fertilizers and balanced fertilizer...
TRANSCRIPT
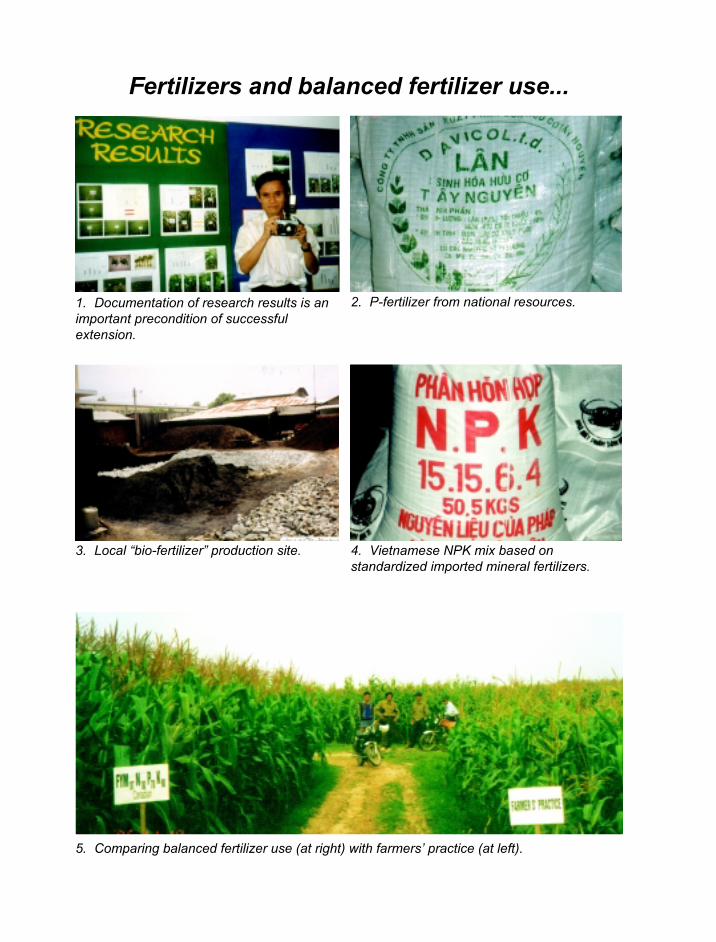
1. Documentation of research results is an
important precondition of successful
extension.
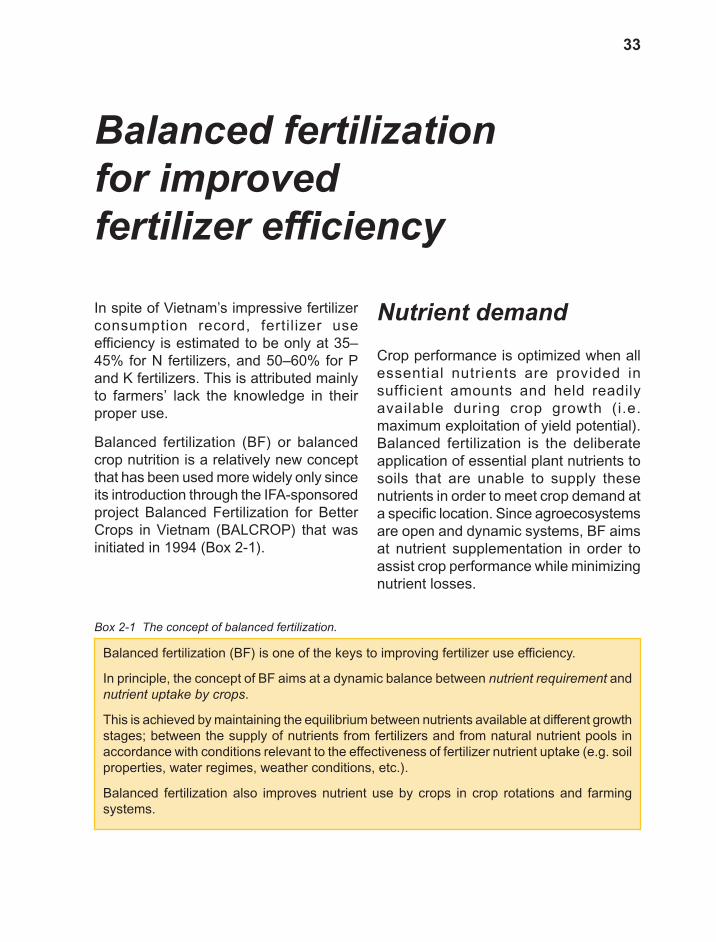
2. P-fertilizer from national resources.
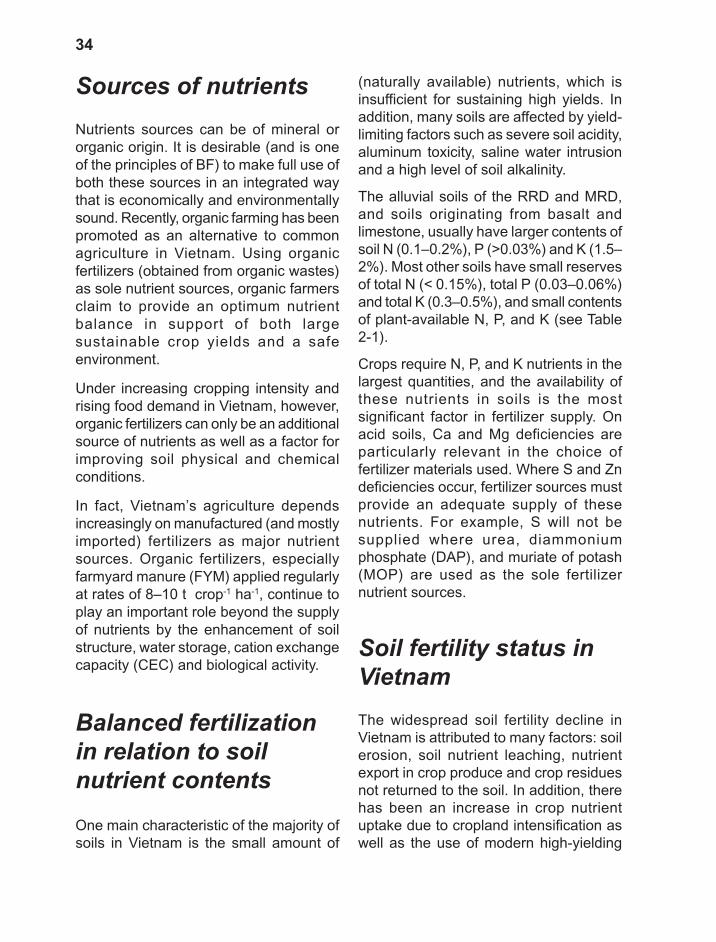
3. Local “bio-fertilizer” production site. 4. Vietnamese NPK mix based on
standardized imported mineral fertilizers.
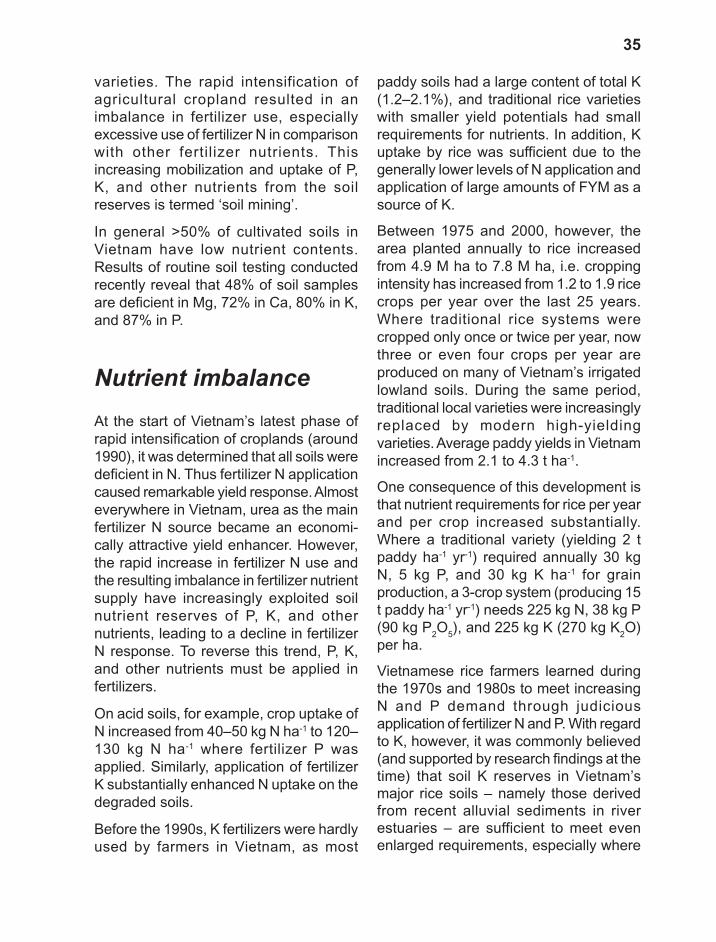
5. Comparing balanced fertilizer use (at right) with farmers’ practice (at left).
Fertilizers and balanced fertilizer use...

6. Long -term fertilizer experiments at
representative sites are essential for
regional recommendations.
9. Balanced nutrition of crops (background)
results in optimum productivity.
7. The use of FYM in addition to mineral
fertilizer (left side) improves soil conditions
and plant growth.
8. Balanced fertilizer use (background)
improves crop growth.10. The result of balanced fertilizer use: A
healthy productive crop (left).
...and the results in the field.
33
In spite of Vietnam’s impressive fertilizer
consumption record, fertilizer use
efficiency is estimated to be only at 35–
45% for N fertilizers, and 50–60% for P
and K fertilizers. This is attributed mainly
to farmers’ lack the knowledge in their
proper use.
Balanced fertilization (BF) or balanced
crop nutrition is a relatively new concept
that has been used more widely only since
its introduction through the IFA-sponsored
project Balanced Fertilization for Better
Crops in Vietnam (BALCROP) that was
initiated in 1994 (Box 2-1).
Balanced fertilization
for improved
fertilizer efficiency
Nutrient demand
Crop performance is optimized when all
essential nutrients are provided in
sufficient amounts and held readily
available during crop growth (i.e.
maximum exploitation of yield potential).
Balanced fertilization is the deliberate
application of essential plant nutrients to
soils that are unable to supply these
nutrients in order to meet crop demand at
a specific location. Since agroecosystems
are open and dynamic systems, BF aims
at nutrient supplementation in order to
assist crop performance while minimizing
nutrient losses.
Balanced fertilization (BF) is one of the keys to improving fertilizer use efficiency.
In principle, the concept of BF aims at a dynamic balance between nutrient requirement and
nutrient uptake by crops.
This is achieved by maintaining the equilibrium between nutrients available at different growth
stages; between the supply of nutrients from fertilizers and from natural nutrient pools in
accordance with conditions relevant to the effectiveness of fertilizer nutrient uptake (e.g. soil
properties, water regimes, weather conditions, etc.).
Balanced fertilization also improves nutrient use by crops in crop rotations and farming
systems.
Box 2-1 The concept of balanced fertilization.
34
Sources of nutrients
Nutrients sources can be of mineral or
organic origin. It is desirable (and is one
of the principles of BF) to make full use of
both these sources in an integrated way
that is economically and environmentally
sound. Recently, organic farming has been
promoted as an alternative to common
agriculture in Vietnam. Using organic
fertilizers (obtained from organic wastes)
as sole nutrient sources, organic farmers
claim to provide an optimum nutrient
balance in support of both large
sustainable crop yields and a safe
environment.
Under increasing cropping intensity and
rising food demand in Vietnam, however,
organic fertilizers can only be an additional
source of nutrients as well as a factor for
improving soil physical and chemical
conditions.
In fact, Vietnam’s agriculture depends
increasingly on manufactured (and mostly
imported) fertilizers as major nutrient
sources. Organic fertilizers, especially
farmyard manure (FYM) applied regularly
at rates of 8–10 t crop-1 ha-1, continue to
play an important role beyond the supply
of nutrients by the enhancement of soil
structure, water storage, cation exchange
capacity (CEC) and biological activity.
Balanced fertilization
in relation to soil
nutrient contents
One main characteristic of the majority of
soils in Vietnam is the small amount of
(naturally available) nutrients, which is
insufficient for sustaining high yields. In
addition, many soils are affected by yield-
limiting factors such as severe soil acidity,
aluminum toxicity, saline water intrusion
and a high level of soil alkalinity.
The alluvial soils of the RRD and MRD,
and soils originating from basalt and
limestone, usually have larger contents of
soil N (0.1–0.2%), P (>0.03%) and K (1.5–
2%). Most other soils have small reserves
of total N (< 0.15%), total P (0.03–0.06%)
and total K (0.3–0.5%), and small contents
of plant-available N, P, and K (see Table
2-1).
Crops require N, P, and K nutrients in the
largest quantities, and the availability of
these nutrients in soils is the most
significant factor in fertilizer supply. On
acid soils, Ca and Mg deficiencies are
particularly relevant in the choice of
fertilizer materials used. Where S and Zn
deficiencies occur, fertilizer sources must
provide an adequate supply of these
nutrients. For example, S will not be
supplied where urea, diammonium
phosphate (DAP), and muriate of potash
(MOP) are used as the sole fertilizer
nutrient sources.
Soil fertility status in
Vietnam
The widespread soil fertility decline in
Vietnam is attributed to many factors: soil
erosion, soil nutrient leaching, nutrient
export in crop produce and crop residues
not returned to the soil. In addition, there
has been an increase in crop nutrient
uptake due to cropland intensification as
well as the use of modern high-yielding
35
varieties. The rapid intensification of
agricultural cropland resulted in an
imbalance in fertilizer use, especially
excessive use of fertilizer N in comparison
with other fertilizer nutrients. This
increasing mobilization and uptake of P,
K, and other nutrients from the soil
reserves is termed ‘soil mining’.
In general >50% of cultivated soils in
Vietnam have low nutrient contents.
Results of routine soil testing conducted
recently reveal that 48% of soil samples
are deficient in Mg, 72% in Ca, 80% in K,
and 87% in P.
Nutrient imbalance
At the start of Vietnam’s latest phase of
rapid intensification of croplands (around
1990), it was determined that all soils were
deficient in N. Thus fertilizer N application
caused remarkable yield response. Almost
everywhere in Vietnam, urea as the main
fertilizer N source became an economi-
cally attractive yield enhancer. However,
the rapid increase in fertilizer N use and
the resulting imbalance in fertilizer nutrient
supply have increasingly exploited soil
nutrient reserves of P, K, and other
nutrients, leading to a decline in fertilizer
N response. To reverse this trend, P, K,
and other nutrients must be applied in
fertilizers.
On acid soils, for example, crop uptake of
N increased from 40–50 kg N ha-1 to 120–
130 kg N ha-1 where fertilizer P was
applied. Similarly, application of fertilizer
K substantially enhanced N uptake on the
degraded soils.
Before the 1990s, K fertilizers were hardly
used by farmers in Vietnam, as most
paddy soils had a large content of total K
(1.2–2.1%), and traditional rice varieties
with smaller yield potentials had small
requirements for nutrients. In addition, K
uptake by rice was sufficient due to the
generally lower levels of N application and
application of large amounts of FYM as a
source of K.
Between 1975 and 2000, however, the
area planted annually to rice increased
from 4.9 M ha to 7.8 M ha, i.e. cropping
intensity has increased from 1.2 to 1.9 rice
crops per year over the last 25 years.
Where traditional rice systems were
cropped only once or twice per year, now
three or even four crops per year are
produced on many of Vietnam’s irrigated
lowland soils. During the same period,
traditional local varieties were increasingly
replaced by modern high-yielding
varieties. Average paddy yields in Vietnam
increased from 2.1 to 4.3 t ha-1.
One consequence of this development is
that nutrient requirements for rice per year
and per crop increased substantially.
Where a traditional variety (yielding 2 t
paddy ha-1 yr-1) required annually 30 kg
N, 5 kg P, and 30 kg K ha-1 for grain
production, a 3-crop system (producing 15
t paddy ha-1 yr-1) needs 225 kg N, 38 kg P
(90 kg P2O
5), and 225 kg K (270 kg K
2O)
per ha.
Vietnamese rice farmers learned during
the 1970s and 1980s to meet increasing
N and P demand through judicious
application of fertilizer N and P. With regard
to K, however, it was commonly believed
(and supported by research findings at the
time) that soil K reserves in Vietnam’s
major rice soils – namely those derived
from recent alluvial sediments in river
estuaries – are sufficient to meet even
enlarged requirements, especially where
36
FYM is applied regularly (as in the RRD)
or straw is recycled.
More recently there are clear indications
that even on soils with comparatively large
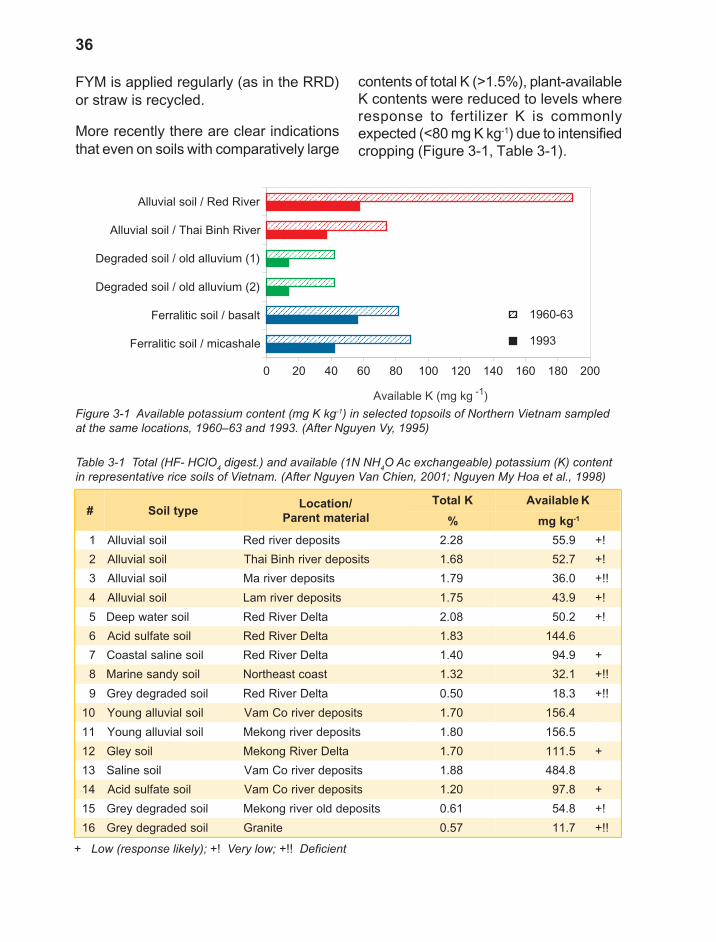
Figure 3-1 Available potassium content (mg K kg-1) in selected topsoils of Northern Vietnam sampled
at the same locations, 1960–63 and 1993. (After Nguyen Vy, 1995)
Ferralitic soil / micashale
Ferralitic soil / basalt
Degraded soil / old alluvium (2)
Degraded soil / old alluvium (1)
Alluvial soil / Thai Binh River
Alluvial soil / Red River
0 20 40 60 80 100 120 140 160 180 200
Available K (mg kg -1
)
1960-63
1993
Table 3-1 Total (HF- HClO4 digest.) and available (1N NH
4O Ac exchangeable) potassium (K) content
in representative rice soils of Vietnam. (After Nguyen Van Chien, 2001; Nguyen My Hoa et al., 1998)
# epytlioS/noitacoL
lairetamtneraP
KlatoT elbaliavA K
% gkgm 1-
1 lioslaivullA stisopedrevirdeR 82.2 9.55 !+
2 lioslaivullA stisopedrevirhniBiahT 86.1 7.25 !+
3 lioslaivullA stisopedreviraM 97.1 0.63 !!+
4 lioslaivullA stisopedrevirmaL 57.1 9.34 !+
5 liosretawpeeD atleDreviRdeR 80.2 2.05 !+
6 liosetaflusdicA atleDreviRdeR 38.1 6.441
7 liosenilaslatsaoC atleDreviRdeR 04.1 9.49 +
8 liosydnaseniraM tsaoctsaehtroN 23.1 1.23 !!+
9 liosdedargedyerG atleDreviRdeR 05.0 3.81 !!+
01 lioslaivullagnuoY stisopedreviroCmaV 07.1 4.651
11 lioslaivullagnuoY stisopedrevirgnokeM 08.1 5.651
21 liosyelG atleDreviRgnokeM 07.1 5.111 +
31 liosenilaS stisopedreviroCmaV 88.1 8.484
41 liosetaflusdicA stisopedreviroCmaV 02.1 8.79 +
51 liosdedargedyerG stisopeddlorevirgnokeM 16.0 8.45 !+
61 liosdedargedyerG etinarG 75.0 7.11 !!+
+ Low (response likely); +! Very low; +!! Deficient
contents of total K (>1.5%), plant-available
K contents were reduced to levels where
response to fertilizer K is commonly
expected (<80 mg K kg-1) due to intensified
cropping (Figure 3-1, Table 3-1).
37
Response to
fertilizer K
A BALCROP fertilizer NPK nutrient
omission trial was carried out in a rice–
rice–maize cropping system on an alluvial
soil of the RRD between 1996 and 2001.
The results indicated an increasing
response to fertilizer K applied at a rate of
210 kg K2O ha-1 annually.
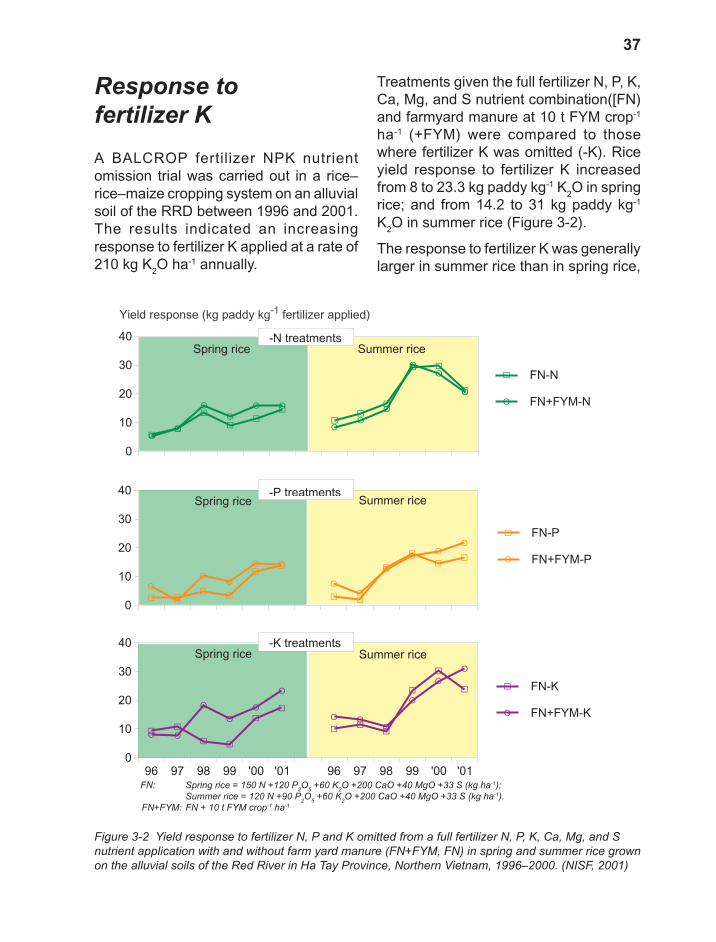
Treatments given the full fertilizer N, P, K,
Ca, Mg, and S nutrient combination([FN)
and farmyard manure at 10 t FYM crop-1
ha-1 (+FYM) were compared to those
where fertilizer K was omitted (-K). Rice
yield response to fertilizer K increased
from 8 to 23.3 kg paddy kg-1 K2O in spring
rice; and from 14.2 to 31 kg paddy kg-1
K2O in summer rice (Figure 3-2).
The response to fertilizer K was generally
larger in summer rice than in spring rice,
Figure 3-2 Yield response to fertilizer N, P and K omitted from a full fertilizer N, P, K, Ca, Mg, and S
nutrient application with and without farm yard manure (FN+FYM, FN) in spring and summer rice grown
on the alluvial soils of the Red River in Ha Tay Province, Northern Vietnam, 1996–2000. (NISF, 2001)
GG
GG
G
G
GG
G
G
G
G
E E
E
E
E
E
E EE
E
E
E
96 97 98 99 '00 '01 96 97 98 99 '00 '01
0
10
20
30
40
G FN-K
E FN+FYM-K
Summer riceSpring rice
-K treatments
Summer riceSpring rice
G GG
G
GG
GG
G
G
GG
E
E
EE
E E
E
E
E
EE
E
0
10
20
30
40
G FN-P
E FN+FYM-P
-P treatments
GG
G
GG
G
GG
G
G G
G
EE
E
E
E E
EE
E
E
E
E
0
10
20
30
40
Yield response (kg paddy kg-1
fertilizer applied)
G FN-N
E FN+FYM-N
Summer riceSpring rice
-N treatments
FN: Spring rice = 150 N +120 P2O
5 +60 K
2O +200 CaO +40 MgO +33 S (kg ha
-1);
Summer rice = 120 N +90 P2O
5 +60 K
2O +200 CaO +40 MgO +33 S (kg ha
-1).
FN+FYM: FN + 10 t FYM crop-1 ha
-1
38
indicating that K release from soil K
reserves to the soil solution was
insufficient to meet requirements for a
second rice crop (summer rice) at the
same level as for the first rice crop (spring
rice). The supply of K from FYM (10 t
crop-1 ha-1) was considered to be
inadequate for supporting larger rice
yields. To support summer rice, an
application rate of fertilizer K larger than
the 60 kg K2O ha-1 applied at the time
would be required.
Similarly, in treatments where fertilizer N
and P were omitted (-N, -P) from FN
treatments, response to fertilizer N and P
increased over time and was larger in
summer rice than in spring rice.
Response to fertilizer N in summer rice
was most prominent in 1999–2000 with
~30 kg paddy kg-1 N-1 in FN+FYM
treatments (Figure 3-2).
Compared with N, P, and K, the omission
of Ca, Mg, and S on alluvial soils resulted
in much smaller paddy yield reductions.
Based on cumulative yields of spring and
summer rice, the yield response to these
fertilizers (5-year average) were:
� Ca: ~2 kg paddy kg-1 Ca;
� Mg: 4–5 kg paddy kg-1 Mg; and
� S: ~9 kg paddy kg-1 S.
Response to fertilizer S was distinctively
greater in summer rice (12 kg paddy kg-1
S) compared with spring rice (6 kg paddy
kg-1 S), indicating that limited supply of S
from natural sources and FYM may
increasingly limit the productivity on these
soils.
In 2001, paddy yields for spring rice and
summer rice were 6.8 and 6.6 t ha-1
respectively in FN+FYM treatments,
compared with 5.8 and 4.7 t ha-1 in
treatments that did not receive fertilizer K
(FN+FYM-K). Thus the omission of
fertilizer K on this ‘naturally K-rich’ alluvial
soils of the RRD has reduced the total
paddy yields of two annual rice crops by
2.9 t ha-1 (22%). This yield reduction is
equivalent to a loss of US$ 293 ha-1 gross
income (at current rice prices), while
investment for the required fertilizer K
would have amounted to only US$ 52 ha-1.
This value:cost ratio (VCR) of 5.6 indicates
that the use of fertilizer K in rice-based
systems on the alluvial soils of Vietnam
can improve farmers’ income through
profits of >US$ 200 ha-1 yr-1.
K-supplying power is related to the soils’
weathering stage and the effect of K
supplied in sediments and irrigation water
in the interwoven branches of the Mekong
and Vam Co river systems in the MRD.
The K-supplying power of ten
representative soils of the MRD was
evaluated in a pot experiment (Nguyen My
Hoa, 1997). Results indicate that the
concentration of exchangeable K in the
five alluvial soils representing the major
area cultivated to rice was ‘marginal to
adequate,’ and thus insufficient to support
more than one rice crop without fertilizer
K supply.
Total K contents on these soils are >1.5%.
Despite this, K fertilization is required to
replace the K nutrients removed in crops
and residues in order to avoid a decline in
soil K fertility in the future. Without proper
management, the removal of large
amounts of K with each of the 2–3 crops
per year may cause a reduction in non-
exchangeable K, decomposition of K-
bearing clay minerals and, finally,
K-fixation (which can only be overcome
by very large fertilizer K applications).

39
Balanced fertilization
in relation to organic
fertilizers
With the dramatic increase in the use of
mineral fertilizers in recent years in
Vietnam, the importance of organic
fertilizers as a nutrient source for crops
has declined. The relationship between
mineral and organic fertilizers as nutrient
sources with regard to the nutrient supply
balance, however, is particularly relevant.
In principle it is expected that organic
fertilizers support soil fertility maintenance
by supplying nutrients and enhancing soil
physical conditions, thus creating the basis
for intensive farming by improving mineral
fertilizer effectiveness. Crop yield is thus
generally increased where organic nutrient
sources (e.g. FYM) are applied in addition
to mineral fertilizers (Table 3-2).
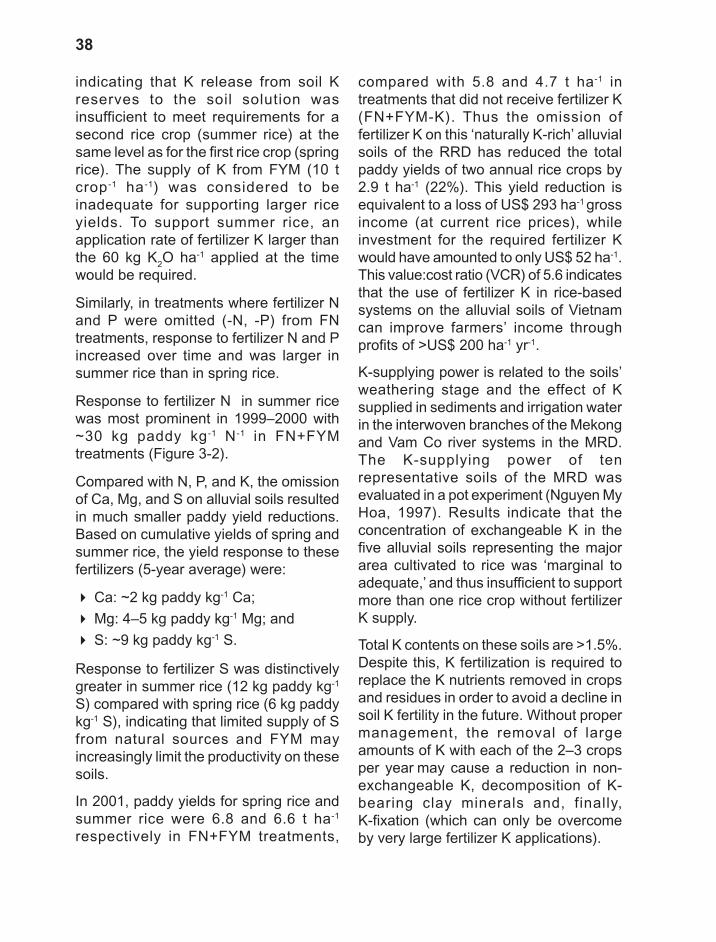
From 1996 to 2001, there was a consistent
increase in the yields of spring rice and
summer rice on alluvial and degraded soils
of the RRD when 10 t FYM crop-1 ha-1 were
added to the FN treatment (fertilizer N, P,
K, Ca, Mg, and S nutrient combination)
(Figure 3-3). On average, yield increases
due to FYM was ~13% in spring rice and
Table 3-2 Response to fertilizer
plus farmyard manure (FYM) as
compared to fertilizer NPK nutrient
application in selected cropping
systems of Vietnam. (Data
collected from on farm trials
conducted between 1991 and
2000)
# porC lioS tnemtaerTdleiY
%∆aht 1-
10 eciR lioslaivullAKPN
MYF+KPN
57.4
13.521
20 eziaM lioslaivullAKPN
MYF+KPN
54.3
33.462
30 enacraguS lioslaivullAKPN
MYF+KPN
06.76
06.963
40 eciRliosdedargeD
muivulladlO
KPN
MYF+KPN
23.3
20.412
50 stundnuorGliosdedargeD
muivulladlO
KPN
MYF+KPN
86.1
19.141
60gnirpS
naebyos
liosdedargeD
muivulladlO
KPN
MYF+KPN
42.2
23.24
70 eziaMliosdedargeD
muivulladlO
KPN
MYF+KPN
27.6
82.78
80 eziamretniWliosdedargeD
muivulladlO
KPN
MYF+KPN
12.4
97.441
90 eziamretniWliosdedargeD
muivulladlO
KPN
MYF+KPN
54.6
04.6)1(
01 occaboTliosdedargeD
muivulladlO
KPN
MYF+KPN
14.1
85.121
11 egnarOloslarreF
elahsyalC
KPN
MYF+KPN
84.9
60.016
21 aeTloslarreF
muivulladlO
KPN
MYF+KPN
86.0
38.022
40
Figure 3-3 Effect of fertilizer N, P, K, Ca, Mg, and S nutrient application with and without farmyard
manure (FYM) on paddy yield of spring and summer rice of alluvial and degraded soils of the Red
River Delta in Vietnam, 1996–2000.
Summer riceSpring rice
BB
B B BB
B B
B
BB
B
J
J J JJ J
J J
J
JJ
J
0
2
4
6
8
10
Yield (t paddy ha-1
)
B FN
J FN+FYM
Summer riceSpring rice
B B B B
B
B
B B
BB
B
BJ
J J J
J
J
JJ
JJ
J J
96 97 98 99 '00 '01 96 97 98 99 '00 '01
0
2
4
6
8
10
B FN
J FN+FYM
Degraded soils
Alluvial soils
FN: Spring rice = 150 N +120 P2O
5 +60 K
2O +200 CaO +40 MgO +33 S (kg ha
-1);
Summer rice = 120 N +90 P2O
5 +60 K
2O +200 CaO +40 MgO +33 S (kg ha
-1).
FN+FYM: FN + 10 t FYM crop-1 ha
-1
Figure 3-4 Effect of fertilizer N, P, K, Ca, Mg, and S nutrient application with and without farmyard
manure (FYM) and after omission of fertilizers N (-N treatments), P (-P treatments) and K (-K
treatments) on green bean yield of coffea robusta on lateritic soils derived from basalt in Dak Lak
Province,1996–2001.
B
BB B B
B
EE E E
EE
0
1
2
3
4
5
6
Yield (t green bean ha-1
)
B FN
E FN+FYM
FN treatments
BB
B BB
B7 7
7
77
7
-N treatments
BB
B BB
B7 7
7
77
7
96 97 98 99 '00 '01
-K treatments
BB
B BB
B7 7
7
77
7
96 97 98 99 '00 '01
0
1
2
3
4
5
6 -P treatments
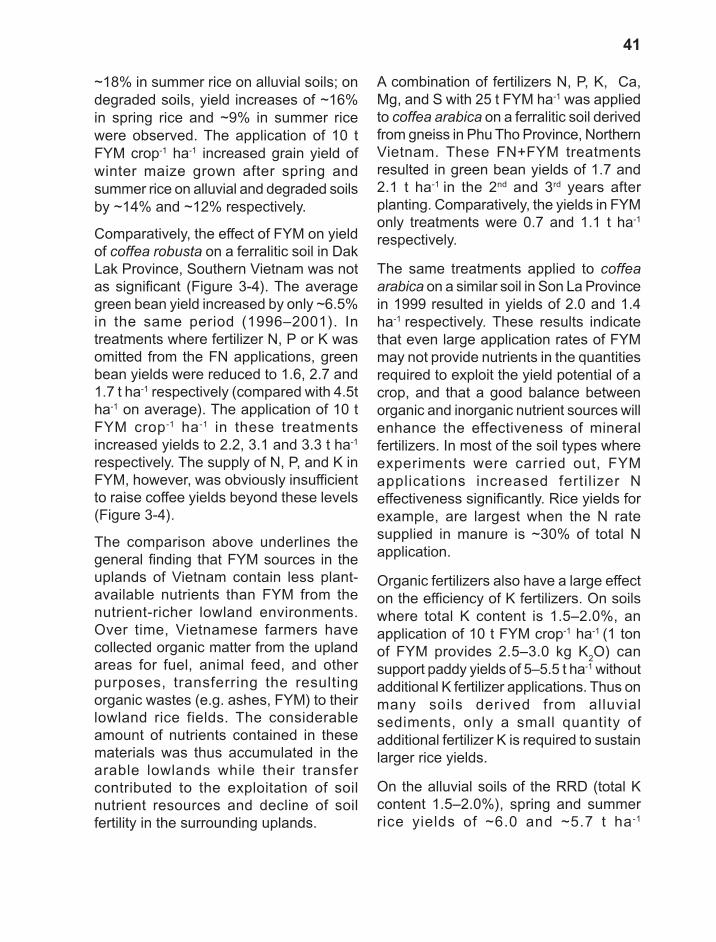
41
~18% in summer rice on alluvial soils; on
degraded soils, yield increases of ~16%
in spring rice and ~9% in summer rice
were observed. The application of 10 t
FYM crop-1 ha-1 increased grain yield of
winter maize grown after spring and
summer rice on alluvial and degraded soils
by ~14% and ~12% respectively.
Comparatively, the effect of FYM on yield
of coffea robusta on a ferralitic soil in Dak
Lak Province, Southern Vietnam was not
as significant (Figure 3-4). The average
green bean yield increased by only ~6.5%
in the same period (1996–2001). In
treatments where fertilizer N, P or K was
omitted from the FN applications, green
bean yields were reduced to 1.6, 2.7 and
1.7 t ha-1 respectively (compared with 4.5t
ha-1 on average). The application of 10 t
FYM crop-1 ha-1 in these treatments
increased yields to 2.2, 3.1 and 3.3 t ha-1
respectively. The supply of N, P, and K in
FYM, however, was obviously insufficient
to raise coffee yields beyond these levels
(Figure 3-4).
The comparison above underlines the
general finding that FYM sources in the
uplands of Vietnam contain less plant-
available nutrients than FYM from the
nutrient-richer lowland environments.
Over time, Vietnamese farmers have
collected organic matter from the upland
areas for fuel, animal feed, and other
purposes, transferring the resulting
organic wastes (e.g. ashes, FYM) to their
lowland rice fields. The considerable
amount of nutrients contained in these
materials was thus accumulated in the
arable lowlands while their transfer
contributed to the exploitation of soil
nutrient resources and decline of soil
fertility in the surrounding uplands.
A combination of fertilizers N, P, K, Ca,
Mg, and S with 25 t FYM ha-1 was applied
to coffea arabica on a ferralitic soil derived
from gneiss in Phu Tho Province, Northern
Vietnam. These FN+FYM treatments
resulted in green bean yields of 1.7 and
2.1 t ha-1 in the 2nd and 3rd years after
planting. Comparatively, the yields in FYM
only treatments were 0.7 and 1.1 t ha-1
respectively.
The same treatments applied to coffea
arabica on a similar soil in Son La Province
in 1999 resulted in yields of 2.0 and 1.4
ha-1 respectively. These results indicate
that even large application rates of FYM
may not provide nutrients in the quantities
required to exploit the yield potential of a
crop, and that a good balance between
organic and inorganic nutrient sources will
enhance the effectiveness of mineral
fertilizers. In most of the soil types where
experiments were carried out, FYM
applications increased fertilizer N
effectiveness significantly. Rice yields for
example, are largest when the N rate
supplied in manure is ~30% of total N
application.
Organic fertilizers also have a large effect
on the efficiency of K fertilizers. On soils
where total K content is 1.5–2.0%, an
application of 10 t FYM crop-1 ha-1 (1 ton
of FYM provides 2.5–3.0 kg K2O) can
support paddy yields of 5–5.5 t ha-1 without
additional K fertilizer applications. Thus on
many soils derived from alluvial
sediments, only a small quantity of
additional fertilizer K is required to sustain
larger rice yields.
On the alluvial soils of the RRD (total K
content 1.5–2.0%), spring and summer
rice yields of ~6.0 and ~5.7 t ha-1
42
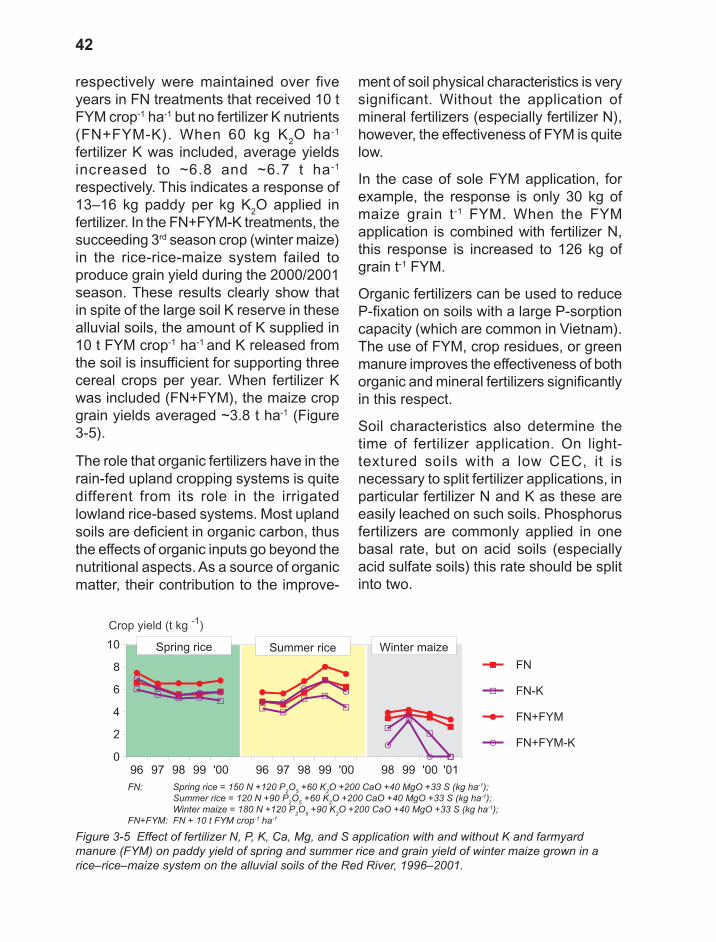
respectively were maintained over five
years in FN treatments that received 10 t
FYM crop-1 ha-1 but no fertilizer K nutrients
(FN+FYM-K). When 60 kg K2O ha-1
fertilizer K was included, average yields
increased to ~6.8 and ~6.7 t ha-1
respectively. This indicates a response of
13–16 kg paddy per kg K2O applied in
fertilizer. In the FN+FYM-K treatments, the
succeeding 3rd season crop (winter maize)
in the rice-rice-maize system failed to
produce grain yield during the 2000/2001
season. These results clearly show that
in spite of the large soil K reserve in these
alluvial soils, the amount of K supplied in
10 t FYM crop-1 ha-1 and K released from
the soil is insufficient for supporting three
cereal crops per year. When fertilizer K
was included (FN+FYM), the maize crop
grain yields averaged ~3.8 t ha-1 (Figure
3-5).
The role that organic fertilizers have in the
rain-fed upland cropping systems is quite
different from its role in the irrigated
lowland rice-based systems. Most upland
soils are deficient in organic carbon, thus
the effects of organic inputs go beyond the
nutritional aspects. As a source of organic
matter, their contribution to the improve-
ment of soil physical characteristics is very
significant. Without the application of
mineral fertilizers (especially fertilizer N),
however, the effectiveness of FYM is quite
low.
In the case of sole FYM application, for
example, the response is only 30 kg of
maize grain t-1 FYM. When the FYM
application is combined with fertilizer N,
this response is increased to 126 kg of
grain t-1 FYM.
Organic fertilizers can be used to reduce
P-fixation on soils with a large P-sorption
capacity (which are common in Vietnam).
The use of FYM, crop residues, or green
manure improves the effectiveness of both
organic and mineral fertilizers significantly
in this respect.
Soil characteristics also determine the
time of fertilizer application. On light-
textured soils with a low CEC, it is
necessary to split fertilizer applications, in
particular fertilizer N and K as these are
easily leached on such soils. Phosphorus
fertilizers are commonly applied in one
basal rate, but on acid soils (especially
acid sulfate soils) this rate should be split
into two.
Figure 3-5 Effect of fertilizer N, P, K, Ca, Mg, and S application with and without K and farmyard
manure (FYM) on paddy yield of spring and summer rice and grain yield of winter maize grown in a
rice–rice–maize system on the alluvial soils of the Red River, 1996–2001.
BB
B B B
B B
B
BB
BB
B
B
GG
G GG
GG
G G
G
G
G
G
G
J
J J JJ
J J
J
JJ
J JJ
J
E
EE E E
E E
E
E
E
E
E
E E
96 97 98 99 '00 96 97 98 99 '00 98 99 '00 '01
0
2
4
6
8
10
Crop yield (t kg-1
)
B FN
G FN-K
J FN+FYM
E FN+FYM-K
Spring rice Summer rice Winter maize
FN: Spring rice = 150 N +120 P2O
5 +60 K
2O +200 CaO +40 MgO +33 S (kg ha
-1);
Summer rice = 120 N +90 P2O
5 +60 K
2O +200 CaO +40 MgO +33 S (kg ha
-1);
Winter maize = 180 N +120 P2O
5 +90 K
2O +200 CaO +40 MgO +33 S (kg ha
-1);
FN+FYM: FN + 10 t FYM crop-1 ha
-1
43
Balanced fertilization
in relation to crops
and varieties
Crops differ substantially with regard to
their nutrient requirements. Groundnut, a
calcophil crop, for example, requires Ca
in relatively larger amounts than many
other crops. In degraded soils with low
contents of Ca and Mg, the application of
lime and/or fertilizer Ca can increase
groundnut yields by 9–10% and 11%
respectively. Besides supplying Ca as a
nutrient, lime also reduces soil acidity and
improves the soil environment for legumes
with regard to biological N2-fixation. The
excessive use of lime, however, decreases
groundnut yield due to an over-represen-
tation (imbalance) of Ca2+ as compared to
Mg2+ and K+ on the surface of cation
exchangers in the soil.
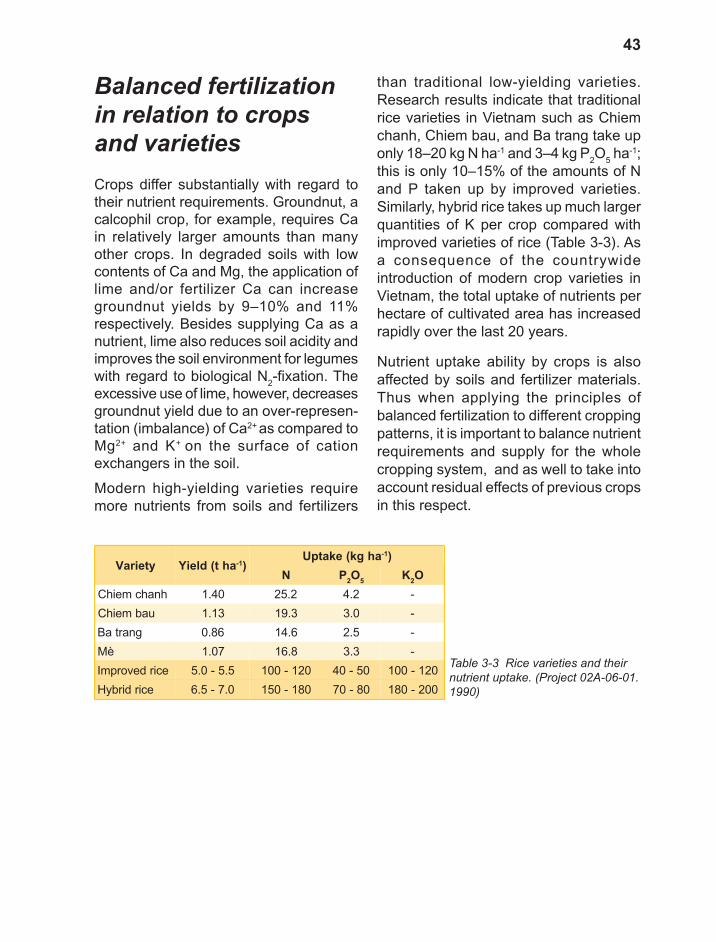
Modern high-yielding varieties require
more nutrients from soils and fertilizers
than traditional low-yielding varieties.
Research results indicate that traditional
rice varieties in Vietnam such as Chiem
chanh, Chiem bau, and Ba trang take up
only 18–20 kg N ha-1 and 3–4 kg P2O
5 ha-1;
this is only 10–15% of the amounts of N
and P taken up by improved varieties.
Similarly, hybrid rice takes up much larger
quantities of K per crop compared with
improved varieties of rice (Table 3-3). As
a consequence of the countrywide
introduction of modern crop varieties in
Vietnam, the total uptake of nutrients per
hectare of cultivated area has increased
rapidly over the last 20 years.
Nutrient uptake ability by crops is also
affected by soils and fertilizer materials.
Thus when applying the principles of
balanced fertilization to different cropping
patterns, it is important to balance nutrient
requirements and supply for the whole
cropping system, and as well to take into
account residual effects of previous crops
in this respect.
Table 3-3 Rice varieties and their
nutrient uptake. (Project 02A-06-01.
1990)
yteiraV aht(dleiY 1- )ahgk(ekatpU 1- )
N P2O
5K
2O
hnahcmeihC 04.1 2.52 2.4 -
uabmeihC 31.1 3.91 0.3 -
gnartaB 68.0 6.41 5.2 -
èM 70.1 8.61 3.3 -
ecirdevorpmI 5.5-0.5 021-001 05-04 021-001
ecirdirbyH 0.7-5.6 081-051 08-07 002-081
44
Balanced fertilization
in relation to other
nutrients
Before the 1960s, the use of manufactured
fertilizers was not common in Vietnam:
most farmers planted only one crop per
year, using traditional varieties with low
productivity that required relatively small
amounts of nutrients (Table 3-3). Since
then, however, farmers have started using
manufactured fertilizers, especially
imported N fertilizers in (at the time) the
form of sulfate of ammonia (SA). During
this period when fertilizer was introduced
to Vietnam, fertilizer N was the over-riding
yield-limiting factor in all crops. Although
only small amounts of fertilizers were
applied, their use induced a rapid
agricultural production increase in
Vietnam, particularly in the case of rice.
Phosphorus fertilizers were seldom used
for yield improvement. However, research
studies during the 1970s indicated that,
due to increasing land intensification,
fertilizer P had by then become the most
prominent yield-limiting nutrient factor in
Vietnam, after fertilizer N.
Fertilizer K became an important yield-
limiting nutrient factor only after modern
rice varieties were introduced widely in the
1980s. Response to fertilizer K was
particularly prominent on light-textured
soils with small K reserves. In the 1990s,
the increasing use of hybrid varieties by
rice growers in Northern Vietnam and
maize farmers throughout the country,
together with the introduction of improved
planting materials to crop sectors other
than rice, also had a significant role in
making K the limiting factor.
When taking a balanced fertilization (BF)
approach, it is important to take nutrient
interactions into consideration. The
significant impact that BF has on yield
response and profitability is discussed
below.
N-P balance
As mentioned previously, N was the most
limiting nutrient factor in crop yield in the
1960s, but during 1970–80 P replaced N
in this respect. Increased P fertilizer use
efficiency is attributed to the use of modern
varieties, increased number of crops per
year, and excessive use of N.
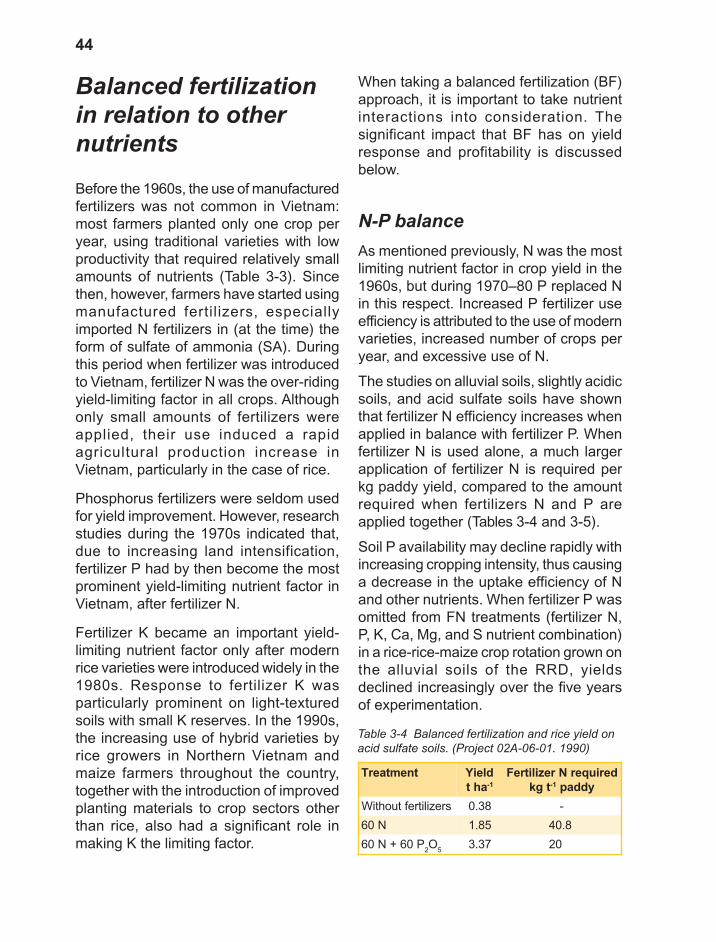
The studies on alluvial soils, slightly acidic
soils, and acid sulfate soils have shown
that fertilizer N efficiency increases when
applied in balance with fertilizer P. When
fertilizer N is used alone, a much larger
application of fertilizer N is required per
kg paddy yield, compared to the amount
required when fertilizers N and P are
applied together (Tables 3-4 and 3-5).
Soil P availability may decline rapidly with
increasing cropping intensity, thus causing
a decrease in the uptake efficiency of N
and other nutrients. When fertilizer P was
omitted from FN treatments (fertilizer N,
P, K, Ca, Mg, and S nutrient combination)
in a rice-rice-maize crop rotation grown on
the alluvial soils of the RRD, yields
declined increasingly over the five years
of experimentation.
Table 3-4 Balanced fertilization and rice yield on
acid sulfate soils. (Project 02A-06-01. 1990)
tnemtaerT dleiY
aht 1-
deriuqerNrezilitreF
tgk 1- yddap
srezilitreftuohtiW 83.0 -
N06 58.1 8.04
P06+N062O
573.3 02
45
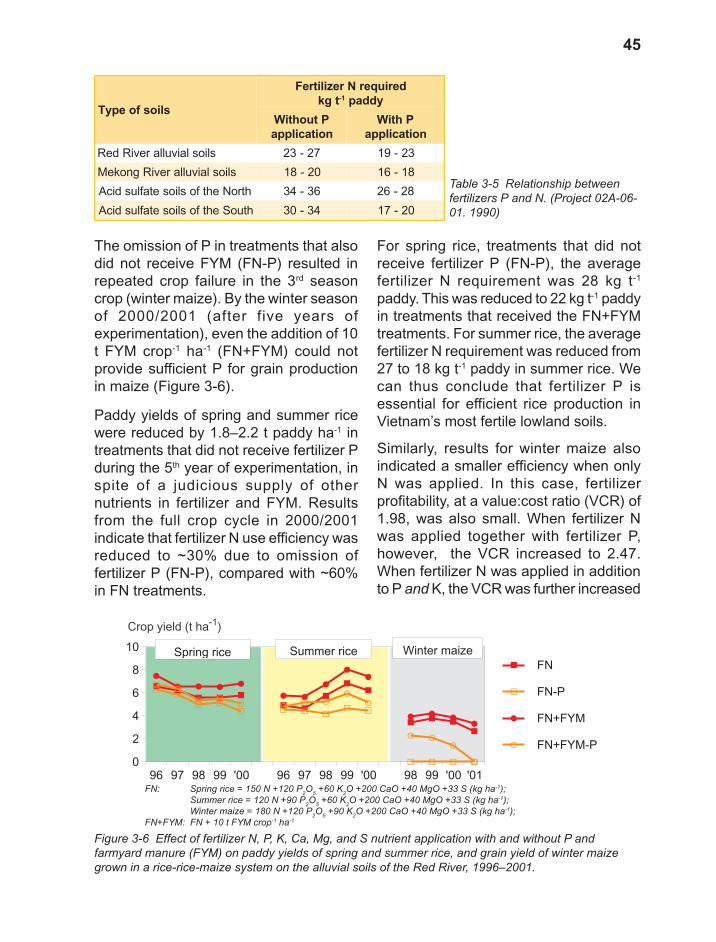
The omission of P in treatments that also
did not receive FYM (FN-P) resulted in
repeated crop failure in the 3rd season
crop (winter maize). By the winter season
of 2000/2001 (after five years of
experimentation), even the addition of 10
t FYM crop-1 ha-1 (FN+FYM) could not
provide sufficient P for grain production
in maize (Figure 3-6).
Paddy yields of spring and summer rice
were reduced by 1.8–2.2 t paddy ha-1 in
treatments that did not receive fertilizer P
during the 5th year of experimentation, in
spite of a judicious supply of other
nutrients in fertilizer and FYM. Results
from the full crop cycle in 2000/2001
indicate that fertilizer N use efficiency was
reduced to ~30% due to omission of
fertilizer P (FN-P), compared with ~60%
in FN treatments.
For spring rice, treatments that did not
receive fertilizer P (FN-P), the average
fertilizer N requirement was 28 kg t-1
paddy. This was reduced to 22 kg t-1 paddy
in treatments that received the FN+FYM
treatments. For summer rice, the average
fertilizer N requirement was reduced from
27 to 18 kg t-1 paddy in summer rice. We
can thus conclude that fertilizer P is
essential for efficient rice production in
Vietnam’s most fertile lowland soils.
Similarly, results for winter maize also
indicated a smaller efficiency when only
N was applied. In this case, fertilizer
profitability, at a value:cost ratio (VCR) of
1.98, was also small. When fertilizer N
was applied together with fertilizer P,
however, the VCR increased to 2.47.
When fertilizer N was applied in addition
to P and K, the VCR was further increased
Table 3-5 Relationship between
fertilizers P and N. (Project 02A-06-
01. 1990)
sliosfoepyT
deriuqerNrezilitreF
tgk 1- yddap
PtuohtiW
noitacilppa
PhtiW
noitacilppa
slioslaivullareviRdeR 72-32 32-91
slioslaivullareviRgnokeM 02-81 81-61
htroNehtfosliosetaflusdicA 63-43 82-62
htuoSehtfosliosetaflusdicA 43-03 02-71
Figure 3-6 Effect of fertilizer N, P, K, Ca, Mg, and S nutrient application with and without P and
farmyard manure (FYM) on paddy yields of spring and summer rice, and grain yield of winter maize
grown in a rice-rice-maize system on the alluvial soils of the Red River, 1996–2001.
FN: Spring rice = 150 N +120 P2O
5 +60 K
2O +200 CaO +40 MgO +33 S (kg ha
-1);
Summer rice = 120 N +90 P2O
5 +60 K
2O +200 CaO +40 MgO +33 S (kg ha
-1);
Winter maize = 180 N +120 P2O
5 +90 K
2O +200 CaO +40 MgO +33 S (kg ha
-1);
FN+FYM: FN + 10 t FYM crop-1 ha
-1
BB
B B B
B B
B
BB
BB
B
B
GG
G G
G G GG
G G
G G G G
J
J J JJ
J J
J
JJ
J JJ
J
EE
E EE E
E E
E
E
E EE
E
96 97 98 99 '00 96 97 98 99 '00 98 99 '00 '01
0
2
4
6
8
10
Crop yield (t ha-1
)
B FN
G FN-P
J FN+FYM
E FN+FYM-P
Spring rice Summer rice Winter maize

46
to 2.8. Table 3-6 provides data to verify
BF’s impact on yield response and
profitability.
On the alluvial soils of the Thai Binh River
and acid sulfate soils of Northern Vietnam,
similar results were obtained for white
potato in the 2000/2001 winter season.
With a balanced fertilizer NPK and FYM
application, uptake of all three nutrients
was enhanced by up to 50%, with tuber
yields increasing by up to 40% (Table 3-
7). This response was induced mainly by
the substantial increase in fertilizer K rates
in the BF treatments. In contrast,
insufficient K release from soil reserves
and FYM in the standard farmers’ practice
(FP) limited uptake of N and P.
Much of Vietnam’s upland soils are derived
from Fe/Al-rich parent materials and have
undergone extreme weathering. On the
majority of these soils, the small contents
of plant-available P (often due to
P-fixation) limit modern agricultural
production to the extent of crop failure.
In hybrid maize grown on a ferralitic soil
in Binh Phuoc Province, Southern
Vietnam, a combination of fertilizer N, P,
K, B, Cu, and Zn nutrients with FYM and
dolomitic limestone provided yields of >5
t grain ha-1 in 1998. No grain yield was
received in treatments without fertilizer P.
In 1999 a large initial rate of 300 kg P2O
5
ha-1, together with fertilizer N (120 kg N
ha-1), K (120 kg K2O ha-1), and dolomitic
limestone (2 t ha-1) was applied to maize
grown in four farms on the lateritic upland
soils of Binh Phuoc Province, Southern
Vietnam. Grain yields of nearly 2.9 t ha-1
on average were obtained, compared with
0.45 t ha-1 achieved under common FP
using fertilizer N only.
tnemtaerT
dleiY *esaercnidleiY ycneiciffE
RCVaht 1-
eziamgk
gk 1- tneirtun
rezilitrefoN 54.0 - - -
N 84.1 30.1 6.8 89.1
PN 08.2 53.2 2.11 74.2
K 54.0 0 0 0
KN 31.2 86.1 0.8 52.2
KPN 57.3 03.3 0.11 08.2
Table 3-6 Balanced fertilization for
maize on the alluvial soils of the
Red River. (* Yield increase
compared with treatments with no
fertilizer applied).
Table 3-7 Effect of balanced fertilization (BF) compared with farmers’ practice (FP) on N, P and K
nutrient uptake of winter potato grown on the alluvial and acid sulfate soils of Northern Vietnam.
epytlioS
tnemtaerT ekatputneirtuN rebuT
dleiyP:N2O
5K:
2O MYF N P K
ahgk 1- aht 1- ahgk 1- aht 1-
,slioslaivullA
reviRhniBiahT
66:64:721)PF( 0.41 2.27 2.21 2.711 52.71
021:09:051)FB( 0.41 1.49 5.51 0.541 83.12
sliosetaflusdicA51:54:041)PF( 5.7 7.96 2.6 5.99 95.41
021:09:051)FB( 5.21 0.301 0.9 7.631 32.02
47
These examples show clearly that soil
fertility recapitalization in the highly
weathered acid upland soils of Vietnam
has to begin with an ameliorative fertilizer
P and dolomite applications. The larger P,
Ca and Mg availability will require an
adequate supply of fertilizer N, K, S, and
micronutrients, in order to increase crop
yield and biomass production (which help
to reduce soil erosion and, if residues are
properly recycled, will assist in building soil
fertility).
N-K balance
The relation between N and K in crops is
known to be of special importance and
their interaction in crop productivity can be
either antagonistic or synergistic. Because
of this relationship, scientists view K as a
major factor in adjusting N supply for
crops.
As discussed earlier, fertilizer K use
among Vietnamese rice farmers has been
minimal (or not at all) for many decades.
Therefore the role of K in rice productivity
has not been proven except on light-
textured soils with small contents of soil K
(e.g. degraded and sandy soils). As
intensification and the use of modern
varieties are becoming more commonly
practiced, K requirements in lowland
cropping systems have started to rise and
response to fertilizer K have increased
significantly.
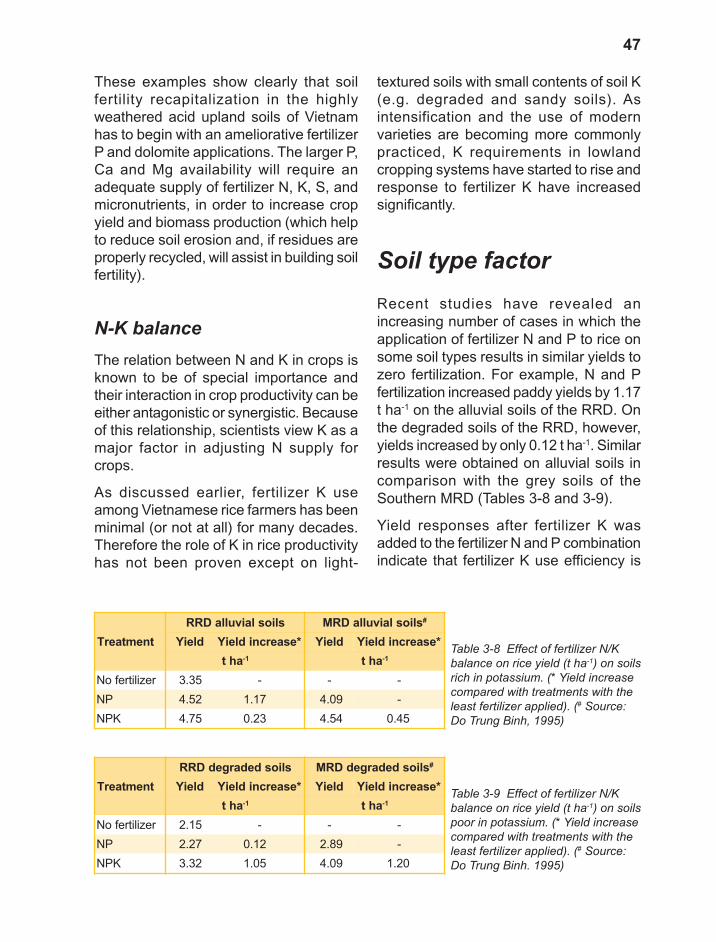
Soil type factor
Recent studies have revealed an
increasing number of cases in which the
application of fertilizer N and P to rice on
some soil types results in similar yields to
zero fertilization. For example, N and P
fertilization increased paddy yields by 1.17
t ha-1 on the alluvial soils of the RRD. On
the degraded soils of the RRD, however,
yields increased by only 0.12 t ha-1. Similar
results were obtained on alluvial soils in
comparison with the grey soils of the
Southern MRD (Tables 3-8 and 3-9).
Yield responses after fertilizer K was
added to the fertilizer N and P combination
indicate that fertilizer K use efficiency is
Table 3-8 Effect of fertilizer N/K
balance on rice yield (t ha-1) on soils
rich in potassium. (* Yield increase
compared with treatments with the
least fertilizer applied). (# Source:
Do Trung Binh, 1995)
tnemtaerT
slioslaivullaDRR slioslaivullaDRM #
dleiY *esaercnidleiY dleiY *esaercnidleiY
aht 1- aht 1-
rezilitrefoN 53.3 - - -
PN 25.4 71.1 90.4 -
KPN 57.4 32.0 45.4 54.0
Table 3-9 Effect of fertilizer N/K
balance on rice yield (t ha-1) on soils
poor in potassium. (* Yield increase
compared with treatments with the
least fertilizer applied). (# Source:
Do Trung Binh. 1995)
tnemtaerT
sliosdedargedDRR sliosdedargedDRM #
dleiY *esaercnidleiY dleiY *esaercnidleiY
aht 1- aht 1-
rezilitrefoN 51.2 - - -
PN 72.2 21.0 98.2 -
KPN 23.3 50.1 90.4 02.1
48
strongly related to the indigenous K-
supplying capacity (soil K content). On
soils that are rich in K (e.g. alluvial soils),
fertilizer K use efficiency is only 2–4 kg of
paddy kg-1 K2O; however, it can reach 8–
13 kg or more paddy kg-1 K2O on degraded
and sandy soils.
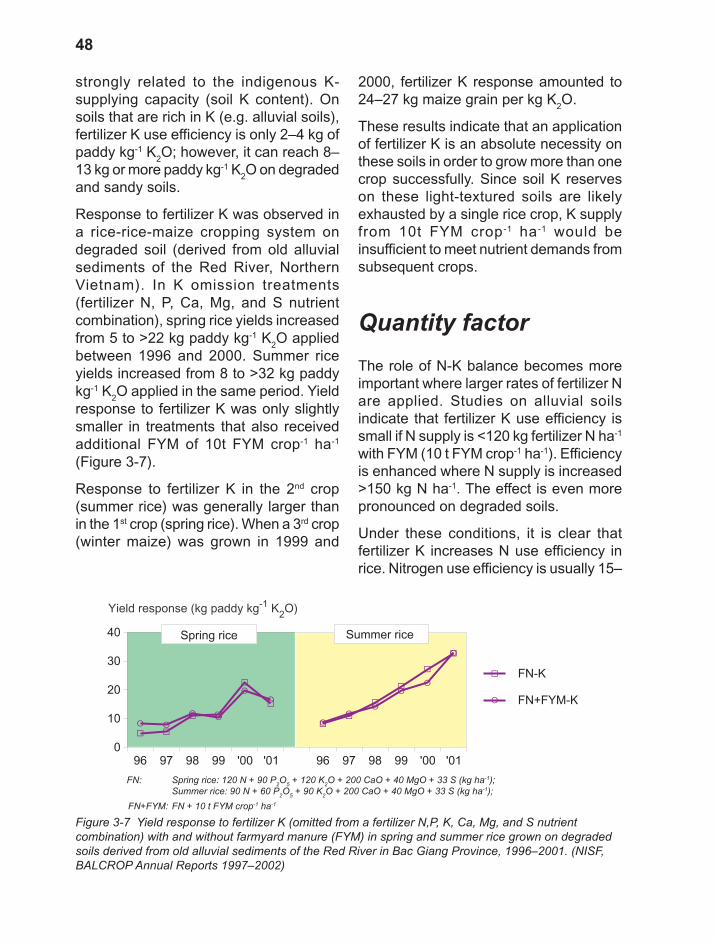
Response to fertilizer K was observed in
a rice-rice-maize cropping system on
degraded soil (derived from old alluvial
sediments of the Red River, Northern
Vietnam). In K omission treatments
(fertilizer N, P, Ca, Mg, and S nutrient
combination), spring rice yields increased
from 5 to >22 kg paddy kg-1 K2O applied
between 1996 and 2000. Summer rice
yields increased from 8 to >32 kg paddy
kg-1 K2O applied in the same period. Yield
response to fertilizer K was only slightly
smaller in treatments that also received
additional FYM of 10t FYM crop-1 ha-1
(Figure 3-7).
Response to fertilizer K in the 2nd crop
(summer rice) was generally larger than
in the 1st crop (spring rice). When a 3rd crop
(winter maize) was grown in 1999 and
2000, fertilizer K response amounted to
24–27 kg maize grain per kg K2O.
These results indicate that an application
of fertilizer K is an absolute necessity on
these soils in order to grow more than one
crop successfully. Since soil K reserves
on these light-textured soils are likely
exhausted by a single rice crop, K supply
from 10t FYM crop-1 ha-1 would be
insufficient to meet nutrient demands from
subsequent crops.
Quantity factor
The role of N-K balance becomes more
important where larger rates of fertilizer N
are applied. Studies on alluvial soils
indicate that fertilizer K use efficiency is
small if N supply is <120 kg fertilizer N ha-1
with FYM (10 t FYM crop-1 ha-1). Efficiency
is enhanced where N supply is increased
>150 kg N ha-1. The effect is even more
pronounced on degraded soils.
Under these conditions, it is clear that
fertilizer K increases N use efficiency in
rice. Nitrogen use efficiency is usually 15–
G G
G G
G
G
G
G
G
G
G
G
E E
EE
E
E
E
EE
E
E
E
96 97 98 99 '00 '01 96 97 98 99 '00 '01
0
10
20
30
40
Yield response (kg paddy kg-1
K2O)
G FN-K
E FN+FYM-K
Spring rice Summer rice
FN: Spring rice: 120 N + 90 P2O
5 + 120 K
2O + 200 CaO + 40 MgO + 33 S (kg ha
-1);
Summer rice: 90 N + 60 P2O
5 + 90 K
2O + 200 CaO + 40 MgO + 33 S (kg ha
-1);
FN+FYM: FN + 10 t FYM crop-1 ha
-1
Figure 3-7 Yield response to fertilizer K (omitted from a fertilizer N,P, K, Ca, Mg, and S nutrient
combination) with and without farmyard manure (FYM) in spring and summer rice grown on degraded
soils derived from old alluvial sediments of the Red River in Bac Giang Province, 1996–2001. (NISF,
BALCROP Annual Reports 1997–2002)
49
30% without K application, but it can be
as high as 39–49% when applied together
with fertilizer K.
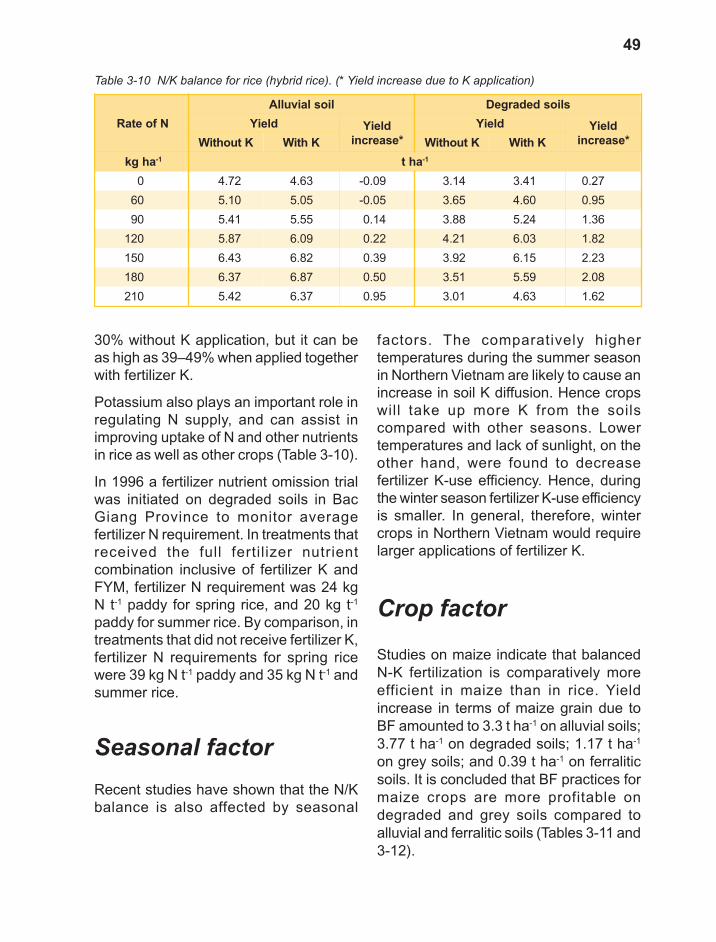
Potassium also plays an important role in
regulating N supply, and can assist in
improving uptake of N and other nutrients
in rice as well as other crops (Table 3-10).
In 1996 a fertilizer nutrient omission trial
was initiated on degraded soils in Bac
Giang Province to monitor average
fertilizer N requirement. In treatments that
received the full fertilizer nutrient
combination inclusive of fertilizer K and
FYM, fertilizer N requirement was 24 kg
N t-1 paddy for spring rice, and 20 kg t-1
paddy for summer rice. By comparison, in
treatments that did not receive fertilizer K,
fertilizer N requirements for spring rice
were 39 kg N t-1 paddy and 35 kg N t-1 and
summer rice.
Seasonal factor
Recent studies have shown that the N/K
balance is also affected by seasonal
factors. The comparatively higher
temperatures during the summer season
in Northern Vietnam are likely to cause an
increase in soil K diffusion. Hence crops
will take up more K from the soils
compared with other seasons. Lower
temperatures and lack of sunlight, on the
other hand, were found to decrease
fertilizer K-use efficiency. Hence, during
the winter season fertilizer K-use efficiency
is smaller. In general, therefore, winter
crops in Northern Vietnam would require
larger applications of fertilizer K.
Crop factor
Studies on maize indicate that balanced
N-K fertilization is comparatively more
efficient in maize than in rice. Yield
increase in terms of maize grain due to
BF amounted to 3.3 t ha-1 on alluvial soils;
3.77 t ha-1 on degraded soils; 1.17 t ha-1
on grey soils; and 0.39 t ha-1 on ferralitic
soils. It is concluded that BF practices for
maize crops are more profitable on
degraded and grey soils compared to
alluvial and ferralitic soils (Tables 3-11 and
3-12).
NfoetaR
lioslaivullA sliosdedargeD
dleiY dleiY
*esaercni
dleiY dleiY
*esaercniKtuohtiW KhtiW KtuohtiW KhtiW
ahgk 1- aht 1-
0 27.4 36.4 90.0- 41.3 14.3 72.0
06 01.5 50.5 50.0- 56.3 06.4 59.0
09 14.5 55.5 41.0 88.3 42.5 63.1
021 78.5 90.6 22.0 12.4 30.6 28.1
051 34.6 28.6 93.0 29.3 51.6 32.2
081 73.6 78.6 05.0 15.3 95.5 80.2
012 24.5 73.6 59.0 10.3 36.4 26.1
Table 3-10 N/K balance for rice (hybrid rice). (* Yield increase due to K application)
50
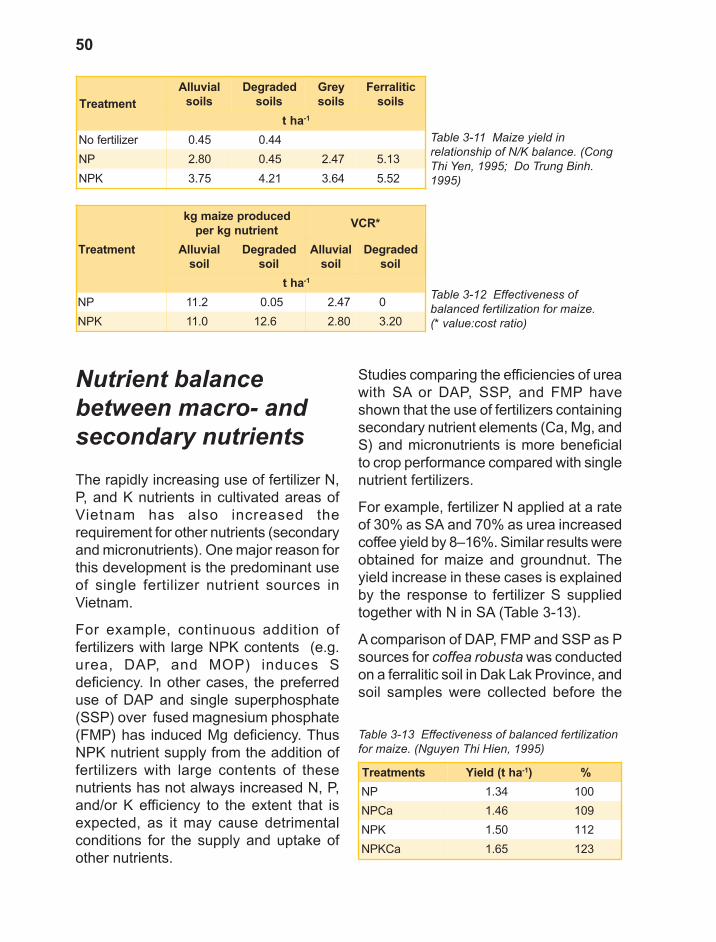
Nutrient balance
between macro- and
secondary nutrients
The rapidly increasing use of fertilizer N,
P, and K nutrients in cultivated areas of
Vietnam has also increased the
requirement for other nutrients (secondary
and micronutrients). One major reason for
this development is the predominant use
of single fertilizer nutrient sources in
Vietnam.
For example, continuous addition of
fertilizers with large NPK contents (e.g.
urea, DAP, and MOP) induces S
deficiency. In other cases, the preferred
use of DAP and single superphosphate
(SSP) over fused magnesium phosphate
(FMP) has induced Mg deficiency. Thus
NPK nutrient supply from the addition of
fertilizers with large contents of these
nutrients has not always increased N, P,
and/or K efficiency to the extent that is
expected, as it may cause detrimental
conditions for the supply and uptake of
other nutrients.
Studies comparing the efficiencies of urea
with SA or DAP, SSP, and FMP have
shown that the use of fertilizers containing
secondary nutrient elements (Ca, Mg, and
S) and micronutrients is more beneficial
to crop performance compared with single
nutrient fertilizers.
For example, fertilizer N applied at a rate
of 30% as SA and 70% as urea increased
coffee yield by 8–16%. Similar results were
obtained for maize and groundnut. The
yield increase in these cases is explained
by the response to fertilizer S supplied
together with N in SA (Table 3-13).
A comparison of DAP, FMP and SSP as P
sources for coffea robusta was conducted
on a ferralitic soil in Dak Lak Province, and
soil samples were collected before the
Table 3-11 Maize yield in
relationship of N/K balance. (Cong
Thi Yen, 1995; Do Trung Binh.
1995)
tnemtaerT
laivullA
slios
dedargeD
slios
yerG
slios
citilarreF
slios
aht 1-
rezilitrefoN 54.0 44.0
PN 08.2 54.0 74.2 31.5
KPN 57.3 12.4 46.3 25.5
Table 3-12 Effectiveness of
balanced fertilization for maize.
(* value:cost ratio)
tnemtaerT
decudorpeziamgk
tneirtungkrep*RCV
laivullA
lios
dedargeD
lios
laivullA
lios
dedargeD
lios
aht 1-
PN 2.11 50.0 74.2 0
KPN 0.11 6.21 08.2 02.3
Table 3-13 Effectiveness of balanced fertilization
for maize. (Nguyen Thi Hien, 1995)
stnemtaerT aht(dleiY 1- ) %
PN 43.1 001
aCPN 64.1 901
KPN 05.1 211
aCKPN 56.1 321
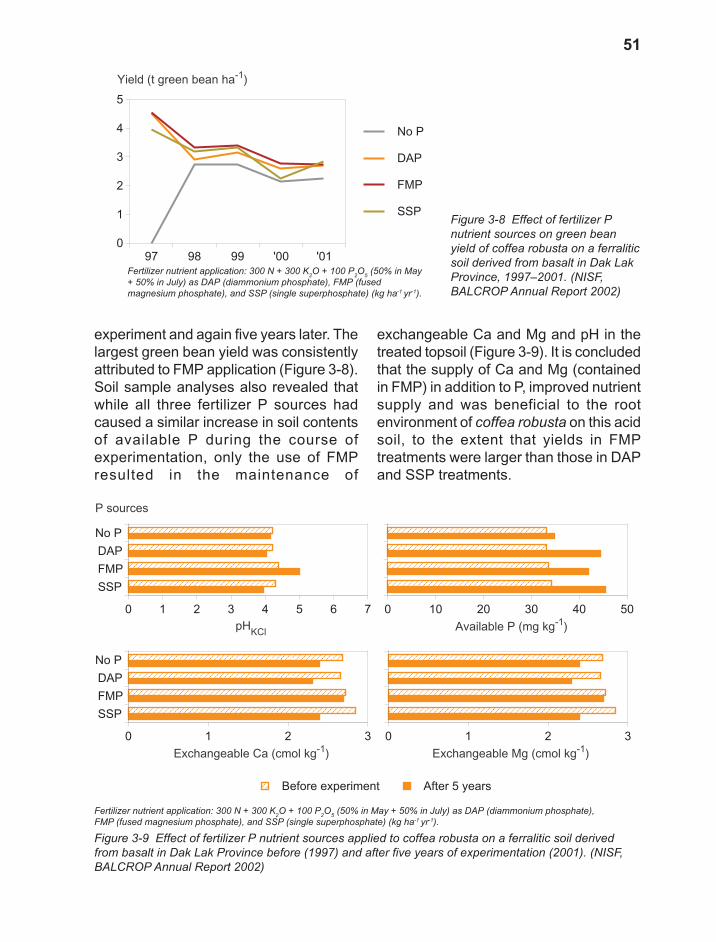
51
experiment and again five years later. The
largest green bean yield was consistently
attributed to FMP application (Figure 3-8).
Soil sample analyses also revealed that
while all three fertilizer P sources had
caused a similar increase in soil contents
of available P during the course of
experimentation, only the use of FMP
resulted in the maintenance of
exchangeable Ca and Mg and pH in the
treated topsoil (Figure 3-9). It is concluded
that the supply of Ca and Mg (contained
in FMP) in addition to P, improved nutrient
supply and was beneficial to the root
environment of coffea robusta on this acid
soil, to the extent that yields in FMP
treatments were larger than those in DAP
and SSP treatments.
Figure 3-8 Effect of fertilizer P
nutrient sources on green bean
yield of coffea robusta on a ferralitic
soil derived from basalt in Dak Lak
Province, 1997–2001. (NISF,
BALCROP Annual Report 2002)
97 98 99 '00 '01
0
1
2
3
4
5
Yield (t green bean ha-1
)
No P
DAP
FMP
SSP
Fertilizer nutrient application: 300 N + 300 K2O + 100 P
2O
5 (50% in May
+ 50% in July) as DAP (diammonium phosphate), FMP (fused
magnesium phosphate), and SSP (single superphosphate) (kg ha-1
yr-1).
Figure 3-9 Effect of fertilizer P nutrient sources applied to coffea robusta on a ferralitic soil derived
from basalt in Dak Lak Province before (1997) and after five years of experimentation (2001). (NISF,
BALCROP Annual Report 2002)
Fertilizer nutrient application: 300 N + 300 K2O + 100 P
2O
5 (50% in May + 50% in July) as DAP (diammonium phosphate),
FMP (fused magnesium phosphate), and SSP (single superphosphate) (kg ha-1
yr-1).
SSP
FMP
DAP
No P
0 1 2 3 4 5 6 7
P sources
pHKCl
After 5 yearsBefore experiment
0 10 20 30 40 50
Available P (mg kg-1
)
SSP
FMP
DAP
No P
0 1 2 3
Exchangeable Ca (cmol kg-1
)
0 1 2 3
Exchangeable Mg (cmol kg-1
)
.
52
Combined SSP and FMP fertilization
usually benefits crop performance on the
upland soils in Vietnam; this is attributed
to a more gradual release of P from these
sources and the beneficial effect of other
nutrients such as S, Ca, and Mg. On acidic
upland soils, the alkaline character of FMP
not only balances the acidic character of
SSP, but may also cause a liming effect,
thus reducing the P-fixation potential of
these soils. On alkaline soils, combined
FMP and SSP fertilization increases the
solubility of phosphorus in FMP, while the
high Si content of FMP supports the
formation of Al3+ compounds, which can
reduce alkaline toxicity.
Consequently the combined application of
SSP and FMP can bring about yield
increases on acid as well as alkaline soils.
Combined SSP and FMP fertilization
resulted in paddy yields increase of 9.2%
(0.37 t paddy ha-1) compared with FMP
alone, and 5.8% (0.24 t paddy ha-1) when
compared with SSP alone. Combined SSP
and FMP fertilization also gave similar
results in groundnut, increasing yield by
10.3% (0.19 t ha-1) compared with
separate applications of FMP and SSP.
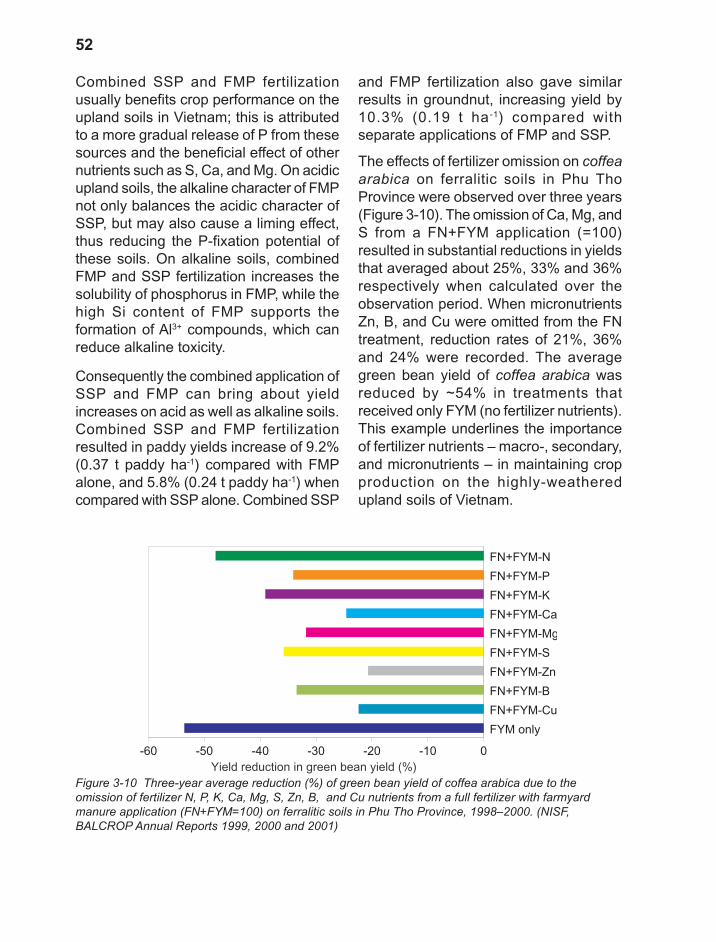
The effects of fertilizer omission on coffea
arabica on ferralitic soils in Phu Tho
Province were observed over three years
(Figure 3-10). The omission of Ca, Mg, and
S from a FN+FYM application (=100)
resulted in substantial reductions in yields
that averaged about 25%, 33% and 36%
respectively when calculated over the
observation period. When micronutrients
Zn, B, and Cu were omitted from the FN
treatment, reduction rates of 21%, 36%
and 24% were recorded. The average
green bean yield of coffea arabica was
reduced by ~54% in treatments that
received only FYM (no fertilizer nutrients).
This example underlines the importance
of fertilizer nutrients – macro-, secondary,
and micronutrients – in maintaining crop
production on the highly-weathered
upland soils of Vietnam.
Figure 3-10 Three-year average reduction (%) of green bean yield of coffea arabica due to the
omission of fertilizer N, P, K, Ca, Mg, S, Zn, B, and Cu nutrients from a full fertilizer with farmyard
manure application (FN+FYM=100) on ferralitic soils in Phu Tho Province, 1998–2000. (NISF,
BALCROP Annual Reports 1999, 2000 and 2001)
FYM only
FN+FYM-Cu
FN+FYM-B
FN+FYM-Zn
FN+FYM-S
FN+FYM-Mg
FN+FYM-Ca
FN+FYM-K
FN+FYM-P
FN+FYM-N
-60 -50 -40 -30 -20 -10 0
Yield reduction in green bean yield (%)

53
In a similar fertilizer omission experiment
on a rice–rice–maize system on the
alluvial and degraded soils of the RRD
over six years, it was observed that paddy
yields were reduced progressively over
time (Figure 3-11).
On alluvial soils, yield reduction due to the
omission of fertilizers Ca, Mg, and S was
generally larger in the 2nd rice crop
(summer rice, 18–20% reduction) than in
the 1st rice crop (spring rice, ~15%
reduction). This indicates that the nutrient
supplied in the 10 t FYM crop-1 ha-1 is not
sufficient to compensate for the omission
of fertilizer Ca, Mg, and S on these soils.
On degraded soils, the omission of
fertilizer Mg caused the largest yield
reduction (24–26%) in spring rice. The
omission of fertilizer S caused a yield
reduction in summer rice in Year 6 (24%)
that was substantially greater compared
to Year 1 (9.5%). Similarly, the omission
of fertilizers Ca and Mg caused yield
reductions in summer rice that were larger
in Year 6 than in Year 1 (Figure 3-11).
Although yield reductions caused by the
omission of fertilizers N, P, and K in these
experiments were comparatively greater,
it is clear from these results that the
omission of ‘secondary’ nutrients in
fertilizers can cause yield reductions of
>1 t paddy ha-1 in the intensified rice
systems of Vietnam, regardless of soil
fertility conditions and soil reserves of Ca,
Mg, and S.
Figure 3-11 Paddy yield reduction (%) of spring and summer rice due to the omission of fertilizer N, P,
K, Ca, Mg, and S nutrients from a full fertilizer with farmyard manure application (FN+FYM=100) on
alluvial and degraded soils of the RRD, 1996 and 2001. (NISF, BALCROP Annual Reports 1997–2002)
54
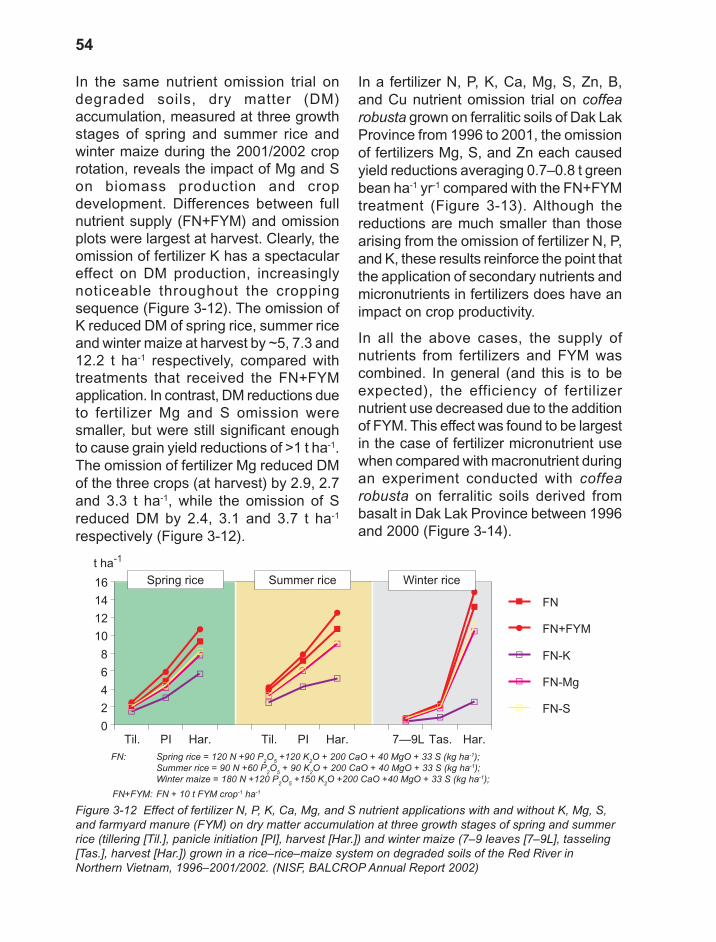
In the same nutrient omission trial on
degraded soils, dry matter (DM)
accumulation, measured at three growth
stages of spring and summer rice and
winter maize during the 2001/2002 crop
rotation, reveals the impact of Mg and S
on biomass production and crop
development. Differences between full
nutrient supply (FN+FYM) and omission
plots were largest at harvest. Clearly, the
omission of fertilizer K has a spectacular
effect on DM production, increasingly
noticeable throughout the cropping
sequence (Figure 3-12). The omission of
K reduced DM of spring rice, summer rice
and winter maize at harvest by ~5, 7.3 and
12.2 t ha-1 respectively, compared with
treatments that received the FN+FYM
application. In contrast, DM reductions due
to fertilizer Mg and S omission were
smaller, but were still significant enough
to cause grain yield reductions of >1 t ha-1.
The omission of fertilizer Mg reduced DM
of the three crops (at harvest) by 2.9, 2.7
and 3.3 t ha-1, while the omission of S
reduced DM by 2.4, 3.1 and 3.7 t ha-1
respectively (Figure 3-12).
In a fertilizer N, P, K, Ca, Mg, S, Zn, B,
and Cu nutrient omission trial on coffea
robusta grown on ferralitic soils of Dak Lak
Province from 1996 to 2001, the omission
of fertilizers Mg, S, and Zn each caused
yield reductions averaging 0.7–0.8 t green
bean ha-1 yr-1 compared with the FN+FYM
treatment (Figure 3-13). Although the
reductions are much smaller than those
arising from the omission of fertilizer N, P,
and K, these results reinforce the point that
the application of secondary nutrients and
micronutrients in fertilizers does have an
impact on crop productivity.
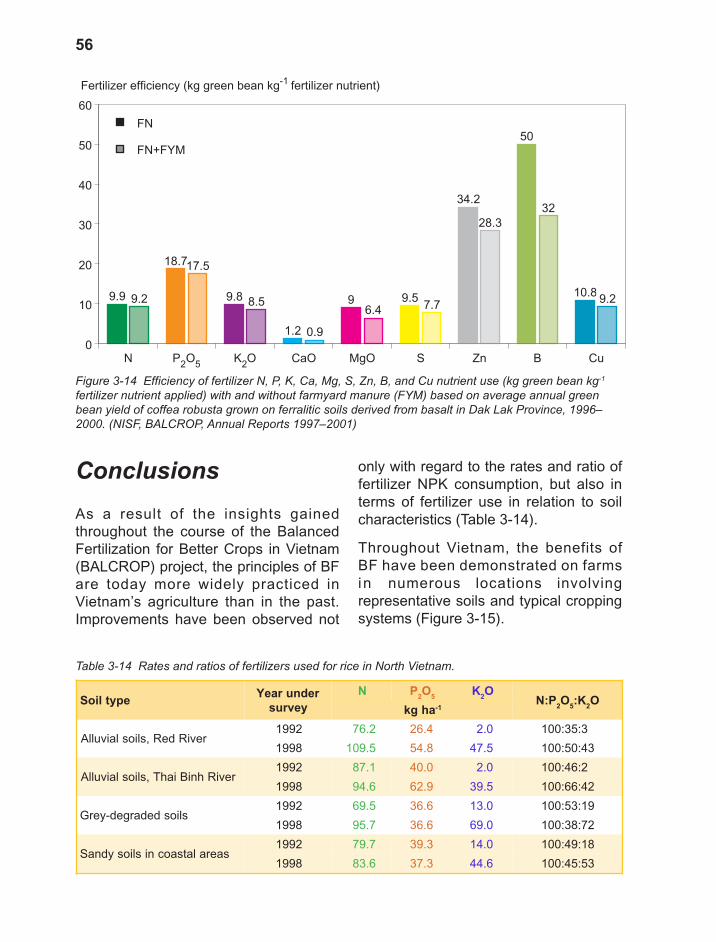
In all the above cases, the supply of
nutrients from fertilizers and FYM was
combined. In general (and this is to be
expected), the efficiency of fertilizer
nutrient use decreased due to the addition
of FYM. This effect was found to be largest
in the case of fertilizer micronutrient use
when compared with macronutrient during
an experiment conducted with coffea
robusta on ferralitic soils derived from
basalt in Dak Lak Province between 1996
and 2000 (Figure 3-14).
B
B
B
B
B
B
B
B
B
J
J
J
J
J
J
J
J
J
G
G
G
G
G
G
GG
GG
G
G
G
G
G
G
G
G
Ñ
Ñ
Ñ
Ñ
Ñ
Ñ
Ñ
Ñ
Ñ
Til. PI Har. Til. PI Har. 7—9L Tas. Har.
0
2
4
6
8
10
12
14
16
t ha-1
B FN
J FN+FYM
G FN-K
G FN-Mg
Ñ FN-S
Spring rice Summer rice Winter rice
Figure 3-12 Effect of fertilizer N, P, K, Ca, Mg, and S nutrient applications with and without K, Mg, S,
and farmyard manure (FYM) on dry matter accumulation at three growth stages of spring and summer
rice (tillering [Til.], panicle initiation [PI], harvest [Har.]) and winter maize (7–9 leaves [7–9L], tasseling
[Tas.], harvest [Har.]) grown in a rice–rice–maize system on degraded soils of the Red River in
Northern Vietnam, 1996–2001/2002. (NISF, BALCROP Annual Report 2002)
FN: Spring rice = 120 N +90 P2O
5 +120 K
2O + 200 CaO + 40 MgO + 33 S (kg ha
-1);
Summer rice = 90 N +60 P2O
5 + 90 K
2O + 200 CaO + 40 MgO + 33 S (kg ha
-1);
Winter maize = 180 N +120 P2O
5 +150 K
2O +200 CaO +40 MgO + 33 S (kg ha
-1);
FN+FYM: FN + 10 t FYM crop-1 ha
-1

55
Figure 3-13 Effect of fertilizer nutrient with and without N, P, K, Ca, Mg, S, Zn, K, Mg, S and FYM
application on green bean yield of coffea robusta on a ferralitic soil derived from basalt in Dak Lak
Province, 1996–2001. (NISF, BALCROP Annual Reports, 1997–2002)
FN: 300 N + 100 P2O
5 + 300 K
2O + 300 CaO + 50 MgO + 60 S + 12 Zn + 12 Cu + 5 B (kg ha
-1 yr
-1).
FN+FYM: FN + 10 t FYM ha-1 yr
-1
B
BB B B
B
JJ J J
JJ
GG
G GG
GE E
E
EE
E
0
1
2
3
4
5
6
Yield (t green bean ha-1
)
B
BB B B
B
JJ J J
JJ
GG G G G
G
EE
E E E E
B
BB B B
B
JJ J J
JJ
G
G G G GG
EE E E E
EB
BB B B
B
JJ J J
JJ
G G
G GG
G
E
E
E E
EE
0
1
2
3
4
5
6
B
BB B B
B
JJ J J
JJ
G
G G G G GE E
E E E EB
BB B B
B
JJ J J
JJ
G
GG G G
GE
E E E EE
0
1
2
3
4
5
6
B
BB B B
B
JJ J J
JJ
GG
G G GG
E EE E
EE
96 97 98 99 '00 '01
B
BB B B
B
JJ J J
JJ
G
G
G GG GE
E E E
E E
0
1
2
3
4
5
6
B
BB B B
B
JJ J J
JJ
GG
G G GG
E EE E
EE
96 97 98 99 '00 '01
0
1
2
3
4
5
6
-B treatments
-S treatments
-Ca treatments
-P treatments
-Zn treatments
-Mg treatments
-K treatments
-N treatments
-Cu treatments
B FN
J FN+FYM
G FN-[fert]
E FN+FYM-[fert]
56
Conclusions
As a result of the insights gained
throughout the course of the Balanced
Fertilization for Better Crops in Vietnam
(BALCROP) project, the principles of BF
are today more widely practiced in
Vietnam’s agriculture than in the past.
Improvements have been observed not
only with regard to the rates and ratio of
fertilizer NPK consumption, but also in
terms of fertilizer use in relation to soil
characteristics (Table 3-14).
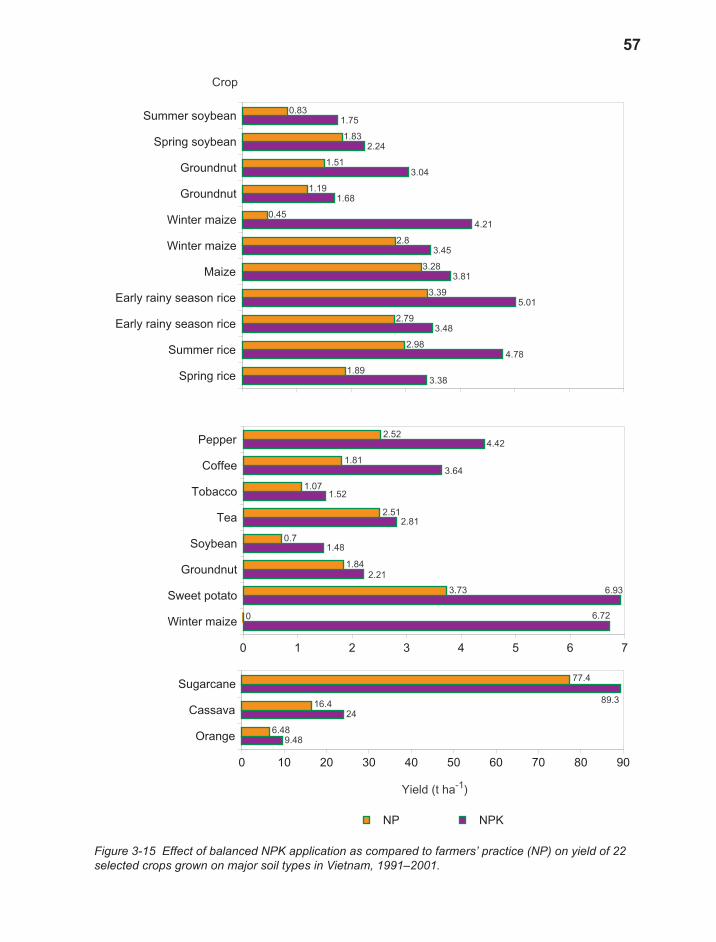
Throughout Vietnam, the benefits of
BF have been demonstrated on farms
in numerous locations involving
representative soils and typical cropping
systems (Figure 3-15).
Figure 3-14 Efficiency of fertilizer N, P, K, Ca, Mg, S, Zn, B, and Cu nutrient use (kg green bean kg-1
fertilizer nutrient applied) with and without farmyard manure (FYM) based on average annual green
bean yield of coffea robusta grown on ferralitic soils derived from basalt in Dak Lak Province, 1996–
2000. (NISF, BALCROP, Annual Reports 1997–2001)
Table 3-14 Rates and ratios of fertilizers used for rice in North Vietnam.
epytlioSrednuraeY
yevrus
N P2O
5K
2O
P:N2O
5K:
2O
ahgk 1-
,slioslaivullA reviRdeR2991 2.67 4.62 0.2 3:53:001
8991 5.901 8.45 5.74 34:05:001
reviRhniBiahT,slioslaivullA2991 1.78 0.04 0.2 2:64:001
8991 6.49 9.26 5.93 24:66:001
sliosdedarged-yerG2991 5.96 6.63 0.31 91:35:001
8991 7.59 6.63 0.96 27:83:001
saeralatsaocnisliosydnaS2991 7.97 3.93 0.41 81:94:001
8991 6.38 3.73 6.44 35:54:001
N P2O
5K
2O CaO MgO S Zn B Cu
0
10
20
30
40
50
60
Fertilizer efficiency (kg green bean kg-1
fertilizer nutrient)
9.9 9.2
18.717.5
9.88.5
1.2 0.9
96.4
9.57.7
34.2
28.3
50
32
10.89.2
FN
FN+FYM
57
Spring rice
Summer rice
Early rainy season rice
Early rainy season rice
Maize
Winter maize
Winter maize
Groundnut
Groundnut
Spring soybean
Summer soybean
Crop
3.38
1.89
4.78
2.98
3.48
2.79
5.01
3.39
3.81
3.28
3.45
2.8
4.21
0.45
1.68
1.19
3.04
1.51
2.24
1.83
1.75
0.83
NPKNP
Winter maize
Sweet potato
Groundnut
Soybean
Tea
Tobacco
Coffee
Pepper
0 1 2 3 4 5 6 7
6.720
6.933.73
2.21
1.84
1.48
0.7
2.81
2.51
1.521.07
3.64
1.81
4.42
2.52
Orange
Cassava
Sugarcane
0 10 20 30 40 50 60 70 80 90
Yield (t ha-1
)
9.48
6.48
24
16.489.3
77.4
Figure 3-15 Effect of balanced NPK application as compared to farmers’ practice (NP) on yield of 22
selected crops grown on major soil types in Vietnam, 1991–2001.
58
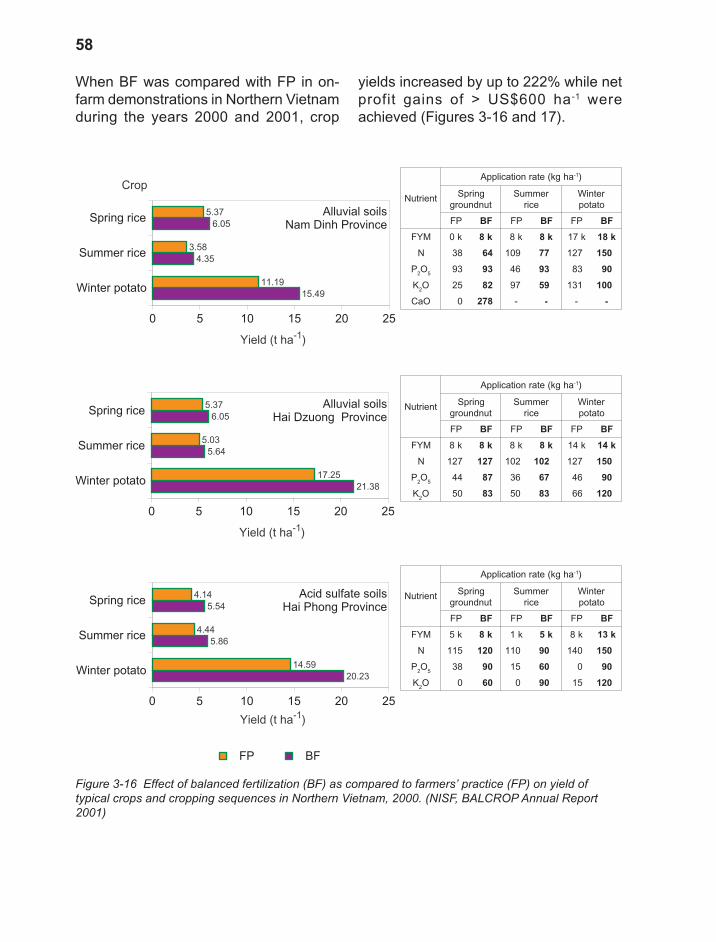
When BF was compared with FP in on-
farm demonstrations in Northern Vietnam
during the years 2000 and 2001, crop
Figure 3-16 Effect of balanced fertilization (BF) as compared to farmers’ practice (FP) on yield of
typical crops and cropping sequences in Northern Vietnam, 2000. (NISF, BALCROP Annual Report
2001)
tneirtuN
ahgk(etarnoitacilppA 1- )
gnirpS
tundnuorg
remmuS
ecir
retniW
otatop
PF FB PF FB PF FB
MYF k0 k8 k8 k8 k71 k81
N 83 46 901 77 721 051
P2O
539 39 64 39 38 09
K2O 52 28 79 95 131 001
OaC 0 872 - - - -
tneirtuN
ahgk(etarnoitacilppA 1- )
gnirpS
tundnuorg
remmuS
ecir
retniW
otatop
PF FB PF FB PF FB
MYF k8 k8 k8 k8 k41 k41
N 721 721 201 201 721 051
P2O
544 78 63 76 64 09
K2O 05 38 05 38 66 021
tneirtuN
ahgk(etarnoitacilppA 1- )
gnirpS
tundnuorg
remmuS
ecir
retniW
otatop
PF FB PF FB PF FB
MYF k5 k8 k1 k5 k8 k31
N 511 021 011 09 041 051
P2O
583 09 51 06 0 09
K2O 0 06 0 09 51 021
Winter potato
Summer rice
Spring rice
0 5 10 15 20 25
Yield (t ha-1
)
20.23
14.59
5.86
4.44
5.54
4.14 Acid sulfate soils
Hai Phong Province
Winter potato
Summer rice
Spring rice
0 5 10 15 20 25
Yield (t ha-1
)
21.38
17.25
5.64
5.03
6.05
5.37 Alluvial soils
Hai Dzuong Province
Winter potato
Summer rice
Spring rice
0 5 10 15 20 25
Crop
Yield (t ha-1
)
15.49
11.19
4.35
3.58
6.05
5.37
BFFP
Alluvial soils
Nam Dinh Province
yields increased by up to 222% while net
profit gains of > US$600 ha-1 were
achieved (Figures 3-16 and 17).
59
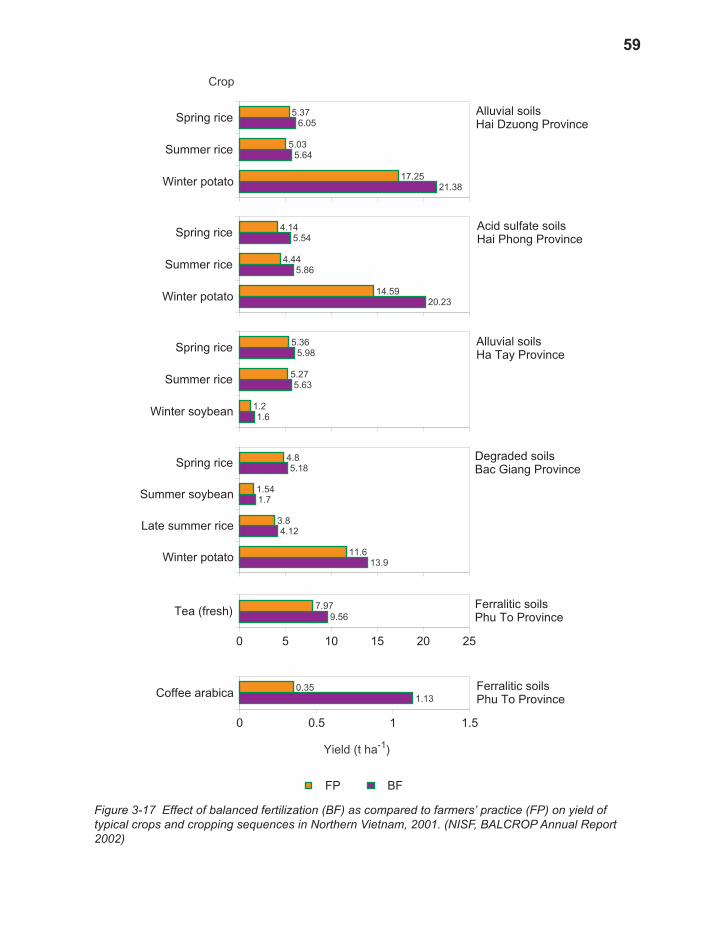
Figure 3-17 Effect of balanced fertilization (BF) as compared to farmers’ practice (FP) on yield of
typical crops and cropping sequences in Northern Vietnam, 2001. (NISF, BALCROP Annual Report
2002)
Coffee arabica
0 0.5 1 1.5
Yield (t ha-1
)
1.13
0.35 Ferralitic soils
Phu To Province
Tea (fresh)
0 5 10 15 20 25
9.56
7.97 Ferralitic soils
Phu To Province
Degraded soils
Bac Giang Province
Winter potato
Late summer rice
Summer soybean
Spring rice
13.9
11.6
4.12
3.8
1.7
1.54
5.18
4.8
Winter soybean
Summer rice
Spring rice
1.6
1.2
5.63
5.27
5.98
5.36 Alluvial soils
Ha Tay Province
Winter potato
Summer rice
Spring rice
20.23
14.59
5.86
4.44
5.54
4.14 Acid sulfate soils
Hai Phong Province
Winter potato
Summer rice
Spring rice
Crop
21.38
17.25
5.64
5.03
6.05
5.37
BFFP
Alluvial soils
Hai Dzuong Province
60
Here within the framework of the
BALCROP project, plant nutrition based
on applied sciences has been introduced
to a wide variety of crops and crop systems
on representative soils located on farmers’
fields in Vietnam. Details of major
experiments conducted during Phase I
and II of BALCOP are presented in the
following sections. The recorded fertilizer
nutrient omission experiments in rice-
based systems and coffee may be viewed
as the first long-term fertilizer trial involving
six nutrients and FYM in Vietnam and the
whole of SE Asia.
The results achieved provide the
foundation for implementing Phase III of
the project which anticipates to establish
balanced fertilization as a common
practice throughout Vietnam in a network
involving farmers, extension workers,
scientists, and decision-makers during
2003–2005.
OFD1 OFD2 OFD3 OFD4 Coffee Tea
-1000
0
1000
2000
3000
4000
5000
US$
FP BF
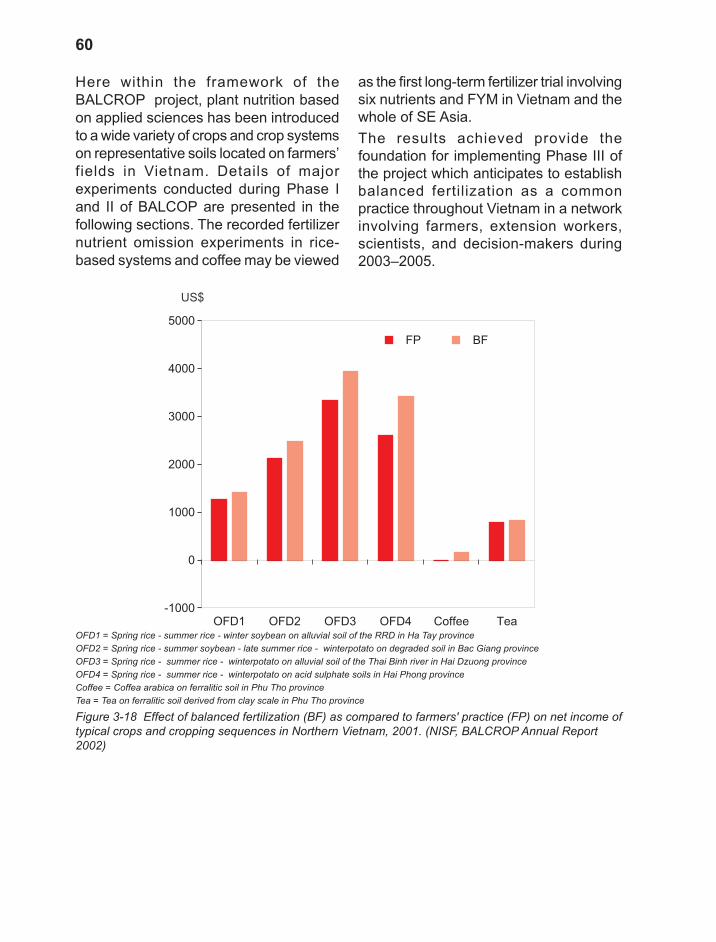
Figure 3-18 Effect of balanced fertilization (BF) as compared to farmers' practice (FP) on net income of
typical crops and cropping sequences in Northern Vietnam, 2001. (NISF, BALCROP Annual Report
2002)
OFD1 = Spring rice - summer rice - winter soybean on alluvial soil of the RRD in Ha Tay province
OFD2 = Spring rice - summer soybean - late summer rice - winterpotato on degraded soil in Bac Giang province
OFD3 = Spring rice - summer rice - winterpotato on alluvial soil of the Thai Binh river in Hai Dzuong province
OFD4 = Spring rice - summer rice - winterpotato on acid sulphate soils in Hai Phong province
Coffee = Coffea arabica on ferralitic soil in Phu Tho province
Tea = Tea on ferralitic soil derived from clay scale in Phu Tho province