festus r-vi school district
TRANSCRIPT

Festus R-VI School District2018 Community Survey
November 7, 2018
Festus Cover 2018.indd 1 11/2/2018 5:10:44 PM

1
Festus School District 2018 Community Telephone Survey
Executive Summary November 7, 2018
In October 2018, a 10- to 12-minute telephone survey was conducted with 371 randomly selected, head-of-household (male or female), registered voters in the Festus School District to determine their thoughts on the district’s current performance and on some project and renovation ideas that the district is considering. Calls were placed to landlines and cell phone numbers, and the completed interviews were divided based on the population distribution, using Highway A and Highway 55 to create the groups. This means that the data in this report that represents the entire survey group has a Margin of Error of plus or minus 5%. (The Margin of Error within the cross-tabulation groups is larger, because the number of respondents in each group is smaller.) Generally speaking, the typical residents who participated in this survey were quite satisfied with the performance of their school district, and found favor with most of the ideas being considered. Specifically: Grading the district’s performance Respondents gave all 19 factors presented to them – plus the district’s overall performance – a grade of “B” or better (or the statistical equivalent of a “B”) on the traditional A-F grading scale. This is the first time this has happened in three surveys, taking place over five years. The top three scores were given to “Quality of education,” “Safety of students in the district” and “Performance of district teachers.” Patron Hot Buttons Twelve of the 19 graded factors also qualified as Patron Hot Buttons, meaning that at least 81% of the respondents were willing to offer a grade, rather than saying, “Don’t know.” This is a somewhat higher than average number of Hot Buttons, suggesting a high level of interest in the district. Strengths and areas needing improvement In separate open-ended questions, respondents identified “Academics,” “Teachers” and Community support/involvement” as the district’s greatest strengths. A total of 148 respondents said, “Don’t know,” when asked to identify an area needing improvement. The top actual factor was “Managing the budget.”

2
Performance on the 2017 Bond Issue Respondents gave a grade of “A” or “B” to the district for its performance in three areas related to the 2017 bond issue:
• Keeping the promises made in that bond issue – 84% • Quality of the finished projects – 83% • Communication with residents during construction – 66%
Ideas for a future potential ballot issue Three of the five ideas being considered received strong support, in terms of respondents saying they would be “More likely to vote in favor,” if that project was included:
• Replacing the HVAC at the Intermediate School – 81% • Adding two more School Resource Officers – 79% • Constructing a Performing Arts Center – 74%
Support was positive, although less so, for an additional gym at the high school (57%), and there are clearly questions about completing the second phase of the stadium (43%). Support for a ballot issue When asked how they would feel about a ballot issue that included the ideas that had been discussed in the survey, and it resulted in a $14 per month tax increase for the owner of a $150,000 home in the district, 60% said they would either “Strongly favor” or “Favor” it, if the election were held today. Taking into account the Margin of Error, that means that the support ranged from 55% to 65%, at the time this survey was taken. Opponents at that level were asked how they would feel about a smaller proposal with a $12 a month tax increase. Support grew to just 62%, which is not a statistically significant increase. Sources of district news Four out of 21 news sources are consulted “frequently” for district updates by at least 50% of the respondents. The top four were “The Leader newspaper,” “Friends and Neighbors,” “The A Step Ahead quarterly newsletter that’s mailed to all area residents,’ and “Teachers in the district.” Perception of tax level compared to other Jefferson County School Districts Thirty percent of respondents thought their school taxes were “near the middle” of all the districts in the county, 23% said, “Don’t know,” 26% thought they were the highest, second-highest or third-highest, and 20% thought they were below the middle or the lowest.

3
The full report that follows contains a series of findings, discussion of each finding, and all the questions, answers and appropriate cross-tabs. A brief summary closes the report.

4
Festus School District 2018 Community Telephone Survey
Final Report November 7, 2018
Finding 1: All 19 different people, program, facility and district/patron relationship factors – plus the district’s overall performance – received a grade of “B” or better (or, in one case only, the statistical equivalent of a “B”) on the traditional A-F grading scale. This is the first time that all the factors have secured such a score. Twelve of the factors also qualified as “Patron Hot Buttons,” meaning that at least 81% of the respondents were willing to offer a grade, rather than saying, “Don’t know.” For the third time in five years, Patron Insight conducted a telephone survey on behalf of the Festus School District to check on the current views of the district’s performance in key areas, and to investigate the residents’ interest in some construction and renovation ideas that the district is considering. Calls were placed to landlines and cell phone numbers in October, and the targeted number of 371 head-of-household (male or female), registered voters living within the boundaries of the Festus School District completed the survey. The completed interviews were divided into groups, using Highway A and the “Hillsboro side” or the “Crystal City side” of Highway 55 to determine the size of each group, to ensure geographic balance. A total of 371 interviews – completed with attention paid to the geographic distribution in a district with this level of population – produced results that have a Margin of Error of plus or minus 5%, at the 95% confidence level, which is the standard for surveys of this type. The Margin of Error is higher within the cross-tabulation groups, because the number of participants in each subgroup is smaller. After the qualification questions had been successfully navigated, each respondent was asked to “grade” – A, B, C, D or F –19 different people, program, facility and district/patron relationship factors, plus the district’s overall performance. Easing respondents into a 12-minute survey with questions of this type allows them to become comfortable with the process (and with the interviewer), before the more complicated questions come up later in the survey. It also provides an opportunity to take a “snapshot” of current patron opinion on a variety of different aspects of the district’s performance.
5
All the grades for all the factors are displayed below. However, to simplify the analysis, a 5-point weighted scale has also been applied. In this scale, each grade of “A” is worth 5 points, down to each grade of “F” being worth 1 point. The point values are totaled and divided by the number of respondents willing to offer a grade (rather than saying, “Don’t know”). Recognizing that securing an “A” in this exercise would require all those with an opinion to say, “A,” the dividing line between areas of strength and those that may need attention is usually considered a “B” (4.00). However, taking into account the Margin of Error, a score as low as 3.80 is still, statistically speaking, a “B.” For the first time, all 19 factors – plus the district’s overall performance – scored a “B” (or the statistical equivalent of a “B”). While the score increases to achieve this result were rather small (because these factors had been near this level on past surveys), this is an achievement, nonetheless. Specifically, the grades are strongest for the following:
• Quality of education – 4.50 • Safety of students in the district – 4.46 • Performance of district teachers – 4.43 • The quality of the technology available to students – 4.38 • The district’s transportation program, meaning the bus service – 4.31 • Quality of the school facilities – 4.31 • Overall grade – 4.31
Even the two lowest scores were not particularly low and, again, were the statistical equivalent of a “B”:
• Efforts of the district to involve citizens in decision-making – 3.91 • The district’s record on making and fulfilling promises – 3.87
The other component of the grading exercise is the identification of Patron Hot Buttons. These are the factors that at least 81% of the survey respondents were willing to offer a grade on, rather than saying, “Don’t know.” In essence, Patron Hot Buttons are the factors that the respondents appear to consider first, when they think about the school district.

6
Twelve of the 19 factors qualified, and, as has been the case in past surveys for the district, these items that come to mind first are a true hodgepodge of topics:
• Quality of education • Safety of students in the district • Performance of district teachers • The district’s transportation program, meaning the bus service • Quality of the school facilities • Preparing students to be college- and career-ready (had been “Preparation of students for
college, vocational or career training, or employment” on previous surveys) • Value received for the tax dollars spent • Performance of the Festus Board of Education • The level of support for the district within the community • Efforts of the district to report its plans and progress to citizens • Efforts of the district to involve citizens in decision-making • The district’s record on making and fulfilling promises
In looking at this list, it is important to remember that all 12 of these items received a grade of “B” or better (or, again, the statistical equivalent of a “B”), meaning that the items that come to mind first for the typical resident are also thought of in a generally positive sense. Questions 1 to 2 confirmed head of household (male or female) and registered voter status. All questions with percentages may add to more or less than 100%, due to rounding. All verbatim comments that appear in this report are one comment, by one person. Had they been indicative of a trend, they would have appeared in enough quantity to be displayed in the chart associated with the question.
3. To make certain we have people who live in all parts of the school district, can you tell me if you live north or south of Highway A? (IF NORTH) Do you live on the Hillsboro side of Highway 55 or on the Crystal City side? Number of respondents in each region was identified by the school district as being representative of the general population pattern. Numbers, rather than percentages, are displayed below.
Response Number
South of Highway A 112 North of Highway A and on the Hillsboro side of Highway 55
130
North of Highway A and on the Crystal City side of Highway 55
129
7
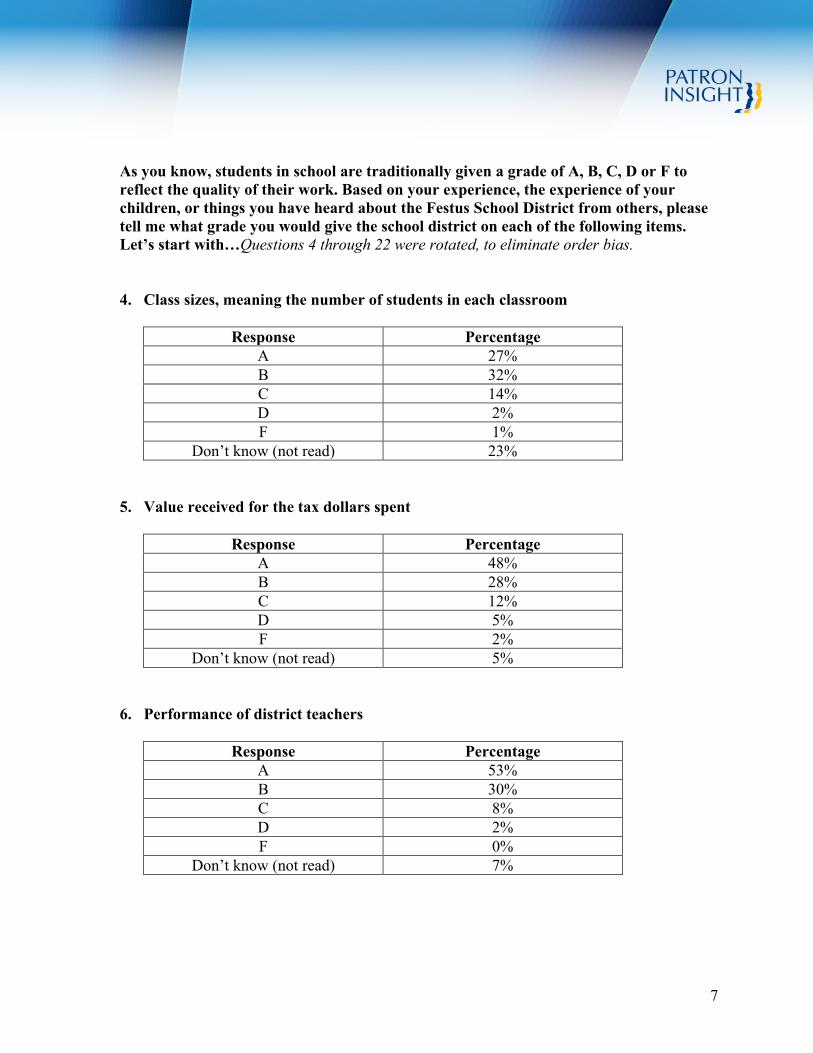
As you know, students in school are traditionally given a grade of A, B, C, D or F to reflect the quality of their work. Based on your experience, the experience of your children, or things you have heard about the Festus School District from others, please tell me what grade you would give the school district on each of the following items. Let’s start with…Questions 4 through 22 were rotated, to eliminate order bias. 4. Class sizes, meaning the number of students in each classroom
Response Percentage
A 27% B 32% C 14% D 2% F 1%
Don’t know (not read) 23%
5. Value received for the tax dollars spent
Response Percentage A 48% B 28% C 12% D 5% F 2%
Don’t know (not read) 5%
6. Performance of district teachers
Response Percentage A 53% B 30% C 8% D 2% F 0%
Don’t know (not read) 7%

8
7. Quality of education
Response Percentage
A 60% B 27% C 6% D 3% F 0%
Don’t know (not read) 4%
8. The quality of the technology available to students
Response Percentage A 39% B 34% C 4% D 2% F 0%
Don’t know (not read) 20%
9. Performance of the superintendent
Response Percentage A 37% B 25% C 8% D 1% F 3%
Don’t know (not read) 26%

9
10. Performance of the Festus Board of Education
Response Percentage
A 31% B 38% C 10% D 1% F 2%
Don’t know (not read) 18%
11. Performance of school principals
Response Percentage A 40% B 26% C 9% D 5% F 1%
Don’t know (not read) 20%
12. Efforts of the district to involve citizens in decision-making
Response Percentage A 23% B 32% C 25% D 2% F 1%
Don’t know (not read) 17%

10
13. Efforts of the district to report its plans and progress to citizens
Response Percentage
A 35% B 33% C 21% D 3% F 1%
Don’t know (not read) 7%
14. The district’s record on making and fulfilling promises
Response Percentage A 28% B 32% C 19% D 7% F 2%
Don’t know (not read) 12%
15. Safety of students in the district
Response Percentage A 55% B 31% C 6% D 2% F <1%
Don’t know (not read) 5%

11
16. Quality of the school facilities
Response Percentage
A 41% B 48% C 8% D 1% F 0%
Don’t know (not read) 2%
17. Preparing students to be college- and career-ready
Response Percentage A 43% B 34% C 9% D 4% F 1%
Don’t know (not read) 9%
18. The district’s responsiveness to citizen concerns
Response Percentage A 25% B 31% C 13% D 3% F 1%
Don’t know (not read) 27%

12
19. The district’s transportation program, meaning the bus service
Response Percentage A 47% B 28% C 10% D 2% F 2%
Don’t know (not read) 11%
20. The user-friendliness of the school district’s website
Response Percentage
A 26% B 24% C 9% D 3% F 0%
Don’t know (not read) 38%
21. The level of support for the district within the community
Response Percentage A 28% B 50% C 18% D 1% F 0%
Don’t know (not read) 3%

13
22. The quality of the district’s food service program
Response Percentage
A 29% B 32% C 11% D 2% F 1%
Don’t know (not read) 25%
23. Thinking about everything you know or have heard about the district, what overall grade would you give the Festus R-6 School District?
Response Percentage
A 43% B 46% C 8% D 2% F 0%
Don’t know (not read) 1%

14
Cross-tabulation: 5-point weighted scale for each of the graded factors. Items in boldface type are Patron Hot Buttons, meaning that at least 81% of the survey respondents were willing to offer a grade on this factor, rather than saying, “Don’t know.” These are the items that typical patrons think of first, when they consider the school district’s performance. (Patron Hot Buttons are shown for 2018 only.)
Graded factor 5-point weighted
scale rating/2018
5-point weighted
scale rating/2016
5-point weighted
scale rating/2014
Quality of education 4.50 4.45 4.33 Safety of students in the district 4.46 4.39 4.17 Performance of district teachers 4.43 4.36 4.35
The quality of the technology available to students 4.38 4.26 4.02 The district’s transportation program, meaning
the bus service 4.31 4.36 4.25
Quality of the school facilities 4.31 4.27 3.95 Overall grade 4.31 4.20 4.01
Preparing students to be college- and career-ready*
4.26 4.15 4.20
Performance of the superintendent 4.24 4.10 4.07 Performance of school principals 4.24 4.23 4.24
Value received for the tax dollars spent 4.21 4.08 4.07 The user-friendliness of the school district’s
website 4.17 4.29 4.29
Performance of the Festus Board of Education 4.14 4.07 3.98 The quality of the district’s food service program 4.14 3.81 3.94 The level of support for the district within the
community 4.09 4.10 4.05
Class sizes, meaning the number of students in each classroom
4.08 3.94 3.83
The district’s responsiveness to citizen concerns 4.06 3.77 3.72 Efforts of the district to report its plans and
progress to citizens 4.05 3.89 3.69
Efforts of the district to involve citizens in decision-making
3.91 3.61 3.62
The district’s record on making and fulfilling promises
3.87 3.77 3.76
*This had been “Preparation of students for college, vocational or career training, or employment” on the 2014 and 2016 surveys.

15
Finding 2: “Academics,” “Teachers” and “Community support/involvement” topped the list of strengths identified by respondents in answer to an open-ended question. On a similar question asking about areas needing improvement, “Don’t know” was number one, followed by “Managing the budget.” Recognizing that the grading questions may not cover all the topics that participants want to discuss, the next two questions provided open-ended opportunities for respondents to opine on the district’s strengths and areas where it can improve. The responses were read and coded – meaning that common words, phrases and ideas were gathered together to provide a clearer picture of the most commonly held views. In doing so, “Academics” (69 mentions) topped the list of strengths, followed closely by “Teachers” (63 mentions) and “Community support/involvement” (55 mentions). The number of items that had at least 20 mentions was high for a district the size of Festus, suggesting a strong connection with the community. In terms of areas needing improvement, “Don’t know” (148 mentions) was the most popular answer – which is also a good sign. This was followed by “Managing the budget” – a common response to this question in the last several years for all school districts – with 71 responses. Below each of the charts is a series of verbatim comments. These comments are either thoughts that were “one-off” in nature, had two ideas contained in the comment or had something else that made them an anomaly. In reviewing these statements, it is important to remember that each is a single statement by one person. Had they been indicative of a trend, they would have appeared in enough quantity to be displayed in the chart associated with the question.
24. What do you think are the district’s strengths? Responses were coded, based on common words, phrases and ideas. Numbers, rather than percentages, are displayed below.
Response Number Academics 69 Teachers 63
Other (see below) 62 Community support/involvement 55
It’s a safe district 38 Don’t know 35
Small-town feel 29 Communication 20

16
Verbatim “other” comments Overall education. They have nice school buildings. Preparing the students for jobs. I like the fact that if a kid is falling behind in math or science, they have a special class if they have fallen behind, instead of failing. Students can get college credits while attending high school. Involve parents in decision-making. Emails are wonderful to let residents know what's going on. Giving good quality education for the money spent. Teacher retention is a good strength. The value of the education that the kids receive. I'm not sure they have any. They tend to plan ahead pretty well. The Superintendent. The School Board is involved in community. The Special Ed teachers. Their dedication of giving students a good education. They have a high tax base, so they have a lot of money and they use it for the kids. We are big on participating in outings in the community. They are very social. Their technology and teachers are second-to-none. They have proven to be the best in Jefferson County in state scores. Quality teachers, and preparing students for college and the work force. The efforts of the teachers and principal. Overall, they work really hard to make sure the community is involved, and they have some of the most caring teachers. College- and career-readiness. Quality teachers and leadership.

17
Their students stay in school and we have freshmen that take college courses. They do have a nice football field. The teachers, the security of the students, the extracurricular activities they offer and not in just sports. It really is a good school district. I think quality and it's so much better than others in Jefferson County. Educational support for all levels of learners. Their safety and their sports program. The efficient use of taxpayers’ money to educate the students. Community involvement. It's all about the kids’ education. They give all students special help, if you are smart or slow. They're really compassionate. Good communication with parents. Good educators. Extracurricular activities are good. Giving our kids a good education. The quality of education. They offer scholarships to further education. Administration and teachers are strong in the district. Good education ratings. I would say the state scores. They are better than most other schools in our area. It's not a huge school, just the right size. High scores in statewide testing. They graduate good students. They are responsive to the community. The Superintendent is a good leader. They are making strides to put more security in the schools.

18
Pep rallies and support from community. Keeping the community involved. They keep the community aware of school activities. Teachers are very concerned for students. Technology. Teachers, diversity of children and technology. Prep for college. We are a Blue Ribbon school. They care. I have a grandson who is ADHD and they have certainly given him lots of TLC. They always push academics. Meeting the needs of the children. They keep up on technology. School performance and how they prepare the kids for tests. Quality teachers and the Board. They really care about kids. Students seem happy to go to school. They do a good job of preparing the kids for the future. Leadership is good and they have the kids’ best interests in mind when making decisions. The graduates leave here well-prepared. The teachers. Standardized testing. They do very well. Location gives them the ability to draw better teachers, and community involvement. All programs are up and running and in good shape. They are exceptional in the arts. All around good school. Support of all the community. Good athletic facilities.

19
Teaching staff and parents. The staff. The facilities. They tend to spend their money wisely. They prepare our kids for a successful future in college and the workplace.
25. Where could the district improve? Responses were coded, based on common words, phrases and ideas. Numbers, rather than percentages, are displayed below.
Response Number
Don’t know 148 Managing the budget 71
Other (see below) 64 Reduce class sizes 39 Communication 33
Nothing/Doing fine as is 16
Verbatim “other” comments Better facilities. More along the lines of making sure expectations are held to a standard. Make the testing not so hard for graduating students. School rezoning, like classroom sizes. About the land they bought without planning, and now I have heard they can't build and want to sell the property. Finish up the work that the high school didn't finish. Transportation. I think the buses are overcrowded sometimes. Focus more on academics over sports. It's too late now, but the distance between the schools. There's always room for improvement in technology. Their choice of principals. Less criticism and more interest in what is going on around us, and bullying is out of control.

20
More one-on-one time with the kids. Making and fulfilling promises. Education level should be raised. I don't think students are nearly prepared for college. Maybe more articles in the paper about things going on at the school. Keeping information out there so incoming new parents could check and make a decision. More Resource Officers. On-on-one computer tablets. Bigger facilities. Parking. They need to be a little more strict on the rules and regulations. They just built a new high school by the stadium, which I think was unnecessary. My granddaughter doesn't learn much. We are not reading or writing. We are going to the zoo to feed the animals. They have done away with cursive writing. We have modern math that is just ridiculous. A diamond isn't a diamond any more. They have changed the names of the images. Probably more parking. Parking. Communications have gotten better, but could improve, and I would love to see more technology courses. We need a theatre. They need to teach more skills like math and so forth. Maybe getting the senior citizens more involved with decision-making. If they could finally get bond issues approved so they could go ahead and find more room. Broader food alternatives, more healthy choices. Need to build a new high school to make classes smaller. Middle School facility is old and needs improvement.

21
They need a new high school. Build new schools closer together. Getting out to the public a little more. Parking is poor for activities that community would like to attend. Try to get all types of people in the district to get new ideas. Maybe the facilities. I really don't know, because my child isn't there yet. Make sure academics is priority over sports. Parking is an issue at the schools. An expensive district. They need more parking around the schools for seniors. They have a hard time finding a parking space when going to events. Communicate plans to the community. They built a $5 million football stadium without consulting the community. We need more support for the arts. It's not poor now, but not great either. More art' facilities. At the high school level, there is a lack of cooperation between sports and arts. Need more Resource Officers. Too much emphasis on sports, more than academics. Nothing. Class sizes are too large. My child has 21 students for one teacher. Manage the budget better. Online courses, like for medical. Not much that I know of. Probably a new building. We have bought land for the future, but haven't started it yet. We need to make the class sizes a little bit smaller. Updated technology.

22
Food service and class sizes. Safety and security. The website isn't user-friendly. I can't always trust the level of information it gives. Problems with parking around schools and behavior on buses. I would like to see a Performing Arts Center. The website is not great and needs to be more user-friendly. The whole community needs to be involved, not just the ones who have students attending the district. Everywhere. I have concerns for the children. None. Traffic is a mess. It probably isn't anything that the school can do anything about, but it is very aggravating. Get a new round of coaches. Continue to maintain for the long haul. Parking. They need to have shuttles when you have an event. Old people can't walk great distances. On Grandparents Day, parking close is horrible. Technology for K-12. Upkeep on school buildings. Leaking buildings. Students are actually in schools that need better upkeep and not new construction. Technology and more space, especially in the high school. They are busting at the seams. Better facilities. More improvements.

23
Finding 3: Respondents appeared to be quite pleased with the district’s performance on (and communication regarding) the 2017 bond issue. Before asking about new ideas for a potential future ballot issue, the survey turned to the 2017 ballot for a series of performance and communication questions. In general, the district received a strong vote of support on all the items in the survey. Specifically, the combined “A” and “B” percentages were (descriptions truncated):
• Keeping the promises made during the campaign – 84% • The quality of the finished projects – 83% • How well it communicated about the progress of construction – 66%
These results are further evidence of the good relationship between the district and typical residents, which bodes well for future proposals that the public deems sensible and reasonable.
26. As you may recall, in 2017, local residents approved a ballot question that allowed the district to complete a series of major projects, including expansion of the elementary school computer lab, renovation and expansion of the high school choir and band areas, and expansion of the parking lot at Festus Middle School – all without a tax increase. What grade would you give the district for keeping the promises it made during that campaign?
Response Percentage
A 64% B 20% C 7% D 1% F 0%
Don’t know (not read) 8%

24
27. What grade would you give the district for how well it communicated with you
about the progress of the construction?
Response Percentage A 42% B 24% C 19% D 6% F 4%
Don’t know (not read) 6%
28. Based on what you know or what you may have heard from others, what grade would you give the quality of the finished projects from that 2017 proposal?
Response Percentage A 56% B 27% C 7% D 1% F 0%
Don’t know (not read) 8%

25
Finding 4: Three of the five potential projects received strong support among survey participants, while one had support that was still over 50%. Respondents were not quite as positive about Phase 2 of the stadium, at least at the time the survey was taken. The next set of questions presented five different ideas for a possible future ballot issue. After each was described, respondents were asked if including this project in such a ballot issue would make them “More likely to vote in favor,” “More likely to vote against” or would it “Make no difference” in their voting decisions. Three of the projects stood out, in terms of the level of support, while one stimulated less enthusiasm, but was still over 50% (descriptions truncated):
• Replace the HVAC at the Intermediate School – 81% “More likely to vote in favor” • Add two more School Resource Officers – 79% • Construct a Performing Arts Center – 74% • Construct an additional gym at the high school – 57%
The remaining project – Complete Phase 2 of the stadium project scored as follows:
• More likely to vote in favor – 43% • More likely to vote against – 28% • It would make no difference in my voting decision – 26% • Don’t know – 4%
While there was more support than opposition, this project clearly stimulated more questions and uncertainty than the top three and, potentially, the top four. The cross-tabulations showed only that men were less supportive of all the projects than women. The others had no clear patterns where one subgroup was always more positive or negative than the others of its type. In other words, the support – or lack of it – was fairly consistent, no matter what the demographic or geographic characteristics of the respondent. When asked to identify their favorite project of the five (if any), the HVAC system replacement (31%) and constructing the Performance Arts Center (26%) were the clear top choices. And when asked to identify the project they were most against (if any), Phase 2 of the stadium project (38%) topped that list, followed by building an additional gym at the high school (21%).

26
As the district continues to plan, some ideas have been discussed that might appear as part of a ballot issue at some point. As I read each one, please tell me what you think. Questions 29 through 33 were rotated. Choices, except where indicated, were read to respondents.
29. One idea is to add two more School Resource Officers, bringing the total to four. Right now, the two existing officers rotate between the four school buildings. Under this scenario, one would be on duty at all times at each building. If this were part of a future ballot issue, would you be…?
Response Percentage
More likely to vote in favor of the ballot issue
79%
More likely to vote against 3% It would make no difference in my
voting decision 16%
Don’t know (not read) 2%
30. One idea is to construct a Performing Arts Center at the high school. This would provide a performance space for plays and concerts, which currently take place in the gym. The Performing Arts Center would also be available for community groups to use, when it was not needed by the school district. If this were part of a future ballot issue, would you be…?
Response Percentage
More likely to vote in favor of the ballot issue
74%
More likely to vote against 12% It would make no difference in my
voting decision 10%
Don’t know (not read) 4%

27
31. One idea is to construct an additional gymnasium at the high school that would seat approximately 2 thousand 5 hundred and would have a track around the top for the community to use, when it was not being used by the school. A gym of this size would also provide opportunities for hosting events, such as regional athletic events, and it would be large enough to make certain that graduation could always take place indoors. If this were part of a future ballot issue, would you be…?
Response Percentage
More likely to vote in favor of the ballot issue
57%
More likely to vote against 21% It would make no difference in my
voting decision 17%
Don’t know (not read) 5%
32. One idea is to replace the heating, ventilation and air-conditioning, or HVAC, system at the intermediate school. The current system has been experiencing significant mechanical issues that cause it to be less effective and efficient than the systems at the other school buildings. If this were part of a future ballot issue, would you be…?
Response Percentage
More likely to vote in favor of the ballot issue
81%
More likely to vote against 2% It would make no difference in my
voting decision 15%
Don’t know (not read) 3%
33. One idea is to complete Phase 2 of the stadium project. Phase 2 includes additional parking, visitor side bleachers and locker room facilities at the stadium for both teams. If this were part of a future ballot issue, would you be…?
Response Percentage More likely to vote in favor of the
ballot issue 43%
More likely to vote against 28% It would make no difference in my
voting decision 26%
Don’t know (not read) 4%

28
Cross-tabulation: “M
ore likely to vote in favor” percentage for each project idea by age, length of time living in the district
and gender. Note: “n” equals the num
ber of respondents in each group. “Age” w
ill not square with “overall” score, because 15
respondents refused to answer this question.
“More likely to vote in favor” percentage
Overall
score
18-34 (n=67)
35-54 (n=167)
55 or older
(n=122)
U
p to 5 years
(n=33)
5-15 years
(n=120)
More
than 15 years
(n=218)
Fem
ale (n=208)
Male
(n=163)
Two m
ore School Resource O
fficers 79%
88%
77%
78%
88%
84%
74%
80%
77%
Constructing a Perform
ing Arts C
enter 74%
84%
74%
70%
82%
71%
75%
77%
70%
Additional high school gym
57%
52%
62%
55%
52%
60%
57%
62%
52%
Replace H
VA
C at Interm
ediate School 81%
82%
81%
80%
76%
82%
81%
84%
77%
Com
plete Phase 2 of the stadium
43%
37%
44%
44%
61%
41%
41%
46%
38%
C
ross-tabulation: “More likely to vote in favor” percentage for each project idea by location of the respondent’s residence,
and by the presence of a current district student in the household, a past student (but no current student) or no student ever in the household. N
ote: “n” equals the number of respondents in each group.
“More likely to vote in favor” percentage
Overall
score
S/Highw
ay A
(n=112) N
/Highw
ay A
and H
illsboro side of
Highw
ay 55 (n=130)
N/H
ighway
A and
Crystal C
ity side of
Highw
ay 55 (n=129)
Student,
yes (n=117)
Student, past
(n=127)
Student, never
(n=127)
Two m
ore School Resource O
fficers 79%
80%
79%
77%
84%
70%
83%
C
onstructing a Performing A
rts Center
74%
72%
75%
75%
76%
69%
77%
Additional high school gym
57%
54%
58%
59%
64%
57%
52%
R
eplace HV
AC
at Intermediate School
81%
77%
82%
82%
84%
75%
83%
Com
plete Phase 2 of the stadium
43%
44%
42%
43%
48%
43%
38%

29
34. Of the five ideas, which – if any – were you most in favor of? It can be one, two, all
or none. I can reread the list again, if you would like me to. Percentages will add to more than 100%, because respondents were permitted to select more than one choice.
Response Percentage
Replacing the HVAC system at the intermediate school
31%
Constructing a Performing Arts Center
26%
All of them (not read) 22% Two additional School Resource
Officers 17%
Building an additional gym at the high school
10%
Completing Phase 2 of the stadium project
9%
Don’t know (not read) 3% None of them (not read) 0%
35. Of the five ideas, which – if any – were you most against? It can be one, two, all or none. I can reread the list again, if you would like me to. Asked only of the 290 respondents who did not answer, “All of them” on question 34. Percentages will add to more than 100%, because respondents were permitted to select more than one choice.
Response Percentage
Completing Phase 2 of the stadium project
38%
Building an additional gym at the high school
21%
Constructing a Performing Arts Center
16%
Don’t know (not read) 13% Two additional School Resource
Officers 8%
Replacing the HVAC system at the intermediate school
4%

30
Cross-tabulation: “Favorite” and “Most against” percentage for each project. Listing is based on “Favorite” score.
Response Percentage/“Favorite” Percentage/“Most against”
Replacing the HVAC system at the intermediate school
31% 4%
Constructing a Performing Arts Center
26% 16%
Two additional School Resource Officers
17% 8%
Building an additional gym at the high school
10% 21%
Completing Phase 2 of the stadium project
9% 38%

31
Cross-tabulation: Percentage of projects that respondents w
ere most in favor of by age, length of tim
e living in the district and gender. N
ote: “n” equals the number of respondents in each group. “A
ge” will not square w
ith “overall” score, because 15 respondents refused to answ
er this question. Not show
n below is the 22%
of the respondents who said, “A
ll of them,” even though this answ
er was not offered.
Project respondent is m
ost in favor of O
verall score
18-34 (n=67)
35-54 (n=167)
55 or older
(n=122)
U
p to 5 years
(n=33)
5-15 years
(n=120)
More
than 15 years
(n=218)
Fem
ale (n=208)
Male
(n=163)
Replacing the H
VA
C system
at the interm
ediate school 31%
25%
29%
37%
33%
29%
32%
29%
34%
Constructing a Perform
ing Arts C
enter 26%
33%
26%
20%
12%
28%
27%
29%
21%
Two additional School R
esource Officers
17%
12%
14%
24%
15%
17%
17%
21%
12%
B
uilding an additional gym at the high
school 10%
10%
12%
7%
6%
13%
10%
9%
12%
Com
pleting Phase 2 of the stadium
project 9%
9%
10%
7%
6%
11%
7%
10%
7%
Cross-tabulation: Percentage of projects that respondents w
ere most in favor of by location of the respondent’s residence, and by the
presence of a current district student in the household, a past student (but no current student) or no student ever in the household. Note:
“n” equals the number of respondents in each group.
Project respondent is m
ost in favor of O
verall score
S/H
ighway
A (n=112)
N/H
ighway
A and
Hillsboro side of
Highw
ay 55 (n=130)
N/H
ighway
A and
Crystal C
ity side of
Highw
ay 55 (n=129)
Student,
yes (n=117)
Student, past
(n=127)
Student, never
(n=127)
Replacing the H
VA
C system
at the interm
ediate school 31%
33%
28%
33%
23%
35%
35%
Constructing a Perform
ing Arts C
enter 26%
20%
30%
28%
26%
27%
25%
Tw
o additional School Resource
Officers
17%
22%
18%
11%
15%
15%
20%
Building an additional gym
at the high school
10%
9%
14%
8%
15%
10%
6%
Com
pleting Phase 2 of the stadium
project 9%
9%
9%
8%
9%
9%
8%

32
Cross-tabulation: Percentage of projects that respondents w
ere most against by age, length of tim
e living in the district and gender. Q
uestion was asked of only the 290 respondents w
ho did not answer, “all of them
” on the question about their favorite project. Note: “n”
equals the number of respondents in each group. “A
ge” will not square w
ith “overall” score, because 15 respondents refused to answer
this question.
Project respondent is most against
Overall
score
18-34 (n=54)
35-54 (n=113)
55 or older
(n=85)
U
p to 5 years
(n=24)
5-15 years
(n=83)
More
than 15 years
(n=157)
Fem
ale (n=139)
Male
(n=125)
Com
pleting Phase 2 of the stadium project
38%
37%
42%
45%
29%
45%
42%
43%
40%
B
uilding an additional gym at the high
school 21%
26%
25%
19%
33%
24%
21%
27%
19%
Constructing a Perform
ing Arts C
enter 16%
19%
19%
14%
14%
18%
17%
17%
17%
Two additional School R
esource Officers
8%
6%
7%
13%
17%
6%
10%
9%
10%
R
eplacing the HV
AC
system at the
intermediate school
4%
6%
4%
5%
4%
4%
5%
2%
7%
Percentage of projects that respondents were m
ost against by location of the respondent’s residence, and by the presence of a current district student in the household, a past student (but no current student) or no student ever in the household. Q
uestion was asked of only
the 290 respondents who did not answ
er, “all of them” on the question about their favorite project. N
ote: “n” equals the number of
respondents in each group.
Project respondent is most against
Overall
score
S/Highw
ay A
(n=73) N
/Highw
ay A
and H
illsboro side of
Highw
ay 55 (n=100)
N/H
ighway
A and
Crystal C
ity side of
Highw
ay 55 (n=91)
Student,
yes (n=75)
Student, past
(n=95)
Student, never (n=74)
Com
pleting Phase 2 of the stadium project
38%
41%
45%
38%
43%
40%
54%
Building an additional gym
at the high school
21%
27%
20%
23%
21%
20%
35%
Constructing a Perform
ing Arts C
enter 16%
14%
16%
21%
22%
16%
18%
Tw
o additional School Resource O
fficers 8%
12%
7%
9%
5%
14%
9%
R
eplacing the HV
AC
system at the
intermediate school
4%
3%
6%
4%
4%
5%
5%

33
Finding 5: When asked whether or not they would support a ballot issue that contained the ideas that had just been presented to them, a majority were supportive at a tax increase of $14 per month on a $150,000 home. Only a handful of opponents became supportive when the proposal had fewer projects and cost $12 a month. If the proposal is for a bond issue, support at either cost level is somewhat tenuous, given the 5% Margin of Error. After hearing the specific project ideas, respondents were asked about their level of support for a potential future ballot issue that would address these ideas, if the election were held today. At a cost of $14 per month for the owner of a $150,000 home in the school district, 60% said they would either “Strongly favor” or “Favor” such a proposal. When opponents at that level were asked about the idea of a smaller proposal that would result in a $12 a month increase, the combined “Strongly favor/Favor” percentage grew to just 62%, which is not statistically significant. In the cross-tabulations, the support ranged from 56% (both tax increase levels among respondents who live north of Highway A and on the Hillsboro side of Highway 55) to a high of 67% (for the $12 level among residents who live north of Highway A and on the Crystal City side of Highway 55). Clearly, the district will need to study these results as it determines the project list, the timing and whether its proposal will be a bond issue or an operating levy increase.
36. What if, at some point in the future, the district proposed a ballot issue that included the ideas that we have just been discussing, and it resulted in a tax increase of about 14 dollars per month for the owner of a $150,000 home in the district? If an election on such a ballot issue were held today, would you…? Choices, except where indicated, were read to respondents.
Response Percentage
Strongly favor 8% Favor 52%
Lean favor (not read) 3% Lean oppose (not read) <1%
Oppose 20% Strongly oppose 12%
Don’t know (not read) 4%

34
37. What if, instead, the proposal included FEWER of these ideas, and it resulted in a tax increase of about 12 dollars per month for the owner of a $150,000 home in the district? If an election on such a ballot issue were held today, would you…? Asked only of the 136 respondents who did not answer, “Strongly favor,” “Favor” or “Lean favor” on question 36. Percentages shown below for the three favor choices are the cumulative percentages for questions 36 and 37, under the assumption that a respondent who supports a higher tax increase level would support a lower one as well. Choices, except where indicated, were read to respondents.
Response Percentage
Strongly favor 8% Favor 54%
Lean favor (not read) 4% Lean oppose (not read) <1%
Oppose 18% Strongly oppose 12%
Don’t know (not read) 3%

35
38. Which idea or ideas would you eliminate to bring the tax increase down to 12
dollars per month? Asked only of the 11 respondents who were negative on question 36, but answered either “Favor” or “Lean favor” on question 37. Numbers, rather than percentages, are shown below. Respondents were permitted to choose more than one answer. Choices, except where indicated, were read to respondents.
Response Number Building an additional gym at the
high school 5
Completing Phase 2 of the stadium project
4
Constructing a Performing Arts Center
3
Don’t know (not read) 2 Two additional School Resource
Officers 1
Replacing the HVAC system at the intermediate school
0

36
Cross-tabulation: C
ombined “Strongly favor/Favor” percentage for each potential tax increase level by age, length of tim
e living in the district and gender. N
ote: “n” equals the number of respondents in each group. “A
ge” will not square w
ith “overall” score, because 15 respondents refused to answ
er this question. C
ombined “Strongly favor/Favor” percentage
Overall
score
18-34 (n=67)
35-54 (n=167)
55 or older
(n=122)
U
p to 5 years
(n=33)
5-15 years
(n=120)
More
than 15 years
(n=218)
Fem
ale (n=208)
Male
(n=163)
$14 per month increase
60%
61%
59%
63%
58%
58%
62%
61%
60%
$12 per m
onth increase 62%
64%
61%
65%
58%
59%
65%
62%
63%
Cross-tabulation: C
ombined “Strongly favor/Favor” percentage for each potential tax increase level by location of the respondent’s
residence, and by the presence of a current district student in the household, a past student (but no current student) or no student ever in the household. N
ote: “n” equals the number of respondents in each group.
Com
bined “Strongly favor/Favor” percentage O
verall score
S/H
ighway
A (n=112)
N/H
ighway
A and
Hillsboro side of
Highw
ay 55 (n=130)
N/H
ighway
A and
Crystal C
ity side of
Highw
ay 55 (n=129)
Student,
yes (n=117)
Student, past
(n=127)
Student, never
(n=127)
$14 per month increase
60%
62%
56%
64%
57%
66%
57%
$12 per month increase
62%
64%
56%
67%
59%
66%
61%

37
Finding 6: Four of 21 potential sources of district news are consulted “frequently” by 50% or more of the survey participants, with one more source at 42% and six more in the 30s%. As the survey was drawing to a close, participants were read a list of 21 potential places they could look for school district news. After each was read, each person was asked to state whether or not they consulted that source frequently for such news. Four of the sources topped 50%:
• The Leader newspaper – 84% • Friends and neighbors – 73% • The A Step Ahead quarterly newsletter that’s mailed to all area residents – 65% • Teachers in the district – 50%
On top of that, there was one source at 42% and six more between 32% and 39%, suggesting a very healthy interest in school district news.
39. I have just a few more questions. I’m wondering where you turn for information about the Festus School District, BESIDES news about weather-related school closings. I’m going to read a short list of people and places where you might turn for district news. If you consult this source frequently, say, “Yes.” If you consult it only every so often, or you don’t consult it at all for district news, say, “No.” Let’s start with...Choices were read to respondents. The two questions on social media were always read in the same order: district social media accounts, first, and then other social media accounts, second. This was done to make it clear that these were different questions about social media. The rest of the choices were rotated.
Response Percentage
The Leader newspaper 84% Friends and neighbors 73%
The A Step Ahead quarterly newsletter that’s mailed to all area residents
65%
Teachers in the district 50% The district’s administration, either in person or
when a member of the administration is quoted in the news media
42%
The school district’s website 39% The School Board, either in person, or when a
member of the Board is quoted in the news media 37%
School principals in the district 36% Marquees at the schools 34%

38
Individual school newsletters 33% Local radio stations 32%
Messages sent through School Messenger 28% The district’s official Twitter, Facebook and
Instagram social media accounts 26%
The conversation at church 24% Other social media accounts, where the district is
sometimes discussed 21%
The Parent Teacher Organization, also known as the PTO
20%
Through sports and recreational clubs for youth 18% The St. Louis Post-Dispatch newspaper 17%
Booster clubs 15% Civic groups, such as Rotary, Kiwanis, the
Chamber and the Optimists 11%
The mymoinfo.com website 9%

39
Demographics, including perception of the size of the district’s levy As always, the survey closed with a series of demographic questions to pinpoint the characteristics of the individuals who took part. This, combined with the geography (“Where do you live?”) question at the beginning, shows that the survey group:
• Was, as expected, mostly long-term residents, with 59% having lived in the district more than 15 years, but with 23% living there 10 years or less.
• 72% lived inside the city limits of Festus. • 60% were between the ages of 25 and 54.
This section also repeated the question from 2016 regarding the perception of the district’s tax rate, in comparison to the other school districts in Jefferson County. Almost one in four (23%) said, “Don’t know,” while those with an opinion tended to think the tax rate was “near the middle” (30%), the highest, second-highest or third-highest (26%), or below the middle or the lowest (20%).
40. How long have you, yourself, lived within the boundaries of the Festus School District? Is it...? Choices were read to respondents.
Response Percentage
Less than 2 years 2% 2 years to 5 years 7%
More than 5 years to 10 years 14% More than 10 years to 15 years 18%
More than 15 years 46% I’ve lived here all my life 13%
41. Do you live inside or outside the city limits of Festus?
Response Percentage Inside 72%
Outside 28%

40
42. In what age group are you? Is it...? Choices, except where indicated, were read to
respondents.
Response Percentage 18 to 24 3% 25 to 34 15% 35 to 44 22% 45 to 54 23% 55 to 64 20%
65 or older 13% Refused (not read) 4%
43. Do you have any children or grandchildren who attend school in the Festus School District right now? Numbers, rather than percentages, are displayed below.
Response Number
Yes, children 114 Yes, both children and
grandchildren 3
Yes, grandchildren 66 No 188
44. Do you have children or grandchildren who will be attending the Festus School District within the next five years? Asked only of the 254 respondents who did not answer question 45 either “Yes, children” or “Yes, both children and grandchildren.” Numbers, rather than percentages, are displayed below.
Response Number
Yes, children 26 Yes, both children and
grandchildren 1
Yes, grandchildren 34 No 193

41
45. Do you have any children or grandchildren who previously were students in the
district, but who have graduated? Asked only of the 254 respondents who did not answer question 43 either “Yes, children” or “Yes, both children and grandchildren.” Numbers, rather than percentages, are displayed below.
Response Number
Yes, children 108 Yes, both children and
grandchildren 19
Yes, grandchildren 3 No 124
46. My final question is this: Where do you think the tax levy for the Festus School District ranks, as compared to the other 10 school districts in Jefferson County? Would you say it is…? Choices, except where indicated, were read to respondents.
Response Percentage/2018 Percentage/2016
The highest 6% 4% Not the highest, but the
second-highest or the third-highest
20% 18%
Near the middle – like fourth, fifth or sixth
30% 43%
Below the middle – like seventh, eighth, ninth or
10th
12% 9%
The lowest 8% 5% Don’t know (not read) 23% 20%
47. RECORD GENDER
Response Percentage Female 56% Male 44%

42
Cross-tabulation: Perceived size of the district tax levy, in com
parison to the other school districts in Jefferson County, by age,
length of time living in the district and gender. N
ote: “n” equals the number of respondents in each group. “A
ge” will not square
with “overall” score, because 15 respondents refused to answ
er this question.
Response
Overall
score
18-34 (n=67)
35-54 (n=167)
55 or older
(n=122)
U
p to 5 years
(n=33)
5-15 years
(n=120)
More
than 15 years
(n=218)
Fem
ale (n=208)
Male
(n=163)
The highest 6%
3%
7%
8%
3%
4%
8%
6%
6%
Second-highest or third-highest 20%
24%
19%
22%
9%
22%
22%
20%
21%
Near the m
iddle – fourth, fifth or sixth 30%
28%
32%
29%
48%
28%
28%
29%
31%
Below
the middle – seventh, eighth, ninth or
10th 12%
12%
10%
15%
0%
14%
13%
12%
13%
The lowest
8%
9%
9%
4%
6%
10%
6%
9%
6%
C
ross-tabulation: Perceived size of the district tax levy, in comparison to the other school districts in Jefferson C
ounty, by location of the respondent’s residence, and by the presence of a current district student in the household, a past student (but no current student) or no student ever in the household. N
ote: “n” equals the number of respondents in each group.
R
esponse O
verall score
S/H
ighway
A (n=112)
N/H
ighway
A and
Hillsboro side of
Highw
ay 55 (n=130)
N/H
ighway
A and
Crystal C
ity side of
Highw
ay 55 (n=129)
Student,
yes (n=117)
Student, past
(n=127)
Student, never
(n=127)
The highest 6%
4%
3%
11%
3%
9%
6%
Second-highest or third-highest
20%
23%
22%
17%
21%
21%
20%
Near the m
iddle – fourth, fifth or sixth 30%
31%
28%
31%
31%
30%
30%
B
elow the m
iddle – seventh, eighth, ninth or 10th
12%
13%
17%
7%
14%
11%
12%
The lowest
8%
8%
6%
9%
13%
6%
4%

43
Summary The October 2018 telephone survey of 371 residents of the Festus School District showed a patron community that is, on balance, quite happy with its school district.
• They give all the graded factors a “B” or better.
• They heap praise on the academics, the teachers and the community support/involvement, and, with the exception of the very common response of “Managing the budget,” had a difficult time identifying any areas of the district that needed improvement.
• They speak positively about how the district has addressed the 2017 bond issue – from keeping promises, to communication, to the finished projects themselves.
• They feel very strongly about a future ballot issue, including the replacement of the HVAC at the Intermediate School, adding two more SROs and building a Performing Arts Center. They are positive, but less so, about building a second gym at the high school and clearly have some questions about completing the second phase of the stadium project.
• They are modestly positive (from a percentage standpoint) in their support for a ballot issue that would result in a $14 per month increase for the owner of a $150,000 home. Only a few respondents who were negative at that level became positive at $12 per month.
• Almost one-fourth of the participants said they don’t know how their taxes stack up in comparison to other districts in the county. The most popular choice was “near the middle.”
As the district looks forward, it should study this data with information it has received from other sources (conversation with parents and patrons, etc.) and make a determination about the project list. If a project is removed, it is important to acknowledge that it was input from residents that caused this decision. As interested as patrons are in school district news, this is a critical message to deliver. Whenever the district moves forward, it will be essential to keep the messages simple, benefit-driven and, most of all, repetitive. Always be explaining how each project will benefit students.