ffnyyh lkaf[;dh; nyyh lkaf[;dh;...
TRANSCRIPT


i
fnYyh lkaf[;dh; fnYyh lkaf[;dh; iqfLrdkiqfLrdk
DELHI STATISTICALHAND BOOK
2017
vFkZ ,oa lkaf[;dh funs'kky; vFkZ ,oa lkaf[;dh funs'kky; jk"Vªh; jkt/kkuh {ks=] fnYyh ljdkjjk"Vªh; jkt/kkuh {ks=] fnYyh ljdkj
DIRECTORATE OF ECONOMICS & STATISTICSGOVERNMENT OF NATIONAL CAPITAL
TERRITORY OF DELHIWebsite : www.des.delhi.gov.in

ii

iii
izLrkoukizLrkouk
vFkZ ,oa lkaf[;dh funs'kky;] jk"Vªh; jkt/kkuh {ks=] fnYyh ljdkj }kjk izdkf'kr fnYyh lkaf[;dh; iqfLrdk 2017 dk ;g 42oka vad gSA bl izdk'ku esa fnYyh la?k jkT; ls lacaf/kr fofHkUu lkektfFkZd xfrfof/k;ksa ds vkadM+ksa dks n'kkZ;k x;k gSA vkadM+ksa dks 23 foLrkj iwoZd fooj.k;ksa esa izLrqr fd;k x;k gSA bl izdk'ku ds fy, iz'kkldksa] vuqla/kkudÙkkZvksa o vU; iz;ksxdÙkkZvksa dh çfrfØ;k cM+h izksRlkgd jgh gSA vr% iz;ksxdÙkkZvksa ds fy, vf/kd ykHkizn cukus gsrq lkaf[;dh; lwpuk vkSj vf/kd izHkkodkjh djus ds iz;kl fujUrj fd;s tkrs jgs gSaA
;g izdk'ku bl funs'kky; ds ewY; o leUo; vuqHkkx }kjkJh 'kku&,&vkye] mi&funs'kd] Jh jktsUnz dqekj] lgk;d funs'kd]Jh lqjthr flag jkor] lkaf[;dh; vf/kdkjh ds ekxZn'kZu o laj{k.k esa rS;kj fd;k x;k gSA vkadM+s ,df=r djuk] tkap djuk] laxzg djuk vkfn dk;Z Jh jfoUnz dqekj] lkaf[;dh; lgk;d] eatw lSuh] lkaf[;dh; lgk;d]vuqt dqekjh] lkaf[;dh; lgk;d] usgk ok".ksZ;] lkaf[;dh; lgk;d }kjk fd;k x;k gSA
;g funs'kky; mu lHkh ,tsfUl;ksa dk ftUgksaus bl iqfLrdk esa leos'k ds fy, vkadM+s fn;s gSa] vkHkkjh gSA Hkfo"; esa bl iqfLrdk ds dk;Z&{ks= ,oa v/;kiu dks lq/kkjus ds gsrq lq>koksa dk Lokxr gSA
fnlacj] 2017 nsosUnz flag] Hkk-iz-ls-nsosUnz flag] Hkk-iz-ls-
fo'ks"k lfpo&lg&funs'kdfo'ks"k lfpo&lg&funs'kd

iv
PREFACE
Delhi Statistical Hand Book-2017 is the 42nd issue being published by Directorate of Economics & Statistics, Government of National Capital Territory of Delhi. This publication contains data relating to various Socio-economic parameters in respect of NCT of Delhi. Data is presented under 23 broad chapters. The response to this publication from the Administrators, Research Workers and other users has been very encouraging. Efforts are, therefore, made continuously to include more Statistical information to make it useful for the users.
The publication has been prepared by Price and Co-ordination Unit of this Directorate under the guidance and supervision ofSh. Shan-E-Alam, Deputy Director, Sh. Rajendra Kumar, Asstt. Director, Sh.Surjeet Singh Rawat, Statistical Offi cer. The work of data collection, scrutiny and compilation etc. have been done by Sh. Ravinder Kumar, S.A, Ms. Anuj Kumari, S.A, Ms. Manju Saini, S.A & Ms. Neha Varshney, S.A..
The Directorate is grateful to all agencies who have supplied data for inclusion in the publication. Suggestions for improving its scope & coverage of future issues are welcome.
December, 2017 Devinder Singh, IAS
Spl. Secretary-Cum-Director

v
nk'kfed iz.kkyh dh ifjorZu rkfydknk'kfed iz.kkyh dh ifjorZu rkfydkCONVERSION TABLE FOR METRIC
STANDARDS
Hkkj ds ekuHkkj ds ekuSTANDARDS OF WEIGHT
1 xzsu Grain 0.065 xzke Gram
1 vkSal Ounce 28.35 xzke Grams
1 rksyk Tola 11.664 xzke Grams
1 NVkad Chhattak 58.32 xzke Grams
1 ikSaM Pound 0.4535924 fdyksxzke Kilogram
gUMojosV Cwt. 50.802 fdyksxzke Kilograms
1 Vu Ton 1016.05 fdyksxzke Kilograms
1 lsj Seer 0.9331 fdyksxzke Kilograms
1 eu Maund 37.3242 fdyksxzke Kilograms
1 fDoaVy Quintal 100 fdyksxzke Kilograms
10 fDoaVy Quintals 1 ehfVªd Vu Metric Ton
yEckbZ ds ekuyEckbZ ds ekuSTANDARDS OF LENGTH
1 bap Inch 0.0254 ehVj Metre
1 QqV Foot 0.3048 ehVj Metre
1 xt Yard 0.9144 ehVj Metre
1 ehy Mile 1609.344 ehVj Metre

vi
{ks=Qy ds eku{ks=Qy ds ekuSTANDARDS OF AREA
1 oxZ QqV Sq. Foot = 0.092903 oxZ ehVj Sq. Metre
1 oxZ xt Sq. Yard = 0.83613 oxZ ehVj Sq. Metre
1 ,dM+ Acre = 0.404686 gSDVs;j Hectare
= 0.004047 oxZ fdyksehVj Sq. Kilometre
1 oxZ ehy Sq. Mile = 2.58999 oxZ fdyksehVj Sq. Kilometres
= 640.00 ,dM+ Acres
/kkfjrk ds eku/kkfjrk ds ekuSTANDARDS OF CAPACITY
1 bEihfj;y xSyu = 4.54596 fyVj Litre
Imperial Gallon
1 ;w-,l- xSyu = 3.78533 fyVj Litre
U.S. Gallon
1 fyVj = 1000.028 ?ku lsaVhehVj Cubic Centimetres
Litre = 0.035316 ?ku QqV Cubic Foot
1 ?ku QqV = 0.02832 ?ku ehVj Cubic Metre
Cubic Foot = 28.3168 fyVj Litres
1 ?ku xt = 764.544 fyVj Litres
Cubic Yard = 201.974 ;w-,l- xSyu U.S. Gallon

vii
la{ksi.k iz;ksx fd;s x;sla{ksi.k iz;ksx fd;s x;sABBREVIATIONS USED
. . = vizkIr
NA Not Available
— = 'kqU; vFkok ux.;
Nil or Negligible
P = vLFkkbZ
Provisional
fn- u- fu- = fnYyh uxj fuxe
M.C.D. Municipal Corporation of Delhi
E.D.M.C = East Delhi Municipal Corporation
S.D.M.C = South Delhi Municipal Corporation
N.D.M.C = North Delhi Municipal Corporation
u- fn- u- ik- = ubZ fnYyh uxj ifj"kn
N.D.M.C. = New Delhi Municipal Council

viii
fo"k; lwphfo"k; lwphCONTENTS
rkfydk la[;k
Table No.
fooj.kDescription
i`"B la[;kPage No.
1 2 3
I {ks=Qy ,oa tula[;k{ks=Qy ,oa tula[;k/Area & Population
1.1 fnYyh dk {ks=Qy ,oa fLFkfr 1
Area & Location of Delhi
1.2 fnYyh dh tula[;k&2011 2-3
Population of Delhi—2011
1.3 fnYyh dh ftyk vkSj {ks=okj vkadM+s 2011 4-5
District & Area wise fi gure of Delhi 2011
1.4 Hkkjr o"kZ ds leLr jkt;ksa@la?k jkT;ksa dh nl o"khZ; tula[;k o`f) 6-9
Decennial Population Growth of all
States/Union territories of India
1.5(a) fnYyh dh tula[;k vk;q&oxkZuqlkj&2001 10-11
Population of Delhi by age-group—2001
1.5(b) fnYyh dh tula[;k vk;q&oxkZuqlkj&2011 12-13
Population of Delhi by age-group—2011
1.6 fnYyh dh tula[;k /kekZuqlkj&2011 14
Population of Delhi by Religion—2011
1.7 fnYyh dh tula[;k&nl o"khZ; o`f) 15-17
Population of Delhi—Decennial Growth

ix
1.8 fnYyh dqy tula[;k] Jfed vkSj xSj Jfed fyaxkuqlkj&2011 18-19
Total Population, Workers and non workers in Delhi, by sex 2011
1.8(a) fnYyh dh dqy tula[;k oxkZuqlkj rFkk ftyk] fuoklh vkSj fyax Hksn&2011
20-21
Total Population, Category of Workers in Delhi, Delhi, its Districts by residence & sex 2011
1.9 fnYyh dh tula[;k&okf"kZd o`f) nj 22
Population of Delhi—Annual Growth Rate
1.10 fyax vuqikr&fnYyh rFkk Hkkjr 23
Sex Ratio—Delhi & India
1.11 fnYyh esa vuqlwfpr tkfr tula[;k 24-25
Scheduled caste Population in Delhi
1.12 fnYyh dh ftykoj tula[;k 2001 vkSj 2011 26-27
District wise Population of Delhi 2001 and 2011
1.13 fnYyh dh rglhyokj tula[;k 2011 28-31
Tehsil wise Population of Delhi 2011
1.14 fnYyh dh tula[;k&2011 fooj.k 32-37
Population of Delhi—2011—Details
1.15 (a to d)
tula[;k dh fnYyh&tux.kuk 2011&xzkeh.k@'kgjh oxhZdj.k&2011 38-41
Population of Delhi - Rural/Urban Distribution Census-2011
1 2 3

x
1.16(a to b)
tula[;k dh fnYyh&tux.kuk 2011&xzkeh.k@'kgjh oxhZdj.k&2011Population of Delhi - Rural/Urban Distribution Census-2011
42-43
1.17 fnYyh esa tux.kuk vkokl 2011 44-45
Census Houses in Delhi 2011.
1.18 ifjokjksa dks miyC/k lqfo/kk,a ¼tux.kuk&2011½ 46
Facilities Available to Households (Census-2011)
1.19 fnYyh esa vkokl o vkokl fgr vU; mi;ksx fooj.k 47
Details of Residential/Residential-cum-other use.
1.20 ikuh ds lzksr ¼tux.kuk&2011½ 48
Source of Water (Census 2011)
1.21 [kkuk idkus esa b±èku dk mi;ksx ¼tux.kuk&2011½ 49
Fuel used for Cooking (Census 2011).
1.22to 1.30
ifjokjksa dh ekfydkuk fLFkfr o muds }kjk mi;ksfxrk fofHkUu lqfoèkk,a ¼tux.kuk&2011½
50-67
Households by Ownership Status and Awailing Different Facilities(2011)
1.31 x`g jfgr tula[;k] tux.kuk 2011 ds vuqlkj 68
Houseless Population as per Population Census-2011
1.32 Hkkjr esa jkT;ksa vuqlkj edkuksa dh deh & 2012 69-70
Housing shortage in India by State-2012
1.33 vkf[kjh fuokl LFkku ds vuqlkj izoklh & 2001 71
Migrants by place of last residence-2001
1 2 3

xi
1.34 fnYyh esa izoklh tula[;k & 2011 72-73
Migrants Population in Delhi - 2011
1.35 fnYyh esa Hkk"kk ds vk/kkj ij tula[;k dk fooj.k 74-75
Distribution of Population by scheduled languages in Delhi.
II jkT; ?kjsyw mRikn ds vuqekujkT; ?kjsyw mRikn ds vuqeku
II State Domestic Product Estimates
2.1 fnYyh V/S Hkkjr ds lHkh ,l Mh ih dk rqykukRed fooj.k&ekStwnk ewY;ksa ij
76-77
Comparative Statement of S D P of Delhi V/S All India - At Current Prices
2.2 fnYyh V/S Hkkjr ds lHkh ,l Mh ih dk rqyukRed fooj.k&fLFkj ewY;ksa ij
78-79
Comparative Statement of S D P of Delhi V/S All India-At Constant Prices
2.3 th ,l oh , vkSj th ,l Mh ih vkfFkZd xfrfof/kvksa }kjk&orZeku ewY;ksa ij
80-83
G S V A and G S D P by Economic Activity-At Current Prices
2.4 th ,l oh , vkSj th ,l Mh ih vkfFkZd xfrfof/kvksa }kjk&fLFkj ewY;ksa ij
84-87
G S V A and G S D P by Economic Activity-at Constant Prices
2.5 ,u ,l oh vkSj ,u ,l Mh ih vkfFkZd xfrfof/kvksa }kjk&orZeku ewY;ksa ij
88-91
N S V A and N S D P by Economic Activity-at Current Prices
2.6 ,u ,l oh , vkSj ,u ,l Mh ih vkfFkZd xfrfof/kvksa ds }kjk&fLFkj ewY;ksa ij
92-95
NSVA and NSDP by Economic Activity-at Constant Prices
1 2 3

xii
2.7 leLr Hkkjr jkT;ksa vksj la?k jkT;ksa dh izfr O;fdr ,u ,l Mh ih ¼izpfyr Hkkoksa ij½
96-99
Per Capita N S D P of States, Union Territories and All India (at Current Prices)
2.8 leLr Hkkjr] jkT;ksa vkSj la?k jkT;ksa dh izfr O;fDr ,u ,l Mh ih ¼fLFkj Hkkoksa ij½
100-103
Per Capita NSDP of States, Union Territories and All India (at Constant 2011-12 Prices).
III tyok;q ,oa o"kkZtyok;q ,oa o"kkZ
III Climate & Rainfall
3.1 fnYyh esa o"kkZ 104-105
Rainfall in Delhi
3.2 fnYyh esa rkieku o vknZzrk ¼ubZ fnYyh dsUnz½ 106-107
Temperature & Humidity in Delhi (New Delhi Centre)
IV tUe ,oa e`R;q leadtUe ,oa e`R;q lead
IV Vital Statistics
4.1 fnYyh esa iathd`r tUe ,oa fofHkUu dkj.kksa ls e`R;q 108-109
Births Registered & Deaths due to Various Causes in Delhi
4.2 fnYyh esa tUe] e`R;q o f'k'kqvksa dh e`R;q nj 110-111
Birth, Death and Infant Mortality Rates in Delhi
V d`f"k ,oa i'kq/kud`f"k ,oa i'kq/ku
V Agriculture & Livestock
5.1 flapkbZ ds lk/ku rFkk flafpr {ks=Qy 112-113
Sources of Irrigation & Irrigated Area
1 2 3

xiii
5.2 fnYyh esa Hkwfe dk mi;ksx 114-117
Utilisation of Land in Delhi
5.2 (a) Division-Wise Forest Cover in Delhi 118
5.2 (b) Change in Forest and Tree Cover 119
5.3 fnYyh esa pquh gqbZ Qlyksa ds varxZr {ks=Qy 120
Area under Selected Crops in Delhi
5.4 fnYyh esa pquh gqbZ Qlyksa dk mRiknu 121
Production of Selected Crops in Delhi
5.5 fnYyh esa izeq[k Qlyksa dk vkSlr mRiknu 122-123
Average Yield of Principal Crops in Delhi
5.6 fnYyh esa eq[; Qlyksa ds varxZr flafpr {ks=Qy 124-125
Area Irrigated under Principal Crops in Delhi
5.7 fnYyh esa Ø;&foØ; ds pje le; ij pquh gqbZ d`f"k oLrqvksa ds mRiknd ds vkSlr ewY;
126-127
Producer’s Average Price of Selected Agricultural Commodities during Peak Marketing Period
5.8 fnYyh esa moZjd dk forj.k 128
Distribution of Fertilizer in Delhi
5.9 fnYyh esa i'kq x.kuk ds vuqlkj i'kq/ku 129-131
Cattle in Delhi according to Livestock Census
5.10 fnYyh esa Ñf"k ;a=ksa dk iz;ksx] i'kqx.kuk ds vk/kkj ij 132-133
Use of Agricultural Implements in Delhi, based on Livestock Census
5.11 fnYyh esa i'kq fpfdRlk dh lqfo/kk,a 134-135
Veterinary Facilities in Delhi
1 2 3

xiv
5.12 fnYyh nqX/k ;kstuk dh xfrfof/k;ka 136-137
Activities of Delhi Milk Scheme
5.13 enj Msjh dh xfrfof/k;ka 138-139
Activities of Mother Dairy
VI m?kksx@Jem?kksx@Je
VI Industry/Labour
6.1(a-c) fnYyh esa vkS|ksfxd izxfr 140-143
Industrial Progress in Delhi
6.2 m|ksx vuqlkj iathd`r dk;Zjr m|ksxksa dk oxhZdj.k rFkk muesa dk;Zjr deZpkjh
144-147
Industry wise Break-up of working Factory and workers employed there in
6.3 okf"kZd vkS|ksfxd losZ{k.k&x.kuk $ uewuk lsDVj 148-149
Annual Survey of Industries—Census + Sample Sector
6.4 fnYyh esa vkS|ksfxd mRiknuksa dk lwpdkad 150
Index of Industrial Production in Delhi
VII ÅtkZ ,oa fo|qrÅtkZ ,oa fo|qr
VII Energy & Electricity
7.1 fnYyh esa fo|qr dh mRiknu {kerk 151
Installed Capacity of Electricity in Delhi
7.2 fo|qr dk mRiknu ,oa forj.k 152-153
Generation & Distribution of Electricity
7.3 fo|qr miHkksDrkvksa dh la[;k ¼oxkZuqlkj½ 154-155
Number of Consumers of Electricity (Categorywise)
1 2 3

xv
7.4 fnYyh esa ÅtkZ mRiknd oLrqvksa dk foØ; 156-157
Sale of Energy Products In Delhi
VIII LdU/k ize.MyLdU/k ize.My
VIII Stock Companies
8.1 fnYyh esa 'ks;j /kkjd fyfeVsM dEifu;ksa ds u;s iathdj.k dk vkS|ksfxd oxhZdj.k
158-161
Industrial Classifi cation of New Registration of Companies Limited by Share in Delhi
8.2 fnYyh esa dk;Z dj jgs] uo iathd`r rFkk fuorZu gq, ize.My 162-163
Stock Companies at work newly registered & ceased to work in Delhi
IX O;kikj ,oa foÙkO;kikj ,oa foÙk
IX Trade & Finance
9.1 jk"Vªh; jkt/kkuh {ks=] fnYyh ljdkj dh vk; O;; ds ctV vuqeku 164-165
Budget Estimates of Receipts and Expenditure of Govt. of National Capital Territory of Delhi
9.2 jk"Vªh; jkt/kkuh {ks=] fnYyh esa LFkkuh; fudk;ksa dh vk; rFkk O;; 166-177
Income & Expenditure of Local Bodies in the National Capital Territory of Delhi
9.3 jk"Vªh; jkt/kkuh {ks=] fnYyh dh fofHkUu ;kstukvksa ij O;; 178-185
Expenditure on various Plans of the National Capital Territory of Delhi
9.4 fnYyh foÙk fuxe&m|ksxkuqlkj Lohd`r _.k 186-187
Delhi Financial Corporation—Loans sanctioned Industry-wise
1 2 3

xvi
9.5 fnYyh esa thou chek dh izxfr 188-189
Progress of Life Insurance in Delhi
9.6 fnYyh esa fcØh dj@laof/kZr dj vf/kfu;eksa ds varxZr iathd`r O;kikjh ,oa izkfIr;ka
190-191
Registered Dealers & Receipts under Sales Tax /VAT Acts in Delhi
9.7 fnYyh esa cSadksa ds dk;kZy;ksa dh la[;k 192
Number of Bank Offi ces in Delhi
9.7(i) Total Deposit and Credits of Bank in Delhi 193
9.8 fnYyh esa vuqlwfpr okf.kfT;d cSadksa esa fu{ksi dk iz:i vuqlkj forj.k 194-195
Distribution of Deposits according to Types in Scheduled Commercial Banks in Delhi
9.9 fnYyh esa vuqlwfpr okf.kfT;d cSadksa dh cdk;k jkf'k dk O;koolkf;d oxhZdj.k
196-197
Occupational Classifi cation of outstanding credit of Scheduled Commercial Banks in Delhi
9.10 fnYyh esa jsy vkSj tyekxZ }kjk O;kikj 198-205
Rail & River Borne Trade in Delhi
9.11 fnYyh esa vYi cpr ;kstukvksa ds vUrxZr /ku laxzg 206-209
Collections under Small Savings Schemes in Delhi
X ifjogu ,oa lapkjifjogu ,oa lapkj
X Transport & Communication
10.1 fnYyh esa iathd`r eksVj xkfM+;k 210-211
Registred Motor Vehicles in Delhi
1 2 3

xvii
10.2 fnYyh ifjogu fuxe dh xfrfof/k;ka 221-215
Activities of Delhi Transport Corporation
10.3 fnYyh esa Mkd ,oa nwjHkk"k lqfo/kk,a 216-217
Postal & Telephone Facilities in Delhi
10.4 fnYyh esa lM+dsa 218-219
Roads in Delhi
XI f'k{kkf'k{kk
XI Education
11.1 fnYyh esa lk{kjrk dh izxfr 220-221
Progress of Literacy in Delhi-2011
11.2 Hkkjr rFkk jkT;ksa esa lk{kjrk nj 222-227
Literacy Rate in India & States-2011
11.3 fnYyh esa f'k{kk laLFkk,a] Nk= rFkk f'k{kd 228-249
Educational Institutions, Students and Teachers in Delhi
11.4 fnYyh esa mPp f'k{kk laLFkk,a] Nk= rFkk izk/;kid 250-255
Educational Institutions, students and Lecturers/Professors in Delhi
11.5 izf'k{k.k vkSj rduhdh f'k{kk funs'kky; ds v/khu laLFkku] Nk= rFkk f'k{kd
256-263
No. of Institutions, Students and Teachers under Dte. of Training and Technical Education in Delhi
11.6 fnYyh esa dsUnzh; cksMZ dh ijh{kk ifj.kke 266
Examination Results of Central Board of Secondary Education in Delhi
1 2 3

xviii
11.7 fnYyh o Hkkjr esa dsUnzh; cksMZ ds ifj{kk ifj.kke ¼izfr'kr esa½ 265
Examination Results of Central Board of Secondary Education in Delhi & India (in percentage)
XII LokLF;LokLF;
XII Health
12.1 fnYyh esa fpfdRlk lqfo/kk,a 266-269
Medical Facilities in Delhi
12.2 fnYyh esa ifjokj dY;k.k dk;ZØe 270-275
Family Welfare Programme in Delhi
XIII Je ,oa jkstxkjJe ,oa jkstxkj
XIII Labour & Employment
13.1 fnYyh ds jkstxkj dk;kZy;ksa dh pkyw iawth esa izkfFkZ;ksa dk O;kolkf;d 276-279
Occupational Distribution of Applicants on Live-register of the Employment Exchanges of Delhi
13.2 fnYyh esa jkstxkj dk;kZy;ksa dh pkyw iwath esa izkfFkZ;ksa dk f'k{kk vuqlkj oxhZdj.k
280-283
Educational Classifi cation of the Applicants on the Live-register of the Employment Exchanges in Delhi
13.3 fnYyh ds {ks=h; jkstxkj dk;kZy;ksa laca/kh lead 284-285
Regional Employment Exchange Statistics of Delhi
13.4 fnYyh esa jkstxkj dk;kZy;ksa dh pkyw iath esa vuqlwfpr tkfr@tutkfr ,oa fodykax O;fDr
286-287
Scheduled Castes, Scheduled Tribes and Physically Handicapped persons on the Live-register of the Employment Exchanges in Delhi
1 2 3

xix
13.5 fnYyh esa Jfed la?k 288-289
Trade Unions in Delhi
13.6 fnYyh esa gM+rky o rkykcUnh esa ifjf.kr vkS|ksfxd fookn 290-291
Industrial Disputes resulting in Strikes & Lockouts in Delhi
13.7 jk"Vªh; jkt/kkuh {ks=] fnYyh ds fofHkUu vuqlwfpr O;olk;ksa esa U;wure osru dh njsa ¼izfrfnu½
292-293
Minimum Rates of wages in Scheduled Employment in the National Capital Territory of Delhi
XIV lgdkfjrklgdkfjrk
XIV Co-operation
14.1 fnYyh esa lgdkjh lfefr;ka 294-295
Co-operative Societies in Delhi
14.2 (a) miHkksDrk lgdkjh LVksjksa dh izxfr 296-297
Progress of Consumer Co-operative Stores
14.2 (b ) miHkksDrk lgdkjh LVksjksa dh izxfr 298-299
Progress of Consumer Co-operative Stores
14.3 (a) oxhZdj.k vuqlkj iathd`r lgdkjh lfefr;ka 300-301
Category-wise Regd. Co-op Societies
14.3 (b) oxhZdj.k vuqlkj iathd`r lgdkjh lfefr;ka 302-303
Category-wise Regd. Co-op Societies
1 2 3

xx
XV iqfyl] vijk/k ,oa nq?kZVuk,aiqfyl] vijk/k ,oa nq?kZVuk,a
XV Police, Crimes & Accidents
15.1 fnYyh esa iqfyl Fkkus] iqfyl pkSfd;ka o iqfyl deZpkjh 304-305
Police Stations, Police Posts & Police Strength in Delhi
15.2 fnYyh esa vijk/k 306-307
Crimes in Delhi
15.3 fnYyh esa pqjkbZ xbZ rFkk iquxzZghr laifÙk 308-309
Property stolen & recovered in Delhi
15.4 fnYyh esa nq?kZVuk,a 310-311
Accidents in Delhi
XVI euksjatueuksjatu
XVI Entertainment
16 fnYyh esa flusek 312
Cinemas in Delhi
XVII vkcdkjh leadvkcdkjh lead
XVII Excise Statistics
17 fnYyh esa eknd oLrqvksa dk miHkksx 314-315
Consumption of Intoxicants in Delhi
XVIII lekpkj i=lekpkj i=
XVIII Newspapers
18 fnYyh esa izdkf'kr lekpkj i= vkSj vkof/kd if=dk,a 316-317
Newspapers & Periodicals published in Delhi
1 2 3

xxi
XIX HkkoHkko
XIX Prices
19.1 fnYyh esa vko';d oLrqvksa ds vkSlr Fkksd Hkko 318-319
Average Whole sale Prices of some Essential Commodities in Delhi
19.2 Hkkjr o"kZ esa Fkksd Hkkoksa dk lwpdkad 320-323
Index Number of Wholesale Prices in India
19.3 fnYyh esa vkS|ksfxd Jfedksa ds fy, miHkksDrk Hkko lwpdkad 324-325
Consumer Price Index Number for Industrial Workers in Delhi
19.4 Hkkjro"kZ ds dqN pqus gq, dsUnzksa ds vkS|ksfxd Jfedksa ds fy, miHkksDrk Hkko lwpdkad
326-327
Consumer Price Index Number for Industrial Workers of some of the selected Centres of India
19.5(a) miHkksDrk ewY; lwpdkad ubZ J`a[kyk ¼vk/kkj&2012=100½ 328-329
CPI New Series (base 2012=100)
XX ty iznk; ,oa eyfu"dkluty iznk; ,oa eyfu"dklu
XX Water Supply & Sewage Disposal
20.1 fofHkUu ty la;a=ksa dh mRiknu {kerk 330
Installed Capacity of Various Water Works
20.2 fofHkUu ey 'kks/kd la;a=ksa dh mRiknu {kerk 331
Capacity of Various Sewage Treatment Plants
1 2 3

xxii
20.3 fnYyh esa ikuh dk miHkksx 332-333
Consumption of water in Delhi
XXI vkfFkZd x.kukvkfFkZd x.kuk
XXI Economic Census
21.1 fnYyh esa vkfFkZd x.kuk ds vUrZxr izeq[k vkfFkZd xfrfof/k lewg vkSj izdkj ls jkstxkj o izfr"Bkuksa dk fooj.k
334-341
Distribution of Employment and Establishments by Major Economic Activity Group and Type.
21.2 fnYyh esa vkfFkZd x.kuk 2013 ds v/khu ftykoj m|eksa dh la[;k o izoj izeq[k vfHkdj.k
342-343
District-wise number of enterprises with selected characteristics under 6th Economic Census 2013 of Delhi
21.3 fnYyh dh NBh vkfFkZd x.kuk ¼2013½ dk izoj :iA 344-345
Selected features of Six Economic Census 2013 of Delhi
XXII lekt ,oa vuqlwfpr tkfr@tutkfr dY;k.klekt ,oa vuqlwfpr tkfr@tutkfr dY;k.k
XXII Social & Scheduled Caste/Scheduled Tribe Welfare
22 fnYyh esa lekt dY;k.k laLFkk,a@lsok,a 346-351
Social Welfare Institutes/Services in Delhi
XXIII fofo/k leadfofo/k lead
XXIII Miscellaneous Statistics
23.1 fnYyh esa lkoZtfud forj.k iz.kkyh 352-353
Public Distribution System in Delhi
23.2 fnYyh esa xjhch js[kk 354-355
Poverty Line in Delhi
1 2 3

xxiii
23.3 xjhch js[kk ¼izfr izfr O;fDr izfr ekg] iq:"kksa esa½ 356-357
Poverty Line (Rs. per capita per month)
23.4 fnYyh esa vla?kfr dk;Z {ks= 358-359
Unincorporated Non-Agricultural Enterprises (Excluding Construction) in Delhi
23.5 fnYyh viax O;fDr;ksa dh vuqekfur la[;k rFkk viaxrk dh fdLeA 360-361
Estimated No. of Disabled persons in Delhi by Type of Disability
23.6 fnYyh rFkk leLr Hkkjr esa ikfjokfjd miHkksDrk O;; dk Lrj vkSj izfr:i
362-363
Level & Pattern of Household Consumer Expenditure in Delhi and All India
23.7 fnYyh esa edkuksa dh voLFkk 364
Housing Conditions in Delhi
23.8 fnYyh esa jkstxkj rFkk csjkstxkj dh fLFkfr ¼tqykbZ] 2011 ls twu] 2012 ds nkSjku½
365
Employment & Unemployment situation in Delhi (during July, 2011 - June, 2012)
O;k[;kRed fVIif.k;ka
Explainatory Notes 366-379
1 2 3

xxiv

1
1- {ks=Qy ,oe~ tula[;k1- {ks=Qy ,oe~ tula[;k1. AREA & POPULATION
1-1 fnYyh dk {ks=Qy ,oa fLFkfr1.1 Area & Location of Delhi
ensa vofèk bdkbZ fooj.k ItemsPeriod Unit Description
1 2 3 4 11. fLFkfr 1 Location¼d½ mÙkjh; v{k
js[kk
28°-24'-17" to 28°-53'-00"
(a) North Latitude
¼[k½ iwohZ ns’kkUrj js[kk
76°-50'- 24" to 77°-20'- 37"
(b) East Longitude
2. fljs 2 Extreme.¼d½ vfèkdre
yEckbZ
fdyksehVj Kilometre
51.90 (a) Greatest Length
¼[k½ vfèkdre pkSM+kbZ
fdyksehVj Kilometre
48.48 (b) Greatest Width
3. {ks=Qy 2011 oxZ fdyksehVj sq. kilometre
1483.00 3 Area
¼d½ 'kgjh " " 1113.65 (a) Urban¼[k½ xzkeh.k " " 369.35 (b) Rural4. xzke " la[;k 112 4 Villages5. x.kuk uxj " " 110 5 Census
Towns6. oSèkkfud dLck " Number 3 6 Statutory
Towns7. ftyk " Number 11 7 Districts8. rglhy@
lc&fMohtu
" Number 33 8 Tehsil / Sub Division
lzksr % tux.kuk funs'kky;] fnYyhA Source : Directorate of Census Operations, Delhi.

2
1- {ks=Qy ,oa tula[;k1- {ks=Qy ,oa tula[;k1-2 fnYyh dh tula[;k&2011
tula[;kPopulation
fyax vuqikr ¼fL=;kaizfr gtkj iq:"k½
Sex Ratios (Female per thousand Males)
{ks= 2001 2011 2001 2011
1 2 3 4 51 ubZ fnYyh uxj
ifj"kn
302363 257803 825 838
2 fnYyh Nkouh 124917 110351 647 731
3 fnYyh uxj fuxe 'kgjh] xzkeh.k rFkk x.kuk uxj
13423227 16419787 822 869
;ksx 13850507 16787941 821 868
1 jk"Vªh; jktèkkuh {ks=] fnYyh ¼'kgjh½
12905780 16368899 822 868
2 jk"Vªh; jktèkkuh {ks=] fnYyh ¼xzkeh.k½
944727 419042 806 852
;ksx 13850507 16787941 821 868
lzksr % tux.kuk funs'kky;] fnYyhA

3
1. AREA & POPULATION1.2 Population of Delhi—2011
{ks=Qy oxZ fd- ehVj
Area in Sq. Km.
tula[;k ?kuRo izfr oxZ fd- ehVj
Density of Population per Sq. Km.
2001 2001 2011 Region
6 7 8 1
42.74 7074 6032 1 New Delhi Municipal Council
42.97 2907 2568 2 Delhi Cantonment Board
1397.29 9607 11751 3 Delhi Municipal Corporation Urban, Rural & Census Towns
1483 9340 11320 Total
1113.65 13957 14698 1 National Capital Territory of Delhi (Urban)
369.35 1692 1135 2 National CapitalTerritory of Delhi (Rural)
1483 9340 11320 Total
Source : Directorate of Census Operations, Delhi.

4
1- {ks=Qy ,oa tula[;k1- {ks=Qy ,oa tula[;k1-3 fnYyh ds ftyk {ks=okj vkadM+s 2011
jkT;@ftyk Area sq. kms.
1 2
jk"Vªh; jkt/kkuh {ks=] fnYyh 1483.00
mÙkj if'peh 443.00
mÙkj 61.00
mÙkj iwohZ 62.00
iwohZ 63.00
ubZ fnYyh 35.00
e/; 21.00
if'peh 130.00
nf{k.k if'peh 421.00
nf{k.k 247.00
lzksr% tux.kuk funs'kky;] fnYyhA

5
1. AREA AND POPULATION 1.3 District & Area Wise Figures-2011
Density of Population per sq. km. State/District
3 1
11320 NCT of Delhi
8254 North-West
14557 North
36155 North-East
27132 East
4057 New Delhi
27730 Central
19563 West
5446 South-West
11060 South
Source: Directorate of Census Operations, Delhi

6
1- {ks=Qy ,oa tula[;k1- {ks=Qy ,oa tula[;k1-4 Hkkjro"kZ ds leLr jkT;ksa@la?k jkT;ksa dh nl o"khZ; tula[;k o`f)
jkT;@la?k jkT; tula[;k ¼yk[kksa esa½Population (in Lakhs)
2001 20111 2 3
vka/kz izns'k 762.10 845.80
v:.kkpy izns'k 10.98 13.83
vklke 266.56 312.05
fcgkj 829.99 1040.99
xksvk 13.47 14.58
xqtjkr 506.71 604.39
gfj;k.kk 211.45 253.51
fgekpy izns'k 60.78 68.64
tEew o d'ehj 101.44 125.41
dukZVd 528.51 610.93
dsjy 318.41 334.06
e/; izns'k 603.48 726.26
egkjk"Vª 968.79 1123.74
ef.kiqj 21.67 25.70
es?kky; 23.19 29.66
fetksje 8.89 10.97
ukxkySaM 19.90 19.78

7
1. AREA AND POPULATION1.4 Decennial Population Growth of All States/Union
Territories of India
tux.kuk esa izfr'kr ifjorZuPercentage variation in previous census
States/UnionTerritories
1991—2001 2001—20114 5 1
14.59 11.00 Andhra Pradesh
27.00 26.00 Arunachal Pradesh
18.92 17.10 Assam
28.62 25.40 Bihar
15.21 8.20 Goa
22.66 19.30 Gujarat
28.43 19.90 Haryana
17.54 12.90 Himachal Pradesh
29.43 23.60 Jammu and Kashmir
17.51 15.60 Karnataka
9.43 4.90 Kerala
24.26 20.30 Madhya Pradesh
22.73 16.00 Maharashtra
24.86 18.60 Manipur
30.65 27.90 Meghalaya
28.81 23.50 Mizoram
64.53 -0.60 Nagaland
Contd...

8
tula[;k ¼yk[kksa esa½Population (in Lakhs)
jkT;@la?k jkT; 2001 20111 2 3
mM+hlk 368.05 419.74
iatkc 243.59 277.43
jktLFkku 565.07 685.48
flfDde 5.41 6.10
rfeyukMq 624.06 721.47
f=iqjk 31.99 36.73
mÙkj izns'k 1661.98 1998.12
if'pe caxky 801.76 912.76
>kj[kaM 269.46 329.88
NÙkhlx<+ 208.34 255.45
mÙkjk[kaM 84.89 100.86
la?k jkT;la?k jkT;vaMeku&fudksckj 3.56 3.80
paMhx<+ 9.01 10.55
nknjk vkSj ukxj gosyh 2.20 3.43
neu o nho 1.59 2.43
fnYyh 138.51 167.87
y{k}hi 0.61 0.64
ikafMpsjh 9.74 12.47
;ksx 10286.10 12108.55
lzksr % tux.kuk funs'kky;] fnYyhA

9
tux.kuk esa izfr'kr ifjorZuPercentage variation in
previous census1991—2001 2001-2011 States/Union Territories
4 5 116.25 14.00 Orissa20.10 13.90 Punjab28.41 21.30 Rajasthan33.06 12.90 Sikkim11.72 15.60 Tamil Nadu16.03 14.80 Tripura25.85 20.02 Uttar Pradesh17.77 13.80 West Bangal23.36 22.40 Jharkhand18.27 22.60 Chhatiasgarh20.41 18.80 Uttrakhand
Union Territories26.90 6.90 Andaman-Nicobar40.28 17.20 Chandigarh59.22 55.90 Dadra, Nagar Heveli55.73 53.80 Daman & Diu47.02 21.20 Delhi17.30 6.30 Lakshadweep20.62 28.10 Pondichery21.54 17.70 Total
Source : Directorate of Census Operations, Delhi.

10
1- {ks=Qy ,oa tula[;k1- {ks=Qy ,oa tula[;k1-5 ¼v½ fnYyh dh tula[;k vk;q&oxkZuqlkj&2001
xzkeh.kRural
vk;q oxZAge-group
iq:"kMale
L=hFemale
dqyTotal
1 2 3 40—4 58456 49926 1083825—9 64804 55457 12026110—14 62096 52963 11505915—19 56303 39799 9610220—24 53766 40087 9385325—29 49156 42586 9174230—34 43438 36080 7951835—39 39007 29765 6877240—44 28409 20412 4882145—49 20297 15249 3554650—54 14397 10485 2482255—59 9128 8319 1744760—64 7760 7791 1555165—69 5477 5307 1078470—74 4268 3684 795275—79 1934 1707 364180+ 2500 2360 4860
vk;q ugha crkbZ@Age not stated 891 663 1554
All age group 522087 422640 944727
lzksr % tux.kuk funs'kky;] fnYyh

11
1. AREA AND POPULATION1.5 (a) Population of Delhi by Age-group—2001
'kgjhUrban
;ksxTotal
dqy tula[;k ls çfr'krPercentageto total Population
iq:"k L=h dqy iq:"k L=h dqyMale Female Total Male Female Total
5 6 7 8 9 10 11678526 590953 1269479 736982 640879 1377861 9.95764545 667473 1432018 829349 722930 1552279 11.21774274 673466 1447740 836370 726429 1562799 11.28760194 571683 1331877 816497 611482 1427979 10.31760840 572167 1333007 814606 612254 1426860 10.30695562 571621 1267183 744718 614207 1358925 9.81587923 487535 1075458 631361 523615 1154976 8.34540169 447089 987258 579176 476854 1056030 7.62434965 325622 760587 463374 346034 809408 5.84330555 256958 587513 350852 272207 623059 4.50242930 181022 423952 257327 191507 448834 3.24158302 134922 293224 167430 143241 310671 2.24123272 119796 243068 131032 127587 258619 1.87
90377 91133 181510 95854 96440 192294 1.3965285 59581 124866 69553 63265 132818 0.9632614 28842 61456 34548 30549 65097 0.4732979 32983 65962 35479 35343 70822 0.5111835 7787 19622 12726 8450 21176 0.15
7085147 5820633 12905780 7607234 6243273 13850507 100.00Source : Directorate of Census Operations, Delhi.

12
1- {ks=Qy ,oa tula[;k1- {ks=Qy ,oa tula[;k1-5 ¼vk½ fnYyh dh tula[;k vk;q&oxkZuqlkj&2011
xzkeh.kRural
vk;q oxZ iq:"k L=h dqyAge-group Male Female Total
1 2 3 40—4 21481 17644 391255—9 23698 18896 4259410—14 25479 20404 4588315—19 24916 19451 4436720—24 23805 20602 4440725—29 20584 18666 3925030—34 17431 16402 3383335—39 16738 14910 3164840—44 14180 11782 2596245—49 10981 8695 1967650—54 7917 6430 1434755—59 5372 4927 1029960—64 5700 5924 1162465—69 3125 2998 612370—74 2171 2147 431875—79 980 1067 204780+ 1482 1540 3022
vk;q ugha crkbZ@Age not stated 281 236 517
All age group 226321 192721 419042
lzksr % tux.kuk funs'kky;] fnYyhA

13
1. AREA AND POPULATION1.5 (b) Population of Delhi by Age-group—2011
'kgjhUrban
;ksxTotal
dqy tula[;k ls izfr'krPercentage to total Population
iq:"k L=h dqy iq:"k L=h dqy
Male Female Total Male Female Total
5 6 7 8 9 10 11712855 629220 1342075 734336 646864 1381200 8.23805789 687589 1493378 829487 706485 1535972 9.15869967 732297 1602264 895446 752701 1648147 9.82900202 722806 1623008 925118 742257 1667375 9.93927606 792047 1719653 951411 812649 1764060 10.51857612 771464 1629076 878196 790130 1668326 9.94740024 660842 1400866 757455 677244 1434699 8.55681717 605879 1287596 698455 620789 1319244 7.86576678 494557 1071235 590858 506339 1097197 6.54484246 407291 891537 495227 415986 911213 5.43368305 304817 673122 376222 311247 687469 4.10263813 234780 498593 269185 239707 508892 3.03232403 227992 460395 238103 233916 472019 2.81136273 130056 266329 139398 133054 272452 1.6292776 92156 184932 94947 94303 189250 1.1349466 49180 98646 50446 50247 100693 0.6052379 57630 110009 53861 59170 113031 0.678894 7291 16185 9175 7527 16702 0.10
8761005 7607894 16368899 8987326 7800615 16787941 100.00Source : Directorate of Census Operations, Delhi.

14
1- {ks=Qy ,oe~ tula[;k1- {ks=Qy ,oe~ tula[;k1. AREA AND POPULATION
1-6 fnYyh dh tula[;k /kekZuqlkj&20111-6 fnYyh dh tula[;k /kekZuqlkj&20111.6 Population of Delhi by Religion-2011
/keZ
tula[;kPopulation
dqy tula[;k ls izfr'kr
Percentage to total population
izfr'kr of)Percentage Increase Religion
2001 2011 2001 2011 (2001-2011)
1 2 3 4 5 6 1
fgUnw 11358049 13712100 82.01 81.68 20.73 Hindu
flD[k 555602 570581 4.01 3.40 2.70 Sikh
eqlyeku 1623520 2158684 11.72 12.86 32.96 Muslim
tSu 155122 166231 1.12 0.99 7.16 Jain
bZlkbZ 130319 146093 0.94 0.87 12.10 Christian
ckS) 23705 18449 0.17 0.11 -22.17 Buddhist
vU; 4190 2197 0.03 0.01 -47.57 Other
irk ugha 13606 - 0.08 - Not Stated
dqy 13850507 16787941 100.00 100.00 21.21 Total
Source : Census of India 2011 (Household population by religion of Head of Household)

15
1- {ks=Qy ,oe~ tula[;k1- {ks=Qy ,oe~ tula[;k1. AREA AND POPULATION
1-7 fnYyh dh tula[;k nl o"khZ; of)1-7 fnYyh dh tula[;k nl o"khZ; of)1.7 Population of Delhi—Decennial Growth
fooj.kDescription
{ks=
vof/kPeriod
tula[;kPopulation
fiNyh tux.kuk ls izfr'kr ifjorZu
Percentage variation since previous Census
Region
1 2 3 4 1
1. dqy 1911 413851 1.98 Total
'kgjh 237944 11.13 Urban
xzkeh.k 175907 –8.24 Rural
2. dqy 1921 488452 18.03 Total
'kgjh 304420 27.94 Urban
xzkeh.k 184032 4.62 Rural
3. dqy 1931 636246 30.26 Total
'kgjh 447442 46.98 Urban
xzkeh.k 188804 2.59 Ruralcontd..

16
1- {ks=Qy ,oe~ tula[;k1- {ks=Qy ,oe~ tula[;k1. AREA AND POPULATION
1-7 fnYyh dh tula[;k nl o"khZ; of)1-7 fnYyh dh tula[;k nl o"khZ; of)1.7 Population of Delhi—Decennial Growth
fooj.kDescription
{ks=
vof/kPeriod
tula[;kPopulation
fiNyh tux.kuk ls izfr'kr ifjorZu
Percentage variation since previous Census
Region
1 2 3 4 14. dqy 1941 917939 44.27 Total
'kgjh 695686 55.48 Urban
xzkeh.k 222253 17.72 Rural
5. dqy 1951 1744072 90.00 Total
'kgjh 1437134 106.58 Urban
xzkeh.k 306938 38.10 Rural
6. dqy 1961 2658612 52.44 Total
'kgjh 2359408 64.17 Urban
xzkeh.k 299204 -2.52 Rural
7. dqy 1971 4065698 52.93 Total
'kgjh 3647023 54.57 Urban
xzkeh.k 418675 39.93 Rural
lzksr % tux.kuk funs'kky;] fnYyhAcontd..

17
fooj.kDescription
{ks=
vof/kPeriod
tula[;kPopulation
fiNyh tux.kuk ls izfr'kr ifjorZu
Percentage variation since
previous Census
Region
1 2 3 4 1
8. dqy 1981 6220406 53.00 Total
'kgjh 5768200 58.16 Urban
xzkeh.k 452206 8.01 Rural
9. dqy 1991 9420644 51.45 Total
'kgjh 8471625 46.87 Urban
xzkeh.k 949019 109.86 Rural
10. dqy 2001 13850507 47.02 Total
'kgjh 12905780 52.34 Urban
xzkeh.k 944727 0.45 Rural
11. dqy 2011 16787941 21.20 Total
'kgjh 16368899 26.80 Urban
xzkeh.k 419042 -55.60 Rural
Source : Directorate of Census Operations, Delhi.

18
1-8 fnYyh dh dqy tula[;k] Jfed vkSj xSj Jfed1-8 fnYyh dh dqy tula[;k] Jfed vkSj xSj Jfedfyaxkuqlkj&2011fyaxkuqlkj&2011
jkT;@ftyk [email protected]@'kgjhTotal/Rural/Urban
O;fDr@iq:"k@L=hPerson/Male/
Female
dqy tula[;kTotal
Population
jk"Vªh; jkt/kkuh {ks=] fnYyh
dqy/Total O;fDr/Person 16787941
iq:"k/Male 8987326
L=h/Female 7800615
xzkeh.k/Rural O;fDr/Person 419042
iq:"k/Male 226321
L=h/Female 192721
'kgjh/Urban O;fDr/Person 16368899
iq:"k/Male 8761005
L=h/Female 7607894

19
1.8 Total Population, Workers and Non Workers in Delhi by Sex 2011
Jfed/WORKERS
dqy Jfed ¼eq[;$lhekUr½Total Workers
(Main+Marginal)
eq[; JfedMain
Workers
lhekUr JfedMarginal Workers
fcuk dk;Z JfedNon
Workers
State/District
5587049 5307329 279720 11200892 NCT of Delhi
4762026 4562710 199316 4225300
825023 744619 80404 6975592
130227 118510 11717 288815
111500 103568 7932 114821
18727 14942 3785 173994
5456822 5188819 268003 10912077
4650526 4459142 191384 4110479
806296 729677 76619 6801598

20
1-8 ¼v½ fnYyh dh dqy tula[;k oxkZuqlkj rFkk ftyk] fuoklh 1-8 ¼v½ fnYyh dh dqy tula[;k oxkZuqlkj rFkk ftyk] fuoklh vkSj fyax Hksn&2011vkSj fyax Hksn&2011
jkT;@ftyk [email protected]@'kgjhTotal/Rural/
Urban
O;fDr@iq:"k@L=hPerson/Male/
Female
dqy tula[;kTotal
Population
jk"Vªh; jkt/kkuh {ks= fnYyh
dqy/Total O;fDr/Person 16787941
iq:"k/Male 8987326
L=h/Female 7800615
xzkeh.k/Rural O;fDr/Person 419042
iq:"k/Male 226321
L=h/Female 192721
'kgjh/Urban O;fDr/Person 16368899
iq:"k/Male 8761005
L=h/Female 7607894
lzksr % tux.kuk funs'kky;] fnYyhA

21
1.8 (a) Total Population, Category of Workers in Delhi, its Districts by Residence & Sex 2011
Jfedksa dk oxhZdj.k@Category of Workers
dqy Jfed ¼eq[;$lhekUr½Total Workers
(Main+ Marginal)
[ksfrgj Jfed
Cultivators Workers
df"k JfedAgricultural Labourers
?kjsyw vkS|ksfxd Jfed
Household Inds.
Workers
vU; JfedOther
Workers
State/ District
5587049 33389 39457 181852 5332324 NCT of Delhi
4762026 27458 31352 152758 4550458
825023 5940 8123 29094 781866
130227 13614 8528 3284 104801
111500 11280 6473 2358 91389
18727 2334 2055 926 13412
5456822 19784 30947 178568 5227523
4650526 16178 24879 150400 4459069
806296 3606 6068 28168 768454
Source: Directorate of Census Operations, Delhi

22
1-9 fnYyh dh tula[;k&okf"kZd of) nj1-9 fnYyh dh tula[;k&okf"kZd of) nj1.9 Population of Delhi—Annual Growth Rates
tux.kuk o"kZ
Census Year
tula[;k ¼yk[k½Population (Lakh)
nl o"khZ; izfr'kr ifjorZu
Decadal %Variation
okf"kZd o`f) nj Annual Exponential
Growth Rate
1 2 3 4
1911 4.14 1.98 0.20
1921 4.89 18.03 1.66
1931 6.36 30.26 2.64
1941 9.18 44.27 3.67
1951 17.44 90.00 6.42
1961 26.59 52.44 4.22
1971 40.66 52.93 4.25
1981 62.20 53.00 4.25
1991 94.21 51.45 4.15
2001 138.51 47.02 3.85
2011 167.88 21.20 1.94
lzksr % tux.kuk funs'kky;] fnYyhASource : Directorate of Census Operation Delhi.

23
1-10 fyax vuqikr&fnYyh rFkk Hkkjr1-10 fyax vuqikr&fnYyh rFkk Hkkjr1.10 Sex Ratio—Delhi & India
tux.kuk o"kZCensus Year
fyax vuqikr ¼fL=;ka izfr gtkj iq:"k½Sex Ratio (Females per '000' of Males)
Delhi India
1 2 3
1911 793 964
1921 733 955
1931 722 950
1941 715 945
1951 768 946
1961 785 941
1971 801 930
1981 808 934
1991 827 927
2001 821 933
2011 868 940
lzksr % tux.kuk funs'kky;] fnYyhASource : Directorate of Census Operation Delhi.

24
1-11 {ks=Qy ,oa tula[;k1-11 {ks=Qy ,oa tula[;k1-11 fnYyh esa vuqlwfpr tkfr tula[;k
1991
{ks= iq:"kMale
L=hFemale
;ksxTotal
1 2 3 4
1 dqy 978690 816146 1794836
2 xzkeh.k 113961 93748 207709
3 'kgjh 864729 722398 1587127
fnYyh uxj fuxe* 940191 785560 1725751
ubZ fnYyh uxj ifj"kn
30043 23887 53930
fnYyh Nkouh 8456 6699 15155
*xzkeh.k {ks= lfEefyr gSAlzksr % tux.kuk funs'kky;] fnYyhA

25
1.11 AREA AND POPULATION1.11 Scheduled Caste Population in Delhi
2001 2011
iq:"k L=h dqy iq:"k L=h dqy Region
Male Female Total Male Female Total
5 6 7 8 9 10 1
1265182 1078073 2343255 1488800 1323509 2812309 1 Total
101500 86878 188378 43818 38365 82183 2 Rural
1163682 991195 2154877 1444982 1285144 2730126 3 Urban
1224992 1044156 2269148 1453597 1292608 2746205 M.C.D.*
29919 25294 52213 26545 23062 49607 N.D.M.C
10271 8623 18,894 8658 7839 16,497 Delhi-Cantonment
Board
*Including Rural Area.Source : Directorate of Census Operations, Delhi.

26
1- {ks=Qy ,oa tula[;k1- {ks=Qy ,oa tula[;k1-12 fnYyh dh ftyk okj tula[;k&2001 vkSj 2011
ftyk
tula[;kPopulation 2001
jkT; dh dqy tula[;k dk %
% of Total Population of
state 2001
Ø- la- 1 2 3
1 mÙkj if'pe 2860869 20.65
2 nf{k.k 2267023 16.37
3 if'pe 2128908 15.37
4 mÙkj iwoZ 1768061 12.77
5 nf{k.k if'pe 1755041 12.67
6 iwoZ 1463583 10.57
7 mÙkj 781525 5.64
8 eè; 646385 4.67
9 ubZ fnYyh 179112 1.29
;ksx 13850507 100.00
lzksr % tux.kuk funs'kky;] fnYyhA

27
1. AREA AND POPULATION1.12 District-wise Population of Delhi-2001 and 2011
tula[;kPopulation
2011
jkT; dh dqy tula[;k dk %
% of Total Population of
state 2011
Js.khRank in
2011 District
4 5 6 1 S.No
3656539 21.80 1 North-West 1
2731929 16.30 2 South 2
2543243 15.10 3 West 3
2241624 13.40 5 North-East 4
2292958 13.70 4 South-West 5
1709346 10.20 6 East 6
887978 5.30 7 North 7
582320 3.50 8 Central 8
142004 0.80 9 New Delhi 9
16787941 100.00 Total
Source : Directorate of Census Operations, Delhi

28
1- {ks=Qy ,oa tula[;k1- {ks=Qy ,oa tula[;k1-13 fnYyh dh rglhy okj tula[;k&2011
Total Population
Ø- la- rglhydqy iq:"k L=h
Total Male Female
1 2 3 4
1 ujsyk 809913 439576 370337
2 ljLorh fogkj 2250816 1202149 1048667
3 ekM+u Vkmu 595810 319197 276613
4 flfoy ykbu 688616 367522 321094
5 lnj cktkj 130188 69837 60351
6 dksrokyh 69174 37643 31531
7 lhyeiqj 1378779 732925 645854
8 'kkgnjk 322931 169409 153522
9 lhekiqjh 539914 286091 253823
10 xka/kh uxj 395342 208645 186697
11 foosd fogkj 247906 130769 117137
12 izhr fogkj 1066098 568086 498012
13 ikfyZ;kesUV LVªhV 52394 28729 23665
14 dukV Iysl 28228 15208 13020

29
1. AREA AND POPULATION1.13 Tehshil-wise Population of Delhi-2011
Scheduled Caste Population
dqy iq:"k L=hS.No. Tehshil
Total Male Female
5 6 7 1
155299 83528 71771 1 Narela
434589 230582 204007 2 Sarswati Vihar
107349 57436 49913 3 Model Town
129391 67996 61395 4 Civil Line
27892 14546 13346 5 Sadar Bazar
8380 4465 3915 6 Kotwali
175443 92879 82564 7 Seelam Pur
37416 19498 17918 8 Shahdara
160899 84682 76217 9 Seema Puri
37461 19743 17718 10 Gandhi Nagar
48421 25309 23112 11 Vivek Vihar
195540 102967 92573 12 Preet Vihar
12616 6676 5940 13 Parliament Street
5534 2928 2606 14 Connaught Place
contd..

30
1- {ks=Qy ,oa tula[;k1- {ks=Qy ,oa tula[;k1-13 fnYyh dh rglhy okj tula[;k&2011
Total Population
rglhydqy iq:"k L=hTotal Male Female
1 2 3 415 pk.kD; iqjh 61382 34005 27377
16 djksy ckx 136599 71544 65055
17 igkM+ xat 174613 92984 81629
18 nfj;k xat 271108 143293 127815
19 iatkch ckx 799453 426618 372835
20 iVsy uxj 1262158 670390 591768
21 jktkSjh xkMZu 481632 259332 222400
22 utQx<+ 1365152 729396 635756
23 fnYyh dSUV 286140 160494 125646
24 olUr fogkj 641666 356156 285510
25 fMQsUl dkyksuh 637775 339725 298050
26 gkSt [kkl 1231293 658380 572913
27 dkydk th 862861 469323 393538
;ksx 16787941 8987326 7800615
lzksr % tux.kuk funs'kky;] fnYyhA

31
1. AREA AND POPULATION1.13 Tehshil-wise Population of Delhi-2011
Scheduled Caste Population
dqy iq:"k L=hTehshil
Total Male Female
5 6 7 1
15095 8281 6814 15 Chanakya Puri
59352 30206 29146 16 Karol Bagh
53615 27807 25808 17 Paharganj
30211 15769 14442 18 Daryaganj
163698 86233 77465 19 Punjabi Bagh
157422 83498 73924 20 Patel Nagar
55352 30367 24985 21 Rajouri Garden
171602 90605 80997 22 Najafgarh
53894 29216 24678 23 Delhi Contonment
92912 50384 42528 24 Vasant Vihar
68480 35958 32522 25 Defence Colony
219813 115084 104729 26 Hauz Khas
134633 72157 62476 27 Kalkaji
2812309 1488800 1323509 Total
Source : Directorate of Census Operations, Delhi.

32
1- fnYyh dh tula[;k&2011 fooj.k1- fnYyh dh tula[;k&2011 fooj.k1.14 POPULATION OF DELHI—2011 DETAILS
¼tux.kuk&2011½(Census—2011)
la?k {ks=@LFkkuh;
fudk;@x.kuk uxj
dqy tula[;k
Total Population
vuqlwfpr tkfr tula[;k
Scheduled castes Population
la?k {ks=@LFkkuh; fudk;@x.kuk
uxjTerritory/Local Body/Census
Town1 2 3 1
jk"Vªh; jktèkkuh {ks= fnYyh
National Capital Terrotory of Delhi
dqy 16787941 2812309 Total
'kgjh 16368899 2730126 Urban
xzkeh.k 419042 82183 Rural
¼d½ ubZ fnYyh uxj ifj"kn
257803 49607 (a) New Delhi Municipal Council
¼[k½ fnYyh Nkouh
110351 16497 (b) Delhi cantt. Board
¼x½ fnYyh uxj fuxe
16419787 2746205 (c) Delhi Municipal Corporation

33
fudk;@x.kuk uxj dqy tula[;k
vuqlwfpr tkfr tula[;k
S. No. Census Town (CT) Total Population
Scheduled castes Population
1 2 31 Sadar Pur Gujran (CT) 97641 9,4882 Baqiabad (CT) 14429 10683 Karawal Nagar (CT) 224281 360564 Dayal Pur (CT) 20589 1,6425 Jiwanpur Alias Johripur (CT) 43054 16,1536 Mustafabad (CT) 127167 4,1307 Khan Pur Dhani (CT) 6994 5318 Tukhmir Pur (CT) 5658 9219 Khajoori Khas (CT) 76640 375810 Mir Pur Khas (CT) 19098 82211 Ziauddin Pur (CT) 68993 9,73712 Gokal Pur (CT) 121870 38,21213 Babarpur(CT) 37058 3,84514 Jaffrabad (CT) 54601 3,59815 Mandoli (CT) 120417 5437416 Shakar Pur Baramad (CT) 1178 5117 Gharonda Neemka Bangar
alias Patpar Ganj (CT)37876 5,104
18 Gharoli (CT) 92540 23,15619 Kondli (CT) 38207 6,51620 Dallo Pura (CT) 154791 59,65621 Chilla Saroda Bangar (CT) 83217 8,90122 Chilla Saroda Khadar (CT) 11743 470
contd..

34
fudk;@x.kuk uxjCensus Town (CT)
dqy tula[;k
vuqlwfpr tkfr tula[;k
S. No.
Total Population
Scheduled castes
Population1 2 3
23 Hastal (CT) 176877 21,06824 Raja Pur Khurd (CT) 19312 169525 Bapraula (CT) 52744 7,14126 Tilang Pur Kotla (CT) 13614 1,69727 Shafi Pur Ranhola (CT) 31944 4,81828 Nilothi (CT) 43371 4,80529 Nangloi Jat (CT) 205596 49,08830 Quammruddin Nagar (CT) 25126 2,05631 Mundka (CT) 54541 9,13132 Bakkar Wala (CT) 18122 5,25133 Tikri Kalan (CT) 16313 2,07634 Jharoda Kalan (CT) 19578 332235 Kair (CT) 4074 51336 Jaffar Pur Kaln (CT) 6573 2,27837 Ujwa (CT) 4856 76438 Mitraon (CT) 6512 1,54339 Khera (CT) 7220 1,17040 Dindar Pur (CT) 35856 4,27741 Roshan Pura alias Dichoan Khurd (CT) 57217 8,03942 Nangli Sakrawati (CT) 37706 4,55843 Chhawala (CT) 14662 1,54944 Moradabad Pahari (CT) 21502 2,294
lzksr % tux.kuk funs'kky;] fnYyhA

35
S. No. fudk;@x.kuk@uxjCensus Town (CT)
dqy tula[;k
Total Population
vuqlwfpr tkfr
tula[;kScheduled
castes Population
1 2 345 Kusum Pur (CT) 17028 9,96046 Malik Pur Kohi alias Rang Puri (CT) 23726 3,44747 Sambhalka (CT) 17076 256548 Kapas Hera (CT) 47073 6,50349 Rajokri (CT) 19148 3,86950 Ghitorni (CT) 14893 1,60351 Aya Nagar (CT) 33123 3,63752 Jona Pur (CT) 10635 2,58353 Fateh Pur Beri (CT) 8861 93554 Dera Mandi (CT) 16725 3,83255 Bhati (CT) 18864 2,30156 Asola (CT) 13275 3,03257 Chandan Hola (CT) 6780 16158 Sultan Pur (CT) 15160 1,59659 Chattar Pur (CT) 16776 6,88760 Maidan Garhi (CT) 11111 2,67961 Raj Pur Khurd (CT) 11161 86662 Deoli (CT) 169122 2827663 Neb Sarai (CT) 15640 2,05664 Saidul Azaib (CT) 17914 1,40165 Tigri (CT) 46974 19,90466 Saidabad (CD) 10168 689
Source : Directorate of Census Operations, Delhi. contd..

36
fudk;@x.kuk uxjCensus Town (CT)
dqy tula[;k vuqlwfpr tkfr tula[;k
S.No. Total Population
Scheduled castes Population
1 2 367 Kotla Mahingiran (CT) 7376 43868 Pul Pehlad (CT) 69657 1783669 Taj Pul (CT) 68796 10,78170 Mitte Pur (CT) 69837 6,72771 Molar Band (CT) 91402 9,28872 Aali (CT) 27169 4,52473 Jait Pur (CT) 59330 4,43274 Mukand Pur (CT) 57135 8,97575 Kamal Pur Majra Burari (CT) 43086 5,58776 Burari (CT) 146190 16,28577 Jharoda Majra Burari (CT) 22878 3,27578 Bankner (CT) 14788 410079 Bhor Garh (CT) 5627 123680 Tikri Khurd (CT) 13772 4,06781 Bakhtawar Pur (CT) 12716 2,43682 Bankauli (CT) 5339 82783 Ali Pur (CT) 20332 2,86784 Mukhmel Pur (CT) 4931 2,12885 Ibrahim Pur (CT) 10614 1,61586 Qadi Pur (CT) 18369 2,26487 Libaspur (CT) 44375 2,06288 Siras Pur (CT) 30445 3,369
lzksr % tux.kuk funs'kky;] fnYyhA

37
fudk;@x.kuk uxjCensus Town (CT)
dqy tula[;k vuqlwfpr tkfr tula[;k
S.No. Total Population
Scheduled castes Population
1 2 389 Khera Kalan (CT) 8252 1,80790 Sahibabad Daulat Pur (CT) 54773 18,36491 Pehlad Pur Bangar (CT) 22968 431392 Khera Khurd (CT) 9777 2,96593 Barwala (CT) 8948 2,01394 Pooth Khurd (CT) 10654 2,20495 Bawana (CT) 73680 9,81396 Darya Pur Kalan (CT) 6310 1,44397 Qutub Garh (CT) 7639 1,62898 Lad Puri (CT) 5529 1,17099 Kanjhawala (CT) 10331 1,509100 Gheora (CT) 6876 1,226101 Rani Khera (CT) 16402 2,030102 Mubarak Pur Dabas (CT) 12043 2,162103 Kirari Suleman Nagar (CT) 283211 50,712104 Nithari (CT) 50464 4,893105 Mohammadpur Majri (CT) 17462 2,490106 Karala (CT) 35730 5701107 Begum Pur (CT) 53682 9,531108 Pooth kalan (CT) 96002 19,275109 Sultan Pur Majra (CT) 181554 81,204110 Bhalswa Jahangir Pur (CT) 197148 43,193
Source : Directorate of Census Operations, Delhi.

38
1- {ks=Qy ,oa tula[;k1- {ks=Qy ,oa tula[;k1-15 ¼v½ fnYyh dh tula[;k
xzkeh.k o 'kgjhDistrict/Union Territory Population
Total Rural Urban1 2 3 4 5
NCT of Delhi 16787941 419042 163688991 North West 3656539 213950 34425892 North 887978 17746 8702323 North East 2241624 21527 22200974 East 1709346 3530 17058165 New Delhi 142004 - 1420046 Central 582320 - 5823207 West 2543243 6420 25368238 South West 2292958 143676 21492829 South 2731929 12193 2719736
1.15 (c)
District/Union TerritoryPercentage Decadal Growth (person) 2001-2011
Total Rural Urban1 2 12 13 14
NCT of Delhi 21.20 -55.60 26.801 North West 27.80 -19.40 32.602 North 13.60 -61.90 18.403 North East 26.80 -84.80 36.504 East 16.80 -80.60 18.005 New Delhi -20.70 - -20.706 Central -9.90 - -9.907 West 19.50 -92.60 24.208 South West 30.60 -36.30 40.509 South 20.50 -92.40 29.10
lzksr % tux.kuk funs'kky;] fnYyhA

39
1. Area and Population 1.15(a) Population of DelhiRural Urban Distribution
Males FemalesTotal Rural Urban Total Rural Urban
6 7 8 9 10 118987326 226321 8761005 7,800,615 192,721 76078941960922 115680 1845242 1695617 98,270 1,597,347475002 9546 465456 412976 8200 404776
1188425 11718 1176707 1053199 9809 1,043,390907500 1861 905639 801846 1669 80017777942 - 77942 64062 - 64062
307821 - 307821 274499 - 2744991356240 3355 1352885 1187003 3,065 1,183,9381246046 77342 1168704 1046912 66334 9805781467428 6819 1460609 1264501 5,374 1,259,127
1.15(b)Percentage Decadal Growth (male)
2001-2011Percentage Decadal Growth
(Female) 2001-2011Total Rural Urban Total Rural Urban
15 16 17 18 19 2018.00 -56.52 23.49 24.56 -54.50 30.3024.75 -21.11 29.47 31.14 -17.40 36.0510.37 -62.91 15.06 16.26 -60.65 21.0924.29 -84.68 33.78 29.61 -84.90 39.5814.19 -81.53 15.42 19.64 -79.50 20.86
-26.12 - -26.12 -24.37 - -24.37-12.80 - -12.80 -7.72 - -7.7216.04 -93.10 20.88 22.37 -91.94 26.9826.95 -36.99 36.11 35.29 -34.87 46.0016.69 -92.23 25.10 25.47 -92.77 34.36
Source : Directorate of Census Operations, Delhi
Census-2011

40
1- {ks=Qy ,oa tula[;k1- {ks=Qy ,oa tula[;k1-15 ¼x½ fnYyh dh tula[;k
xzkeh.k o 'kgjh
District/Union Territory Total Child population 0-6 Years (Persons)Total Rural Urban
1 2 21 22 23NCT of Delhi 2012454 56716 1955738
1 North West 449894 28936 4209582 North 103304 2391 1009133 North East 301947 3386 2985614 East 194357 374 1939835 New Delhi 12760 - 127606 Central 62739 - 627397 West 288421 931 2874908 South West 267989 18901 2490889 South 331043 1797 329246
1.15(?k)
District/Union TerritoryPercentage of Child Population in age
group 0-6 years (Persons)Total Rural Urban
1 2 30 31 32NCT of Delhi 12.0 13.5 11.9
1 North West 12.3 13.5 12.22 North 11.6 13.5 11.63 North East 13.5 15.7 13.44 East 11.4 10.6 11.45 New Delhi 9.0 - 9.06 Central 10.8 - 10.87 West 11.3 14.5 11.38 South West 11.7 13.2 11.69 South 12.1 14.7 12.1
lzksr % tux.kuk funs'kky;] fnYyhA

41
1. Area and Population 1.15(c) Population of DelhiRural Urban Distribution
Total Child population 0-6 Years (Male)
Total Child population 0-6 Years (Female)
Total Rural Urban Total Rural Urban24 25 26 27 28 29
1075440 31259 1044181 937014 25457 911557241169 15894 225275 208725 13042 19568355155 1268 53887 48149 1123 47026
160583 1839 158744 141364 1547 139817103902 218 103684 90455 156 90299
6738 - 6738 6022 - 602232928 - 32928 29811 - 29811
154088 521 153567 134333 410 133923145285 10587 134698 122704 8314 114390175592 932 174660 155451 865 154586
1.15(d)Child Sex ratio 0-6 years Sex ratio (No. of Females per
1000 males)Total Rural Urban Total Rural Urban
33 34 35 36 37 38871 814 873 868 852 868865 821 869 865 849 866873 886 873 869 859 870880 841 881 886 837 887871 716 871 884 897 884894 - 894 822 - 822905 - 905 892 - 892872 787 872 875 914 875845 785 849 840 858 839885 928 885 862 788 862
Source : Directorate of Census Operations, Delhi
Census-2011

42
1.16(a) Puplation of Delhi Rural-Urban Distribution
District Code
Union Territory District
Literates (Persons) Literates (Males) Literates (Females)
Total Rural Urban Total Rural Urban Total Rural Urban
1 2 39 40 41 42 43 44 45 46 47
NCT of Delhi
12,737,767 296,600 12,441,167 7,194,856 174,327 7020529 5,542,911 122,273 5,420,638
1 North West
2707855 147,327 2,560,528 1,541,952 87,043 1454909 1,165,903 60,284 1,105,619
2 North 681517 13240 668277 381615 7700 373,915 299902 5540 294362
3 North East
1611588 14,465 1,597,123 912481 8515 903,966 699107 5950 693157
4 East 1352998 2,986 135,012 748382 1583 746,799 604616 1406 603213
5 New Delhi
114179 - 114179 65678 - 65678 48501 - 48501
6 Central 442360 - 442360 240518 - 240,518 201842 - 201842
7 West 1961179 4,448 1,956,731 109,399 2,563 1091370 867246 1885 865361
8 South West
1787689 105,998 1,681,691 1,025,261 61,887 963,374 762428 44111 718317
9 South 2078402 8,136 2,070,266 1,185,036 5,036 1180000 893,366 3100 890266
lzksr % tux.kuk funs'kky;] fnYyhANote:New Delhi District & Central District are totally urban
Census-2011

43
1.16(b) Puplation of Delhi Rural-Urban Distribution
District Code
Union Territory District
Literacy Rate (Persons) Literacy Rate (Males) Literacy Rate (females)
Total Rural Urban Total Rural Urban Total Rural Urban
1 2 48 49 50 51 52 53 54 55 56
NCT of Delhi
86.20 81.90 86.30 90.90 89.40 91.00 80.80 73.10 80.90
1 North West
84.40 79.60 84.70 89.70 87.20 89.80 78.40 70.70 78.90
2 North 86.90 86.20 86.90 90.90 93.00 90.90 82.20 78.30 82.30
3 North East
83.10 79.70 83.10 88.80 86.20 88.80 76.70 72.00 76.70
4 East 89.30 94.60 89.30 93.10 96.30 93.10 85.00 92.70 85.00
5 New Delhi
88.30 88.30 92.20 - 92.20 83.60 - 83.60
6 Central 85.10 - 85.10 87.50 - 87.50 82.50 - 82.50
7 West 87.00 81.00 87.00 91.00 90.40 91.00 82.40 71.00 82.40
8 South West
88.30 85.00 88.50 93.10 92.70 93.20 82.50 76.00 82.90
9 South 86.60 78.30 86.60 91.70 85.50 91.80 80.60 68.80 80.60
Source :Directorate of Census Operations, Delhi
Census-2011

44
1- {ks=Qy ,oa tula[;k1- {ks=Qy ,oa tula[;k1-17 fnYyh esa tux.kuk vkokl&20111-17 fnYyh esa tux.kuk vkokl&2011
tux.kuk vkokl bdkbZ dqy xzkeh.k(Units) Total Rural
1 2 3 4A. vf/kxzfgr vkokl la[;k esa 4092864 101866
(In Nos.) (88.90) (81.90)1 fuokl ” 3176329 75234
(77.6) (73.8)2 fuokl lfgr vU; mi;ksx ” 137575 3458
(3.4) (3.4)3 nqdku] dk;kZy; ” 377299 3022
(9.2) (3.0)4 Ldwy] dkWyst vU; ” 9709 279
(0.2) (0.3)5 gksVy] ykWt] vfrfFk x`g vU; ” 7754 60
(0.2) (0.1)6 vLirky] vkS"kk/kky; vU; ” 7853 113
(0.2) (0.1)7 QSDVjh@dk;Z'kkyk] odZ 'ksM vU; ” 90945 829
(2.2) (0.8)8 iwtk LFky ” 8668 354
(0.2) (0.3)9 vU; xSj fuoklh; vkokl ” 237244 17713
(5.8) (17.4)10. rkyk yxs vf/kxzfgr tux.kuk vkokl ” 39488 804
(1.0) (0.8)B. fjDr vkokl ” 512691 22556
(11.1) (18.1)C . dqy tux.kuk vkokl ” 4605555 124422
(100.00) (100.00)uksV % czsdV esa izfr'kr n'kkZ, x, gSalzksr % tux.kuk funs'kky;] fnYyh

45
1. AREA AND POPULATION1.17 Census Houses in Delhi-2011
'kgjhUrban
Census Houses
5 13990998 A. OCCUPIED HOUSES
(89.1)3101095 1 Residence
(77.7)134117 2 Residence-cum-others
(3.4)374277 3 Shop, Offi ces
(9.4)9430 4 School, College etc.(0.2)7694 5 Hotel, Lodge, Guest house etc.(0.2)7740 6 Hospital, Dispensary etc.(0.2)
90116 7 Factory, Workshop, Workshed etc.(2.2)8314 8 Places of Worship(0.2)
219531 9 Other non-residential use(5.5)
38684 10. No. of Occupied Locked Census Houses(1.0)
490135 B. Vacant House(10.9)
4481133 C . Total Census House(100.00)
Brackets shows percentage.Source :Directorate of Census Operations, Delhi

46
1- {ks=Qy ,oa tula[;k1- {ks=Qy ,oa tula[;k1-18 ifjokjksa dks miyC/k lqfo/kk,a ¼tux.kuk 2011½
1.18 FACILITIES AVAILABLE TO HOUSEHOLDS (CENSUS 2011)
ifjokj laLFkkxr bdkbZ ifjokj lfgr
UnitbZdkbZ
dqyTotal
xzkeh.kRural
'kgjhUrban
1 2 3 4 5 1
1 fctyh lqfo/kk miyC/k la[;k(Numbers)
3310809(99.11)
77366(97.80)
3233443(99.10)
1 Electricity Available
2 'kkSp?kj lqfo/kk miyC/k ,,,,
2990741(89.53)
60355(94.30)
2930386(89.08)
2 Latrine Facility Available
3 fctyh ,oa 'kkSp?kj nksuksa lqfo/kk miyC/k
,,,,
2980190(89.21)
59653(75.90)
2920537(89.50)
3 Both Elect. & Latrine facility available
4 fctyh lqfo/kk miyC/k ijUrq 'kkSp?kj lqfo/kk miyC/k ugha
,, 330619(9.90)
17713(22.40)
312906(9.60)
4 Elect. Available but latrine not available
5 'kkSp?kj lqfo/kk miyC/k ijUrq fctyh ugha
,, 10551(0.32)
702(0.09)
9849(0.30)
5 Elect not available but latrine available
6 fctyh ,oa 'kkSp?kj nksuksa lqfo/kk miyC/k ugha
,, 19178(0.57)
1047(1.30)
18131(0.60)
6 Both elect. & latrine not available
uksV % czsdV esa izfr'kr n'kkZ;s x;s gSaNote: Brackets shows percentagelzksr % tux.kuk funs'kky;] fnYyh Source: Directorate of Census Operations, Delhi

47
1. AREA AND POPULATION1-19 fnYyh esa vkokl o vkokl lfgr vU; mi;ksx okys tux.kuk vkoklksa dk fooj.k ¼tux.kuk 2011½1.19 Details of Residential/Residential-cum-other
Use of Census Houses (CENSUS 2011)
fooj.kbdkbZ dqy izfr'kr
DescriptionUnit Total Percentage
1 2 3 4 1
1 fuokl la[;k 3176329 77.6 1 Residence
(Nos.)
2 fuokl vU; dk;Z lfgr
,, 137575 3.4 2 Residence cum-other use.
3 vkokl dh fLFkfr
3 Condition of houses
dqy ,, 3313904 100.00 Total
(i) vPNk ,, 2181500 65.8 (i) Good
(ii) jgus ;ksX; ,, 1039572 31.4 (ii) Livable
(iii) th.kZ&'kh.kZ ,, 92882 2.8 (iii) Dilapidated
lzksr % tux.kuk funs'kky;] fnYyhSource : Directorate of Census Operations, Delhi

48
1- {ks=Qy ,oa tula[;k1- {ks=Qy ,oa tula[;k1-20 ikuh ds lzksr ¼tux.kuk 2011½
1.20 SOURCES OF WATER (CENSUS 2011)
ifjokjksa dh la[;kNo. of Households
lzksrdqy xzkeh.k 'kgjh SourceTotal Rural Urban
1 2 3 4 1
1. lHkh lzksr 3340538 79115 3261423 1 All Sources
(100.00) (100.00) (100.00)
2. dq,a 3167 250 2917 2 Well
(0.1) (0.3) (0.1)
(i) <ds dq,a 2541 168 2373 (i) Covered Well
(ii) fcuk <dssssss dqq,a 626 82 544 (ii) Un-Covered Well
3. uy 2716793 47004 2669789 3 Tap
(81.33) (59.41) (81.86)
(i) uy ikuh lalkf/kr L=ksrksa ls 2511646 39213 2472433 (i) Tap water from treated source
(ii) uy ikuh vlalkf/kr L=ksrksa ls
205147 7791 197356 (ii) Tap water from un-treated source
4. gSaM iEi@V~;wc oSy 457977(13.71)
22567(28.52)
435410(13.35)
4 Hand Pump/ Tubewell
5. vU; lfEefyr unh@ukyk@VSad@>juk
162601(4.87)
9294(11.75)
153307(4.70)
5 Other Including River/ Canal/ Tank/ Spring
czsdV esa izfr'kr n'kkZ;s x;s gSaBrackets shows percentage.lzksr % tux.kuk funs'kky;] fnYyhSource: Directorate of Census Operations, Delhi.

49
1. AREA AND POPULATION1-21 [kkuk idkus esa b±/ku mi;ksx ¼tux.kuk 2011½
1.21 FUEL USED FOR COOKING (CENSUS 2011)ifjokjksa dh la[;kNo. of Households
b±/ku ds izdkjdqy xzkeh.k 'kgjh Type of fuelTotal Rural Urban
1 2 3 4 1
1. [kkuk idkus dh xSl ,y-ih-th-@ih-,u-th
3003996(89.93)
59510 (75.22)
2944486(90.28)
1. LPG/PNG
2. feV~Vh dk rsy 175443 6123 169320 2. Kerosene(5.25) (7.74) (5.19)
3. miys 19487 2907 16580 3. Cow Dung Cake(0.58) (3.67) (0.51)
4. ydM+h 112291 8927 103364 4. Wood(3.36) (11.28) (3.17)
5. dks;yk dksd@fyxukbZV 4476 102 4374 5. Coal/Coke/Lignite(0.13) (0.13) (0.13)
6. ck;ksxSl 3017 65 2952 6. Bio-Gas(0.09) (0.08) (0.09)
7. Qly vo'ks"k 9094 1241 7853 7. Crop residue(0.27) (1.57) (0.24)
8. fctyh 1335 56 1279 8. Electricity(0.04) (0.07) (0.04)
9. vU; 1866 27 1839 9. Others(0.06) (0.29) (0.06)
10. [kkuk ugha cukuk 9533 157 9376 10 No Cooking(0.29) (0.20) (0.29)
11. dqy lzksr 3340538 79115 3261423 11 All Sources(100.00) (100.00) (100.00)
czsdV esa izfr'kr n'kkZ;s x;s gSBrackets shows percentage.lzksr % tux.kuk funs'kky;] fnYyhSource : Directorate of Census Operations, Delhi.

50
1-22 ifjokjksa dh ekfydkuk fLFkfr1-22 ifjokjksa dh ekfydkuk fLFkfr¼tux.kuk&2011½
Øe la[;kSr. No.
ensaItems
fuf'pr la[;k Absolute Number
dqyTotal
xzkeh.kRural
'kgjhUrban
1 2 3 4
1 viuk 2,279,303 64,682 2,214,621
2 fdjk;s ij 941,459 12,347 929,112
3 vU; 119,776 2,086 117,690
dqy ifjokjksa dh la[;k 3,340,538 79,115 3,261,423

51
1.22 Households by ownership status (In Percentage) (Census-2011)
dqyTotal
xzkeh.kRural
'kgjhUrban
Ø-la-S.No.
ensaItems
5 6 7
68.2 81.8 67.9 1 Owned
28.2 2.6 28.5 2 Rented
3.6 2.6 3.6 3 Others
100 100 100 Total number of households

52
1-23 vkokl xzg ifjokjkaas dh la[;k1-23 vkokl xzg ifjokjkaas dh la[;k
Øe la[;k
Sr. No. ensa
Items
fuf'pr la[;k Absolute Number
dqyTotal
xzkeh.kRural
'kgjhUrban
1 2 3 4
1 dksbZ Hkh dejk ugha 43,813 828 42,985
2 ,sd dejk 1,074,917 22,953 1,051,964
3 nks dejsa 989,686 22,184 967,502
4 rhu dejsa 666,480 15,742 650,738
5 pkj dejsa 348,639 9,995 338,644
6 ikp dejsa 101,185 3,890 97,295
7 N% dejsa o mlls vf/kd
115,818 3,523 112,295
dqy ifjokjksa dh la[;k
3,340,538 79,115 3,261,423

53
1.23 Households by Number of Dwelling Rooms
izfr'kr Percentage
dqyTotal
xzkeh.kRural
'kgjhUrban
Ø-la-S.No.
ensaItems
5 6 7 1
1.3 1.1 1.3 1 No exclusive room
32.2 29 32.3 2 One room
29.6 28 29.7 3 Two rooms
20 19.9 19.9 4 Three rooms
10.4 12.6 10.4 5 Four rooms
3 4.9 3 6 Five rooms
3.5 4.5 3.4 7 Six rooms and above
100 100 100 Total number of households

54
1-24 ifjokjksa dh lnL; la[;k vuqlkj ¼tux.kuk&2011½1-24 ifjokjksa dh lnL; la[;k vuqlkj ¼tux.kuk&2011½
Øe la-Sr. No.
ifjokj ds lnL;ksa dh la[;k No. of Member in Household
ifjokjksa esa lnL; la[;kifjokjksa esa lnL; la[;k
dqyTotal
xzkeh.kRural
'kgjhUrban
1 2 3 4
1 1 123,106 2,392 120,714
2 2 252,370 4,456 247,914
3 3 428,403 7,682 420,721
4 4 803,065 17,258 785,807
5 5 681,142 17,389 663,753
6 6-8 853,773 23,689 830,084
7 9+ 198,679 6,249 192,430
dqy 3,340,538 79,115 3,261,423

55
1.24 Households by Households Size (Census-2011)
izfr'kr Percentage ifjokj ds lnL;ksa dh la[;k No. of members in households
S.No.dqyTotal
xzkeh.kRural
'kgjhUrban
5 6 7 1
3.7 3 3.7 1 1
7.6 5.6 7.6 2 2
12.8 9.7 12.9 3 3
24 21.8 24.1 4 4
20.4 22 20.4 5 5
25.6 30 25.4 6-8 6
5.9 7.9 5.9 9+ 7
100 100 100 Total

56
1-25 ifjokjksa dks miyC/k 'kkSp lqfo/kkvksa ds izdkj ¼tux.kuk&2011½1-25 ifjokjksa dks miyC/k 'kkSp lqfo/kkvksa ds izdkj ¼tux.kuk&2011½
Øe la[;kS. No. 'kkSp lqfo/kk izdkj
ifjokjksa dh la[;kNo. of Households
dqyTotal
xzkeh.kRural
'kgjhUrban
1 2 3 4
1 ifjlj ds Hkhrj 'kksp lafo/kk;sa
2,990,741 60,355 2,930,386
2 ikuh ls f?kjk 2,861,762 55,396 2,806,366
(i) ikbZi okyh O;oLFkk 1,979,839 8,252 1,971,587
(ii) lSfIVd Vsad 850,831 46,351 804,480
(iii) vU; O;oLFkk 31,092 793 30,299
3 xM~Ms okyk 'kkSp 59,339 4,113 55,226
(i) flYyh lfgr@goknkj xM~Ms okyk 'kkSp
54,151 3,961 50,190
(ii) cxsj flYyh lfgr@ [kqyk 'kkSp
5,188 152 5,036
4 vU; 'kkSp 69,640 846 68,794

57
1.25 Households by type of latrine facility (Census-2011)
izfr'krPercentage
Ø-la-S.No. Type of Latrine Facility
dqyTotal
xzkeh.kRural
'kgjhUrban
5 6 7 1
89.5 76.3 89.8 1 Latrine facility within the premises
85.7 70 86 2 Water Closet
59.3 10.4 60.4 (i) Piped sewer system
25.5 58.6 24.7 (ii) Septic tank
0.9 1 0.9 (iii) Other system
1.8 5.2 1.7 3 Pit Latrine
1.6 5 1.5 (i) With slab/ ventilated improved pit
0.2 0.2 0.2 (ii) Without slab/ open pit
2.1 1.1 2.1 4 Other Latrine
Contd...

58
ifjokjksa dh la[;kNo. of Households
Øe la[;kS. No. 'kkSp lqfo/kk izdkj
dqyTotal
xzkeh.kRural
'kgjhUrban
1 2 3 4
(i) [kqys ukyksa esa forfjr ey fo"Bk
68,424 773 67,651
(ii) ekuoh; ey fo"Bk 583 0 583
(iii) tkuojksa dh ey fo"Bk
633 73 560
5 ifjlj esa 'kkSp lqfoèkk ugha
349,797 18,760 331,037
(i) ifCyd 'kkSp 240,448 8,076 232,372
(ii) [kqyk 109,349 10,684 98,665
dqy ifjokjksa dh la[;k
3,340,538 79,115 3,261,423

59
izfr'kr Percentage
dqyTotal
xzkeh.kRural
'kgjhUrban
Øe la[;kS. No. Type of Latrine Facility
5 6 7 1
2.1 1 2.1 (i) Night soil disposed into open drain
0 0 0 (ii) Night soil removed by human
0 0.1 0 (iii) Night soil serviced by animals
10.5 23.7 10.2 5 No Latrine within the premises
7.2 10.2 7.1 (i) Public latrine
3.3 13.5 3 (ii) Open
100 100 100 Total number of households

60
1-26 ifjokjkas dks Luku?kj dh lqfo/kk;sa ¼tux.kuk&2011½1-26 ifjokjkas dks Luku?kj dh lqfo/kk;sa ¼tux.kuk&2011½
dze la[;kS.No.
fooj.k Description
ifjokjksa dh la[;kNo. of households
dqyTotal
xzkeh.kRural
'kgjhUrban
1 2 3 4
1 Luku?kj 2,906,987 59,212 2,847,775
2 cxSj Nr pkjfnokjh 135,197 5,995 129,202
3 dksbZ Hkh ugha 298,354 13,908 284,446
dqy ifjokjksa dh la[;k 3,340,538 79,115 3,261,423
1-27 ifjokjksa dh la[;k ty fudklh ds izdkj vuqlkj1-27 ifjokjksa dh la[;k ty fudklh ds izdkj vuqlkj
1 2 3 4
1 can ty fudkl 1,977,793 10,782 1,967,011
2 [kqyk ty fudkl 1,223,935 58,584 1,165,351
3 dksbZ Hkh ty fudkl ugha 138,810 9,749 129,061
dqy ifjokjksa dh la[;k 3,340,538 79,115 3,261,423

61
1.26 Households by Bathing Facility (Census-2011)
izfr'kr Percentage
fooj.k Description
dqyTotal
xzkeh.kRural
'kgjhUrban
dze la[;kS.No.
5 6 7 1
87 74.8 87.3 1 Bathroom
4.1 7.6 4 2 Enclosure without roof
8.9 17.6 8.7 3 None
100 100 100 Total number of households
1.27 Households By Type of Drainage Connectivity For Waste Water Outlet
5 6 7 1
59.2 13.6 60.3 1 Closed drainage
36.6 74.1 35.7 2 Open drainage
4.2 12.3 4 3 No drainage
100 100 100 Total number of households

62
1-28 ifjokjksa dks jlksbZ?kj lqfo/kk;sa miyC/k ¼tux.kuk&2011½1-28 ifjokjksa dks jlksbZ?kj lqfo/kk;sa miyC/k ¼tux.kuk&2011½
dze la[;kS. No.
ensaItems
fuf'pr la[;kAbsolute Number
dqyTotal
xzkeh.kRural
'kgjhUrban
1 2 3 4
1 ?kj ds Hkhrj [kkuk cukuk
3,284,487 75,896 3,208,591
(i) jlksbZ?kj gS 2,633,420 52,975 2,580,445
(ii) jlksbZ?kj ugha gS 651,067 22,921 628,146
2 ?kj ds ckgj [kkuk cukuk
46,518 3,062 43,456
(i) jlksbZ?kj gS 9,679 610 9,069
(ii) jlksbZ?kj ugha gS 36,839 2,452 34,387
3 dksbZ [kkuk cukuk ugha
9,533 157 9,376
dqy ifjokjksa dh la[;k
3,340,538 79,115 3,261,423

63
1.28 Households by Availability of Kitchen Facility (Census-2011)
izfr'kr Percentage
dze la[;kS. No.
ensaItems
dqyTotal
xzkeh.kRural
'kgjhUrban
5 6 7 1
98.3 95.9 98.4 1 Cooking inside house
78.8 66.9 79.1 (i) Has Kitchen
19.5 29 19.3 (ii) Does not have kitchen
1.4 3.9 1.3 2 Cooking outside house
0.3 0.8 0.3 (i) Has Kitchen
1.1 3.1 1.1 (ii) Does not have kitchen
0.3 0.2 0.3 3 No cooking
100 100 100 Total number of households

64
1-29 ifjokjksa dk lEifr LokfeRo ¼tux.kuk&2011½1-29 ifjokjksa dk lEifr LokfeRo ¼tux.kuk&2011½
dze la[;kS. No.
ensaItems
fuf'pr la[;kAbsolute Number
dqyTotal
xzkeh.kRural
'kgjhUrban
1 2 3 4
1 jssfM;ks@VªkftLVj@ 1,115,077 19,419 1,095,658
2 Vsyhfotu 2,939,423 65,651 2,873,772
3 dEI;wVj@ysiVkWi bUVjusV lfgr
588,951 3,515 585,436
4 dEI;wVj@ysiVkWi fcuk bUVjusV lfgr
383,997 7,085 376,912
5 VsyhQksu 3,031,775 65,829 2,965,946
(i) ySaMykbu 171,323 3,374 167,949
(ii) eksckbZy 2,279,781 57,727 2,222,054
(iii) ySaMykbu o eksckby nksuksa
580,671 4,728 575,943

65
1.29 Households by posession of Assets (Census-2011)
izfr'kr Percentage
Øe la[;kS. No.
ensaItems
dqyTotal
xzkeh.kRural
'kgjhUrban
5 6 7 1
33.4 24.5 33.6 1 Radio/ Transistor
88 83 88.1 2 Television
17.6 4.4 18 3 Computer/Laptop - With Internet
11.5 9 11.6 4 Computer/Laptop - Without Internet
90.8 83.2 90.9 5 Telephone
5.1 4.3 5.1 (i) Landline Phone
68.2 73 68.1 (ii) Mobile Phone
17.4 6 17.7 (iii) Telephone/ Mobile Phone - Both
Contd...

66
Øe la[;kS. No.
ensaItems
fuf'pr la[;k(Absolute Numbers)
dqyTotal
xzkeh.kRural
'kgjhUrban
1 2 3 4
6 lkbZfdy@LdqVj 1,022,199 34,983 987,216
7 eksVj lkbZfdy@ekSsiSM
1,298,383 30,444 1,267,939
8 dkj@thi@oSu 692,279 8,562 683,717
9 dksbZ Hkh mYys[k ugha
97,368 4,172 93,196
dqy ifjokjksa dh la[;k
3,340,538 79,115 3,261,423
1-30 ifjokjksa )kjk mi;ksfxr cSfdax lsok;sa ¼tux.kuk&2011½1-30 ifjokjksa )kjk mi;ksfxr cSfdax lsok;sa ¼tux.kuk&2011½
dqyTotal
xzkeh.kRural
'kgjhUrban
1 2 3 4
ifjokjksa )kjk mi;ksfxr cSfdax lsok;sa
2,595,302 58,179 2,537,123

67
izfr'kr Percentage
Øe la[;kS. No.
ensaItems
dqyTotal
xzkeh.kRural
'kgjhUrban
5 6 7 1
30.6 44.2 30.3 6 Bicycle/ Scooter
38.9 38.5 38.9 7 Motorcycle/ Moped
20.7 10.8 21.0 8 Car/ Jeep/ Van
2.9 5.3 2.9 9 None of the specifi ed assets
100.0 100.0 100.0 Total number of households
1.30 Households availing banking services (Census-2011)
dqyTotal
xzkeh.kRural
'kgjhUrban
ensaItems
5 6 7 1
77.7 73.5 77.8 Households availing banking services

68
1-31 x`g jfgr tula[;k ] tux.kuk 2011 ds vuqlkj1-31 x`g jfgr tula[;k ] tux.kuk 2011 ds vuqlkj1.31 Houseless Population as per population census - 2011
ensa dqy iq:"k efgyk ItemTotal Male Female
1 2 3 4 5 11 ifjokjksa dh la[;k dqy/Total 23175 1 No. of Households
'kgjh /Urban 23078
xzkeh.k/Rural 972 dqy x`gjfgr
tula[;kdqy/Total 47076 37836 9240 2 Total Houseless
Population
'kgjh/Urban 46724 37630 9094
xzkeh.k/Rural 352 206 1463 x`gjfgr tula[;k
(0 - 6) vk;q oxZ dqy/Total 3594 1809 1785 3 Houseless
Population (0-6 age group)
'kgjh/Urban 3527 1774 1753
xzkeh.k/Rural 67 35 324 vuqlwfpr tkfr
x`gjfgr tula[;kdqy/Total 6346 4644 1702 4 SC Houseless
Population
'kgjh/Urban 6278 4608 1670
xzkeh.k/Rural 68 36 32
5 lk{kj dqy/Total 20059 17666 2393 5 Literates
'kgjh/Urban 19931 17568 2363
xzkeh.k/Rural 128 98 306 dqy Jfed 34561 31807 2754 6 Total Workersi) [ksfrgj 80 74 6 (i) Cultivatorsii) Ñf"k laca/h Jfed 152 132 20 (ii) Agricultural
labourersiii) ifjokj m|ksx Jfed 501 360 141 (iii) Household
Industry Workersiv) vU; Jfed 29521 27405 2116 (iv) Other Workersv) eq[; Jfed 30254 27971 2283 (v) Main Workersvi) lhekUr Jfed 4307 3836 471 (vi) Marginal Workersvii) fcuk dk;Z Jfed 12515 6029 6486 (vii) Non Workers
lzksr % tux.kuk funs'kky;] fnYyhASource : Directorate of Census Operations, Delhi.

69
1-32 Hkkjr esa jkT;ksa vuqlkj edkuksa dh deh &20121-32 Hkkjr esa jkT;ksa vuqlkj edkuksa dh deh &20121.32 HOUSING SHORTAGE IN INDIA BY STATES - 2012
nl yk[k esa (in Million)
jkT;@la?k jkT;
edkuksa dh dehHousing shortage State/UTdqyTotal
1 3 1vka/zk izns'k 1.27 Andhra Pradesh
v:.kkpy izns'k 0.03 Arunachal Pradesh
vklke 0.28 Assam
fcgkj 1.19 Bihar
NÙkhlx<+ 0.35 Chattisgarh
xqtjkr 0.99 Gujarat
xksok 0.06 Goa
gfj;k.kk 0.42 Haryana
fgekpy izns'k 0.04 Himachal Pradesh
tEew o d'ehj 0.13 Jammu & Kashmir
>kj[kaM 0.63 Jharkhand
dukZVd 1.02 Karnataka
dsjy 0.54 Kerala
eè; izns'k 1.10 Madhya Pradesh
egkjk"Vª 1.94 Maharashtra
ef.kiqj 0.08 Manipur
es?kky; 0.03 Meghalaya
fetksje 0.02 MizoramContd...

70
edkuksa dh dehedkuksa dh dehHousing Shortage
jkT;@ la?k jkT; dqyTotal
State/UT
1 2 1
ukxkySaM 0.21 Nagaland
mM+hlk 0.41 Orissa
iatkc 0.39 Punjab
jktLFkku 1.15 Rajasthan
flfDde 0.01 Sikkim
rfeyukMq 1.25 Tamil Nadu
f=iqjk 0.03 Tripura
mÙkj izns'k 3.07 Uttar Pradesh
mÙkjkapy 0.16 Uttaranchal
if'pe caxky 1.33 West Bengal
vaMeku & fudksckj 0.00 A & N Islands
paMhx<+ 0.02 Chandigarh
nknj vkSj ukxj gosyh 0.05 Dadra & Nagar Haveli
neu o nho 0.01 Daman & Diu
fnYyh 0.49 Delhi
y{k}hi 0.01 Lakshadweep
ikafMpsjh 0.07 Pondicherry
leLr Hkkjr 18.78 All IndiaNote : These estimates have been arrived at by utilizing the data released by RGI on the basis of Census of India, 2001lzksr %jk"Vªh; Hkou laxBuASource : National Buildings Organisation

71
1-33 vkf[kjh fuokl LFkku ds vuqlkj izoklh & 20011-33 vkf[kjh fuokl LFkku ds vuqlkj izoklh & 20011.33 MIGRANTS BY PLACE OF LAST RESIDENCE - 2001
¼nl yk[k esa½@(in Million)
vkf[kjh fuoklvkf[kjh fuokl dh gSfl;r
dqy izoklhTotal Migrants Last
ResidenceStatus of last residence
iq:"kMale
efgykFemale
dqyTotal
1 2 3 4 5 1Hkkjr&dqy izoklh 93.36 221.18 314.54 India-Total
MigrantsHkkjr esa vkf[kjh fuokl
xzkeh.k@Rural 50.59 172.84 223.42 Last residence in India
'kgjh@Urban 21.05 28.51 49.56
dqy@Total 90.68 218.71 309.39
x.kuk jkT; ds vUnj
xzkeh.k@Rural 38.56 158.50 197.06 Within the State of enumeration
'kgjh@Urban 15.08 21.84 36.92
dqy@Total 71.58 196.64 268.22
Hkkjr jkT; ds vUnj
xzkeh.k@Rural 12.03 14.33 26.36 States in India beyond the State of Enumeration
'kgjh@Urban 5.97 6.67 12.64
x.kuk jkT; ds ikj
dqy@Total 19.10 22.07 41.17
lzksr % Hkkjr ds egkjftLVªkjSource : Registrar General of India

72
1-34 fnYyh esa izoklh tula[;k1-34 fnYyh esa izoklh tula[;kTable 1.34 Migrant Population in Delhi (Census-2001)
Øla. Description fooj.kA Total in Migrants dqy izoklh
Male (in %) iq:"k ¼izfr'kr esa½Females (in %) efgyk ¼izfr'kr esa½
B Reasons for migration (in%) izokl dk dkj.k ¼izfr'kr esa½Work/employment jkstxkjBusiness dkjksckjEducation f'k{kkMarriage fookgMoved after birth tUe ds ckn tkukMoved with household ifjokj lfgr tkukOther vU;
C Duration of residence at the vkoklh dh vof/k x.kuk LFkku ijplace of enumeration (in %)Less than 1 year 1 o"kZ ls de1-4 years 1&4 o"kZ5-9 years 5&9 o"kZ10-19 years 10&19 o"kZ20+years 20 ls ÅijDuration not stated vof/k ugha crkbZ xbZ
lzksr % Hkkjr ds egkjftLVªkj

73
1-34 fnYyh esa izoklh tula[;k1-34 fnYyh esa izoklh tula[;kTable 1.34 Migrant Population in Delhi (Census-2001)
¼nl yk[k esa½1991 2001 2011*
3723462 6014458 766395553.8 55.5 51.8
46.2 44.5 48.229.1 33.4 28.0
4.4 0.7 0.81.4 1.4 1.7
19.0 15.3 18.4- 2.1 4.8
38.3 33.7 34.87.8 13.4 11.5
3.8 2.6 4.321.5 18.4 16.419.8 18.2 17.426.5 27.5 61.9**26.8 26.8 -1.6 6.6 NA
*provisional **10+yearSource : Registrar General of India

74
1-35 fnYyh esa Hkk"kk ds vk/kkj ij tula[;k dk fooj.k 1-35 fnYyh esa Hkk"kk ds vk/kkj ij tula[;k dk fooj.k1991
Language Male Female Total %ageHkk"kk iq:"k L=h dqy izfr'krvklkeh 1713 1017 2730 0.03
caxkyh 65929 56009 121938 1.30
cksMks 0 0 0 0.00
Mksxjh 0 0 0 0.00
xqtjkrh 13958 12774 26732 0.28
fgUnh 4232327 3458304 7690631 81.83
dUuM 5391 4532 9923 0.11
d'kehjh 6024 5336 11360 0.12
dksudoh 1231 1287 2518 0.03
eSFkhyh 0 0 0 0.00
ey;kye 35207 29745 64952 0.69
euhiqj 160 61 221 0.00
ejkBh 11097 9296 20393 0.22
uSikyh 17414 8976 26390 0.28
mfj;k 8687 4412 13099 0.14
iatkch 386004 362141 748145 7.96
laLd`r 409 178 587 0.01
laFkkyh 0 0 0 0.00
flU/kh 18835 18546 37381 0.40
rfey 45210 39663 84873 0.90
rsyxq 12460 10422 22882 0.24
ÅnqZ 281333 231657 512990 5.46
;ksx 5143389 4254356 9397745 100.00
lzksr % Hkkjr ds egkjftLVªkj

75
1.35 Distribution of Population by Scheduled Languages in Delhi(Census-2001)
2001Language Male Female Total %ageHkk"kk iq:"k L=h dqy izfr'krAssamese 3873 2456 6329 0.05Bengali 115111 93303 208414 1.51Bodo 154 68 222 0.00Dogri 4192 2782 6974 0.05Gujrati 23324 21821 45145 0.33Hindi 6186251 5024592 11210843 81.13Kannade 5554 4971 10525 0.08Kashmiri 11204 10121 21325 0.15Konkani 847 920 1767 0.01Maithali 54589 30742 85331 0.62Malayalam 45954 46035 92009 0.67Manipur 1210 810 2020 0.01Marathi 14416 12056 26472 0.19Nepali 27997 16370 44367 0.32Oriya 18349 10829 29178 0.21Punjabi 509052 479928 988980 7.16Sanskrit 193 95 288 0.00Santali 225 139 364 0.00Sindhi 21576 21265 42841 0.31Tamil 47939 44487 92426 0.67Telgu 14902 13165 28067 0.20Urdu 483117 391216 874333 6.33Total 7590029 6228191 13818220 100.00Source : Registrar General of India

76
2-1 fnYyh 2-1 fnYyh v/s v/s Hkkjr ds ldy ?kjsyw mRikn dk rqyukRed fooj.kHkkjr ds ldy ?kjsyw mRikn dk rqyukRed fooj.k
ubZ J`a[kyk 2011&12
ekStwn dherksa ij
Item 2011-12(R) 2012-13(R) 2013-14(R)
th,lMhih@ldy ?kjsyw mRikn yk[k #i;s esa
Delhi All India
34376664873632900
39123843994401300
443782791123352200
fiNys lky ds eqdkcys % ifjorZu
Delhi All India
13.8113.8
13.4313.0
,u,lMhih@,uMhih yk[k :i;s esa
Delhi All India
31461916781915400
35725090888310800
404663911003754700
fiNys lky ds eqdkcys % ifjorZu
DelhiAll India
13.5513.6
13.2713.0
izfr O;fDr :- esa # Delhi All India
18534363462
20650370983
22951879118
fiNys lky ds eqdkcys % ifjorZu
Delhi All India
11.4211.9
11.1511.5
Note : R:- Revised Estimates, 1st RE:- First Revised Estimates, AE:- Advance Estimates#:- Population Projected and Supplied by CSO, on the basis of 2011 Census

77
2.1 COMPARATIVE STATEMENT OF SDP OF DELHI v/s ALL INDIA
New Series: 2011-12At Current Prices
2014-15 (1st RE)
2015-16(1st RE)
2016-17(AE)
Item
492424221244512800
551963411368203500
622384641518370900
DelhiAll India
GSDP/GDP In Rs. Lakh
10.9610.8
12.099.9
12.7611.0
DelhiAll India
% change over previous year
447435091110119100
501104031223666200
565655011359781100
DelhiAll India
NSDP/NDP In Rs. Lakh
10.5710.6
11.9910.2
12.8811.1
DelhiAll India
% change over previous year
24900486454
27361894130
303073103219
DelhiAll India
Per Capita Income In Rs. #
8.499.3
9.898.9
10.769.7
DelhiAll India
% change over previous year

78
2-2 fnYyh 2-2 fnYyh v/s v/s Hkkjr ds ldy ?kjsyw mRikn dk rqyukRed fooj.kHkkjr ds ldy ?kjsyw mRikn dk rqyukRed fooj.k
ubZ J`a[kyk 2011&12
fLFkj ewY;ksa ijItem 2011-12(R) 2012-13(R) 2013-14(R)
th,lMhih@ldy ?kjsyw mRikn yk[k #i;s esa
DelhiAll India
34376664873632900
36653809921301700
39171787980137000
fiNys lky ds eqdkcys % ifjorZu
DelhiAll India
6.625.5
6.876.4
,u,lMhih@,uMhih yk[k :i;s esa
DelhiAll India
31461916781915400
33410302820235600
35533700870076000
fiNys lky ds eqdkcys % ifjorZu
DelhiAll India
6.194.9
6.366.1
izfr O;fDr vk; :- esa #
DelhiAll India
18534363462
19312365538
20154168572
fiNys lky ds eqdkcys % ifjorZu
DelhiAll India
4.203.3
4.364.6
Note : R:- Revised Estimates, 1st RE:- First Revised Estimates, AE:- Advance Estimates #:- Population Projected and Supplied by CSO, on the basis of 2011 Census

79
2.2 COMPARATIVE STATEMENT OF SDP OF DELHI v/s ALL INDIA
New Series: 2011-12At Constant Prices
2014-15 (1st RE)
2015-16(1st RE)
2016-17(AE)
Item
422919921053698400
460216631138100200
498216881218985400
DelhiAll India
GSDP/GDP In Rs. Lakh
7.977.5
8.828.0
8.267.1
DelhiAll India
% change over previous year
38210333935626000
414964321011680900
448528841084191700
DelhiAll India
NSDP/NDP In Rs. Lakh
7.537.5
8.608.1
8.097.2
DelhiAll India
% change over previous year
21264672862
22658377803
24031882269
DelhiAll India
Per Capita Income In Rs. #
5.516.3
6.556.8
6.065.7
DelhiAll India
% change over previous year

80
2-3 th ,l oh , vkSj th ,l Mh ih vkfFkZd xfrfof/kvksa ds vuqlkj2-3 th ,l oh , vkSj th ,l Mh ih vkfFkZd xfrfof/kvksa ds vuqlkj¼orZeku ewY;ksa ij½
¼vk/kkj o"kZ 2011&12½ ¼:- yk[k esa½
Ø-la- m|ksx 2011-12(R) 2012-13(R) 2013-14(R)
1 2 3 41. Ñf"k] okfudh vkSj eRL; ikyu 285471 257046 255884
1.1 Qlysa 65772 72448 748521.2 i'kq /ku 217867 182767 1791351.3 okfudh vkSj yVªBk cukuk 1007 991 9501.4 eRL;u vkSj tyh; Ñf"k 826 840 9472 [kuu ,oa mR[kuu 772879 746562 1015528
izkFkfedizkFkfed 1058350 1003608 12714123. fofuekZ.k 1890728 2334979 25337694. fctyh] xSl vkSj ty vkiwfrZ vkSj
vU; mi;ksfxrk lsok,a
410538 728273 909613
5. fuekZ.k 1666852 1786576 1982965ek/;fedek/;fed 3968117 4849828 5426347
6. O;kikj] gksVy vkSj jsLVksjsaV 4212068 4905111 56531956.1 O;kikj vkSj ejEer lsok,a 3806351 4458194 51709226.2 gksVy vkSj jsLVksjsaV 405718 446917 4822737. ifjogu] HkaMkj.k vkSj lapkj 3929455 4534332 49975337.1 jsyos 190731 207226 2586977.2 lM+d ifjogu 664297 718643 7134937.3 ty ifjogu 546 597 5417.4 ok;q ifjogu 98961 178752 1466077.5 ifjogu ds fy, vkdfLed lsok 2368549 2748292 30593017.6 HkaMkj.k 21247 24271 276677.7 lapkj ,oa izlkj.k ls lacaf/kr lsok,a 585124 656551 791227

81
2.3 GSVA AND GSDP BY ECONOMIC ACTIVITY(at Current Prices)
(Base year 2011-12) (Rs. in lakh)2014-15
(1st RE)2015-16(1st RE)
2016-17(AE)
Sector
5 6 7 1250568 339032 407746 1. Agriculture, Forestry &
Fishing64959 103388 108376 1.1 Crops
183770 233615 297333 1.2 Livestock861 1000 1053 1.3 Forestry & Logging978 1029 983 1.4 Fishing
963777 1084338 1167318 2 Mining & Quarrying1214345 1423370 1575064 PRIMARY 2749307 3630007 4568863 3. Manufacturing971255 1176605 1309075 4. Electricity, Gas & Water
Supply & Other Utility Services
2048788 2116833 2186958 5. Construction5769350 6923445 8064896 SECONDARY 5896633 6105266 6357232 6. Trade, Hotels & Restaurants5359605 5525480 5729645 6.1 Trade & Repair Services537028 579786 627587 6.2 Hotel & Restaurants
5597141 6047627 6549455 7. Transport, Storage & Communication
293836 307520 336670 7.1 Railways718343 722346 726279 7.2 Road transport
574 607 639 7.3 Water transport420460 444250 537371 7.4 Air Transport
3259417 3584423 3867212 7.5 Services incidental to transport
29922 36012 40992 7.6 Storage874588 952470 1040291 7.7 Communication & Services
related to broadcastingContd...

82
2-3 th ,l oh , vkSj th ,l Mh ih vkfFkZd xfrfof/k ds vuqlkj2-3 th ,l oh , vkSj th ,l Mh ih vkfFkZd xfrfof/k ds vuqlkj¼orZeku ewY;ksa ij½
¼vkèkkj o"kZ 2011&12½ ¼:- yk[k esa½
Ø-la- m|ksx 2011-12(R) 2012-13(R) 2013-14(R)
1 2 3 4
8. foÙkh; lsok,a 5388295 5992774 6449101
9. fj;y ,LVsV] edkuksa vkSj O;kolkf;d lsokvksa dk LokfeRo
7248036 8242110 9618416
10. lkoZtfud iz'kklu 1957156 1802787 1876644
11. vU; lsok,a 2558685 2913283 3282734
r`rh;dr`rh;d 25293696 28390396 31877623
dqy ldy jkT; ewY;oèkZu cqfu;knh ewY;ksa ij tksM+k
30320163 34243833 38575381
mRikn dj 4442090 5380588 6308016
mRikn lfClMh 385589 500578 505118
cktkj ewY;ksa ij ldy jkT; ?kjsyw mRikn
34376664 39123843 44378279
tula[;k ¼^00 esa½ 169750 17300 176310
izfr O;fDr ldy jkT; ?kjsyw mRikn ¼:- esa½
202513 226149 251706
Source : Directorate of Economics & Statistics, Govt. of NCT of Delhi.

83
2.3 GSVA AND GSDP BY ECONOMIC ACTIVITY
(at Current Prices)
(Base year 2011-12) (Rs. in lakh)2014-15
(1st RE)2015-16(1st RE)
2016-17(AE)
Sector
5 6 7 16974870 7516907 8058944 8. Financial Services
11733335 13454970 16199181 9. Real estate, ownership of dwellings & professional services
2008191 2219503 2424599 10. Public Administration3829385 4392490 5108606 11. Other Services
36039554 39736762 44698016 TERTIARY
43023249 48083578 54337976 TOTAL GROSS STATE VALUE ADDED At Basic Prices
6611719 7686011 8700135 Product Taxes
392546 573248 799647 Product Subsidies
49242422 55196341 62238464 GROSS STATE DOMESTIC PRODUCT At Market Prices
179690 183140 186640 Population ( in '00)274041 301389 333468 Per Capita GSDP ( In Rs.)

84
2-4 th ,l oh , vkSj th ,l Mh ih vkfFkZd xfrfof/kvksa ds vuqlkj2-4 th ,l oh , vkSj th ,l Mh ih vkfFkZd xfrfof/kvksa ds vuqlkj¼fLFkj ewY;ksa ij½
¼vk/kkj o"kZ 2011&12½ ¼:- yk[k esa½Ø-la- m|ksx 2011-12(R) 2012-13(R) 2013-14(R)
1 2 3 41. d`f"k] okfudh vkSj eRL;
ikyu
285471 222388 199538
1.1 Qlysa 65772 59709 462061.2 i'kq /ku 217867 161035 1517771.3 okfudh vkSj yVªBk cukuk 1007 874 7961.4 eRL;u vkSj tyh; d`f"k 826 771 7602 [kuu ,oa mR[kuu 772879 699057 919949
izkFkfedizkFkfed 1058350 921445 11194873. fofuekZ.k 1890728 2224419 23151864. fctyh] xSl vkSj ty vkiwfrZ
vkSj vU; mi;kfxrk lsoka,
410538 676895 805878
5. fuekZ.k 1666852 1631439 1680482ekè;fedekè;fed 3968117 4532753 4801546
6. O;kikj] gksVy vkSj jsLVksjsaV 4212068 4569446 49717226.1 O;kikj vkSj ejEer lsok,a 3806351 4153115 45474826.2 gksVy vkSj jsLVksjsaV 405718 416331 4242407. ifjogu] HkaMkj.k vkSj lapkj 3929455 4330167 46022567.1 jsyos 190731 207113 2401997.2 lM+d ifjogu 664297 685246 6581567.3 ty ifjogu 546 569 4997.4 ok;q ifjogu 98961 170445 1352367.5 ifjogu ds fy, vkdfLed
lsok
2368549 2620571 2822029
7.6 HkaMkj.k 21247 22608 243227.7 lapkj ,oa izlkj.k ls lacafèkr
lsok,a
585124 623615 721815

85
2.4 GSVA AND GSDP BY ECONOMIC ACTIVITY(at Constant Prices)
(Base year 2011-12) (Rs. in lakh)2014-15
(1st RE)2015-16(1st RE)
2016-17(AE)
Sector
5 6 7 1187767 225989 228911 1. Agriculture, Forestry &
Fishing32618 47841 48412 1.1 Crops
153677 176561 178990 1.2 Livestock719 795 796 1.3 Forestry & Logging753 793 713 1.4 Fishing
923303 1157339 1239378 2 Mining & Quarrying1111070 1383328 1468289 PRIMARY 2452498 3151066 3857622 3. Manufacturing823318 949163 1006701 4. Electricity, Gas & Water
Supply & Other Utility Services
1656381 1599656 1562491 5. Construction4932196 5699884 6426814 SECONDARY 5087436 5403666 5453595 6. Trade, Hotels & Restaurants4623870 4890212 4914837 6.1 Trade & Repair Services463566 513453 538757 6.2 Hotel & Restaurants
5217753 5545616 5943519 7. Transport, Storage & Communication
254541 254538 264869 7.1 Railways674728 667709 666450 7.2 Road transport
539 561 587 7.3 Water transport394932 410648 493103 7.4 Air Transport
3061517 3313305 3548637 7.5 Services incidental to transport
25795 31841 35114 7.6 Storage805701 867014 934760 7.7 Communication & Services
related to broadcasting
Contd...

86
2-4 th ,l oh , vkSj th ,l Mh ih vkfFkZd xfrfof/k ds vuqlkj2-4 th ,l oh , vkSj th ,l Mh ih vkfFkZd xfrfof/k ds vuqlkj¼fLFkj ewY;ksa ij½
¼vk/kkj o"kZ 2011&12½ ¼:- yk[k esa½
Ø-la- m|ksx 2011-12(R) 2012-13(R) 2013-14(R)
1 2 3 4
8. foÙkh; lsok,a 5388295 5913960 6226900
9. fj;y ,LVsV] edkuksa vkSj O;kolkf;d lsokvksa dk LokfeRo
7248036 7514915 8027163
10. lkoZtfud ç'kklu 1957156 1662655 1604585
11. vU; lsok,a 2558685 2656329 2740075
r`rh;dr`rh;d 25293696 26647472 28172701
dqy ldy jkT; ewY;o/kZu cqfu;knh ewY;ksa ij tksM+k
30320163 32101671 34093733
mRikn dj 4442090 4980914 5477571
mRikn lfClMh 385589 428775 399518
cktkj ewY;ksa ij ldy jkT; ?kjsyw mRikn
34376664 36653809 39171787
tula[;k ¼^00 esa½ 169750 173000 176310
izfr O;fDr ldy jkT; ?kjsyw mRikn ¼:- esa½
202513 211872 222176
Source : Directorate of Economics & Statistics, Govt. of NCT of Delhi.

87
2.4 GSVA AND GSDP BY ECONOMIC ACTIVITY(at Constant Prices)
(Base year 2011-12) (Rs. in lakh)
2014-15 (1st RE)
2015-16(1st RE)
2016-17(AE)
Sector
5 6 7 1
6668652 7003808 7410028 8. Financial Services
9301071 9888912 11178354 9. Real estate, ownership of dwellings & professional services
1636761 1701629 1761405 10. Public Administration
3036561 3229458 3526659 11. Other Services
30948233 32773089 35273559 TERTIARY
36991499 39856301 43168662 TOTAL GROSS STATE VALUE ADDED At Basic Prices
5598440 6543263 7112032 Product Taxes
297947 377900 459006 Product Subsidies
42291992 46021663 49821688 GROSS STATE DOMESTIC PRODUCT At Market Prices
179690 183140 186640 Population ( in '00)
235361 251292 266940 Per Capita GSDP (In Rs.)

88
2-5 ,u ,l oh , vkSj ,u ,l Mh ih vkfFkZd xfrfof/k;ksa ds vuqlkj2-5 ,u ,l oh , vkSj ,u ,l Mh ih vkfFkZd xfrfof/k;ksa ds vuqlkj¼orZeku ewY;ksa ij½
¼vk/kkj o"kZ 2011&12½ ¼:- yk[k esa½Ø-la- m|ksx 2011-12(R) 2012-13(R) 2013-14(R)
1 2 3 41. d`f"k] okfudh vkSj eRL;
ikyu
279741 251156 249254
1.1 Qlysa 62548 68703 703771.2 i'kq /ku 215469 180727 1770911.3 okfudh vkSj yVªBk cukuk 996 980 9391.4 eRL;u vkSj tyh; d`f"k 729 746 8472 [kuu ,oa mR[kuu 679588 655963 869632
izkFkfedizkFkfed 959329 907119 11188863. fofuekZ.k 1591119 2008472 22059904. fctyh] xSl vkSj ty vkiwfrZ
vkSj vU; mi;ksfxrk lsok,a
261284 468119 590676
5. fuekZ.k 1588185 1692371 1862414ek/;fedek/;fed 3440587 4168962 4659080
6. O;kikj] gksVy vkSj jsLVksjsaV 3927832 4559580 52446336.1 O;kikj vkSj ejEer lsok,a 3554473 4148003 47999556.2 gksVj vkSj jsLVksjsaV 373360 411577 4446787. ifjogu] HkaMkj.k vkSj lapkj 3411161 3870730 42270227.1 jsyos 168156 180221 2177107.2 lM+d ifjogu 621827 674917 6713217.3 ty ifjogu 354 357 3017.4 ok;q ifjogu 26337 100553 716247.5 ifjogu ds fy, vkdfLed
lsok
2099967 2353731 2646588
7.6 HkaMkj.k 18189 21015 234027.7 lapkj ,oa izlkj.k ls lacafèkr
lsok,a
476331 539936 596076

89
2.5 NSVA AND NSDP BY ECONOMIC ACTIVITY(at Current Prices)
(Base year 2011-12) (Rs. in lakh)2014-15
(1st RE)2015-16(1st RE)
2016-17(AE)
Sector
5 6 7 1243327 331180 399283 1. Agriculture, Forestry &
Fishing59913 97771 102188 1.1 Crops
181682 231483 295157 1.2 Livestock851 991 1045 1.3 Forestry & Logging881 935 892 1.4 Fishing
812711 928102 1005912 2 Mining & Quarrying1056038 1259282 1405195 PRIMARY 2412264 3283700 4213292 3. Manufacturing614937 782906 877995 4. Electricity, Gas & Water
Supply & Other Utility Services
1924484 1988776 2055148 5. Construction4951685 6055382 7146435 SECONDARY 5441535 5603632 5809062 6. Trade, Hotels & Restaurants4946896 5071029 5233452 6.1 Trade & Repair Services494639 532603 575610 6.2 Hotel & Restaurants
4602337 4828530 5106065 7. Transport, Storage & Communication
249803 260441 286545 7.1 Railways677547 682926 688235 7.2 Road transport
364 427 489 7.3 Water transport336646 351605 435895 7.4 Air Transport
2712294 2902890 3051269 7.5 Services incidental to transport
25012 30457 34792 7.6 Storage600670 599785 608839 7.7 Communication & Services
related to broadcasting
Contd...

90
2-5 ,u ,l oh , vkSj ,u ,l Mh ih vkfFkZd xfrfof/k;ksa ds vuqlkj2-5 ,u ,l oh , vkSj ,u ,l Mh ih vkfFkZd xfrfof/k;ksa ds vuqlkj¼orZeku ewY;ksa ij½
¼vk/kkj o"kZ 2011&12½ ¼:- yk[k esa½
Ø-la- m|ksx 2011-12(R) 2012-13(R) 2013-14(R)
1 2 3 4
8. foÙkh; lsok,a 5303210 5886620 6341724
9. fj;y ,LVsV] edkuksa vkSj O;kolkf;d lsokvksa dk LokfeRo
6659468 7525305 8743460
10. lkoZtfud iz'kklu 1512284 1403545 1471370
11. vU; lsok,a 2191543 2523219 2857319
r`rh;dr`rh;d 23005499 25768998 28885528
dqy 'kq) jkT; ewY;oèkZu cqfu;knh ewY;ksa ij tksM+k
27405415 30845080 34663493
mRikn dj 4442090 5380588 6308016
mRikn lfClMh 385589 500578 505118
cktkj ewY; ij 'kq) jkT; ?kjsyw mRikn
31461916 35725090 40466391
tula[;k ¼^00 esa½ 169750 173000 176310
izfr O;fDr ,u,lMhih ¼:- esa½ 185343 206503 229518
Source : Directorate of Economics & Statistics, Govt. of NCT of Delhi.

91
2.5 NSVA AND NSDP BY ECONOMIC ACTIVITY(at Current Prices)
(Base year 2011-12) (Rs. in lakh)
2014-15 (1st RE)
2015-16(1st RE)
2016-17(AE)
Sector
5 6 7 1
6850021 7374586 7899151 8. Financial Services
10650525 12164306 14700663 9. Real estate, ownership of dwellings & professional services
1597862 1804119 2004160 10. Public Administration
3374334 3907803 4594283 11. Other Services
32516613 35682975 40113383 TERTIARY
38524336 42997640 48665013 TOTAL NET STATE VALUE ADDED At Basic Prices
6611719 7686011 8700135 Product Taxes
392546 573248 799647 Product Subsidies
44743509 50110403 56565501 NET STATE DOMESTIC PRODUCT At Market Prices
179690 183140 186640 Population ( in '00)
249004 273618 303073 Per Capita NSDP ( In Rs.)Note : R- Revised Estimates, 1st RE- First Revised Estimates, AE- Advance Estimates

92
2-6 ,u ,l oh , vkSj ,u ,l Mh ih vkfFkZd xfrfof/kvksa ds vuqlkj2-6 ,u ,l oh , vkSj ,u ,l Mh ih vkfFkZd xfrfof/kvksa ds vuqlkj¼fLFkj ewY;ksa ij½
¼vk/kkj o"kZ 2011&12½ ¼:- yk[k esa½
Ø-la- m|ksx 2011-12(R) 2012-13(R) 2013-14(R)1 2 3 41. d`f"k] okfudh vkSj eRL; ikyu 279741 216922 1937851.1 Qlysa 62548 56232 423631.2 i'kq /ku 215469 159145 1499651.3 okfudh vkSj yVªBk cukuk 996 864 7861.4 eRL;u vkSj tyh; d`f"k 729 682 6722 [kuu ,oa mR[kuu 679588 612799 786334
izkFkfedizkFkfed 959329 829721 9801193. fofuekZ.k 1591119 1912978 20133184. fctyh] xSl vkSj ty vkiwfrZ
vkSj vU; mi;ksfxrk lsok,a
261284 426152 506724
5. fuekZ.k 1588185 1541563 1567047ek/;fedek/;fed 3440587 3880693 4087089
6. O;kikj] gksVy vkSj jsLVksjsaV 3927832 4243878 45998096.1 O;kikj vkSj ejEer lsok,a 3554473 3861022 42100506.2 gksVy vkSj jsLVksjsaV 373360 382856 3897597. ifjogu] HkaMkj.k vkSj lapkj 3411161 3692034 38728517.1 jsyos 168156 181788 2027917.2 lM+d ifjogu 621827 643392 6191317.3 ty ifjogu 354 338 2767.4 ok;q ifjogu 26337 95338 655677.5 ifjogu ds fy, vkdfLed lsok 2099967 2241915 24334547.6 HkaMkj.k 18189 19538 204477.7 lapkj ,oa izlkj.k esa lacafèkr
lsok,a
476331 509725 531185

93
2.6 NSVA AND NSDP BY ECONOMIC ACTIVITY(at Constant Prices)
(Base year 2011-12) (Rs. in lakh)2014-15
(1st RE)2015-16(1st RE)
2016-17(AE)
Sector
5 6 7 1181779 219765 222452 1. Agriculture, Forestry &
Fishing28518 43484 43798 1.1 Crops
151879 174777 177220 1.2 Livestock709 786 788 1.3 Forestry & Logging672 719 646 1.4 Fishing
789718 1023784 1105853 2 Mining & Quarrying971496 1243549 1328305 PRIMARY
2149012 2845962 3550900 3. Manufacturing495702 593085 622161 4. Electricity, Gas & Water
Supply & Other Utility Services
1543010 1486349 1449248 5. Construction4187723 4925395 5622309 SECONDARY 4684446 4969599 4988451 6. Trade, Hotels & Restaurants4258646 4497196 4494029 6.1 Trade & Repair Services425800 472402 494421 6.2 Hotel & Restaurants
4297412 4434339 4641306 7. Transport, Storage & Communication
215181 213226 221605 7.1 Railways637517 632312 632867 7.2 Road transport
346 398 454 7.3 Water transport318129 326711 402032 7.4 Air Transport
2560133 2699112 2821635 7.5 Services incidental to transport
21479 27084 29916 7.6 Storage544627 535496 532798 7.7 Communication & Services
related to broadcasting

94
2-6 ,u ,l oh , vkSj ,u ,l Mh ih vkfFkZd xfrfof/k ds vuqlkj2-6 ,u ,l oh , vkSj ,u ,l Mh ih vkfFkZd xfrfof/k ds vuqlkj¼fLFkj ewY;ksa ij½
¼vk/kkj o"kZ 2011&12½ ¼:- yk[k esa½
Ø-la- m|ksx 2011-12(R) 2012-13(R)
2013-14(R)
1 2 3 4
8. foÙkh; lsok,a 5303210 5811046 6124735
9. fj;y ,LVsV edkuksa vkSj O;kolkf;d lsokvksa dk LokfeRo
6659468 6837023 7217877
10. lkoZtfud ç'kklu 1512284 1279003 1226588
11. vU; lsok,a 2191543 2284765 2346579
r`rh;dr`rh;d 23005499 24147749 25388439
dqy 'kq) jkT; ewY;oèkZu cqfu;knh ewY;ksa ij tksM+k
27405415 28858164 30455646
mRikn dj 4442090 4980914 5477571
mRikn lfClMh 385589 428775 399518
cktkj ewY; ij 'kq) jkT; ?kjsyw mRikn 31461916 33410302 35533700
tula[;k ¼^00 esa½ 169750 173000 176310
izfr O;fDr ,u,lMhih ¼:- esa½ 185343 193123 201541
Source : Directorate of Economics & Statistics, Govt. of NCT of Delhi.

95
2.6 NSVA AND NSDP BY ECONOMIC ACTIVITY(at Constant Prices)
(Base year 2011-12) (Rs. in lakh)2014-15
(1st RE)2015-16(1st RE)
2016-17(AE)
Sector
5 6 7 1
6552839 6874347 7266919 8. Financial Services
8326346 8748748 9872751 9. Real estate, ownership of dwellings & professional services
1262932 1331968 1395912 10. Public Administration
2626646 2803124 3083906 11. Other Services
27750620 29162125 31249244 TERTIARY
32909840 35331069 38199858 TOTAL NET STATE VALUE ADDED At Basic Prices
5598440 6543263 7112032 Product Taxes
297947 377900 459006 Product Subsidies
38210333 41496432 44852884 NET STATE DOMESTIC PRODUCT At Market Prices
179690 183140 186640 Population ( in '00)
212646 226583 240318 Per Capita NSDP ( In Rs.)Note : R- Revised Estimates, 1st RE- First Revised Estimates, AE- Advance Estimates

96
2-7 leLr Hkkjr] jkT;ksa rFkk la?k jkT;ksa dh izfr O;fDr ,u,lMhih2-7 leLr Hkkjr] jkT;ksa rFkk la?k jkT;ksa dh izfr O;fDr ,u,lMhih¼izpkfyr Hkkoksa ij½
¼:i;ksa esa½
jkT;@la?k 'kkflr 2011-12 2012-13 2013-14
1 2 3 4
1- vU/kz izns'k 69000 74687 82870
2- v:.kkpy izns'k 73068 81353 91809
3- vle× 41142 44599 49734
4- fcgkj 21750 24487 26948
5- NÙkhlx<+ 55177 60849 69839
6- xksvk 259444 234354 215776
7- xqtjkr 87481 102826 113139
8- gfj;k.kk 106085 121269 138300
9- fgekpy izns'k 87721 99730 114095
10- tEew vkSj d'ehj 53173 56834 61108
11- >kj[kaM 41254 47360 50006
12- dukZVd 90263 102319 118829
13- dsjy 97912 110314 123388
14- e/; izns'k 38550 44931 51897
15- egkjk"Vª 99173 111542 124724
16- ef.kiqj 39762 41246 47852
17- es?kky; 60013 64036 65118

97
2.7 PER CAPITA NSDP OF STATES, UNION TERRITORIES AND ALL INDIA(At Current Prices)
(In Rupees)2014-15 2015-16 2016-17 States/UT
5 6 7 1
93699 108163 122376 1. Andhra Pradesh
110793 122466 NA 2. Arunachal Pradesh
52895 60526 NA 3. Assam
28671 31454 35590 4. Bihar
78001 84767 91772 5. Chhattisgarh
289185 327059 NA 6. Goa
127017 141504 NA 7. Gujarat
148485 162034 180174 8. Haryana
123532 134376 146073 9. Himachal Pradesh
61185 74653 NA 10 Jammu & Kashmir
57301 59628 64823 11. Jharkhand
129823 142906 157474 12. Karnataka
135537 147190 NA 13. Kerala
56182 62334 72599 14. Madhya Pradesh
132341 147399 NA 15. Maharashtra
53187 55603 NA 16. Manipur
64638 70693 NA 17. Meghalaya

98
¼:i;ksa esa½jkT;@la?k 'kkflr 2011-12 2012-13 2013-14
1 2 3 4
18- fetksjke 57654 65013 77581
19- ukxkySaM 53010 61225 71510
20- mM+hlk 47632 53900 59468
21- iatkc 85577 94318 103831
22- jktLFkku * 57391 63775 69018
23- flfDde * 158667 174183 194624
24- rfeyukMq 92984 105031 116329
25- rsyaxkuk 91121 101007 112162
26- f=iqjk 47079 52434 61570
27- mÙkj izns'k 32002 35812 40124
28- mÙkjk[kaM 100305 113610 126247
29- if'pe caxky - - -
jkT; la?k30- vaMeku fudksckj 88183 96032 106413
31- p.Mhx<+ 159116 183039 205492
32- fnYyh 185343 206503 229518
33- ikafMpsjh 119649 130548 148147
leLr Hkkjr 63462 70983 79118Source: For Sl. No. 1-33-- Directorate of Economics & Statistics of respective State Governments, and for All India-- Central Statistics Offi ce.Note 1 : The estimates of West Bengal for new series with base year 2011-12 compiled by the DES, West Bengal are under examination.Note 2 : *Provisional

99
(In Rupees)2014-15 2015-16 2016-17 States/UT
5 6 7 1103049 114524 NA 18. Mizoram78367 83621 NA 19. Nagaland64869 68293 75223 20. Odisha
108897 119261 128821 21. Punjab75201 82325 NA 22. Rajasthan *
214148 233954 257182 23. Sikkim *128385 137837 153263 24. Tamil Nadu124058 137955 155612 25. Telangana71666 NA NA 26. Tripura42267 46299 51920 27. Uttar Pradesh
135881 146826 160795 28. Uttarakhand- - - 29. West Bengal
U.T.s119312 124361 NA 30. A & N Island211313 229976 NA 31. Chandigarh249004 273618 303073 32. Delhi146921 157871 173687 33. Puducherry86454 94130 103219 All India Per Capita NNI
As on 23.08.2017

100
2-8 leLr Hkkjr] jkT;ksa rFkk la?k jkT;ksa dh izfr O;fDr ,u,lMhih2-8 leLr Hkkjr] jkT;ksa rFkk la?k jkT;ksa dh izfr O;fDr ,u,lMhih2011&12 ds fLFkj Hkkoksa ij
¼:i;ksa esa½
jkT;@la?k 'kkflr 2011-12 2012-13 2013-14
1 2 3 4
1- vU/kz izns'k 69000 68865 72254
2- v:.kkpy izns'k 73068 72820 77044
3- vle× 41142 41609 43002
4- fcgkj 21750 22201 22776
5- NÙkhlx<+ 55177 56761 61293
6- xksvk 259444 220019 188358
7- xqtjkr 87481 96683 102589
8- gfj;k.kk 106085 111648 119522
9- fgekpy izns'k 87721 92672 98974
10- tEew vkSj d'ehj 53173 52413 54066
11- >kj[kaM 41254 44176 43779
12- dukZVd 90263 94417 101918
13- dsjy 97912 103551 107846
14- e/; izns'k 38550 41257 42654
15- egkjk"Vª 99173 103426 109364
16- ef.kiqj 39762 38927 41445
17- es?kky; 60013 59703 58681

101
2.8 PER CAPITA NSDP OF STATES, UNION TERRITORIES AND ALL INDIA
At Constant (2011-12) Prices(In Rupees)
2014-15 2015-16 2016-17 States/UT
5 6 7 1
78039 86118 95566 1. Andhra Pradesh
87966 100387 NA 2. Arunachal Pradesh
44809 48465 NA 3. Assam
23223 24572 26693 4. Bihar
64841 67185 71214 5. Chhattisgarh
241081 267329 NA 6. Goa
111370 122502 NA 7. Gujarat
124302 133591 143211 8. Haryana
105146 114478 121843 9. Himachal Pradesh
52576 60171 NA 10 Jammu & Kashmir
48781 50817 54201 11. Jharkhand
106245 113506 120403 12. Karnataka
112444 119763 NA 13. Kerala
44110 46783 51852 14. Madhya Pradesh
113629 121514 NA 15. Maharashtra
44101 45652 NA 16. Manipur
55936 59949 NA 17. Meghalaya
Contd...

102
¼:i;ksa esa½jkT;@la?k 'kkflr 2011-12 2012-13 2013-141 2 3 418- fetksjke 57654 60261 67591
19- ukxkySaM 53010 55482 58619
20- mM+hlk 47632 49543 52551
21- iatkc 85577 88915 93238
22- jktLFkku* 57391 58526 60315
23- flfDde* 158667 160553 168897
24- rfeyukMq 92984 96937 101591
25- rsyaxkuk 91121 92577 95692
26- f=iqjk 47079 50366 54429
27- mÙkj izns'k 32002 32908 34044
28- mÙkjk[kaM 100305 106318 112803
29- if'pe caxky - - -
jkT; la?k30- vaMeku fudksckj 88183 90070 94575
31- p.Mhx<+ 159116 172063 183400
32- fnYyh 185343 193123 201541
33- ikafMpsjh 119649 119196 129127
leLr Hkkjr 63462 65538 68572Source: For Sl. No. 1-33-- Directorate of Economics & Statistics of respective State Governments, and for All India-- Central Statistics Offi ce.Note 1 : The estimates of West Bengal for new series with base year 2011-12 compiled by the DES, West Bengal are under examination.Note 2 : *Provisional

103
(In Rupees)2014-15 2015-16 2016-17 States/UT
5 6 7 185056 91985 NA 18. Mizoram60372 61363 NA 19. Nagaland54926 57616 61678 20. Odisha95546 99372 103726 21. Punjab63123 66342 NA 22. Rajasthan*
180675 193569 205112 23. Sikkim*106186 111454 118915 24. Tamil Nadu101119 108788 118684 25. Telangana58888 NA NA 26. Tripura34583 36883 39028 27. Uttar Pradesh
118788 126562 133534 28. Uttarakhand- - - 29. West Bengal
U.T.s100760 107873 NA 30. A & N Island183734 195448 NA 31. Chandigarh212646 226583 240318 32. Delhi117102 127284 135110 33. Puducherry72862 77803 82269 ALL INDIA
As on 23.08.2017

104
III. tyok;q ,oa o"kkZ3-1 fnYyh esa o"kkZ
2015
lkekU; o"kkZ o"kkZ ds dqy o"kkZ
eklfeyh&ehVj fnuksa dh la[;k feyh&ehVj esa
Normal Rainfall in mms
No.of Rainy Days
Total Rainfall in mms
1 2 3 4
tuojh 21.7 4 24.1
Qjojh 18.0 0 1.8
ekpZ 15.9 6 97.4
vizSy 12.2 2 27.7
ebZ 19.7 0 3.1
twu 65.5 4 61.7
tqykbZ 210.6 10 235.2
vXkLr 247.7 9 181.6
flrEcj 125.1 1 22.0
vDVwcj 28.0 0 0.4
uoEcj 5.6 0 1.1
fnlEcj 9.0 0 0.0
uksV % o"kkZ dk fnu gS tc o"kkZ ,d fnu esa 2-5 ,e,e ;k vf/kd o"kkZ gks Alzksr % izknsf'kd ekSle dsUnz ubZ fnYyhA

105
III. CLIMATE AND RAINFALL3.1. Rainfall in Delhi
2016
lkekU; o"kkZ feyh&ehVj
o"kkZ ds fnuksa dh la[;k
dqy o"kkZ feyh& ehVj esa Month
Normal Rainfall in mms
No.of Rainy Days
Total Rainfall in mms.
5 6 7
21.7 0 0.0 January
18.0 0 1.3 February
15.9 3 32.0 March
12.2 0 0.0 April
19.7 4 24.3 May
65.5 3 34.5 June
210.6 15 292.5 July
247.7 10 122.7 August
125.1 3 75.0 September
28.0 0 2.0 October
5.6 0 0.0 November
9.0 0 0.0 December
Note: Rainy day is when rain fall is 2.5 MM or more in a day.Source:Regional Meteorological Centre, New Delhi.

106
III. tyok;q ,oa o"kkZ3-2 fnYyh esa rkieku ,oa vknzZrk ¼ubZ fnYyh dsUnz½
rkieku% fMxzh lsaVhxzsM esa 2015
rkiekuTemperature
vkSSSlr vfèkdre vkSSSlr U;wure vuqikfrd vknzZrk %Relative Humidity %
ekl Mean Max. Mean Min. 8:30 IST 17:30 IST
1 2 3 4 5
tuojh 17.9 8.2 93 69
Qjojh 25.9 12.2 87 54
ekpZ 28.2 15.3 83 56
vizSy 34.5 20.9 69 41
ebZ 40.9 25.8 46 29
twu 38.6 26.4 63 46
tqykbZ 34.7 26.0 79 67
vXkLr 34.6 26.8 81 68
flrEcj 36.1 26.0 69 47
vDVwcj 34.4 20.7 73 51
uoEcj 28.8 14.6 83 60
fnlEcj 23.0 9.0 90 63
lzksr % izknsf'kd ekSle dsUnz ubZ fnYyhA

107
III. CLIMATE AND RAINFALL3.2 Temperature and Humidity in Delhi (New Delhi Centre)
Temperature: Degree in Centigrade2016rkieku
Temperature
vkSSSlr vf/kdre vkSSSlr U;wure vuqikfrd vknzZrk %Relative Humidity %
Mean Max. Mean Min. 8:30 IST 17:30 IST Month6 7 8 9 1
21.6 9.1 96 70 January25.7 10.9 86 49 February31.5 17.3 76 45 March38.0 23.4 46 23 April40.1 26.8 52 36 May39.5 28.7 65 47 June34.5 27.2 83 75 July34.5 26.8 83 72 August35.0 25.7 76 57 September34.2 20.6 72 50 October29.7 12.9 79 54 November27.1 9.4 93 65 December
Source : Regional Meteorological Centre, New Delhi.

108
IV. tUe ,oa e`R;q leadtUe ,oa e`R;q lead4-1 fnYyh esa iathd`r tUe ,oa fofHkUu dkj.kksa ls e`R;q
fooj.k 2009 2010 2011 2012
1 2 3 4 51 tUe
thfor tUe 354482 359463 353759 360473
e`r tUe 1244 2140 3045 3642
2 fofHkUu dkj.kksa ls e`R;q ¼fpfdRlk }kjk izkekf.kr vkSj vU; izdkj ls½
gStk 73 192 199 498
pSpd 0 0 0 0
iSfpl o vfrlkj 121 120 143 222
okll cU/kh jksx 5328 7525 8590 7513
pksV 3866 5088 2898 2979
vU; dkj.k 102625 111428 100312 93404
dqy e`R;q 112013 124353 112142 104616
iq:"k 70075 78092 69732 64608
L=h 41938 46261 42410 40008
vU; *
lzksr % eq[; iathdkj] tUe ,oa e`R;q] jk"Vªh; jkt/kkuh {ks=] fnYyh ljdkjA

109
IV. VITAL STATISTICS4.1 Births Registered and Deaths due to Various Causes in Delhi
2013 2014 2015 2016 Description6 7 8 9 1
1.Births370000 373693 374012 379161 Live-Birth
3517 3102 3175 2977 Still-Birth2. Death due to Various causes (Medically certifi ed or otherwise)
676 427 283 247 Cholera0 0 0 0 Small Pox
97 150 160 208 Dysentery and Diarrhoea
5986 5516 6502 9149 Respiratory Diseases2972 3291 3136 3570 Injuries
87454 111902 114435 128458 Other Causes97185 121286 124516 141632 Total Deaths60447 75404 76421 87704 Male36738 45882 48095 53887 Female
- - - 41 Others*Note : * Others Includes transgender/ambiguous/not statedSource : Offi ce of Chief Registrar, Births & Deaths, Govt. of NCT of Delhi.

110
IV. tUe ,oa e`R;q leadtUe ,oa e`R;q lead4-2 fnYyh esa tUe] e`R;q o f'k'kqvksa dh e`R;q nj
o"kZYear
*tUe nj izfr lglz tula[;k ijBirth rate per ’000
Population
e`R;q nj izfr lglz tula[;k ij
Death rate per ’000 Population
f'k'kqvksa dh e`R;q nj izfr lglz thfor
tUe ijInfant Mortality rate per ’000 Live Births
1 2 3 4
1997 23.95 5.90 25.95
1998 22.71 6.43 31.30
1999 22.15 6.06 23.18
2000 23.58 5.93 23.29
2001 21.23 5.81 23.93
2002 21.18 6.05 16.27
2003 20.78 6.07 17.42
2004 20.72 5.76 13.08
2005 21.52 6.24 12.89
2006 21.05 6.45 18.05
lzksr % eq[; iathdj.k tUe ,oa e`R;q jk"Vªh; jkt/kkuh {ks= fnYyh ljdkjA* Revised w.e.f. 2001 based on estimated mid year population as per census 2011

111
IV. VITAL STATISTICS4.2 Birth, Death & Infant Mortality Rates in Delhi
o"kZYear
*tUe nj izfr lglz tula[;k ijBirth rate per ’000
Population
e`R;q nj izfr lglz tula[;k ij
Death rate per ’000 Population
f'k'kqvksa dh e`R;q nj izfr lglz thfor
tUe ijInfant Mortality rate per ’000 Live Births
1 2 3 4
2007 20.58 6.46 25.44
2008 20.94 6.77 18.38
2009 21.77 6.89 18.96
2010 21.66 7.48 22.47
2011 20.89 6.63 21.91
2012 20.90 6.10 23.94
2013 21.07 5.52 22.37
2014 20.88 6.77 21.66
2015 20.50 6.82 23.25
2016 20.38 7.61 21.35
Source : Ofi ce of Chief Registrar, Births & Deaths, Govt. of NCT of Delhi.*Revised w.e.f. 2001 based on estimated mid year population as per census 2011

112
V. d`f"k ,oa i'kq/kud`f"k ,oa i'kq/ku5-1 flapkbZ ds lk/ku rFkk flafpr {ks=Qy
¼gsDVs;j esa½
flapkbZ ds lk/ku 2012-2013
2013-2014
2014-2015
2015-2016
2016-2017(E)
Source ofIrrigation
1 2 3 4 5 6 1
1- ugjsa 2225 2225 2225 2218 2240 1 Canals
2- rkykc — — — — 2 Tanks
3- dq,a 19561 19561 19561 19533 19727 3 Wells
¼d½ uy dqi@dq,a
18586 18586 18586 18571 18752 (a) Tubewells/ Wells
¼[k½ vU; lk/ku 975 975 975 962 975 (b) Other Sources
4- 'kq) flafpr {ks=Qy ¼1$2$3½
21786 21786 21786 21751 21967 4 Net Area Irrigated
(E)= vuqekfurlzksr % la;qDr funs'kd ¼d`f"k½] jk"Vªh; jkt/kkuh {ks=] fnYyh ljdkjA

113
V. AGRICULTURE & LIVESTOCK5.1 Sources of Irrigation and Irrigated Area
(In Hectares)
flapkbZ ds lk/ku
2012-2013
2013-2014
2014-2015
2015-2016
2016-2017(E)
Source of Irrigation
1 2 3 4 5 6 1
5- ,d ckj ls vfèkd Qly ds vUrxZr flafpr {ks=Qy
7875 7875 7900 7678 7756 5 Area Irrigated under more than one crop
6- dqy flafpr {ks=Qy ¼4$5½
29661 29661 29661 29429 29723 6 Gross Area Irrigated
Note ;-(E)=EstimatedSource : Joint Director, Agriculture, Govt. of NCT of Delhi.

114
V. d`f"k ,oa i'kq/kud`f"k ,oa i'kq/ku5-2 fnYyh esa Hkwfe dk mi;ksx
¼gsDVs;j esa½
oxhZdj.k 2012-2013 2013-2014 2014-2015
1 2 3 4
1- xzkeh.k dkxtksa ds vuqlkj {ks=Qy ¼ou {ks= NksM+ dj½
147488 147488 147488
2- d`f"k ds fy, vuqiyC/k Hkwfe 91058 92701 92701
¼d½ vd`f"k dk;ks± esa iz;qDr Hkwfe 75054 76218 76218
¼[k½ catj rFkk vd`"; Hkwfe 16004 16482 16482
3- vU; vd`"; Hkwfe&ijrh Hkwfe ds vfrfjDr
11144 11124 11124
¼d½ LFkk;h pjkxkg vkSj vU; pjus ;ksX; Hkwfe
61 61 61
¼[k½ fofo/k o`{k&'kL;ksa vkSj miouksa okyh Hkwfe tks cqokbZ fd;s x;s 'kq) {ks=Qy esa lfefyr ugha gSA
1190 1170 1170
¼x½ d`f"k ;ksX; O;FkZ iM+h Hkwfe 9893 9893 9893
(E)= vuqekfur

115
V. AGRICULTURE & LIVESTOCK5.2 Utilisation of Land in Delhi
(In Hectares)
2015-2016 2016-2017 2017-2018(E) Classifi cation
5 6 7 1
147488 147488 147488 1 Area according to Village Papers (Excluding Forest Area)
92701 92701 92701 2 Area not available forCultivation
76218 76218 76218 (a) Land put to Non-agricultural Uses
16482 16482 16482 (b) Barren UncultivableLand
11124 11124 11124 3 Other Uncultivated land excluding fallow Land
61 61 61 (a) Permanent Pasturesand Other Grazingland
1170 1170 1170 (b) Land under Misc.Treecrops andgroves not included in net area sown.
9893 9893 9893 (c) Cultivable waste landNote ;-(E)=Estimated Contd...

116
¼gsDVs;j esa½
oxhZdj.k 2012-2013 2013-2014 2014-2015
1 2 3 4
4- ijrh Hkwfe 19230 19225 19225
5- 'kq) cks;k x;k {ks=Qy 23118 23150 23150
6- ,d ckj ls vf/kd cks;k x;k {ks=Qy
12060 11590 11590
7- dqy cks;k x;k {ks=Qy 35178 34312 34312
8- ou
¼d½ fnYyh fodkl izkf/kdj.k ds varZxr ou {ks=
1281 1281 1281
¼[k½ uksfVQkbM fjt {ks= 7784 7784 7784
¼x½ ou foHkkx ds varZxr ou {ks=] fjt {ks= dks NksM+dj
388 388 388
lzksr % la;qDr funs'kd ¼d`f"k½] jk"Vªh; jkt/kuh {ks=] fnYyh ljdkj

117
(In Hectares)2015-2016 2016-2017 2017-2018(E) Classifi cation
5 6 7 119225 19225 19225 4 Fallow land
23150 23150 23150 5 Net area sown
11600 11600 11600 6 Area sown more than once
34312 34750 34750 7 Total Cropped Area
8 Forest
1281 1281 1281 (a) Forest area under
D.D.A.
7784 7784 7784 (b) Notifi ed Ridges Area
388 388 388 (c) Under Forest Deptt.
Forest area,Except Ridge area
E=EstimatedSource :Joint Director, Agriculture, Govt. of NCT of Delhi.

118
5.2 (a) Division-Wise Forest Cover in Delhi-2015
2015 Unit: Sq. Km.
Forest Division
Revenue District Geographical Area
Forest Cover
Percentage of Geo. Area
South Forest Division
Central Delhi 25 5.14 20.56
New Delhi 35 17.25 49.29
South Delhi 250 82.14 32.86
North Forest Division
East Delhi 64 3.28 5.13
North-East Delhi 60 3.97 6.62
North Delhi 59 4.53 7.68
West Forest Division
North-West Delhi 440 17.04 3.87
South-West Delhi 421 48.60 11.54
West Delhi 129 6.82 5.29
Total 1483 188.77 12.73
Source:District wise Forest Cover of Delhi -India State of Forest Report-2015, MoEF & CC, G.O.I, Dehradun

119
5.2 (b) Forest and Tree Cover
S. No. Assessment Year
Forest and Tree Cover ( In Sq. Km.)
Percentage of Geo. Area
1 1995 26 1.75
2 1997 26 1.75
3 1999 88 5.93
4 2001 151 10.20
5 2003 268 18.07
6 2005 283 19.09
7 2009 299.58 20.20
8 2011 296.20 19.97
9 2013 297.81 20.08
10 2015 299.77 20.22
Source: Forest Survey of India, MoEF, G.O.I

120
V. d`f"k ,oa i'kq/kud`f"k ,oa i'kq/kuV. AGRICULTURE & LIVESTOCK
5-3 fnYyh esa pquh gqbZ Qlyksa ds vUrxZr {ks=Qy5.3 Area Under Selected Crops in Delhi
(In Hectares)
Qlysa 2013-2014 2014-2015 2015-2016 2016-2017(E) Crops
1 2 3 4 5 1
xsagw 19450 19360 19050 19622 Wheat
tkS 65 64 62 68 Barley
ckt+jk 1519 1520 1482 1487 Bajra
eDdk 37 35 34 34 Maize
Tokj 3319 3242 3161 3193 Jowar
/kku 6068 6035 5884 5973 Paddy
puk 44 41 25 25 Gram
vkyw 689 436 Potatoes
xUUkk 3 - - Sugar cane
dqy {ks=Qy
31194 30733 29698 30402 Total Foodgrain
lzksr % la;qDr funs'kd ¼d`f"k½] jk"Vªh; jkt/kkuh {ks= fnYyh ljdkjASource : Joint Director, (Agriculture), Govt. of NCT of Delhi.(E)=vuqekfur

121
V. d`f"k ,oa i'kq/kud`f"k ,oa i'kq/kuV. AGRICULTURE & LIVESTOCK
5-4 fnYyh esa pquh gqbZ Qlyksa dk mRiknu5.4 Production of Selected Crops in Delhi
(Metric Ton)
Qlysa 2013-2014 2014-2015 2015-2016 2016-2017(E) Crops
1 2 3 4 5 1
xsagw 86498 85558 83419 87182 Wheat
tkS 183 186 181 184 Barley
ckt+jk 3815 3817 3256 3278 Bajra
eDdk 828 783 174 174 Maize
Tokj 30082 NA 3034 3065 Jowar
/kku 29652 25904 25256 25891 Paddy
puk 62 54 53 53 Gram
vU; nkys
53 NA NA NA Other Pulses
vkyw 14652 9273 NA NA Potatoes
xUuk 226 NA NA NA Sugar cane (In terms of Gur)
dqy [kk|ku
166026 128688 115373 119827 Total Foodgrain
lzksr % la;qDr funs'kd ¼d`f"k½] jk"Vªh; jkt/kkuh {ks= fnYyh Source : Joint Director, (Agriculture), Govt. of NCT of Delhi.Note : (E)=Estimated

122
V. d`f"k ,oa i'kq/kud`f"k ,oa i'kq/ku5-5 fnYyh esa izeq[k Qlyksa dk vkSlr mRiknu
¼fdyksxzke izfr gsDVs;j½
Qlysa 2009-2010 2010-2011 2011-2012 2012-2013*
1 2 3 4 5
xsgwa 4340 4350 4340 4360
tkS 2810 2816 2985 2828
ckt+jk 1875 1878 1872 1878
eDdk 2158 2200 2050 1950
Tokj 960 965 965 966
/kku 4180 4250 4180 4322
puk 1450 1450 1323 1477
vkyw 15890 15890 17360 16448
xUuk 75235 75235 75235 75235
(E)= vuqekfurlzksr % la;qDr funs'kd ¼d`f"k½] jk"Vªh; jktèkkuh {ks=] fnYyh ljdkjA

123
V. AGRICULTURE & LIVESTOCK5.5 Average Yield of Principal Crops in Delhi
(Kg. per Hectare)
2013-2014 2014-2015 2015-2016 2016-2017(E) Crops
6 7 8 9 1
5232 4419 4379 4443 Wheat
2828 2906 2919 2706 Barley
1878 2513 2197 2190 Bajra
1950 2237 5118 5118 Maize
966 906 960 960 Jowar
4322 4292 4292 4335 Paddy
1477 1317 2120 2120 Gram
16448 NA NA NA Potatoes
75235 NA NA NA Sugar cane
(E)=EstimatedSource : Joint Director, (Agriculture), Govt. of NCT of Delhi.

124
V. d`f"k ,oa i'kq/kud`f"k ,oa i'kq/ku5-6 fnYyh esa eq[; Qlyksa ds vUrxZr flafpr {ks=Qy
¼gsDVs;j esa½
Qlysa 2009-2010 2010-2011 2011-2012 2012-2013
1 2 3 4 5
1- [kk|ku Qlysa
xsgwa 28512 20136 18927 19450
tkS 42 45 45 47
cktjk 31 31 31 29
eDdk 44 40 38 37
Tokj 3280 3341 3140 3319
/kku 6821 6848 7248 6860
puk 30 8 10 13
2- O;kikfjd Qlysa
xUuk 3 3 NA 3
frygu 595 1000 1000 950
3- pkjk 1039 1050 1050 1045
(E) = vuqekfurlzksr % la;qDr funs'kd ¼d`f"k½ jk"Vªh; jkt/kkuh {ks=] fnYyh ljdkj

125
V. AGRICULTURE & LIVESTOCK5.6 Area Irrigated under Principal Crops in Delhi
(In Hectares)
2013-2014 2014-2015 2015-2016 2016-2017(E) Crops
6 7 8 9 1
1 Food Crops
19878 19360 19050 19622 Wheat
47 64 62 68 Barley
29 N.A N.A N.A Bajra
37 35 N.A N.A Maize
3319 3242 3161 3193 Jowar
6860 6035 5884 5973 Paddy
13 41 25 25 Gram
2 Commercial Crops
3 NA NA NA Sugarcane
950 NA NA NA Oil seeds
1045 NA NA NA 3 Fodder
(E)=EstimatedSource : Joint Director (Agriculture) Govt. of NCT of Delhi.

126
V. d`f"k ,oa i'kq/kud`f"k ,oa i'kq/ku5-7 fnYyh esa Ø;&foØ; ds pje le; ij pquh gqbZ d`f"k oLrqvksa ds
mRiknd ds vkSlr ewY;
¼:i;ksa esa izfr fDoaVy½
oLrq 2011-2012 2012-2013 2013-2014
1 2 3 4
xsgwa ¼ebZ o twu½ 1280 1450 1600
puk ¼15 vizSy ls 31 ebZ½ 3600 3800 3900
tkS ¼vizSy o ebZ½ 1500 1500 1500
ckt+kjk ¼uoEcj o fnlEcj½ 1300 1450 1450
eDdk ¼uoEcj½ 1600 1600 1600
Tokj ¼uoEcj½ 1500 1800 1800
/kku ¼uoEcj o fnlEcj½ 1950 2200 2200
vkyw ¼tuojh o Qjojh½ 1400 1500 2000
xUuk ¼xqM+½ ¼15 fnlEcj ls 15 Qjojh rd½
3200 3200 3600
(E)= vuqekfurlzksr % la;qDr funs'kd ¼d`f"k½ jk"Vªh; jkt/kkuh {ks=] fnYyh ljdkj

127
V.AGRICULTURE & LIVESTOCK5.7 Producer’s Average Price of Selected Agricultural Commodities
during Peak Marketing Period
(In Rs. per Quintal)
2014-2015 2015-2016 2016-2017(E) Commodity
5 6 7 11450 1525 1625 Wheat (May & June)3175 5000 5500 Gram (15th April to
31stMay)
1150 1450 1500 Barley (April & May)1500 1650 1650 Bajra (November &
December)1650 1720 1545 Maize (November)1850 1750 1645 Jowar (November)2000 1450 2500 Paddy (November &
December)1800 NA NA Potatoes (January &
February)NA NA NA Sugarcane (Gur) (15th
December to 15thFebruary)
(E)=EstimatedSource :Joint Director, (Agriculture) Govt. of NCT of Delhi

128
V. d`f"k ,oa i'kq/kud`f"k ,oa i'kq/kuV. AGRICULTURE & LIVESTOCK
5-8 fnYyh esa moZjd dk forj.k5.8 Distribution of Fertilizer in Delhi
(M. Tons)
moZjd 2012-2013
2013-2014
2014-2015
2015-2016
2016-2017(E)
Fertilizer
1 2 3 4 5 6 1
ukbZVªksftul 1862 1862 4180 5641 7566 Nitrogenous
QkLQfVd 1052 1052 1870 2502 316 Phosphatic
iksVkfld 358 358 1220 1220 NA Potassic
;ksx 3272 3272 7270 9363 7882 Total
jalyt [kkn NA NA NA NA NA Sludgmanure
fdVuk'kd 52 52 NA NA NA Pesticides
lzksr % la;qDr funs'kd ¼d`f"k½ jk"Vªh; jkt/kkuh {ks=] fnYyh ljdkjSource :Joint Director (Agriculture), Govt. of NCT of Delhi.(E)= vuqekfur

129
V. d`f"k ,oa i'kq/kud`f"k ,oa i'kq/kuV. AGRICULTURE & LIVESTOCK
5-9 fnYyh esa i'kq&x.kuk ds vuqlkj i'kq/ku5.9 Cattle in Delhi according to Livestock Census
fooj.k 1997 2003 2007 2012 Description1 2 3 4 5 6 11 xks/ku 1 Cattle
(Exotic/ crossbreed/ Indigenous)
¼v½ rhu o"kZ ls vf/kd vk;q ds lkaM@cSy
(A) Male over 3 yrs.
¼d½ i'kq mRifÙk ds fy,
813 681 336 356 (a) For Breeding
¼[k½ dsoy dke ds fy;s
1982 424 460 424 (b) For Work only
¼x½ vU; 361 297 (c) Others
;ksx 2795 1105 1157 1077 Total
¼c½ rhu o"kZ ls vf/kd vk;q dh xk;
(B) Female over 3 years
¼d½ nw/k ns jgh 51277 47108 50865 47690 (a) In Milk
¼[k½ vnqgkrh xk;sa 6346 7181 9396 8432 (b) Dry cows
Contd...

130
fooj.k 1997 2003 2007 2012 Description1 2 3 4 5 1
¼x½ ftUgksaus ,d ckj Hkh cPpk ugha fn;k
735 883 1316 2064 (c) Not yet calved
¼?k½ ¼vU;½ 1125 3029 (d) Others
;ksx 58358 55172 62702 62292 Total
cNM+s cNfM+;ka 34507 35312 43871 24141 Young Stock
xks/kudk ;ksx 95660 91589 107730 86433 Total Cattle2. HkSals 2 Buffaloes
¼v½ rhu o"kZ ls vf/kd vk;q okys >ksVs
(A) Male 0-over 3 years
¼d½ i'kq mRifÙk ds fy,
815 917 1625 798 (a) For Breeding
¼[k½ i'kq mRifÙk vkSj dke nksuksa ds fy,
3588 1641 2361 1886 (b) For Breeding and work both
¼x½ vU; 47 -- 841 1036 (c) Others
;ksx 4450 2558 4827 3720 Total
¼c½ HkSal rhu o"kZ ls vf/kd vk;q okyh
(B) Buffaloes 0-over Female 3 years
¼d½ nw/k ns jgh 111549 126785 135032 83279 (a) In Milk

131
fooj.k 1997 2003 2007 2012 Description
1 2 3 4 5 1
vnwgkrh HkSals 12527 12389 21494 11974 Dry Buffaloes
ftUgksaus ,d ckj Hkh cPpk ugha fn;k
1587 1333 2188 2042 Not yet calved even
vU; 1514 1362 Others
;ksx 125663 140507 160228 98657 Total
¼[k½ dV~Vs o dfV~V;ka
72941 90045 101571 63485 (a) Young Stock
HkSlksa dk ;ksx 203054 230552 266626 162142 Total Buffaloes
3- HksaMs+ 10674 3377 5896 932 3 Sheep
4- cdfj;ka 25358 16779 21176 30470 4 Goats
5- ?kksM+s o VVw 1131 1353 393 2694 5 Horses and Ponies
6- lqvj 30534 29463 21019 76346 6 Pigs
7- ÅaV 99 76 10 157 7 Camels
8- vU; eos'kh 1611 1589 369 6815 8 Other Livestock
9- i'kq/ku dk ;ksx
368121 374778 423319 365967 9 Total Livestock
10- dqDdqV 1327885 458682 49550 76312 10 Poultry
lzksr % funs'kky; i'kq ikyu] jk"Vªh; jkt/kkuh {ks=] fnYyh ljdkjSource : Directorate of Animal Husbandary, Govt. of NCT of Delhi.The fi gures are published as per 19th Live Census.

132
V. d`f"k ,oa i'kq/kud`f"k ,oa i'kq/ku5-10 fnYyh esa d`f"k ;a=ksa dk iz;ksx] i'kqx.kuk ds vk/kkj ij
fooj.k 1997 2003 Description
1 2 3 1
1- gy 1. Ploughs
¼d½ ydM+h ds 174 246 (a) Wooden
¼[k½ yksgs ds 315 31 (b) Iron
2- leqUur gsjksa rFkk ikVs 854 475 2. Improved Harrows & Cultivators
3- leqUur cht fMªy 3149 3635 3. Improved Seed Drills
4- leqUur daMuh ¼Fkzslj½ 2920 603 4. Improved Threshers
5- *?kwe dj pyus okyh dqV~Vh dkVus dh e'khu
23814 8147 5. *Rotary Chaff Cutter
6- fNM+dus okys ;a= 9048 1278 6. Sprayers & Dusters
7- cSy xkfM+;ka 154 701 7. Carts
*gkFk ls pyus okyh e'khuksa lfgrAlzksr % funs'kd i'kq ikyu] jk"Vªh; jkt/kkuh {ks=] fnYyh ljdkj

133
V. AGRICULTURE & LIVESTOCK5.10 Use of Agriculture Implements in Delhi Based on
Livestock Census
fooj.k 1997 2003 Description
1 2 3 1
8- xUuk isyus dh e'khu 0 7 6 8 Sugarcane Crushers
9- rsy ds batu ¼iEi ds lkFk½ flapkbZ ds fy,
38 816 9 Oil Engines (with pumps) for irrigation purposes
10- fctyh ds iEi flapkbZ ds fy,°
2348 3913 10 Electricpump for irrigation purposes
11 jgV — — 11 11.Rehats(Persian Wheels)
12- VªsDVj 918 2643 12 Tractors
13- ikoj fVylZ 214 223 13 Powers Tillers
14- Qly dkVus dk ;a= — — 14 Harvesters
15- vkyw [kksnus dk ;a= 12 273 15 Potato Digger
Includes Hand Operated Chaff Cutters.Source : Director Animal Husbandary, Govt. of NCT of Delhi.

134
V. d`f"k ,oa i'kq/kud`f"k ,oa i'kq/ku5-11 fnYyh esa i'kq fpfdRlk dh lqfo/kk,a
fooj.k 2009-10 2010-11 2011-12 2012-13
1 2 3 4 5
1- vLirky 45 48 46 46
2- vkS"k/kky; 29 27 28 8
3- fpfdRld* 45 41 40 58
4- fpfdRlr i'kq vUrokZlk rFkk cfgokZlh
406878 483709 415986 391152
5- uiqaldhdj.k 80 275 45 180
6- d`f=e xHkkZ/ku fd;s 6611 6476 1719 13180
7- cka>iu dh fpfdRlk 19692 7837 19527 17144
8- ,p- ,l- Vhds ¼^000½ 124 16 126 265
9- ,Q- ,e- Mh- Vh- ds 155079 361985 228133 329465
10- futh mipkjky; 201 212 NA NA
*dsoy jk"Vªh; jkt/kkuh {ks=] fnYyh 'kklu ds v/khu fpfdRldAlzksr % funs'kd] i'kqikyu] jk"Vªh; jkt/kkuh {ks=] fnYyh ljdkj

135
V. AGRICULTURE & LIVESTOCK5.11. Veterinary Facilities in Delhi
2013-14 2014-15 2015-16 2016-17 Description
6 7 8 9 1
49 49 46 46 1 Hospitals (Including one vety. Poly Clinc)
25 26 26 28 2 Dispensaries58 58 51 55 3 Doctors*
378359 367518 412363 438504 4 Animals treated Indoor/Outdoor
58 NIL NIL NIL 5 Castrations14809 13395 17382 11336 6 Artifi cial
Insemination16027 21906 18165 17209 7 Sterility cases treated
203 185 179 475 8 H.S. Vaccination('000)368000 389625 223504 236189 9 F.M.D. Vacci- nation
NA NA NA NA 10 Private Clinics* Doctors under Govt. of National Capital Territory of Delhi Only.Source : Director, Animal Husbandry, Govt. of NCT of Delhi.P= Provisional

136
V. d`f"k ,oa i'kq/kud`f"k ,oa i'kq/ku5-12 fnYyh nqX/k ;kstuk dh xfrfof/k;ka
fooj.k 2012-2013
2013-2014
2014-2015
2015-2016
2016-2017
Description
1 2 3 4 5 6 1
1- nqX/k fMiks dh la[;k
1239 1056 1087 1198 1192 1 Number of Milk Depots
2- ,df=r fd;k x;k nw/k ¼nSfud vkSlr½ ¼yk[k fdyks½
2.95 1.41 2.56 2.43 2.1 2 Procurement of Milk (Daily average) (In Lakh Kgs.)
3- nw/k dk forj.k ¼nSfud vkSlr½ ¼yk[k yhVj½
3.00 2.76 2.60 2.65 2.84 3 Distribution of Milk ( Daily average) (In Lakh Litres)
4- nw/k fufeZr inkFkks± dk foØ;
4 Sale of by products of milk
lzksr % fnYyh nqX/k ;kstuk] Hkkjr ljdkj] ubZ fnYyhA

137
V. AGRICULTURE & LIVESTOCK5.12 Activities of Delhi Milk Scheme
fooj.k 2012-2013
2013-2014
2014-2015
2015-2016
2016-2017
Description
1 2 3 4 5 6 1
¼d½ eD[ku ¼eh- Vu½
77.70 29.77 47.50 59.85 59.43 (a) Butter (M.Tonns)
¼[k½ ?kh ¼eh- Vu½
693.19 235.01 486.75 498.38 454.12 (b) Ghee (M. Tonns)
¼x½ ;ksx gVZ ¼000½ dqYyM+ 100 ¼fe- fy-½
220 286 360 474 471 (c) Yoghurt ( in '000') (in 100 ml. Kullar)
¼?k½ ,Q- ,y- feYd ¼^000*½ 200 ,e- ,y- iksp@cksry
142 97 86 91 79 (d) Flavoured Milk (in ‘000’) (in 200ml.Pouches/Bottle)
¼M½ ngh dqYyM+ 200 xzke ¼^000*½
246 172 189 224 164 (e) Dahi (in 200 gm. Kullar) (in ‘000’)
¼p½ iuhj&¼eh- Vu½
54.77 57.11 48.43 117.12 109.6 (f) Paneer (M.Tonns)
¼p½ NkN ikmp 200 xzke ¼000½
232 281 346 427 392 (g) Chhaz Pouch 200g (000)
Source : Delhi Milk Scheme, Govt. of India, New Delhi.

138
V. d`f"k ,oa i'kq/kud`f"k ,oa i'kq/ku5-13 enj Msjh dh xfrfof/k;ka
fooj.k bdkbZ/Unit 2012-2013 2013-2014
Øe la[;k 1 2 3 4
1- izpqj ek=k esa nw/k cspus okys cwFk
la[;k No.
1317 1443
2- ikSyh iSd nw/k cspus okyh nqdkusa
,, 16000 16700
3- bUlqysfVM VSad ,, 1591 1517
4- rjy nw/k dh fcØh kl. - 937462
5- ngh dh foØ; mt. 750 7379
6- ?kh dh foØ; mt. 1250 1154
lzksr % enj Msjh fnYyhA

139
V. AGRICULTURE & LIVESTOCK5.13 Activities of Mother Dairy
2014-2015 2015-2016 2016-2017 Description
5 6 7 1
1506 1529 1574 1 Bulk Vending Booths
20000 22000 22700 2 Shops Selling Poly-pack Milk
1500 1430 1394 3 Insulated Tanks
881491 825976 789672 4 Sale of Liquid Milk
32464 35433 41824 5 Sale of Curd
3413* 3073* 3906* 6 Sale of Ghee
Source : Mother Dairy, Delhi.* In kilo litre

140
VI. m|ksxm|ksx/INDUSTRY6-1 fnYyh esa vkS|ksfxdh izxfr
6.1(a) Industrial Progress in DelhiRegistered Micro Small & Medium Enterprises (M.S.M.E.)
ensa 2014 2015 2016 Items1 2 3 4 1
(1) pkyq m|eksa (1) No. of Working
dh la[;k Enterprises(a) mRiknu 1679 4290 10131 (a) Mfg.(b) lsok,¡ 397 1741 9104 (b) Services
;ksx 2076 6031 19235 Total(2) uSV oFkZ dk eqY;
¼yk[k #i;s esa½
(2) Value of Net Worth (Rs. in lac)
(a) mRiknu 46828.27 129381.66 364401.00 (a) Mfg.(b) lsok,¡ 10469.43 36255.43 137459.00 (b) Services
;ksx 57297.70 165637.09 501860.00 Total(3) dqy iw.kZ
mRiknu ¼djksM+ #- esa½
(3) *Total Gross Out Put (Rs. In Crores)
(a) mRiknu 20912.56 22764.00 (a) Mfg.(b) lsok,¡ 6520.98 8545.55 (b) Services
;ksx 27433.54 31309.55 Total(4) jkstxkj ¼O;fDr½ (4) Employment
(person)(a) mRiknu 40960 86626 143917 (a) Mfg.(b) lsok,¡ 20411 59856 148169 (b) Services
;ksx 61371 146482 292086 Totallzksr % m|ksx foHkkx] jk"Vªh; jkt/kkuh {ks=] fnYyh ljdkj Source : Industries Deptt., Govt. of NCT of Delhi.* upto 17/09/2015

141
VI. m|ksxm|ksx/INDUSTRY6-1 fnYyh esa vkS|ksfxdh izxfr
6.1(b) Industrial Progress in DelhiEnterprises by type of Organization
ensa 2014 2015 2016 Items
1 2 3 4 1
(1) ekfydkuk 867 2956 12909 (1) Proprietary
(2) lk>snkjh 389 881 1819 (2) Partnership
(3) fuft dEiuh 558 1795 3889 (3) Private company
(4) ifCyd fye- dEiuh
197 269 231 (4) Public Ltd. Co.
(5) lgdkjh 14 17 18 (5) Co-Operatives
(6) fganw vfHkHkkftr ifjokj
18 55 (6) Hindu Undivided Family
(7) Lo;a lgk;rk lewg
6 88 (7) Self Help Group
(8) vU; 51 89 226 (8) Others
;ksx 2076 6031 19235 Total
lzksr % m|ksx foHkkx] jk"Vªh; jkt/kkuh {ks=] fnYyh ljdkj Source : Industries Deptt., Govt. of NCT of Delhi.

142
VI. m|ksxm|ksx/INDUSTRY6.1 (c) fnYyh esa vkS|ksfxdh izxfr6.1(c) Industrial Progress in Delhi
No. of CETP Installed/Capacity and fl ow of Waste water 2016
S.No. CETP installed (Areas) Capacity(MLD)
1 2 31. Badli Indl. Area 12
2. GT Karnal Road 6
3. Jhilmil 16.8
4. Lawrence Road 12
5. Mangolpuri 2.4
6. Mayapuri 12
7. Nangloi 12
8. Okhla Indl. Area Phse -I & II 24
9. SMA 12
10. Wazirpur 24
11. Naraina 21.6
12. Narela 22.5
13. Bawana 35
lzksr % m|ksx foHkkx] jk"Vªh; jkt/kkuh {ks=] fnYyh ljdkj Source : Industries Deptt., Govt. of NCT of Delhi.

143
VI. m|ksxm|ksx/INDUSTRY6.1 (c) fnYyh esa vkS|ksfxdh izxfr6.1(c) Industrial Progress in Delhi
No. of CETP Installed/Capacity and fl ow of Waste water 2016Flow of waste CETP installedWater (MLD)
4 S.No. 11.0 1. cknyh bafMLVªh;y ,fj;k2.4 2. thVh djuky jksM4.0 3. >hyehy2.0 4. ykjsal jksM1.0 5. eaxksyiqjh2.7 6. ek;kiqjh2.0 7. ukaxyksbZ2.0 8. vkS[kyk bafM- ,fj;k Qsl &1 vkSj 21.5 9. ,l,e,1.2 10. othjiqj9.0 11. ukjk;.kk9.0 12. ujsyk7.0 13. cokuk
Note: CETP: Common Effulent Treatment Plants

144
VI. JeJe6-2 m|ksx&vuqlkj iathd`r dk;Zjr m|ksx dk oxhZdj.k
rFkk muesa dk;Zjr deZpkjh
dkj[kkuksa dh la[;kNo. of Working Factories
oxZ 2014 2015 2016
1 2 3 4
1. [kk| mRikn 330 333 340
2. eknd is; rEckdw rFkk rEckdw mRikn
46 44 44
3. diM+k mRikn 2033 2012 2013
4. ydM+h mRikn rFkk QuhZpj cukuk 265 266 269
5. dkxt rFkk dkxt mRikn 765 771 776
6. peM+k rFkk peZ oL= fcuk ejEer 298 298 300
7. jcM+ IykfLVd isVªksfy;e dksy mRikn
666 666 662
8. dSfedy rFkk dSfedy mRikn fcuk isVªksfy;e dksy
295 291 290
9. vk/kqr [kfut mRikn 82 82 82
10. csfld /kkrq rFkk ,yk; m|ksx 525 523 519
11. /kkrq mRikn e'khujh rFkk ifjogu lkeku e'khu ds vkStkj rFkk fctyh dk lkeku
1913 1890 1890

145
VI. LABOUR6.2 Industry-wise Break-up of registered Factories
and Workers Employed thereinjkstxkj esa yxs vuqekfur deZpkfj;ksa dh la[;k
No. of Estimated Workers Employed
2014 2015 2016 Description5 6 7 1
20316 20500 21316 1. Food Products3214 3074 3134 2. Beverages, Tobacco &
Tobacco products141263 139803 140408 3. Textiles products10317 10356 10541 4. Wood products,
Furniture & Fixtures29816 30050 29997 5. Paper & Paper products
Printing publishing & allied12872 12872 13054 6. Leather & Leather Fur
prod. (except repair)15365 15365 14952 7. Rubber, Plastic, Petroleum
Coal Products11793 11633 11548 8. Chemical & Chemical products
(except Petrol lium & Coal)2426 2426 2426 9. Non-metallic Mineral products8614 8581 8373 10. Basic Metal & Alloy Industry
76427 75508 75215 11. Metal products and PartsMachinery & Transport Equipment-Machine tools including Eletrical appliances

146
VI. JeJe6-2 m|ksx&vuqlkj iathd`r dk;Zjr m|ksx dk oxhZdj.k
rFkk muesa dk;Zjr deZpkjh
dkj[kkuksa dh la[;kNo. of Working Factories
oxZ 2014 2015 2016
1 2 3 4
12. fo|qr] xSal] Hkki] ty dk;Z rFkk bldk forj.k
104 104 109
13. b±/ku] dSfedy] b=] phuh] feV~Vh dk lkeku rFkk 'kh'ks dk Fkksd O;kikj
73 95 91
14. lkoZtfud iz'kklu rFkk lqj{kk lsok,a 9 9 9
15. lSusVh lsok,a 17 17 18
16. ewy lkeku dh ejEer rFkk ejEer lsok,a
540 550 556
17. fofo/k vof.kZr oxZ ¼vU;= vof.kZr½ 1007 1003 1000
dqy 8968 8954 8968
lzksr % Je vk;qDr] jk"Vªh; jkt/kkuh {ks=] fnYyh ljdkj

147
VI. LABOUR6.2 Industry-wise Break-up of registered Factories and
Workers Employed therein
jkstxkj esa yxs vuqekfur deZpkfj;ksa dh la[;k
No. of Estimated Workers Employed
2014 2015 2016 Description5 6 7 1
5935 5935 6065 12. Electricity, Gas and Stream WaterWorks and Supply.
657 855 650 13. Wholesale Trade in Fuel,Chemicals, Perfumery, CeramicsGlass
7655 7655 7655 14. Public Administration andDefence Services
391 391 102 15. Sanitary Services30502 31067 31431 16. Repair of Capital Goods &
Repair Services39364 39207 39966 17. Miscellaneous unspecifi ed
Group
416927 415278 416833 TOTAL
Source : Labour Commissioner, Govt. of NCT of Delhi.

148
VI. m|ksxm|ksx6-3 okf"kZd vkS|ksfxd losZ{k.k&x.kuk $ uewuk lSDVj
ensa 2008-09 2009-10 2010-11
1 2 3 4
1. iathÑr dkj[kkuksa dh la[;k ftuls lwpuk yh
3026 2878 2878
2. mRiknd iwath ¼:- yk[kksa esa½ 641588 990659 1268555
¼d½ vpy iwath 312873 386654 446921
¼[k½ dk;Z'khy iwath 328715 604005 821634
3. leLr deZpkjh 126816 121161 122531
¼d½ dqy Jfed 87752 84408 79036
¼[k½ Jfedksa ds vfrfjDr deZpkjh 39064 36753 43495
4. dke ds Je fnu ¼yk[kksa esa½ 379 363 371
5. dqy osru ¼yk[kksa esa½ 131273 159046 197163
lzksr % vFkZ ,oe~ lkaf[;dh funs'kky;] jk"Vªh; jkt/kkuh {ks=] fnYyh ljdkj

149
VI. INDUSTRY6.3 Annual Survey of Industries—Census + Sample Sector
2011-12 2012-13 2013-14 Items5 6 7 12976 3183 2980 1. Number of Registered
Factories covered under ASI1928990 1879825 1652887 2. Production Capital (Lakh
Rs.)893782 1066080 590341 (a) Fixed Capital
1035209 813745 1072218 (b) Working Capital
118778 126354 115731 3. All Employees76867 81901 76250 (a) Workers41911 44453 39481 (b) Other than Workers
359 376 350 4. Man Days (In Lakhs)226033 257756 248927 5. Total Emoluments
(In Lakh Rs.)Source :— Directorate of Economics & Statistics, Govt. of NCT of Delhi.

150
VI. m|ksx@m|ksx@INDUSTRY6-4 fnYyh esa vkS|ksfxd mRiknuksa dk lwpdkad
6.4 Index of Industrial Production in DelhiO;kid lwpdkad/General Index
o"kZ O;kid lwpdkad fuekZ.k fo|qr
Year General Index Manufacturing Electricity
Weight 1000 586.1 413.9
1 Base Year 2 3 4
2012-13 2011-12=100 116.8 106.4 131.6
2013-14 " 111.1 117.2 102.3
2014-15 " 118.7 108.0 134.0
2015-16 " 106.9 110.2 102.3
2016-17 '' 119.4 119.5 119.2
lzksr % vFkZ ,oe~ lkaf[;dh funs'kky;] jk"Vªh; jkt/kkuh {ks=] fnYyh ljdkjSource : Directorate of Economics & Statistics, Govt. of NCT of Delhi.

151
VII. ÅtkZ ,oa fo|qrÅtkZ ,oa fo|qrVII. ENERGY & ELECTRICITY
7.1 fnYyh esa fo|qr dh mRiknu {kerk7.1 Installed Capacity of Electricity in Delhi
¼fdyksokV esa½(In Kilowat)
vof/k mRiknu {kerk fMjsfVM {kerkPeriod Installed Capacity Derated Capacity
1 2 32001-02 602000 6020002002-03 932000 9320002003-04 932000 9320002004-05 932000 9320002005-06 932000 9320002006-07 932000 9320002007-08 932000 9320002008-09 932000 9320002009-10 932000 9320002010-11 747000 7350002011-12 1059450 10474502012-13 1529050 1517050
2013-14* 2215580 22033942014-15* 2228780 2203094
2015-16** 2931400 28314002016-17*** 2227850 2202350
* Note- As submitted by IPGCL, PPCL, TPDDL & NDMC** As submitted by Delhi SLDC*** As submitted by IPGCL, PPCL, TPDDLSource : Delhi Electricity Regulatory Commission.

152
VII. ÅtkZ ,oa fo|qrÅtkZ ,oa fo|qr7-2 fo|qr dk mRiknu ,oa forj.k
¼nl yk[k bdkbZ½ensa 2009 2010- 2011- 2012-
2010 2011 2012 2013
1 2 3 4 51 mRiknu ,oa Ø; dh gqbZ
fo|qr
¼d½ LFkkuh; mRikn 9425 6921 8007 4970
¼[k½ vU; jkT;ksa ls Ø; 19758 25823 25383 28472
;ksx 29183 32744 33390 334422 mi;ksx dh xbZ fo|qr
¼LFkkuh;½ (a) ?kjsyw dk;ks± esa 8753 9723 10396 10796(b) okf.kfT;d dk;ks± esa* 4741 5074 6253 5569(c) vkS|ksfxd dk;ks± esa* 2991 3008 2989 2979(d) lkoZtfud tyiznk; dk;ks±
rFkk lM+dksa ij jks'kuh esa
404 734 748 870
(e) vU; $ 955 1219 1314 1147
dqy 17844 19758 21700 21361
lzksr % fnYyh fo|qr fofu;ked vk;ksxA

153
VII. ENERGY AND ELECTRICITY7.2 Generation & Distribution of Electricity
(In Million Unit)
2013- 2014- 2015- 2016- Items
2014# 2015# 2016 2017
6 7 8 9 11 Electricity Generated &
Purchased**4723 4763 5941 4013.52 (a) Locally generated
30006 21044 24618 24892.74 (b) Purchased from other State34729 25807 30559 28906.26 Total
2 Electricity consumed (Locally)@
11609 12386 12560 14059.68 (a) Domestic purposes6786 6814 6053 7257.06 (b) Commercial purposes*3064 3068 3135 3088.37 (c) Industrial purposes*838 1007 1027 1097.65 (d) Public Water Work and
Street Lighting1484 1202 1262 1362.39 (e) Others$
23781 24477 24037 26865.15 TotalSource:Delhi Electricity Regulatory Commission.* Commercial and Industrial includes both LT and HT Consumption** Include Long Term Purchases from & outside Delhi# Include BRPL, BYPL, TPDDL, NDMC etc.$ Include Agriculture, Mushroom, DMRC, Advertisement, Railway Traction, Self consumption, Temporary connection Licenses (NDMC & MES) etc.@ As submitted by BRPL, BYPL, TPDDL & NDMC

154
VII. ÅtkZ ,oa fo|qrÅtkZ ,oa fo|qr7-3 fo|qr miHkksDrkvksa dh la[;k ¼oxkZuqlkj½
oxZ 2009-10 2010-11 2011-12 2012-13
1 2 3 4 5
1 ?kjsyw jks'kuh ,oa ia[ks rki ,oa 'kfDr
3000383 3258647 3464611* 3616611
2 okf.kfT;d jks'kuh ,oa ia[ks rki ,oa 'kfDr
656218 704373 764627 775001
3 vkS|ksfxd ean cksYVst 63531 67549 46729 57267
4 lkoZtfud ty iznk; dk;Z rFkk lM+dksa ij jks'kuh
264 561 631 4495
5. vU; 56371 16065 10934 10598
dqy miHkksDrk 3776767 4047195 4300861 4463971
lzksr % fnYyh fo|qr fofu;ked vk;ksxA

155
VII. ENERGY AND ELECTRICITY7.3 Number of Consumers of Electricity (Category-wise)
2013-14 2014-15 2015-16 2016-17 Category
6 7 8 9 1
3954019 4094647 4289124 4537277 1 Domestic Light and Fans Heat and Power
847980 851410 871330 926710 2. Commercial Light, Fans (HT) Heat and Power
56180 52731 52308 52397 3. Industrial Low Voltage
6207 20491 20562 18569 4 Public water works & Street Lighting
32975** 25189** 29511** 33122** 5 Others
4897361 5044468 5262835 5568075 Total Consumer
* This includes 1698 number of consumers pertaining to JJ clusters.** include Agriculture, Mushroom, DIAL, DMRC, Advertisement, Railway Traction, Self consumption, Temporary connection etc.Note : As submitted by BRPL, BYPL ,TPDDL& NDMCSource:Delhi Electricity Regulatory Commission.

156
VII. ÅtkZ ,oa fo|qrÅtkZ ,oa fo|qr7-4 fnYyh esa ÅtkZ mRiknd oLrqvksa dk foØ;
('000 eh-&Vu)
ensa 2009-10 2010-11 2011-12 2012-13
1 2 3 4 51 isVªksy ¼,e-,l-½ 807 825 813 787
2 Mhty
¼d½ ,p- ,l- Mh- vks- 1093 804 930 1029
¼[k½ ,y- Mh- vks- 5 7 4.2 9
3 dqfdax xSl ¼,y- ih- th-½ 680 709 731 716
4 feV~Vh dk rsy 132 107 48 42
5 vU; ÅtkZ mRiknd oLrq,a @
1418 1621 1768 1557
6. lh - ,u- th- foØ; 500 596 649 695
7. ih -,u -th- dusD'ku@miHkksDrk la[;k
228167 333706 386226
8. izkdfrd xSl dk miHkksx 0.11 0.13 0.17
* vLFkk;hL=kksr % isVªksfy;e vkSj izkÑfrd xSl ea=kky; Hkkjr ljdkj ubZ fnYyhA

157
VII. ENERGY AND ELECTRICITY7.4 Sale of Energy products in Delhi
('000 M. Tons)
2013-14 2014-15 2015-16 2016-17(P) Items
6 7 8 9 1
797 831 902 906 1. Petrol (M.S.)
2. Diesel
1129 1269 1508 1267 (a) HSDO
4 3 1 0.5 (b) LDO
702 732 777 798 3. Cooking Gas (L.P.G.)
9 1 1 1 4. Kerosene oil
1650 1680 1809 1909 5. Other energy/Products@
698 717 738 804 6. CNG Sale
393476 415652 461881 522747 7. PNG Connection/ Consumers(No.)
0.17 0.18 0.18 0.19 8. Consumption of (mmscmd)^ Natural Gas
P= Provisional@ Includes ATF, JP-4/5, FO/TDO, LSHS/HHS & RF ^ Million Metric Standards cubic Metre per daySource : Ministry of Petroleum and Natural Gas, GOI, New Delhi

158
VIII. la;qDr LdU/k ize.Myla;qDr LdU/k ize.My8-1 fnYyh esa 'ks;j /kkjd fyfeVsM dEifu;ksa ds u;s
iathdj.k dk vkS|ksfxd oxhZdj.k2013-2014 2014-2015
izeaMyksa dh l[;k
izkf/kd`r iwath ¼:- yk[kksa esa½
izeaMyksa dh la[;k
izkf/kd`r iwath ¼:- yk[kksa esa½
oxhZdj.k No. of Companies
Authorised Capital
(Rs. In Lakhs)
No. of Companies
Authorised Capital
(Rs. In Lakhs)1 2 3 4 51- d`f"k ,oa laca) fØ;k,a
143 1709 116 1420
2- [kfutdeZ ,oa mR[kyu
71 51613 41 940
3- fofuekZ.k¼d½ [kk| inkFkZ] oL=] ydM+h ds mRikn] peM+k ,oa muds mRikn
993 25388 567 10396
¼[k½ /kkfRod ,oa jlk;u dk mRiknu e'khujh ,oa Hkkstuky;
1054 43557 597 44725
¼x½ vU; 178 5726 80 1710
4- fctyh] xSl ,oa ty
190 64155 143 23587

159
VIII. STOCK COMPANIES8.1 Industrial Classifi cation of New Registration of
Companies Limited by share in Delhi2015-2016 2016-2017
izeaMyksa dh l[;k
izkf/kd`r iwath ¼:- yk[kksa esa½
izeaMyksa dh la[;k
izkf/kd`r iwath ¼:- yk[kksa esa½
No. of Companies
Authorised Capital
(Rs. In Lakhs)
No. of Companies
Authorised Capital
(Rs. In Lakhs)
Classifi cation
6 7 8 9 1157 1274.60 163 1505.70 1. Agriculture and
Allied Activities34 272 23 580 2. Mining &
Qrarrying3. Manufacturing
647 5289.15 713 64118.4 (a) Food Stuffs, Textiles, Wood products, leather, paper
640 23393.10 720 25943.63 (b) Metals & Chemicals and Products thereof, Machinery & Equipment
100 3338.50 148 1241.00 (c) Others175 4846 169 10490 4. Electricity, Gas
& Water

160
2013-2014 2014-2015izeaMyksa dh
l[;kizkf/kd`r iwath ¼:- yk[kksa esa½
izeaMyksa dh la[;k
izkf/kd`r iwath ¼:- yk[kksa esa½
oxhZdj.k No. of Companies
Authorised Capital
(Rs. In Lakhs)
No. of Companies
Authorised Capital
(Rs. In Lakhs)
1 2 3 4 5
5- fuekZ.k 1235 16553 505 22506
6- Fkksd ,oa [kqnjk O;kikj rFkk pk; iku x`g ,oa Hkkstuky;
2066 51681 1367 28209
7- ;krk;kr] laxzg.k ,oa lapkj
722 31831 503 10751
8- foÙk chek ifjlifÙk;ka rFkk O;kikj lsok,a
8315 582305 6446 148463
9- lkeqnkf;d] lkekftd ,oa O;SfDrd lsok,a
1784 55946 668 4987
;ksx 16751 930464 11033 297694
Source : Ministry of Corporate Affairs, G.O.I. New Delhi.

161
2015-2016 2016-2017
izeaMyksa dh l[;k
izkf/kd`r iwath ¼:- yk[kksa esa½
izeaMyksa dh la[;k
izkf/kd`r iwath ¼:- yk[kksa esa½
No. of Companies
Authorised Capital
(Rs. In Lakhs)
No. of Companies
Authorised Capital (Rs. In Lakhs)
Classifi cation
6 7 8 9 1467 18748.40 519 6418.25 5 Construction
1604 15044.01 1669 17171.16 6 Trading
616 2069055.90 592 14179.30 7 Transport, Storage & Communication
8754 77597.63 10325 671452.38 8 Finance, Insurance, Real- Estates, Business Services
867 7118.45 926 5494.03 9 Community, Social & Personal Services
14061 2225977.74 15967 818593.85 TotalSource : Ministry of Corporate Affairs, G.O.I. New Delhi.

162
VIII. LdU/k ize.MyLdU/k ize.My8-2 fnYyh esa dk;Z dj jgs uo iathd`r rFkk fuorZu gq,
ize.My ¼iwath djksM :- esa½
dk;Z dj jgs izeaMyCompanies at Work
o"kZ la[;k iznÙk iwathYear No. Paid up Capital1 2 3
2001-2002 109429 92,513.772002-2003 113965 107,002.012003-2004 119706 123,215.632004-2005 128561 192,695.382005-2006 141561 132261.00 (92870)@2006-2007 139976 136695 (124151)@2007-2008 152740 198149(13055)@2008-2009 157194 197353(144094)@2009-2010 167329 262257(116583)R@2010-2011 148680 262256.582011-2012 159299 291309.342012-2013® 167461 377875.362013-2014(P) 189441 782061.012014-2015 195137 462828.622015-2016 204235 502471* Ceased to work includes struck-off and liquidated

163
VIII. STOCK COMPANIES8.2 Stock Companies at work, newly registered and ceased to
work in Delhi(Capital in Rs. crore)
uo iathd`r izeaMyNewly registered Companies
fuoZru gq, izeaMyCompanies ceased to work
la[;k izkf/kd`r iwath la[;k iznÙk iwath No. Authorised
Capital No. Paid up
Capital4 5 6 7
4419 1,110.86 121 .034793 859.64 143 .045836 1,226.12 44 0.08922 1,446.82 26 0.0
13372 6,243.29 316 .9513060 25,498.33 4114 19.5314473 17,724.55 15815 54.9112261 7,704.06 7 1.3311740 4,108.39 73 3.1315544 7,551.44 686 21.8316722 8,477.30 3719 257.3516055 14,670.04 1229 127.35*16751 9,140.53 768 69.68*11025 1,674.43 2061* 330.11*14061 22,259.78 3188* 164.39*
R- Revised P-Provisional@ Paidup captial data for Companies (nos. given in Paranthesis as compiled from MCA- 21)Govt. of India. Ministry of Corporate Affairs, New Delhi.

164
IX. O;kikj ,oa foÙkO;kikj ,oa foÙk9-1 jk"Vªh; jkt/kkuh {ks=] fnYyh ljdkj dh vk;@O;; ds ctV vuqeku
(djksM+ :- esa)
okLrfodActuals
ensa 2011- 2012- 2013-
2012 2013 20141 2 3 4
1. çkfIr;kaçkfIr;ka
¼d½ jktLo izkfIr;ka¼d½ jktLo izkfIr;ka
(i) dj jktLo 19971.67 23431.52 25918.69
(ii) dj fHkUu jktLo 460.87 2129.45 2062.00
;ksx (i+ii) 20432.54 25560.97 27980.69
¼[k½ olwfy;ka¼[k½ olwfy;ka
(i) jktLo -- --
(ii) iwath -- --
;ksx (i+ii) -- --
;ksx ¼d$[k½ 20432.54 25560.97 27980.69
2. O;;O;;
(i) jktLo ys[ks ij 17964.86 20659.36 22366.53
(ii) iwath ys[ks ij 8437.57 9199.44 11685.07
;ksx (i+ii) 26402.43 29858.80 34051.60
lzksr % foÙk foHkkx] jk"Vªh; jkt/kkuh {ks=] fnYyh ljdkjA

165
IX. TRADE & FINANCE9.1 Estimates of Receipts/Expenditure of Govt. of N.C.T. of Delhi
(Rs in Crore)
okLrfod okLrfod Revised Budget
Actual Actual Estimates Estimates2014- 2015- 2016- 2017- Items2015 2016 2017 2018
5 6 7 8 1I. ReceiptsA. Revenue Receipts
26603.90 30225.16 32430.00 38700.00 (i) Tax Revenue2980.68 4773.69 4492.06 3516.00 (ii) Non-tax revenue
29584.58 34998.85 36922.06 42216.00 Total (i+ii)B. Recoveries
-- -- -- -- (i) Revenue-- -- -- -- (ii) Capital-- -- -- -- Total (i+ii)
29584.58 34998.85 36922.06 42216.00 Total (A+B)
II. Expenditure
23509.49 26342.56 32076.43 38426.91 (i) Revenue Account
7430.61 8852.96 9123.57 9573.09 (ii) Capital Account
30940.10 35195.52 41200.00 48000.00 Total (i+ii)
Source : Finance Department, Govt, of NCT of Delhi

166
IX. O;kikj ,oa foÙkO;kikj ,oa foÙk9-2 jk"Vªh; jkt/kkuh {ks= esa LFkkuh; fudk;ksa dh vk; rFkk O;;
¼:- yk[kksa esa½
Actual Revised Budget
Estimates
Budget Estimates
ensa 2015-16 2016-17 2017-18
1 2 3 4
East Delhi Municipal Corporation
Income
1. Total External Revenue 44,323.8 58900.32 60679.00
2 Total Taxes 56681.04 63060.42 69911.37
3 Total Fees & Fines 4,654.98 6289.30 7055.20
4 Total Others 41,537.99 219590.75 248476.20
Total Income 1,47,197.81 347840.79 386121.77

167
IX. TRADE & FINANCE9.2 Income & Expenditure of Local Bodies in the NCT of Delhi
(Rs in Lakhs)Actual Revised
Budget Estimates
Budget Estimates
2015-16 2016-17 2017-18 Items5 6 7 1
East Delhi Municipal CorporationExpenditure
27524 57417.49 56973.99 1 General Administration98.03 274.98 269.07 2 Licensing
661.88 1673.82 9588.82 3 Community Services31097.23 82008.98 88524.43 4 Education 13807.99 35148.28 37526.65 5 Public Health & Medical Relief44767.01 81925.41 94834.30 6 Sanitation17904.64 41299.28 43904.50 7 Public Workers & Street
Lighting754.17 5484.37 2953.06 8 Veterinary Services
3859.82 12347.31 14709.81 9 Horticulture519.53 5875.05 5001.59 10 Land & Estate451.01 7456.81 10210.16 11 Exclusive Development
Expenses0 20248.00 20248.00 12 Loan Repayments
141445.31 351159.78 384744.38 Total ExpenditureSource : East Delhi Municipal Corporation of Delhi

168
IX. O;kikj ,oa foÙkO;kikj ,oa foÙk9-2 jk"Vªh; jkt/kkuh {ks= esa LFkkuh; fudk;ksa dh vk; rFkk O;;
¼:- yk[kksa esa½
Actual Revised Budget
Estimates
Budget Estimates
ensa 2015-16 2016-17 2017-18
1 2 3 4
South Delhi Municipal Corporation
Income
1. Total External Revenue 79675.60 99780.00 125945.00
2 Total Taxes 180883.18 208628.02 213881.62
3 Total Fees & Fines 16942.06 20833.90 23236.10
4 Total Others 49110.89 56390.82 56500.30
5 Loan 0.00 0.00 0.00
Total Income 326,611.73 385,632.74 419,563.02

169
IX. TRADE & FINANCE9.2 Income & Expenditure of Local Bodies in the NCT of Delhi
(Rs in Lakhs)Actual Revised
Budget Estimates
Budget Estimates
2015-16 2016-17 2017-18 Items5 6 7 1
South Delhi Municipal Corporation Expenditure
46945.36 58257.19 62413.74 1 General Administration163.96 253.47 288.95 2 Licensing
5460.46 12753.59 13063.59 3 Community Services58445.64 72703.98 88312.98 4 Education 15645.50 23084.37 29611.10 5 Public Health & Medical Relief72464.86 89061.50 108879.60 6 Sanitation50698.84 77375.44 78885.18 7 Public Workers & Street
Lighting1457.07 3393.04 4937.99 8 Veterinary Services
13774.07 22594.00 27785.50 9 Horticulture166.00 741.30 1592.30 10 Land & Estate
10600.92 33425.00 35152.00 11 Exclusive Development Expenses
14728.91 13632.00 13441.50 12 Loan Repayments290,551.59 407,274.88 464,364.43 Total Expenditure
Source : South Delhi Municipal Corporation of Delhi

170
IX. O;kikj ,oa foÙkO;kikj ,oa foÙk9-2 jk"Vªh; jkt/kkuh {ks= esa LFkkuh; fudk;ksa dh vk; rFkk O;;
¼:- yk[kksa esa½
Actual Revised Budget
Estimates
Budget Estimates
ensa 2015-16 2016-17 2017-18
1 2 3 4
North Delhi Municipal Corporation
Income
1. External Revenue 84885.47 105878.00 116297.00
2. Taxes & Rates 135167.29 172240.10 195939.80
3. Rent Fees & Fines 27316.06 54476.25 100238.36
4 Others 18984.72 14859.26 27587.79
5. Internal Renvenue 181468.07 241575.61 323765.95
6. Loan 31400.00 124400.00 361000.00
Total Income 297753.54 471853.61 801062.95

171
IX. TRADE & FINANCE9.2 Income & Expenditure of Local Bodies in the NCT of Delhi
(Rs in Lakhs)Actual Revised
BudgetEstimates
Budget Estimates
2015-16 2016-17 2017-18 Items5 6 7 1
North Delhi Municipal Corporation Expenditure
36917.94 68295.29 110322.96 1 General Administration
304.64 387.19 439.27 2 Licensing 3857.40 9804.44 10575.44 3 Community Services
63126.18 89140.40 97867.80 4 Education 49966.94 69430.58 82108.34 5 Health68658.87 104347.97 164443.42 6 Sanitation39110.02 66427.81 81340.02 7 Public Workers &
Street Lighting1340.21 4388.00 6095.35 8 Veterinary Services
11057.68 17171.00 20286.50 9 Horticulture383.47 2113.20 1455.20 10 Land & Estate
4434.15 55396.15 34526.15 11 Exclusive Development Expenses
0.00 0.00 148665.43 12 Loan Repayments279157.50 486902.03 758125.88 Total Expenditure
Source : North Delhi Municipal Corporation of Delhi

172
ubZ fnYyh uxj ifj"knubZ fnYyh uxj ifj"kn
çkfIr;ka çkfIr;ka ¼:- yk[kksa esa½
ensa okLrfod okLrfod okLrfod
Actuals Actuals Actuals
2012-13 2013-14 2014-2015
1 2 3 4Function Group
1. General Administration 72211.69 108357.77 129888.202. Planning & Regulation 1117.60 721.25 750.403. Public works -699.52 2258.76 3239.344. Health 35.37 106.86 113.195. Sanitation and solid waste 296.88 429.07 422.15
Management6. Civic Amenties 14649.95 15806.32 20839.117. Urban Forestry 95.73 30.50 71.598. Urban Poverty Alleviation 639.88 24.64 424.49
and social welfare9. Other services 98627.39 104458.44 120622.1810. Revenues 49539.37 45587.26 48010.13
Total 236514.34 277780.87 324380.78

173
New Delhi Municipal Council Receipts (Rs in Lakhs)
ifj'kksf/kr ctVvuqeku vuqeku
okLrfod Revised Budget ItemsActuals Estimates Estimates2015-16 2016-17 2017-18
5 6 7 1Function Group
124566.98 123976.46 130804.27 1. General Administration815.86 2112.49 16297.22 2. Planning & Regulation
2992.40 2723.57 2701.70 3. Public works115.96 125.75 128.25 4. Health539.14 1483.20 748.30 5. Sanitation and solid waste
Management22661.21 25392.82 26333.21 6. Civic Amenties
153.95 34.80 33.80 7. Urban Forestry130.68 76.05 26.05 8. Urban Poverty Alleviation
and social welfare128140.37 123806.41 123338.68 9. Other services55029.93 60719.81 62296.66 10. Revenues
335146.48 340451.36 362708.14 Total

174
ubZ fnYyh uxj ifj"knubZ fnYyh uxj ifj"kn
O;; ¼:- yk[kksa esa½
okLrfod okLrfod okLrfod
ensa Actuals Actuals Actuals
2012-13 2013-14 2014-15
1 2 3 4
Function Group1. General Administration 47489.87 72500.61 79728.212. Planning & Regulation 988.55 850.19 1169.343. Public works 10311.20 11654.79 12776.654. Health 8091.53 8263.27 11653.605. Sanitation and solid waste 7860.59 7341.74 10745.04
Management6. Civic Amenties 28070.86 32944.57 29671.267. Urban Forestry 5988.17 6197.22 8929.058. Urban Poverty Alleviation 1835.77 2068.99 4582.74
and social welfare9. Other services 98478.51 120668.87 144449.44
10. Revenues 312.39 263.49 412.09Total 209427.44 262753.74 304117.42
lzksr % ubZ fnYyh uxj ifj"kn

175
New Delhi Municipal Council Expenditure (Rs in Lakhs)
ifj'kksf/kr ctV
vuqeku vuqeku
okLrfod Revised Budget Items
Actuals Estimates Estimates2015-16 2016-17 2017-18
5 6 7 1Function Group
89861.49 96912.76 94318.18 1. General Administration1058.00 12819.26 21895.73 2. Planning & Regulation
12756.46 18870.01 16765.56 3. Public works12104.14 12261.16 13776.74 4. Health13267.65 15119.75 16226.82 5. Sanitation and solid waste
Management24040.43 25538.58 35283.14 6. Civic Amenties9518.67 9995.96 10747.92 7. Urban Forestry2722.20 2939.02 3394.21 8. Urban Poverty Alleviation
and social welfare126816.10 134682.99 149223.50 9. Other services
432.65 485.09 530.68 10. Revenues292577.79 329624.58 362162.48 Total
Source: NDMC

176
fnYyh Nkouh cksMZfnYyh Nkouh cksMZ
¼:- yk[kksa esa½
okLrfod okLrfod okLrfodActuals Actuals Actuals
ensa 2012-13 2013-14 2014-151 2 3 4vk;vk;
1. nj ,oa dj 103.69 87.60 91.022. djkjksfir laifÙk ds vfrfjDr
jktLo izkIfr
871.68 1628.67 1687.21
3. fofo/k 163.79 251.90 93.32
;ksx 1139.16 1968.17 1871.55
O;;O;;1. lkekU; iz'kklu 310.39 442.16 340.512. jktLo ,oa vfxze dk laxzg.k 35.65 37.76 34.113. lkoZtfud dk;Z 5233.40 5726.30 3346.554. lkoZtfud lqj{kk ,oa lqfo/kk,a 1186.31 1618.35 1623.145. fpfdRlk ,oa lQkbZ lsok,a 3385.16 3711.48 3750.376. lkoZtfud laLFkk,a 983.16 1226.96 1207.547. lkekU; mís'; ,oa isa'ku vkfn gsrq
laxzg.k
501.42 599.84 871.37
8. fofo/k 32.62 84.04 171.61
;ksx 11668.11 13446.89 11345.20
L=ksr % fnYyh Nkouh cksMZ

177
DELHI CANTONMENT BOARD(Rs. in Lakhs)
okLrfod okLrfod Budget
Actuals Actuals Estimates2015-16 2016-17 2017-18 Items
5 6 7 1Income
82.23 293.22 1605.55 1. Rates and Taxes1028.11 9802.16 8369.56 2. Revenue Derived from
Property Apart from Taxation82.98 37.18 300.00 3. Miscellaneous
1193.32 10132.56 10275.11 TotalExpenditure
468.02 731.89 992.79 1. General Administration31.11 27.56 49.99 2. Collection of Reveune and
Refunds5314.31 4461.93 8394.18 3. Public Works2194.19 2141.84 3106.44 4. Public Safety and Convenience5212.15 4571.93 8666.13 5. Medical Services and Sanitation1380.68 1484.98 2514.83 6. Public Institutions912.90 1049.94 1650.00 7. Contribution for General
Purposes Pension Gratuities Etc.111.31 101.45 200.66 8. Miscellaneous
15624.67 14571.52 25575.02 TotalSource: Delhi Cantonment Board

178
IX. O;kikj ,oa foÙkO;kikj ,oa foÙk9-3 jk"Vªh; jkt/kkuh {ks= fnYyh dh fofHkUu ;kstukvksa ij O;;
¼:- djksM+ esa½
12th Five Year
[k.M Plan Outlay Expenditure Expenditure
(2012-17 ) 2013-14 2014-15*
1 2 3 4
1. d`f"k ,oa lac) lsok,a - 1.78 4.48
2. xzkeh.k&fodkl 882.00 177.05 118.13
3. flapkbZ o ck<+ fu;a=.k 400.00 69.41 81.45
4. ÅtkZ 4820.20 326.00 581.26
5. m|ksx 199.00 72.00 48.32
6. ifjogu 21954.62 3754.54 2996.79
7. foKku rduhdh i;kZoj.k
546.50 46.07 42.08
8. lkekU; vkfFkZd lsok,a 7.50 1.32 2.06

179
IX. TRADE & FINANCE9.3 Expenditure on Various Programme/Project in National Capital
Territory of Delhi
(Rs. in Crores)
Expenditure Scheme/
Programme/Expenditure (Provisional) Project Sector
2015-16* 2016-17 2017-185 6 7 14.72 3.43 26.00 1. Agriculture & Allied
Services105.19 130.28 614.00 2. Rural Development48.54 59.21 90.00 3. Minor Irrigation & Flood
Control235.51 187.77 295.00 4. Energy 59.81 7.20 31.00 5. Industries
3504.03 2739.92 3056.00 6. Transport37.92 33.71 90.00 7. Science, Technology &
Environment6.52 1.98 11.00 8. Secretariat Economic
Services

180
¼:- djksM+ esa½
12th Five Year
[k.M Plan Outlay Expenditure Expenditure
(2012-17 ) 2013-14 2014-15*
1 2 3 4
9. i;ZVu 185.00 9.41 8.61
10. [kk| laHkj.k 800.00 99.38 1.60
11. lkekU; f'k{kk 10344.00 1678.61 1975.53
12. rduhdh f'k{kk 1458.00 293.41 159.34
13. dyk ,oe laLd`fr 291.00 44.32 41.79
14. [ksy ,oa ;qok lsok,a 147.50 32.80 36.74
15. fpfdRlk 12934.50 1461.16 1847.63

181
(Rs. in Crores)
Expenditure Scheme/
Programme/
Expenditure (Provisional) Project Sector
2015-16* 2016-17 2017-18
5 6 7 1
19.61 8.08 117.00 9. Tourism
0.69 1.66 12.00 10. Civil Supplies
2645.59 3124.78 2970.00 11. General Education
268.36 259.62 363.00 12. Technical Education
32.38 49.91 104.00 13. Art & Culture
45.16 52.15 88.00 14. Sports & Youth
Services
1693.83 1736.83 2151.00 15. Medical
Contd...

182
¼:- djksM+ esa½
12th Five Year
[k.M Plan Outlay Expenditure Expenditure
(2012-17 ) 2013-14 2014-15*
1 2 3 4
16. tu&LokLF; 565.50 150.52 319.06
17. ty&vkiwfrZ lQkbZ 11000.00 1550.00 1789.00
18. vkokl 2700.00 484.04 173.77
19. 'kgjh fodkl 8700.00 1759.84 1463.16
20. vuqlwfpr tkfr@tutkfr o vU; fiNM+s oxZ dh dY;k.k
1600.00 254.77 257.01
21. Je ,oe Je dY;k.k
574.00 45.05 25.22
22. lekt dY;k.k 3831.00 660.11 655.68

183
(Rs. in Crores)
Expenditure Scheme/
Programme/
Expenditure (Provisional) Project Sector
2015-16* 2016-17 2017-18
5 6 7 1
331.01 342.85 476.00 16. Public Health
1723.93 1384.65 1755.00 17. Water-Supply & Sanitation
245.80 134.81 251.00 18. Housing
1303.95 1674.36 2117.00 19. Urban Development
284.13 105.58 400.00 20. Welfare of SC/ST/OBC/ Minorities
40.24 24.88 110.00 21. Labour & Labour Welfare
737.82 804.25 1272.00 22. Social Welfare
Contd...

184
¼:- djksM+ esa½
12th Five Year
[k.M Plan Outlay Expenditure Expenditure
(2012-17 ) 2013-14 2014-15*
1 2 3 4
23. iks"k.k 1340.00 148.44 328.72
24. dkjkxkj 753.68 100.60 111.11
25. yksd&fuekZ.k 700.00 89.94 166.47
26. vU; iz'kklfud lsok,a 1566.00 206.97 213.74
27. efgyk ,oa cky fodkl 1700.00 446.76 530.92
;ksx 90000.00 13964.28 13979.68
lzksr % ;kstuk foHkkx] jk"Vªh; jkt/kkuh {ks=] fnYyh ljdkjA

185
(Rs. in Crores)
Expenditure Scheme/
Programme/
Expenditure (Provisional) Project Sector
2015-16* 2016-17 2017-18
5 6 7 1
265.63 208.30 380.00 23. Nutrition
55.43 64.28 65.00 24. Jail
230.59 254.00 234.00 25. Public Works
454.47 221.15 550.00 26. Other Administrative Services
579.68 650.61 872.00 27. Women & child Welfare
14960.54 14266.25 18500.00 Total
Source : Planning Department, Govt. of NCT of Delhi.* From Annual Plan 2014-15 Central Share in Centrally Sponsored Scheme has become part of the State Plan.

186
IX. O;kikj ,oa foÙkO;kikj ,oa foÙk9-4 fnYyh foÙk fuxe&m|ksxkuqlkj Lohd`r _.k
¼jkf'k yk[k esa½2011-2012 2012-2013 2013-2014
la[;k jkf'k la[;k jkf'k la[;k jkf'k
oxZ No. Amt No Amt No. Amt.
1 2 3 4 5 6 7
1. dkxt o dkxt mRikn dk mRiknu
— — — — — —
2. fofo/k mRiknu m|ksx peM+k o peM+s ls cuh oLrq,a
361 4966.40 40 597.15 40 541.18
2(a) IykfLVd m|ksx 02 47.00 12 297.93 3 61.11
3. Leky jksM VªkaliksVZ vkijsVj Ldhe
08 34.73 33 87.90 38 117.23
;ksx 371 5048.13 85 982.98 81 719.52
lzksr % fnYyh foÙk fuxe] ubZ fnYyh

187
IX. TRADE & FINANCE9.4 Delhi Financial Corporation—Loans sanctioned Industry-wise
(Amount in lakh Rs.)2014-2015 2015-2016 2016-2017
la[;k jkf'k la[;k jkf'k la[;k jkf'kNo. Amt. No. Amt. No. Amt. Class8 9 10 11 12 13 1— — — — — — 1. Manufacture
of Paper& Paper Products
225 5628.24 61 1590.15 7 105.52 2. Miscellaneous includingmanufacture of Leatherand Leather Products
5 80.27 — — — — 2(a) Plastic Industry130 208.00 620 729.00 36 66.37 3. Small Road
TransportOperator Scheme
360 5916.51 681 2319.15 43 171.89 Total* Including Relocation of industriesSource : Delhi Financial Corporation, New Delhi.

188
IX. O;kikj ,oa foÙkO;kikj ,oa foÙk9-5 fnYyh esa thou chek dh izxfr
¼:- djksM+ esa½
fooj.k 2009-10 2010-11 2011-12 2012-13
1 2 3 4 5
O;SfDrd cheki. vof/k ds vUr esa pkyw
O;kikj
5580.18 6458.16 6995.45 7309.32
ii. vof/k ds nkSjku u;k O;kikj
2298.01 2227.38 1445.23 1606.90
iii. vof/k ds nkSjku izhfe;e ls vk;
6876.66 5883.06 6036.10 5995.05
iv. chek jkf'k ds izfr gtkj ij vkSlr izhfe;e ¼:- esa½
121.62 106.57 N.A. NA
leqnk; cheki. vof/k ds vUr esa pkyw
O;kikj ¼:- esa½
9249.00 3495.00 4202.88 29479.70
ii. vof/k ds nkSjku u;k O;kikj ¼:- esa½ ¼,d izfe;e½
2133.00 8705.06 2455.01 3763.25
iii. vof/k ds nkSjku ls vk; ¼:- esa½ ¼uohdj.k izhfe;e½
2603.00 9429.94 774.96 4250.42
lzksr % thou chek fuxe] mÙkj {ks=h; dk;kZy;] ubZ fnYyhA

189
IX. TRADE AND FINANCE9.5 Progress of Life Insurance in Delhi
(Rs. in Crores)2013-14 2014-15 2015-16 2016-17 Description
6 7 8 9 1Individual Insurances
161353.98* 170942.85* 182746.72* 194213.56* i. Business in force at the end of the period
1675.55 1457.14 1277.37 1886.15 ii. New Business during the period
6161.53 9473.33 9936.96 10633.68 iii. Premium Income during the period
40.27 55.42 54.38 54.75 iv. Average premium on sum Assured per thousand (in Rs.)Group Insurances
34433.1* 38455.73 45244.65 56014.92 i. Business in force at the end of the period
5330.04 5288.77 10014.00 12261.21 ii. New Business during the period(Single Prem.)
473.27 377.57 195.63 463.40 iii. Premium Income during the period(Renewal Prem.)
Source : Life Insurance Corporation, Northern Zonal Offi ce,New Delhi.* Sum Assured

190
IX. O;kikj ,oa foÙkO;kikj ,oa foÙk9-6 fnYyh esa fcØh dj@loaf/kZr dj vf/kfu;eksa ds vUrxZr
iathÑr&O;kikjh ,oa izkfIr;kaiathÑr O;kikjh
Registered Dealers o"kZ LFkkuh; vf/kfu;e ds
vUrxZrUnder Local Act
dsUnzh; vf/kfu;e ds varxZrUnder Central ActYear
1 2 31997-98 140787 1372421998-99 147542 1439051999-00 155864 1513522000-01 155868 1468472001-02 161824 1522262002-03 167446 1577482003-04 171868 1619352004-05 161283 1517392005-06 174264 1593912006-07 189957 1709312007-08 206359 1776612008-09 212665 1839182009-10 223927 1954662010-11 234839 2056232011-12 248829 2191872012-13 286951 2559012013-14 250450 2316782014-15 283139 2624382015-16 308534 2953182016-17 400156 373090lzksr % O;kikj ,oa dj foHkkx] jk"Vªh; {ks=] fnYyh ljdkjA

191
IX. TRADE & FINANCE9.6 Registered-Dealers & Receipts under Sales Tax /VAT Act in Delhi
çkfIr;ka ¼djksM+ :- esa½Tax Collection (Gross) (Rs. in Crores)
LFkkuh; fcØh djLocal Sales Tax
dsUnzh; fcØh djCentral Sales Tax
;ksxTotal
1 2 31462.84 567.55 2030.391521.67 592.09 2113.761729.28 616.56 2345.842675.25 704.34 3379.592992.76 697.60 3690.363082.27 784.70 3866.973584.91 848.96 4437.854201.38 997.07 5203.025684.91 939.66 6624.586543.46 1058.10 7601.567528.89 1215.50 8744.398833.44 1125.68 9959.12
10065.41 1892.91 11958.3211365.88 3071.96 14437.8412614.82 2150.25 14765.0714489.26 1727.42 16216.6816499.72 1748.68 18248.4016596.65 1983.68 18580.3318418.35 4654.16* 23072.5119717.91 2943.62** 22661.53
Source : Trade & Taxes Department, Govt. of NCT of Delhi* Rs. 2572.97 Cr. Received as compensation from G.O.I Under Central Sales Tax* *Rs. 690.53 Cr. Received as compensation from G.O.I Under Central Sales Tax

192
IX. O;kikj ,oa foÙkO;kikj ,oa foÙk9.7 Number of Functioning Offi ce of Commercial Bank in Delhi
¼31 ekpZ dks½
oxZ 2013 2014 2015 2016 2017 Category
1 2 3 4 5 6 1
1. LVsV cSad vkQ bafM;k o lgk;d cSad
495 525 540 551 558 1 State Bank of India & its Associates
2. jk"Vªh;d`r cSad 1766 1879 1965 1994 2052 2 Nationalised Banks
3. vU; okf.kT;d cSad
819 878 966 1107 1193 3 Other Commercial Banks
4. {ks=h; xzkeh.k cSad
0 0 0 0 0 4 Regional Rural Banks
;ksx 3080 3282 3471 3652 3803 Total
lzksr % fjtoZ cSad vkQ bafM;k] eqEcbZNote :-1.Bank branch data include administrative offi ces.2.Other Commercial Banks Comprises of other Public Sector, Private Sector, Foreign & Banks.

193
IX. TRADE & FINANCE9.7(i) Total Deposits and Credits of Banks in Delhi
(As on 31st March)
oxZ 2012 2013 2014 2015 2016
1 2 3 4 5 6 1
1. fu{ksi ¼djksM+ :-½
686338 755821 831838 882331 976166 1 Deposits (Crores Rs.)
2. vfxze ¼djksM+ :-½
654265 737304 845401 913813 970596 2 Credits (Crores Rs.)
Source : Reserve Bank of India, Mumbai.

194
IX. O;kikj ,oa foÙkO;kikj ,oa foÙk9-8 fnYyh esa vuqlwfpr okf.kfT;d cSadksa esa fu{ksi dk izk:i vuqlkj forj.k
31 ekpZ rd
¼jkf'k djksM+ :- esa½
fooj.k 2011 2012 2013
1 2 3 4
¼d½ pkyw [kkrs
1- [kkrksa dh la[;k 2182 2193 2513
2- jkf'k 121464 115568 84350
¼[k½ cpr [kkrs
1- [kkrksa dh la[;k 21790 20417 22270
2- jkf'k 100283 105223 114753
¼x½ lkof/k tek [kkrs
1- [kkrksa dh la[;k 6948 7708 8958
2- jkf'k 414176 463341 553083
¼?k½ dqy [kkrksa dh la[;k 30921 30318 33741
¼M-½ dqy jkf'k 635923 684133 752186
[kkrksa dh la[;k gtkjksa esaAlzksr % fjtoZ cSad vkQ bafM;k] eqEcbZA

195
IX. TRADE & FINANCE9.8 Distribution of Deposits according to Types of Scheduled
Commercial Banks in Delhias on 31st March
(Amount in Crore Rs.)2014 2015 2016 Description
5 6 7 1(A) Current Accounts
2742 2852 3058 1. No. of Accounts
83316 91456 99066 2. Amount
(B) Saving Accounts
24704 27924 30680 1. No. of Accounts
129588 147381 157161 2. Amount
( C) Fixed/Term Deposits
9656 10493 11729 1. No. of Accounts
601760 645546 710831 2. Amount
37101 41269 45467 (D) Total No. of Accounts
814665 884383 967058 (E) Total AmountNo. of Accounts in ’000.Source : Reserve Bank of India, Mumbai.

196
IX. O;kikj ,oa foÙkO;kikj ,oa foÙk9-9 fnYyh esa vuqlwfpr okf.kfT;d cSadksa dh cdk;k jkf'k dk O;kolkf;d oxhZdj.k
¼jkf'k fefy;u+ :- esa½2014 2015
March March[kkrksa dh la[;k
cdk;k jkf'k
[kkrksa dh la[;k
cdk;k jkf'k
O;olk;No. of
AccountsAmount
Out-standing
No. of Accounts
Amount Out-
standing
1 2 3 4 51. d`f"k ,oa lacaf/kr dk;Z 52953 277579 33643 2084582. m|ksx 105064 4963540 106011 5372514
¼d½ [kfutdeZ o mR[kuu
4483 121828 3579 82545
¼[k½ fofuekZ.k 85876 3093929 88932 3205930
¼x½ fo|qr&mRiknu lapj.k o forj.k
1469 651411 1218 797063
¼?k½ fuekZ.k 13236 1096373 12282 12869773. ifjogu izpkyd 42237 91990 41054 914284. O;kikj 95877 579319 110266 798195
¼d½ Fkksd O;kikj 18415 347506 21731 496731
¼[k½ QqVdj O;kikj 77462 231813 88535 3014645. fuft _.k o O;olk;h
lsok,a
1868544 1508086 1996484 1459367
6. foÙk o vU; dqy 206549 1023644 211221 1143510
;ksx 2371224 8444157 2498679 9073472
lzksr % fjtoZ cSad vkQ bafM;k] eqacbZA

197
IX. TRADE & FINANCE9.9 Occupational Classifi cation of Outstanding credit of
Scheduled Commercial Banks in Delhi(Amount in Million Rs.)
2016March
2016December
[kkrksa dh la[;k
cdk;k jkf'k [kkrksa dh la[;k
cdk;k jkf'k
No. of Accounts
AmountOutstanding
No. of Accounts
Amount Outstanding
Occupation
6 7 154655 246008 65624 127152 (1) Agriculture &
Allied Activities115728 5619407 129714 5433680 (2) Industry
1923 74574 1552 75770 (a) Mining and Quarrying
102144 3300363 115345 3144403 (b) Manufacturing1400 983123 1411 1013402 (c) Electricity- Gas &
Water10261 1261347 11406 1200104 (d) Construction56827 100915 59236 112707 (3) Transport
Operators163237 833565 173946 723570 (4) Trade23458 507793 21582 456295 (a) Wholesale Trade
139779 325772 152364 267275 (b) Retail Trade2276122 1782632 2433560 1820675 (5) Personal Loans
& Professional Services
229229 1122587 76403 888590 (6) Finance and all others
2895798 9705114 2938483 9106373 TotalSource : Reserve Bank of India, Mumbai

198
IX. O;kikj ,oa foÙkO;kikj ,oa foÙk9-10 fnYyh esa jsy vkSj ty ekxZ }kjk O;kikj
¼^000 fDoaVy½2012-13 2013-14
oLrq,a vkod tkod vkod tkodInward Outward Inward Outward
1 2 3 4 51 Hkwlh esa pkoy 0 2372 pkoy 1829 305 53 543 puk vkSj pus ds mRiknu 186 0.6 32 2.94 nkysa ¼puk vkSj puksa ds
mRiknu dks NksM+dj½
743 823 233 598
5 xsgwa 2029 24 6698 0.76 xsgwa mRiknksa 7 1.27 Tokj 278 eDdk 0.06 0.99 vukt dh vU; fdLesa 0.26 1721 1061 115410 frygu fcukSyk 38 3311 frygu fcukSyk ¼dikl
dks NksM+dj½
2 12 26
12 dPps diky&nck;k 1213 dPps dikl&<hyh14 twV&dPps15 Qy vkSj lCth&rktk 296 964 581 12816 xUuk

199
IX. TRADE & FINANCE9.10 Rail & River Borne Trade in Delhi
(‘000 Qunitals)2014-15 2015-16
vkokd tkod vkokd tkod Articles
Inward Outward Inward Outward6 7 8 9 1
1. Rice in the husk142 233 284 280 2. Rice not in husk60 6 140 0.5 3. Gram and Gram products
297 644 26.5 806 4 Pulses other thanGram products
5317 5648 5. Wheat2.2 5.4 6. Wheat Products
7. Jowar & Bajra8. Maize & Millets
734 958 461 416 9. Grain, other sorts72 10 Oil seeds Cotton69 11 Oil seeds (Other than
Cotton12 Raw cotton - Pressed13 Raw cotton - Loose
0 0 14 Jute - Raw219 83 398 96 15 Fruit & Vegetable - Fresh
16 Sugar Cane

200
¼^000 fDoaVy½2012-13 2013-14
oLrq,a vkod tkod vkod tkodInward Outward Inward Outward
1 2 3 4 517 rsy dsd 18 4
18 vU; pkjk vkSj Hkwlh 1.3 2.6 17 0.8
19 i'kq&ykbo LVksd20 cky vkSj [kky21 dks;yk vkSj dksd 2574 0.6 2190
22 laxejej vkSj iRFkj 0.3 716 587
23 pwuk vkSj pwuk iRFkj 448 161 37 141
24 eSaxuht v;Ld25 ykSg v;Ld26 nwljksa v;Ldksa 0.04
27 [kfut rsy ¼feV~Vh dk rsy NksM+dj½
10113 5.7 11558 52
28 feV~Vh dk rsy 48
29 vU; [kfut 0.6 2.5
30 ckal 0.5
31 vU; bekjrh ydM+h 285 143
32 >kM+w

201
(‘000 Qunitals)2014-15 2015-16
vkod tkod vkod tkod Articles
Inward Outward Inward Outward6 7 8 9
1 3.4 17 Oil Cakes9.5 2.2 2.6 18 Other Fodder and Husk
19 Animals - Live stock20 Hides and Skins
1705 2726 28 21 Coal & Coke2 51 46.5 22 Marble and stone
209 80 110 89 23 Lime & Limestonedolomite & gypsum
24 Manganese Ore25 Iron Ore
1.8 26 Others Ores10246 7486 27 Mineral Oil
(exclusive Kerosene)28 Kerosene29 Other Minerals30 Bamboo
221 423 137 31 Other Forest Products32 Brooms

202
¼^000 fDoaVy½2012-13 2013-14
vkod tkod vkod tkodoLrq,a Inward Outward Inward Outward1 2 3 4 5
33 phuh 0 3.5 1205 1.734 xqM+ jkc vkSj xqM+ 674 18 9.635 xqM36 ued 1648 2.5 1643 0.537 pk; 038 lkcqu 23.5 2.539 eawxQyh dk rsy 0 5.740 ljlksa dk rsy 454 15841 jsaMh42 vU; [kk| rsy 29 2.3 543 dikl fofuekZ.k 104 14.544 twV fofuekZ.k 0.545 vU; diM+s 0.6 0.246 peM+k vkSj peM+k
mRikn47 jcj vkSj jcj mRikn48 twV mRikn49 lhesUV 11690 192 9473 23150 lhesUV fofuekZ.k 2451 bZVsa52 yksgk bLikr 7582 1933 5801 1856

203
(‘000 Qunitals)2014-15 2015-16
vkod tko vkod tkod Articles
Inward Outward Inward Outward6 7 8 9 1
1379 1 503 23.3 33 Sugar 13 24.6 34 Gur Jaggery and Gur
Shakkar35. Molasses
1582 13 1619 14.7 36 Salt37 Tea
6.2 45 38 Soap2.6 0.9 39 Groundnut Oil
0.6 121 207 40 Mustard Oil41 Castor
230 2.3 106 200 42 Other edible oil23 65 43 Cotton Manufactures
44 Jute Manufactures45 Other Texiles46 Leather & Leather
Products0.4 47 Rubber & Rubber
Products48 Coir Products
4970 102 4122 51 49 Cement1178 23 785 50 Cement Manufactures
51 Bricks6360 1204 6727 446 52 Iron & Steel

204
¼^000 fDoaVy½2012-13 2013-14
vkod tkod vkod tkodoLrq,a Inward Outward Inward Outward1 2 3 4 5
53 ifjogu midj.k 14.7 7354 fctyh dk lkeku 54 21 33655 e'khujh vkSj e'khu
midj.k
6 1
56 vU; /kkrq 157 /kkrq mRikn 058 dkxt 1027 104 718 4.759 isaV~l ,aM okfuZ'k 0.8 0.660 dkfLVd iksVk'k vkSj
lksMk
195 526
61 ,Ydksgy 362 vEy63 moZjd vkSj jlk;u
[kkn
82 27
64 vU; jlk;u 15.3 1.665 dksaQh 1.5 0.966 Ms;jh mRikn 96 2167 elkys 73 86 2468 xSlksa69 ikuh 0.970 vU; 50505 26778 67927 29527
lzksr % okf.kT; vf/klwpuk ,oa lkaf[;dh foHkkx] Hkkjr ljdkj] dksydrkA

205
(‘000 Qunitals)2014-15 2015-16
vkod tkod vkod tkod Articles
Inward Outward Inward Outward6 7 8 9 128 29 53 Transport Euipments
1253 0.3 1250 33.6 54 Electrical Goods0.8 55 Machinery and Machine
Tools56 Other Metal57 Metal Products
1074 4.5 451 38.5 58 Paper0.5 4.1 59 Paints & Varnishes
849 851 60 Caustic Potash & Soda61 Alcohols62 Acid
56 83 63 Fertilizer & Chemical manure
1.4 21.1 64 Other Chemicals4.5 49.3 65 Coffee7.3 24.4 66 Dairy Product22 106 81.1 67 Spices
68 Gases69 Water
82140 33515 97639 27638 70 Other CommoditiesSource: Directorate General of Commercial Intelligence andStatistics, Govt. of India, Kolkatta

206
IX. O;kikj ,oa foÙkO;kikj ,oa foÙk9-11 fnYyh esa vYi cpr ;kstukvksa ds vUrxZr /ku laxzg
¼:- yk[kksa esa½
;kstuk,a
2013-2014 2014-2015
dqy fuoy dqy fuoyGross Net Gross Net
1 2 3 4 51. Mkd?kj cpr ;kstuk 255838 (-)4350 323462 8090
2. Mkd[kkuk lkof/kd tek ;kstuk
82311 29901 113718 37897
3. Mkd[kkuk vorhZ tek 86840 26275 99299 (-)9993
4. jk"Vªh; cpr i= ¼vkBoka fuxZe½
61247 28412 57773 25978
5. jk"Vªh; cpr i= ¼ukSoka fuxZe½
5528 5528 5668 5668
6. iqjkus jk"Vªh; cpr i=ksa dk fuiVku **
-- (-)47 19051 (-)19798
7. iqjkus i=@;kstuk *** -- -- -- --

207
IX. TRADE AND FINANCE9.11 Collections Under Small Savings Schemes in Delhi
(Rs. in Lakhs) 2015-2016 2016-2017
Schemesdqy fuoy dqy fuoy
Gross Net Gross Net6 7 8 9 1
540992 39035 656742 57137 1. Post Offi ce Savings Scheme
189943 90179 282704 93617 2. Post Offi ce Time DepositScheme
101838 (-)13999 174024 30443 3. Post Offi ce RecurringDeposit
40178 (-)6716 83600 (-)13814 4. National Saving Certifi cate(VIII Series)
2365 2353 40 12 5. National Saving Certifi cate(IX Series)
994 (-)5897 -- -- 6. Discharge of OldN.S.C.s**
-- -- 2242 (-)1246 7 Old Certifi cate/Scheme***

208
¼:- yk[kksa esa½
;kstuk,a
2013-14 2014-15
dqy fuoy dqy fuoyGross Net Gross N e t
1 2 3 4 58. lkekftd lqj{kk i=** -- -- -- --
9. bafnjk fodkl i=** -- (-)1409 -- --
10. yksd Hkfo"; fuf/k ¼cSad½ -- -- 1071585 440726
11. yksd Hkfo"; fuf/k ¼Mkd?kj½**
140759 92967 96548 28548
12. ekfld vk; ;kstuk 65389 (-)10681 81525 (-)21251
13. fdlku fodkl i= 295 (-)68487 100749 48971
14. ofj"V ukxfjdksa dh cpr ;kstuk ¼cSad½
5790 680
15. ofj"V ukxfjdksa dh cpr ;kstuk ¼Mkd ?kj½
14618 (-)21379 25789 (-)68344
16. lqO;oLFkk le`f) [kkrk
lzksr % la;qDr funs'kd] jk"Vªh; cpr laLFkku] Hkkjr ljdkj] ubZ fnYyhA(**) Old certifi cates/schemes means NSC,CS.DS,IVP,POTYDDC,NSS-1987 and 1992# This fi gure pertains to old and new series of KVP*** Old Certifi cate/Scheme means Discountinue Schemes, IVP, NSS-87, NSS-92

209
(Rs. in Lakhs)2015-16 2016-17
Schemesdqy fuoy dqy fuoy
Gross Net Gross Net6 7 8 9 1
-- -- 8. Social Security Certifi cate**
-- -- 9. Indira Vikas Patra**-- -- -- -- 10. Public Provident
Fund (Bank)119289 46881 193525 73714 11. Public Provident
Fund (Post offi ce)**141156 (-)81235 207257 (-)161751 12. Monthly Income
Scheme92856# 37762# 69547 84961 13. Kisan Vikas Patra
(New Series)-- -- -- -- 14 Sr. Citizen Saving
Scheme (Bank)78012 11359 86362 40369 15. Sr. Citizen Saving
Scheme (Post offi ce)15243 15242 24636 24599 16. Sukanya Samridhi
AccountSource : Offi ce of Joint Director, National Savings Institution, GOI, New Delhi.

210
X. ifjogu ,oa lapkjifjogu ,oa lapkj10-1 fnYyh esa iathdr eksVj xkfM+;k
¼31 ekpZ dks½
Ø-la- okgu dk uke 2009-10 2010-11 2011-12 2012-13
1 2 3 4 5
1 dkjsa rFkk thisa 2013680 2173323 2343113 2474087
2 eksVj lkbfdysa rFkk LdwVj
4055229 4342403 4644146 4962507
3 vkVks fjD'kk,a 86482 88181 88197 86838
4 VSfDl;ka 45240 57958 69780 70335
5 clsa 58047* 61471 64033 39694
6 ekyokgd xkfM+;k vkfn
193205 209370 228886 140942
7. bZ&fjD'kk -- -- -- --
;ksx 6451883 6932706 7438155 7774403
uksV % *jksxh&;ku vkSj vU; ;k=h okgu lfEefyr gSa Alzksr % ifjogu foHkkx] jk"Vªh; jkt/kkuh {ks=] fnYyh ljdkjA

211
X. TRANSPORT & COMMUNICATION10.1 Registered Motor Vehicle in Delhi
[As on 31st March]
2013-14 2014-15 2015-16 2016-17 S.No. Name of the Vehicle
6 7 8 9 1
2629343 2790566 2986579 3152710 1 Cars and Jeeps
5297697 5681265 6104070 6707891 2 Motor Cycles and Scooters
91840 81633 198137 174000 3 Auto Rickshaws
78686 79606 91073 148434 4 Taxis
40947 32540 43723 38265 5 Buses*
154654 161821 281159 231767 6 Goods Vehicles etc.
-- -- -- 29690 7 E-Rickshaws
8293167 8827431 9704741 10482757 Total
Note :-*Ambulance & other passanger vehicles includes.Source : Transport Department, Govt. of N.C.T. of Delhi.

212
X. ifjogu ,oa lapkjifjogu ,oa lapkj10-2 fnYyh esa ifjogu fuxe dh xfrfof/k;ka
2015-16
fooj.k Total Low Floor Std.
Non- Ac Ac1 2 3 4 5
1 csM+sa esa dqy clsa ¼vUr esa½ 4352 2506 1276 570
2 pkyw clsa ¼nSfud vkSlr½ 3817 2206 1056 555
3 ;k=h ¼yk[kksa esa½ 12944.24 8981.77 2475.59 1486.88
4 nSfud vkSlr ;k=h ¼vUr esa½
35.37 24.54 6.77 4.06
5 lapkfyr fd- ehVj ¼yk[kksa esa½
2673.50 1606.62 741.95 324.93
6 lapkfyr fd- ehVj ¼nSfud vkSlr yk[kksa esa½
7.31 4.39 2.03 0.89
7 vojks/k 10000 clksa ij 862 825 1154 453

213
X. TRANSPORT & COMMUNICATION10.2 Activities of Delhi Transport Corporation
2016-17Total Low Floor Std. Description
Non- Ac Ac6 7 8 9 14027 2506 1275 246 1 Total Buses in the Fleet
(At the end)3547 2238 1065 244 2 Buses on Road (Daily
Average)11516.52 8796.24 2063.42 656.86 3 Passengers (in Lakhs)
31.55 24.10 5.65 1.80 4 Daily Average Passengers (in Lakhs)
2578.71 1660.21 764.69 153.81 5 K. metres operated (in lakhs)
7.06 4.55 2.09 0.42 6 K. metres operated Daily Average (in lakhs)
763 706 952 461 7 Break-down per 10000 buses
Contd...

214
2015-16Total Low Floor Std.
fooj.k Non-Ac Ac
1 2 3 4 5
8 nq?kZVuk,a 153 89 44 20
cM+h 13 8 3 2
NksVh 110 68 35 7
9 fn- i- fu- ds vUrxZr jk"Vªh; jktèkkuh {ks= ds cl :V
11 -- -- --
10 fn- i- fu- ds odZ'kki 2 -- -- --
11 fn- i- fu- ds fMIkksa 43 -- -- --
uksV % vkdM+s dsoy fnYyh ifjogu dh clksa ls gh lEcfU/kr gSAlzksr % fnYyh ifjogu fuxe] ubZ fnYyh

215
2016-17
Total Low Floor Std.
Non- Ac Ac Description
6 7 8 9 1
128 82 35 11 8 Accidents
7 7 -- -- Major
93 60 26 7 Minor
9 -- -- -- 9 NCR Bus Route covered by D.T.C.
2 -- -- -- 10 D.T.C.Workshop
39 -- -- -- 11 D.T.C.Depots
Note : Data pertains to DTC buses only.Source : Delhi Transport Corporation, New Delhi.

216
X. ifjogu ,oa lapkjifjogu ,oa lapkj10-3 fnYyh esa Mkd ,oa nwjHkk"k lqfo/kk,a
¼31 ekpZ dkss½
fooj.k 2010 2011 2012 2013
1 2 3 4 5
1 Mkd ?kj 573 575 576 577
2 ySVj cDl 3096 2819 2640 2059
3 dqy VsyhQksu ¼la[;k½
31010425 41660422 45402224 43388800
4 ok;jykbZu Qksu 2710835 2838818 2912937 2962600
5 ok;jysl Qksu 28299590 38821604 42489287 40426200
lzksr% 1- lapkj ea=kky; Mkd foHkkx] Hkkjr ljdkj ubZ fnYyh2- nwjHkk"k vk;ksx] ,lVhVh foHkkx] lapkj Hkou ubZ fnYyh

217
X. TRANSPORT & COMMUNICATION10.3 Postal facilities in Delhi & Telephone Facilities in Delhi Service Area
(As on 31 March)
2014 2015 2016 2017 Description
6 7 8 9 1
561 551 554 554 1 Post Offi ces
2033 1648 1266 1187 2 Letter Boxes
45688835 49328987 50415825 52313016* 3 Total Telephones (No's)
3103986 3141390 3171185 3207341* 4 Wire Line Phones
42584849 46187597 47244640 49105675* 5 Wire Less Phones
Source : Ministry of Communication, Deptt. of Posts, Dak Bhawan,Sansad Marg, New Delhi.* as on Nov. 2016

218
X. ifjogu ,oa lapkjifjogu ,oa lapkj10-4 fnYyh esa lM+dsa
¼ekpZ dks½¼fdyksehVj esa½
vfHkdj.k 2010 2011 2012 2013
1 2 3 4 5
LFkkuh; fudk;1 fnYyh uxj fuxe 27139 27139 26459 23931
(i) bZ-Mh-,e-lh-(ii) ,l-Mh-,e-lh-(iii) ,u-Mh-,e-lh-
2 ubZ fnYyh uxj ikfydk 1290 1290 1290 12903 jk"Vªh; jkt/kkuh {ks=]
fnYyh ljdkj(i) jk"Vªh; ekxZ 356 360 360 360
(ii) vU; lM+dsa 2300 2400 3180 5708**4 Mh-,l-vkbZ-vkbZ-Mh-lh- 1317 1434 1434 14345 vkbZ ,aM ,Q lh 40 40 40 406 Mh- Mh- , 435 435
lzksr % LFkkuh; fudk; ,oa lkoZtfud fuekZ.k] foHkkx] jk"Vªh; jkt/kkuh {ks= fnYyh ljdkjA

219
X. TRANSPORT & COMMUNICATION10.4 Roads in Delhi
(As on March)
(In Lane Kilometer)
2014 2015 2016 Agency
6 7 8 1
Local bodies23931 1 M.C.D.
270' 162.24' (i) E.D.M.C9408' 9592' (ii) S.D.M.C3118" 3272.65' (iii) N.D.M.C
1290 1290 1290 2 New Delhi Municipal Council
3 Public Works Department (Delhi Govt.)
360 430 430 (i) National Highway5708** 6308** 6308** (ii) Other Roads1434# 1434# 1434# 4 DSIIDC
40# 40# 40# 5 I & FC435# 435# 435# 6 DDA
Source : Local Bodies & Public Works Department, Govt. of NCT of Delhi** including 3208 lane km taken over from MCD # as on 31 march 2013'in kilometers"in feet width$ as on 31 march 2015

220
XI.XI. f'k{kk f'k{kk11-1 fnYyh esa lk{kjrk dh izxfr11-1 fnYyh esa lk{kjrk dh izxfr
o"kZYear
dqy tula[;kTotal Population*
lk{kj O;fDrLiterate Persons
dqyTotal
Âiq#"kMale
L=hFemale
1 2 3 4 5
1941 917939 229603 171233 58370
(25.01) (31.99) (15.25)
1951 1744072 669073 424118 244955
(38.36) (42.99) (32.34)
1961 2658612 1402298 904801 497497
(52.75) (60.75) (42.55)
1971 4065698 2301605 1438268 863337
(56.61) (63.71) (47.75)
1981 6220406 3828326 2352883 1475443
(61.54) (68.40) (53.07)

221
XI. EDUCATION11.1 Progress of Literacy in Delhi
o"kZYear
dqy tula[;kPopulation*
lk{kj O;fDrLiterate Persons
dqyTotal
Âiq#"kMale
L=hFemale
1 2 3 4 5
1991 7813248 5882297 3539500 2342797
(75.29) (82.01) (66.99)
2001 11833658 9664764 5700847 3963917
(81.67) (87.33) (74.71)
2011 16787941 12737767 7194856 5542911
(86.2) (90.9) (80.8)
uksV % dks"Bdksa esa fn, x, vkadM+s izfr'kr gSaAÐNote : Figures given in parenthesis are percentages.*Excluding population of 0-6 age group.L=ksr % fnYyh tux.kuk funs'kky;] fnYyhASource : Directorate of Census Operations, Delhi.

222
XI.XI. f'k{kk f'k{kk11-2 ¼d½ Hkkjr rFkk jkT;ksa esa lk{kjrk nj11-2 ¼d½ Hkkjr rFkk jkT;ksa esa lk{kjrk nj
2011 (Literates)
Ø-la-S.No.
jkT;@la?k jkT; {ks=State/UT's
O;fDrPerson
iq#"kMale
L=hFemale
1 2 3 4 5
dqy Hkkjr 763498517 434683779 328814738
1. vkU/kz izns'k 50556760 28251243 22305517
2. v#.kkpy izns'k 766005 439868 326137
3. vklke 19177977 10568639 8609338
4. fcgkj 52504553 31608023 20896530
5. NÙkhlx<+ 15379922 8807893 6572029
6. xksok 1165487 615823 549664
7. xqtjkr 41093358 23474873 17618485
8. gfj;k.kk 16598988 9794067 6804921
9. fgekpy izns'k 5039736 2752590 2287146
10. tEew d'ehj 7067233 4264671 2802562
11. >kj[k.M 18328069 10882519 7445550
12. dukZVd 40647322 22508471 18138851
13. dsjy 28135824 13704903 14430921

223
XI. EDUCATION11.2 (a) Literacy Rate in India & States (in Percentage)
2011 (Literacy Rate)
O;fDrPerson
iq#"kMale
L=hFemale
State/UnionTerritories
6 7 8 1
73.0 80.9 64.6 All India
67.0 74.9 59.1 1.Andhra Pradesh
65.4 72.6 57.7 2. Arunachal Pradesh
72.2 77.8 66.3 3. Assam
61.8 71.2 51.5 4. Bihar
70.3 80.3 60.2 5. Chhatisgarh
88.7 92.6 84.7 6. Goa
78.0 85.8 69.7 7. Gujarat
75.6 84.1 65.9 8. Haryana
82.8 89.5 75.9 9. Himachal Pradesh
67.2 76.8 56.4 10. Jammu & Kashmir
66.4 76.8 55.4 11.Jharkhand
75.4 82.5 68.1 12. Karnataka
94.0 96.1 92.1 13. Kerala
Contd...

224
XI.XI. f'k{kk f'k{kk11-2 ¼d½ Hkkjr rFkk jkT;ksa esa lk{kjrk nj11-2 ¼d½ Hkkjr rFkk jkT;ksa esa lk{kjrk nj
2011 (Literates)
Ø-la-S.No.
jkT;@la?k jkT; {ks=State/UT's
O;fDrPerson
iq#"kMale
L=hFemale
1 2 3 4 5
14. e/; izns'k 42851169 25174328 17676841
15. egkjk"Vª 81554290 45257584 36296706
16 e.khiqj 1768181 960015 808166
17. es?kky; 1785005 913879 871126
18. fetksje 848175 438529 409646
19. ukxkySaM 1342434 723957 618477
20. mM+hlk 26742595 15089681 11652914
21. iatkc 18707137 10436056 8271081
22. jktLFkku 38275282 23688412 14586870
23. flfDde 444952 251269 193683
24. rfeyukMq 51837507 28040491 23797016
25. f=iqjk 2804783 1501369 1303414
26. mÙkj izns'k 114397555 68234964 46162591
27. mÙkjk[k.M 6880953 3863708 3017245
28. if'pe caxky 61538281 33818810 27719471

225
XI. EDUCATION11.2 (a) Literacy Rate in India & States (in Percentage)
2011 (Literacy rate)
O;fDrPerson
iq#"kMale
L=hFemale
State/UnionTerritories
6 7 8 1
69.3 78.7 59.2 14. Madhya Pradesh
82.3 88.4 75.9 15. Maharashtra
79.2 86.1 72.4 16. Manipur
74.4 76.0 72.9 17. Meghalaya
91.3 93.3 89.3 18. Mizoram
79.6 82.8 76.1 19. Nagaland
72.9 81.6 64.0 20. Orissa
75.8 80.4 70.7 21. Punjab
66.1 79.2 52.1 22. Rajasthan
81.4 86.6 75.6 23. Sikkim
80.1 86.8 73.4 24. Tamil Nadu
87.2 91.5 82.7 25. Tripura
67.7 77.3 57.2 26. Uttar Pradesh
78.8 87.4 70.0 27. Uttarakhand
76.3 81.7 70.5 28. West Bengal

226
XI.XI. f'k{kk f'k{kk11-2 ¼[k½ Hkkjr rFkk jkT;ksa esa lk{kjrk nj11-2 ¼[k½ Hkkjr rFkk jkT;ksa esa lk{kjrk nj
2011 (Literates)
Ø-la-S.No.
jkT;@la?k jkT; {ks=State/UT's
O;fDrPerson
iq#"kMale
L=hFemale
1 2 3 4 5
la?k jkT;
1. v.Meku fudksckj 294281 164377 129904
2. p.Mhx<+ 805438 465346 340092
3. Mh- ,u- gosyh 223230 142521 80709
4. neu rFkk nhi 188406 124643 63763
5. fnYyh 12737767 7194856 5542911
6. y{k}hi 52553 28023 24530
7. iqnqpsjh 957309 497378 459931

227
XI. EDUCATION11.2 (b) Literacy Rate in India & States (in Percentage)
2011 (Literacy rate)
O;fDrPerson
iq#"kMale
L=hFemale
State/UnionTerritories
6 7 8 1
86.6 90.3 82.4 1. A & N Island
86.0 90.0 81.2 2. Chandigarh
76.2 85.2 64.3 3. D & N Haveli
87.1 91.5 79.5 4. Daman and Diu
86.2 90.9 80.8 5. Delhi
91.8 95.6 87.9 6. Lakshdweep
85.8 91.3 80.7 7. Puducherry

228
XI.XI. f'k{kk f'k{kk
11-3 ¼d½ fnYyh esa f'k{kk laLFkk,a11-3 ¼d½ fnYyh esa f'k{kk laLFkk,a
laLFkk,a 2011-2012 2012-2013 2013-2014
1 2 3 4
1. mPprj ek/;fed fo|ky; 1427 1504 1627
2. ek/;fed fo|ky; 463 458 389
3. mPp izkFkfed fo|ky; 600 564 728
4. izkFkfed fo|ky; 2581 2580 2657
5. iwoZ izkFkfed fo|ky; 51 49 52
;ksx 5122 5155 5453

229
XI. EDUCATION11.3 (a) EDUCATIONAL INSTITUTIONS IN DELHI
2014-2015 2015-2016 2016-2017 Institutions
5 6 7 1
1674 1684 1704 1. Sr. Secondary School
385 393 400 2. Secondary School
933 940 933 3. Middle Schools
2766 2742 2700 4. Primary Schools
40 37 35 5. Pre Primary Schools
5798 5796 5772 Total

230
XI.XI. f'k{kk f'k{kk11-3 ¼[k½ fnYyh ds f'k{kk laLFkkuksa esa Nk=ksa dh la[;k11-3 ¼[k½ fnYyh ds f'k{kk laLFkkuksa esa Nk=ksa dh la[;k
¼ukekadu dqy d{kkvkas ds vk/kkj ij½¼ukekadu dqy d{kkvkas ds vk/kkj ij½
2013-2014 2014-2015
d{kk yM+dsBoys
yM+fd;kaGirls
;ksxTotal
yM+dsBoys
yM+fd;kaGirls
;ksxTotal
1 2 3 4 5 6 7
1- iwoZ izkFkfed fo|ky;
99379 91722 191101 108775 99247 208022
2- izkFkfed fo|ky;
I 173873 155973 329846 180812 164834 345646
II 189275 167178 356453 192913 170382 363295
III 203291 175801 379092 200904 175125 376029
IV 204976 175910 380886 210426 179618 390044
V 209539 175863 385402 217048 183460 400508
mi ;ksx 980954 850725 1831679 1002103 873419 1875522

231
XI. EDUCATION11.3 (b) Number of Students in Educational Institutions in Delhi
(ENROLMENT - CLASS-WISE TOTAL)
2015-2016 2016-2017
yM+dsBoys
yM+fd;kaGirls
;ksxTotal
yM+dsBoys
yM+fd;kaGirls
;ksxTotal Class
8 9 10 11 12 13 1
114960 100715 215675 118208 103889 2220971. Pre Primary
School
2. Primary School
181114 163184 344298 177066 158025 335091 I
195321 175583 370904 191284 171494 362778 II
201530 176382 377912 201503 179966 381469 III
207629 178000 385629 204492 177376 381868 IV
221693 186538 408231 216165 183751 399916 V
1007287 879687 1886974 990510 870612 1861122 Sub- Total

232
XI.XI. f'k{kk f'k{kk11-3 ¼[k½ fnYyh ds f'k{kk laLFkkuksa esa Nk=ksa dh la[;k11-3 ¼[k½ fnYyh ds f'k{kk laLFkkuksa esa Nk=ksa dh la[;k
¼ukekadu dqy d{kkvkas ds vk/kkj ij½¼ukekadu dqy d{kkvkas ds vk/kkj ij½
2013-2014 2014-2015
d{kk yM+dsBoys
yM+fd;kaGirls
;ksxTotal
yM+dsBoys
yM+fd;kaGirls
;ksxTotal
1 2 3 4 5 6 7
3- mPp izkFkfed fo|ky;
VI 202917 181625 384542 202221 174165 376386
VII 200987 169829 370816 195988 176627 372615
VIII 196506 165116 361622 198198 168354 366552
mi ;ksx 600410 516570 1116980 596407 519146 1115553
4- ek/;fed fo|ky;
IX 190909 156043 346952 217745 179895 397640
X 159422 138257 297679 132446 122057 254503
mi ;ksx 350331 294300 644631 350191 301952 652143

233
XI. EDUCATION11.3 (b) Number of Students in Educational Institutions in Delhi
(ENROLMENT - CLASS-WISE TOTAL)
2015-2016 2016-2017
yM+dsBoys
yM+fd;kaGirls
;ksxTotal
yM+dsBoys
yM+fd;kaGirls
;ksxTotal Class
8 9 10 11 12 13 1
3.Middle School
202558 177009 379567 205330 178966 384296 VI
197387 171817 369204 198948 175043 373991 VII
195620 175645 371265 197774 171318 369092 VIII
595565 524471 1120036 602052 525327 1127379 Sub- Total
4. Secondary School
233698 194757 428455 239455 213369 452824 IX
136835 126391 263226 152099 136008 288107 X
370533 321148 691681 391554 349377 740931 Sub- Total

234
XI.XI. f'k{kk f'k{kk11-3 ¼[k½ fnYyh ds f'k{kk laLFkkuksa esa Nk=ksa dh la[;k11-3 ¼[k½ fnYyh ds f'k{kk laLFkkuksa esa Nk=ksa dh la[;k
¼ukekadu dqy d{kkvkas ds vk/kkj ij½¼ukekadu dqy d{kkvkas ds vk/kkj ij½
2013-2014 2014-2015
d{kk yM+dsBoys
yM+fd;kaGirls
;ksxTotal
yM+dsBoys
yM+fd;kaGirls
;ksxTotal
1 2 3 4 5 6 7
5- mPprj ek/;fed fo|ky;
XI 182272 153318 335590 172394 148239 320633
XII 134912 130801 265713 122408 118736 241144
mi ;ksx 317184 284119 601303 294802 266975 561777
;ksx 2348258 2037436 4385694 2352278 2060739 4413017

235
XI. EDUCATION11.3 (b) Number of Students in Educational Institutions in Delhi
(ENROLMENT - CLASS-WISE TOTAL)
2015-2016 2016-2017
yM+dsBoys
yM+fd;kaGirls
;ksxTotal
yM+dsBoys
yM+fd;kaGirls
;ksxTotal Class
8 9 10 11 12 13 1
5. Sr. Secondary School
148213 133575 281788 138083 128156 266239 XI
119235 115447 234682 114678 110888 225566 XII
267448 249022 516470 252761 239044 491805 Sub- Total
2355793 2075043 4430836 2355085 2088249 4443334 Total

236
XI.XI. f'k{kk f'k{kk11-3 ¼x½ fnYyh ds f'k{kk laLFkkuksa esa vuqlwfpr tkfr Nk=ksa dh la[;k11-3 ¼x½ fnYyh ds f'k{kk laLFkkuksa esa vuqlwfpr tkfr Nk=ksa dh la[;k
¼ukekadu vuqlwfpr tkfr Nk=ksa ds vk/kkj ij½¼ukekadu vuqlwfpr tkfr Nk=ksa ds vk/kkj ij½
2013-2014 2014-2015
d{kk yM+dsBoys
yM+fd;kaGirls
;ksxTotal
yM+dsBoys
yM+fd;kaGirls
;ksxTotal
1 2 3 4 5 6 7
1- iwoZ izkFkfed fo|ky;
6883 7449 14332 7178 7603 14781
2- izkFkfed fo|ky;
I 16280 14957 31237 16053 15695 31748
II 19178 17416 36594 18465 17115 35580
III 22149 19696 41845 20615 18787 39402
IV 23162 20209 43371 23222 20760 43982
V 23779 20025 43804 24474 21572 46046
mi ;ksx 104548 92303 196851 102829 93929 196758

237
XI. EDUCATION11.3 (c) Number of Scehduled Castes Students in
Educational Institutions in Delhi (ENROLMENT - SC Student)
2015-2016 2016-2017
yM+dsBoys
yM+fd;kaGirls
;ksxTotal
yM+dsBoys
yM+fd;kaGirls
;ksxTotal Class
8 9 10 11 12 13 1
7820 7646 15466 7926 7629 15555 1. Pre Primary School
2. Primary School
15665 14706 30371 15097 14292 29389 I
18476 17217 35693 17444 16163 33607 II
20005 18274 38279 19765 18328 38093 III
21824 19699 41523 20760 19232 39992 IV
25052 21860 46912 23027 20783 43810 V
101022 91756 192778 96093 88798 184891 Sub- Total

238
XI.XI. f'k{kk f'k{kk11-3 ¼x½ fnYyh ds f'k{kk laLFkkuksa esa vuqlwfpr tkfr Nk=ksa dh la[;k11-3 ¼x½ fnYyh ds f'k{kk laLFkkuksa esa vuqlwfpr tkfr Nk=ksa dh la[;k
¼ukekadu vuqlwfpr tkfr Nk=ksa ds vk/kkj ij½¼ukekadu vuqlwfpr tkfr Nk=ksa ds vk/kkj ij½
2013-2014 2014-2015
d{kk yM+dsBoys
yM+fd;kaGirls
;ksxTotal
yM+dsBoys
yM+fd;kaGirls
;ksxTotal
1 2 3 4 5 6 7
3- mPp izkFkfed fo|ky;
VI 17057 17760 34817 16945 16115 33060
VII 18243 18277 36520 18279 19629 37908
VIII 19175 19059 38234 19529 19446 38975
mi ;ksx 54475 55096 109571 54753 55190 109943
4- ek/;fed fo|ky;
IX 21791 20456 42247 26854 25234 52088
X 17441 17865 35306 13387 15132 28519
mi ;ksx 39232 38321 77553 40241 40366 80607

239
XI. EDUCATION11.3 (c) Number of Scehduled Castes Students in
Educational Institutions in Delhi (ENROLMENT - SC Student)
2015-2016 2016-2017
yM+dsBoys
yM+fd;kaGirls
;ksxTotal
yM+dsBoys
yM+fd;kaGirls
;ksxTotal Class
8 9 10 11 12 13 1
3. Middle School
17424 17446 34870 17817 17676 35493 VI
18150 17452 35602 18668 18316 36984 VII
19309 21137 40446 19081 18168 37249 VIII
54883 56035 110918 55566 54160 109726 Sub- Total
4. Secondary School
29789 28183 57972 30527 30067 60594 IX
14117 16183 30300 17207 18196 35403 X
43906 44366 88272 47734 48263 95997 Sub- Total

240
XI.XI. f'k{kk f'k{kk11-3 ¼x½ fnYyh ds f'k{kk laLFkkuksa esa vuqlwfpr tkfr Nk=ksa dh la[;k11-3 ¼x½ fnYyh ds f'k{kk laLFkkuksa esa vuqlwfpr tkfr Nk=ksa dh la[;k
¼ukekadu vuqlwfpr tkfr Nk=ksa ds vk/kkj ij½¼ukekadu vuqlwfpr tkfr Nk=ksa ds vk/kkj ij½
2013-2014 2014-2015
d{kk yM+dsBoys
yM+fd;kaGirls
;ksxTotal
yM+dsBoys
yM+fd;kaGirls
;ksxTotal
1 2 3 4 5 6 7
5- mPprj ek/;fed fo|ky;
XI 24730 23573 48303 22319 22269 44588
XII 18139 20444 38583 15230 17356 32586
mi ;ksx 42869 44017 86886 37549 39625 77174
;ksx 248007 237186 485193 242550 236713 479263

241
XI. EDUCATION11.3 (c) Number of Scehduled Castes Students in
Educational Institutions in Delhi (ENROLMENT - SC Student)
2015-2016 2016-2017
yM+dsBoys
yM+fd;kaGirls
;ksxTotal
yM+dsBoys
yM+fd;kaGirls
;ksxTotal Class
8 9 10 11 12 13 1
5. Sr. Secondary School
17527 19025 36552 15907 17565 33472 XI
13980 16269 30249 13256 15149 28405 XII
31507 35294 66801 29163 32714 61877 Sub- Total
239138 235097 474235 236482 231564 468046 Total

242
XI.XI. f'k{kk f'k{kk11-3 ¼?k½ fnYyh ds f'k{kk laLFkkuksa esa vuqlwfpr tu tkfr Nk=ksa dh la[;k11-3 ¼?k½ fnYyh ds f'k{kk laLFkkuksa esa vuqlwfpr tu tkfr Nk=ksa dh la[;k
¼ukekadu vuqlwfpr tu tkfr Nk=ksa ds vk/kkj ij½¼ukekadu vuqlwfpr tu tkfr Nk=ksa ds vk/kkj ij½
2013-2014 2014-2015
d{kk yM+dsBoys
yM+fd;kaGirls
;ksxTotal
yM+dsBoys
yM+fd;kaGirls
;ksxTotal
1 2 3 4 5 6 7
1- iwoZ izkFkfed fo|ky;
352 305 657 331 354 685
2- izkFkfed fo|ky;
I 677 556 1233 722 585 1307
II 732 599 1331 764 596 1360
III 759 627 1386 746 628 1374
IV 765 596 1361 775 719 1494
V 793 664 1457 782 742 1524
mi ;ksx 3726 3042 6768 3789 3270 7059

243
XI. EDUCATION11.3 (d) Number of Scehduled Tribes Students in
Educational Institutions in Delhi (ENROLMENT - ST Student)
2015-2016 2016-2017
yM+dsBoys
yM+fd;kaGirls
;ksxTotal
yM+dsBoys
yM+fd;kaGirls
;ksxTotal Class
8 9 10 11 12 13 1
427 399 826 543 469 1012 1. Pre primary school
2. Primary School
681 625 1306 818 689 1507 I
771 729 1500 776 605 1381 II
744 654 1398 823 670 1493 III
748 633 1381 856 624 1480 IV
1099 691 1790 852 704 1556 V
4043 3332 7375 4125 3292 7417 Sub- Total

244
XI.XI. f'k{kk f'k{kk11-3 ¼?k½ fnYyh ds f'k{kk laLFkkuksa esa vuqlwfpr tu tkfr Nk=ksa dh la[;k11-3 ¼?k½ fnYyh ds f'k{kk laLFkkuksa esa vuqlwfpr tu tkfr Nk=ksa dh la[;k
¼ukekadu vuqlwfpr tu tkfr Nk=ksa ds vk/kkj ij½¼ukekadu vuqlwfpr tu tkfr Nk=ksa ds vk/kkj ij½
2013-2014 2014-2015
d{kk yM+dsBoys
yM+fd;kaGirls
;ksxTotal
yM+dsBoys
yM+fd;kaGirls
;ksxTotal
1 2 3 4 5 6 7
3- mPp izkFkfed fo|ky;
VI 612 485 1097 656 548 1204
VII 633 570 1203 675 537 1212
VIII 610 572 1182 678 562 1240
mi ;ksx 1855 1627 3482 2009 1647 3656
4- ek/;fed fo|ky;
IX 712 549 1261 820 619 1439
X 588 556 1144 638 547 1185
mi ;ksx 1300 1105 2405 1458 1166 2624

245
XI. EDUCATION11.3 (d) Number of Scehduled Tribes Students in
Educational Institutions in Delhi (ENROLMENT - ST Student)
2015-2016 2016-2017
yM+dsBoys
yM+fd;kaGirls
;ksxTotal
yM+dsBoys
yM+fd;kaGirls
;ksxTotal Class
8 9 10 11 12 13 1
3. Middle School
602 552 1154 712 618 1330 VI
669 595 1264 679 576 1255 VII
704 554 1258 688 611 1299 VIII
1975 1701 3676 2079 1805 3884 Sub- Total
4. Secondary School
799 627 1426 862 639 1501 IX
628 513 1141 709 564 1273 X
1427 1140 2567 1571 1203 2774 Sub- Total

246
XI.XI. f'k{kk f'k{kk11-3 ¼?k½ fnYyh ds f'k{kk laLFkkuksa esa vuqlwfpr tu tkfr Nk=ksa dh la[;k11-3 ¼?k½ fnYyh ds f'k{kk laLFkkuksa esa vuqlwfpr tu tkfr Nk=ksa dh la[;k
¼ukekadu vuqlwfpr tu tkfr Nk=ksa ds vk/kkj ij½¼ukekadu vuqlwfpr tu tkfr Nk=ksa ds vk/kkj ij½
2013-2014 2014-2015
d{kk yM+dsBoys
yM+fd;kaGirls
;ksxTotal
yM+dsBoys
yM+fd;kaGirls
;ksxTotal
1 2 3 4 5 6 7
3- mPprj ekè;fed fo|ky;
XI 699 619 1318 706 660 1366
XII 538 627 1165 516 589 1105
mi ;ksx 1237 1246 2483 1222 1249 2471
;ksx 8470 7325 15795 8809 7686 16495

247
XI. EDUCATION11.3 (d) Number of Scehduled Tribes Students in
Educational Institutions in Delhi (ENROLMENT - ST Student)
2015-2016 2016-2017
yM+dsBoys
yM+fd;kaGirls
;ksxTotal
yM+dsBoys
yM+fd;kaGirls
;ksxTotal Class
8 9 10 11 12 13 1
5. Sr. Secondary School
649 640 1289 717 666 1383 XI
552 582 1134 562 604 1166 XII
1201 1222 2423 1279 1270 2549 Sub- Total
9073 7794 16867 9597 8039 17636 Total

248
XI.XI. f'k{kk f'k{kk11-3 ¼M½ fnYyh ds f'k{kk laLFkkuksa esa v/;kidksa dh la[;k11-3 ¼M½ fnYyh ds f'k{kk laLFkkuksa esa v/;kidksa dh la[;k
2013-2014 2014-2015
d{kk iq#"kMale
efgykFemale
;ksxTotal
iq#"kMale
efgykFemale
;ksxTotal
1 2 3 4 5 6 7
1- iwoZ izkFkfed fo|ky;
0 187 187 0 162 162
2- izkFkfed fo|ky;
7330 20982 28312 7284 22262 29546
3- mPp izkFkfed fo|ky;
1471 7845 9316 1733 10008 11741
4- ek/;fed fo|ky;
2744 7038 9782 2389 6981 9370
5- mPprj ek/;fed fo|ky;
26140 63835 89975 25120 63541 88661
;ksx 37685 99887 137572 36526 102954 139480
L=ksr&f'k{kk funs'kky;] jk"Vªh; jkt/kkuh {ks=] fnYyh ljdkjA

249
XI. EDUCATION11.3 (e) Number of Teachers in Educational Institutions in Delhi
2015-2016 2016-2017
iq#"kMale
efgykFemale
;ksxTotal
iq#"kMale
efgykFemale
;ksxTotal Class
8 9 10 11 12 13 1
0 131 131 0 116 116 1. Pre Primary Schools
7573 21873 29446 7567 21400 28967 2. Primary Schools
1719 10596 12315 1765 11026 12791 3. Middle Schools
2615 7677 10292 2465 7144 9609 4. Secondary School
26635 67274 93909 26626 71062 96788 5. Sr. Secondary School
38542 107551 146093 38723 109848 148271 Total
Source:- Directorate of Education , Govt. of NCT of Delhi

250
XI.XI. f'k{kk f'k{kk11-4 ¼d½ fnYyh esa mPp f'k{kk laLFkk,a11-4 ¼d½ fnYyh esa mPp f'k{kk laLFkk,a
2013-2014 2014-2015
laLFkk,a yM+dsBoys
yM+fd;kaGirls
lgf'k{kkCo-Edn.
;ksxTotal
yM+dsBoys
yM+fd;kaGirls
lgf'k{kkCo-Edn.
;ksxTotal
1 2 3 4 5 6 7 8 9
1- fo'o fo|ky; 0 1 10 11 0 1 10 11
2- fo'o fo|ky; ds lekUrj le>h tkus okyh laLFkk,a
0 0 12 12 0 0 12 12
3- jk"Vªh; egRo dh laLFkk,a
0 0 3 3 0 0 3 3
4- lkekU; f'k{kk egkfo|ky;
0 24 61 85 0 24 61 85
5- O;olkf;d f'k{kk egkfo|ky;
0 2 95 97 0 2 95 97
;ksx 0 27 181 208 0 27 181 208

251
XI. EDUCATION11.4 (a) Higher Educational Institutions in Delhi
2015-2016 2016-2017
yM+dsBoys
yM+fd;kaGirls
lgf'k{kkCo-Edn.
;ksxTotal
yM+dsBoys
yM+fd;kaGirls
lgf'k{kkCo-Edn.
;ksxTotal
Institutions
10 11 12 13 14 15 16 17 1
0 1 11 12 0 1 11 12 1. Universities
0 0 12 12 0 0 11 11 2. Institutions deemed as Universities
0 0 3 3 0 0 4 4 3. Institutions of National Importance
0 24 60 84 0 24 60 84 4. Colleges for General Education
0 2 98 100 0 8 94 102 5. Colleges for Professional Education
0 27 184 211 0 33 180 213 Total

252
XI.XI. f'k{kk f'k{kk11-4 ¼[k½ mPp f'k{kk laLFkkuksa esa Nk=ksa dh la[;k11-4 ¼[k½ mPp f'k{kk laLFkkuksa esa Nk=ksa dh la[;k
2013-2014 2014-2015
laLFkk,a yM+dsBoys
yM+fd;kaGirls
;ksxTotal
yM+dsBoys
yM+fd;kaGirls
;ksxTotal
1 2 3 4 5 6 7
1- fo|ky; dkWyst rFkk vU; laLFkk,a
558195 515391 1073586 580963 536148 1117111
;ksx 558195 515391 1073586 580963 536148 1117111

253
XI. EDUCATION11.4 (b) Number of Students in Higher Educational Institutions
2015-16 2016-2017
yM+dsBoys
yM+fd;kaGirls
;ksxTotal
yM+dsBoys
yM+fd;kaGirls
;ksxTotal Institutions
8 9 10 11 12 13 14
848810 758769 1607579 727817 646141 1373958 Universities Colleges & Other Institutions
848810 758769 1607579 727817 646141 1373958 Total

254
XI.XI. f'k{kk f'k{kk11-4 ¼x½ mPp f'k{kk laLFkkuksa esa vuqlwfpr tkfr@vuqlwfpr tu tkfr 11-4 ¼x½ mPp f'k{kk laLFkkuksa esa vuqlwfpr tkfr@vuqlwfpr tu tkfr
ds Nk=ksa dh la[;kds Nk=ksa dh la[;k
2013-14 2014-15
laLFkk,ayM+dsBoys
yM+fd;kaGirls
dqyTotal
yM+dsBoys
yM+fd;kaGirls
dqyTotal
1 2 3 4 5 6 7
1- fo'ofo|ky; dkWyst rFkk vU; laLFkk,a
48109 36966 85075 71010 53079 124089
dqy 48109 36966 85075 71010 53079 124089
11-4 ¼?k½ mPp f'k{kk laLFkkuksa esa izk/;kidksa dh la[;k11-4 ¼?k½ mPp f'k{kk laLFkkuksa esa izk/;kidksa dh la[;k
2013-2014 2014-15
laLFkk,aiq:"kMale
efgykWomen
dqyTotal
iq:"kMale
efgykWomen
dqyTotal
1 2 3 4 5 6 7
1- fo'ofo|ky; dkWyst rFkk vU; laLFkk,a
2474 1156 3630 1895 985 2880
dqy 2474 1156 3630 1895 985 2880
L=ksr % mPp f'k{kk funs'kky;] fnYyh ljdkjA

255
XI. EDUCATION11.4 (c) Number of SC/ST Students in Higher Educational Institutions
2015-16 2016-17
yM+dsBoys
yM+fd;kaGirls
dqyTotal
yM+dsBoys
yM+fd;kaGirls
dqyTotal Institutions
8 9 10 11 12 13 1
99307 82658 181965 97768 159372 257140 1. Universities Colleges & Other Institu-tions
99307 82658 181965 97768 159372 257140 Total
11.4 (d) Number of Lecturers/Professors in Higher Educational Institutions in Delhi
2015-2016 2016-17
iq:"kMale
efgykWomen
dqyTotal
iq:"kMale
efgykWomen
dqyTotal
Institutions
8 9 10 11 12 13 1
3546 1701 5247 3548 1752 5300 1. Universities Colleges & Other Institu-tions
3546 1701 5247 3548 1752 5300 Total
Source : Dte. of Higher Education, Govt. of NCT of Delhi.

256
XI.XI. f'k{kk f'k{kk11-5 ¼d½ izf'k{k.k vkSj rduhdh f'k{kk funs'kky;] jk"Vªh; jkt/kkuh {ks=] 11-5 ¼d½ izf'k{k.k vkSj rduhdh f'k{kk funs'kky;] jk"Vªh; jkt/kkuh {ks=]
fnYyh ljdkj ds v/khu rduhdh f'k{kk laLFkk,afnYyh ljdkj ds v/khu rduhdh f'k{kk laLFkk,a
2013&2014 2014&2015
laLFkk,a yM+dsBoys
yM+fd;kaGirls
lgf'k{kkCo-Edn.
dqy Total
yM+dsBoys
yM+fd;kaGirls
lgf'k{kkCo-Edn.
dqy Total
1 2 3 4 5 6 7 8 9
1- vkbZ-Vh-vkbZ-
0 5 11 16 0 4 13 17
2- vkbZ-Vh-lh- 4 26 31 61 4 26 31 61
3- ch-Vh-lh- 0 0 1 1 0 0 1 1
4- lh-,l-vkbZ-@ch-ch-,l-
0 0 1 1 0 0 1 1
5- MCY;w-lh-,l-lh- 0 0 1 1 0 0 1 1
6- ikSyhVsDuhd 0 3 18 21 0 3 17 20
;ksx 4 34 63 101 4 33 64 101

257
XI. EDUCATION11.5 (a) Number of Institutions under the Dte. of Training and
Technical Education, Govt. of NCT of Delhi
2015-16 2016-2017
yM+dsBoys
yM+fd;kaGirls
lgf'k{kkCo-Edn.
dqy Total
yM+dsBoys
yM+fd;kaGirls
lgf'k{kkCo-Edn.
dqy Total
Institutions
10 11 12 13 14 15 16 17 1
0 4 13 17 0 5 14 19 1. I.T.I’s
4 26 31 61 4 26 33 63 2. ITCs**
0 0 1 1 0 0 1 1 3. BTC
0 0 1 1 0 0 1 1 4. CSI/IBBS
0 0 1 1 0 0 1 1 5. WCSC
0 3 17 20 0 3 16 19 6. Polytechnic*
4 33 64 101 4 34 66 104 Total
** Out of 63 Private ITI's/ITC affi liated only 35 Private Institute ITI's/ITC have admitted the condidates during 2016-17

258
XI.XI. f'k{kk f'k{kk11-5 ¼[k½ fnYyh esa rduhdh f'k{k.k laLFkkvksa esa Nk=ksa dh la[;k11-5 ¼[k½ fnYyh esa rduhdh f'k{k.k laLFkkvksa esa Nk=ksa dh la[;k
2013&14 2014&2015
laLFkk,a yM+dsBoys
yM+fd;kaGirls
dqy Total
yM+dsBoys
yM+fd;kaGirls
dqy Total
1 2 3 4 5 6 7
1- vkbZ-Vh-vkbZ- 5698 2843 8541 5830 2474 8304
2- vkbZ-Vh-lh- 1583 709 2292 1653 811 2464
3- ch-Vh-lh- 538 147 685 638 110 748
4- lh-,l-vkbZ-@ch-ch-,l-
78 26 104 72 16 88
5- MCY;w-lh-,l-lh- 111 63 174 186 69 255
6- ikSyhVsDuhd 12363 3156 15519 12695 3068 15763
;ksx 20371 6944 27315 21074 6548 27622

259
XI. EDUCATION11.5 (b) No. of Students in Technical Educational Institutions in Delhi
2015-16 2016-2017
yM+dsBoys
yM+fd;kaGirls
dqy Total
yM+dsBoys
yM+fd;kaGirls
dqy Total Institutions
8 9 10 11 12 13 1
8542 3133 11675 8477 4294 12771 1. I.T.I’s
2067 543 2610 3711 716 4427 2. ITCs**
445 85 530 553 128 681 3. BTC
65 25 90 88 30 118 4. CSI/IBBS
111 252 363 391 212 603 5. WCSC
13694 3288 16982 12237 3331 15568 6. Polytechnic*
24924 7326 32250 25457 8711 34168 Total

260
XI.XI. f'k{kk f'k{kk11-5 ¼x½ fnYyh esa rduhdh f'k{k.k laLFkkvksa esa vuqlwfpr tkfr@11-5 ¼x½ fnYyh esa rduhdh f'k{k.k laLFkkvksa esa vuqlwfpr tkfr@
tutkfr ds Nk=ksa dh la[;ktutkfr ds Nk=ksa dh la[;k
2013&2014 2014&2015
laLFkk,a yM+dsBoys
yM+fd;kaGirls
dqy Total
yM+dsBoys
yM+fd;kaGirls
dqy Total
1 2 3 4 5 6 7
1- vkbZ-Vh-vkbZ- 1391 634 2025 1821 719 2540
2- vkbZ-Vh-lh- 216 103 319 223 119 342
3- ch-Vh-lh- 143 46 189 107 24 131
4- lh-,l-vkbZ-@ch-ch-,l-
21 5 26 21 6 27
5- MCY;w-lh-,l-lh- 19 17 36 30 10 40
6- ikSyhVsDuhd 2371 660 3031 2412 657 3069
;ksx 4161 1465 5626 4614 1535 6149

261
XI. EDUCATION11.5 (c) No. of SC/ST Students in Technical Educational
Institutions in Delhi
2015-16 2016-2017
yM+dsBoys
yM+fd;kaGirls
dqy Total
yM+dsBoys
yM+fd;kaGirls
dqy Total
Institutions
8 9 10 11 12 13 1
2074 775 2849 2048 635 2683 1. I.T.I’s
300 118 418 446 65 511 2. ITCs**
91 19 110 114 36 150 3. BTC
22 4 26 27 9 36 4. CSI/IBBS
64 44 108 90 44 134 5. WCSC
2559 682 3241 2309 687 2996 6. Polytechnic*
5110 1642 6752 5034 1476 6510 Total

262
XI.XI. f'k{kk f'k{kk11-5 ¼?k½ fnYyh esa rduhdh f'k{k.k laLFkkvksa esa v/;kidksa dh la[;k11-5 ¼?k½ fnYyh esa rduhdh f'k{k.k laLFkkvksa esa v/;kidksa dh la[;k
2013&2014 2014&2015
laLFkk,a iq#"kMale
efgykFemale
dqy Total
iq#"kMale
efgykFemale
dqy Total
1 2 3 4 5 6 7
1- vkbZ-Vh-vkbZ- 543 172 715 593 175 768
2- vkbZ-Vh-lh- 169 94 263 169 94 263
3- ch-Vh-lh- 26 6 32 30 8 38
4- lh-,l-vkbZ-@ch-ch-,l-
2 1 3 1 1 2
5- MCY;w-lh-,l-lh- 9 4 13 4 3 7
6- ikSyhVsDuhd 580 339 919 552 285 837
;ksx 1329 616 1945 1349 566 1915
*ljdkjh] ljdkjh lgk;rk izkIr] izk;ksftr vkSj futh**futh vkSj izf'k{k.k vkSj rduhdh f'k{kk funs'kky; ls lac)vkbZ-Vh-vkbZ- & vkS|ksfxd izf'k{k.k laLFkkuvkbZ-Vh-lh- & vkS|ksfxd izf'k{k.k dsUæch-Vh-lh- & izkjafHkd izf'k{k.k laLFkkulh-,l-vkbZ- & okf.kfT;d {ks= laLFkkuL=ksr % izf'k{k.k vkSj rduhdh f'k{kk funs'kky;] fnYyh ljdkjA

263
XI. EDUCATION11.5 (d) NO. OF TEACHERS IN TECHNICAL EDUCATIONAL
INSTITUTIONS IN DELHI
2015-2016 2016-2017
iq#"kMale
efgykFemale
dqy Total
iq#"kMale
efgykFemale
dqy Total
Institutions
8 9 10 11 12 13 1
516 145 661 552 164 716 1. I.T.I’s
109 49 158 158 64 222 2. ITCs**
23 8 31 17 7 24 3. BTC
1 1 2 26 6 32 4. CSI/IBBS
6 5 11 6 4 10 5. WCSC
543 267 810 549 309 858 6. Polytechnic*
1198 475 1673 1308 554 1862 Total
*Govt., Govt. Aided, Sponsored & Private**Private & Affi liated with TTE.Abbreviations of Cources :—ITI’s :—Industrial Training Institutes.ITC’s :—Industrial Training Centres.BTC :—Basic Training CentresCSI :—Commercial Sector Institutes.Source : Directorate of Training & Technical Education, Govt. of NCT of Delhi.

264
XI.XI. f'k{kk f'k{kk11-6 fnYyh esa dsUæh; cksMZ ds ijh{kk ifj.kke11-6 fnYyh esa dsUæh; cksMZ ds ijh{kk ifj.kke
11.6 Examination Results of Central Board of Secondary Examination in Delhi
o"kZYear
ijh{kk esa cSBs fo|kFkhZStudents appeared
ijh{kk esa mÙkh.kZ fo|kFkhZStudents Passed
d{kk Class
yM+ds Boys
yM+fd;ka Girls
dqyTotal
yM+ds Boys
yM+fd;ka Girls
dqyTotal
izfr'kr%age
1 2 3 4 5 6 7 82011Sec 165621 142559 308180 158045 137332 295377 95.85Sr. Sec 114084 103542 217626 93071 92893 185964 85.452012Sec 192655 167166 359821 187978 164358 352336 97.92Sr. Sec 119442 109024 228466 96916 98185 195101 85.402013Sec 178922 155337 334259 175541 153382 328923 98.40Sr. Sec 133657 125341 258998 110181 114584 224765 86.782014Sec 169109 148054 317163 165527 146291 311818 98.31Sr. Sec 148861 141602 290463 122199 129875 252074 86.782015Sec 142860 132408 275268 136319 128745 265064 96.29Sr. Sec 134451 128910 263361 109701 117137 226838 86.132016Sec 147936 137094 285030 134626 126908 261534 91.76Sr. Sec 131122 125667 256789 108192 115247 223439 87.012017Sec 192370 175329 367699 150015 137129 287144 78.09Sr. Sec 120014 117646 237660 109243 100791 210034 88.37Source : Central Board of Secondary Education.

265
XI.XI. f'k{kk f'k{kk11-7 fnYyh o Hkkjr esa dsUæh; cksMZ ds ijh{kk ifj.kke ¼izfr'kr esa½11-7 fnYyh o Hkkjr esa dsUæh; cksMZ ds ijh{kk ifj.kke ¼izfr'kr esa½
11.7 Examination Results of Central Board of Secondary Examination in Delhi & India (in percentage)
fnYyhDELHI
bafM;kINDIA
o"kZYear
ikl izfr'krPassed Percentage
Âikl izfr'krPassed Percentage
yM+ds yM+fd;ka dqy yM+ds yM+fd;ka dqyClass Boys Girls Total Boys Girls Total 1 2 3 4 5 6 72011Sec 95.43 96.33 95.85 96.28 97.08 96.61Sr. Sec 81.58 89.72 85.45 76.78 86.57 80.882012Sec 97.57 98.32 97.92 97.98 98.48 98.19Sr. Sec 81.14 90.06 85.40 75.80 86.21 80.192013Sec 98.11 98.74 98.40 98.64 98.94 98.76Sr. Sec 82.44 91.42 86.78 77.78 87.98 82.102014Sec 97.88 98.81 98.31 98.74 99.06 98.87Sr. Sec 82.09 91.72 86.78 78.27 88.52 82.662015Sec 95.42 97.23 96.29 96.98 97.82 97.32Sr. Sec 81.59 90.87 86.13 77.77 87.56 82.002016Sec 91.00 92.57 91.76 96.11 96.36 96.21Sr. Sec 82.51 91.71 87.01 78.85 88.58 83.052017Sec 77.98 78.21 78.09 93.44 92.50 93.06Sr. Sec 91.03 85.67 88.37 78.88 85.34 82.02NOTE :—All India includes Ajmer, Chandigarh, Delhi, Guwahati, Chennai,Allahabad, Patna, and Bhubanneswar for the year 2011, 2012 & 2013.

266
XII. XII. LokLF;LokLF;12.1 12.1 fnYyh esa fpfdRlk lqfo/kk,a ¼31-12-2016 dks½fnYyh esa fpfdRlk lqfo/kk,a ¼31-12-2016 dks½
vfHkdj.k dk uke
Allopathic,syksiSfFkd
Ayurvedic/Unanivk;qosZfnd@;wukuh
In Nos. la[;k In Nos la[;kHosp.
vLirkyBeds'kS¸;k,
Hosp.vLirky
Beds'kS¸;k,
1 2 3 4 51 fnYyh ljdkj @ 34 9266 2 5102 LokLF; lsok funs'kky; -- -- -- --3 fnYyh uxj fuxe 13# 3592## 12### 210**4 ubZ fnYyh fuxe ifj"kn % 2 215 -- --5 Hkkjr ljdkj LokLF; lsok,aC 2 30 1 256 Mh-th-,p-,l- * 3 4203 -- --7 bZ-,l-vkbZ- ¼Je ea=ky;½ 4 1416 -- --8 jsyos 2 442 -- --9 j{kk ea=ky;@fnYyh NkouhB 3 2148 -- --10 Lok;'kklh ¼dsaæ ljdkj½ $ 3 2960 -- --11 xSj ljdkjh iathÑr ifjpk;Z
x`g@LoSfPNd laLFkk
1057 26816 -- --
dqy 1123 51088 15 745

267
XII. HEALTH12.1 Medical Facilities in Delhi (as on 31.12.2016)
Homeopathic gksE;ksiSfFkd
In Nos. la[;k esas
Primary Health Centre
izkFkfed LokLF; dsaæ Name of Orgnisation Hosp. vLirky
Beds 'kS¸;k,
Nos.la[;k
Beds'kS¸;k,
6 7 8 9 12 150 -- -- 1 Delhi Govt. @-- -- -- -- 2 DHS-- -- 2 10 3 MCD-- -- -- -- 4 NDMC %-- -- -- -- 5 CGHS C-- -- 3 10 6 DGHS *-- -- -- -- 7 ESI(Min of Labour)-- -- -- -- 8 Railways-- -- -- -- 9 Min. of Defence/ Delhi Cantt. B-- -- -- -- 10 Autonomous(Central Govt.) $-- -- -- -- 11 Pvt. Reg. Nursing Homes/
Voluntry Org2 150 5 20 TOTAL
1. @ As per Annual Report 2015-162.C -As per record available on website of CGHS.3.* SJH 1531,RML 1420, LHMC12524.B As per record available on 31.12.2155.$ includes AIIMS, LRS and Patel chest (Delhi University) and No of Beds information received telephonically from AIIMS-2362,LRS470, Patel chest 128 No of beds are the beds sanctioned in the Hospital/facilities.6.# NDMC 5 major hospitals+1 Colony hospital, SDMC 3 colony hospitals+1 TB Hosp., EDMC 1 +1 leprosy home +1 TB Chest Hosp.##NDMC 3020, SDMC 90+45 TB Hosp. Beds, EDMC 370+19 Leprosy home+48 TB Chest clinic###NDMC 7, SDMC2, EDMC 3** North Delhi Municipal Corporation 2107.%-Beds in Chark Palika Hospital-150, Palika Maternity Hospital-658. EDMC pancharma hospital-3, SDMC 2 Panchkarma Hospital

268
XII. XII. LokLF;LokLF;12.1 12.1 fnYyh esa fpfdRlk lqfo/kk,a ¼31-12-2016 dks½fnYyh esa fpfdRlk lqfo/kk,a ¼31-12-2016 dks½
vfHkdj.k dk uke
izlwrh o f'k'kq@dY;k.k dsaæ
Maternal/Maternity Child Welfare
Centre
Vh-ch- DyhfudT.B.Clinic
Nosla[;k
Beds 'kS¸;k,
Nos la[;k
Beds'kS¸;k,
1 2 3 4 51 fnYyh ljdkj -- -- -- --2 LokLF; lsok funs'kky; -- -- -- --3 fnYyh uxj fuxe 185@ 290& 10S --4 ubZ fnYyh fuxe ifj"kn 7 0 1 --5 Hkkjr ljdkj LokLF; lsok,a C 1 40 --6 Mh-th-,p-,l- 0 0 -- --7 vkbZ-,l-,l- foHkkx ¼vk;q"k½ # -- -- -- --8 bZ-,l-vkbZ- ¼Je ea=ky;½ -- -- -- --9 jsyos -- -- -- --
10 j{kk ea=ky;@fnYyh Nkouh A -- -- -- --11 Lok;'kklh ¼dsaæ ljdkj½ -- -- -- --12 xSj ljdkjh iathÑr ifjpk;Z
x`g@LoSfPNd laLFkk
-- -- -- --
dqy 193 330 11 0
L=ksr % LokLF; lsok egkfuns'kd] jk"Vªh; jktèkkuh {ks=] fnYyh ljdkj

269
XII. HEALTH12.1 Medical Facilities in Delhi (as on 31.12.2016)
Dispensaries
Name of OrgnisationAllopathic,syksiSfFkd
Ayur/Unani vk;qosZfnd@;wukuh
Homeopathic gksE;ksiSfFkd
Nosla[;k
Nosla[;k
Nosla[;k
6 7 8 1-- -- -- 1 Delhi Govt.
485* -- -- 2 DHS102P 159W 41D 3 MCD22** 15 13 4 NDMC
97 18 15 5 CGHS C-- -- -- 6 DGHS-- 58 101 7 Deptt. of ISM (AYUS) #
32 8 4 8 ESI (Min. of Labour)13 -- -- 9 Railways1 -- -- 10 Min. of Defence/Delhi
Cantt. A72$ -- 2 11 Autonomous Central
Govt.)-- -- -- 12 Pvt. Reg. Nursing
Homes/V oluntry Org824 258 176 TOTAL
1.*242 allopathic, 107 Mohalla clinic, 23 Polyclinic, 43 MHC,-70SHC (As per Annual Report 2015-16)2. C-As per data received.3. A- As per record available as on 31.12.20154. $This includes dispensary of DJB, NDPl, RBI, IGPL, BSES, TRANSCO, SBI, DTC5. # As per annual report 2015-166. @SDMC 50MCWC+8MH+2PP units+6 Sub centres+5 Mobile M&CW centres, NDMC 08MH+79MCWC, EDMC 7MH+20MCWC &EDMC107, SDMC 99, NDMC 84S EDMC2(.2Chest Clinic), SDMC 1(1Chest Clinic), NDMC 7P EDMC 17(9 Allop.Disp+8 MHC), SDMC21 (7Polyclinics+1UHC+9 Mobile Allop.Disp.+4 School Health Clinics), NDMC (30+16+01+11+06)W EDDMC 24 AYURVEDIC DISPENSARY +03 UNANI DISPENSARY, SDMC 33 Ayurvedic Dispensary+10 Unani+01 Diabetic centre(Ayur),NDMC 69+19D EDMC10+NDMC 25 +SDMC 06**13 Allopathic Dispensary, (08 School health clinics & 01 Polyclinics AS PER RECORD FROM 31.12.2015).7. MCWC -Maternity/Maternity Child Welfare Centre and MHJ Maternity Homes

270
XII. XII. LokLF;LokLF;12.2 (12.2 (d) ) fnYyh esa ifjokj dY;k.k dk;ZØefnYyh esa ifjokj dY;k.k dk;ZØe
fooj.k 2011-12 2012-13 2013-14
1 2 3 4
ifjokj dY;k.k dsUæ 99 98 92
iksLV ikVZl ;wfuV lfgr
vuqizosf"kr ywi 42293 47164 58293
ulcafn;ka 19279 20107 19181
iq:"k 2634 1563 1401
L=h 16645 18544 17780
eq[; lsok fVfd;ka ¼pؽ 195204 213992 207872
daMkse ¼’000½ 8954 9325 5373
L=ksr % ifjokj dY;k.k funs'kky;] jk"Vªh; jkt/kkuh {ks=] fnYyh ljdkj

271
XII. HEALTH12.2 (a) Family Welfare Programme in Delhi
2014-15 2015-16 2016-17 Description
5 6 7 1
77 NA NA Family Welfare Centres including post partum units
71754 80293 84370 Insertion of Intrauterine Contraceptive Device (IUCD)
17458 17383 18869 Sterilizations
811 901 1323 Males
16647 16482 17546 Females
196354 185499 199092 Oral Pills (Cycles)
3990 5709 6880 Condoms (’000)
Source : Directorate of Family Welfare, Govt. of NCT of Delhi.

272
XII. HEALTH12.2 (b) Family Welfare Programme in Delhi
Description 2014-15 2015-16 2016-17
1 2 3 4
1 No. of pregnant women received 3 ANC check ups during pregnancy
512186 554481 563171
2 Deliveries conducted at Public Institutions (Including C - Sections)
205471 208616 211930
3 Deliveries conducted at Private Institutions (Including C - Sections)
42528 44139 43087
4 No. of children (9 to 11 months old fully immunised ( BCG +DPT123/Pentavlent 123+OPV+Measles)
277215 296438 281032
5 No. of Infants (more than 16 months old) received Measles, Mumps, Rubella (MMR) Vaccination
212207 155695 296998
Source : Directorate of Family Welfare, Govt. of NCT of Delhi.

273
XII. LokLF;LokLF;12.2(c) Family Welfare Programme in Delhi
Infant Young Child Feeding (IYCF)
Description 2014-15 2015-16 2016-17
1 2 3 4
S.No. Total No. of Reporting Hospitals/Mat. Homes
28 26 --
1 No. of pregenant women counseled 168808 142967 124759
2 No. of Lactating women counseled 128554 125518 102383
3 Out of above (1+2) women detected and counseled for feeding diffi culties
31189 29304 24810
4 No. of <1 year children detected with Protien Energy Malnutrition
5662 4686 3655
5 No. of children 1 to 3 years detected with Protien Energy Malnutrition
6833 7855 5673
6 No. of women counseled for complementary feeding
38580 45164 34847
7 No. of low birth babies <2.5 kg whose mothers have been counseled on breast feeding
20983 20232 14711
8 Total No. of malnourished <5 years children admitted and treated
3962 3355 8223
L=ksr % ifjokj dY;k.k funs'kky;] jk"Vªh; jktèkkuh {ks=] fnYyh ljdkj

274
XII. LokLF;LokLF;12.2(d) Family Welfare Programme in Delhi
Data on Adolescent Reproductive and Sexual Health (ARSH)
fooj.k 2015-2016
S.No. 1 2 3 4 5
Description Male Female
Age Group
10 - 14 15 - 19 10 - 14 15 - 19
1 No. of Clients registered 18114 17455 21579 25881
2 No. of Clients who received clinical services
12069 12626 16794 20824
3 No. of Clients who received Counselling Services
12750 11917 13992 17838
4 No. of Clients reffered to other Facilities
435 386 473 718
12.2 (e) Report of ( SNCU) Sick Neonatal Care Unit among the 16 indentifi ed Hospitals (including Delhi Govt. and MCD)
2015-2016 2016-17
No. of Admission in the Unit 19270 19193
No. of Deaths 1049 1154
L=ksr % ifjokj dY;k.k funs'kky;] jk"Vªh; jktèkkuh {ks=] fnYyh ljdkj

275
XII. HEALTH12.2(d) Family Welfare Programme in Delhi
Data on Adolescent Reproductive and Sexual Health (ARSH)
2016-17 fooj.k
6 7 8 9 1
Male Female Description
Age Group
10 - 14 15 - 19 10 - 14 15 - 19
762 668 2198 2467 1 Total No. of Clients registered
652 582 1846 2088 2 Total No. of Clients who received clinical services
518 528 1289 1635 3 Total No. of Clients who received Counselling Services
04 13 56 147 4 Total No. of Clients reffered to other Facilities
Note:- Data includes report from only 25 adolecent friendly clinics that have been established as per GOI norms under Rashtriya Kishor Swasthya Karyakarm
12.2(f) Maternal Deaths
2014-15 2015-16 2016-17
399 442 508
Source : Directorate of Family Welfare, Govt. of NCT of Delhi.

276
XIII. Je ,oa jkstxkjJe ,oa jkstxkj13-1 fnYyh ds jkstxkj dk;kZy; dh pkyw jftLVj esa 13-1 fnYyh ds jkstxkj dk;kZy; dh pkyw jftLVj esa
izkfFkZ;ksa dk O;olkf;d foHkktuizkfFkZ;ksa dk O;olkf;d foHkktu
¼31 fnlEcj dks½
oxZ 2009 2010 2011 2012
1 2 3 4 5
1. O;olkf;d] rduhdh ,oa vU; lacafèkr dk;ZdrkZ
54203 98567 165666 226292
2. iz'kklfud] lapkyu ,oa vU; izca/kdh; dk;ZdrkZ
1117 1453 1897 2656
3. fyfidh; ,oa lacaf/kr dk;ZdrkZ 6669 49535 104390 171616
4. foØ; dk;ZdrkZ -- 16933 29651 57247
5. Ñ"kd] eNsjs] f'kdkjh] dckM+h ,oa lacafèkr dk;ZdrkZ
4480 6346 11963 14070
6. mRiknu ,oa lacaf/kr dk;ZdrkZ] ifjogu midj.k pkyd
13532 21428 30892 38389

277
XIII. LABOUR & EMPLOYMENT13.1 Occupational Distribution of Applicant on Live Register of
the Employment Exchanges of Delhi
(As on 31st December)
2013 2014 2015 2016 Group
6 7 8 9 1
276427 329233 360697 379683 1. Professional, Technical andRelated Workers
3429 4148 5008 5645 2. Administrative, Executive andManagerial Workers
231735 296164 338049 363509 3. Clerical and Related Workers
87043 104047 119048 122604 4. Sales Workers
26758 30104 31692 33472 5. Farmers, Fishermen Hunters,Loggers & Related Workers
44895 51061 56165 62263 6. Production & RelatedWorkers,TransportEquipment operators

278
XIII. Je ,oa jkstxkjJe ,oa jkstxkj13-1 fnYyh ds jkstxkj dk;kZy; dh pkyw jftLVj esa 13-1 fnYyh ds jkstxkj dk;kZy; dh pkyw jftLVj esa
izkfFkZ;ksa dk O;olkf;d foHkktuizkfFkZ;ksa dk O;olkf;d foHkktu
¼31 fnlEcj dks½
oxZ 2009 2010 2011 2012
1 2 3 4 5
7. lsok lacaf/kr dk;ZdÙkkZ 44929 64253 124008 169545
8. vdq'ky vuqlkj 13693 17939 21536 24450
9. O;olk; vuqlkj vfoHkkftr dk;ZdÙkkZ miyC/k ugha
275906 216930 153300 70304
;ksx 414539 493384 643303 774569
lzksr % jkstxkj funs'kky;] jk"Vªh; jkt/kkuh {ks=] fnYyh ljdkjA

279
XIII. LABOUR & EMPLOYMENT13.1 Occupational Distribution of Applicant on Live Register of the
Employment Exchanges of Delhi
(As on 31st December)
2013 2014 2015 2016 Group
6 7 8 9 1
214020 251841 277283 294062 7. Service Workers
26782 29049 32033 34258 8. Unskilled Workers
1691 1809 1834 1868 9. Workers not classifi ed by occupation/not available
912780 1097456 1221809 1297364 Total
Source : Directorate of Employment, Govt. of N.C.T. of Delhi.

280
XIII. Je ,oa jkstxkjJe ,oa jkstxkj13-2 fnYyh ds jkstxkj dk;kZy; dh pkyw jftLVj esa 13-2 fnYyh ds jkstxkj dk;kZy; dh pkyw jftLVj esa
izkfFkZ;ksa dk f'k{kk vuqlkj foHkktuizkfFkZ;ksa dk f'k{kk vuqlkj foHkktu
¼31 fnlEcj dks½
oxZ 2009 2010 2011 2012
1 2 3 4 5
1. eSfVªd ls de 51575 73259 91925 106362
2. eSfVªd ls gk;j lSdsUMªh o baVjehfM,V
297757 296047 389742 467479
3. Lukrd ¼dqy½ 50391 86394 113248 138683
a. dyk 36837 55716 69036 81956
b. foKku 2256 4861 7077 9028
c. okf.kT; 4471 9875 14391 18271
d. bathfu;fjax 1242 1983 2663 3537
e. fpfdRlk 11 31 365 448
f. Ñf"k -- -- --
g. f'k{kk 3847 10052 14859 18778
h. fof/k 60 183 302 402
i. vU; 1667 3693 4555 6263

281
XIII. LABOUR & EMPLOYMENT13.2 Educational Classifi cation of Applicant on the Live Register of
the Employment Exchanges in Delhi
(As on 31st December)
2013 2014 2015 2016 Group
6 7 8 9 1
128040 137158 141749 144774 1. Below Matric
495423 616019 656088 686859 2. Matric, HigherSecondary &Intermediate
158728 180021 195450 209762 3. Graduates (Total)
92098 103184 111412 118446 a. Arts
10492 11956 12877 13971 b. Science
21832 25656 28379 31104 c. Commerce
4478 5395 6106 7020 d. Engineering
510 555 667 1260 e. Medical
-- -- -- -- f. Agriculture
21101 23639 25523 27167 g. Education
454 502 534 580 h. Law
7763 9134 9952 10214 i. Others

282
XIII. Je ,oa jkstxkjJe ,oa jkstxkj13-2 fnYyh ds jkstxkj dk;kZy; dh pkyw jftLVj esa 13-2 fnYyh ds jkstxkj dk;kZy; dh pkyw jftLVj esa
izkfFkZ;ksa dk f'k{kk vuqlkj foHkktuizkfFkZ;ksa dk f'k{kk vuqlkj foHkktu
¼31 fnlEcj dks½
oxZ 2009 2010 2011 2012
1 2 3 4 54. LukrdksÙkj ¼dqy½ 6050 14323 19249 24491
a. dyk 3102 7448 10248 12799
b. foKku 748 1532 2150 2763
c. okf.kT; 566 1140 1679 2120
d. bathfu;fjax 34 59 86 120
e. fpfdRlk 36 53 69 82
f. f'k{kk 143 426 597 770
g. fof/k 1 1 2 2
h. vU; 1420 3664 4418 5835
5. fMIyksek /kkjd 8766 23361 29139 37554
;ksx 414539 493384 643303 774569
L=ksr % jkstxkj funs'kky;] jk"Vªh; jktèkkuh {ks=] fnYyh ljdkjA
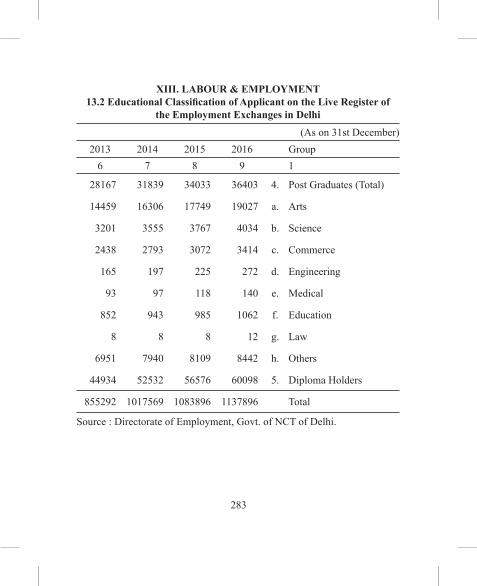
283
XIII. LABOUR & EMPLOYMENT13.2 Educational Classifi cation of Applicant on the Live Register of
the Employment Exchanges in Delhi
(As on 31st December)2013 2014 2015 2016 Group
6 7 8 9 1
28167 31839 34033 36403 4. Post Graduates (Total)
14459 16306 17749 19027 a. Arts
3201 3555 3767 4034 b. Science
2438 2793 3072 3414 c. Commerce
165 197 225 272 d. Engineering
93 97 118 140 e. Medical
852 943 985 1062 f. Education
8 8 8 12 g. Law
6951 7940 8109 8442 h. Others
44934 52532 56576 60098 5. Diploma Holders
855292 1017569 1083896 1137896 Total
Source : Directorate of Employment, Govt. of NCT of Delhi.

284
XIII. Je ,oa jkstxkjJe ,oa jkstxkj13-3 fnYyh ds jkstxkj dk;kZy;ksa laca/kh lead13-3 fnYyh ds jkstxkj dk;kZy;ksa laca/kh lead
fooj.k 2009 2010 2011 2012
1 2 3 4 5
1. dk;kZy;ksa dk iz;ksx djus okys lsok ;kstd
600 833 611 475
2. jkstxkj dk;kZy; 15 12 12 12
3. iath;u ¼*000½ 93 127 164 138
4. dk;Z fnyk;s x;s izkFkhZ 20 8651 175 1349
5. ?kksf"kr fjDr LFkku 90 28351 21600 7293
6. var esa pkyw iathdk esa izkFkhZ ¼*000½
461 588 753 891
L=ksr % jkstxkj funs'kky;] jk"Vªh; jktèkkuh {ks=] fnYyh ljdkjA

285
XIII. LABOUR & EMPLOYMENT13.3 Regional Employment Exchanges Statistics of Delhi
2013 2014 2015 2016 Description
6 7 8 9 1
438 485 365 289 1. Employers using Exchanges
12 12 12 12 2. Employment Exchanges
159 148 133 73 3. Registration (’000)
73 417 176 102 4. Applicants placed
6022 4285 3043 3280 5. Vacancies notifi ed
1050 1198 1331 1404 6. Applicants on the LiveRegister at the end (’000)
Source : Directorate of Employment, Govt. of NCT of Delhi.

286
XIII. Je ,oa jkstxkjJe ,oa jkstxkj13-4 fnYyh ds jkstxkj dk;kZy; dh pkyw jftLVj esa vuqlwfpr 13-4 fnYyh ds jkstxkj dk;kZy; dh pkyw jftLVj esa vuqlwfpr
tkfr@tutkfr ,oa foDykax O;fDrtkfr@tutkfr ,oa foDykax O;fDr
fooj.k 2009 2010 2011 2012
1 2 3 4 5
iq#"k 330812 423092 541560 637596
L=h 129991 165362 211311 253602
dqy O;fDr 460803 588454 752871 891198
vuqlwfpr tkfr 117606 152230 198125 241171
vuqlwfpr tutkfr 8381 9969 11791 13143
HkwriwoZ lSfud 310 657 1025 1411
viax 2816 4864 7273 8990
¼d½ va/ks 219 403 646 811
¼[k½ xwaxs cgjs 281 465 710 846
¼x½ gM~Mh jksxh 2316 3996 5688 7068
¼?k½ vU; 229 265
vU; 331690 420734 534657 626483
L=ksr % jkstxkj funs'kky;] jk"Vªh; jktèkkuh {ks=] fnYyh ljdkjA

287
XIII. LABOUR & EMPLOYMENT13.4 Scheduled Castes, Scheduled Tribes & Physically HandicappedPersons on the Live Register of the Employment Exchanges in Delhi
2013 2014 2015 2016 Description
6 7 8 9 1
749007 847727 937846 986033 Men
301475 350445 393344 417678 Women
1050482 1198172 1331190 1403711 Total Persons
297198 341553 380076 401149 Scheduled Castes
14785 16403 18198 19207 Scheduled Tribes
1709 2121 2395 2620 Ex-Service Men
10727 12549 14158 15173 Physically Handicapped
963 1146 1305 1412 (a) Blind
1011 1173 1375 1499 (b) Deaf & Dumb
8453 9898 11087 11827 (c) Orthopaedic cases
300 332 391 402 (d) Others
726063 825546 916363 965562 Others
Source : Directorate of Employment, Govt. of NCT of Delhi.

288
XIII. Je ,oa jkstxkjJe ,oa jkstxkj13-5 fnYyh esa Jfed la?k13-5 fnYyh esa Jfed la?k
fooj.k 2006 2007 2008 2009 2010
1 2 3 4 5 6
1. o"kZ ds vkjaHk esa Jfed la?k 1600 1011 1053 1084 1118
2. o"kZ ds varxZr iathÑr Jfed la?k
22 43 33 39 30
3. o"kZ ds varxZr foyksfir Jfed la?k
611 1 2 5 1
4. o"kZ ds var esa fo|eku Jfed la?k
1011 1053 1084 1118 1147
L=ksr % Je vk;qDr] jk"Vªh; jkt/kkuh {ks=] fnYyh ljdkj

289
XIII. LABOUR & EMPLOYMENT13.5 Trade Unions in Delhi
2011 2012 2013 2014 2015 2016 Description
7 8 9 10 1
1147 1198 1238 1244 1284 1299 Trade Unions at thebeginning of the year
51 40 7 40 15 21 Trade Unions reg-isteredduring the year
- - 1 - - - Trade Unions can-celled+closed during the year
1198 1238 1244 1284 1299 1320 Trade Unions at theend of the year
Source : Labour Commissioner, Govt. of NCT of Delhi.

290
XIII. Je ,oa jkstxkjJe ,oa jkstxkj13-6 fnYyh esa gM+rky o rkyk cUnh ls ifjf.kr vkS|ksfxd fookn13-6 fnYyh esa gM+rky o rkyk cUnh ls ifjf.kr vkS|ksfxd fookn
fooj.k 2007 2008 2009 2010
1 2 3 4 5
1. vof/k ds varxZr vkjaHk gq, fookn — 1 4 3
2. vof/k ds var ij vfuf.kZr fookn — — 2 —
3. izLrkfor etnwjksa dh la[;k
¼d½ izR;{k % — 196 604 772
¼[k½ vizR;{k % — — — —
4. dqy Je tu fnol gkfu — — 1961 21040
L=ksr % Je vk;qDr] jk"Vªh; jkt/kkuh {ks=] fnYyh ljdkj

291
XIII. LABOUR & EMPLOYMENT13.6 Industrial Disputes resulting in Strikes & lock-outs in Delhi
2011 2012 2013 2014 2015 2016 Description
6 7 8 9 1
— 1 — — — — 1. Disputes startedduring the period
— — — — — — 2. Disputes unsettled at the end of the period
3. No. of WorkersInvolved
— 150 — — — — (a) Directly
— 40 — — — — (b) Indirectly
— 3230 — — — — 4. Total no. of Man-days lost
Source : Labour Commissioner, Govt. of NCT of Delhi.

292
XIII. Je ,oa jkstxkjJe ,oa jkstxkj13-7 jk"Vªh; jkt/kkuh {ks= fnYyh ds fofHkUu vuqlwfpr O;olk;ksa esa U;wure 13-7 jk"Vªh; jkt/kkuh {ks= fnYyh ds fofHkUu vuqlwfpr O;olk;ksa esa U;wure
osru dh njsa ¼izfrfnu@izfrekg½osru dh njsa ¼izfrfnu@izfrekg½
¼#i;s esa½
Js.khCategory
2016
vizSy April
vDVwcjOctober
Per Day Per Month Per Day Per Month1 2 3 4 5
vn{k 365 9568 374 9724
v/kZn{k 407 10582 414 10764
n{k 447 11622 455 11830
Dysfjdy ,aM uku&VSfDudy lqijokbtjh LVkQ
uku&eSfVªd 407 10582 414 10764
eSfVªdqysV~l rFkk uku&xzstq,V~l
447 11622 455 11830
xzstq,V~l rFkk blls Åij 487 12662 495 12370
L=ksr % Je vk;qDr] jk"Vªh; jkt/kkuh {ks=] fnYyh ljdkj

293
XIII.LABOUR & EMPLOYMENT13.7 Minimum Rates of Wages in Scheduled Employment in the
National Capital Territory of Delhi (Per Day/Per Month)
(In Rs.)2017 Js.kh
CategoryvizSy April
Per Day Per Month6 7 1
513 13350 Unskilled
565 14698 Semi-skilled
622 16182 Skilled
Clerical & Non-Technical Supervisory Staff
565 14698 Non-Matric
622 16182 Matriculates but not Graduates
677 17604 Graduates & Above
Source : Labour Commissioner, Govt. of NCT of Delhi.

294
XIV. lgdkfjrklgdkfjrk14-1 fnYyh esa lgdkjh lfefr;ka
fooj.k 2007-08 2008-09 2009-10 2010-11 2011-12
1 2 3 4 5 6
1 iathd`r lgdkjh lfefr;ka dh la[;k
5381 5413 5434 5455 5483
2 dk;Z'khy lgdkjh lfefr;ksa dh la[;k
2229 2256 3772 3793 3821
3 lnL;rk ¼^000½ 1387 1389 1391 1392 1394
4 va'k iwth ¼:- yk[kksa esa½*
9762 9827 9869 9914 9974
5 fu{ksi ¼:- yk[kksa esa½
219658 219724 219766 219813 219872
lzksr % iath;d] lgdkjh lfefr;ka] jk"Vªh; jkt/kkuh {ks=] fnYyh ljdkjA

295
XIV. COOPERATION14.1 Co-operative Societies in Delhi
2012-13 2013-14 2014-15 2015-16 2016-17 Description
7 8 9 10 11 1
5526 5541 5549 5589 5648 1 No. of Regd. Societies
3864 3879 3887 3927 3986 2 No. of Working Societies
1396 1397 1397.5 1400 1403 3 Membership (‘ 000)
10063 10093.40 10110.82 10194.96 10319.95 4 Share Capital (R s. in Lakhs)*
219961 219991.34 220008.82 220093.22 220218.57 5 Deposits (Rs. in Lakhs)
Source : Registrar, Coop. Societies, Govt. of NCT of Delhi.* For Group Housing/Housing societies-fi gures are not available after year 2002

296
XIV. lgdkfjrklgdkfjrk14-2 ¼d½ miHkksDrk lgdkjh LVksjksa dh izxfr
lnL;rkMembership
LVksj dk uke 2014-2015 2015-2016 2016-2017
1 2 3 4
1 fnYyh miHkksDrk lgdkjh Fkksd LVksj fyfeVsM
601 601 600
2 dsUnzh; Hk.Mkj lgdkjh LVksj fyfeVsM
91531 92146 93242
3 fnYyh Qy o lCth miHkksDrk lgdkjh QsMjs'ku fyfeVsM
70 70 70
;ksx 92202 92817 93912

297
XIV. COOPERATION14.2(a) Progress of Consumer Cooperative Stores
dqy 'ks;j iwath ¼yk[kksa esa½
Total Share Capital (In Lakhs)
'kk[kkvksa dh la[;kNo. of Branches
2014-2015
2015-2016
2016-2017
2014-2015
2015-2016
2016-2017
Name of the Store
5 6 7 8 9 10 136.31 36.31 36.30 102 104 103 1 Delhi Consumer
Coop. Wholesale Store Ltd.
97.14 98.26 100.06 147 146 148 2 Kendriya Bhandar Coop. Store Ltd.
3.48 3.48 3.48 28 28 28 3 3. Delhi Fruit & Vegetable Consumer Coop. Federation Ltd.
136.93 138.05 139.84 277 278 279 Total

298
XIV. lgdkfjrklgdkfjrk14-2 ¼[k½ miHkksDrk lgdkjh LVksjksa dh izxfr
yk[kksa esa fcØhSales (In Lakhs)
LVksj dk uke 2014-2015 2015-2016 2016-2017
1 3 4 4
1 fnYyh miHkksDrk lgdkjh Fkksd LVksj fyfeVsM
44832 48937 48526
2 dsUnzh; Hk.Mkj lgdkjh LVksj fyfeVsM
82516 102086 86437
3 fnYyh Qy o lCth miHkksDrk lgdkjh QsMjs'ku fyfeVsM
673 681 813
;ksx 128021 151704 135776
lzksr % iath;d] lgdkjh lfefr;ka] jk"Vªh; jkt/kkuh {ks=] fnYyh ljdkjA

299
XIV. COOPERATION14.2 (b)Progress of Consumer Cooperative Stores
ykHk ¼yk[kksa esa½Profi t (In Lakhs)
2014-2015 2015-2016 2016-2017 Name of the Store
5 6 7 1
386.34 589.91 N.A 1 Delhi Consumer Coop. Wholesale Store Ltd.
673.31 661.39 695.8 2 Kendriya Bhandar Coop. Store Ltd.
1.64 1.67 2.19 3 3. Delhi Fruit & Vegetable Consumer Coop. Federation Ltd.
1061.29 1252.97 697.99 Total
Source : Registrar, Cooperative Societies, Govt. of N.C.T. of Delhi.

300
XIV. lgdkfjrklgdkfjrk14-3 ¼d½ oxhZdj.k vuqlkj iathd`r lgdkjh lfefr;ka
iathd`r lfefr;kaRegd. Societies (No.)
dk;Zdkjh lfefr;ka ¼la[;k½Working Societies (No.)
oxhZdj.k 2015-2016 2016-2017 2015-2016 2016-2017
1 2 3 4 5
1 vkS|ksfxd 1206 1206 793 793
2 lgdkjh ¼Vh- o lh- cSad½
1361 1420 1202 1261
3 HkaMkj 568 568 350 350
4 vkoklh; 133 133 105 105
5 lkewfgd 1966 1966 1296 1296
6 iSdst ¼xzkeh.k½ 183 183 92 92
7 cgqmís'kh; 170 170 88 88
8 lsok lfefr;ka 2 2 1 1
;ksx 5589 5648 3927 3986

301
XIV. COOPERATION14.3 (a) Category-wise Registered Cooperative Societies
lnL;rk ¼^000 la[;k½ Membership (’000 Nos.)
2015-2016 2016-2017 Category
6 7 1
29 29 1 Industrial
983.75 987 2 Urban (T&C Banks)
85 85 3 Stores
33 33 4 Housing
220 220 5 Group Housing
40 40 6 Package (Rural)
9 9 7 Multi-Purpose
0 0 8 Service Society
1400 1403 Total
Note : Membership rounded upto two decimal place

302
XIV. lgdkfjrklgdkfjrk14-3 ¼[k½ oxhZdj.k vuqlkj iathd`r lgdkjh lfefr;ka
va'k iwath ¼:- yk[kksa esa½Share Capital (Rs. in Lakhs)
oxhZdj.k 2014-2015 2015-2016 2016-2017
1 2 3 4
1 vkS|ksfxd 333.38 333.38 333.38
2 lgdkjh ¼Vh- o lh- cSad½
6012.17 6096.31 6221.30
3 HkaMkj 289.59 289.59 289.59
4 vkoklh; 32.95 32.95 32.95
5 lkewfgd vkoklh; 3381.62 3381.62 3381.62
6 iSdst ¼xzkeh.k½ 50.76 50.76 50.76
7 cgqmís'kh; 9.35 9.35 9.35
8 lsok lfefr;ka 1.00 1.00 1.00
dqy 10110.82 10194.96 10319.95
lzksr % iath;d] lgdkjh lfefr;ka] jk"Vªh; jkt/kkuh {ks=] fnYyh ljdkjA

303
XIV. COOPERATION14.3 (b) Category-wise Registered Cooperative Societies
fu{ksi ¼:- yk[kksa esa½Deposits (Rs. in Lakhs)
2014-2015 2015-2016 2016-2017 Category
5 6 7 1
285.23 285.23 285.23 1 Industrial
203678.20 203762.60 203887.95 2 Urban (T&C Banks)
1543.43 1543.43 1543.43 3 Stores
143.90 143.90 143.90 4 Housing
14334.10 14334.10 14334.10 5 Group Housing
8.54 8.54 8.54 6 Package (Rural)
14.42 14.42 14.42 7 Multi-Purpose
1.00 1.00 1.00 8 Service Society
220008.82 220093.22 220218.57 Total
Source : Registrar, Coop. Societies, Govt. of NCT of Delhi.

304
XV. iqfyl] vijk/k ,oa nq?kZVuk,aiqfyl] vijk/k ,oa nq?kZVuk,a15-1 fnYyh esa iqfyl Fkkus] iqfyl pkSfd;ka o deZpkjh
fooj.k 2013 2014 2015 2016 Description
1 2 3 4 5 1
1 iqfyl Fkkus 181 181 190 192 1 Police Stations
2 iqfyl pkSfd;ka 23 23 21 21 2 Police Posts
3 iqfyl ij O;; ¼djksM+ $ :-½
NA NA NA NA 3 Expenditure on Police (Rs. In Crore)*
4 iqfyl deZpkjh 4 Police Strength
(i) vk;qDr] fo'ks"k vk;qDr] la;qDr vk;qDr vkSj vfrfjDr iqfyl vk;qDr
50 50 50 52 (i) Commissioner, Spl. Commissioner, Joint Commissioner and Addl. Commissioner of Police
* foÙkh; o"kZ dh rjg*As per Financial Year

305
XV. POLICE, CRIMES & ACCIDENTS15.1 Police Stations, Police Posts and Police strength in Delhi
fooj.k 2013 2014 2015 2016 Description
1 2 3 4 5 1
(ii) mi o lgk;d vk;qDr
455 455 455 455 (ii) Deputy and Asstt. Commissioner of Police
(iii) fujh{kd o mifujh{kd
7461 7461 7461 7464 (iii) Inspectors & Sub-Inspectors
(iv) lgk;d mi&fujh{kd o eq[; flikgh
27569 27569 27569 27577 (iv) Asstt. Sub-Inspectors & Head Constables
(v) flikgh o ?kqM+lokj flikgh o vU;
49001 49001 49001 49048 (v) Constables & Mounted Constables & Others
;ksx 84536 84536 84536 84596 Total
Source : Dy. Commissioner of Police, Crime (CRO & PRO), Delhi.

306
XV. iqfyl] vijk/k ,oa nq?kZVuk,aiqfyl] vijk/k ,oa nq?kZVuk,a15-2 fnYyh esa vijk/k
fooj.k 2013 2014 2015 2016 Description
1 2 3 4 5 1
1 gR;k 517 586 570 528 1 Murder
2 MdSrh 33 82 75 46 2 Dacoity
3 ywVikV 1245 6464 7407 4761 3 Robbery
4 lsaèkekjh 2835 10309 12848 14307 4 Burglary
5 pksjh 30124 78753 104432 130928 5 Theft
6 gR;k ds iz;kl 585 770 770 646 6 Attempt to Murder
7 vkxtuh 97 190 224 183 7 Arson
8 LFkkuh; ,oa fo'ks"k dkuwu ds v/khu vijk/k
6616 9908 8599 7401 8 Crime under Local and Special Laws
9 vkbZ ih lh ds vèkhu vU; vijkèk
38537 50498 55871 50720 9 Miscellaneous I.P.C. Cases.
10 cykRdkj 1636 2166 2199 2155 10 Rape

307
XV. POLICE, CRIMES & ACCIDENTS15.2 Crimes in Delhi
fooj.k 2013 2014 2015 2016 Description
1 2 3 4 5 1
11 ngst ls e`R;q
144 153 122 162 11 Dowry Death
12 NsM+ NkM+ 916 1361 1492 918 12 Eve Teasing
13 efgykvksa ls nqO;ogkj
3515 4322 5367 4165 13 Molestation of Women
14 >iVuk NA NA NA NA 14 Snatch Theft
15 okgu pksjh
NA NA NA NA 15 Motor vehicle Theft
;ksx 86800 165562 199976 216920 Total
Year Missing Persons No. of Persons Traced2015 M F T M F T
Below 18 Yrs.
3636 4292 7928 2801 2957 5758
Above 18 Yrs.
8607 8135 16742 5568 4977 10545
Year Missing Persons No. of Persons Traced2016 M F T M F T
Below 18 Yrs.
2939 3982 6921 2272 2755 5027
Above 18 Yrs.
8403 8085 16488 5345 4825 10170
Source : Dy. Commissioner of Police, Crime (CRO & PRO), Delhi.

308
XV. iqfyl] vijk/k ,oa nq?kZVuk,aiqfyl] vijk/k ,oa nq?kZVuk,a15-3 fnYyh esa pqjkbZ xbZ rFkk iquZx`fgr lEifÙk
fooj.k 2009 2010 2011 2012
1 2 3 4 5
1 lEifÙk pksjh dh ?kVukvksa dh la[;k
25360 26892 26389 25823
2 iquZx`fgr l lEifÙk dh ?kVukvksa dh la[;k
7688 7093 8717 8117
3 izfr'kr Hkkx 30.31 26.37 33.03 31.43
4 pqjkbZ xbZ lEifÙk dk yxHkx ewY; ¼:- djksM+ esa½
21584 20566 24119 21211
5 iquZx`fgr lEifÙk dk yxHkx ewY; ¼:- djksM+ esa½
1365 1516 2070 3472
6 izfr'kr Hkkx 6.32 7.37 8.58 16.37

309
XV. POLICE, CRIMES & ACCIDENTS15.3 Property Stolen & Recovered in Delhi
2013 2014 2015 2016 Description
6 7 8 9 1
37875 102958 134658 159613 1 Number of cases involving theft of Property
9564 15316 18005 26078 2 Number of Cases in which property was recovered
25.25 14.87 13.37 16.33 3 Percentage of recovery cases
34594 44055 72025 23492 4 Approximate value of property stolen (‘in Crore Rs.)
2229 2783 7714 3168 5 Approximate value of property recovered (‘in Crore Rs.)
6.44 6.32 10.71 13.48 6 Percentage of value recovered
Source : Dy. Commissioner of Police, Crime (CRO & PRO), Delhi.

310
XV. iqfyl] vijk/k ,oa nq?kZVuk,aiqfyl] vijk/k ,oa nq?kZVuk,a15-4 fnYyh esa nq?kZVuk,a
fooj.k 2012 2013 2014 2015 2016 Description
1 2 3 4 5 6 1
dkj[kkuksa esa nq?kZuk,a
Factory* Accidents
?kkrd 6 13 1 6 10 Fatal
v?kkrd 18 14 9 20 26 Non Fatal
vfXu nq?kZVuk,a Fire Accidents
vfXudkaM o fo'ks"k cqyko
21996 22750 22875 25672 30103 Fire and Special Calls
vuqekfur {kfr ¼yk[k :- esa½
NA NA NA NA NA Estimated Loss (Lakh Rs.)
lzksr % (i) Je vk;qDr] jk"Vªh; jkt/kkuh {ks=] fnYyh 'kkluA(ii) fnYyh vfXu lsok] ubZ fnYyhA

311
XV. POLICE, CRIMES & ACCIDENTS15.4 Road Accidents in Delhi
fooj.k 2012 2013 2014 2015 2016 Description
1 2 3 4 5 6 1
lM+d nq?kZVuk,a Road Accidents
nq?kZVuk,a 6937 7566 8623 8085 7375 Accidents
O;fDr ekjs x, 1866 1820 1671 1622 1591 Persons Killed
O;fDr ?kk;y gq, 6633 7098 8283 8258 6833 Persons injured
vUrxzZLr okgu 6937 7566 8623 8085 7375 Vehicles involved
Source : Dy. Commissioner of Police, Crime (CRO & PRO), Delhi.

312
XVI. ENTERTAINMENT16- fnYyh esa flusek
Cinemas in Delhi
o"kZ cgq[k.kMh; flusek dh la[;kNo. of
multiplex Cinemas
flusek 'kks flusek ns[kus okys
Cinemas Cinema
Year Theatres show (Av per day)
Cinegoers(Av. per day)
1 2 3 4 52004 53 . . . .2005 57 . . . .2006 48 . . . .2007 56 . . . .2008 129 -- --2009 129 -- --2010 129 21 450 900002011 129 25 510 980002012 127 23 514 1070002013 127 24 635 1150002014 133 24 665 1230252015 129 28 645 1200202016 135 28 675 124875
lzksr % euksjatu dj vf/kdkjh] jk"Vªh; jkt/kkuh {ks=] fnYyh ljdkjASource : Entertainment Tax Offi cer, Govt. of NCT of Delhi.

313

314
XVII. vkcdkjh leadvkcdkjh lead17- fnYyh esa eknd oLrqvksa dk miHkksx
fooj.k 2009-10 2010-11 2011-12 2012-13
1 2 3 4 5
1- nslh fLifjV 557KL 308KL 395KL 415.77KL
2- vQhe ¼fd- xzk-½ 10 6.30 6.30 4.78
3- efnjk
1- Hkkjr fufeZr fons'kh 'kjkcÕ 7971729(Cases)
9258110(Cases)
10806529(Cases)
11494228(Cases)
2- nslh 'kjkc 5679042(Cases)
5482791(Cases)
4697895(Cases)
3844686(Cases)
3- Hkkjrh; fc;j 9817341(Cases)
9448511(Cases)
8460898(Cases)
10254670(Cases)
lzksr % vkcdkjh vk;qDr] jk"Vªh; jkt/kkuh {ks=] fnYyh ljdkjA

315
XVII. EXCISE STATISTICS17. Consumption of Intoxicants in Delhi
2013-14 2014-15 2015-16 2016-17 Description
6 7 8 9 1
410.23KL 386950BL 453542BL 430492BL 1 (Rectifi ed/
Denatured/Absolute)
4.42 4.02 2.97 2.34 2 Opium (Kg.)
3 Wine
11761207(Cases)
12091552(Cases)
12339706(Cases)
14002160(Cases)
(i) IMFL
2893110(Cases)
2537827(Cases)
3032400(Cases)
2493493(Cases)
(ii) Country Liquor
11001254(Cases)
10583621(Cases)
11451776(Cases)
12007879(Cases)
(iii) Indian Beer
Source : Commissioner of Excise, Govt. of NCT of Delhi.

316
XVIII. lekpkj i=lekpkj i=18- fnYyh esa iathÑr lekpkj i= vkSj vkof/kd if=dk,a
fooj.k 2009-10 2010-11 2011-12 2012-13
1 2 3 4 5
¼d½ nSfud i=
1- fgUnh 420 431 497 506
2- vaxzsth 123 117 144 138
3- vU; Hkk"kk,a 196 180 201 232
;ksx 739 728 851 876
¼[k½ vU; vkof/kd if=dk,a
1- fgUnh 4684 4084 4185 4391
2- vaxzsth 4453 3515 3575 3713
3- vU; Hkk"kk,a 3015 2279 2329 2430
;ksx 12152 9878 10089 10534
lzksr % iath;d] Hkkjrh; lekpkj i=] Hkkjr ljdkj] ubZ fnYyhA

317
XVIII. NEWS PAPERS18. Newspapers and Periodicals Registered in Delhi
2013-14 2014-15 2015-16 2016-17 Description
6 7 8 9 1
Dailies
543 585 619 646 Hindi
148 161 176 184 English
263 294 313 335 Other Language
954 1040 1108 1165 Total
Other Periodicals
4541 4692 4496 4909 Hindi
3782 3878 3139 3982 English
2490 2567 4847 3830 Other Language
10813 11137 12482 12721 Total
Source : Registrar of Newspaper for India, GOI-New Delhi

318
XIX. HkkoHkkoPRICES
19-1 fnYyh esa dqN vko';d oLrqvksa ds vkSlr Fkksd HkkoAverage Wholesale Prices of Some Essential Commodities in Delhi
(in Rs.)
oLrq,a bdkbZ Unit 2013 2014 2015 2016 Commodities
1 2 3 4 5 6 1
1- xsgwa ¼308½ izfr fDoaVy
1745 1725 1770 1800 1 Wheat (Dara)
2- puk ¼xjkjk½ çfr fDoaVy 3300 3450 4200 4690 2 Gram (Grarra)
3- pkoy ¼cklerh½
]] 5800 6250 6300 6500 3 Rice (Basmati)
4- nky vjgj ¼ns'kh½
6500 6400 10200 11820 4 Dal Arhar (Split)
5- nky ewax ¼fNydk½
]] 6300 6550 8425 9050 5 Dal Moong (Chhilka)
6- nky mM+n ¼fNydk½
]] 4700 5950 10200 11720 6 Dal Urd (Chilka)
7- rsy ljlksa ¼dPph ?kkuh½
15 Kg Tin 1250 1340 1390 1490 7 Mustard Oil (Kachi Ghani)
8- ?kh ¼nslh½ 15 Kg Tin 4300 4200 5250 6800 8 Ghee (Desi)
Source : Dte. of Agricultural Marketing, Govt. of NCT of Delhi.

319
XIX. HkkoHkkoPRICES
19-1 fnYyh esa dqN vko';d oLrqvksa ds vkSlr Fkksd HkkoAverage Wholesale Prices of Some Essential Commodities in Delhi
(in Rs.)oLrq,a bdkbZ Unit 2013 2014 2015 2016 Commodities
1 2 3 4 5 6 19- ?kh ¼ouLifr½ ¼iu?kV½
Vhu 15 Kg. (Tin) izfr yhVj
1125 1050 1000 1200 9 Ghee (Vanaspati)
10-feV~Vh dk rsy
izfr fyVj (Per Litere)
N.A N.A N.A N.A 10. Kerosene Oil
11- dks;yk iRFkj dk
izfr 40 fd-xzk-(Per 40 Kg.)
N.A N.A N.A N.A 11. Hard Coke
12- xks'r izfr fDoaVy (Per Qtl)
26000 25500 22500 34500 12 Meat
13- v.Ms ¼^00 la-½ 340 400 400 540 13 Eggs14- fepZ ¼yky½
izfr fDo- (Per Qtl)
8100 9000 N.A 9500 14 Chillies (Red)
15- gYnh ^^ 7400 8000 9500 9800 15 Turmeric16- phuh ^^” 3250 3300 3825 4150 16 Sugar17- xqM+ ^^” 2850 2900 2900 4000 17 Gur18- vkyw nslh
^^” 710 750 1675 1800 18 Potatoes
19- I;kt ¼lw[kk½
^^” 1100 1200 1000 2375 19 Onion (Dry)
Source : Dte. of Agricultural Marketing, Govt. of NCT of Delhi.

320
XIX. HkkoHkko19-2 Hkkjro"kZ esa Fkksd Hkkoksa dk lwpdkad
¼vk/kkj 2011&12=100½Hkkj
weightokf"kZd vkSlr
oxZ 2012-13 2013-14
1 2 3 4
I izkFkfed oLrq,¡ 22.61756 111.4 122.4
¼,½ [kk| oLrq,¡ 15.25585 110.9 124.5
¼ch½ xSj&[kk| oLrq,¡ 4.11894 113.3 118.4
¼lh½ [kfut inkFkZ 0.83317 118.2 114.4
¼Mh½ ØwM isVªksfy;e vkSj izkÑfrd xSl 2.40960 109.4 119.0
II bZa/ku vkSj fctyh 13.15190 107.1 114.7
¼,½ dks;yk 2.13813 102.1 104.8
¼ch½ [kfut rsy 7.94968 110.9 121.6
¼lh½ fo|qr 3.06409 100.5 103.6
III fofufeZr mRikn 64.23054 105.3 108.5
¼,½ [kk| mRiknksa ds fuekZ.k 9.12173 108.7 114.1
¼ch½ is; inkFkks± dk fuekZ.k 0.90907 104.5 110.1
¼lh½ rackdw mRiknksa dk fuekZ.k 0.51357 108.4 114.4
¼Mh½ oL=ksa dk fuekZ.k 4.88068 104.0 111.8
¼bZ½ ifj/kku dk fuekZ.k 0.81414 112.2 117.7
¼,Q½ peM+k vkSj lacaf/kr mRiknksa dk fuekZ.k 0.53540 107.3 114.8
¼th½ ydM+h vkSj dksadZ ds ydM+h vkSj mRiknksa ds fuekZ.k
0.77181 110.9 118.8
¼,p½ isij vkSj isij mRiknksa dk fuekZ.k 1.11322 103.6 110.2

321
XIX. PRICE19.2 Index Numbers of Wholesale Prices in India
(Base 2011-12=100)Annual Average
2014-15 2015-16 2016-176 7 8 1
125.1 124.6 128.9 I Primary Articles131.5 134.9 140.3 (a) Food Articles115.1 118.2 122.2 (b) Non-Food Articles118.6 105.6 113.1 (c) Minerals103.5 76.6 73.1 (d) Crude Petroleum &
Natural Gas107.7 86.5 86.3 II Fuel & Power106.7 106.5 109 (a) Coal108.7 73.9 73.3 (b) Mineral Oils105.7 105.3 104.2 (c) Electricity111.2 109.2 110.7 III Manufactured Products116.2 114.5 125.4 (a) Manufacture of Food Products113.3 113.9 116.1 (b) Manufacture of Beverages123.3 133.0 141.6 (c) Manufacture of Tobacco Products112.7 109.1 111.2 (d) Manufacture of Textiles122.6 128.7 131 (e) Manufacture of Wearing Apparel120.7 122.0 122.6 (f) Manufacture of Leather and
Related Products124.6 130.0 129.8 (g) Manufacture of Wood and of
Products of Wood and Cork 114.0 112.7 113.6 (h) Manufacture of Paper and Paper
Products

322
XIX. HkkoHkko19-2 Hkkjro"kZ esa Fkksd Hkkoksa dk lwpdkad
¼vk/kkj 2011&12=100½
oxZ
HkkjWeight
okf"kZd vkSlr
2012-13 2013-141 2 3 4¼vkbZ½ fjdksMZ fd, x, ehfM;k ds eqnz.k vkSj
iqu%0.67622 110.5 118.7
¼ts½ v/kkRod [kfut mRikn 6.46505 108.3 113.3¼ds½ QkekZL;wfVdYl] esfMdy dSfMyk; vkSj
cksVSfudy mRikn dk fuekZ.k1.99345 104.8 108.3
¼,y½ jcM+ vkSj IykfLVd mRiknksa dk fuekZ.k 2.29851 103.7 110.1¼,e½ vU; xSj&/kkrq [kfut mRiknksa dk fuekZ.k 3.20176 107.2 107.5¼,u½ csfld esVYl dk fuekZ.k 9.64632 104.8 102.9
¼vks½ diM+s ds /kkrq ds mRiknksa dk fuekZ.k] ra= vkSj midj.kksa dks NksM+ nsa
3.15498 103.2 103.0
¼ih½ daI;wVj] bysDVkWfud vkSj vkWfIVdy mRiknksa dk fuekZ.k
2.00875 101.0 103.0
¼D;w½ fo|qr midj.kksa dk fuekZ.k 2.92970 103.4 104.8
¼vkj½ e'khujh vkSj midj.kksa dk fuekZ.k 4.78899 103.6 105.8
¼,l½ eksVj okguksa] Vªsyj vkSj lSeh Vsªyjksa dk fuekZ.k
4.96853 102.8 107.4
¼Vh½ vU; ifjogu midj.k dk fuekZ.k 1.64777 101.5 103.0
¼;w½ QuhZpj dk fuekZ.k 0.72672 105.4 111.5
¼oh½ vU; fofuekZ.k 1.06417 96.4 95.7
[kk| lwpdkad 24.37758 110.0 120.6
lHkh oLrqvksa 100.00000 106.9 112.5

323
XIX. PRICE19.2 Index Numbers of Wholesale Prices in India
(Base 2011-12 = 100)
Annual Average
2014-15 2015-16 2016-17 Groups
6 7 8 1126.2 136.1 141.1 (I) Printing and Reproduction of Recorded
Media 116.1 112.6 111 (J) Manufacture of Chemicals and Chemical
Products114.5 118.7 119.7 (K) Manufacture of Pharmaceuticals, Medicinal
Chemical and Botanical Products111.8 108.2 107.5 (L) Manufacture of Rubber and Plastics
Products111.3 110.5 109.8 (M) Manufacture of other Non-Metallic
Mineral Products103.5 92.0 91.1 (N) Manufacture of Basic Metals105.8 105.9 105.1 (O) Manufacture of Fabricated Metal Products,
Except Machinery and Equipment107.4 108.0 108.3 (P) Manufacture of Computer, Electronic and
Optical Products109.5 109.0 108.2 (Q) Manufacture of Electrical Equipment108.3 109.2 107.9 (R) Manufacture of Machinery and Equipment109.8 110.7 110.4 (S) Manufacture of Motor Vehicles, Trailers
and Semi-Trailers106.2 105.9 107.7 (T) Manufacture of other Transport Equipment116.5 112.7 114.1 (U) Manufacture of Furniture105.4 116.9 119.7 (V) Other Manufacturing125.8 127.3 134.7 IV Food Index113.9 109.7 111.6 All Commodities

324
XIX. HkkoHkko19-3 fnYyh esa vkS|ksfxd Jfedksa ds fy, miHkksDrk Hkko lwpdkad
¼vk/kkj 2001=100½
Hkkjweight
okf"kZd vkSlr
oxZ 2010 2011 2012
1 2 3 4 5
[kk| inkFkZ 43.75 174 189 206
iku&lqijh] rEckdw o eknd inkFkZ 2.12 146 171 193
b±/ku ,oa jks'kuh 5.39 163 181 203
vkokl 20.72 150 167 175
oL=] fcNkSus o twrs 5.68 131 155 179
fofo/k 22.34 160 163 177
O;kid lwpdkad 100.00 163 176 191
vuqekfur O;kid lwpdkadvk/kkj 1960=100½
4538 4900 5318
vuqekfur O;kid lwpdkadvk/kkj 1949=100½
5776 6236 6768
vuqekfur O;kid lwpdkadvk/kkj 1939=100½
19899 21486 23318
lzksr % Je C;wjks] Je ea=ky;] f'kekyk

325
XIX. PRICES19.3 Consumer Price Index Number for Industrial Workers in Delhi
(Base : 2001 = 100)
Annual Average
2013 2014 2015 2016 Groups
6 7 8 9 1
231 246 265 278 Food Groups220 236 258 288 Pan-Supari, Tobacco and
Intoxicants220 253 222 216 Fuel & Light190 202 212 227 Housing190 198 208 216 Clothing, Bedding and Footwear186 196 203 213 Miscellaneous209 223 234 246 General Index
5815 6208 6511 6849 Estimated General Index (Base 1960 = 100)
7401 7901 8286 8717 Estimated General Index(Base 1949 = 100)
25497 27220 28548 30031 Estimated General Index (Base 1939 = 100)
Source : Labour Bureau, Ministry of Labour, Shimla.

326
XIX. HkkoHkko19-4 Hkkjro"kZ ds dqN pqus gq, dsUnzksa ds vkS|ksfxd Jfedksa ds fy,
miHkksDrk Hkko lwpdkad¼vk/kkj 2001=100½
okf"kZd vkSlr
dsUnz 2011 2012 2013
1 2 3 4
eqEcbZ 192 212 237
pSUubZ 171 196 218
vgenkckn 186 206 233
ve`rlj 208 227 240
dydÙkk 185 199 222
gSnjkckn 174 190 207
dkuiqj 200 214 237
ukxiqj 220 240 265
fnYyh 176 191 209
leLr Hkkjr 192 209 232
lzksr % Je C;wjks] ea=ky; f'keykSource : Labour Bureau, Ministry of Labour, Shimla.

327
XIX.PRICES19.4 Consumer Price Index Number for Industrial Workers
of some of selected Centres of India(Base : 2001= 100)
Annual Average
2014 2015 2016 Centre
5 6 7 1
257 276 287 Mumbai
230 248 255 Chennai
238 249 261 Ahmedabad
255 263 271 Amritsar
239 251 261 Kolkata
217 228 240 Hyderabad
255 268 285 Kanpur
277 294 306 Nagpur
223 234 246 Delhi
247 261 274 All India
lzksr % Je C;wjks] ea=ky; f'keykSource : Labour Bureau, Ministry of Labour, Shimla.

328
XIX HkkoHkko19.5 General Consumer Price Indices (New Series) for the Year 2016
(Base : 2012=100)
Rural Urban
S.No. Month Delhi All India Delhi All India
1 Jan 121.1 128.1 123.6 124.2
2 Feb 121.3 127.9 124.6 123.8
3 March 122.2 128.0 124.7 123.8
4 April 123.4 129.0 126.2 125.3
5 May 124.5 130.3 127.4 126.6
6 June 126.3 131.9 127.8 128.1
7 July 128.2 133.0 130.5 129.0
8 August 128.9 133.5 130.3 128.4
9 Sep 129.1 133.4 130.4 128.0
10 Oct 129.2 133.8 130.8 128.6
11 Nov 129.3 133.6 131.1 128.5
12 Dec 130.0 132.8 129.4 127.6

329
XIX PRICES19.5 General Consumer Price Indices (New Series) for the Year 2016
(Base : 2012=100)
Combined (Rural+Urban)
S.No. Month Delhi All India
1 Jan 123.5 126.3
2 Feb 124.4 126.0
3 March 124.6 126.0
4 April 126.0 127.3
5 May 127.2 128.6
6 June 127.7 130.1
7 July 130.4 131.1
8 August 130.2 131.1
9 Sep 130.3 130.9
10 Oct 130.7 131.4
11 Nov 131.0 131.2
12 Dec 129.4 130.4Source: C.S.O.MOSPI, G.O.I.

330
XX. fnYyh ty cksMZfnYyh ty cksMZ20-1 fofHkUu ty la;a=ksa dh mRiknu {kerk
20.1 Installed Capacity of Various Water Works¼,e- th- Mh-½
(M.G.D)As on 31st March
ty la;a= Water Works2013 2014 2015 2016 2017
1 2 3 4 5 6 1
1- pUnzkoy I,II 90 90 90 90 90 1 Chandrawal I,II
2- othjkckn I,II,III 120 120 120 120 120 2 Wazirabad I,II,III
3- jSuh dwi ,oa uy dwi
100 80 80 80 80 3 RainyWells & Tube Wells
4- gSnjiqj I,II 200 200 200 200 200 4 Haiderpur I,II
5- HkkxhjFk 100 100 100 100 100 5 Bhagirathi
6- ukaxyksbZ 40 40 40 40 40 6 Nangloi
7- lksfu;k fogkj 140 140 140 140 140 7 Sonia Vihar
8- cokuk 20 20 20 20 20 8 Bawana
9- iqu% mi;ksxh IykaV
37 45 45 45 45 9 Recyling Plants
10- vks[kyk 20 20 20 20 10 Okhla
11- }kjdk 50 50 50 11 Dwarka
;ksx * 847 855 905 905 905 Total **Actual production of water is about 900 MGD*ikuh dk okLrfod mRiknu yxHkx 900 ,ethMh gS]

331
XX. DELHI JAL BOARD20-2 fofHkUu ey'kks/kd la;a=ksa dh {kerk
20.2 Capacity of Various Sewage Treatment Plants(As on 31st March) ¼,e-th-Mh-½/(M.G.D)
ey 'kks/kd la;a= 2013 2014 2015 2016 2017 SewageTreat-ment Plants
1 2 3 4 5 6 1
1- vks[kyk 170 170 170 140 140 1. Okhla
2- dkjksus'ku fiyj 40 40 40 30 30 2. Coronation Piller
3- dS'kksiqj fiyj 72 72 72 72 72 3. Keshopur Piller
4- fjBkyk 80 80 80 80 80 4. Rithala
5- ;equk fogkj 20 20 20 35 35 5. Yamuna Vihar
6- vksfdlMslu ikS.Ml
6 6 6 6. Oxidation Ponds
7- olUr dqat 5 5 5 5.2 5 7. Vasant Kunj
8- dksaMyh 45 90 90 70 70 8. Kondli
9- Mk- lSu uflZax gkse ukyk
2.2 2.2 2.2 2.2 2.2 9. Dr. Sen Nursing HomeNalla
10- utQx<+ ukyk 5 5 5 5 5 10. Najafgurh Nalla
11- f?kVksjuh 5 5 5 5 11. Ghitorni
12- iIiudyh 20 20 30 40 40 12. Papan Kalan
13- ujsyk 10 10 10 10 10 13. Narela
14- fnYyh xsV ukyk 2.2 2.2 2.2 17.2 17.2 14. Delhi Gate Nalla
15- fuyksBh 40 40 40 60 60 15. Nilothi
16- egjkSyh 5 5 5 5 5 16. Mehrauli
17- jksfg.kh 15 15 15 15 15 17. Rohini
18- jk"VeaMy 1 1 1 1 1 18. Commonwealth
[ksyxkao Games Village
19- eksyjcUn 0.66 0.66 0.66 0.66 0.66 19. Molarband
20- cDdjokyk 0.66 0.66 0.66 20. Bakkerwala
21- dkilgsM+k 5 5 5 5 21. Kapashera
22- fpYyk 9 9 9 9 22. Chilla
;ksx 544.72 603.72 613.72 603 607 Total
lzksr % fnYyh ty cksMZ] >.Msoyku] ubZ fnYyhASource : Delhi Jal Board

332
XX. fnYyh ty cksMZfnYyh ty cksMZ20-3 fnYyh esa ikuh dk miHkksx
fooj.k 2009-10 2010-11 2011-12 2012-13
1 2 3 4 5
1- ehVjksa lfgr yxs dusD'kuksa dh la[;k
1427768 1480441 1540968 1542825
2- fcuk ehVjksa ds dusD'kuksa dh la[;k
357256 314774 399930 438791
3- ikuh dh miHkksx ek=k* ¼yk[k fdyks yhVj esa½
13671 13754 14085 13837
¼d½ ?kjsyw 12413 - 12789 -
¼[k½ okf.kfT;d@vkS|ksfxd 1258 - 1296 -
4- izfr O;fDr ikuh dk miHkksx ¼xSyu izfr fnu½
50 50 50 49
* cjcknh lfgr
lzksr % fnYyh ty cksMZ

333
XX. DELHI JAL BOARD20.3 Consumption of Water in Delhi
2013-14 2014-15 2015-16 2016-17 Description
6 7 8 9 1
1602099 1862753 1949150 2316210 1 No. of Metered Connections
469705 265925 389694 178845 2 No. of Un Metered Connections
13837 14085 14914 14914 3 Water consumption*
(In lakh K Litre)
- - - - (a) Domestic
- - - - (b) Commercial/ Industrial
48 48 48 47 4 Per Capita Consum-ption of water (Gallons per Capita per day)
* These fi gures includes water lossesSource : Delhi Jal Board

334
XXIXXI vkfFkZd x.kukvkfFkZd x.kuk21-1 ¼d½ izeq[k vkfFkZd xfrfof/k lewg vkSj izdkj ds vk/kkj ij jkstxkj dk forj.k21-1 ¼d½ izeq[k vkfFkZd xfrfof/k lewg vkSj izdkj ds vk/kkj ij jkstxkj dk forj.k
Major Economy Activity Group
Rural UrbanType of establishment Type of establishment
OAE Estt (H) Total OAE Estt (H) Total
d`f"k xfrfof/k;kad`f"k xfrfof/k;kaQly mRiknu ,oa o`{kkjksi.k ds vykok vU; d`f"k ls lacaf/kr xfrfof/k;ka
22 26 48 140 562 702
i'kq 1,661 1,052 2,713 5,748 6,745 12,493okfudh vkSj ykWfxax - - - 42 435 477eRL; ikyu vkSj ,Dok laLd`fr
- - - 47 44 91
mi dqy ¼mi dqy ¼I½ ½ xSj d`f"k xfrfof/k;kasxSj d`f"k xfrfof/k;kas
1,683 1,078 2,761 5,977 7,786 13,763
[kuu ,oa mR[kuu - - - - - -fofuekZ.k 1,075 3,099 4,174 85,322 913,517 998,839fctyh] xSl] Hkki vkSj ,;j daMh'kfuax vkSj vkiwfrZ
2 112 114 473 15,724 16,197
ty vkiwfrZ] lhojst] dpjk izca/ku vkSj fjehMh,s'ku xfrfof/k;ksa
8 53 61 1,488 5,754 7,242
fuekZ.k 499 89 588 23,914 17,519 41,433Fkksd fcØh O;kikj] [kqnjk O;kikj vkSj eksVj okgu vkSj eksVj lkbfdy dh ejEer
156 428 584 9,726 89,034 98,760
Fkksd fcØh O;kikj ¼Åij doj ugha½
235 391 626 13,076 95,932 109,008
[kqnjk O;kikj ¼Åij doj ugha½ 4,162 2,558 6,720 236,294 404,485 640,779ifjogu HkaMkj.k 1,318 1,411 2,729 55,300 120,973 176,273vkokl vkSj Hkkstu lsok xfrfof/k;ksa
639 684 1,323 34,597 105,797 140,394

335
XXI ECONOMIC CENSUSXXI ECONOMIC CENSUS21.1 (a) Distribution of Employment by
Majar Economic Activity Group and TypeCombined
Major Economy Activity GroupType of establishmentOAE Estt (H) Total
Agricultural Activities162 588 750 Activities relating to agriculture other
than crop production & plantation7,409 7,797 15,206 Livestock
42 435 477 Forestry and Logging47 44 91 Fishing and aqua culture
7,660 8,864 16,524 Sub-total (I)Non-Agricultural Activities
- - - Mining and quarrying86,397 916,616 1,003,013 Manufacturing
475 15,836 16,311 Electricity, gas, steam and air conditioning supply
1,496 5,807 7,303 Water supply, sewerage, waste management and remediation activities
24,413 17,608 42,021 Construction9,882 89,462 99,344 Whole sale trade, retail trade & repair
of motor vehicles & motor cycles13,311 96,323 109,634 Whole sale trade ( not covered above)
240,456 407,043 647,499 Retail trade (not covered above)56,618 122,384 179,002 Transportation and storage35,236 106,481 141,717 Accommodation and Food service
activitiesContd...

336
XXIXXI vkfFkZd x.kukvkfFkZd x.kuk21-1 ¼d½ izeq[k vkfFkZd xfrfof/k lewg vkSj izdkj ds vk/kkj ij jkstxkj dk forj.k21-1 ¼d½ izeq[k vkfFkZd xfrfof/k lewg vkSj izdkj ds vk/kkj ij jkstxkj dk forj.k
izeq[k vFkZO;oLFkk xfrfof/k lewg
Rural Urban
Type of establishment Type of establishmentOAE Estt (H) Total OAE Estt (H) Total
lwpuk ,oa lapkj 63 124 187 6,580 47,400 53,980
foÙkh; vkSj chek xfrfof/k;ksa
28 116 144 2,936 59,333 62,269
vpy laifÙk dh xfrfof/k;ksa
251 227 478 16,299 29,275 45,574
O;kolkf;d] oSKkfud vkSj rduhdh xfrfof/k;ksa
80 75 155 6,722 90,302 97,024
iz'kklfud vkSj leFkZu lsok xfrfof/k;ksa
72 282 354 6,814 67,285 74,099
f'k{kk 340 2,867 3,207 18,000 119,979 137,979
ekuo LokLF; vkSj lkekftd dk;Z xfrfof/k;ksa
131 1,220 1,351 6,494 110,407 116,901
dyk euksjatu] [ksy vkSj euksjatu
28 28 56 2,375 9,555 11,930
vU; lsok xfrfof/k;ksa dgha vkSj oxhZdr ugha
981 1,017 1,998 51,299 98,428 149,727
mi dqymi dqy (II)(II) 10,068 14,781 24,849 577,709 2,400,699 2,978,408
dqy dqy [ST(I)+ST(II)][ST(I)+ST(II)] 11,751 15,859 27,610 583,686 2,408,485 29,92,171
Source : Economic Census report 2013OAE= Own Account EnterprisesEstt (H)= Establishment with one or more hired workers

337
XXI ECONOMIC CENSUSXXI ECONOMIC CENSUS21.1 (a) Distribution of Employment by Majar Economic Activity
Group and TypeCombined
Major Economy Activity GroupType of establishment
OAE Estt (H) Total
6,643 47,524 54,167 Information & communication
2,964 59,449 62,413 Financial and insurance activities
16,550 29,502 46,052 Real estate activities
6,802 90,377 97,179 Professional, scientifi c & technical activities
6,886 67,567 74,453 Administrative and support service activities
18,340 122,846 141,186 Education
6,625 111,627 118,252 Human health & social work activities
2,403 9,583 11,986 Arts entertainment, sports & amusement and recreation
52,280 99,445 151,725 Other service activities not elsewhere classifi ed
587,777 2,415,480 3,003,257 Sub-total (II)5,95,437 24,24,344 30,19,781 Total [ST(I)+ST(II)]

338
XXIXXI vkfFkZd x.kukvkfFkZd x.kuk21-1 ¼[k½ izeq[k vkfFkZd xfrfof/k lewg vkSj izdkj ds vk/kkj ij izfr"Bkuksa dk forj.k21-1 ¼[k½ izeq[k vkfFkZd xfrfof/k lewg vkSj izdkj ds vk/kkj ij izfr"Bkuksa dk forj.k
izeq[k vFkZO;oLFkk xfrfof/k lewg
Rural Urban
Type of establishment Type of establishmentOAE Estt (H) Total OAE Estt (H) Total
d`f"k xfrfof/k;kad`f"k xfrfof/k;ka
Qly mRiknu ,oa o`{kkjksi.k ds vykok vU; d`f"k ls lacaf/kr xfrfofèk;ka
20 8 28 95 112 207
i'kq 805 311 1,116 3,397 2,112 5,509
okfudh vkSj ykWfxax - - - 35 65 100
eRL; ikyu vkSj ,Dok laLd`fr
- - - 33 15 48
mi dqy ¼mi dqy ¼I½ ½ xSj d`f"k xfrfof/k;kaxSj d`f"k xfrfof/k;ka
825 319 1,144 3,560 2,304 5,864
[kuu ,oa mR[kuu - - - - - -
fofuekZ.k 781 616 1,397 57,537 97,016 1,54,553
fctyh] xSl] Hkki vkSj ,;j daMh'kfuax vkSj vkiwfrZ
1 8 9 382 919 1,301
ty vkiwfrZ] lhojst] dpjk] izca/ku vkSj fjehMh,s'ku xfrfof/k;ka
8 6 14 1,098 719 1,817
fuekZ.k 416 36 452 21,556 3,088 24,644
Fkksd fcØh O;kikj] [kqnjk O;kikj vkSj eksVj okgu vkSj eksVj lkbfdy dh ejEer
142 93 235 7,394 19,771 27,165
Fkksd fcØh O;kikj ¼Åij doj ugha½
155 82 237 10,189 21,032 31,221
[kqnjk O;kikj ¼Åij doj ugha½
3,281 944 4,225 1,92,498 1,15,107 3,07,605
ifjogu vkSj HkaMkj.k 1,197 272 1,469 51,951 19,152 71,103
vkokl vkSj Hkkstu lsok xfrfof/k;ka
498 145 643 27,814 19,594 47,408

339
XXI ECONOMIC CENSUSXXI ECONOMIC CENSUS21.1 (b) Distribution of Establishments by Majar Economic Activity
Group and TypeCombined Major Economy Activity Group
Type of establishmentOAE Estt (H) Total
Agricultural Activities115 120 235 Activities relating to agriculture other
than crop production & plantation4,202 2,423 6,625 Livestock
35 65 100 Forestry and Logging33 15 48 Fishing and aqua culture
4,385 2,623 7,008 Sub-total (I)Non-Agricultural Activities
- - - Mining and quarrying58,318 97,632 1,55,950 Manufacturing
383 927 1,310 Electricity, gas, steam and air conditioning supply
1,106 725 1,831 Water supply, sewerage, waste management and remediation activities
21,972 3,124 25,096 Construction7,536 19,864 27,400 Whole sale trade, retail trade & repair of
motor vehicles & motor cycles10,344 21,114 31,458 Whole sale trade ( not covered above )
1,95,779 1,16,051 3,11,830 Retail trade (not covered above)53,148 19,424 72,572 Transportation and storage 28,312 19,739 48,051 Accommodation and Food service
activities

340
XXIXXI vkfFkZd x.kukvkfFkZd x.kuk21-1 ¼[k½ izeq[k vkfFkZd xfrfof/k lewg vkSj izdkj ds vk/kkj ij izfr"Bkuksa dk forj.k21-1 ¼[k½ izeq[k vkfFkZd xfrfof/k lewg vkSj izdkj ds vk/kkj ij izfr"Bkuksa dk forj.k
izeq[k vFkZO;oLFkk xfrfof/k lewg
Rural Urban
Type of establishment Type of establishment
OAE Estt (H) Total OAE Estt (H) Total
lwpuk ,oa lapkj 58 54 112 5,466 5,379 10,845
foÙkh; vkSj chek xfrfof/k;ksa
23 22 45 2,519 6,485 9,004
vpy laifÙk dh xfrfof/k;ksa
216 87 303 13,588 9,240 22,828
O;kolkf;d] oSKkfud vkSj rduhdh xfrfof/k;ksa
69 26 95 5,639 13,106 18,745
iz'kklfud vkSj leFkZu lsok xfrfofèk;ka
46 57 103 4,836 10,053 14,889
f'k{kk 245 247 492 14,792 11,544 26,336
ekuo LokLF; vkSj lkekftd dk;Z xfrfof/k;ka
114 114 228 5,406 10,805 16,211
dyk euksjatu] [ksy vkSj euksjatu
22 8 30 1,785 1,198 2,983
vU; lsok xfrfof/k;ksa dgha vkSj oxhZd`r ugha
818 390 1,208 40,573 27,772 68,345
mi dqy (II) 8,090 3,207 11,297 4,65,023 3,91,980 8,57,003
dqy [ST(I)+ST(II)] 8,915 3,526 12,441 4,68,583 3,94,284 862,867
Source : Economic Census report 2013OAE= Own Account EnterprisesEstt (H)= Establishment with one or more hired workers

341
XXI ECONOMIC CENSUSXXI ECONOMIC CENSUS21.1 (b) Distribution of Establishments by Majar Economic Activity
Group and TypeCombined Major Economy Activity
GroupType of establishmentOAE Estt (H) Total
5,524 5,433 10,957 Information & communication
2,542 6,507 9,049 Financial and insurance activities
13,804 9,327 23,131 Real estate activities
5,708 13,132 18,840 Professional, scientifi c & technical activities
4,882 10,110 14,992 Administrative and support service activities
15,037 11,791 26,828 Education
5,520 10,919 16,439 Human health & social work activities
1,807 1,206 3,013 Arts entertainment, sports & amusement and recreation
41,391 28,162 69,553 Other service activities not elsewhere classifi ed
4,73,113 3,95,187 8,68,300 Sub-total (II)
4,77,498 3,97,810 8,75,308 Total [ST(I)+ST(II)]

342
XXI. vkfFkZd x.kukvkfFkZd x.kuk21-2 fnYyh dh vkfFkZd x.kuk 2013 ds v/khu ftykoj m|eksa dh la[;k o
izoj izeq[k vfHkdj.kName of District No. of Establishment No. of persons
Employed
mÙkj if'pe 93297 286189
mÙkj 73724 318960
mÙkj iwoZ 86597 183313
iwoZ 80061 215979
ubZ fnYyh 38153 269225
e/; 150671 599058
if'pe 106726 313574
nf{k.k if'pe 42166 105954
nf{k.k 57126 145304
'kkgnjk 71738 229663
nf{k.k iwoZ 75049 352562
;ksx 875308 3019781
uksV % (I) Qly mRiknu rFkk ckxku dks NksM+djlzksr % fnYyh dh NBoha vkfFkZd x.kuk 2013 vFkZ ,oa lkaf[;dh funs'kky; fnYyh ljdkj }kjk izdkf'kr

343
XXI. ECONOMIC CENSUS21.2 District wise number of Establishment with Selected Principal
Characterstics under 6th Economic Census 2013 of Delhi
Agri Establishment Non-Agri. Establishment
Name of District
465 92832 North-West
1197 72527 North
756 85841 North-East
720 79341 East
270 37883 New Delhi
721 149950 Central
385 106341 West
1154 41012 South-West
600 56526 South
327 71411 Shahdara
413 74636 South East
7008 868300 TotalNote : (i) Excluding crop production and PlantationSource: 6th Economic Census of Delhi,2013 released by Directorate of Economics & Statistics, Govt. of NCT of Delhi.

344
XXI. vkfFkZd x.kukvkfFkZd x.kuk21-3 fnYyh dh NBh vkfFkZd x.kuk ¼2013½ dk izoj :i
fooj.k xzkeh.k 'kgjh
Rural Urban
1 2 31. m|eksa dh la[;k 12441 862867
2. fu;qDr O;fDr;ksa dh la[;k 27610 2992171
3. m|eksa dk izdkji. d`f"k 1144 5864
ii. xSj d`f"k 11297 857003
3.1 fu;qDr O;fDr;ksa dh la[;ki. d`f"k 2761 13763
ii. xSj d`f"k 24849 2978408
uksV % (I) Qly mRiknu rFkk ckxku dks NksM+djlzksr % fnYyh dh NBh vkfFkZd x.kuk 2013 vFkZ ,oa lkaf[;dh funs'kky; fnYyh ljdkj }kjk izdkf'kr

345
XXI. ECONOMIC CENSUS21.3 Selected features of 6th Economic Census 2013 of Delhi
dqy Description
Total
4 1
875308 1. No. of Establishment
3019781 2. No. of Persons employed
3. Type of Establishment
7008 i. Agricultural
868300 ii. Non-Agricultural
3.1 No. of Persons employed
16524 i. Agricultural
3003257 ii. Non-Agricultural
Note (i) Excluding crop production and PlantationSource : 6th Economic census 2013 of Delhi released by Directorateof Eco & Statistics, Govt. of NCT of Delhi

346
XXII. lekt ,oa vuqlwfpr tkfr@tutkfr dY;k.klekt ,oa vuqlwfpr tkfr@tutkfr dY;k.k22- fnYyh esa lekt dY;k.k laLFkk,a@lsok,a
2013&14 2014&15
laLFkk@;kstuk dk uke
laLFkkvksa@lsokvksa dh la[;k
ykHk izkIr djus okyksa dh vkSlr la[;k
laLFkkvksa@lsokvksa dh la[;k
ykHk izkIr djus okyksa dh vkSlr la[;k
1 2 3 4 5(A) cky dY;k.k
¼cky vfèkfu;e ds vèkhu okyk laLFkku½
1 ns[kHkky x`g 7* 188 7* 2002 cky x`g 16* 540 16* 6003 cky dY;k.k
lsok,a
10# 3919 10# 3700
4 ,dhd`r ,l,uih lfgr cky fodkl lsok,a dk;ZØe
10897 1081379 NA NA
(B) efgyk dY;k.k
1 efgykvksa ds fy, vkoklh; laLFkku
3 146 5 186
2 efgykvksa ds fy, odZ lsUVj
18 40 18 40

347
XXII. SOCIAL & SCHEDULED CASTE/TRIBE WELFARE22. Social Welfare Institutes/Services in Delhi
2015-16 2016-17
No. of Institutes/ Services
Average Number of
Benefi ciaries
No. of Institutes/ Services
Average Number of Benefi ciaries
Name of Institution/
Scheme
6 7 8 9 1(A) CHILD
WELFARE (Children Institutions under Children Act)
7 257 7 261 1 Observation Homes
14 599 14 502 2 Children Homes11$ 4237 36@ 2108 3 Children Welfare
Services10897 597051 10897 1663431** 4 Integrated
Children Development Programme including SNP
(B) WOMEN WELFARE
5 154 5 583 1 Residential Institutions for the Women
7^ 368 4^ 377 2 Work Centres for Women
* This include Statutory & Non Satutory run by Govt.# This include 8 Child Welfare committees and 2 Juvenile Justice Boards$ This include 8 Child Welfare committees and 3 Juvenile Justice Boards^ This include work centres for women & working women hostel@ This include 8 children welfare committe, 3 Juvenile Justice Board, 13 open shelter and 12 adoption agencies**Surveyed benefi ciaries - 1002721 + benefi ciaries receiving supplementary nutration - 660710 Contd...

348
2013&14 2014&15
laLFkk@;kstuk dk uke
laLFkkvksa@lsokvksa dh la[;k
ykHk izkIr djus okyksa dh vkSlrla[;k
laLFkkvksa@lsokvksa dh la[;k
ykHk izkIr djus okyksa dh vkSlr la[;k
1 2 3 4 5
(C) lkekftd lqj{kk dk;ZØe
1 Hkh[k ekaxuk vf/kfu;e ds v/khu fHk[kkfj;ksa ds fy, vkoklh; laLFkku
11 1502 11 625
2 ifjoh{kk lsok,a NA NA 10 181933 tsy dY;k.k lsok,a NA NA 1 7074 eUn cqf) cPpksa okyksa
dk ?kj
6 1055 6 1066
(D) 'kkjhfjd :i ls fodykax
1 izf'k{k.k ,oa mRiknu dsUnz 1 30 2 142 'kSyVMZ odZ'kki 2 NA 2 153 'kkjhfjd :i ls fodykaxksa
ds fy, vkoklh; x`g
NA NA NA NA
4 cgjs ,oa xwaxksa ds fy, Ldwy
5 1140 5 1255
5 ean cqf) okyksa cPpksa ds fy, Ldwy
1 47 1 49
6 dkyst tkus okys n`f"Vghu fo|kfFkZ;ksa ds fy, vkokl
1 125 1 107
7 n`f"Vghu fo|kfFkZ;ksa ds fy, m- iz- fo|ky;
1 123 1 118

349
2015-16 2016-17
No. of Institutes/ Services
Average Number of Benefi ciaries
No. of Institutes/ Services
Average Number of
Benefi ciaries
Name of Institution/Scheme
6 7 8 9 1
(C) SOCIAL DEFENCE PROGRAMME
11 477 11 414 1 Residential Institutions for the beggars under begging Act,(BPB Act 1959)
10 8188 2 Probation Services
1 929 3 Prison Welfare Services
6 1102 6 1144 4 Home for Mentally Challenged
(d) PHYSICALLY HANDICAPPED
1 5 1 5 1 Training-cum Production Centres.
1 15 1 3 2 Sheltered Workshops
NA NA NA NA 3 Residential Homes for Physically Handicapped
5 1354 5 1354 4 School for Deaf and Dumb.
1 57 1 67 5 School for the Mentally retarded Children
1 90 1 100 6 Homes for college Blind Students
1 112 1 135 7 Govt. Sr. Sec. School for Blind

350
2013-2014 2014-2015
laLFkk @;kstuk dk ukeykHk izkIr djus okyks dh vkSlr
la[;k
ykHk izkIr djus okyks dh vkSlr
la[;k1 2 3
(E) lkekftd lqj{kk@vU;1 fo/kokvksa dks Lojkstxkj@
isa'ku ds fy;s foÙkh; lgk;rk
126478 NA
2 o`)koLFkk 376000 331881
3 cw<+s vkSj vk'kDr O;fDr;ksa dk x`g fcUnkiqj
54 108
4 jk"Vªh; ifjokj fgrdkjh ;kstuk
2872 3372
5 dq"B O;fDr;ksa ds fy, iquokZl dsUnz
586 562
6 yM+dh f'k'kq laj{k.k ;kstuk 186866 185135
7 fo/kokvksa dh yM+dh rFkk vukFk yM+fd;ksa dh 'kknh
3025 2951
8 fodykax O;fDr;ksa dks csjkstxkj HkÙkk
45471 41043
lzksr % efgyk ,oa cky foHkkx] fnYyh ljdkjA

351
2015-2016 2016-2017
Average Number of Benefi ciaries
Average Number of Benefi ciaries
Name of Institution/Scheme
4 5 1
(E) SOCIAL SECURITY/OTHERS
158603 176778 1 Financially Assistance to Widows etc. for self employment/Pension to Women in Distress
407709 381849 2. Old Age Pension.96 99 3. Homes for Aged and Infi rms
Persons Bindapur & Lampur5396 7000 4 National Family Benefi t
Scheme541 586 5 Rehabilitation Centre for
Lepers174212 166197 6 Girl Child protection scheme/
(Ladli scheme)3612 3273 7 Marriage of widow's daughter
& orphan girls65070 71581 8 Unemployment allowance to
disabled personsSource: Deptt. of Woment & Child Dev., Govt. of NCT of Delhi.

352
XXIII. fofo/k leadfofo/k lead23-1 fnYyh esa lkoZtfud forj.k iz.kkyh
fooj.k 2011-12 2012-13 2013-14
1 2 3 4
1- jk'ku dkMks± dh la[;k ¼gtkjksa esa½ 3339* 3455* 1779
2- mfpr nj nqdkusa 2498 2479 2396
3- vuqKkif=r feV~Vh ds rsy dh nqdkuksa dh la[;k
2361 1828 NIL
lzksr % [kk| ,oa laHkj.k foHkkx] jk"Vªh; jkt/kkuh {ks=] fnYyh ljdkjA

353
XXIII. MISCELLANEOUS STATISTICS23.1 Public Distribution System in Delhi
2014-15 2015-16 2016-17 Description
5 6 7 1
1700 1957 1940 No. of Food Cards (in '000)
2310 2281 2254 Fair Price Shops
NIL NIL NIL No. of Licensed Shop of
Kerosene Oil
Source: Food & Supplies Department, Govt. of NCT of Delhi.* This includes stamped/unstaped,APL, BPL, AAY. Annapurna Cards.

354
23-2 fnYyh esa xjhch js[kk23-2 fnYyh esa xjhch js[kk23.2 POVERTY LINE IN DELHI
o"kZ xzkeh.k 'kgjh ;ksxYear Rural Urban Combined1 2 3 4 1
1993&94
la[;k ¼yk[kksa esa½ 0.19 15.32 15.51 No.'s in Lakhs
izfr'kr 1.9 16.03 14.69 Percentage
1999&2000
la[;k ¼yk[kksa esa½ 0.07 11.42 11.49 No.’s in Lakhs
izfr'kr 0.4 9.42 8.23 Percentage
2004&2005*
la[;k ¼yk[kksa esa½ 1.4 18.9 20.4 No.’s in Lakhs
izfr'kr 15.6 12.9 13.1 Percentage
2009&2010*
la[;k ¼yk[kksa esa½ 0.3 22.9 23.3 No.’s in Lakhs
izfr'kr 7.7 14.4 14.2 Percentage
2011&2012**
la[;k ¼yk[kksa esa½ 0.5 16.5 17.0 No.’s in Lakhs
izfr'kr 12.9 9.8 9.9 Percentage

355
23-2 Hkkjr esa xjhch js[kk23-2 Hkkjr esa xjhch js[kk23.2 POVERTY LINE IN INDIA
o"kZYear
xzkeh.kRural
'kgjhUrban
;ksxCombined
1 2 3 4 1
1993&94
la[;k ¼yk[kksa esa½ 2440.31 762.37 3202.68 No.'s in Lakhs
çfr'kr 37.27 32.36 35.97 Percentage
1999&2000
la[;k ¼yk[kksa esa½ 1932.43 670.07 2602.50 No.’s in Lakhs
izfr'kr 27.09 23.62 26.10 Percentage
2004&2005*
la[;k ¼yk[kksa esa½ 3266.6 807.6 4076.1 No.’s in Lakhs
izfr'kr 41.80 25.7 37.2 Percentage
2009&2010*
la[;k ¼yk[kksa esa½ 2782.1 764.7 3546.8 No.’s in Lakhs
izfr'kr 33.8 20.9 29.8 Percentage
2011&2012**
la[;k ¼yk[kksa esa½ 2166.6 531.25 2697.83 No.’s in Lakhs
izfr'kr 25.70 13.70 21.92 Percentage
Source: Planning Commission, Govt. of India*Report of the Expert Group to Review the Methodology for Measurement of Poverty (Tendulkar Methodology), Planning Commission, Govt. of India, June, 2014

356
23-3 fnYyh esa xjhch js[kk23-3 fnYyh esa xjhch js[kk23.3 POVERTY LINE IN DELHI
¼izfr O;fDr izfr ekg :i;ksa esa½
(Rs. per Capita per Month)
o"kZ xzeh.k 'kgjh
Year Rural Urban
1 2 3
1973-74 49.95 67.95
1977-78 59.37 80.17
1983-85 88.57 123.29
1987-88 122.9 176.91
1993-94 233.79 309.48

357
23-3 fnYyh esa xjhch js[kk23-3 fnYyh esa xjhch js[kk23.3 POVERTY LINE IN DELHI
¼izfr O;fDr izfr ekg :i;ksa esa½(Rs. per Capita per Month)
o"kZYear
xzeh.kRural
'kgjhUrban
1 2 3
1996-97 289.31 404.96
1999-2000 362.68 454.11
2004-2005* 541 642
2009-2010* 748 1040
2011-12* 1145 1134
Source: Planning Commission, Govt. of India*Report of the Expert Group to Review the Methodology for Measurement of Poverty (Tendulkar Methodology), Planning Commission, Govt. of India, June, 2014

358
23-4 fnYyh esa vlaf?kr dk;Z lsDVj23-4 fnYyh esa vlaf?kr dk;Z lsDVj
dqy la[;k@Total Number
m|e Jfed
fooj.k Enterprise Workers
1 2 3
fofuekZ.k 242388 903868
¼dqy dk %½ (21.00) (30.33)
O;kikj 475275 970210
¼dqy dk %½ (41.18) (32.56)
vU; lsok,a 436422 1105658
¼dqy dk %½ (37.82) (37.11)
;ksx 1154085 2979736
lzksr % lektkfFkZd losZ{k.k dk 67oka pØ vFkZ ,oe~ lkaf[;dh funs'kky;] jk"Vªh; jkt/kkuh {ks=] fnYyh ljdkj

359
23.4 Unincorporated Non-Agricultural Enterprises (Excluding Construction) in Delhi-2010-11
ekfld ldy ewY; lao/kZu ¼:-½ Per Month Gross Value Added (Rs.)
izfr m|e izfr JfedPer Enterprise Per Worker Description
4 5 134561 9268 Manufacturing
(in % of total)
31307 15336 Trade
(in % of total)
33431 13196 Other Services
(in % of total)
32793 12701 Total(July 2010 - June 2011)Source : 67th Round of Socio-Economic Survey, Dte. of Economics & Statistics, Govt. of NCT of Delhi

360
23-5 fnYyh esa viax O;fDr;ksa dh vuqekfur la[;k rFkk vaixrk dh fdLe23-5 fnYyh esa viax O;fDr;ksa dh vuqekfur la[;k rFkk vaixrk dh fdLe
viaxrk dh fdLeviax O;fDr;ksa dh la[;k
iq:"k L=hMale Female
1 2 3
¼d½ ekufld
(i) eanu 10385 5953
(ii) chekjh 6292 3754
dqy 16677 9707
¹¼[k½ n`f"Vd
(i) va/kkiu@ean n`f"V 16864 13260
¼x½ lapkj
(i) lquuk 19277 15222
(ii) ok.kh 8946 6148
dqy 28223 21370
¼?k½ pyu 40727 26656
¼M½ cgqfo| 14105 10280
dqy 54832 36936
vU; 21783 15230
dqy 138379 96503
dqy izfr'kr 63.80 36.20

361
23.5 Estimated Number of Disabled Persons in Delhi by Type of DisabilityNo. of Disabled Persons
dqy ;ksx dk izfr'krTotal Percentage to Total Type of Disability
4 5 1(a) Mental
16338 6.96 (i) Retardation
10046 4.28 (ii) Illness
26384 11.23 Total
(b) Visual
30124 12.83 (i) Blindness/ Low Vision
( c) Communication
34499 14.69 (i) Hearing
15094 6.43 (ii) Speech
49593 21.11 Total
67383 28.69 (d) Locomotor
24385 10.38 (e) Multiple
91768 39.07 Total
37013 15.76 (f) Any other234882 100.00 Total
100 Percentage to TotalSource : Offi ce of Census Operations, Registrar General of india, Govt. of India, Census-2011

362
23-6 fnYyh rFkk leLr Hkkjr esa ikfjokfjd miHkksDrk O;; dk Lrj vkSj izfr:i23-6 fnYyh rFkk leLr Hkkjr esa ikfjokfjd miHkksDrk O;; dk Lrj vkSj izfr:i[izfr O;fDr ekfld miHkksDrk O;; ¼:-½izfr O;fDr ekfld miHkksDrk O;; ¼:-½]
fnYyh/Delhi
ensa
NSS 63rd NSS64th NSS66th NSS68thRound Round Round Round
(July 2006- (July 2007- (July 2009- (July 2011-June2007) June2008) June2010) June2012)
1 2 3 4 5
xzkeh.k[kk| 553.05 740.72 771.28 1,182.74
[kk|srj 751.22 962.58 989.75 1,378.41
;ksx 1,304.27 1,703.30 1,761.03 2,561.16
'kgjh
[kk| 733.53 770.21 1,036.21 1,489.02
[kk|srj 1,238.66 1,307.83 1,868.66 2,352.52
;ksx 1,972.19 2,078.04 2,904.87 3,841.54
lzksr % vFkZ ,oe~ lkaf[;dh funs'kky;] jk"Vªh; jkt/kkuh {ks=] fnYyh ljdkj

363
23.6 Level & Pattern of Household Consumer Expenditure in Delhi & All India
(Monthly Per capita Consumer Expenditure in Rs.)
leLr Hkkjr /All India
NSS 63rd NSS 64th NSS 66th NSS 68th
ItemsRound Round Round Round
(July 2006- (July 2007- (July 2009- (July 2011-
June 2007) June 2008) June 2010) June2012)
6 7 8 9 1
Rural
363.42 404.33 497.09 756.49 Food
331.75 368.03 455.96 673.47 Non-Food
695.17 772.36 953.05 1,429.96 Total
Urban
517.25 582.43 727.49 1,120.88 Food
795.25 889.11 1,128.52 1,508.78 Non-Food
1,312.50 1,471.54 1,856.01 2,629.66 Total
Source : Dte. of Economics & Statistics, Govt. of NCT of Delhi

364
23-7 fnYyh esa edkuksa dh voLFkk23-7 fnYyh esa edkuksa dh voLFkk23.7 Housing Conditions In Delhi-2012
izfr'kr esa
fooj.k In Percentage Description1 2 1
¼d½ vkokl bZdkbZ lajpuk ds izdkj Structure Type of Dwelling Unit(Combined)
iDdk 99.1 PuccavFkZ iDdk .68 Semi PuccadPpk .22 Katcha¼[k½ vkokl iz;ksx ds izdkj Type of Use of
Dwelling Unitfjgk;'k 88.64 Residentialfjgk;'k lfgr okf.kfT;d 10.98 Residential cum
commercialvU; 0.38 Others¼x½ vkokl dk LokfeRo Ownership of
Dwellingfuth 61.11 Ownedfu;ksDrk dk edku 4.51 Employer's quartersvU; fdjk;s dk edku 28.08 Hired accommodationvU; 6.3 Others
(July - December - 2012)lzksr % vFkZ ,oe~ lkaf[;dh; funs'kky;] jk"Vªh; jkt/kkuh {ks=] fnYyh ljdkjASource : 69th Round of Socio-Economic Survey, Dte. of Economics &Statistics, Govt. of NCT of Delhi

365
23-8 fnYyh esa jkstxkj rFkk csjkstxkj dh fLFkfr23-8 fnYyh esa jkstxkj rFkk csjkstxkj dh fLFkfrtqykbZ 2011 ls twu 2012 ds nkSjkutqykbZ 2011 ls twu 2012 ds nkSjku
23.8 Employment & Unemployment Situation inDelhi (During July 2011-June 2012)
O;fDr;ksa dh la[;k@No. of persons[k.M
Sectorjkstxkj
Employedcsjkstxkj
UnemployedJe 'kfDr
Labour forceJe'kfDr ds fcuk
Out of labour force
dqyEstimated
Populationxzkeh.k@Rural
iq#"k 70421 8216 78637 132436 211073Male (85.54%) (96.55%) (86.57%) (44.03%)L=h 11901 293 12194 168319 180513Female (14.46%) (3.45%) (13.43%) (55.97%)dqy 82322 8509 90831 300755 391586Total (100.00%) (100.00%) (100.00%) (100.00%)
'kgjh /Urbaniq#"k 5095753 204690 5300443 3617228 8917671Male (90.61%) (79.36%) (90.12%) (33.44%)L=h 528042 53227 581269 7198275 7779544Female (9.39%) (20.64%) (9.88%) (66.56%)dqy 5623795 257917 5881711 10815503 16697214Total (100.00%) (100.00%) (100.00%) (100.00%)
fnYyh@Delhiiq#"k 5166174 212905 5379080 3749664 9128744Male (90.54%) (79.91%) (90.06%) (33.73%)L=h 539943 53520 593463 7366594 7960057Female (9.46%) (20.09%) (9.94%) (66.27%)dqy 5706117 266426 5972543 11116258 17088800Total (100.00%) (100.00%) (100.00%) (100.00%)uksV % czsdV esa izfr'kr n'kkZ, x, gSa @Brackets shows percentageL=ksr% ,u,l,l lektkfFkZd losZ{k.k dk 68ok¡ ^fnYyh esa jkstxkj rFkk csjkstxkj** ds fo"k; esa vFkZ ,oe~ lkaf[;dh funs'kky; ]jk"Vªh; jkt/kkuh {ks=] fnYyh ljdkjASource : 68th Round of NSS Socio Economic survey on \"Employment and Un-employment situation in Delhi\"(July 2011 to June 2012) Dte of Eco. & Stat, GNCT of Delhi

366
O;k[;kRed fVIif.k;kaO;k[;kRed fVIif.k;ka
vuqHkkx&I {ks=Qy ,oa tula[;k
¼lkj.kh 1-1 ls 1-35½
jk"Vªh; jkt/kkuh {ks= fnYyh dk leLr {ks= ik¡p LFkkuh; fudk;ksa] iwohZ fnYyh uxj fuxe mÙkjh fnYyh uxj fuxe] nf{k.k fnYyh uxj fuxe] ubZ fnYyh uxj ifj"kn o fnYyh Nkouh cksMZ esa cVk gqvk gSA fnYyh uxj fuxe {ks= xzkeh.k o 'kgjh nks Hkkxksa esa foHkkftr gS tc fd vU; nks LFkkuh; fudk;ksa dk leLr {ks= 'kgjh gSA
vuqHkkx&II jkT; vk; vuqHkkx
¼lkj.kh 2-1 ls 2-8½
jk"Vªh; jkt/kkuh {ks=] fnYyh ds vuqekfur jkT; ?kjsyw mRikn miyC/k vkadM+ksa ds vk/kkj ij rS;kj fd, x, gS izfr O;fDr vk;] tux.kuk 2011 ds ifj.kkeksa ds vk/kkj ij fudkyh xbZ gSA m|ksx ewy ds vuqlkj fnYyh dh jkT; vk; ds vuqeku izpfyr Hkkoksa ij LFkkbZ ¼2011&2012½ Hkkoksa ij Øe'k% lkj.kh 2-3 ls 2-6 esa fn, x, gSA leLr Hkkjr dqN jkT;ksa rFkk la?k jkT;ksa dh izfr O;fDr vk; ¼izpfyr o fLFkj Hkkoksa ij½ rqyukRed fLFkfr dks n'kkZus gsrq lkj.kh 2-7 o 2-8 esa iznf'kZr xbZ gSA

367
EXPLANATORY NOTES
SECTION I—Area & Population
(Tables 1.1 to 1.35)
The National Capital Territory of Delhi is covered by fi ve local bodies i.e. North Delhi Municipal Corporation] East Delhi Municipal Corporation, South Delhi Municipal Corporation, New Delhi Municipal Council and Delhi Cantonment Board. The area of Municipal Corporation has been divided into Rural and Urban while the other two local bodies are entirely urban.
SECTION II—State Income Estimates
(Table 2.1 to 2.8)
The Estimates of State Domestic Product of the National Capital Territory of Delhi have been prepared on the basis of available date. The per capita income has been derived on the basis of results of the population Census 2011. The State Income of Delhi by industry of Origin at Current prices & Constant prices (2011-2012) is given in Table 2.3 to 2.6 respectively. Per Capita income of All India certain States & Union Territories (at current Prices and constant Prices) have been given in table 2.7 and 2.8 with a view to have a comparative picture.

368
vuqHkkx&III tyok;q ,oa o"kkZ
¼lkj.kh 3-1 ls 3-2½
fdlh fnu esa de ls de 2-5 fe-fe- gqbZ o"kkZ dk fnu ekuk x;k gSA ,slh lEHkkouk gks ldrk gS fd fdlh eghus esa o"kkZ gksus ds ckotwn dksbZ Hkh izLohd`r o"kkZ dk fnu u gksA
vuqHkkx&V d`f"k ,oa i'kq/ku
d`f"k
¼lkj.kh 5-4½
pquh gqbZ Qlyksa ds mRiknu] jktLo vf/kdkjh ds vfUre vuqeku ij vk/kkfjr gS] vfrfjDr mu Qlyksa ds ftuds ckjs esa uewuk vk/kkj ij Qly dVkbZ ijh{k.k fd, x, FksA
d`f"k ewY;
¼lkj.kh 5-7½
mRiknd ds ewY; oLrq Ø;&foØ; ds pje le; ij dqN pquh gqbZ oLrqvksa ds fnYyh dh rhu ef.M;ksa&ujsyk] utQx<+ o egjkSyh ds ewY;ksa dh vkSlr }kjk izkIr fd, x, gSA vf/kdrj oLrqvksa ds Ø;&foØ; ds pje le; dk fu/kkZj.k [kk| ,oa d`f"k ea=ky; }kjk izsf"kr ÞHkkjrh; Qly dyS.Mjß fjiksVZ ds vk/kkj ij gqvk gSA dqN oLrqvksa ds lEcu/k esa LFkkuh; fLFkfr dks ns[krs gq, le; esa ifjorZu fd;s x;sA

369
SECTION III—Climate & Rainfall
(Tables 3.1 & 3.2)
A day receiving at least 2.5 mm of rainfall is treated as one rainy day. Hence, it is possible that a month may have some rainfall without any recognised rainy day.
SECTION V—Agriculture and Livestock Agriculture
(Table 5.4)
Production of Selected Crops is based on the fi nal forecast of the revenue authorities except those for which crop cutting experiments were conducted on sample basis.
Agricultural Prices
(Table 5.7)
The producer’s price of selected commodities during peak marketing period has been obtained by averaging the prices from three rural markets of Delhi. viz., Narela, Najafgarh and Mehrauli.The peak marketing period for most of the commodities has been determined on the basis of the report on ‘‘Indian Crop Calendar’’ issued by the Ministry of Food & Agriculture. In case of a few commodities, however, certain modifi cation in the period have been made keeping in view the local conditions.

370
i'kq fpfdRlk lqfo/kk,a
¼lkj.kh 5-11½
vLirkyksa dh la[;k esa jk"Vªh; jkt/kkuh {ks=] fnYyh 'kklu] uxj fuxe] ubZ fnYyh uxj ifj"kn] lSfud] jk"Vªifr vax j{kd] fnYyh fpfM+;ka?kj ,uhey] ÝSM~l rFkk ,l-ih-lh-,- vLirky lfEefyr gSA vkS"kk/kky;ksa esa jk"Vªh; jkt/kkuh] {ks= fnYyh ljdkj vkSj fnYyh uxj fuxe ds vkS"kk/kky; lfEefyr gSA
vuqHkkx&VI m|ksx
iathd`r dkj[kkus
¼lkj.kkh 6-2½
QSVªht ,DV] 1948 dh /kkjk 2 ,e ¼i½ ds vUrxZr mu QSfDVª;ksasa dk ftuesa 10 ;k vf/kd deZpkjh dke djrs gSA rFkk 'kfDr dk iz;ksx gksrk gS vkSj /kkjk 2 ,e ¼ii½ ds vUrxZr mu QSfDVª;ksa dk ftuesa 20 ;k vf/kd deZpkjh dke djrs gS rFkk 'kfDr dk iz;ksx ugha gksrk iath;u vko';d gSA ,dV dh /kkjk 85 ds vUrxZr vU; dqN QSfDVª;ksa dk iath;u Hkh gksrk gSA

371
Veterinary Facilities
(Table 5.11)
Hospitals include the hospitals under Govt. of National Capital Territory of Delhi. Municipal Corporation of Delhi, New Delhi Municipal Council, Military. President’s Body Gurad, Delhi Zoo, Animal Friends and S.P.C.A. Dispensaries include dispensaries under Govt. of National Capital Territory of Delhi & Municipal Corporation of Delhi.
SECTION VI—Industry
Registered Factories
(Table 6.2)
Under the Section 2m (i) of the Factories Act, 1948. Factories employing 10 or more workers and using power, under section 2m (ii) of the Act those employing 20 or more workers but not using power are required to be registered. A few other factories are also registered under section 85 of the Act.

372
m|ksxksa dk okf"kZd losZ{k.k
¼lkj.kh 6-3½
Hkkjr ljdkj jk"Vªh; uewuk losZ{k.k dk;ZØe ds vUrxZr m|ksxksa dk okf"kZd losZ{k.k djrh gS ftlds vUrxZr izfrj{k izfr"Bkuksa dks NksM+dj QSDVªh vf/kfu;e] 1948 dh /kkjk 2 ,e ¼i½ rFkk 2 ,e ¼2½ ds vUrxZr iathd`r QSfDVª;ksa dks lfEefyr fd;k tkrk gSA rkfydk esa x.kuk rFkk uewuk lSDVj ds vkadM+s n'kkZ;s x;s gSA
vkS|ksfxd mRiknu dk lwpdkad
¼lkj.kh 6-4½
vkS|ksfxd mRiknu lwpdkad ds vUrxZr ny laxfBr vkS|ksfxd {ks= esa dk;Zjr dkj[kkuksa dks gh fy;k tkrk gS tks /kkjk 2 ¼,e½ Hkkjrh; dkj[kkuk vf/kfu;e] 1948 ds vUrxZr iathd`r gS vkSj jk"Vªh; jkt/kkuh {ks=] fnYyh esa dk;Z dj jgs gSaA D;ksafd vlaxfBr {ks= ds dksbZ Hkh fu;fer ,oa fo'oluh; vkadM+s miyC/k ugha gSA
vuqHkkx&VII fo|qr
¼lkj.kh 7-1 ls 7-3½
fo|qr mRiknu {kerk o fMjsfVM fo|qr {kerk nksuksa ls lacaf/kr vkadM+s fn;s x;s gSA e'khujh o dyiqtks± dh VwV&QwV bR;kfn dks /;ku esa j[krs gq, fMjsfVM fo|qr {kerk ds vkadM+s fudkys tkrs gSA lkj.kh ua- 7-3 miHkksDrkvksa dh la[;k tks fctyh ls flpkbZ djrs gSa] vkS|ksfxd ¼,y-Vh-½ esa lfEefyr gSA

373
Annual Survey of Industries
(Table 6.3)
The Government of India under the national Sample Survey Pro-gramme conducts Annual Survey of Industries covering the factories regis-tered under Section 2m (i) and 2m (ii) of the Factories Act, 1948 excluding the Defence Establishments. In the Table the data of Census and Sample Sector have been shown.
Index of Industrial Production
(Table 6.4)
The Index of Industrial production, covers only organised industrial sector, comprising of factories registered under Section 2(m) of the Indi-an Factories Act, 1948 and functioning, within the Territory, because of the non-availability of regular and reliable data for the unorganised sector.
SECTION VII—Electricity
(Table 7.1 to 7.3)
Figures in these tables relate to both the installed capacity as well as derated capacity of the Delhi Electric Supply Undertaking. The derated ca-pacity is arrived at after taking into consideration the wear and tear of the plant & machinery. Number of Consumers of Electricity under irrigation included in industrial (LT) table No. 7.3.
SECTION XIII—Labour & Employment

374
vuqHkkx&XIII Je ,oa jkstxkj
¼lkj.kh 13-1 ls 13-4½
jkstxkj cktkj lwpuk dk;ZØe ds vUrxZr jkstxkj f'k{kk =Sekfld vof/k ij leLr lkoZtfud {ks= esa jkstxkj rFkk futh {ks= ds vd`f"k laLFkkuksa esa tgka 10 ;k vf/kd deZpkjh dke djrs gSA jkstxkj laca/kh lwpuk ,df=r djrk gSA
lkj.kh 13-2 dk mís'; jkstxkj dk;kZy;ksa dh pky iwath esa izkfFkZ;ksa ds f'k{kk Lrj dks n'kkZuk gSA lkj.kh 13-4 vuqlwfpr tkfr@tutkfr rFkk viax] jkstxkj pkgus okys O;fDr;ksa ds ckjs esa vkadM+s iznf'kZr djrh gSA
vuqHkkx&XV iqfyl vijk/k ,oa nq?kZVuk,a
¼lkj.kh 15-2 ls 15-4½
;gka iqfyl dks lwfpr gLr{ksi vijk/kksa dh la[;k nh xbZ gSA

375
(Table 13.1 to 13.4)
Under the Employment Market Information (EMI) Programme, the Directorate of Employment collects on quarterly basis information on em-ployment from the entire public sector and non-agricultural establishments employing 10 or more persons in private Sector.
Table 13.2 has been aimed to present educational standards of the ap-plicants on the live register. Table 13.4 aims to present important informa-tion regarding the employment seekers from Scheduled Castes/Scheduled Tribes and physically handicapped persons.
SECTION XV—Police, Crimes & Accidents
(Table 15.2 to 15.4)
The number of crimes given here are the cognizable ones as reported to the police.

376
vuqHkkx&XIX Hkko
vkS|ksfxd Jfedksa ds fy, miHkksDrk Hkko lwpdkad ¼lkj.kh 19-3½ o"kZ 1999&2000 esa fd, x, vkS|ksfxd Jfedksa ds jgu&lgu ds losZ{k.k ds vkèkkj ij Je dk;kZy;] f'keyk }kjk o"kZ 2001=100 dks vk/kkj ekurs gq, fnYyh dsUnz ds fy, pkyw lwpdkad ladfyr fd, tk jgs gSaA
o"kZ 1982=100] 1960=100] 1949=100] o 1939=100 ds vk/kkjksa ij lwpdkad tksM+us okys xq.kdksa dk iz;ksx djrs gq, vuqekfur fd, x, gSA
vuqHkkx&XXI vkfFkZd x.kuk
vkfFkZd x.kuk&2013 d`f"k o xSj d`f"k xfrfof/k;ka ¼lkj.kh 21½

377
SECTION XIX—Prices
Consumer Price Index Number for Industrial Workers (Table 19.3)
On the basis of the Family Living Survey of Industrial Workers conducted during 1999-2000 the current index for Delhi centre with base 2001=100 is being compiled by Labour Bureau, Shimla.
The indices with base 1982=100, 1960=100, 1949=100 and 1939=100 have been estimated utilising the linking factors.
SECTION XXI—Economic Census
Economic Census—2013
(Agricultural Activities & Non Agricultural Activities) (Table 21)

378
vkfFkZd x.kukvksa esa iz;ksx dh xbZ lk/kkj.k /kkj.kk,a rFkk ifjHkk"kk,a fuEu gS%&
1- izfr"Bku & izf"Bku og bdkbz ;k ifjokj gS tks xSj&d`f"k m|e esa yxk gks ftlesa de ls de ,d etnwj iw.kZ :i ls fu;fer vk/kkj ij dk;Zjr gksA
2- m|e & m|e ;k miØe gS tks fdlh eky mRiknu vkSj ;k forj.k vkSj fdlh izdkj dh ,slh lsokvksa esa yxk gS tks dsoy ifjokj ds vius gh m|ksx ds fy, u gksA
3- d`f"k m|e & d`f"k m|e og m|e gS tks i'kq /ku mRiknu d`f"k lsokvksa] f'kdkj Qlkuk vkSj vk[ksV izlkj] ou m|e ,oa yV~Bk m|e vkSj eNu m|e esa dk;Zjr gSA d`f"k mit o ckxokuh esa yxs m|e esa dk;Zjr gSA d`f"k mit o ckxokuh esa yxs m|e mlesa lfEefyr ugha gSA

379
General concepts and defi nitions used are given below :—
1. Establishment :—Establishment is a unit or household engaged in Non-agricultural Enterprises with the assistance of at least one hired worker on a fairly regular basis.
2. Enterprise :—Enterprise is an undertaking engaged in production and/or distribution of goods and/ or services not for the sole purpose of own consumption.
3. Agricultural Enterprise :—It is defi ned as one engaged in livestock production, agricultural services, hunting trapping and game propagation forestry, logging and fi shing. Enterprises engaged in activities pertaining to agricultural production and plantations are not covered.