ffy 2016 part b state performance plan (spp)/annual ... · the idea data center (idc) center for...
TRANSCRIPT

INPart B
FFY2016State Performance Plan /
Annual Performance Report
FFY 2016 Part B State Performance Plan (SPP)/Annual Performance Report (APR)
5/15/2018 Page 1 of 65

Introduction to the State Performance Plan (SPP)/Annual Performance Report (APR)
Attachments
OSEP Comment: The State’s determinations for both 2016 and 2017 were Needs Assistance. Pursuant to section 616(e)(1) of the IDEA and 34 C.F.R. § 300.604(a), OSEP’s June 28, 2017determination letter informed theState that it must report with its FFY 2016 SPP/APR submission, due February 1, 2018, on: (1) the technical assistance sources from which the State received assistance; and (2) the actions the State took as a result of thattechnical assistance.
Indiana Response:
(1) the technical assistance sources from which the State received assistance:
National Center on Accessible Educational Materials (AEM)State Implementation and Scaling-up of Evidence-based Practices (SISEP)Early Childhood Personnel Center (ECPC)Center on Positive Behavioral Interventions and Supports (PBIS)National Center on Deaf-Blindness (NCDB)National Center for Systemic Improvement (NCSI)National Deaf Center on Postsecondary OutcomesCenter for IDEA Early Childhood Data Systems (DaSy)CADRE (National Center for Appropriate Dispute Resolution in Special Education)Early Childhood Technical Assistance Center (ECTA)Early Childhood Personnel Center (ECPC)Great Lakes Equity CenterThe IDEA Data Center (IDC)Center for IDEA Fiscal Reporting (CIFR)Center for the Integration of IDEA Data (CIID)The National Center on Intensive Intervention (NCII)The Schoolwide Integrated Framework for Transformation (SWIFT) CenterNational Center on Educational Outcomes (NCEO)National Post-School Outcomes Center (NPSO)Center on Enhancing Early Learning OutcomesThe IRIS CenterCollaboration for Effective Educator Development, Accountability, and Reform (CEEDAR)Center for Parent Information and ResourcesGreat Lakes Comprehensive CenterNational Technical Assistance Center on Transition (NTACT)
(2) the actions the State took as a result of that technical assistance:
The DOE and IRN entities access these centers for a variety of purposes - all which support the elements of our 'Every StudentSucceeds' initiative, which has a foundation of 'Equity Plus Access Equals Outcomes'. See this link https://www.doe.in.gov/specialed forthe infographic, and click on the 'Office of Special Education Short Shares and Coffee Talks' for detailed information on each of theinfographic components.
The federal centers have been used in multiple ways: for a review of website topic specific content that was then used in work withLEAs,; staff have attended conferences and workshops in person that are hosted by the centers; we access the webinars and participatein the regularly scheduled conference calls offered by the centers, e.g. CIFR and NSCI; Indiana has been successful in applying forfocused assistance and national center staff visit Indiana to provide assistance based upon our needs, for example, multi tieredsystems of support, assessment, and results driven accountability; and, Indiana access the centers when we have a specific question.The assistance has been invaluable.
File Name Uploaded By Uploaded Date Remove
in-b-ffy2015priorindicator15findings_final (002).docx Nancy Zemaitis
387
General Supervision System:
The systems that are in place to ensure that IDEA Part B requirements are met, e.g., monitoring, dispute resolution, etc.
The Indiana State Education Agency (SEA) is located within the Indiana Department of Education/Academics Division and is the Office of Special Education (IDOE/OSE). The Department offers support to IDOE/OSE throughancillary divisions such as Finance and Business Operations, Communications, General Counsel, Government and Public Affairs and School Support Services. Please visit the Indiana website at http://www.doe.in.gov/ for
FFY 2016 Part B State Performance Plan (SPP)/Annual Performance Report (APR)
5/15/2018 Page 2 of 65
additional information. IDOE/OSE continues to strengthen relationships between various divisions through work on the State Systemic Improvement Plan (Indicator 17). The Every Student Succeeds Act has been anotheropportunity for collaboration, through initiatives such as the establishment of multi-tiered systems of support in Local Education Agencies (LEA) across the state. the IDOE/OSE looks forward to ongoing involvement in theimplementation of the Act to ensure excellence and equity for students with disabilities in Indiana.
The IDOE/OSE has nineteen dedicated staff members that provide general supervision to the state. Staff includes:
Administration
Director (1)
Assistant Director (1)
Due Process Team
Due Process Coordinator/Special Education Attorney (1)
Complaint Investigator (3)
Due Process Support Specialist (1)
Fiscal Team
Part B Grants Supervisor (1)
Grants and Medicaid Specialist (1)
Grants and Contracts Specialist (1)
Excess Cost Supervisor (1)
Excess Costs and Part B Grants Specialist (1)
Excess Cost Support Specialist (1)
Fiscal Support Specialist (2)
Monitoring Team
Education Specialist (4)
Data Manager (1)
As a result of a long and productive working relationship with the Parent Training and Information Center, IDOE is one of a few states, if not the only state, that provides office space for a staff member from our parent resourcecnter, IN*SOURCE, which helps to facilitate a close working relationship between the two entities. The IN*SOURCE staff member is an integral part of IDOE/OSE, attending IDOE/OSE staff meetings and is asked to speak tofamily members who call in with questions.
Following the Individuals with Disabilities Education Act (IDEA), corresponding regulations, and, Article 7, (Indiana’s special education rules), IDOE/OSE personnel are to ensure that students with disabilities are provided afree appropriate public education (FAPE) so they can be involved and make progress in the general education curriculum.
The IDOE/OSE 'system of general supervision' is a cohesive, coordinated set of the activities described below. It is important to note that though personnel have an assigned 'area of responsibility,' work is not done in isolation.Staff work closely with one another as each is dependent upon the others for updates, sharing of information, and communication of issues that impact the entire office. The IDOE/OSE routinely engages in cross-training DueProcess, Monitoring and Fiscal staff, involving individuals from each in the ongoing/routine work of the others’ program areas. For example, each of the due process, fiscal and monitoring staff members are also leadingproject teams, answer general inquiries on a rotational basis, serve on or providing administrative support for councils and Boards and assisting with review processes during peak times.
Staff work in partnership with other offices and divisions within the department including:
Superintendent of Public Instruction Early Learning & Intervention
Deputy Superintendent Title Programs
Government & Public Affairs Workforce and STEM Alliances
Communications eLearning
Information Technology School Support Services
Legal Affairs Student Services
Finance & Business Operations School & Community Nutrition
School Improvement Licensing
Grants Management Assessment
Staff also work closely with other state agencies that provide support for students with disabilities including:
Department of Health Family and Social Services Administration including divisions listed below:
Department of Workforce Development *First Steps
Indiana School for the Blind and Visually Impaired (ISBVI) *Division of Disabilities and Rehabilitation Services
Indiana School for the Deaf (ISD) *Vocational Rehabilitation Services
Department of Correction *Office of Early Childhood and Out of School Learning
Office of the Attorney General *Department of Child Services
FFY 2016 Part B State Performance Plan (SPP)/Annual Performance Report (APR)
5/15/2018 Page 3 of 65
Department of Administration *Division of Family Resources
State Board of Education *Office of Medicaid Policy and Planning
State Budget Agency Division of Mental Health and Addiction
State Board of Accounts *Division of Contracts Management
Legislative Services Agency *Division of Financial Management
GENERAL SUPERVISION COMPONENTS
For the purposes of this document Indiana is using a modified version of the guidance that OSEP offered in the Regional Implementation Meetings - Building the Legacy: IDEA 2004, “Concepts of General Supervision.”Indiana has identified eight components of general supervision which will be discussed in detail later in this introduction:
State Performance Plan/Annual Performance Report Policies, Procedures, and Effective Implementation Integrated Monitoring Activities Fiscal Management Data on Processes and Results Improvement, Correction,Incentives and Sanctions Effective Dispute Resolution Targeted Technical Assistance and Professional Development.
1) State Performance Plan (SPP)/Annual Performance Report (APR)
The current SPP is effective from FFY2013 through FFY2018. The SPP describes each of the 17 federal indicators and provides a target for each. Each indicator is categorized as either ‘compliance’ (the target is 100% or0%, depending upon the indicator) or ‘results’ (the target is set by IDOE/OSE based on trend analysis and stakeholder input). Some are measured by a statewide number, others include a compilation of local education agency(LEA) information, i.e. the percentage of LEAs that meet the target.
Submitted to OSEP each year, the APR reflects the performance of Indiana LEAs based upon data collected per indicator and includes the findings made, allowing a year for correction by LEAs that did not meet the targets setfor specific indicators. See “Integrated Monitoring Activities,” below for a description of data collection.
The SPP and APR are posted on the IDOE http://www.doe.in.gov/specialed/monitoring.
2) Policies, Procedures, and Effective Implementation
The Indiana special education rules are promulgated in the Indiana Administrative Code at 511 IAC 7-32, 7-49. This rule is commonly known as "Article 7," and there is an agency version that includes a table of contents and anindex for reader reference.
"Navigating the Course: Finding your way through Indiana's Special Education Rules" was written to provide an overview and a practical resource to help parents, advocates, school personnel, and students understand therequirements of Indiana's special education rules, Article 7.
When questions arise as local programs implement Article 7, necessary clarification is provided by the Director of Special Education, and this guidance/clarification is included through the Question/Answer Section of the“From the Director” newsletter and is posted on the "Learning Connection,” which is the IDOE on-line resource for education stakeholders. In addition to the various learning communities found on the Learning ConnectionWebsite, users can also find curriculum resources, academic standards, and post questions and/or suggestions. The Learning Connection is available as a resource not just to Special Education Directors, but to parents,teachers- both general and special education, building principals, Superintendents and any other education stakeholder.
Article 7 and Navigating the Course are aligned with the Individuals with Disabilities Education Act (IDEA) and are implemented by local programs, including LEAs and state-run programs. The documents are referenced byIDOE/OSE personnel when providing technical assistance in calls and emails from the general public and both serve as the basis of any technical assistance and training offered through IDOE/OSE.
3) Integrated Monitoring Activities
Annually, the IDOE/OSE makes a determination whether LEAs meet the requirements and purposes of IDEA Part B, which is reflected in Article 7. The IDOE/OSE makes this determination based upon data collectedthroughout the year and compares it to the indicator targets in the SPP, information obtained through LEA monitoring activities, and any other publicly available information. IDOE/OSE categorizes each LEA as:
1) Meets Requirements and purposes of Part B of IDEA;
2) Needs Assistance in implementing the requirements of Part B of IDEA;
3) Needs Intervention in implementing the requirements of Part B of IDEA; or
4) Needs Substantial intervention in implementing the requirements of Part B of the Act.
Depending upon the LEA determination, IDOE/OSE may offer technical assistance/training, require a corrective action plan to resolve the root cause issue(s), and/or put special conditions on funds of an LEA. LEAdeterminations are posted on the IDOE/OSE’s public website.
IDOE/OSE conducts various monitoring activities that focus on improving educational results and functional outcomes for all children with disabilities, and ensuring that LEAs and other educational programs meet theprogram requirements under Part B of the IDEA. IDOE/OSE conducts monitoring activities through the collection and analysis of data that the LEAs submit throughout the year. These data are compared to the compliancetargets as defined in the SPP. There are seventeen specific indicators, tied to three overarching themes, that are the cornerstones to Part B of IDEA:
1) Provision of a free appropriate public education in the least restrictive environment;
2) The IDOE/OSE exercise of general supervision, including child find, effective monitoring, the use of resolution meetings, mediation, and a system of transition services; and
3) Disproportionate representation of racial and ethnic groups in special education and related services, to the extent the representation is the result of inappropriate identification of the student with a disability.
The IDOE/OSE Monitoring Team members are each responsible to monitor LEA compliance with/results for specific indicators found in the SPP. Depending upon how the information is reported in the APR, the teammembers analyze either LEA data or statewide data. The data for each LEA is reviewed once every three years on three compliance indicators (B-11, B-12, and B-13). All LEAs are reviewed annually for the other complianceindicators (B-4, B-9, and B-10). In addition, all noncompliance identified through Indiana’s effective dispute resolution process must be corrected as soon as possible and no later than one year after the noncompliance hasbeen identified.
As the LEA information becomes available from IDOE data collections, the members of the team review the data for completeness and work with the individual LEAs as necessary to make sure the data was accurately submitted.In some cases, for example the disproportionality indicators, the data is sent to a vendor who is responsible for clean-up, analysis, and synthesis of the data. The data is then compared to the targets identified in the SPP. Someinformation submitted by an LEA for compliance indicators are determined to meet the targets based strictly on data, i.e., did the identification of a student's eligibility for special education occur within the state identifiedtimelines. However, other compliance decisions take additional factors into account before determining if there is a finding of noncompliance. Depending upon the indicator, in addition to an analysis of the data, a team membermay look at LEAs policies, procedures and practices as part of the noncompliance decision.
Letters are sent to LEAs specifying whether they are in compliance with the applicable indicators or failed to meet compliance requirements. If an LEA is out of compliance, it must determine the root cause and develop acorrective action plan to address the reason(s) it is noncompliant. The designated IDOE/OSE education specialist provides assistance throughout the root cause identification and corrective action plan development thenmaintains regular contact with the LEA staff responsible for correction of the identified noncompliance. This regular contact is in the form of telephone calls, face to face visits as well as emails consisting of discussion aboutthe issues, provision of technical assistance and identification of resources to assist with correction.
Using a two-pronged approach, education specialists are responsible to work with their assigned LEAs to verify that each incidence of noncompliance is corrected within the required timelines (Prong 1). For example,verification that Transition IEPs are developed during the appropriate timeframe and contain all required components. The education specialist is also responsible to review updated data to ensure that any systemic issuescausing noncompliance are addressed (Prong 2). If it is discovered during these regular contacts that the LEA is not making sufficient progress in correcting noncompliance, more concentrated technical assistance isprovided to ensure verification of correction during the required timeline. Once the correction has been verified the LEA is issued a letter documenting that the noncompliance has been corrected. If the LEA is unsuccessful incorrecting noncompliance within the required timelines, the IDOE/OSE will impose the appropriate sanctions and/or enforcement.
FFY 2016 Part B State Performance Plan (SPP)/Annual Performance Report (APR)
5/15/2018 Page 4 of 65

Go to this webpage: https://www.doe.in.gov/specialed/monitoring. Then see the 'Federal Reporting' section. The posted Excel workbook named "LEA Report on All Indicators" has information about each LEA for eachcompliance or results indicator and whether the target was achieved by the LEA.
4) Fiscal Management
IDOE/OSE is responsible for three fiscal management areas:
A) Distribution and monitoring of Federal Part B funds. The Part B grants consist of section 611 (students ages 3-21) and section 619 (students ages 3-5). The purpose of these funds is to pay the costs of providing specialeducation and related services to students who are eligible for special education services. These funds are to supplement state, local and other federal funds. The IDOE/OSE team members provide intensive technicalassistance to LEA personnel to ensure the funds are utilized and reported appropriately.
The funds are distributed through an application process which includes:
An LEA budget that is built upon allowable costs, e.g., personnel/benefits, equipment, purchased services, materials, etc.; Identification of a proportionate share of Part B funds that will be spent on equitable services forparentally-placed private school children with disabilities; Maintenance of Effort, which requires an LEA to spend at least the same amount per student as it did in the previous fiscal year on students with disabilities from stateand local funds; Identification of Excess Costs, ensuring that an LEA can demonstrate that IDEA funds are used only for the excess costs that are required to provide FAPE to children with disabilities; Coordinated EarlyIntervening Services (CEIS). CEIS can be a voluntary or mandated process by which an LEA may expend up to 15% of the LEA’s total 611 and 619 Part B funds on students who have been identified as at risk for specialeducation services. If an LEA has exceeded the Indiana defined bar for discipline, special education identification or least restrictive environment, the LEA is mandated to expend exactly 15% of its total 611 and 619 allocationson students who have not been identified as needing special education or related services but need academic and behavioral support to succeed in a general education environment.
IDOE/OSE personnel not only distribute Part B funds in accordance with federal requirements, they assure the funds are used in accordance with federal and state requirements, by providing oversight on the use of funds.
IDOE/OSE personnel monitor for the appropriate use of the Part B funds. For example, the proportionate share of Part B funds must be documented by the LEA through submitted reports that include an itemization ofexpenditures and costs. IDOE/OSE provides assistance to LEAs regarding maintenance of effort, clarifying that expenses should be consistent year to year, logically be connected to special education, and that expenses betracked for audit purposes.
The IDOE/OSE staff monitor that the CEIS funds are spent appropriately. The LEA must itemize expenditures and costs, report the number of students receiving services through CEIS funding and the number of studentseligible for special education services after receiving services during a reporting period, and a description of the activities implemented through use of the funds that will be sustained. The members of the fiscal team workclosely with the monitoring team in this process.
IDOE/OSE utilizes a portion of the Part B funds for administrative support, including contracts to entities for the provision of technical assistance and professional develop to LEAs.
B) Medicaid reimbursement available for health-related services that schools provide to meet the educational needs of students with disabilities: IDOE/OSE has a Medicaid specialist who works with LEAs that claim Medicaidreimbursement for covered IEP-required services (e.g., physical therapy, speech therapy, nursing services, etc). The LEA is reimbursed at the Medicaid-allowable rate for these services, thereby recovering available federalfunds pursuant to federal and state Medicaid and Education laws and rules. LEAs can also take advantage of Indiana’s Medicaid Administrative Claiming opportunity, in which the participating LEA recovers a portion of its stateand local costs for staff administrative activities to facilitate healthcare access for ALL students in the district.
C) Excess Cost Funding: IDOE/OSE personnel manage a state line item fund that can be accessed by the LEA to cover the excess costs of educating students whose disabilities are of such intensity as to precludeachievement in the existing local public school setting.
The LEA may access this fund using an application that justifies the school’s inability to meet the student’s extraordinary educational need without this funding. The application is primarily based upon the services that areidentified in the IEP of the student, including consideration of least restrictive environment and includes detailed information about any private vendor and the costs of the service(s). The funding may pay for services thatinclude, but are not limited to, the following:
(a) A public or private residential program when services in a residential setting are necessary for the student to benefit from special education.
(b) Nonresidential services necessary to enable the student to remain in the community without resorting to residential placement or to return to the local community from a residential placement.
The IDOE/OSE personnel administer the funding process from receipt of application to payment for services via a state contract with either a private vendor or directly with the LEA. The state contract regulations involve IDOEFinance Division and several other state agencies.
5) Data on Processes and Results
School and LEA staff prepare and submit data regarding students, personnel, and other required data via the IDOE STN Application Center and DOE Online. Public schools, including charter schools, and accreditednonpublic schools submit required data. There are various required data submissions during the school year, some of which are specific to special education students:
Child count1.
Personnel Educational environments2.
Student exiting information3.
Discipline Assessment4.
Dispute resolution5.
The information is also used to complete the annual performance report required by OSEP, and as mentioned previously, used to discover LEA findings of noncompliance, and to make determinations.
Section 618 of the Individuals with Disabilities Education Act (IDEA) requires that each state submit data about children with disabilities, ages 3 through 21, who receive special education and related services under Part B ofIDEA. This data includes:
Assessment
Child Count
Child Count and Educational Environments
Discipline
Dispute Resolution
Educational Environments
Exiting
Maintenance of Effort Reduction and Coordinated Early Intervening Services
Personnel
Data is used to inform all of the projects that IDOE/OSE is involved in. IDOE/OSE provides data to members of the general public, school personnel, State Board of Education, and legislators. Confidentiality laws are followed.
6) Improvement, Correction, Incentives and Sanctions
FFY 2016 Part B State Performance Plan (SPP)/Annual Performance Report (APR)
5/15/2018 Page 5 of 65

Attachments
As stated earlier, IDOE/OSE personnel are to ensure that students with disabilities are provided a free appropriate public education (FAPE) so they can be involved and make progress in the general education curriculum.IDOE/OSE has the state authority to enforce regulations, policies and procedures to ensure LEA compliance. IDOE/OSE assists the LEA, through guidance, technical assistance and training, and in the correction ofdeficiencies that are identified through monitoring activities. If the LEA deficiencies persist, IDOE/OSE has a range of activities that may be utilized to assist in the correction. In the event the LEA does not correctnoncompliance within one year, the IDOE/OSE considers imposing sanctions ranging from more intensive technical assistance to placing special conditions on the use of Part B funds.
As part of the dispute resolution process (see below) has elements of improvement, correction, incentives and sanctions.
A. Complaint Investigation: The complaint is submitted to the IDOE/OSE and a complaint investigator investigates the allegations then develops a report which reflects the identified issue(s), the findings of fact, conclusions,and corrective action, if any.
B) Mediation: is a voluntary and confidential process that provides a trained and impartial mediator to facilitate discussion between the parent(s) and school to help the parties resolve a disagreement. If the disagreement isresolved through mediation, the parties must put their agreement in a written agreement.
C) Due Process Hearing: At the conclusion of the hearing, the Independent Hearing Officer considers all of the information and issues a written decision.
If, through the process of compliance monitoring an LEA has a finding of non-compliance, the LEA must complete a Root Cause Analysis to determine the reason(s) for non-compliance. From that, the LEA must develop aCorrective Action Plan. The plan must then be implemented, and the non-compliance fixed within a year of the finding. If the non-compliance is not fixed within a year, the LEA has 'uncorrected' non-compliance, and if not fixedafter the second year, the LEA goes into 'long standing' non-compliance. Findings as well as any continued non-compliance impacts the Determination score.
The Individuals with Disabilities Education Act (IDEA) requires the OSE to determine if each local educational agency (LEA) meets the requirements of Part B of the IDEA. Based on an LEA’s score on a number of criteriabased upon compliance indicators, the LEA is ranked in one of four categories of determination.
LEA DETERMINATION CONSEQUENCE
Meets Requirements No Action Needed by LEA
Needs Assistance LEA works with OSE Consultant; provided with resources
Needs Intervention LEA works with OSE Consultant; specific resource plan (TA/PD) developed that LEA must follow
Needs Substantial Intervention Individually determined. In recent years Indiana has had one district with this determination, and they were placed on Special Conditions for their Part B grant.
IDOE has imposed Special Conditions on one Local Educational Agency’s (LEA) for the grant award under Part B to ensure that the LEA General Supervision system (including monitoring, complaints, hearings, etc.)corrects noncompliance as required.
These special conditions were imposed because:
The failure of the LEA to implement requirements to evaluate and determine students eligible within 50 instructional days;1.
The failure of the LEA to implement requirements for transition services;2.
The failure of the LEA to implement requirements for discipline procedures;3.
The failure of the LEA to implement requirements for disproportionality in suspensions and/or expulsions;4.
The failure of the LEA to implement requirements for disproportionality in identification of students with disabilities based onrace/ethnicity;
5.
The failure of the LEA to implement requirements for Least Restrictive Environment;6.
The failure of the LEA to implement requirements for Maintenance of Effort;7.
The failure of the LEA general supervision system to timely correct noncompliance; and8.
The failure of the LEA to provide an appropriately certified sign language interpreter.9.
7) Effective Dispute Resolution
The working relationship between the student with a disability, his or her family, and school personnel is generally positive as all parties work together to make decisions about the student’s education. When there is adisagreement that cannot be worked out at the local level there are three conflict resolution options available:
A) A complaint, which can be filed by anyone, alleges that a school is not complying with: State/ federal special education or related requirements; A signed mediation agreement; A signed resolution agreement; or, A hearingofficer’s orders.
A complaint may involve one student or a group of students. The complaint is submitted to the IDOE/OSE and a complaint investigator investigates the allegations then develops a report which reflects the identified issue(s),the findings of fact, conclusions, and corrective action, if any.
B) Mediation may be used on a voluntary basis to resolve any disagreements between a parent and the LEA, including those involved in complaints and due process hearings. All parties must agree to participate in mediationwhich is conducted by a trained mediator. The discussions are confidential, and the mediation agreement is legally binding.
C) Due process hearings involve an ‘independent hearing officer’. The parent, 18 year old student, the school, or the IDOE may make a written request for a due process hearing. The process involves administrativeproceedings similar to court, and the parties can be represented by counsel or non-attorney advocate. If the hearing was requested by the parent, the school is required to conduct a resolution session. The parties may agreeto mediate in lieu of the resolution session. If the issue is not resolved or settled, a hearing will be conducted. The hearing officer makes a written decision, and there is an opportunity to appeal.
In addition to these three formal means of dispute resolution that are identified in Article 7, Indiana also offers facilitated IEP (FIEP) as a means to address concerns within the IEP team meeting, referred to, in Indiana, as thecase conference committee (CCC). A trained facilitator is provided upon request and at no cost to the parties.
IDOE/OSE works with the LEAs, as well as the Parent Training and Information Center to ensure that parents receive and understand their rights and responsibilities.
File Name Uploaded By Uploaded Date
No APR attachments found.
Technical Assistance System:
The mechanisms that the State has in place to ensure the timely delivery of high quality, evidenced based technical assistance and support to LEAs.
For purposes of this document ‘technical assistance’ is defined as the provision of advice and assistance in the implementation, installation and maintenance of the concepts related to improving the performance of studentswith disabilities.
FFY 2016 Part B State Performance Plan (SPP)/Annual Performance Report (APR)
5/15/2018 Page 6 of 65

Attachments
In Indiana, the provision of LEA technical assistance and professional development go hand in hand. Dependent upon the subject matter and the intensity of the need, IDOE/OSE offers various levels of technical assistanceand/or professional development. For ease of reading, the levels of assistance will be outlined as the ‘Technical Assistance System”, and the provision of technical assistance/professional development will be addressed in the“Professional Development System” description portion of the introduction.
IDOE/OSE provides technical assistance and professional development based upon three levels of need:
Universal
Targeted
Intensive
The universal level is available to all LEAs and includes resources through: discussion with or training by the IDOE/OSE staff members; the IDOE website including topic specific communities of learning; the IDOE LearningConnection; information about state and national resources (including the OSEP funded national technical assistance centers as well as the Indiana Resource Network [contracted vendors]); links and contact information torelevant local, regional and state resources; written guidance about specific topics; short video clips called 'Short Shares' and 'Coffee Talks', webinars, and, question and answer documents.
The targeted level of assistance is available to those LEAs who have identified noncompliance found through the monitoring process described elsewhere in this introduction, or, if the LEA is in danger of being out ofcompliance if procedure/practice revisions are not made. The targeted level also includes those LEAs who have had personnel changes and require assistance to ensure new staff gain the knowledge of the expectations underIDEA. Assistance is provided via: webinars; conference calls; on-site or regional training opportunities that include evidence based practices; and, summits.
The intensive level of assistance has a focus on those LEAs that have identified issues that most likely are systemic and require rigorous LEA work and focused assistance by the IDOE/OSE and/or the Indiana ResourceNetwork. Assistance will be individualized dependent upon the identified issue(s) and could include 1 to 1 consultation between LEA and IDOE/OSE and/or the Indiana Resource Network personnel (telephone, email, on site)and topic specific training provided to LEA staff by IDOE/OSE and/or contracted vendors.
As technical assistance and professional development occur in Indiana, the IDOE/OSE follows the principles of adult learning and includes evidence based practices. The effectiveness of the implementation is measuredthrough the data collected for the specific indicators or evidence that practice has changed.
File Name Uploaded By Uploaded Date
No APR attachments found.
Professional Development System:
The mechanisms the State has in place to ensure that service providers have the skills to effectively provide services that improve results for students with disabilities.
The Early Childhood Center
For purposes of this introduction ‘professional development’ is defined as the provision of training and technical activities leading to theacquisition of skills and knowledge to improve the performance of students with disabilities. Depending upon the subject matter andthe intensity of the need, IDOE/OSE offers various levels of technical assistance and/or professional development.
IDOE/OSE provides assistance to LEAs either directly (telephone/email and on-site) or indirectly (on-line resources, and/or throughvendors that have been contracted for the purpose of technical assistance and/or professional development (Indiana ResourceNetwork) (http://www.doe.in.gov/specialed/indiana-resource-network).
These entities are described below and can be directly accessed by the LEAs in the state:
Indiana IEP Resource Center Focus: To increase Indiana educators' knowledge and skills that will (a) support the use of Indiana IEPto develop legally compliant IEPs that follow Article 7 requirements, (b) provide technical assistance and professional development forIndiana educators and staff who are involved in the development of high quality IEPs and (c) support Local Educational Agencies(LEAs) in the development and use of procedures to ensure compliance and the fidelity of implementation of IEP goals and servicesthat will result in high quality instruction and programming evident by data review and progress monitoring
Indiana Center on Teacher Quality (ICTQ) In partnership with schools, families, agencies and communities, the Indiana Center onTeacher Quality (ICTQ) seeks to improve educational outcomes for students by ensuring their access to a pre-k through 12 continuumof instruction from high quality teachers. ICTQ intends to 1) increase the number of high quality teachers serving students withdisabilities by providing job embedded professional development at the state, regional and district levels; 2) increase the number ofstudents with disabilities who have access to a high quality teacher by improving recruitment, support and retention of all teacherswho teach students with disabilities across the LRE continuum (general education and special education); and 3) to improve schooltransitions and post-school outcomes for students with disabilities through partnerships and collaborations among schools, communityagencies, higher education and families in a pre-K-12 system of support by aligning the policies and practices of key educationalstakeholders across the lifespan serving individuals with disabilities.
Project Success Focus: Support of teachers and administrators in the design and implementation of Indiana Academic Standards incurriculum and instruction for students with significant cognitive disabilities. This includes providing critical background information andaccess to instructional and resource materials developed by NCSC that have been tailored to Indiana’s standards. Project SUCCESSprovides monthly professional development sessions to participating teams and on-site technical assistance as needed.
IN*SOURCE Focus: Since 1975, the Indiana Resource Center for Families with Special Needs or IN*SOURCE has provided service toIndiana’s families of infants, toddlers, children, youth and young adults with disabilities. IN*SOURCE is a parent organization. Throughthe work and dedication of the Board of Directors, the staff and many volunteers, virtually all of whom are parents of persons withdisabilities, IN*SOURCE, utilizing a proven parent to parent model, has provided assistance, support services and educational resourcesto the community of individuals and organizations that serve and support persons with disabilities. Through the provision of information,training, individual assistance and support, they worked to help countless families confront the complexities and challenges of having aloved one with special needs. IN*SOURCE celebrates the accomplishments of individuals with disabilities and their families and affirms
FFY 2016 Part B State Performance Plan (SPP)/Annual Performance Report (APR)
5/15/2018 Page 7 of 65

their ongoing commitment to them.
Pass Project: Promoting Achievement for Students with Sensory Loss Focus: To provide professional developmentopportunities for educators that will improve instructional quality, promote academic achievement and foster successful post-secondarytransition outcomes for students with sensory loss.
Indiana Deafblind Services Project Focus: The Indiana Deafblind Services Project is designed to improve the quality of educationalservices available to Indiana's infants, toddlers, children and youth who have a combined vision and hearing loss.
PATINS Project Focus: The PATINS Project is a state-wide technical assistance network that provides accessible technology forassisting LEAs in the utilization and creation of accessible learning environments and instructional materials. The PATINS Projectprovides a complete state NIMAS delivery process, inclusive of assistive and accessible technologies, designed to support the IndianaDepartment of Education and LEAs in addressing the statutory and final regulatory requirements of the Individuals with DisabilitiesEducation Act of 2004.
Indiana Center for Accessible Instructional Materials (ICAM) Focus: The Indiana Center for Accessible Instructional Materials(ICAM) is a PATINS Project managed web-based system designed to provide supports to Indiana LEAs in meeting the NIMASregulations of the Individuals with Disabilities Improvement Act of 2004. The mission is to partner with LEAs in securing accessibletextbooks and core curriculum materials in specialized formats for qualifying students with print disabilities. Access to the system,technical support and professional training are provided through the ICAM and PATINS projects without a fee.
Indiana Secondary Transition Resource Center Focus: To create and enhance professional development activities and resources inorder to build capacity that will improve school and post-school outcomes. The center's work focuses on student-focused planningactivities and self-determination skill development; improved Transition IEPs and use of transition assessments; access to effectiveacademic and life-skills instruction, quality work-based learning; interagency collaboration; and, family involvement.
The Indiana Disproportionality Resource Center (IDRC) Focus: To assist the Indiana Department of Education in defining andidentifying disproportionality in special education, and provides technical assistance to Local Education Agencies (LEAs) in order toincrease equity in special education throughout the state.
There are other resources in the state that can be accessed by the LEA, however IDOE/OSE does not have a direct contractrelationship. They include:
Indiana School Mental Health InitiativeVision: To ensure all of Indiana’s students, including those with disabilities, are socially, emotionally, and mentally healthy so they areready to learn and can achieve their full potential. Mission: To build local capacity by providing resources and training with the goal ofsupporting schools and their community partners as they work together to address the social, emotional, behavioral, and mental healthneeds of Indiana’s students. Values and Beliefs: the function of an education is to address the development of the whole child;attachment is the carrier of all development, including learning; meeting the social, emotional, and mental health needs of teachersand other school staff is as important as meeting those of the student’s; and our schools and communities are stronger when we worktogether. Goals: raise awareness on the effects of trauma, stress, and adversity on social, emotional, and cognitive development;promote the development of multi-tiered, cross-system infrastructures to support school communities in addressing the social,emotional, behavioral, and mental health needs of their students and staff within existing structures; share best and promisingpractices across Indiana by building a community of practice and harnessing our collective knowledge; identify barriers that exist andwork to close gaps in systems; assist school districts in building strong community partnerships and connecting to their local System ofCare; and identify funding mechanisms and cross-system collaboration opportunities to promote the above.
PBIS Indiana: Positive Behavior Interventions & Supports Resource CenterFocus: To develop and establish a statewide network of culturally responsive school-wide positive behavior support sites and increaseeducators' knowledge and understanding of how PBIS impacts student achievement, family engagement, dropout rate and leastrestrictive environment placements
HANDS (Helping Answer Needs by Developing Specialists) in Autism Resource Center Focus: To help school personnelincrease knowledge, skill and application of research-based educational and behavioral strategies rooted in Applied Behavior Analysis andrelated to working with students with Autism Spectrum Disorder (ASD) and other neurodevelopmental disabilities. These interventionswill foster collaboration, data-driven decision making, and alternatives for discipline that will lead to improved instruction and limitedbehavioral challenges in the classroom as well as other school and community settings. A wide range of resources, materials, trainingsand consultations are available to assist consumers in learning about and practically applying best practice strategies across disciplines,roles and settings with students of all ages and functioning levels. Services and resources are available for a range of free, low cost andfee-for-service or contractual basis.
Center on Education and Lifelong Learning (CELL) Focus: The Center on Education and Lifelong Learning (CELL) provides tools,training and technical assistance as schools increase student achievement, build staff capacity and align resources. Their work focuseson professional development related to teacher evaluation systems, differentiated instruction, classroom management, co-teaching,instructional consultation teams (ICT), cultural responsive practices, and PBIS. In addition, CELL conducts program evaluations for avariety of district, state and national programs.
Center for Deaf and Hard of Hearing Education (CDHHE)
Focus: To promote positive outcomes for all deaf and hard of hearing children through information, services, and education. TheCDHHE provides direct services and facilitation of services to children birth through school exit. The Indiana State Department ofHealth has executive oversight of the CDHHE. The CDHHE (The Center) works directly with school districts, professionals,
FFY 2016 Part B State Performance Plan (SPP)/Annual Performance Report (APR)
5/15/2018 Page 8 of 65

Attachments
Attachments
parents/guardians and with State agencies, including the Department of Education, the Indiana School for the Deaf, the Family andSocial Services Administration, and the Indiana State Department of Health. Services provided for school-age children include transitionsupport from Part C to special education services, comprehensive multidisciplinary assessments, hearing assessments and technicalassistance to schools, Teacher of Record services, secondary transition support, and school program consultation and assessments.
The Indiana Resource Center for Autism
Focus: The Indiana Resource Center for Autism (IRCA) staff are actively engaged in work that leads to improved outcomes forindividuals on the autism spectrum and related disorders, and their families by providing professionals, family members, and individualswith ASD with the knowledge and skills to support children and adults in typical early intervention, school, community, work,postsecondary and home settings.
The work of IRCA covers a wide range of activities focused on building local capacity via information development and dissemination,customized trainings, statewide conferences, individual consultations, coaching, and research.
Through social media (Facebook, Twitter, Pinterest), numerous list serves, website and free newsletter, IRCA provides access to awealth of free and practical tools that can be easily replicated and used across a variety of settings. As Indiana’s state legislated autismcenter, IRCA is committed to responding with accurate and timely information that addresses the needs of individuals across theautism spectrum and across the lifespan.
Virtuoso Education ConsultingFocus: To empower educators to meet the needs of all students by developing practitioners’ awareness, knowledge, and skills relatedto best practices in the PK-12 environment. The team helps educators meet school improvement goals, remediate disproportionality,close discipline and achievement gaps, and develop proficiency in culturally responsive practices.
The Early Childhood Center (ECC) provides training, technical assistance, data analyses, and strategic planning to support schools inimproving the quality and impact of their preschool programs. Its work has focused on program evaluation and professionaldevelopment related to inclusive services, universal design, collaborative service approaches, transition, family engagement, and highquality early education practices for all children. ECC has worked with early education programs serving children with and withoutdisabilities throughout Indiana. It also works closely with Indiana’s First Steps system in providing evaluation and continuous qualityimprovement services.
File Name Uploaded By Uploaded Date
No APR attachments found.
Stakeholder Involvement: apply this to all Part B results indicators
The mechanism for soliciting broad stakeholder input on targets in the SPP, including revisions to targets.
In the course of the development of the State Performance Plan (SPP) input was obtained from parent groups, LEAs, other stateagencies, and institutions of higher education. As targets for specific indicators were revised through FFY 2012 (SY 12-13) the IndianaDepartment of Education, Office of Special Education (OSE) obtained stakeholder input from the State Advisory Council on the Educationof Children with Disabilities (SAC). Additionally, there is a specific stakeholder group that has been developed to address and includestakeholder input and engagement with regard to Indicator 17, the State Systemic Improvement Plan. The members of this stakeholdergroup are a diverse group of members from various internal and external departments, and organizations that are able to providesupport to the development and implementation of the SSIP.
In preparation for the FFY 2013 through FFY 2018 SPP, the OSE prepared trend data information for each of the indicators and developedrecommended targets based upon that data. The stakeholders reviewed the trend data, discussed the information and as the result ofthat discussion identified the targets for each of the indicators. The stakeholders represent various constituency groups, includingindividuals with disabilities, parents of children with disabilities as well as teachers, state and local education officials, programadministrators, representatives of various state agencies, representatives of higher education institutions that prepare special educationand related service personnel, representatives of nonpublic schools, and representatives of vocational, community, or businessorganizations concerned with the provision of transitional services to children with disabilities.
File Name Uploaded By Uploaded Date
No APR attachments found.
Reporting to the Public:
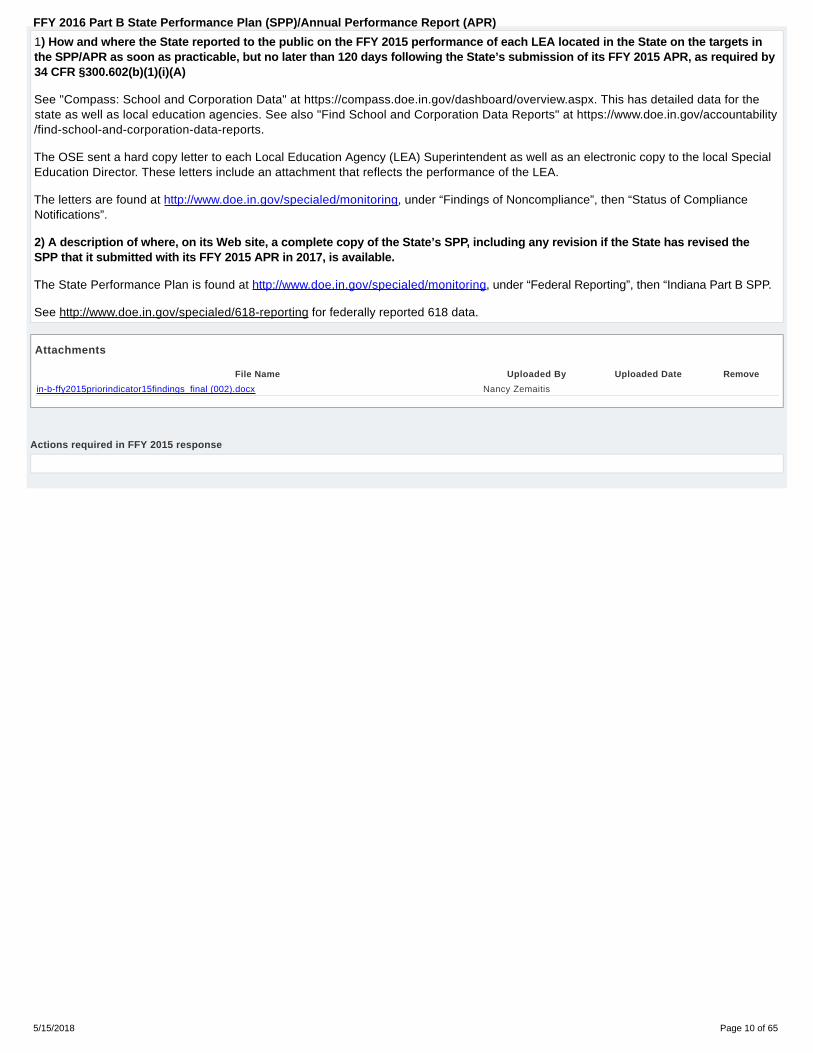
How and where the State reported to the public on the FFY 2015 performance of each LEA located in the State on the targets in the SPP/APR as soon as practicable, but no laterthan 120 days following the State’s submission of its FFY 2015 APR, as required by 34 CFR §300.602(b)(1)(i)(A); and a description of where, on its Web site, a complete copy ofthe State’s SPP, including any revision if the State has revised the SPP that it submitted with its FFY 2015 APR in 2017, is available.
FFY 2016 Part B State Performance Plan (SPP)/Annual Performance Report (APR)
5/15/2018 Page 9 of 65
Attachments
1) How and where the State reported to the public on the FFY 2015 performance of each LEA located in the State on the targets inthe SPP/APR as soon as practicable, but no later than 120 days following the State’s submission of its FFY 2015 APR, as required by34 CFR §300.602(b)(1)(i)(A)
See "Compass: School and Corporation Data" at https://compass.doe.in.gov/dashboard/overview.aspx. This has detailed data for thestate as well as local education agencies. See also "Find School and Corporation Data Reports" at https://www.doe.in.gov/accountability/find-school-and-corporation-data-reports.
The OSE sent a hard copy letter to each Local Education Agency (LEA) Superintendent as well as an electronic copy to the local SpecialEducation Director. These letters include an attachment that reflects the performance of the LEA.
The letters are found at http://www.doe.in.gov/specialed/monitoring, under “Findings of Noncompliance”, then “Status of ComplianceNotifications”.
2) A description of where, on its Web site, a complete copy of the State’s SPP, including any revision if the State has revised theSPP that it submitted with its FFY 2015 APR in 2017, is available.
The State Performance Plan is found at http://www.doe.in.gov/specialed/monitoring, under “Federal Reporting”, then “Indiana Part B SPP.
See http://www.doe.in.gov/specialed/618-reporting for federally reported 618 data.
File Name Uploaded By Uploaded Date Remove
in-b-ffy2015priorindicator15findings_final (002).docx Nancy Zemaitis
Actions required in FFY 2015 response
FFY 2016 Part B State Performance Plan (SPP)/Annual Performance Report (APR)
5/15/2018 Page 10 of 65

Indicator 1: Graduation
Baseline Data: 2012
Monitoring Priority: FAPE in the LRE
Results indicator:Percent of youth with Individualized Education Programs (IEPs) graduating from high school with a regular high school diploma.
(20 U.S.C. 1416 (a)(3)(A))
Historical Data
FFY 2004 2005 2006 2007 2008 2009 2010 2011 2012 2013 2014
Target ≥ 74.00% 87.10% 75.00% 56.71% 59.95% 59.95% 95.00% 64.00% 67.00%
Data 69.46% 52.60% 53.20% 58.95% 58.95% 69.72% 65.31% 71.72% 69.29% 73.41%
FFY 2015
Target ≥ 70.00%
Data 70.87%
Key: Gray – Data Prior to Baseline Yellow – Baseline Blue – Data Update
FFY 2016 - FFY 2018 Targets
FFY 2016 2017 2018
Target ≥ 72.00% 74.00% 76.00%
Key:
Targets: Description of Stakeholder Input
The Indiana Department of Education, Office of Special Education has analyzed the data from past Annual Performance Reports todetermine appropriate, achievable, yet rigorous targets for 2013-2018.
The Indiana Department of Education, Office of Special Education included stakeholder input from the State Advisory Council on theEducation of Children with Disabilities (SAC), as well as other constituents, to set the targets submitted for 2013-2018.
Prepopulated Data
Source Date Description Data Overwrite Data
SY 2015-16 Cohorts for RegulatoryAdjusted-Cohort Graduation Rate
(EDFacts file spec C151; Data group696)
10/12/2017 Number of youth with IEPs graduating with a regular diploma 6,483
SY 2015-16 Cohorts for RegulatoryAdjusted-Cohort Graduation Rate
(EDFacts file spec C151; Data group696)
10/12/2017 Number of youth with IEPs eligible to graduate 9,000 null
SY 2015-16 Regulatory Adjusted CohortGraduation Rate (EDFacts file spec
C150; Data group 695)10/12/2017 2014-15 Regulatory four-year adjusted-cohort graduation rate table 72.03% Calculate
FFY 2016 SPP/APR Data
Number of youth with IEPs in the current year'sadjusted cohort graduating with a regular diploma
Number of youth with IEPs in the currentyear's adjusted cohort eligible to graduate
FFY 2015 Data FFY 2016 Target FFY 2016 Data
6,483 9,000 70.87% 72.00% 72.03%
Graduation Conditions
Choose the length of Adjusted Cohort Graduation Rate your state is using: 4-year ACGR
Provide a narrative that describes the conditions youth must meet in order to graduate with a regular high school diploma and, if different, the conditions thatyouth with IEPs must meet in order to graduate with a regular high school diploma. If there is a difference, explain.
Please see the attached document for the Diploma requirements.
FFY 2016 Part B State Performance Plan (SPP)/Annual Performance Report (APR)
5/15/2018 Page 11 of 65

Or, visit http://www.doe.in.gov/ccr/indianas-diploma-requirements for the requirements.
Are the conditions that youth with IEPs must meet to graduate with a regular high school diploma different from the conditions noted above? No
Actions required in FFY 2015 response
none
FFY 2016 Part B State Performance Plan (SPP)/Annual Performance Report (APR)
5/15/2018 Page 12 of 65

Indicator 2: Drop Out
Baseline Data: 2011
Monitoring Priority: FAPE in the LRE
Results indicator:Percent of youth with IEPs dropping out of high school.
(20 U.S.C. 1416 (a)(3)(A))
Historical Data
FFY 2004 2005 2006 2007 2008 2009 2010 2011 2012 2013 2014
Target ≤ 26.00% 25.00% 24.00% 23.00% 22.00% 21.00% 20.00% 9.01% 8.51%
Data 30.54% 32.63% 30.01% 26.99% 15.93% 10.76% 10.76% 8.54% 8.51% 6.94%
FFY 2015
Target ≤ 8.01%
Data 7.60%
Key: Gray – Data Prior to Baseline Yellow – Baseline Blue – Data Update
FFY 2016 - FFY 2018 Targets
FFY 2016 2017 2018
Target ≤ 7.51% 7.01% 6.51%
Key:
Targets: Description of Stakeholder Input
The Indiana Department of Education, Office of Special Education has analyzed the data from past Annual Performance Reports todetermine appropriate, achievable, yet rigorous targets for 2013-2018.
The Indiana Department of Education, Office of Special Education included stakeholder input from the State Advisory Council on theEducation of Children with Disabilities (SAC), as well as other constituents, to set the targets submitted for 2013-2018.
Please indicate whether you are reporting using Option 1 or Option 2.
Option 1
Option 2
Prepopulated Data
Source Date Description Data Overwrite Data
SY 2015-16 Exiting Data Groups(EDFacts file spec C009; Data Group 85)
6/1/2017Number of youth with IEPs (ages 14-21) who exited special education by graduating with a regularhigh school diploma (a)
5,904 null
SY 2015-16 Exiting Data Groups(EDFacts file spec C009; Data Group 85)
6/1/2017 Number of youth with IEPs (ages 14-21) who exited special education by receiving a certificate (b) 927 null
SY 2015-16 Exiting Data Groups(EDFacts file spec C009; Data Group 85)
6/1/2017Number of youth with IEPs (ages 14-21) who exited special education by reaching maximum age(c)
31 null
SY 2015-16 Exiting Data Groups(EDFacts file spec C009; Data Group 85)
6/1/2017 Number of youth with IEPs (ages 14-21) who exited special education due to dropping out (d) 431 null
SY 2015-16 Exiting Data Groups(EDFacts file spec C009; Data Group 85)
6/1/2017 Number of youth with IEPs (ages 14-21) who exited special education as a result of death (e ) 17 null
FFY 2016 SPP/APR Data
Number of youth with IEPs (ages 14-21) who exitedspecial education due to dropping out [d]
Total number of all youth with IEPs who left highschool (ages 14-21) [a + b + c + d + e]
FFY 2015 Data* FFY 2016 Target* FFY 2016 Data
431 7,310 7.60% 7.51% 5.90%
FFY 2016 Part B State Performance Plan (SPP)/Annual Performance Report (APR)
5/15/2018 Page 13 of 65
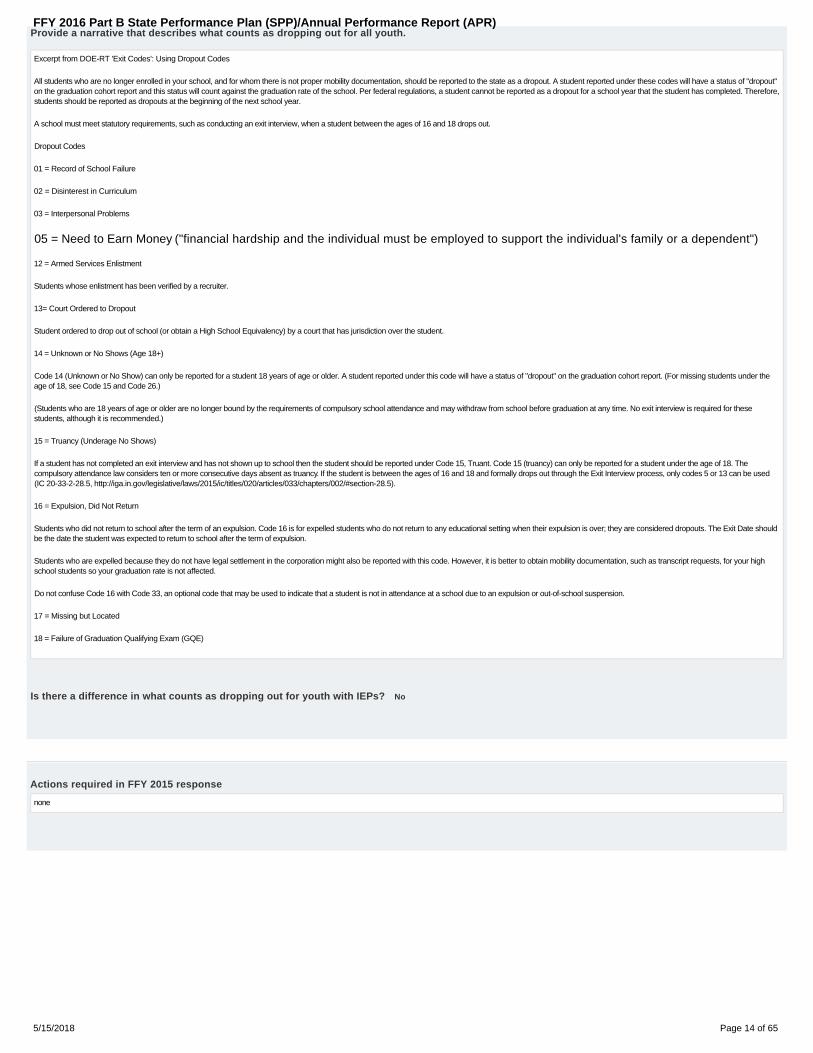
Provide a narrative that describes what counts as dropping out for all youth.
Excerpt from DOE-RT 'Exit Codes': Using Dropout Codes
All students who are no longer enrolled in your school, and for whom there is not proper mobility documentation, should be reported to the state as a dropout. A student reported under these codes will have a status of "dropout"on the graduation cohort report and this status will count against the graduation rate of the school. Per federal regulations, a student cannot be reported as a dropout for a school year that the student has completed. Therefore,students should be reported as dropouts at the beginning of the next school year.
A school must meet statutory requirements, such as conducting an exit interview, when a student between the ages of 16 and 18 drops out.
Dropout Codes
01 = Record of School Failure
02 = Disinterest in Curriculum
03 = Interpersonal Problems
05 = Need to Earn Money ("financial hardship and the individual must be employed to support the individual's family or a dependent")
12 = Armed Services Enlistment
Students whose enlistment has been verified by a recruiter.
13= Court Ordered to Dropout
Student ordered to drop out of school (or obtain a High School Equivalency) by a court that has jurisdiction over the student.
14 = Unknown or No Shows (Age 18+)
Code 14 (Unknown or No Show) can only be reported for a student 18 years of age or older. A student reported under this code will have a status of "dropout" on the graduation cohort report. (For missing students under theage of 18, see Code 15 and Code 26.)
(Students who are 18 years of age or older are no longer bound by the requirements of compulsory school attendance and may withdraw from school before graduation at any time. No exit interview is required for thesestudents, although it is recommended.)
15 = Truancy (Underage No Shows)
If a student has not completed an exit interview and has not shown up to school then the student should be reported under Code 15, Truant. Code 15 (truancy) can only be reported for a student under the age of 18. Thecompulsory attendance law considers ten or more consecutive days absent as truancy. If the student is between the ages of 16 and 18 and formally drops out through the Exit Interview process, only codes 5 or 13 can be used(IC 20-33-2-28.5, http://iga.in.gov/legislative/laws/2015/ic/titles/020/articles/033/chapters/002/#section-28.5).
16 = Expulsion, Did Not Return
Students who did not return to school after the term of an expulsion. Code 16 is for expelled students who do not return to any educational setting when their expulsion is over; they are considered dropouts. The Exit Date shouldbe the date the student was expected to return to school after the term of expulsion.
Students who are expelled because they do not have legal settlement in the corporation might also be reported with this code. However, it is better to obtain mobility documentation, such as transcript requests, for your highschool students so your graduation rate is not affected.
Do not confuse Code 16 with Code 33, an optional code that may be used to indicate that a student is not in attendance at a school due to an expulsion or out-of-school suspension.
17 = Missing but Located
18 = Failure of Graduation Qualifying Exam (GQE)
Is there a difference in what counts as dropping out for youth with IEPs? No
Actions required in FFY 2015 response
none
FFY 2016 Part B State Performance Plan (SPP)/Annual Performance Report (APR)
5/15/2018 Page 14 of 65
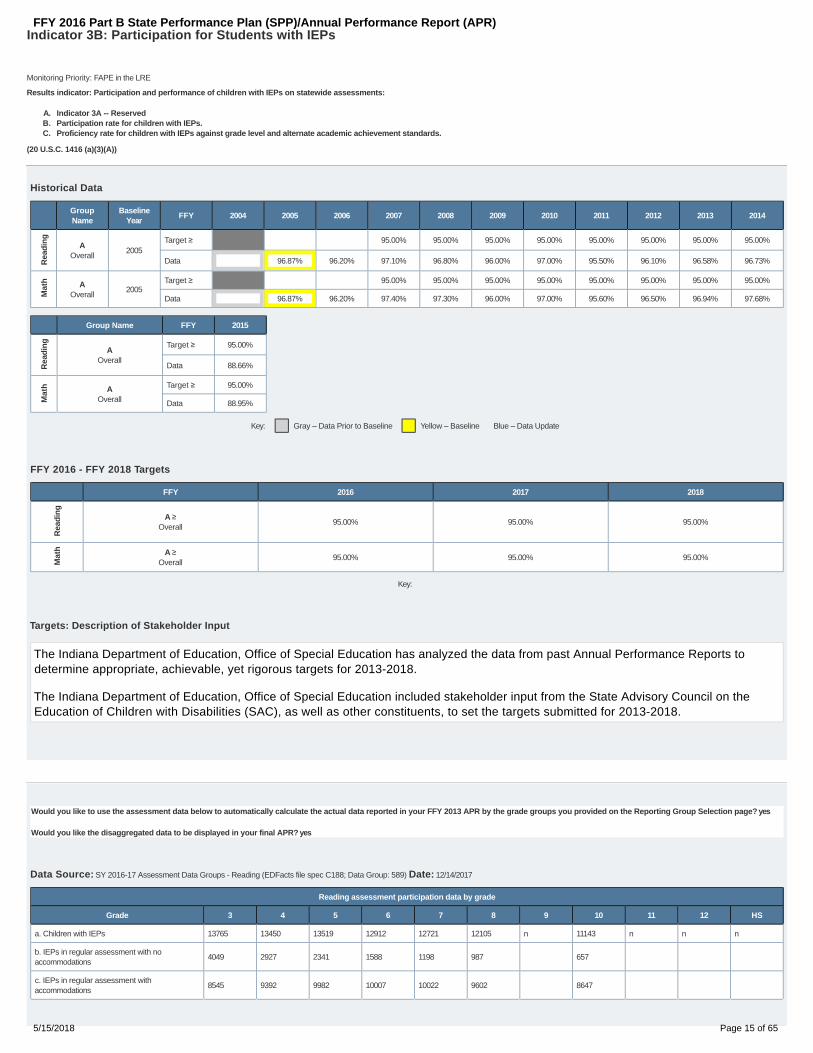
Indicator 3B: Participation for Students with IEPs
Monitoring Priority: FAPE in the LRE
Results indicator: Participation and performance of children with IEPs on statewide assessments:
Indicator 3A -- ReservedA.Participation rate for children with IEPs.B.Proficiency rate for children with IEPs against grade level and alternate academic achievement standards.C.
(20 U.S.C. 1416 (a)(3)(A))
Historical Data
GroupName
BaselineYear
FFY 2004 2005 2006 2007 2008 2009 2010 2011 2012 2013 2014
AOverall
2005Target ≥ 95.00% 95.00% 95.00% 95.00% 95.00% 95.00% 95.00% 95.00%
Data 96.87% 96.20% 97.10% 96.80% 96.00% 97.00% 95.50% 96.10% 96.58% 96.73%
AOverall
2005Target ≥ 95.00% 95.00% 95.00% 95.00% 95.00% 95.00% 95.00% 95.00%
Data 96.87% 96.20% 97.40% 97.30% 96.00% 97.00% 95.60% 96.50% 96.94% 97.68%
Group Name FFY 2015
AOverall
Target ≥ 95.00%
Data 88.66%
AOverall
Target ≥ 95.00%
Data 88.95%
Key: Gray – Data Prior to Baseline Yellow – Baseline Blue – Data Update
FFY 2016 - FFY 2018 Targets
FFY 2016 2017 2018
A ≥Overall
95.00% 95.00% 95.00%
A ≥Overall
95.00% 95.00% 95.00%
Key:
Targets: Description of Stakeholder Input
The Indiana Department of Education, Office of Special Education has analyzed the data from past Annual Performance Reports todetermine appropriate, achievable, yet rigorous targets for 2013-2018.
The Indiana Department of Education, Office of Special Education included stakeholder input from the State Advisory Council on theEducation of Children with Disabilities (SAC), as well as other constituents, to set the targets submitted for 2013-2018.
Would you like to use the assessment data below to automatically calculate the actual data reported in your FFY 2013 APR by the grade groups you provided on the Reporting Group Selection page? yes
Would you like the disaggregated data to be displayed in your final APR? yes
Data Source: SY 2016-17 Assessment Data Groups - Reading (EDFacts file spec C188; Data Group: 589) Date: 12/14/2017
Reading assessment participation data by grade
Grade 3 4 5 6 7 8 9 10 11 12 HS
a. Children with IEPs 13765 13450 13519 12912 12721 12105 n 11143 n n n
b. IEPs in regular assessment with noaccommodations
4049 2927 2341 1588 1198 987 657
c. IEPs in regular assessment withaccommodations
8545 9392 9982 10007 10022 9602 8647
Rea
din
gM
ath
Rea
din
gM
ath
Rea
din
gM
ath
FFY 2016 Part B State Performance Plan (SPP)/Annual Performance Report (APR)
5/15/2018 Page 15 of 65

Reading assessment participation data by grade
Grade 3 4 5 6 7 8 9 10 11 12 HS
d. IEPs in alternate assessment againstgrade-level standards
e. IEPs in alternate assessment against modifiedstandards
f. IEPs in alternate assessment against alternatestandards
730 823 898 956 1053 1078
Data Source: SY 2016-17 Assessment Data Groups - Math (EDFacts file spec C185; Data Group: 588) Date: 12/14/2017
Math assessment participation data by grade
Grade 3 4 5 6 7 8 9 10 11 12 HS
a. Children with IEPs 13781 13466 13530 12916 12729 12116 n 11157 n n n
b. IEPs in regular assessment with noaccommodations
4146 2922 2319 1578 1158 929 608
c. IEPs in regular assessment withaccommodations
8659 9477 10083 10081 10143 9721 8784
d. IEPs in alternate assessment againstgrade-level standards
e. IEPs in alternate assessment against modifiedstandards
f. IEPs in alternate assessment against alternatestandards
729 821 900 953 1047 1076
FFY 2016 SPP/APR Data: Reading Assessment
Group NameNumber of Children with
IEPsNumber of Children with IEPs
ParticipatingFFY 2015 Data* FFY 2016 Target* FFY 2016 Data
AOverall
89,615 85,482 88.66% 95.00% 95.39%
FFY 2016 SPP/APR Data: Math Assessment
Group NameNumber of Children with
IEPsNumber of Children with IEPs
ParticipatingFFY 2015 Data* FFY 2016 Target* FFY 2016 Data
AOverall
89,695 86,134 88.95% 95.00% 96.03%
Public Reporting Information
Provide links to the page(s) where you provide public reports of assessment results.
Specific LEA/Building Level assessment results are located on the DOE website (https://www.doe.in.gov/idoe/idoe-data), "Compass: School and Corporation Data". Once on the DOE Compass page:1) input the name of the corporation or school into the search box (for example, Indianapolis Public Schools)2) When the IPS page appears, hover over 'Student Performance' then click on the assessment tool (for example, ISTEP+)3) When this page appears, choose the year, the subject and the grade to be reviewed (for example, 2016-17, both English/language arts, all grades)4) Click on the pie chart of 'Pass/Did not Pass' 5) A new page with bar graphs of specific populations will appear. Scroll down to 'Results by Special Education'6) Hovering over the special education/general education; pass/did not pass bars will provide specific numbers and percentages.
The DOE has created a place on the Office of Special Education homepage for Public reportinghttps://www.doe.in.gov/specialed/monitoring
Indiana has added an excel workbook to this website, see "Federal Reporting", that includes the performance of each LEA against specific Indicator Targets. Information about this indicator is located on the 'Assessment Results (Grads 3-8, 10) worksheet.
Actions required in FFY 2015 response
Within 90 days of the receipt of the State’s 2017 determination letter, the State must provide to OSEP a Web link that demonstrates that it has reported to the public, for FFY 2015, on the statewide assessments of children withdisabilities in accordance with 34 CFR §300.160(f). In addition, OSEP reminds the State that in the FFY 2016 SPP/APR, the State must include a Web link that demonstrates compliance with 34 CFR §300.160(f) for FFY 2016.
FFY 2016 Part B State Performance Plan (SPP)/Annual Performance Report (APR)
5/15/2018 Page 16 of 65

Responses to actions required in FFY 2015 OSEP response
The DOE has created a place on the Office of Special Education homepage for Public reportinghttp://www.doe.in.gov/specialedhttp://www.doe.in.gov/specialed/618-reportingInformation located in the Reading and Math Assessment Tabs of the workbook
FFY 2016 Part B State Performance Plan (SPP)/Annual Performance Report (APR)
5/15/2018 Page 17 of 65

Indicator 3C: Proficiency for Students with IEPs
Monitoring Priority: FAPE in the LRE
Results indicator: Participation and performance of children with IEPs on statewide assessments:
Indicator 3A -- ReservedA.Participation rate for children with IEPs.B.Proficiency rate for children with IEPs against grade level and alternate academic achievement standards.C.
(20 U.S.C. 1416 (a)(3)(A))
Historical Data
GroupName
BaselineYear
FFY 2004 2005 2006 2007 2008 2009 2010 2011 2012 2013 2014
AOverall
2005Target ≥ 34.00% 34.00% 35.00% 36.00% 37.00% 38.00% 39.00% 48.00% 54.00%
Data 33.31% 33.60% 39.88% 54.02% 43.00% 50.00% 52.70% 52.80% 55.12% 32.33%
AOverall
2005Target ≥ 39.00% 40.00% 41.00% 42.00% 43.00% 44.00% 45.00% 57.00% 61.00%
Data 42.13% 42.50% 48.50% 64.11% 51.00% 57.00% 62.10% 60.20% 63.37% 35.41%
Group Name FFY 2015
AOverall
Target ≥ 60.00%
Data 25.72%
AOverall
Target ≥ 65.00%
Data 25.69%
Key: Gray – Data Prior to Baseline Yellow – Baseline Blue – Data Update
FFY 2016 - FFY 2018 Targets
FFY 2016 2017 2018
A ≥Overall
62.00% 64.00% 66.00%
A ≥Overall
67.00% 69.00% 71.00%
Key:
Targets: Description of Stakeholder Input
The Indiana Department of Education, Office of Special Education has analyzed the data from past Annual Performance Reports todetermine appropriate, achievable, yet rigorous targets for 2013-2018.
The Indiana Department of Education, Office of Special Education included stakeholder input from the State Advisory Council on theEducation of Children with Disabilities (SAC), as well as other constituents, to set the targets submitted for 2013-2018.
FFY 2016 SPP/APR Data: Reading Assessment
Group NameChildren with IEPs who
received a valid score anda proficiency was assigned
Number of Children with IEPs Proficient FFY 2015 Data* FFY 2016 Target* FFY 2016 Data
AOverall
85,482 23,573 25.72% 62.00% 27.58%
FFY 2016 SPP/APR Data: Math Assessment
Group NameChildren with IEPs who
received a valid score anda proficiency was assigned
Number of Children with IEPs Proficient FFY 2015 Data* FFY 2016 Target* FFY 2016 Data
AOverall
86,134 21,846 25.69% 67.00% 25.36%
Rea
din
gM
ath
Rea
din
gM
ath
Rea
din
gM
ath
FFY 2016 Part B State Performance Plan (SPP)/Annual Performance Report (APR)
5/15/2018 Page 18 of 65

Public Reporting Information
Provide links to the page(s) where you provide public reports of assessment results.
Specific LEA/Building Level assessment results are located on the DOE website (https://www.doe.in.gov/idoe/idoe-data), "Compass: School and Corporation Data". Once on the DOE Compass page:1) input the name of the corporation or school into the search box (for example, Indianapolis Public Schools)2) When the IPS page appears, hover over 'Student Performance' then click on the assessment tool (for example, ISTEP+)3) When this page appears, choose the year, the subject and the grade to be reviewed (for example, 2016-17, both English/language arts, all grades)4) Click on the pie chart of 'Pass/Did not Pass' 5) A new page with bar graphs of specific populations will appear. Scroll down to 'Results by Special Education'6) Hovering over the special education/general education; pass/did not pass bars will provide specific numbers and percentages.
The DOE has created a place on the Office of Special Education homepage for Public reportinghttps://www.doe.in.gov/specialed/monitoring
Indiana has added an excel workbook to this website, see "Federal Reporting", that includes the performance of each LEA against specific Indicator Targets. Information about this indicator is located on the 'Assessment Results (Grads 3-8, 10) worksheet.
Actions required in FFY 2015 response
Within 90 days of the receipt of the State’s 2017 determination letter, the State must provide to OSEP a Web link that demonstrates that it has reported to the public, for FFY 2015, on the statewide assessments of children withdisabilities in accordance with 34 CFR §300.160(f). In addition, OSEP reminds the State that in the FFY 2016 SPP/APR, the State must include a Web link that demonstrates compliance with 34 CFR §300.160(f) for FFY 2016.
Responses to actions required in FFY 2015 OSEP response
http://www.doe.in.gov/specialed/618-reporting
Assessment website (https://www.doe.in.gov/assessment) where Assessment Program Manual (https://www.doe.in.gov/sites/default/files/assessment/2017-18-program-manual-final-11817-ch-1-13.pdf) is posted.Accommodation information is in Appendix E.
School administrators should be aware that section 1111(b)(2)(A) of the Elementary and Secondary Education Act (also known as the Every Student Succeeds Act, or ESSA) requires the implementation of high quality studentacademic assessments in math, reading or language arts, and science. Section 1111(b) (2) (B) (i) (II) requires these assessments be administered to all elementary and secondary school students. In addition, section 1111(c)(4) (E) requires participation rates in statewide assessments of at least 95 percent for all groups of students for purposes of accountability. Students’ failure to take Indiana's assessments may result in a lower A-Faccountability grade.
FFY 2016 Part B State Performance Plan (SPP)/Annual Performance Report (APR)
5/15/2018 Page 19 of 65
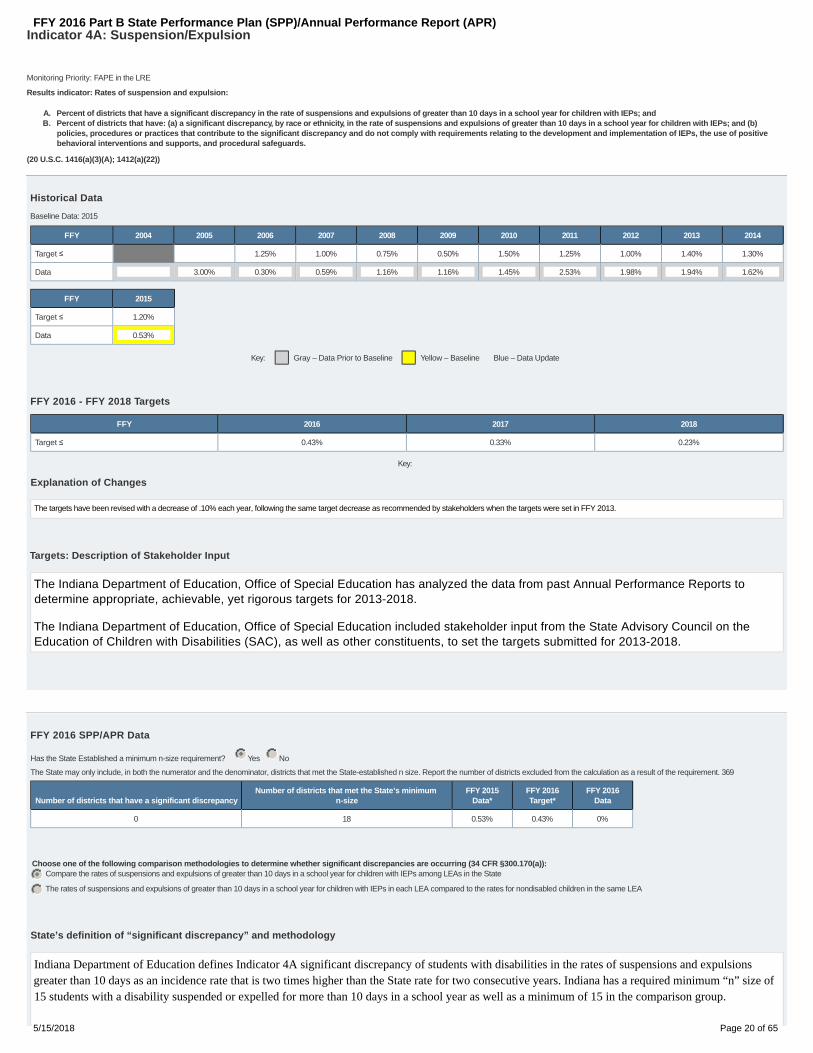
Indicator 4A: Suspension/Expulsion
Baseline Data: 2015
Monitoring Priority: FAPE in the LRE
Results indicator: Rates of suspension and expulsion:
Percent of districts that have a significant discrepancy in the rate of suspensions and expulsions of greater than 10 days in a school year for children with IEPs; andA.Percent of districts that have: (a) a significant discrepancy, by race or ethnicity, in the rate of suspensions and expulsions of greater than 10 days in a school year for children with IEPs; and (b)policies, procedures or practices that contribute to the significant discrepancy and do not comply with requirements relating to the development and implementation of IEPs, the use of positivebehavioral interventions and supports, and procedural safeguards.
B.
(20 U.S.C. 1416(a)(3)(A); 1412(a)(22))
Historical Data
FFY 2004 2005 2006 2007 2008 2009 2010 2011 2012 2013 2014
Target ≤ 1.25% 1.00% 0.75% 0.50% 1.50% 1.25% 1.00% 1.40% 1.30%
Data 3.00% 0.30% 0.59% 1.16% 1.16% 1.45% 2.53% 1.98% 1.94% 1.62%
FFY 2015
Target ≤ 1.20%
Data 0.53%
Key: Gray – Data Prior to Baseline Yellow – Baseline Blue – Data Update
FFY 2016 - FFY 2018 Targets
FFY 2016 2017 2018
Target ≤ 0.43% 0.33% 0.23%
Key:
Explanation of Changes
The targets have been revised with a decrease of .10% each year, following the same target decrease as recommended by stakeholders when the targets were set in FFY 2013.
Targets: Description of Stakeholder Input
The Indiana Department of Education, Office of Special Education has analyzed the data from past Annual Performance Reports todetermine appropriate, achievable, yet rigorous targets for 2013-2018.
The Indiana Department of Education, Office of Special Education included stakeholder input from the State Advisory Council on theEducation of Children with Disabilities (SAC), as well as other constituents, to set the targets submitted for 2013-2018.
FFY 2016 SPP/APR Data
Has the State Established a minimum n-size requirement? Yes No
The State may only include, in both the numerator and the denominator, districts that met the State-established n size. Report the number of districts excluded from the calculation as a result of the requirement. 369
Number of districts that have a significant discrepancyNumber of districts that met the State’s minimum
n-sizeFFY 2015
Data*FFY 2016Target*
FFY 2016Data
0 18 0.53% 0.43% 0%
Choose one of the following comparison methodologies to determine whether significant discrepancies are occurring (34 CFR §300.170(a)):Compare the rates of suspensions and expulsions of greater than 10 days in a school year for children with IEPs among LEAs in the State
The rates of suspensions and expulsions of greater than 10 days in a school year for children with IEPs in each LEA compared to the rates for nondisabled children in the same LEA
State’s definition of “significant discrepancy” and methodology
Indiana Department of Education defines Indicator 4A significant discrepancy of students with disabilities in the rates of suspensions and expulsionsgreater than 10 days as an incidence rate that is two times higher than the State rate for two consecutive years. Indiana has a required minimum “n” size of15 students with a disability suspended or expelled for more than 10 days in a school year as well as a minimum of 15 in the comparison group.
FFY 2016 Part B State Performance Plan (SPP)/Annual Performance Report (APR)
5/15/2018 Page 20 of 65

FFY 2015 Identification of Noncompliance
The State DID NOT identify noncompliance with Part B requirements as a result of the review required by 34 CFR §300.170(b)
The State DID identify noncompliance with Part B requirements as a result of the review required by 34 CFR §300.170(b). If YES, select one of the following:
Indiana notified the LEAs that the annual data analysis reflected possible noncompliance (over the Indiana defined risk ratio threshold) with this indicatorand required each LEA to participate in a policy, procedure and practice file review. This review was consistent with the requirements under 34 CFR §300.170(b) relating to the development and implementation of IEPs, the use of positive behavioral interventions and supports, and procedural safeguards.If the LEA exceeded the threshold, then the LEA policies and procedures are reviewed and a minimum of 5 files (to determine practice)reviewed on students who were evaluated and identified as students with disabilities. If policies, procedures and/or practices were determined to beinappropriate, findings would be issued.
Indicator 4A
Compliant LEAs 17
Non-compliant LEAs 0
LEAs that did not meet n size 344
LEAs that did not have 2 years of data 25
LEAs with continued noncompliance 1
Total 387
Actions required in FFY 2015 response
none
Note: Any actions required in last year's response table that are related to correction of findings should be responded to on the "Correction of Previous Findingsof Noncompliance" page of this indicator. If your State's only actions required in last year's response are related to findings of noncompliance, a text field willnot be displayed on this page.
Review of Policies, Procedures, and Practices (completed in FFY 2016 using 2015-2016 data)Provide a description of the review of policies, procedures, and practices relating to the development and implementation of IEPs, the use of positive behavioral interventions and supports, and procedural safeguards.
Indiana notified the LEAs that the annual data analysis reflected possible noncompliance (over the Indiana defined risk ratio threshold) with this indicator. Each LEA was required to participate in a policy and procedure review.Additionally, a minimum of 5 files per LEA (to determine practice) were reviewed on students who were evaluated and identified as students with disabilities. If policies, procedures and/or practices (including the use of positivebehavioral interventions and supports and procedural safeguards) were determined to be inappropriate, findings would be issued. There were no findings of noncompliance issued during this reporting year for this indicator.
Correction of Findings of Noncompliance Identified in FFY 2015
Findings of Noncompliance IdentifiedFindings of Noncompliance Verified as
Corrected Within One YearFindings of Noncompliance Subsequently
CorrectedFindings Not Yet Verified as Corrected
0 0 0 0
Explanation of Alternate Data
Not Applicable
FFY 2014 Findings of Noncompliance Verified as Corrected
Describe how the State verified that the source of noncompliance is correctly implementing the regulatory requirements
One LEA did not correct within a year. In addition to working with an IDOE specialist to complete a root cause analysis, develop a corrective action plan and participate in progress monitoring calls, this LEA worked with one ofour Indiana Resource Network resource centers and received assistance to review and to revise, as appropropriate, policies, procedures, and practices relating to the development and implementation of IEPs, including theuse of positive behavioral interventions and supports, and procedural safeguards. Prong 2 of the requirements in the OSEP Memo 09-02 were addressed.
This LEA has subsequently corrected the noncompliance.
Describe how the State verified that each individual case of noncompliance was corrected
Addressing Prong 1 of the requirements in the OSEP Memo 09-02 included verification of the LEA correction (when possible to correct)of student level noncompliance. Included was the review of evidence of student-level correction and a review of policies, procedures, andpractices, resulting in revisions as appropriate. Technical assistance and training was provided virtually and/or on-site by the TheIndiana Disproportionality Resource Center and /or Virtuoso Education Consulting for LEA administration, teachers and other special
FFY 2016 Part B State Performance Plan (SPP)/Annual Performance Report (APR)
5/15/2018 Page 21 of 65

education staff. If a student was no longer within the jurisdiction of the LEA, individual correction was not made.
FFY 2013 Findings Not Yet Verified as Corrected
Actions taken if noncompliance not corrected
One LEA had continued noncompliance for this indicator and is in longstanding noncompliance. This LEA received more intensive technical assistance and the Part B grant has been placed on special conditions for multipleyears. In addition to working with an IDOE specialist, this LEA worked with one of the Indiana Resource Network resource centers in order to review policies, procedures, and practices relating to the development andimplementation of IEPs, the use of positive behavioral interventions and supports, and procedural safeguards. Please see introduction (Improvement/Correction/Incentives/Sanctions and the attachment 'in-b-ffy2015 priorindicator findings') for detailed information on the LEA that has not corrected.
FFY 2016 Part B State Performance Plan (SPP)/Annual Performance Report (APR)
5/15/2018 Page 22 of 65

Indicator 4B: Suspension/Expulsion
Baseline Data: 2015
Monitoring Priority: FAPE in the LRE
Compliance indicator: Rates of suspension and expulsion:
Percent of districts that have a significant discrepancy in the rate of suspensions and expulsions of greater than 10 days in a school year for children with IEPs; andA.Percent of districts that have: (a) a significant discrepancy, by race or ethnicity, in the rate of suspensions and expulsions of greater than 10 days in a school year for children with IEPs; and (b)policies, procedures or practices that contribute to the significant discrepancy and do not comply with requirements relating to the development and implementation of IEPs, the use of positivebehavioral interventions and supports, and procedural safeguards.
B.
(20 U.S.C. 1416(a)(3)(A); 1412(a)(22))
Historical Data
FFY 2004 2005 2006 2007 2008 2009 2010 2011 2012 2013 2014
Target 0% 0% 0% 0% 0% 0% 0% 0% 0%
Data 1.50% 2.31% 2.00% 1.70% 2.50% 0.27%
FFY 2015
Target 0%
Data 0.53%
Key: Gray – Data Prior to Baseline Yellow – Baseline
FFY 2016 - FFY 2018 Targets
FFY 2016 2017 2018
Target 0% 0% 0%
FFY 2016 SPP/APR Data
Has the State Established a minimum n-size requirement? Yes No
The State may only include, in both the numerator and the denominator, districts that met the State-established n size. Report the number of districts excluded from the calculation as a result of the requirement. 375
Number of districts that have asignificant discrepancy, by race or
ethnicity
Number of those districts that havepolicies, procedures, or practicesthat contribute to the significant
discrepancy and do not comply withrequirements
Number of districts that met theState’s minimum n-size
FFY 2015Data*
FFY 2016Target*
FFY 2016Data
3 0 12 0.53% 0% 0%
All races and ethnicities were included in the review
State’s definition of “significant discrepancy” and methodology
Indiana's definition identifies Significant Discrepancy of racial and ethnic groups (American Indian or Alaska Native, Asian, NativeHawaiian or other Pacific Islander, Hispanic/Latino, Black or African American, White, and Multiracial) as a risk ratio for a givenracial/ethnic group that is greater than 2.0 for two consecutive years. Indiana has a required minimum “n” size of 15 students with adisability in any of the racial/ethnic groups suspended or expelled for more than 10 days in a school year as well as a minimum of 15 inthe comparison group.
Indiana notified the LEAs that the annual data analysis reflected possible noncompliance (over the Indiana defined risk ratio threshold)with this indicator and required each LEA to participate in a policy, procedure and practice file review. This review was consistent with the requirements under 34 CFR §300.170(b) relating to the development and implementation of IEPs, the use of positive behavioral interventions and supports, and procedural safeguards. If the LEA exceeded the threshold, then the LEA policies and procedures arereviewed and a minimum of 5 files (to determine practice) reviewed on students who were evaluated and identified as students withdisabilities. If policies, procedures and/or practices were determined to be inappropriate, findings were issued.
Indicator 4B
Compliant LEAs 11
Non-compliant LEAs 0
FFY 2016 Part B State Performance Plan (SPP)/Annual Performance Report (APR)
5/15/2018 Page 23 of 65

FFY 2015 Identification of Noncompliance
The State DID NOT identify noncompliance with Part B requirements as a result of the review required by 34 CFR §300.170(b)
The State DID identify noncompliance with Part B requirements as a result of the review required by 34 CFR §300.170(b). If YES, select one of the following:
LEAs that did not meet n size 350
LEAs that did not have 2 years of data 25
LEAs with continued noncompliance 1
Total 387
Actions required in FFY 2015 response
none
Note: Any actions required in last year's response table that are related to correction of findings should be responded to on the "Correction of Previous Findingsof Noncompliance" page of this indicator. If your State's only actions required in last year's response are related to findings of noncompliance, a text field willnot be displayed on this page.
Review of Policies, Procedures, and Practices (completed in FFY 2016 using 2015-2016 data)Provide a description of the review of policies, procedures, and practices relating to the development and implementation of IEPs, the use of positive behavioral interventions and supports, and procedural safeguards.
Indiana notified the LEAs that the annual data analysis reflected possible noncompliance (over the Indiana defined risk ratio threshold) with this indicator. Each LEA was required to participate in a policy and procedure review.Additionally, a minimum of 5 files per LEA (to determine practice) were reviewed on students who were evaluated and identified as students with disabilities. If policies, procedures and/or practices (including the use of positivebehavioral interventions and supports and procedural safeguards) were determined to be inappropriate, findings would be issued. There were no findings of noncompliance issued during this reporting year for this indicator.
Correction of Findings of Noncompliance Identified in FFY 2015
Findings of Noncompliance IdentifiedFindings of Noncompliance Verified as
Corrected Within One YearFindings of Noncompliance Subsequently
CorrectedFindings Not Yet Verified as Corrected
0 0 0 0
Please explain why no findings of noncompliance were identified when you reported a failure to be in compliance in your last APR.
Indiana misunderstood how to report prior years' noncompliance. It was included each year in the current data but should not have. This year all years of data have been corrected.
Explanation of Alternate Data
Indiana misunderstood how to report prior years' noncompliance. It was included each year in the current data but should not have. This year all years of data have been corrected.
FFY 2014 Findings Not Yet Verified as Corrected
Actions taken if noncompliance not corrected
One LEA had continued noncompliance for this indicator and is in longstanding noncompliance. This LEA received more intensive technical assistance and the Part B grant has been placed on special conditions for multipleyears. In addition to working with an IDOE specialist, this LEA worked with one of the Indiana Resource Network resource centers in order to review policies, procedures, and practices relating to the development andimplementation of IEPs, the use of positive behavioral interventions and supports, and procedural safeguards. Please see introduction (Improvement/Correction/Incentives/Sanctions and the attachment 'in-b-ffy2015 priorindicator findings') for detailed information on the LEA that has not corrected.
FFY 2016 Part B State Performance Plan (SPP)/Annual Performance Report (APR)
5/15/2018 Page 24 of 65

Indicator 5: Education Environments (children 6-21)
Monitoring Priority: FAPE in the LRE
Results indicator: Percent of children with IEPs aged 6 through 21 served:
Inside the regular class 80% or more of the day;A.Inside the regular class less than 40% of the day; andB.In separate schools, residential facilities, or homebound/hospital placements.C.
(20 U.S.C. 1416(a)(3)(A))
Historical Data
Baseline
YearFFY 2004 2005 2006 2007 2008 2009 2010 2011 2012 2013 2014
A 2008Target ≥ 60.37% 60.38% 60.39% 60.40% 60.41% 60.42% 60.43% 67.00% 68.00%
Data 59.54% 63.19% 62.81% 63.77% 64.89% 67.86% 69.28% 68.81% 70.01% 70.55%
B 2008Target ≤ 15.30% 15.29% 15.28% 15.27% 15.26% 15.25% 15.24% 12.00% 11.50%
Data 14.33% 13.14% 13.06% 12.94% 12.51% 12.60% 12.03% 10.90% 10.65% 10.55%
C 2008Target ≤ 1.22% 1.21% 1.20% 1.19% 1.18% 1.17% 1.16% 2.16% 2.15%
Data 1.99% 2.20% 2.50% 2.42% 2.46% 2.25% 2.26% 2.19% 2.08% 2.06%
FFY 2015
ATarget ≥ 69.00%
Data 71.40%
BTarget ≤ 11.00%
Data 10.42%
CTarget ≤ 2.14%
Data 2.02%
Key: Gray – Data Prior to Baseline Yellow – Baseline Blue – Data Update
FFY 2016 - FFY 2018 Targets
FFY 2016 2017 2018
Target A ≥ 70.00% 71.00% 72.00%
Target B ≤ 10.50% 10.00% 9.50%
Target C ≤ 2.13% 2.12% 2.11%
Key:
Targets: Description of Stakeholder Input
The Indiana Department of Education, Office of Special Education has analyzed the data from past Annual Performance Reports todetermine appropriate, achievable, yet rigorous targets for 2013-2018.
The Indiana Department of Education, Office of Special Education included stakeholder input from the State Advisory Council on theEducation of Children with Disabilities (SAC), as well as other constituents, to set the targets submitted for 2013-2018.
Prepopulated Data
Source Date Description Data Overwrite Data
SY 2016-17 Child Count/EducationalEnvironment Data Groups (EDFacts file
spec C002; Data group 74)7/13/2017 Total number of children with IEPs aged 6 through 21 155,185 null
SY 2016-17 Child Count/EducationalEnvironment Data Groups (EDFacts file
spec C002; Data group 74)7/13/2017 A. Number of children with IEPs aged 6 through 21 inside the regular class 80% or more of the day 112,689 null
SY 2016-17 Child Count/EducationalEnvironment Data Groups (EDFacts file
spec C002; Data group 74)7/13/2017
B. Number of children with IEPs aged 6 through 21 inside the regular class less than 40% of theday
15,276 null
FFY 2016 Part B State Performance Plan (SPP)/Annual Performance Report (APR)
5/15/2018 Page 25 of 65
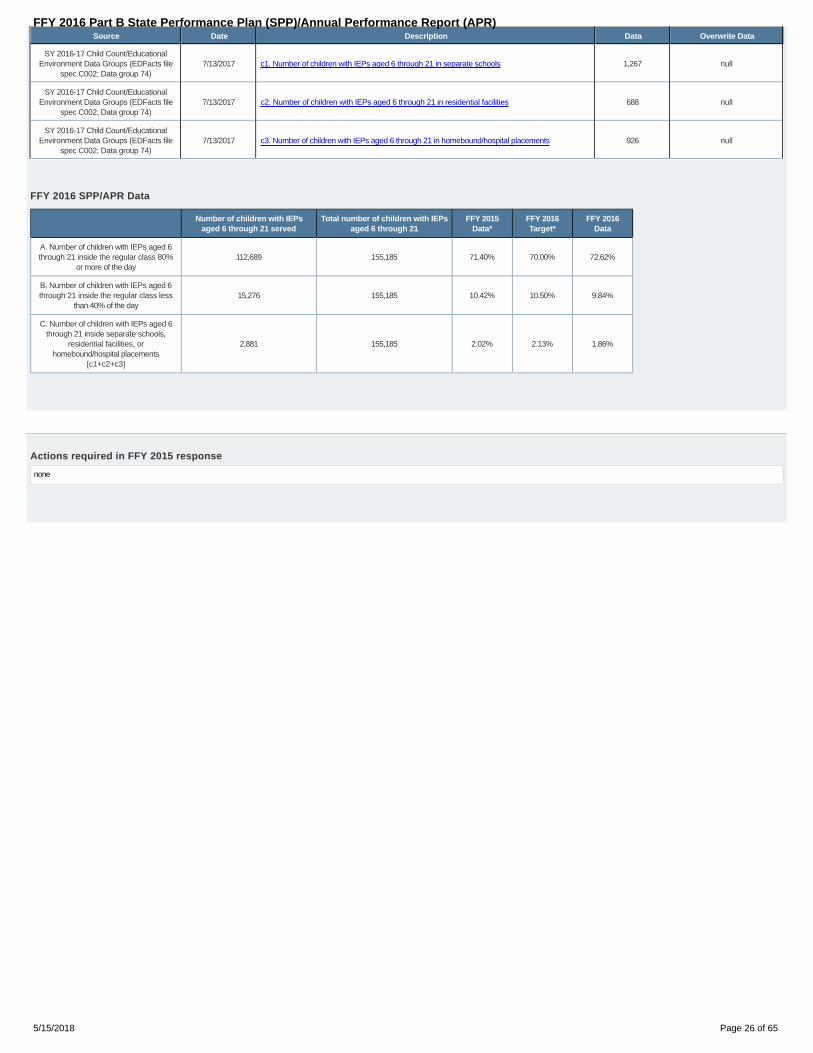
Source Date Description Data Overwrite Data
SY 2016-17 Child Count/EducationalEnvironment Data Groups (EDFacts file
spec C002; Data group 74)7/13/2017 c1. Number of children with IEPs aged 6 through 21 in separate schools 1,267 null
SY 2016-17 Child Count/EducationalEnvironment Data Groups (EDFacts file
spec C002; Data group 74)7/13/2017 c2. Number of children with IEPs aged 6 through 21 in residential facilities 688 null
SY 2016-17 Child Count/EducationalEnvironment Data Groups (EDFacts file
spec C002; Data group 74)7/13/2017 c3. Number of children with IEPs aged 6 through 21 in homebound/hospital placements 926 null
FFY 2016 SPP/APR Data
Number of children with IEPsaged 6 through 21 served
Total number of children with IEPsaged 6 through 21
FFY 2015Data*
FFY 2016Target*
FFY 2016Data
A. Number of children with IEPs aged 6through 21 inside the regular class 80%
or more of the day112,689 155,185 71.40% 70.00% 72.62%
B. Number of children with IEPs aged 6through 21 inside the regular class less
than 40% of the day15,276 155,185 10.42% 10.50% 9.84%
C. Number of children with IEPs aged 6through 21 inside separate schools,
residential facilities, orhomebound/hospital placements
[c1+c2+c3]
2,881 155,185 2.02% 2.13% 1.86%
Actions required in FFY 2015 response
none
FFY 2016 Part B State Performance Plan (SPP)/Annual Performance Report (APR)
5/15/2018 Page 26 of 65
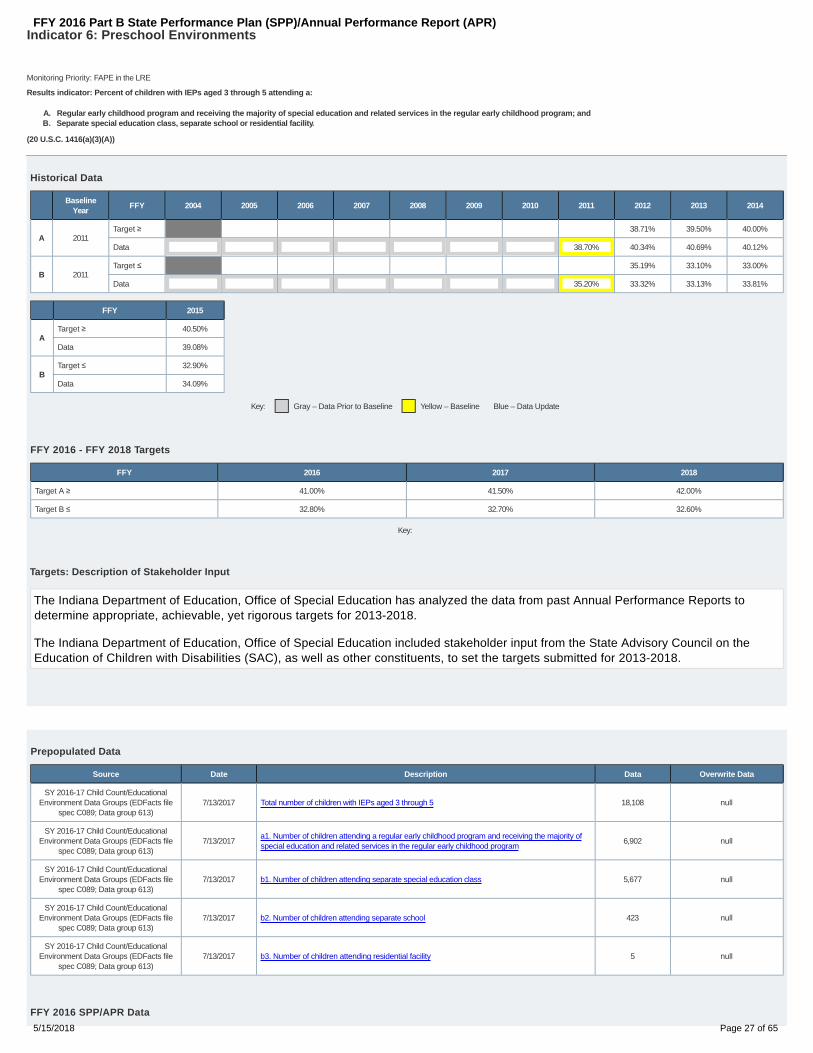
Indicator 6: Preschool Environments
Monitoring Priority: FAPE in the LRE
Results indicator: Percent of children with IEPs aged 3 through 5 attending a:
Regular early childhood program and receiving the majority of special education and related services in the regular early childhood program; andA.Separate special education class, separate school or residential facility.B.
(20 U.S.C. 1416(a)(3)(A))
Historical Data
Baseline
YearFFY 2004 2005 2006 2007 2008 2009 2010 2011 2012 2013 2014
A 2011Target ≥ 38.71% 39.50% 40.00%
Data 38.70% 40.34% 40.69% 40.12%
B 2011Target ≤ 35.19% 33.10% 33.00%
Data 35.20% 33.32% 33.13% 33.81%
FFY 2015
ATarget ≥ 40.50%
Data 39.08%
BTarget ≤ 32.90%
Data 34.09%
Key: Gray – Data Prior to Baseline Yellow – Baseline Blue – Data Update
FFY 2016 - FFY 2018 Targets
FFY 2016 2017 2018
Target A ≥ 41.00% 41.50% 42.00%
Target B ≤ 32.80% 32.70% 32.60%
Key:
Targets: Description of Stakeholder Input
The Indiana Department of Education, Office of Special Education has analyzed the data from past Annual Performance Reports todetermine appropriate, achievable, yet rigorous targets for 2013-2018.
The Indiana Department of Education, Office of Special Education included stakeholder input from the State Advisory Council on theEducation of Children with Disabilities (SAC), as well as other constituents, to set the targets submitted for 2013-2018.
Prepopulated Data
Source Date Description Data Overwrite Data
SY 2016-17 Child Count/EducationalEnvironment Data Groups (EDFacts file
spec C089; Data group 613)7/13/2017 Total number of children with IEPs aged 3 through 5 18,108 null
SY 2016-17 Child Count/EducationalEnvironment Data Groups (EDFacts file
spec C089; Data group 613)7/13/2017
a1. Number of children attending a regular early childhood program and receiving the majority ofspecial education and related services in the regular early childhood program
6,902 null
SY 2016-17 Child Count/EducationalEnvironment Data Groups (EDFacts file
spec C089; Data group 613)7/13/2017 b1. Number of children attending separate special education class 5,677 null
SY 2016-17 Child Count/EducationalEnvironment Data Groups (EDFacts file
spec C089; Data group 613)7/13/2017 b2. Number of children attending separate school 423 null
SY 2016-17 Child Count/EducationalEnvironment Data Groups (EDFacts file
spec C089; Data group 613)7/13/2017 b3. Number of children attending residential facility 5 null
FFY 2016 SPP/APR Data
FFY 2016 Part B State Performance Plan (SPP)/Annual Performance Report (APR)
5/15/2018 Page 27 of 65

Number of children with IEPsaged 3 through 5 attending
Total number of children with IEPsaged 3 through 5
FFY 2015Data*
FFY 2016Target*
FFY 2016Data
A. A regular early childhood program andreceiving the majority of special educationand related services in the regular early
childhood program
6,902 18,108 39.08% 41.00% 38.12%
B. Separate special education class,separate school or residential facility
6,105 18,108 34.09% 32.80% 33.71%
Use a different calculation methodology
Actions required in FFY 2015 response
none
FFY 2016 Part B State Performance Plan (SPP)/Annual Performance Report (APR)
5/15/2018 Page 28 of 65

Indicator 7: Preschool Outcomes
Monitoring Priority: FAPE in the LRE
Results indicator: Percent of preschool children aged 3 through 5 with IEPs who demonstrate improved:
Positive social-emotional skills (including social relationships);A.Acquisition and use of knowledge and skills (including early language/ communication and early literacy); andB.Use of appropriate behaviors to meet their needs.C.
(20 U.S.C. 1416 (a)(3)(A))
Historical Data
Baseline
YearFFY 2004 2005 2006 2007 2008 2009 2010 2011 2012 2013 2014
A1 2010Target ≥ 52.50% 53.00% 53.50% 54.00% 72.00% 73.00%
Data 52.00% 66.10% 64.20% 78.30% 73.70% 72.27% 69.83%
A2 2010Target ≥ 41.00% 41.50% 42.00% 42.50% 22.00% 23.00%
Data 40.70% 36.10% 20.40% 20.10% 25.80% 19.83% 18.21%
B1 2010Target ≥ 65.50% 66.00% 66.50% 67.00% 80.50% 81.00%
Data 65.10% 65.00% 72.60% 77.70% 81.30% 78.10% 77.55%
B2 2010Target ≥ 48.00% 48.50% 49.00% 49.50% 15.00% 15.50%
Data 47.80% 32.40% 15.40% 13.30% 16.00% 10.27% 9.83%
C1 2010Target ≥ 77.00% 77.50% 78.00% 78.50% 83.00% 83.50%
Data 76.70% 63.10% 74.50% 80.00% 83.20% 81.22% 80.28%
C2 2010Target ≥ 64.50% 65.00% 65.50% 66.00% 16.50% 17.00%
Data 64.40% 31.50% 16.90% 13.90% 17.40% 11.45% 11.26%
FFY 2015
A1Target ≥ 74.00%
Data 73.00%
A2Target ≥ 24.00%
Data 20.09%
B1Target ≥ 81.50%
Data 79.77%
B2Target ≥ 16.00%
Data 10.69%
C1Target ≥ 84.00%
Data 82.59%
C2Target ≥ 17.50%
Data 12.18%
Key: Gray – Data Prior to Baseline Yellow – Baseline Blue – Data Update
FFY 2016 - FFY 2018 Targets
FFY 2016 2017 2018
Target A1 ≥ 75.00% 76.00% 77.00%
Target A2 ≥ 25.00% 26.00% 27.00%
Target B1 ≥ 82.00% 82.50% 83.00%
Target B2 ≥ 16.50% 17.00% 17.50%
Target C1 ≥ 84.50% 85.00% 85.50%
Target C2 ≥ 18.00% 18.50% 19.00%
Key:
Targets: Description of Stakeholder Input
The Indiana Department of Education, Office of Special Education has analyzed the data from past Annual Performance Reports todetermine appropriate, achievable, yet rigorous targets for 2013-2018.
FFY 2016 Part B State Performance Plan (SPP)/Annual Performance Report (APR)
5/15/2018 Page 29 of 65
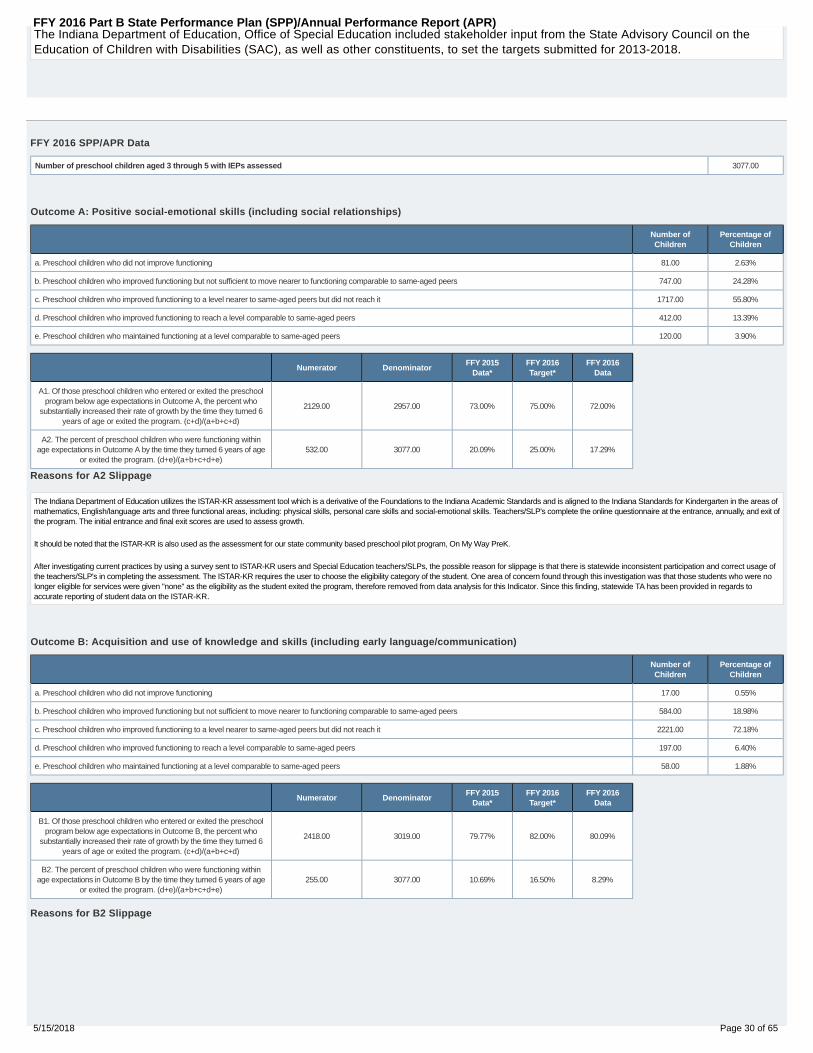
The Indiana Department of Education, Office of Special Education included stakeholder input from the State Advisory Council on theEducation of Children with Disabilities (SAC), as well as other constituents, to set the targets submitted for 2013-2018.
FFY 2016 SPP/APR Data
Number of preschool children aged 3 through 5 with IEPs assessed 3077.00
Outcome A: Positive social-emotional skills (including social relationships)
Number ofChildren
Percentage ofChildren
a. Preschool children who did not improve functioning 81.00 2.63%
b. Preschool children who improved functioning but not sufficient to move nearer to functioning comparable to same-aged peers 747.00 24.28%
c. Preschool children who improved functioning to a level nearer to same-aged peers but did not reach it 1717.00 55.80%
d. Preschool children who improved functioning to reach a level comparable to same-aged peers 412.00 13.39%
e. Preschool children who maintained functioning at a level comparable to same-aged peers 120.00 3.90%
Numerator DenominatorFFY 2015
Data*FFY 2016Target*
FFY 2016Data
A1. Of those preschool children who entered or exited the preschoolprogram below age expectations in Outcome A, the percent who
substantially increased their rate of growth by the time they turned 6years of age or exited the program. (c+d)/(a+b+c+d)
2129.00 2957.00 73.00% 75.00% 72.00%
A2. The percent of preschool children who were functioning withinage expectations in Outcome A by the time they turned 6 years of age
or exited the program. (d+e)/(a+b+c+d+e)532.00 3077.00 20.09% 25.00% 17.29%
Reasons for A2 Slippage
The Indiana Department of Education utilizes the ISTAR-KR assessment tool which is a derivative of the Foundations to the Indiana Academic Standards and is aligned to the Indiana Standards for Kindergarten in the areas ofmathematics, English/language arts and three functional areas, including: physical skills, personal care skills and social-emotional skills. Teachers/SLP's complete the online questionnaire at the entrance, annually, and exit ofthe program. The initial entrance and final exit scores are used to assess growth.
It should be noted that the ISTAR-KR is also used as the assessment for our state community based preschool pilot program, On My Way PreK.
After investigating current practices by using a survey sent to ISTAR-KR users and Special Education teachers/SLPs, the possible reason for slippage is that there is statewide inconsistent participation and correct usage ofthe teachers/SLP's in completing the assessment. The ISTAR-KR requires the user to choose the eligibility category of the student. One area of concern found through this investigation was that those students who were nolonger eligible for services were given "none" as the eligibility as the student exited the program, therefore removed from data analysis for this Indicator. Since this finding, statewide TA has been provided in regards toaccurate reporting of student data on the ISTAR-KR.
Outcome B: Acquisition and use of knowledge and skills (including early language/communication)
Number ofChildren
Percentage ofChildren
a. Preschool children who did not improve functioning 17.00 0.55%
b. Preschool children who improved functioning but not sufficient to move nearer to functioning comparable to same-aged peers 584.00 18.98%
c. Preschool children who improved functioning to a level nearer to same-aged peers but did not reach it 2221.00 72.18%
d. Preschool children who improved functioning to reach a level comparable to same-aged peers 197.00 6.40%
e. Preschool children who maintained functioning at a level comparable to same-aged peers 58.00 1.88%
Numerator DenominatorFFY 2015
Data*FFY 2016Target*
FFY 2016Data
B1. Of those preschool children who entered or exited the preschoolprogram below age expectations in Outcome B, the percent who
substantially increased their rate of growth by the time they turned 6years of age or exited the program. (c+d)/(a+b+c+d)
2418.00 3019.00 79.77% 82.00% 80.09%
B2. The percent of preschool children who were functioning withinage expectations in Outcome B by the time they turned 6 years of age
or exited the program. (d+e)/(a+b+c+d+e)255.00 3077.00 10.69% 16.50% 8.29%
Reasons for B2 Slippage
FFY 2016 Part B State Performance Plan (SPP)/Annual Performance Report (APR)
5/15/2018 Page 30 of 65

The Indiana Department of Education utilizes the ISTAR-KR assessment tool which is a derivative of the Foundations to the Indiana Academic Standards and is aligned to the Indiana Standards for Kindergarten in the areas ofmathematics, English/language arts and three functional areas, including: physical skills, personal care skills and social-emotional skills. Teachers/SLP's complete the online questionnaire at the entrance, annually, and exit ofthe program. The initial entrance and final exit scores are used to assess growth. It should be noted that the ISTART-KR is also used as the assessment for our state community based preschool pilot program, On My WayPreK.
After investigating current practices by using a survey sent to ISTAR-KR users and Special Education teachers/SLPs, the possible reason for slippage is that there is statewide inconsistent participation and correct usage ofthe teachers/SLP's in completing the assessment. The ISTAR-KR requires the user to choose the eligibility category of the student. One area of concern found through this investigation was that those students who were nolonger eligible for services were given "none" as the eligibility as the student exited the program, therefore removed from data analysis for this Indicator. Since this finding, statewide TA has been provided in regards toaccurate reporting of student data on the ISTAR-KR.
Outcome C: Use of appropriate behaviors to meet their needs
Number ofChildren
Percentage ofChildren
a. Preschool children who did not improve functioning 21.00 0.68%
b. Preschool children who improved functioning but not sufficient to move nearer to functioning comparable to same-aged peers 501.00 16.28%
c. Preschool children who improved functioning to a level nearer to same-aged peers but did not reach it 2252.00 73.19%
d. Preschool children who improved functioning to reach a level comparable to same-aged peers 236.00 7.67%
e. Preschool children who maintained functioning at a level comparable to same-aged peers 67.00 2.18%
Numerator DenominatorFFY 2015
Data*FFY 2016Target*
FFY 2016Data
C1. Of those preschool children who entered or exited the preschoolprogram below age expectations in Outcome C, the percent who
substantially increased their rate of growth by the time they turned 6years of age or exited the program. (c+d)/(a+b+c+d)
2488.00 3010.00 82.59% 84.50% 82.66%
C2. The percent of preschool children who were functioning withinage expectations in Outcome C by the time they turned 6 years of age
or exited the program. (d+e)/(a+b+c+d+e)303.00 3077.00 12.18% 18.00% 9.85%
Reasons for C2 Slippage
The Indiana Department of Education utilizes the ISTAR-KR assessment tool which is a derivative of the Foundations to the Indiana Academic Standards and is aligned to the Indiana Standards for Kindergarten in the areas ofmathematics, English/language arts and three functional areas, including: physical skills, personal care skills and social-emotional skills. Teachers/SLP's complete the online questionnaire at the entrance, annually, and exit ofthe program. The initial entrance and final exit scores are used to assess growth. It should be noted that the ISTAR-KR is also used as the assessment for our state community based preschool pilot program, On My WayPreK.
After investigating current practices by using a survey sent to ISTAR-KR users and Special Education teachers/SLPs, the possible reason for slippage is that there is statewide inconsistent participation and correct usage ofthe teachers/SLP's in completing the assessment. The ISTAR-KR requires the user to choose the eligibility category of the student. One area of concern found through this investigation was that those students who were nolonger eligible for services were given "none" as the eligibility as the student exited the program, therefore removed from data analysis for this Indicator. Since this finding, statewide TA has been provided in regards toaccurate reporting of student data on the ISTAR-KR.
Does the State include in the numerator and denominator only children who received special education and related services for at least six monthsduring the age span of three through five years? Yes
Was sampling used? No
Did you use the Early Childhood Outcomes Center (ECO) Child Outcomes Summary (COS) process? No
Provide the criteria for defining “comparable to same-aged peers.”
The Indiana Department of Education utilizes the ISTAR-KR assessment tool which is a derivative of the Foundations to the Indiana Academic Standards and is aligned to the Indiana Standards for Kindergarten in the areas ofmathematics, English/language arts and three functional areas, including: physical skills, personal care skills and social-emotional skills. Teachers/SLP's complete the online questionnaire at the entrance, annually, and exit ofthe program. The initial entrance and final exit scores are used to assess growth. Student outcome and KR Cut scores were developed per age range. Based on the student data, a score that is equal to or above theexpected score would be considered evidence of achievement at a level that is "comparable to same age peers".
List the instruments and procedures used to gather data for this indicator.
The Indiana Department of Education utilizes the ISTAR-KR assessment tool which is a derivative of the Foundations to the Indiana Academic Standards and is aligned to the Indiana Standards for Kindergarten in the areas ofmathematics, English/language arts and three functional areas, including: physical skills, personal care skills and social-emotional skills. Teachers/SLP's complete the online ISTAR-KR questionnaire at the Student'sentrance, annually, and exit of the program. The initial entrance and final exit scores are used to assess growth.
Actions required in FFY 2015 response
none
FFY 2016 Part B State Performance Plan (SPP)/Annual Performance Report (APR)
5/15/2018 Page 31 of 65
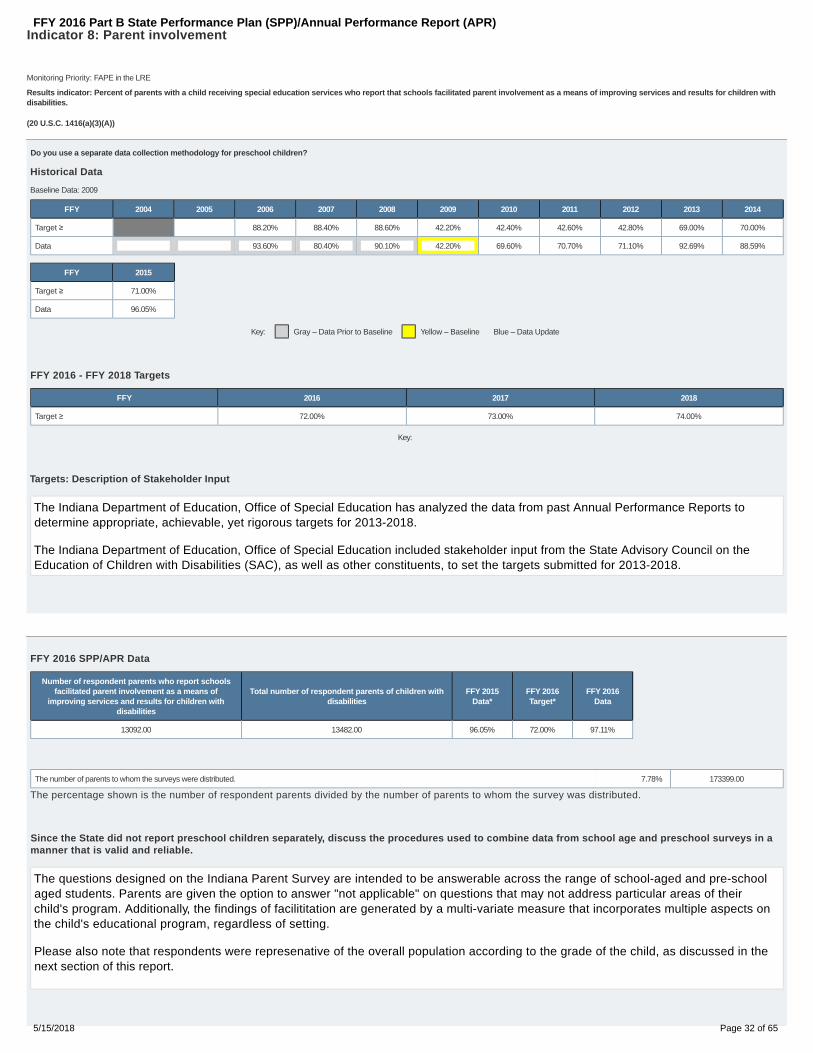
Indicator 8: Parent involvement
Baseline Data: 2009
Monitoring Priority: FAPE in the LRE
Results indicator: Percent of parents with a child receiving special education services who report that schools facilitated parent involvement as a means of improving services and results for children withdisabilities.
(20 U.S.C. 1416(a)(3)(A))
Do you use a separate data collection methodology for preschool children?
Historical Data
FFY 2004 2005 2006 2007 2008 2009 2010 2011 2012 2013 2014
Target ≥ 88.20% 88.40% 88.60% 42.20% 42.40% 42.60% 42.80% 69.00% 70.00%
Data 93.60% 80.40% 90.10% 42.20% 69.60% 70.70% 71.10% 92.69% 88.59%
FFY 2015
Target ≥ 71.00%
Data 96.05%
Key: Gray – Data Prior to Baseline Yellow – Baseline Blue – Data Update
FFY 2016 - FFY 2018 Targets
FFY 2016 2017 2018
Target ≥ 72.00% 73.00% 74.00%
Key:
Targets: Description of Stakeholder Input
The Indiana Department of Education, Office of Special Education has analyzed the data from past Annual Performance Reports todetermine appropriate, achievable, yet rigorous targets for 2013-2018.
The Indiana Department of Education, Office of Special Education included stakeholder input from the State Advisory Council on theEducation of Children with Disabilities (SAC), as well as other constituents, to set the targets submitted for 2013-2018.
FFY 2016 SPP/APR Data
Number of respondent parents who report schoolsfacilitated parent involvement as a means of
improving services and results for children withdisabilities
Total number of respondent parents of children withdisabilities
FFY 2015Data*
FFY 2016Target*
FFY 2016Data
13092.00 13482.00 96.05% 72.00% 97.11%
The number of parents to whom the surveys were distributed. 7.78% 173399.00
The percentage shown is the number of respondent parents divided by the number of parents to whom the survey was distributed.
Since the State did not report preschool children separately, discuss the procedures used to combine data from school age and preschool surveys in amanner that is valid and reliable.
The questions designed on the Indiana Parent Survey are intended to be answerable across the range of school-aged and pre-schoolaged students. Parents are given the option to answer "not applicable" on questions that may not address particular areas of theirchild's program. Additionally, the findings of facilititation are generated by a multi-variate measure that incorporates multiple aspects onthe child's educational program, regardless of setting.
Please also note that respondents were represenative of the overall population according to the grade of the child, as discussed in thenext section of this report.
FFY 2016 Part B State Performance Plan (SPP)/Annual Performance Report (APR)
5/15/2018 Page 32 of 65

Include the State’s analyses of the extent to which the demographics of the parents responding are representative of the demographics of childrenreceiving special education services.
Indiana has conducted analyses for representativness in disability categories, grade level, and ethnicity, using questions posed on the survey and the data collected for the child count on Dec. 1, 2016.
As regards the distribution of primary disabilities, parents were asked to identify their child's primary disability on the survey. Tests of representativeness are strongly indicative that the response rate was representative of theoverall population of students with disabilities. Deviations from expected values of survey response distribution by disability categories were well within tolerable differences for representativeness. Chi-squared tests on boththe collected disabilities and adjusted totals to account for low-incidence disabilities indicate a high degree of interdependence in the distribution of survey respondents and the underlying population for disability.
The frequency distribution by student disability category and the overall disability category distribution for students across the state are as follows:
Respondents PopulationMultiple Disabilities 2.46% 1.27%Orthopedic Impairment 0.83% 0.92%Blind or Low Vision 0.88% 0.57%Deaf or Hard of Hearing 1.20% 1.39%Emotional Disability 6.51% 7.37%Specific Learning Disability 29.03% 31.52%Developmental Delay 5.22% 2.51%Language or Speech Impairment 21.33% 23.56%Cognitive Disability 7.30% 8.29%Deaf-blind 0.05% 0.02%Autism Spectrum Disorder 11.48% 9.10%Traumatic Brain Injury 0.29% 0.28%Other Health Impairment 13.41% 13.20%Total N 13,479 173,399
Regarding ethnicity/race, parents respond to one of seven racial categories collected by the Indiana Department of Education, which is collected on the child count for students with disabilities. Statistical tests ofrepresentativeness suggest that the response rate for ethnicity was representative of the overall population of students with disabilities. Deviations from expected values of survey response distribution by disability categorieswere within tolerable differences for representativeness Chi-squared tests on both the collected ethnicity categories and adjusted totals to account for low-incidence ethnicity categories indicate a reasonable degree ofindependence in the distribution of survey respondents and the underlying population for ethnicity.
The frequency distributions for ethnicities of respondents and the underlying population of students with disabilities are as follows:
Respondents Population1 = American Indian/Alaskan Native 0.27% 0.25%2 = Black 6.81% 13.28%3 = Asian 0.84% 0.96%4 = Hispanic Ethnicity and of any race 5.68% 9.73%5 = White 81.41% 70.65%6 = Multiracial (two or more races) 4.85% 5.08%7 = Native Hawaiian or Other Pacific Islander 0.14% 0.05%Total N 13,479 173,399
Regarding age, parents were asked to indicate their child's grade level on the parent survey, which is also collected by the Indiana Department of Education on the child count. Tests of representativeness are stronglyindicative that the response rate was representative of the overall population of students with disabilities. Deviations from expected values of survey response distribution by grade level were well within tolerable differences forrepresentativeness. Chi-squared tests on both the collected grade level and adjusted totals to account for low-incidence grade levels indicate a high degree of independence in the distribution of survey respondents and theunderlying population for grade level.
Respondents PopulationPK 10.42% 7.50%KG 6.59% 5.61%1 7.01% 6.42%2 7.34% 6.90%3 8.18% 7.79%4 8.75% 8.05%5 8.27% 7.98%6 7.36% 7.71%7 6.94% 7.60%8 6.08% 7.24%9 5.53% 7.20%10 5.54% 6.99%11 5.99% 6.39%12+ 5.99% 6.60%Total N 13,479 173,399
Was sampling used? No
Was a survey used? Yes
Submitted survey: Indiana Parent Survey 2016-17
The demographics of the parents responding are representative of the demographics of children receiving special education services. Yes
Provide additional information about this indicator (optional)
Indicator 8 data is supplied by an analysis of the results of the Indiana Parenet Survey, attached to this indicator. Parents are asked a battery of questions about their role and experience in their child's IEP process. Theseresponses are aggregated and indexed to supply the results of this indicator.
School districts are asked to facilitate the survey process by providing the parent with a secure space to take the survey on the internet, or by providing isntructions to the parent to obtain the survey independently from theIndiana Department of Education. Accessibility provisions are addressed in this process.
FFY 2016 Part B State Performance Plan (SPP)/Annual Performance Report (APR)
5/15/2018 Page 33 of 65

Actions required in FFY 2015 response
none
FFY 2016 Part B State Performance Plan (SPP)/Annual Performance Report (APR)
5/15/2018 Page 34 of 65

Indicator 9: Disproportionate Representation
Baseline Data: 2015
Monitoring Priority: Disproportionate Representation
Compliance indicator: Percent of districts with disproportionate representation of racial and ethnic groups in special education and related services that is the result of inappropriate identification.
(20 U.S.C. 1416(a)(3)(C))
Historical Data
FFY 2004 2005 2006 2007 2008 2009 2010 2011 2012 2013 2014
Target 0% 0% 0% 0% 0% 0% 0% 0% 0%
Data 3.41% 0% 0.30% 0.29% 0% 0% 0% 0% 0% 0%
FFY 2015
Target 0%
Data 0%
Key: Gray – Data Prior to Baseline Yellow – Baseline
FFY 2016 - FFY 2018 Targets
FFY 2016 2017 2018
Target 0% 0% 0%
FFY 2016 SPP/APR Data
Has the State Established a minimum n-size requirement? Yes No
The State may only include, in both the numerator and the denominator, districts that met the State-established n and/or cell size. Report the number of districts totally excluded from the calculation as a result of the requirementbecause the district did not meet the minimum n and/or cell size. 42
Number of districts withdisproportionate representation ofracial and ethnic groups in special
education and related services
Number of districts withdisproportionate representation ofracial and ethnic groups in specialeducation and related services that
is the result of inappropriateidentification
Number of districts that met theState’s minimum n-size
FFY 2015Data*
FFY 2016Target*
FFY 2016Data
2 1 345 0% 0% 0.29%
Reasons for Slippage
Indiana Department of Education did not meet its current target for the reporting year and had slippage. In the reporting year, when a LEA's data exceeded the risk ratio, Indiana Department of Education instituted a morerigorous review of policies, procedures, and practices than in previous years. The updated Policy and Procedure Survey as well as File Review Rubrics required LEAs to provide more explanation and documentation ascompared to previous year. Due to the increased rigor, slippage occurred.
Were all races and ethnicities included in the review? Yes No
Describe how the State made its annual determination that the disproportionate overrepresentation it identified of racial and ethnic groups in specificdisability categories was the result of inappropriate identification
Indiana notified the LEAs that the annual data analysis reflected possible noncompliance (over the Indiana defined risk ratio threshold) with this indicator. Each LEA was required to participate in a policy and procedure review.Additionally, a minimum of 5 files (to determine practice) were reviewed on students who were evaluated and identified as students with disabilities. If policies, procedures and/or practices were determined to be inappropriate,findings were issued.
Define “disproportionate representation.” Please specify in your definition: 1) the calculation method(s) being used (i.e., risk ratio, weighted risk ratio,e-formula, etc.); and 2) the threshold at which disproportionate representation is identified. Also include, as appropriate, 3) the number of years of dataused in the calculation; and 4) any minimum cell and/or n-sizes (i.e., risk numerator and/or risk denominator).
FFY 2016 Part B State Performance Plan (SPP)/Annual Performance Report (APR)
5/15/2018 Page 35 of 65

Indiana defines disproportionate representation as disproportionate representation of racial and ethnic groups (American Indian or Alaskan Native, Asian, Native Hawaiian or Other Pacific Islander, Hispanic or Latino, Black orAfrican American, White, Multiracial) in special education and related services that is the result of inappropriate identification.
Indiana defines disproportionate representation as a risk ratio greater than 2.0 in special education and related services for two consecutive years. Indiana has a required minimum “n” size of 15 students with a disability in agiven population as well as a minimum of 15 in the comparison group.
Indiana notified the LEAs that the annual data analysis reflected possible noncompliance (over the Indiana defined risk ratio threshold) with this indicator. Each LEA was required to participate in a policy and procedure review.Additionally, a minimum of 5 files (to determine practice) were reviewed on students who were evaluated and identified as students with disabilities. If policies, procedures and/or practices were determined to be inappropriate,findings were issued.
Indicator 9
Compliant LEAs 344
Non-compliant LEAs 1
LEAs that did not meet n size 24
LEAs that did not have 2 years of data 18
LEAs with continued noncompliance 0
Total 387
Describe how the State made its annual determination as to whether the disproportionate representation it identified of racial and ethnic groups inspecial education and related services was the result of inappropriate identification.
Indiana notified the LEAs that the annual data analysis reflected possible noncompliance (over the Indiana defined risk ratio threshold) with this indicator. Each LEA was required to participate in a policy and procedure review.Additionally, a minimum of 5 files (to determine practice) were reviewed on students who were evaluated and identified as students with disabilities. If policies, procedures and/or practices were determined to be inappropriate,findings were issued.
Actions required in FFY 2015 response
none
Note: Any actions required in last year's response table that are related to correction of findings should be responded to on the "Correction of Previous Findingsof Noncompliance" page of this indicator. If your State's only actions required in last year's response are related to findings of noncompliance, a text field willnot be displayed on this page.
Correction of Findings of Noncompliance Identified in FFY 2015
Findings of Noncompliance IdentifiedFindings of Noncompliance Verified as
Corrected Within One YearFindings of Noncompliance Subsequently
CorrectedFindings Not Yet Verified as Corrected
0 0 0 0
FFY 2016 Part B State Performance Plan (SPP)/Annual Performance Report (APR)
5/15/2018 Page 36 of 65

Indicator 10: Disproportionate Representation in Specific Disability Categories
Baseline Data: 2015
Monitoring Priority: Disproportionate Representation
Compliance indicator: Percent of districts with disproportionate representation of racial and ethnic groups in specific disability categories that is the result of inappropriate identification.
(20 U.S.C. 1416(a)(3)(C))
Historical Data
FFY 2004 2005 2006 2007 2008 2009 2010 2011 2012 2013 2014
Target 0% 0% 0% 0% 0% 0% 0% 0% 0%
Data 3.41% 4.15% 3.85% 4.05% 0% 3.18% 3.18% 1.13% 1.94% 2.70%
FFY 2015
Target 0%
Data 1.84%
Key: Gray – Data Prior to Baseline Yellow – Baseline
FFY 2016 - FFY 2018 Targets
FFY 2016 2017 2018
Target 0% 0% 0%
FFY 2016 SPP/APR Data
Has the State Established a minimum n-size requirement? Yes No
The State may only include, in both the numerator and the denominator, districts that met the State-established n and/or cell size. Report the number of districts totally excluded from the calculation as a result of the requirementbecause the district did not meet the minimum n and/or cell size. 63
Number of districts withdisproportionate representation ofracial and ethnic groups in specific
disability categories
Number of districts withdisproportionate representation ofracial and ethnic groups in specific
disability categories that is theresult of inappropriate
identificationNumber of districts that met the
State’s minimum n-sizeFFY 2015
Data*FFY 2016Target*
FFY 2016Data
25 9 324 1.84% 0% 2.78%
Reasons for Slippage
Indiana Department of Education did not meet its current target for the reporting year and had slippage. In the reporting year, when a LEA's data exceeded the risk ratio, Indiana Department of Education instituted a morerigorous review of policies, procedures, and practices than in previous years. The updated Policy and Procedure Survey as well as File Review Rubrics required LEAs to provide more explanation and documentation ascompared to previous year. Due to increased rigor, slippage occurred.
Were all races and ethnicities included in the review? Yes No
Describe how the State made its annual determination that the disproportionate overrepresentation it identified of racial and ethnic groups in specificdisability categories was the result of inappropriate identification
Indiana notified the LEAs that the annual data analysis reflected possible noncompliance (over the Indiana defined risk ratio threshold) with this indicator. Each LEA was required to participate in a policy and procedure review.Additionally, a minimum of 5 files (to determine practice) were reviewed on students who were evaluated and identified as students with disabilities. If policies, procedures and/or practices were determined to be inappropriate,findings were issued.
Please specify in your definition: 1) the calculation method(s) being used (i.e., risk ratio, weighted risk ratio, e-formula, etc.); and 2) the threshold at whichdisproportionate representation is identified. Also include, as appropriate, 3) the number of years of data used in the calculation; and 4) any minimum celland/or n-sizes (i.e., risk numerator and/or risk denominator).
Indiana’s definition of disproportionate representation is the disproportionate representation of racial and ethnic groups (American Indian or Alaskan Native, Asian, Native Hawaiian or Other Pacific Islander, Hispanic orLatino, Black or African American, White, Multiracial) in specific disability categories (Cognitive Disability, Specific Learning Disability, Emotional Disability, Language or Speech Impairment, Other Health Impairment, andAutism Spectrum Disorder) that is the result of inappropriate identification. Indiana has a required minimum “n” size of 15 students with a disability in a given population as well as a minimum of 15 in the comparison group.Indiana calculates risk ratios for all of LEAs in the state. School districts must exceed the data threshold (2.0 risk ratio) for 2 consecutive years.
Indicator 10
Compliant LEAs 313
Non compliant LEAs 9
FFY 2016 Part B State Performance Plan (SPP)/Annual Performance Report (APR)
5/15/2018 Page 37 of 65

LEAs that did not meet n size 45
LEAs that did not have 2 years of data 18
LEAs with continued noncompliance 2
Total 387
Describe how the State made its annual determination as to whether the disproportionate overrepresentation it identified of racial and ethnic groups inspecific disability categories was the result of inappropriate identification.
Indiana notified the LEAs that the annual data analysis reflected possible noncompliance (over the Indiana defined risk ratio threshold) with this indicator. Each LEA was required to participate in a policy and procedure review.Additionally, a minimum of 5 files (to determine practice) were reviewed on students who were evaluated and identified as students with disabilities. If policies, procedures and/or practices were determined to be inappropriate,findings were issued.
Actions required in FFY 2015 response
none
Note: Any actions required in last year's response table that are related to correction of findings should be responded to on the "Correction of Previous Findingsof Noncompliance" page of this indicator. If your State's only actions required in last year's response are related to findings of noncompliance, a text field willnot be displayed on this page.
Correction of Findings of Noncompliance Identified in FFY 2015
Findings of Noncompliance IdentifiedFindings of Noncompliance Verified as
Corrected Within One YearFindings of Noncompliance Subsequently
CorrectedFindings Not Yet Verified as Corrected
5 4 1 0
FFY 2015 Findings of Noncompliance Verified as Corrected
Describe how the State verified that the source of noncompliance is correctly implementing the regulatory requirements
Consistent with the requirements in OSEP Memo 09-02, for Prong 2 (addressing systemic issues), the LEAs received more intensive technical assistance. Working with an IDOE specialist, these LEAs analyzed their dataand developed a Root Cause Analysis, identifying the issues that resulted in noncompliance. The LEA then developed a Corrective Action Plan, detailing actions that would address the RCA identified issues. Throughout thisRCA/CAP process, the OSE education specialist maintained close communication, either email or telephone calls on a regularely scheduled basis.
During CAP development and more intensely during CAP implementation, the LEA worked with one of the Indiana Resource Network entities to review (and revise as necessary) policies, procedures, and practices relating tothe (1) identification of specific disabilities as defined in Article 7 (Indiana Code), (2) development and implementation of IEPs, and (3) procedural safeguards.
Describe how the State verified that each individual case of noncompliance was corrected
Addressing Prong 1 of the requirements in the OSEP Memo 09-02, verification of the LEA correction, as appropriate, of student level noncompliance was completed. Included was the review of evidence of student-levelcorrection and a review of policies, procedures, and practices, resulting in revisions as appropriate. Technical assistance and training, using the results from the evaluation rubric of the initial file review was provided by anIndiana Resource Network entity for LEA administrative staff, teachers and other special education staff. If a student was no longer within the jurisdiction of the LEA, individual correction was not made.
Explanation of Alternate Data
Non Applicable.
FFY 2014 Findings of Noncompliance Verified as Corrected
Describe how the State verified that the source of noncompliance is correctly implementing the regulatory requirements
Consistent with the requirements in OSEP Memo 09-02, for Prong 2 (addressing systemic issues), the LEAs received more intensive technical assistance. Working with an IDOE specialist, these LEAs analyzed their dataand developed a Root Cause Analysis, identifying the issues that resulted in noncompliance. The LEA then developed a Corrective Action Plan, detailing actions that would address the RCA identified issues. Throughout thisRCA/CAP process, the OSE education specialist maintained close communication, either email or telephone calls on a regularely scheduled basis.
During CAP development and more intensely during CAP implementation, the LEA worked with one of the Indiana Resource Network entities to review (and revise as necessary) policies, procedures, and practices relating tothe (1) identification of specific disabilities as defined in Article 7 (Indiana Code), (2) development and implementation of IEPs, and (3) procedural safeguards.
Describe how the State verified that each individual case of noncompliance was corrected
Addressing Prong 1 of the requirements in the OSEP Memo 09-02 included verification of the LEA correction, as appropriate, of studentlevel noncompliance. Included was the review of evidence of student-level correction and a review of policies, procedures, and practices,resulting in revisions as appropriate. Technical assistance and training intensified and was provided virtually and/or on-site by the TheIndiana Disproportionality Resource Center and /or Virtuoso Education Consulting for LEA administration, teachers and other specialeducation staff. If a student was no longer within the jurisdiction of the LEA, individual correction was not made.
FFY 2013 Findings Not Yet Verified as Corrected
FFY 2016 Part B State Performance Plan (SPP)/Annual Performance Report (APR)
5/15/2018 Page 38 of 65
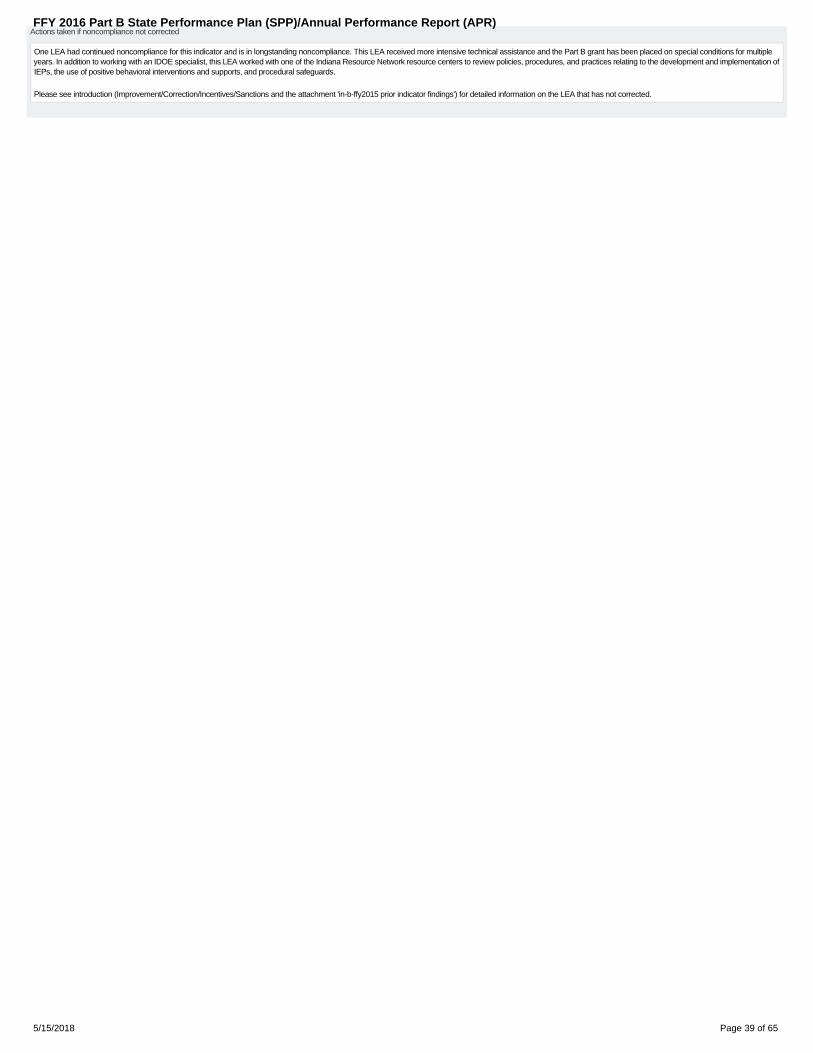
Actions taken if noncompliance not corrected
One LEA had continued noncompliance for this indicator and is in longstanding noncompliance. This LEA received more intensive technical assistance and the Part B grant has been placed on special conditions for multipleyears. In addition to working with an IDOE specialist, this LEA worked with one of the Indiana Resource Network resource centers to review policies, procedures, and practices relating to the development and implementation ofIEPs, the use of positive behavioral interventions and supports, and procedural safeguards.
Please see introduction (Improvement/Correction/Incentives/Sanctions and the attachment 'in-b-ffy2015 prior indicator findings') for detailed information on the LEA that has not corrected.
FFY 2016 Part B State Performance Plan (SPP)/Annual Performance Report (APR)
5/15/2018 Page 39 of 65

Indicator 11: Child Find
Baseline Data: 2005
Monitoring Priority: Effective General Supervision Part B / Child Find
Compliance indicator: Percent of children who were evaluated within 60 days of receiving parental consent for initial evaluation or, if the State establishes a timeframe within which the evaluation must beconducted, within that timeframe.
(20 U.S.C. 1416(a)(3)(B))
Historical Data
FFY 2004 2005 2006 2007 2008 2009 2010 2011 2012 2013 2014
Target 100% 100% 100% 100% 100% 100% 100% 100% 100%
Data 78.00% 85.90% 87.70% 92.30% 98.00% 98.50% 97.90% 97.85% 98.84% 99.26%
FFY 2015
Target 100%
Data 98.71%
Key: Gray – Data Prior to Baseline Yellow – Baseline
FFY 2016 - FFY 2018 Targets
FFY 2016 2017 2018
Target 100% 100% 100%
FFY 2016 SPP/APR Data
(a) Number of children for whom parental consent toevaluate was received
(b) Number of children whose evaluations werecompleted within 60 days (or State-established
timeline)FFY 2015
Data*FFY 2016Target*
FFY 2016Data
11,137 10,966 98.71% 100% 98.46%
Number of children included in (a), but not included in (b) [a-b] 171
Account for children included in (a) but not included in (b). Indicate the range of days beyond the timeline when the evaluation was completed and anyreasons for the delays.
The total number of students that were evaluated outside of the timelines for Indiana is 171 students. Timelines were missed for a variety of reasons identified as follows: staff shortages, the volume of referrals, schedulingconflicts, timeline errors, inadequate tracking, improper documentation, LEA data system errors and LEA staff errors.
Days Over TimelineNumber ofEvaluations
1-5 52
6-10 25
11-15 8
16-20 7
21-25 7
26+ 62
Invalid Data Submission 10
Grand Total 171
Indicate the evaluation timeline used
The State used the 60 day timeframe within which the evaluation must be conducted.
The State established a timeline within which the evaluation must be conducted.
FFY 2016 Part B State Performance Plan (SPP)/Annual Performance Report (APR)
5/15/2018 Page 40 of 65

What is the source of the data provided for this indicator?
State monitoring
State database that includes data for the entire reporting year
Describe the method used to collect these data, and if data are from the State’s monitoring, describe the procedures used to collect these data.
The data for this indicator was submitted to the Indiana Department of Education (IDOE) via a secure site known as the Student TestNumber (STN) Application Center. Each Local Educational Agency (LEA) must upload child count as well as performance andcompliance data to the STN Application Center. This data is then stored in the IDOE data warehouse where it can be extracted and usedfor state and federal funding, performance indicators, and compliance indicators. Target data was gathered from the IDOE-EV report andthen verified with LEAs to ensure accuracy. Data used in the APR is derived from the final verification reports submitted by LEAs.
Actions required in FFY 2015 response
none
Note: Any actions required in last year's response table that are related to correction of findings should be responded to on the "Correction of Previous Findingsof Noncompliance" page of this indicator. If your State's only actions required in last year's response are related to findings of noncompliance, a text field willnot be displayed on this page.
Correction of Findings of Noncompliance Identified in FFY 2015
Findings of Noncompliance IdentifiedFindings of Noncompliance Verified as
Corrected Within One YearFindings of Noncompliance Subsequently
CorrectedFindings Not Yet Verified as Corrected
22 21 1 0
FFY 2015 Findings of Noncompliance Verified as Corrected
Describe how the State verified that the source of noncompliance is correctly implementing the regulatory requirements
The LEAs with findings of noncompliance were informed that the noncompliance must be corrected as soon as possible but in no case greater than one year from the date of the issuance of the finding. The LEAs wereinformed that they were required to review and revise their policies, procedures, and practices relating to the process of conducting the initial evaluation within timeline parameters. Each LEA created a Corrective Action Plan(CAP) based on a Root Cause Analysis (RCA) through the submission of a Monitoring Workbook. The Monitoring Workbook included LEA specific data in regard to the file review, and a root cause analysis questionnaire tobe completed by the staff of the LEA in order to inform the CAP.
In addition, the LEAs identified with noncompliance were informed that they were required to work with IDOE staff and/or appropriate Indiana Resource Network (IRN) technical assistance provider(s). Progress on thisIndicator was monitored through the regularly scheduled contacts between the LEA and Indiana Department of Education consultant to address the specific reason(s) of noncompliance.
Describe how the State verified that each individual case of noncompliance was corrected
The LEAs with findings of noncompliance were informed that the noncompliance must be corrected as soon as possible but in no case greater than one year from the date of the issuance of the finding. The LEAs wereinformed that they were required to correct each individual case of noncompliance identified in the file review unless the student was no longer under the jurisdiction of the LEA. (Prong 1 in OSEP Memo 09-02) The LEAs workwith IDOE staff through the regularly scheduled contacts to address the specific reason(s) of noncompliance. The LEAs that were issued findings were assigned an IDOE consultant and required to develop a correctiveaction plan (CAP) in order to identify the root cause(s) of noncompliance and to change and update policies, procedures and practices in order to correctly implement all regulatory requirements of the Indicator. The IDOEconsultant collected the updated policies, procedures, and practices from LEAs and verified that the appropriate changes were made. Pursuant to OSEP Memorandum 09-02, the IDOE verified that unless the child no longerremained under the jurisdiction of the initiating LEA, all outstanding noncompliant initial evaluations were completed, although late. The IDOE verified completion of the outstanding noncompliant timelines by collecting andreviewing updated evaluation information from LEAs on each individual case through the State's data system and verified the LEA achieved the 100% percent compliance requirement.
Explanation of Alternate Data
Not applicable.
FFY 2014 Findings of Noncompliance Verified as Corrected
Describe how the State verified that the source of noncompliance is correctly implementing the regulatory requirements
The LEAs with findings of noncompliance were informed that the noncompliance must be corrected as soon as possible but in no case greater than one year from the date of the issuance of the finding. The LEAs wereinformed that they were required to review and revise their policies, procedures, and practices relating to the process of conducting the initial evaluation within timeline parameters. Each LEA created a Corrective Action Plan(CAP) based on a Root Cause Analysis (RCA) through the submission of a Monitoring Workbook. The Monitoring Workbook included LEA specific data in regard to the file review, and a root cause analysis questionnaire tobe completed by the staff of the LEA in order to inform the CAP. The CAP was reviewed and revised addressing more specific areas of need.
In addition, the LEAs identified with noncompliance were informed that they were required to work with IDOE staff and/or appropriate Indiana Resource Network (IRN) technical assistance provider(s). Progress on thisIndicator was monitored through the regularly scheduled contacts between the LEA and Indiana Department of Education consultant to address the specific reason(s) of noncompliance.
Describe how the State verified that each individual case of noncompliance was corrected
FFY 2016 Part B State Performance Plan (SPP)/Annual Performance Report (APR)
5/15/2018 Page 41 of 65

The LEAs were informed that they were required to correct each individual case of noncompliance identified in the file review unless the student was no longer under the jurisdiction of the LEA. (Prong 1 in OSEP Memo 09-02)The LEAs worked with IDOE staff through the regularly scheduled contacts to address the specific reason(s) of noncompliance. Pursuant to OSEP Memorandum 09-02, the IDOE verified that unless the child no longerremained under the jurisdiction of the initiating LEA, all outstanding noncompliant initial evaluations were completed, although late. The IDOE verified completion of the outstanding noncompliant timelines by collecting andreviewing updated evaluation information from LEAs on each individual case through the State's data system and verified the LEA achieved the 100% percent compliance requirement.
FFY 2014 Findings Not Yet Verified as Corrected
Actions taken if noncompliance not corrected
LEAs identified as not meeting the required timeline for completing timeline compliance were required to develop a Corrective Action Plan (CAP) in coordination with an education specialist at the IDOE during FFY2014. Forthose LEAs that had identified noncompliance in FFY 2013 (SY 13-14) or earlier, the previously developed CAP was evaluated for effectiveness and updated to reflect more comprehensive activities. The LEAs that were not ableto verify correction of policies and procedures receive intensified consultation from an assigned IDOE consultant and will participate in the required corrective action as identified above. Additional monitoring and datasubmissions are required as a part of the Corrective Action Plan.
The Education Specialist is working closely with the Special Education Director to look at the most recent data and the reasons for noncompliance. The specialist will continue working with the Director to address the issuesthat are continuing to impact compliance on timelines of eligibility. This includes visits to the districts to work with the evaluation teams regarding expectations and the provision of technical assistance to address questions theteam has.
FFY 2013 Findings of Noncompliance Verified as Corrected
Describe how the State verified that the source of noncompliance is correctly implementing the regulatory requirements
The LEAs with findings of noncompliance were informed that the noncompliance must be corrected as soon as possible but in no case greater than one year from the date of the issuance of the finding. The LEAs wereinformed that they were required to review and revise their policies, procedures, and practices relating to the process of conducting the initial evaluation within timeline parameters. Each LEA created a Corrective Action Plan(CAP) based on a Root Cause Analysis (RCA) through the submission of a Monitoring Workbook. The Monitoring Workbook included LEA specific data in regard to the file review, and a root cause analysis questionnaire tobe completed by the staff of the LEA in order to inform the CAP. The CAP was reviewed and revised addressing more specific areas of need.
In addition, the LEAs identified with noncompliance were informed that they were required to work with IDOE staff and/or appropriate Indiana Resource Network (IRN) technical assistance provider(s). Progress on thisIndicator was monitored through the regularly scheduled contacts between the LEA and Indiana Department of Education consultant to address the specific reason(s) of noncompliance.
Describe how the State verified that each individual case of noncompliance was corrected
The LEAs were informed that they were required to correct each individual case of noncompliance identified in the file review unless the student was no longer under the jurisdiction of the LEA. (Prong 1 in OSEP Memo 09-02)The LEAs worked with IDOE staff through the regularly scheduled contacts to address the specific reason(s) of noncompliance. Pursuant to OSEP Memorandum 09-02, the IDOE verified that unless the child no longerremained under the jurisdiction of the initiating LEA, all outstanding noncompliant initial evaluations were completed, although late. The IDOE verified completion of the outstanding noncompliant timelines by collecting andreviewing updated evaluation information from LEAs on each individual case through the State's data system and verified the LEA achieved the 100% percent compliance requirement.
FFY 2016 Part B State Performance Plan (SPP)/Annual Performance Report (APR)
5/15/2018 Page 42 of 65
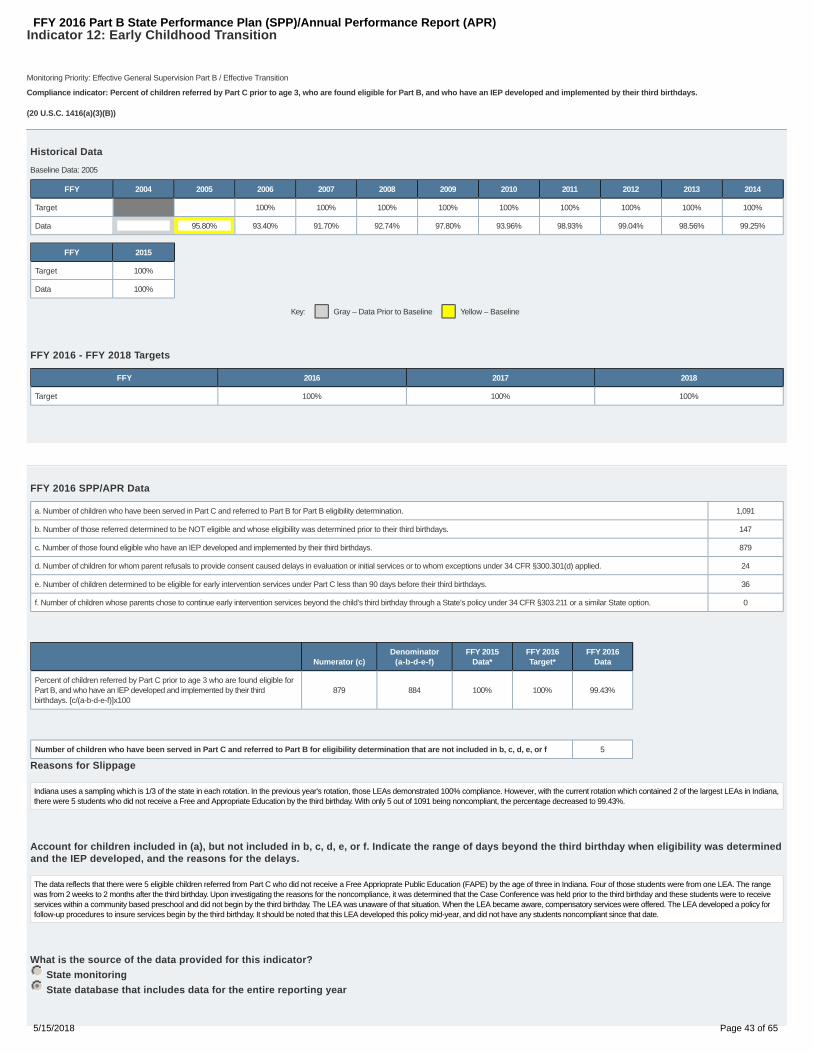
Indicator 12: Early Childhood Transition
Baseline Data: 2005
Monitoring Priority: Effective General Supervision Part B / Effective Transition
Compliance indicator: Percent of children referred by Part C prior to age 3, who are found eligible for Part B, and who have an IEP developed and implemented by their third birthdays.
(20 U.S.C. 1416(a)(3)(B))
Historical Data
FFY 2004 2005 2006 2007 2008 2009 2010 2011 2012 2013 2014
Target 100% 100% 100% 100% 100% 100% 100% 100% 100%
Data 95.80% 93.40% 91.70% 92.74% 97.80% 93.96% 98.93% 99.04% 98.56% 99.25%
FFY 2015
Target 100%
Data 100%
Key: Gray – Data Prior to Baseline Yellow – Baseline
FFY 2016 - FFY 2018 Targets
FFY 2016 2017 2018
Target 100% 100% 100%
FFY 2016 SPP/APR Data
a. Number of children who have been served in Part C and referred to Part B for Part B eligibility determination. 1,091
b. Number of those referred determined to be NOT eligible and whose eligibility was determined prior to their third birthdays. 147
c. Number of those found eligible who have an IEP developed and implemented by their third birthdays. 879
d. Number of children for whom parent refusals to provide consent caused delays in evaluation or initial services or to whom exceptions under 34 CFR §300.301(d) applied. 24
e. Number of children determined to be eligible for early intervention services under Part C less than 90 days before their third birthdays. 36
f. Number of children whose parents chose to continue early intervention services beyond the child’s third birthday through a State’s policy under 34 CFR §303.211 or a similar State option. 0
Numerator (c)Denominator
(a-b-d-e-f)FFY 2015
Data*FFY 2016Target*
FFY 2016Data
Percent of children referred by Part C prior to age 3 who are found eligible forPart B, and who have an IEP developed and implemented by their thirdbirthdays. [c/(a-b-d-e-f)]x100
879 884 100% 100% 99.43%
Number of children who have been served in Part C and referred to Part B for eligibility determination that are not included in b, c, d, e, or f 5
Reasons for Slippage
Indiana uses a sampling which is 1/3 of the state in each rotation. In the previous year's rotation, those LEAs demonstrated 100% compliance. However, with the current rotation which contained 2 of the largest LEAs in Indiana,there were 5 students who did not receive a Free and Appropriate Education by the third birthday. With only 5 out of 1091 being noncompliant, the percentage decreased to 99.43%.
Account for children included in (a), but not included in b, c, d, e, or f. Indicate the range of days beyond the third birthday when eligibility was determinedand the IEP developed, and the reasons for the delays.
The data reflects that there were 5 eligible children referred from Part C who did not receive a Free Apprioprate Public Education (FAPE) by the age of three in Indiana. Four of those students were from one LEA. The rangewas from 2 weeks to 2 months after the third birthday. Upon investigating the reasons for the noncompliance, it was determined that the Case Conference was held prior to the third birthday and these students were to receiveservices within a community based preschool and did not begin by the third birthday. The LEA was unaware of that situation. When the LEA became aware, compensatory services were offered. The LEA developed a policy forfollow-up procedures to insure services begin by the third birthday. It should be noted that this LEA developed this policy mid-year, and did not have any students noncompliant since that date.
What is the source of the data provided for this indicator?
State monitoring
State database that includes data for the entire reporting year
FFY 2016 Part B State Performance Plan (SPP)/Annual Performance Report (APR)
5/15/2018 Page 43 of 65

Describe the method used to collect these data, and if data are from the State’s monitoring, describe the procedures used to collect these data.
In FFY 2016 the data for this indicator was submitted to the Indiana Department of Education (IDOE) via a secure site known as theStudent Test Number (STN) Application Center. Each Local Educational Agency (LEA) must upload Child count as well as performanceand compliance data to the STN Application Center. This data is then stored in the IDOE data warehouse where it can be extracted andused for state and federal funding, performance indicators, and compliance indicators.
Indicator 12 data was collected through the DOE-EV (Evaluation) report on July 1, 2017, and ranged from July 1, 2016 to June 30, 2017 inorder to encompass the entire reporting year.
Actions required in FFY 2015 response
none
Note: Any actions required in last year's response table that are related to correction of findings should be responded to on the "Correction of Previous Findingsof Noncompliance" page of this indicator. If your State's only actions required in last year's response are related to findings of noncompliance, a text field willnot be displayed on this page.
Correction of Findings of Noncompliance Identified in FFY 2015
Findings of Noncompliance IdentifiedFindings of Noncompliance Verified as
Corrected Within One YearFindings of Noncompliance Subsequently
CorrectedFindings Not Yet Verified as Corrected
null null null 0
FFY 2016 Part B State Performance Plan (SPP)/Annual Performance Report (APR)
5/15/2018 Page 44 of 65

Indicator 13: Secondary Transition
Baseline Data: 2009
Monitoring Priority: Effective General Supervision Part B / Effective Transition
Compliance indicator: Percent of youth with IEPs aged 16 and above with an IEP that includes appropriate measurable postsecondary goals that are annually updated and based upon an age appropriatetransition assessment, transition services, including courses of study, that will reasonably enable the student to meet those postsecondary goals, and annual IEP goals related to the student’s transitionservices needs. There also must be evidence that the student was invited to the IEP Team meeting where transition services are to be discussed and evidence that, if appropriate, a representative of anyparticipating agency was invited to the IEP Team meeting with the prior consent of the parent or student who has reached the age of majority.
(20 U.S.C. 1416(a)(3)(B))
Historical Data
FFY 2004 2005 2006 2007 2008 2009 2010 2011 2012 2013 2014
Target 100% 100% 100% 100% 100% 100% 100% 100% 100%
Data 80.22% 84.05% 73.32% 79.00% 81.05% 80.16%
FFY 2015
Target 100%
Data 86.36%
Key: Gray – Data Prior to Baseline Yellow – Baseline
FFY 2016 - FFY 2018 Targets
FFY 2016 2017 2018
Target 100% 100% 100%
FFY 2016 SPP/APR Data
Number of youth aged 16 and above with IEPs thatcontain each of the required components for
secondary transition Number of youth with IEPs aged 16 and aboveFFY 2015
Data*FFY 2016Target*
FFY 2016Data
400 468 86.36% 100% 85.47%
What is the source of the data provided for this indicator?
State monitoring
State database that includes data for the entire reporting year
Describe the method used to collect these data, and if data are from the State’s monitoring, describe the procedures used to collect these data.
For Indicator 13 Indiana state rule requires transition plans begin at age 14, prior to the 9th grade, or earlier if determined appropriate bythe case conference committee. The Indiana Department of Education (IDOE) Office of Special Education contracted with the Center onCommunity Living and Careers (CCLC) at Indiana University to conduct a compliance review of a randomly selected sample of students’transition IEPs. The review was conducted to ensure that IDOE meets the reporting requirements and is providing ongoing assistancefor school corporations with compliance rates less than 100%.To determine and ensure compliance to Indicator 13, the IDOE has developed the Indiana Transition Requirements Checklist based ona data collection tool created by the National Secondary Transition Technical Assistance Center (NSTTAC) and approved by the Office ofSpecial Education Programs of the US Department of Education (OSEP). The Indiana Secondary Transition Resource Center at theCCLC, Indiana Institute on Disability and Community at Indiana University has created an on-line version of Indiana’s data collection toolthat was used to analyze Indiana’s student records to determine compliance with Indicator 13. The ten-item Indiana TransitionRequirements Checklist was utilized to assess if there was evidence in a student’s IEP that the student had been provided theappropriate transition services to prepare him/her to successfully transition from secondary school to a post-secondary educationand/or training program and to employment at an accuracy rate of 100%.IDOE provided CCLC with a population database of students who were receiving special education services and met the Indianatransition IEP age criteria for the monitored school year and whose local school districts are part of the monitoring cycle. The databaseincluded the Student Test Number (STN), which is the State of Indiana’s student identification number and the Corporation CodeNumber. To generate the sample, CCLC used Microsoft Excel software to run a random sampling program. If the corporation had lessthan 100 students with disabilities, three students were selected for the review. For corporations with more than 500 students, 10students were selected. Therefore, a minimum of 3 and maximum of 10 Transition IEPs were reviewed based on size of the district. Insome cases, charter schools had sample sizes of less than three students because these schools were serving limited number of
FFY 2016 Part B State Performance Plan (SPP)/Annual Performance Report (APR)
5/15/2018 Page 45 of 65

students or did not have large populations of students with disabilities. A report of the review is then provided to IDOE.
Do the State's policies and procedures provide that public agencies must meet these requirements at an age younger than 16?
Yes No
Did the State choose to include youth at an age younger than 16 in its data for this indicator and ensure that its baseline data are based on youth beginning
at that younger age? Yes No
At what age are youth included in the data for this indicator? 14
Actions required in FFY 2015 response
none
Note: Any actions required in last year's response table that are related to correction of findings should be responded to on the "Correction of Previous Findingsof Noncompliance" page of this indicator. If your State's only actions required in last year's response are related to findings of noncompliance, a text field willnot be displayed on this page.
Correction of Findings of Noncompliance Identified in FFY 2015
Findings of Noncompliance IdentifiedFindings of Noncompliance Verified as
Corrected Within One YearFindings of Noncompliance Subsequently
CorrectedFindings Not Yet Verified as Corrected
43 39 3 1
FFY 2015 Findings of Noncompliance Verified as Corrected
Describe how the State verified that the source of noncompliance is correctly implementing the regulatory requirements
The Indiana Department of Education (IDOE) issued 43 Indicator 13 findings. These new findings were identified through an assessment by CCLC using the Indiana Transition IEP checklist and 39 of those LEAsdemonstrated correction within a year by achieving 100% compliance on current IEPs using the Indiana IIEP Requirements Checklist. The IDOE verified the correction of all non-compliance in those 39 LEAs. This verificationincluded a review of updated policies, procedures, and practices (prong 2) and confirming correction of each individual non-compliant transition IEP that had been identified previously (prong 1). The IDOE collected andverified the data by obtaining a new, randomized sample of youth with IEPs aged 14 and above, using Indiana's Transition Requirements Checklist to ensure that the individual and systemic non-compliance had been resolved.The IDOE maintained monthly communication via e-mails and phone calls, providing resources and technical assistance to the LEA until non-compliance was corrected. Depending upon the corrective action plan generatedby the LEA, IDOE provided one-on-one training and technical assistance on site at the LEA or through regional trainings. Both LEA administrative and teaching personnel attended those opportunities.
Describe how the State verified that each individual case of noncompliance was corrected
The IDOE verified correction to all individual cases of non-compliance by using the Indiana Transition Requirements checklist to insure that each individual case had been corrected based on the IEP review in the Indiana IEPsystem. The IDOE also verified the enrollment status of a student of a non-compliant IEP if an LEA advised that the student was no longer enrolled due to graduation, transfer, withdrawal, etc. Correction was not required if thestudent was no longer enrolled
FFY 2015 Findings Not Yet Verified as Corrected
Actions taken if noncompliance not corrected
Three of the four LEAs that did not correct in a year have subsequently corrected.
The IDOE continued to provide technical assistance to the LEAs who failed to correct non-compliance within the first year. This assistance included, but not limited to, monthly communications via phone and email with specialeducation directors and staff, on-site training with teachers who create transition IEPs and bi-monthly transition IEP reviews to verify correction to previously reviewed non-compliant IEPs and to verify systemic correction tonewly created IEPS. Resources specific to need were provided to the LEAs based on the IEP reviews.
FFY 2014 Findings of Noncompliance Verified as Corrected
Describe how the State verified that the source of noncompliance is correctly implementing the regulatory requirements
Along with the on-going TA mentioned above, 6 of the 7 LEAs that remained out (and have subsequently corrected) participated in Transition IEP training put on by the Indiana Secondary Transition Resource Center. Theeducation consultant conducts monthly reviews of transition IEPs from this LEA and provides feedback to the Special Education Directors.
Describe how the State verified that each individual case of noncompliance was corrected
All instances of identified non-compliance were relayed to the LEA Special Education Director along with any technical assistance and resources that could be used in making the required corrections. Individual instances thatwere previously identified as non-compliant were then reviewed using the Indiana Transition IEP Rubric to verify correction. Technical assistance and professional development were continued until each instance wascompliant.
FFY 2014 Findings Not Yet Verified as Corrected
Actions taken if noncompliance not corrected
Please note that as of 3/23/2018, the aforementioned LEA has corrected the finding.
The OSE education specialist intensified his monitoring of this LEA, detailing more and more specific issues with the transition IEP components and making specific requirements for revisions and why. District staff wererequired to participate in technical assistance opportunities offered by the IIEPRC and the Indiana Secondary Transition Resource Center.
The IDOE conducted an on-site monitoring visit on 12/18/2017. While on this visit, the team:
focused on how/where services were being provided
FFY 2016 Part B State Performance Plan (SPP)/Annual Performance Report (APR)
5/15/2018 Page 46 of 65

Interviewed teachers to see if there was a common understanding on transition goal writingIEP Audit to review goal writingInterviewed leadership about expectations around transition IEP development
It should be noted that the special education director is retiring at the end of the current school year. The superintendent is personally addressing the overarching issues that impact the special education program as a whole.A targeted action plan has been developed and with the help of the Indiana IEP Resource Center (IIEPRC) will be implemented. This will solidify the prong 2, systemic portion of the correction.
FFY 2016 Part B State Performance Plan (SPP)/Annual Performance Report (APR)
5/15/2018 Page 47 of 65

Indicator 14: Post-School Outcomes
Monitoring Priority: Effective General Supervision Part B / Effective Transition
Results indicator: Percent of youth who are no longer in secondary school, had IEPs in effect at the time they left school, and were:
Enrolled in higher education within one year of leaving high school.A.Enrolled in higher education or competitively employed within one year of leaving high school.B.Enrolled in higher education or in some other postsecondary education or training program; or competitively employed or in some other employment within one year of leaving high school.C.
(20 U.S.C. 1416(a)(3)(B))
Historical Data
Baseline
YearFFY 2004 2005 2006 2007 2008 2009 2010 2011 2012 2013 2014
A 2009Target ≥ 34.80% 35.30% 35.80% 36.30% 36.80%
Data 34.30% 32.50% 33.90% 35.90% 33.21% 35.68%
B 2009Target ≥ 49.10% 49.60% 51.10% 63.50% 64.00%
Data 49.10% 56.40% 62.10% 63.80% 60.26% 62.81%
C 2009Target ≥ 86.60% 87.10% 87.60% 77.50% 78.00%
Data 86.10% 76.10% 77.90% 78.00% 79.49% 83.92%
FFY 2015
ATarget ≥ 37.30%
Data 30.00%
BTarget ≥ 64.50%
Data 65.71%
CTarget ≥ 78.50%
Data 87.14%
Key: Gray – Data Prior to Baseline Yellow – Baseline Blue – Data Update
FFY 2016 - FFY 2018 Targets
FFY 2016 2017 2018
Target A ≥ 37.80% 38.30% 38.80%
Target B ≥ 65.00% 65.50% 66.00%
Target C ≥ 79.00% 79.50% 86.20%
Key:
Targets: Description of Stakeholder Input
The Indiana Department of Education, Office of Special Education has analyzed the data from past Annual Performance Reports todetermine appropriate, achievable, yet rigorous targets for 2013-2018.
The Indiana Department of Education, Office of Special Education included stakeholder input from the State Advisory Council on theEducation of Children with Disabilities (SAC), as well as other constituents, to set the targets submitted for 2013-2018.
FFY 2016 SPP/APR Data
Number of respondent youth who are no longer in secondary school and had IEPs in effect at the time they left school 122.00
1. Number of respondent youth who enrolled in higher education within one year of leaving high school 38.00
2. Number of respondent youth who competitively employed within one year of leaving high school 48.00
3. Number of respondent youth enrolled in some other postsecondary education or training program within one year of leaving high school (but not enrolled in higher education or competitively employed) 7.00
4. Number of respondent youth who are in some other employment within one year of leaving high school (but not enrolled in higher education, some other postsecondary education or training program,or competitively employed).
12.00
Number of Number of FFY 2015 FFY 2016 FFY 2016
FFY 2016 Part B State Performance Plan (SPP)/Annual Performance Report (APR)
5/15/2018 Page 48 of 65

respondent youth
respondent youthwho are no longer insecondary school andhad IEPs in effect at
the time they leftschool
Data* Target* Data
A. Enrolled in higher education (1) 38.00 122.00 30.00% 37.80% 31.15%
B. Enrolled in higher education or competitively employed within oneyear of leaving high school (1 +2)
86.00 122.00 65.71% 65.00% 70.49%
C. Enrolled in higher education, or in some other postsecondaryeducation or training program; or competitively employed or in some
other employment (1+2+3+4)105.00 122.00 87.14% 79.00% 86.07%
Please select the reporting option your State is using:
Option 1: Use the same definition as used to report in the FFY 2015 SPP/APR, i.e., competitive employment means that youth have worked for pay at or above the minimum wage in a setting with others who are nondisabledfor a period of 20 hours a week for at least 90 days at any time in the year since leaving high school. This includes military employment.
Option 2: Report in alignment with the term “competitive integrated employment” and its definition, in section 7(5) of the Rehabilitation Act, as amended by Workforce Innovation and Opportunity Act (WIOA), and 34 CFR§361.5(c)(9). For the purpose of defining the rate of compensation for students working on a “part-time basis” under this category, OSEP maintains the standard of 20 hours a week for at least 90 days at any time in the year sinceleaving high school. This definition applies to military employment.
Was a survey used? No
Was sampling used? Yes
Has your previously-approved sampling plan changed? No
Describe the sampling methodology outlining how the design will yield valid and reliable estimates.
The data for this report came from the Indiana Post-High School Outcomes Survey, conducted and analyzed by Systems Improvement Group, a contractor with the Indiana Department of Education. This survey was intended toreach a random sample of 441 former students that attended an Indiana public school during 2015-2016 academic year. To be eligible, the students selected for the random sample included those who graduated, dropped out,or who were expected to return for the school year, but did not do so. A complete description of the sampling process used for this survey was reviewed and approved by the Office of Special Education Programs (OSEP).
The state contractor selected a random sample of school leavers. Youth selected for the original sample of 441 school leavers represented 9 of the 13 IDEA eligibility categories, including: Speech Language Impairment,Orthopedic Impairment, Hearing Impairment, Visual Impairment, Autism, Emotional Disturbance, Cognitive Disability, Other Health Impairment, and Specific Learning Disability. Eligibility categories not represented in thesample included Traumatic Brain Injury, Deaf-Blindness, Deafness, and Multiple Disabilities. These eligibility categories are considered “low incidence” disabilities and represent populations of youth with disabilities whichhave a fairly low probability of being included in a sample selection process.
The selected sample originally consisted of 441 youth. Of this number, 122 respondents completed the survey, and 53 individuals exercised their option to refuse to participate. The telephone survey interviewers were unable tomake contact with 266 individuals eligible to respond to the survey. Changing telephone numbers, along with wrong phone numbers and individuals that did not answer the phone, accounted for a large number of those whocould not be contacted. Given these circumstances, a valid return rate of 27.7% was calculated. While lower than FFY 2015, this percentage still falls within the range of return rates reported by the National Post-SchoolOutcomes (NPSO) in FFY 2015 based on a report which is overseen by OSEP and developed by various Technical Assistance and Dissemination Centers, in this case, NPSO.
The state contractor conducted statistical tests of representativeness in the areas of disability and ethnicity. The sample and the respondents themselves were representative of the student population of exiters for FFY 2015 inboth of these areas, with small percentage differences in makeup. Chi-squared tests also suggest representativeness. For the details on distribution, please consult the attached document, specifically pages 6 and 7.
Following are quick reference charts for race/ethnicity and disability, which reflect that the response data are representative of the demographics of youth who are not longer in secondary school and had IEPs in effect at thetime they left school.
WHITEBLACK ORAFRICANAMERICAN
HISPANIC MULTIRACIALAMERICANINDIAN
ASIAN
STATEPERCENTAGE
76 12 7 4 <1 1
SAMPLE SIZEPERCENTAGE
70 17 8 4 0 1
STATE PERCENTAGE SAMPLE SIZE PERCENTAGE
Specific Learning Disability 36 45
Other Health Impairment 14 15
Intellectual Disability 9 13
Emotional Disturbance 8 11
Autism 9 10
Orthopedic Impairment 1 2
Hearing Impairment 1 1
Multiple Disabilities 1 1
Speech-Language Impairment 1 1
Visual Impairment 1 1
The report prepared by a state contractor is attached to this indicator.
Are the response data representative of the demographics of youth who are no longer in school and had IEPs in effect at the time they left school? Yes
FFY 2016 Part B State Performance Plan (SPP)/Annual Performance Report (APR)
5/15/2018 Page 49 of 65

Actions required in FFY 2015 response
none
FFY 2016 Part B State Performance Plan (SPP)/Annual Performance Report (APR)
5/15/2018 Page 50 of 65
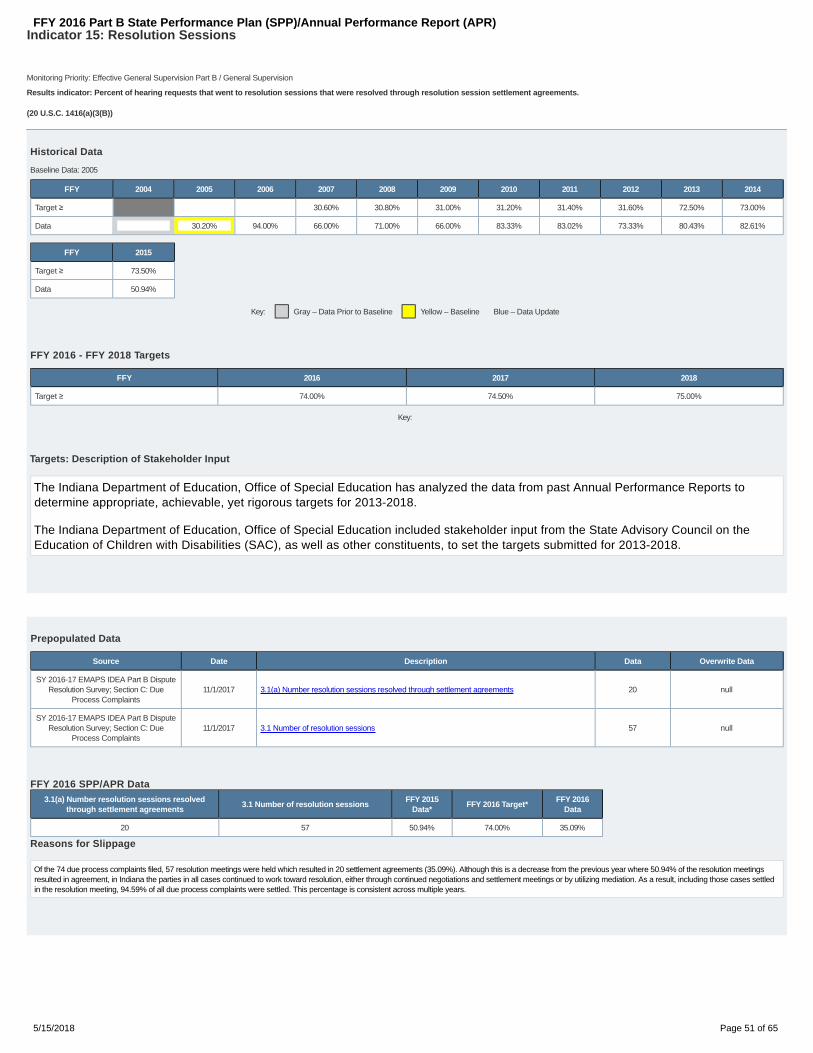
Indicator 15: Resolution Sessions
Baseline Data: 2005
Monitoring Priority: Effective General Supervision Part B / General Supervision
Results indicator: Percent of hearing requests that went to resolution sessions that were resolved through resolution session settlement agreements.
(20 U.S.C. 1416(a)(3(B))
Historical Data
FFY 2004 2005 2006 2007 2008 2009 2010 2011 2012 2013 2014
Target ≥ 30.60% 30.80% 31.00% 31.20% 31.40% 31.60% 72.50% 73.00%
Data 30.20% 94.00% 66.00% 71.00% 66.00% 83.33% 83.02% 73.33% 80.43% 82.61%
FFY 2015
Target ≥ 73.50%
Data 50.94%
Key: Gray – Data Prior to Baseline Yellow – Baseline Blue – Data Update
FFY 2016 - FFY 2018 Targets
FFY 2016 2017 2018
Target ≥ 74.00% 74.50% 75.00%
Key:
Targets: Description of Stakeholder Input
The Indiana Department of Education, Office of Special Education has analyzed the data from past Annual Performance Reports todetermine appropriate, achievable, yet rigorous targets for 2013-2018.
The Indiana Department of Education, Office of Special Education included stakeholder input from the State Advisory Council on theEducation of Children with Disabilities (SAC), as well as other constituents, to set the targets submitted for 2013-2018.
Prepopulated Data
Source Date Description Data Overwrite Data
SY 2016-17 EMAPS IDEA Part B DisputeResolution Survey; Section C: Due
Process Complaints11/1/2017 3.1(a) Number resolution sessions resolved through settlement agreements 20 null
SY 2016-17 EMAPS IDEA Part B DisputeResolution Survey; Section C: Due
Process Complaints11/1/2017 3.1 Number of resolution sessions 57 null
FFY 2016 SPP/APR Data3.1(a) Number resolution sessions resolved
through settlement agreements3.1 Number of resolution sessions
FFY 2015Data*
FFY 2016 Target*FFY 2016
Data
20 57 50.94% 74.00% 35.09%
Reasons for Slippage
Of the 74 due process complaints filed, 57 resolution meetings were held which resulted in 20 settlement agreements (35.09%). Although this is a decrease from the previous year where 50.94% of the resolution meetingsresulted in agreement, in Indiana the parties in all cases continued to work toward resolution, either through continued negotiations and settlement meetings or by utilizing mediation. As a result, including those cases settledin the resolution meeting, 94.59% of all due process complaints were settled. This percentage is consistent across multiple years.
FFY 2016 Part B State Performance Plan (SPP)/Annual Performance Report (APR)
5/15/2018 Page 51 of 65
Actions required in FFY 2015 response
none
FFY 2016 Part B State Performance Plan (SPP)/Annual Performance Report (APR)
5/15/2018 Page 52 of 65

Indicator 16: Mediation
Baseline Data: 2005
Monitoring Priority: Effective General Supervision Part B / General Supervision
Results indicator: Percent of mediations held that resulted in mediation agreements.
(20 U.S.C. 1416(a)(3(B))
Historical Data
FFY 2004 2005 2006 2007 2008 2009 2010 2011 2012 2013 2014
Target ≥ 52.40% 52.60% 52.80% 53.00% 53.00% 53.40% 53.64% 74.50% 75.00%
Data 52.00% 82.00% 55.00% 69.20% 69.40% 59.38% 76.47% 76.19% 79.25% 100%
FFY 2015
Target ≥ 75.50%
Data 88.33%
Key: Gray – Data Prior to Baseline Yellow – Baseline Blue – Data Update
FFY 2016 - FFY 2018 Targets
FFY 2016 2017 2018
Target ≥ 76.00% 76.50% 77.00%
Key:
Targets: Description of Stakeholder Input
The Indiana Department of Education, Office of Special Education has analyzed the data from past Annual Performance Reports todetermine appropriate, achievable, yet rigorous targets for 2013-2018.
The Indiana Department of Education, Office of Special Education included stakeholder input from the State Advisory Council on theEducation of Children with Disabilities (SAC), as well as other constituents, to set the targets submitted for 2013-2018.
Prepopulated Data
Source Date Description Data Overwrite Data
SY 2016-17 EMAPS IDEA Part B DisputeResolution Survey; Section B: Mediation
Requests11/1/2017 2.1.a.i Mediations agreements related to due process complaints n null
SY 2016-17 EMAPS IDEA Part B DisputeResolution Survey; Section B: Mediation
Requests11/1/2017 2.1.b.i Mediations agreements not related to due process complaints 38 null
SY 2016-17 EMAPS IDEA Part B DisputeResolution Survey; Section B: Mediation
Requests11/1/2017 2.1 Mediations held 42 null
FFY 2016 SPP/APR Data2.1.a.i Mediations agreements
related to due processcomplaints
2.1.b.i Mediations agreementsnot related to due process
complaints2.1 Mediations held
FFY 2015Data*
FFY 2016 Target*FFY 2016
Data
0 38 42 88.33% 76.00% 90.48%
Actions required in FFY 2015 response
none
FFY 2016 Part B State Performance Plan (SPP)/Annual Performance Report (APR)
5/15/2018 Page 53 of 65

Indicator 17: State Systemic Improvement Plan
Baseline Data: 2014
Monitoring Priority: General Supervision
Results indicator: The State’s SPP/APR includes a State Systemic Improvement Plan (SSIP) that meets the requirements set forth for this indicator.
Reported Data
FFY 2013 2014 2015 2016
Target ≥ 45.16% 45.66% 46.16%
Data 29.00% 45.16% 55.35%
Key: Gray – Data Prior to Baseline Yellow – Baseline
Blue – Data Update
FFY 2017 - FFY 2018 Targets
FFY 2017 2018
Target ≥ 46.66% 52.84%
Key:
Description of Measure
Indiana has submitted the SSIP report via two attachments to GRADS 360:
SSIP PHASE III-Year 2-April 2018 Annual Report-FINAL.pdf
IN SSIP EVAL March 2018 REPORT.pdf
Targets: Description of Stakeholder Input
April 1, 2015- Submitted during Phase I
Stakeholders were presented with proficiency trend data for both ISTEP+ (English/Language Arts) and IREAD-3 for the overall state andfor the more limited purposeful sample group. As a SSIP Stakeholder Team, pros and cons of using different measures wereconsidered, as well as different options for setting baselines and targets. Stakeholders voted on options, and the majority votedetermined the baseline and targets.
The SSIP Stakeholder Team discussed setting more conservative targets because Indiana adopted new standards as a result of effortsto increase rigor for all students in Indiana through the adoption of college and career ready standards through the ESEA FlexibilityWaiver. This led to the need to align new standardized testing measures to these standards and subsequently new vendors to createthese assessments. There were concerns about how these factors could have an effect on the outcome of data quality. Withoutconsistent trend data over the past few years to set current baseline data or targets, stakeholders did not have the confidence to supportmore rigorous targets at this time. In addition to this, there was discussion around the challenges in predicting the amount of growthstudents within a small sample size could make in a short period of time. This logic led stakeholders to set conservative targets asinitial goals. The expectation is that the targets will be evaluated and revised as the various factors stabilize and more data relative to theimplementation of coherent improvement strategies is collected.
Indiana Department of Education (IDOE) representatives and a broad scope of stakeholders from across Indiana focused their work ondeveloping Indiana’s State Systemic Improvement Plan (SSIP). SSIP Core Team members include: the Assistant Director of SpecialEducation for IDOE, the Part B Data Manager for IDOE, an IDOE Education Specialist, and the North Central Regional Resource Center(NCRRC) staff initially. The Core Team reviewed existing data, requested additional data runs, and analyzed the relationship betweendata elements and data sets. The Core Team set the agendas for SSIP Stakeholder Team meetings expanding on prior meetings, thenext elements of Phase I, and areas that the SSIP Stakeholder Team felt needed to be addressed. For example, the stakeholderswanted to see additional data and wanted the data visualized differently, this led to further disaggregation of data for preparation for thenextSSIP Stakeholder Team meeting. The Core Team and the Part B Data Manager also set out timelines for specific tasks and providednecessary organization and processes on the SSIP tasks.
The SSIP Core Team expanded as the process of Phase I of the SSIP moved forward and other areas within IDOE were identified as keypartners in the process for increasing outcomes for students with disabilities. This broader group of IDOE stakeholders is comprised ofadditional representatives from the Office of Special Education (OSE), specialists and the coordinator from Title 1, the director ofOutreach, Reading Specialist from the Office of College and Career Ready, the director of School Accountability, and the director ofStudent Assessment. This diverse group of experienced leaders brings a wealth of educational experience from special education andgeneral education settings, including building and district leaders, instructional coaches, and reading experts. The Leadership Teamexplored, discussed, and summarized statewide reading proficiency data for students with disabilities. The team also analyzed IDOE’scurrent infrastructure capacity to support improvement strategies and student outcomes. Leadership Team members engaged in root
FFY 2016 Part B State Performance Plan (SPP)/Annual Performance Report (APR)
5/15/2018 Page 54 of 65

cause analysis discussions. A chart with stakeholder descriptions and involvement aligned to the SSIP Implementation Phases isattached for clarification.
Information and data regarding the SSIP and Phase 1 were presented at State Advisory Council meetings, the Indiana Association ofSchool Psychologists’ Annual Conference in Fall 2014, the Indiana Council for Special Education Administrators’ Spring 2015Conference, IDOE Outreach Coordinator Staff Training Fall 2015 Meeting and Indiana Resource Network meetings with programsupervisors. All of these external stakeholder groups have provided feedback and guidance throughout the various aspects of the SSIPdata analysis and infrastructure analysis process.
In addition to these groups, a formal stakeholder group (SSIP Stakeholder Team) was developed with the sole purpose of providingstakeholder engagement in the development and implementation of the SSIP. This group is comprised of representatives from thefollowing organizations: Indiana’s State Special Education Advisory Council; Indiana Council of Administrators of Special Education(ICASE); Indiana Association of School Principals; INSOURCE (a statewide parent support organization); and Project SUCCESS (aresource center developed and managed by Public Consulting Group (PCG). In addition to the organization representatives, sixteachers from various grades and disciplines (including special education and general education) from various geographical locationsacross the state are also members. This diverse group has participated in three formal in-person stakeholder meetings thus far and allmembers are part of a listserv which provides frequent updates on progress and opportunities for feedback. In person feedback isprovided through meeting activities which provide opportunities for members to share in a variety of different modalities. Feedback fromthis group is also requested between meetings through email voting, as well as member participation in the SSIP Learning ConnectionCommunity.
Overview
Data Analysis
A description of how the State identified and analyzed key data, including data from SPP/APR indicators, 618 data collections, and other available data as applicable, to: (1) select the State-identified Measurable Result(s) forChildren with Disabilities, and (2) identify root causes contributing to low performance. The description must include information about how the data were disaggregated by multiple variables (e.g., LEA, region, race/ethnicity,gender, disability category, placement, etc.). As part of its data analysis, the State should also consider compliance data and whether those data present potential barriers to improvement. In addition, if the State identifies anyconcerns about the quality of the data, the description must include how the State will address these concerns. Finally, if additional data are needed, the description should include the methods and timelines to collect and analyzethe additional data.
April 1, 2015- Phase I Submission:
IDOE began the process of data analysis by collecting a comprehensive report of available assessment data from FFY 2009 throughFFY 2012. Initially, any data reported that related in some capacity to students with disabilities and their performance on assessmentswas gathered for analysis. This included 618 data related to students with disabilities and their participation, performance on statewideassessments (both standard and alternate), as well as state data from the IREAD-3 assessment for the years it was available. Thisinformation was disaggregated by the individual tests (ISTEP+, IMAST, ISTAR, and IREAD-3) and shared with stakeholders through SSIPstakeholder meetings. The stakeholder group also analyzed data from prior and current State Performance Plans and AnnualPerformance Reports (SPP/APR).
Stakeholders were provided with raw data in regard to student results on assessments, including math and reading, as well asdisaggregated data including bar graphs, pie charts and trend lines. The facilitator of the meetings led the discussion of the wholegroup, ensuring each stakeholder member had a common understanding of the data findings in order to understand the related needsbased on these findings. The stakeholders were then asked to have conversations in small groups (each included a mix of thestakeholders, i.e. family representatives, teachers, administrators, state personnel). These conversations included discussions aboutpotential data trends and possible implications from these trends. The discussion in both the large and small groups began with abroad analysis of the data then pointed discussion that helped to narrow the analysis process. Once the external stakeholder group hadanalyzed the data, the information was shared with an internal stakeholder group. The discussion with the internal group includedidentification of the current IDOE initiatives, such as college and career readiness, RTI/MTSS, and educator effectiveness. The groupconsensus was that the SSIP should be tied to an existing reading initiative, specifically the emphasis on students being college andcareer ready through the academic lens of reading. Through these discussions, it was determined by both internal and externalstakeholders that Indiana should focus on student data related to reading proficiency. The group wanted to explore other data sourcesfor potential trends and student performance on statewide assessments in the areas of reading and English language arts. Additionally,it was discussed and determined that as a means to leverage resources and partner with internal stakeholders within IDOE, it would benecessary to disaggregate data for schools that were in focus status as determined by Indiana’s Federal ESEA Flexibility Waiver. Thiswill provide additional opportunities for the OSE to collaborate in order to meet broad strategic goals of the Department and meet theneeds of all students in order to increase proficiency. Through trend analysis, a “purposeful sample group” of the schools in focus statuswas identified as the group for determining the State Identified Measureable Result (SIMR), for gauging potential root causescontributing to low performance, and for establishing a model of selection for the SSIP schools for the implementation in Phase III.
In addition to the extensive quantitative analysis of data which helped the stakeholder groups set an initial focal point, qualitative analysiswas done as well. Leadership and Core Teams from the OSE, Title 1, and Outreach programs worked collaboratively to conduct focusgroup surveys of schools within the purposeful sample group. These surveys were conducted through a combination of on-site,in-person interviews with key staff members (those involved in providing reading instruction or intervention to students with disabilities atschools) in the purposeful sample group, as well as through online questionnaires with additional staff and parents. This information
FFY 2016 Part B State Performance Plan (SPP)/Annual Performance Report (APR)
5/15/2018 Page 55 of 65

then was used to identify root causes that contribute to low performance in reading and English language arts.
Trend analysis of historical assessment information for all of the Indiana assessment tools were included in the data review andfocused on the disaggregation of data by district: disability, placement (LRE), ethnicity, poverty (free/reduced lunch status, Title 1eligibility), and EL status. This resulted in an abundance of both raw data and data visualizations. As one of the goals of the SSIP is tobreak down silos between the various IDOE departments, OSE worked closely with Title I and Outreach to collaborate on a sharedvision. A purposeful sample group of buildings in focus status was developed to assist in narrowing the scope of data to review and lookfor common trends among similar schools. The sample was limited to schools that were identified under Indiana’s FederalAccountability Waiver as schools that received a “D” or “F” school designation and are considered to be in federal school improvementstatus. If a school received a “D” in 2012-2013, that school was classified as a focus school in 2013-2014. In order to ensure a broadrepresentation for root cause analysis and later scaling up, the purposeful sample group included schools from large, medium andsmall LEAs as well as representation from various geographical locations across the state. Through internal and external stakeholderdiscussions, the pros and cons of working with either “D” or “F” schools was debated. Through this debate, it was decided that in orderto gather information on schools that were in need, but still had a foundational infrastructure for support, the selection for LEAs would belimited to LEAs with at least one, but less than four, focus elementary schools. The rationale used for this formula was that LEAs withgreater than four focus elementary schools could limit the initial capacity for implementation in Phase III and could imply that thesedistricts had more LEA systemic challenges that would impact building infrastructure support. A discussion also ensued as to whyfocus schools and not priority schools were selected for the sample group. A comment from a stakeholder (who is a parent advocate)was taken into consideration by the external stakeholders when the discussion started with the assumption that priority schools wouldbe the target sample group. This insight shed light on the possibility that priority schools likely had many issues impacting studentlearning both at the school and LEA levels. The group was challenged to think about what Indiana hopes to accomplish through theSSIP and how available resources and measurable student outcomes could be affected if the challenges to the school/LEAinfrastructure were massive: Would there be capacity to implement the changes? Could team structures be identified within theseschools?
After substantial dialogue and debate, the stakeholder group determined that focus schools were not only in need of intervention andsupport, but were also likely to have the foundational infrastructure to support implementation and sustain change for the long-term. Itwas determined that focus schools would become the purposeful sample.
Indiana does not have issues with data quality as far as data being incomplete or incorrect. However, Indiana has experienced transitionwith regard to Indiana Academic Standards:
• Indiana adopted Common Core standards in 2010.
• Indiana General Assembly enacted legislation precluding Indiana’s use of Common Core standards in March 2014.
• Legislation required that new College and Career Ready standards be adopted by the State Board of Education by July 1,2014.
Subsequently, Indiana has revised its statewide assessments over the past three years. Indiana has used ISTEP+ for the regularassessment, Indiana Modified Achievement Standards Test (IMAST) for the modified assessment, and ISTAR for the alternateassessment.
IMAST was discontinued after the 2013-2014 school year, and the ISTEP+ and ISTAR assessments required revisions in order to alignwith the college and career ready standards. The Indiana Superintendent of Public Instruction, the Governor, and the Indiana StateBoard of Education continue to have conversations regarding the Indiana Academic Standards and Assessments. The impact of thesetransitions translates into data discrepancies between years and will impact future data comparisons. Additionally, with the eliminationof the modified assessment (2% assessment, IMAST), additional students will be assessed using ISTEP+ which could impactstatewide performance data. This, coupled with changes in assessment vendors, could have an impact on data reliability.
In an effort to assist with the potential for unreliable data, it was determined that IDOE will use the IREAD-3 assessment given to thirdgrade students as the measure for student performance for the SSIP. This assessment has not been effected by the changes tostandards or vendors that the standardized assessment has experienced. This will allow IDOE to identify reliable baseline measuresand set realistic targets for student achievement without waiting for new data to be collected over several testing windows as the newassessment is introduced.
It is anticipated that there will be data variability with the IREAD-3 assessment due to the fact that different third grade students areevaluated every year. The evaluation plan in Phase II will address this possible issue. Initial discussion has prompted the idea oftracking student cohorts, i.e. third grade students in year one of implementation as they advance in grades, kindergarten students whowill be recipients of the coherent improvement strategies, etc.
The OSE provided trend information to the stakeholders on each of the federal indicators including both compliance and resultsindicators. The data was reviewed to identify possible areas of impact on the SSIP. No foreseeable issues were brought up by theexternal stakeholder group, however, conversation continued within the OSE. None of the data, in regard to indicators, stand out asbarriers to the implementation of the SSIP. However, as the buildings begin to execute the SSIP at a local level the data will need to beanalyzed specifically for any root cause possibilities. For example, if any discipline or special education identification disproportionalityissues exist, the data will need to be reviewed, and local plans may need to include strategies to address the issue(s). Indicator 5, leastrestrictive environment (LRE), could also play a part in the coherent strategies that are put in place at a local level, adjusting servicedelivery and continuum options and providing training if there are issues related to LRE identified through the root cause analysis. As theimplementation phase of the SSIP nears, Indiana will need to align any findings of non-compliance or any LEA outcomes that do notmeet state targets for results indicators that may be present in the buildings to coherent improvement strategies and initiatives beingimplemented.
FFY 2016 Part B State Performance Plan (SPP)/Annual Performance Report (APR)
5/15/2018 Page 56 of 65

April 1, 2016 Phase II Submission: Revisions to Phase I
After the initial submission of Phase I of the SSIP for Indiana, there were several factors that led to the need to revisit the data analysis process and reset both baseline data and targets for the future goals of the Indiana SIMR.During the 2013-14 school year, Indiana adopted new standards, which led to a more rigorous assessment of these standards across all assessments, including the IREAD3 Assessment. This also led to an almost 10% declinein proficiency scores for the IREAD3 for all students, and subgroups of students, including those with disabilities. Given this change in standards and subsequent performance dip, it was approved by OSEP TA providers thatIndiana could reset the baseline measure for the SSIP SIMR using the 2014 IREAD3 data. Additionally, the target group of students for the SIMR changed based on the State Development Network (SDN) infrastructure. Thenew targeted group of students, is a larger sample size of students including all students with disabilities, receiving free and reduced lunch attending elementary schools within the SDN Cohort 1. This includes sixty threeelementary schools and approximately 945 students out of the 1,147 total number of third graders with disabilities in these schools. The comprehensive SSIP Stakeholder group was included in analysis of the updated data
using the IREAD3 2014 data set, and the SDN 3rd grade data for students with disabilities. Stakeholders evaluated achievement gap data, and helped to determine the appropriate parameters for setting future targets based onthe identified trends within the SDN student data. Stakeholders felt it was important to consider the impact of significant achievement gaps within certain racial and ethnic groups even though the data showed that across allsubgroups, students receiving free/reduced lunch underperformed compared to their peers receiving paid lunch. A discrepancy in performance between students receiving free/reduced lunch and paid lunch was also shownwithin overall statewide data. Both of these gave support to the emphasis on Indiana’s State Identified Measureable Result (SIMR) being focused on students with disabilities in the SDN schools that receive free/reducedlunch. Also within the SDN disaggregate data, African American students with disabilities receiving free/reduced lunch and paid lunch had an overall performance rate on the IREAD3 that was significantly lower than both thestate average, and the performance of all other subgroups of students with disabilities within the SDN. Additionally, white students with disabilities had the largest gap of performance between students receiving paid andfree/reduced lunch. The performance of these two subgroups were used as the parameters for setting the target. The overall performance of both white and African American students receiving paid lunch for this data reportwas used as a means of setting parameters for the overall growth target for the SSIP. Incremental growth of .5% is expected for the first years of SSIP Implementation, based on the indirect influence of practices that are being
implemented both within the SDN Site schools and the primary support of the LEA participation within the State Development Network. It is expected that the students that have received SSIP Implementation support from K-3rd
grade will demonstrate a significant amount of growth and this will be shown during the FFY19 IREAD3 assessment year. Additionally, it is the goal of Indiana to scale up implementation and share the lessons learned throughthis model both within the SDN and across the state. It is possible that growth from participation in SDN related activities or from shared professional learning around the SSIP Partnering LEAs and Site Schools will result in agreater rate of performance than anticipated.
Please refer to Appendix F-Data Analysis Update within the attached Comprehensive Manual for Implementation which includes disaggregated data used by stakeholders, as well as an explanation of the new baseline andtargeted goals for improvement over Phase III
Analysis of State Infrastructure to Support Improvement and Build Capacity
A description of how the State analyzed the capacity of its current infrastructure to support improvement and build capacity in LEAs to implement, scale up, and sustain the use of evidence-based practices to improve results forchildren with disabilities. State systems that make up its infrastructure include, at a minimum: governance, fiscal, quality standards, professional development, data, technical assistance, and accountability/monitoring. Thedescription must include current strengths of the systems, the extent the systems are coordinated, and areas for improvement of functioning within and across the systems. The State must also identify current State-levelimprovement plans and initiatives, including special and general education improvement plans and initiatives, and describe the extent that these initiatives are aligned, and how they are, or could be, integrated with, the SSIP.Finally, the State should identify representatives (e.g., offices, agencies, positions, individuals, and other stakeholders) that were involved in developing Phase I of the SSIP and that will be involved in developing and implementingPhase II of the SSIP.
April 1, 2015-Submission of Phase I Report-
IDOE analyzed State infrastructure through a variety of qualitative data analysis methods. The core and leadership teams met regularly toconceive opportunities to leverage resources and to review data that reflected the state infrastructure. Additionally, members of the coreteam met with external stakeholder groups to garner feedback related to state infrastructure. A formal SWOT (strengths, weaknesses,opportunities, and threats) analysis process was completed (using resources and recommendations from the RRCP SWOT Analysisand State Infrastructure Analysis Toolkit) with the official SSIP Stakeholder Team and with internal IDOE staff to determine strengths,weaknesses, opportunities, and threats that would have an impact on the SIMR and SSIP relative to the state infrastructure.
There are existing supports currently available to LEAs and school personnel. The following are examples of infrastructure supports thatare available for LEAs/buildings:
Indiana has a waiver from certain aspects of the federal No Child Left Behind law. This gives local schools continued flexibility in howfederal funding is utilized and allows more funding decisions to be made at the local level.
The federally funded 21st Century Community Learning Centers program provides at-risk students a safe environment duringnon-school hours. A range of high quality services to support regular school-day academics and development are provided, includingtutoring and mentoring, academic enrichment, and character education.
The “Learning Connection” is an online tool developed by IDOE that plays a prominent role in supporting the implementation ofIndiana’s strategic initiatives. By providing data, resources, and tools for school improvement, the functionality of the LearningConnection can be leveraged across IDOE initiatives aimed at improving student learning. The Learning Connection includes:communities for professional collaboration; a library to create lessons and school activities, a class workspace to schedule events,lessons, and learning activities; the creation of reports (individual student and class) of achievement; and a means by whichparents/students can access school or corporation information.
The Office of Student Services provides resources including assistance for chronic absenteeism, prevention of bullying, school climateand cultural awareness, school counseling and guidance, and military children and family resources.
Resources are provided for parents/families through different divisions within IDOE.
The Office of Special Education has the Indiana Resource Network comprised of centers that provide targeted, comprehensive support to schools across the state to improve teaching and learning:
o Over 98% of the LEAs utilize the “Indiana IEP” online to develop legally compliant Individualized Education Programs.Technical assistance and professional development for Indiana educators is offered in the development and use ofprocedures to ensure compliance and fidelity of IEP goal implementation.
o The Positive Behavior Interventions and Supports (PBIS) Resource Center increases educator knowledge andunderstanding of how PBIS impacts student achievement, family engagement, dropout rate and least restrictiveenvironments.
FFY 2016 Part B State Performance Plan (SPP)/Annual Performance Report (APR)
5/15/2018 Page 57 of 65

o Project SUCCESS supports teachers and administrators in the design and implementation of Indiana Academic Standardsin curriculum and instruction for students with significant cognitive disabilities.
o IN*SOURCE, utilizing a proven parent-to-parent model, has provided assistance, support services, and educationalresources to the community of individuals and organizations that serve and support persons with disabilities.
o The PATINS Project is a statewide technical assistance network that provides accessible technology for assisting LEAs inthe utilization and creation of accessible learning environments and instructional materials. A focus for the PATINS Projectwill include Universal Design for Learning.
o The Indiana Secondary Transition Resource Center focuses on student-focused planning activities and self-determinationskill development; improved Transition IEPs and use of transition assessments; access to effective academic andlife-skills instruction, quality work-based learning; interagency collaboration; and family involvement.
Detailed reports are attached that reflect the infrastructure analyses that were completed. Indiana would like to draw the reader’sattention to the ‘discussion’ portion of the reports that provide an overview of the analyses that were completed. Also attached are tworeports which detail Indiana’s current strengths, the extent the systems are coordinated, and the areas for improvement within andacross the systems (PDFs of SWOT Reports which detail descriptions of SWOT for each area of state infrastructure).
The Indiana Superintendent of Public Instruction has clearly laid out the IDOE initiatives as follows:
“We are dedicated to providing the highest quality of support to Indiana’s schools, teachers, students and parents. We are working witheducators, policy makers, business leaders, and community based organizations to achieve our mission to build an education systemof high quality and equity that is focused on student-centered accountability.
The Indiana Department of Education is using a community approach to educating our children and in building support systems for ourschools. No matter where children live in our state, they should enter schools that have equity in resources and the expectation they willreceive a high quality education. We have established the division of Outreach for School Improvement to embrace this philosophy andapproach to ensuring continuous and measurable improvement for both our students and schools.”
The Office of Special Education’s new State Director of Special Education presented her goals during the keynote at a recent IndianaInclusion Conference:
“I am passionate about the importance of growing inclusive schools. In this age of racial unrest and radical extremists, it becomes evenmore paramount that students are taught in schools where tolerance is expected and diversity is welcome.
We started this conversation years ago. With the onset of PL94-142, followed by IDEA... the push for mainstreaming in the 70s and theregular ed. initiative of the 80s...these all nudged schools to have students with disabilities in classrooms and buildings with their sameage peers. I often wonder why after all this time we still find pockets of resistance to meeting the needs of all students withoutclassifying some of them and separating them from the masses. Why, with all of the technology, research and highly qualified teachersdo we still accept the notion that some students don’t belong in a particular classroom, school or community. I guess the answeris...institutional change takes time and it takes commitment and it takes a champion or two to take risks and bring people along. Myhope for all of you over the next two days is that you leave feeling confident and motivated to truly embrace all students’ abilities andtalents and skills, I hope you continue promoting high expectations for all students and I hope you re-dedicate your career to making alasting change.”
As IDOE analyzed state plans that are currently in place for schools in Indiana, there are also plans that are required by schools basedupon varying factors. All schools submit Schoolwide Improvement Plans; this is a required component for accreditation in an effort toassist schools in continuous strategic school improvement initiatives. Additionally, all schools with students in grades K-4 are requiredto submit Reading Plans. If a school is in focus or priority status, they must also submit a Student Achievement Plan. Lastly, if schoolsreceive Title 1 funds, they must submit Title 1 Plans. The opportunity to align all of these plans with the SSIP exists. It is an expectation ofIDOE that through each step of the SSIP, the cohesion and coordination of services will be aligned through these plans and initiatives.The partnership between the offices within IDOE through Outreach, Title 1, and special education, along with the current IDOE initiative tocoordinate the elements of each plan into one, will allow for continuity and will reduce redundancy in schools.
As part of the final process for developing the SIMR and analyzing the state infrastructure, IDOE reviewed the SWOT Analysis reports withthe SSIP stakeholder group through a formal text rendering process and discussion. This cooperative sharing experience allowed themembers of the formal stakeholder group to reflect on significant points from the SWOT process and to consider the various areas ofthe state infrastructure that could have shared strengths, weaknesses, opportunities or threats that could be either capitalized on, ordeveloped for further planning purposes. The main standout points as far as weaknesses and opportunities that were brought to theforefront of the discussion for emphasis are in the areas of Technical Assistance/Professional Development and Data and reference thethree “C’s: Capacity, Cohesion, and Communication.”
April 1, 2016- Phase II Submission- Revisions to Phase I:
Following the submission of Phase I of the SSIP, the Division of School Improvement began considering additional ways to supportLEAs at a district level in order to improve systemic alignment and work cohesively to address schools in need of improvement. This ledto the creation of the Indiana State Development Network of districts that are committed to participating in a transformational communitythat is deeply focused on building an education system of high quality and equity in Title I served schools. This initiative was modeledafter the State Development Network model that Indiana had been participating in at an SEA level through support of Mass Insight. Thefirst cohort of LEAs that were able to participate in this support were selected based on their designation as Title 1 eligible districts withan intensive focus on supporting their schools that were designated as Focus or Priority Schools in need of improvement. Members ofthe SDN will continue to recieve the following supports:
FFY 2016 Part B State Performance Plan (SPP)/Annual Performance Report (APR)
5/15/2018 Page 58 of 65
• Increased technical assistance and professional development.
• Access to IDOE experts and on-site work days
• Network of Resources including peers with similar goals and high performing districts
• Priority access on grant approval and amendments
• Assignment of a case manager to provide guidance and support
• Opportunities to participate in intensive summer professional development
The first cohort of the SDN received additional reallocated Title 1 funds and state turnaround dollars to support the implementation of a high quality district improvement plan. Professional Development and TechnicalAssistance support for this was offered in August 2015, and then continued on a quarterly cycle with additional follow-up support made by Case Managers on a monthly basis. Given the intentional support for schoolimprovement that this structure provides as well as the opportunity for collaboration across all offices of the Division of School Improvement, our core team for the SSIP decided to seek the approval for the selection of schoolsfor implementation of the SSIP to be from the SDN districts. This would allow for additional supports and cross collaboration throughout IDOE. Approval and collaboration for this partnership was received welcomingly, andthis even led to an additional pilot school partner being selected from one of the Cohort I LEAs.
State-identified Measurable Result(s) for Children with DisabilitiesA statement of the result(s) the State intends to achieve through the implementation of the SSIP. The State-identified result(s) must be aligned to an SPP/APR indicator or a component of an SPP/APR indicator. The State-identified result(s) must be clearly based on the Data and State Infrastructure Analyses and must be a child-level outcome in contrast to a process outcome. The State may select a single result (e.g., increasing the graduationrate for children with disabilities) or a cluster of related results (e.g., increasing the graduation rate and decreasing the dropout rate for children with disabilities).
Statement
April 1, 2016-Phase II Submission- Revision to Phase I:
The SIMR is based upon improving student performance in reading, which aligns to Indicator 3- student performance on statewide assessment.
The State Identified Measureable Result for Indiana:
Indiana will increase reading proficiency achievement on Indiana’s IREAD-3 assessment by at least .5% each year for 3rd grade students with disabilities eligible for free/reduced lunch attending elementary schools within theState Development Network Districts.
Description
April 1, 2015- Phase I Submission:
In order to determine the SIMR, disaggregated data for reading performance by area of exceptionality, LRE, race, school lunch status,and gender were shared and displayed for the stakeholder groups to review for trend implications. A graphic representation of each ofthe disaggregation displays of this data is attached. The data indicated that students with language and speech impairments andspecific learning disabilities in the purposeful sample group were the largest areas of exceptionalities represented. In a disaggregationof data for all students with disabilities in Indiana who did not demonstrate proficiency in passing statewide assessments in Englishlanguage arts/reading, students with specific learning disabilities did not meet proficiency expectations. 77% of students with specificlearning disabilities are receiving their instruction in a general education setting for 80% or more of the day, 22% receive their instructionin a resource room setting, and only 2% of those students are receiving instruction in a self-contained special education setting. Whencomparing the racial demographics of the purposeful sample group to their general education peers within the LEAs they reside within,the data was comparable. Therefore, there did not appear to be any implication related to race for the purposeful sample group. In bothstate and purposeful sample data, there are significantly more male students than female students identified with specific learningdisabilities in third grade. Also significant for the development of the SIMR is the impact of poverty as related through school lunchstatus. 73% of the students in the purposeful sample group receive free lunch. After analyzing the graphic displays of the data and thetrend implications, the stakeholders discussed how these implications could be developed as a State Identified Measureable Result.Stakeholders agreed to an initial SIMR that focused on improvement of reading outcomes for third and fourth grade male studentsidentified with specific learning disabilities receiving free lunch. After it was determined that the most reliable measurement tool fordetermining baseline and targets and measuring future growth would be Indiana’s IREAD-3 assessment, this further narrowed thefocus to third grade students since IREAD-3 is given only to third graders.
Given the emphasis from both the state legislature and IDOE to improve college and career readiness outcomes for students in Indiana,there is a clear alignment between the Indiana SIMR and state initiatives which focuses on increasing reading outcomes for studentswith specific learning disabilities in third grade. The State’s commitment to reading is evident in a letter below signed by theSuperintendent of Public Instruction that includes an explanation of the “Hoosier Family of Readers”:
“Dear Parents and Community Supporters,
During our busy days, finding time to read can be a challenge. I hope that you are able to find the time to read with the youngpeople in your life. The Hoosier Family of Readers is an initiative to build a culture of readers in Indiana. A reading family can be anycombination of caring adults and children, reading together at home, a neighborhood library or out of school at places like the Boys andGirls Club, YMCA or scouts.
We encourage all of our reading families to read anything that interests them–including graphic novels, non-fiction books,magazines, and newspapers – whether online or in print. We suggest that they:
• Read with someone
FFY 2016 Part B State Performance Plan (SPP)/Annual Performance Report (APR)
5/15/2018 Page 59 of 65
• Read to someone
• Share with someone what he/she has read
• Listen to someone read
• Help others read
• Read independently
Our Hoosier Family of Readers welcomes the Indiana National Guard as our new reading partner in Books & Boots. Active dutymembers of the National Guard are going to schools around Indiana to help students read and learn! We are happy to welcome them toour Hoosier Family of Readers.
If you are a member of a community group wanting to help with this reading initiative, please contact [email protected](link sends e-mail) and let us know about your group and how you would like to support the Hoosier Family of Readers.
Remember, a reader is not simply someone who can read; a reader is someone who does read.”
As described previously, Indiana collected and analyzed data from a number of resources, conducting both quantitative and qualitativeanalyses. The stakeholder groups, during the initial presentation of information, engaged in thoughtful and deliberate discussion whichresulted in the collection of further data and analysis. The new information was then analyzed along with the initial information, and thestakeholder groups ultimately crafted the SIMR.
It is Indiana’s belief that the student centered outcome has been evident in all elements of the first phase of the SSIP. The stakeholdergroups keep the focus of all conversations on the student who is learning. This has been evident through the focused work of studentcentered outcomes achieved by breaking down silos, including parents, teachers, Title 1, Outreach, Assessment, and Accountability. The students are the center of the work. A tool that has been developed for use by the administrators of the pilot and implementationbuildings (to begin in Phase II) that lists each target student individually and the various ‘categories’ of support that are available to thatstudent either through a funding source or building/LEA initiative. The tool also lists the individual student results on assessments toensure that there is a baseline of information for measurement purposes.
Indiana chose the SIMR using a deliberate and intentional method of selection focusing first on leveraging the IDOE-wide readinginitiative to ensure that the office of special education was supporting those efforts for students with disabilities being implemented as‘students’ first. To support these students, Indiana followed the guidance offered through the OSEP funded technical assistance centers,the various conference calls, webinars and technical assistance opportunities: “start small and scale up”.
Though an argument could be made to focus on any particular group of students with disabilities, Indiana chose to concentrate on a group of students in a disability category with a higher incidence in the state. In order toeffectively partner with various divisions within the IDOE, the OSE looked to partner with Title I and Outreach. Those divisions were already working with the focus and priority schools, and when the data was reviewed, it wasfound that the male students with specific learning disabilities were a group that needed assistance. With the selection of the SIMR based on impact of students with the highest incidence disability category in both thepurposeful sample group and in the state, it provides an opportunity to implement evidence-based practices for improving outcomes that can be scaled up to a group that is also affected at a state level and has overall impact onstate data and performance.
April 1, 2016- Phase II Submission- Revisions to Phase I
The SSIP is part of a larger IDOE initiative through the State Development Network. This partnership focuses on struggling learners as a whole. Due to this emphasis, stakeholders reviewed additional data and determinedthat the SiMR should include a broader student demographic group instead of the original focus on male students with specific learning disabilities.
Please review the attached Comprehensive Manual for Implementation-IN-SSIP for additional explanation.
Selection of Coherent Improvement Strategies
An explanation of how the improvement strategies were selected, and why they are sound, logical and aligned, and will lead to a measurable improvement in the State-identified result(s). The improvement strategies shouldinclude the strategies, identified through the Data and State Infrastructure Analyses, that are needed to improve the State infrastructure and to support LEA implementation of evidence-based practices to improve the State-identified Measurable Result(s) for Children with Disabilities. The State must describe how implementation of the improvement strategies will address identified root causes for low performance and ultimately build LEA capacityto achieve the State-identified Measurable Result(s) for Children with Disabilities.
April 1, 2016- Phase II Submission- Revisions to Phase I:
During the initial phases of SSIP development, IDOE established an Instructional Practices Advisory Committee to identify the evidence-based instructional strategies within early literacy instruction, as well as high-leveragepractices that, when applied across content, improve student learning. This group met on multiple occassions, under the direction of the IDOE with support from the National Center on Systemic Improvement, to collaborativelyreview the research and identify the evidence-based and high-level instructional strategies that, if applied with fidelity, will most likely improve student literacy performance. Likewise, this group considered how to purposefullyalign SSIP work to the existing requirements and support under the SDN. For example, the SSIP specifically focused on leadership capacity to support both school turn around and inclusive school cultures. Furthermore, andmost impressive, the team connected ongoing school turnaround efforts to review and revise the state’s RTI guidance and align it with the framework for Multi-tiered Systems of Support. MTSS will be supported by the SSIPteam using the work of the department as a guideline. As demonstrated within the SSIP logic model, MTSS establishes the infrastructure to both promote school turn around efforts and the implementation of evidence-basedand high-leverage practices with fidelity. A complete listing of the advisory committee’s menu of approved instructional practices can be found within Appendix C of the Comprehensive Manual for Implementation.
Theory of Action
A graphic illustration that shows the rationale of how implementing the coherent set of improvement strategies selected will increase the State’s capacity to lead meaningful change in LEAs, and achieve improvement in the State-identified Measurable Result(s) for Children with Disabilities.
FFY 2016 Part B State Performance Plan (SPP)/Annual Performance Report (APR)
5/15/2018 Page 60 of 65
Submitted Theory of Action: No Theory of Action Submitted
Provide a description of the provided graphic illustration (optional)
Description of Illustration
April 1, 2016- Phase II Submission- Revisions to Phase I:
The Theory of Action developed during Phase I was revised by the Indiana SSIP Core Team based on OSEP guidance and input from Stakeholders and the National Center for Systemic Improvement to ensure that the cleararticulation of coherent improvement activities and roles of each layer of the infrastructure from State Education Agency to Local Education Agency to building leader to teacher was clearly identified.
A Logic Model and alignment document was also developed during Phase II to further clarify specific activities, and short, medium, andlong term measures of success.
Indiana would like to thank the staff from the federally funded National Center for Systemic Improvement and their collaborative TA partners that have spent the year assisting the Indiana SSIP Core Team in ensuring theprocess was both deliberate and focused and that IDOE met the goals and requirements outlined by OSEP.
Infrastructure Development
(a) Specify improvements that will be made to the State infrastructure to better support EIS programs and providers to implement and scale up EBPs to improve results for infants and toddlers with disabilities and their families.(b) Identify the steps the State will take to further align and leverage current improvement plans and other early learning initiatives and programs in the State, including Race to the Top-Early Learning Challenge, Home VisitingProgram, Early Head Start and others which impact infants and toddlers with disabilities and their families.(c) Identify who will be in charge of implementing the changes to infrastructure, resources needed, expected outcomes, and timelines for completing improvement efforts.(d) Specify how the State will involve multiple offices within the State Lead Agency, as well as other State agencies and stakeholders in the improvement of its infrastructure.
April 1, 2016- Phase II Submission:
Indiana has been intentionally focused on systems alignment from the State Education Agency level cascading through to the LEA and school levels. Within the Indiana Department of Education(IDOE), systems alignment workhas been supported through an organizational change, combining all offices focused on school improvement, including the Office of Special Education under one division. The directors of each office within the Division meetand will continue to meet weekly as a leadership team to work toward common goals guided by the IDOE Strategic Plan. The offices are now sharing and will continue to share the SSIP work as well as other initiatives. Thiscross office collaboration led to the creation of the State Development Network (SDN) focused on increasing capacity at the district level for LEAs and system alignment for LEAs. Additionally, this collaboration has led toforming multiple task forces focused on initiatives such as the development of a task force within IDOE to begin work on reviewing and revising current RTI guidance to align with the framework for Multi-tiered Systems ofSupport and a task force to provide statewide recognition for schools implementing successful “Promising Practices”. These activities all demonstrate a quilting of silos at the state level to support improved practices andoverall student outcomes at the local level.
The new organizational structure within IDOE will ensure ongoing communication and problem solving among offices. The common goal of school improvement encompasses the SSIP work. The IDOE website providesnumerous resources which will allow for sustainable support for the SSIP at both the universal and targeted levels. Additionally, the collaborative work among offices will provide structure for future scaling up outside of theSDN. The established special education Indiana Resource Network (IRN) will meet quarterly to plan the provision of PD and TA to the SSIP schools focusing on instructional support of students with disabilities. Finally,planned TA to SDN site schools will provide sustainable support for the implementation of the identified coherent improvement strategies that align specifically to the SDN site schools participating in the SSIP.
Currently in Indiana, all schools are required to complete School Improvement Plans (SIP).Those schools identified as priority or focus schools are required to complete Student Achievement Plans (SAP). In addition, allelementary schools in Indiana are required to submit Reading Plans that identify the reading instruction and targets for supporting students at risk. Finally, the State Development Network (SDN) requires that all districtsparticipating in this initiative complete a High Quality Plan (HQP) identifying systemic alignment and improvement activities. Each of these plans focus on how to improve student outcomes, including outcomes for studentswith disabilities.
As a means to leverage and align the current required plans (HQP, SIP, SAP, and Reading Plans) with the SSIP work, site schools will be required to include goals that are focused on professional development, technicalassistance, and evidenced based practices for instruction that will be implemented to improve outcomes for students with disabilities and struggling learners. The work to ensure continuity among all plans will be a focal pointof the SSIP support provided to schools and LEAs.
The infrastructure changes to support the SSIP have already begun within the structure of the State Development Network. The LEAs that agree to be Partnering LEAs and designate site schools for SSIP implementation willhave additional requirements for aligning all plans, and maximizing the additional SDN funding in part or whole to support this work. A core group of Directors and Specialists from various Offices within the Division of SchoolImprovement will meet frequently to assess the need for additional changes in infrastructure.
The IDOE MTSS task force has submitted the final recommendations for guidance and this initiative is currently in its final stages of planning. The goal for introducing the MTSS framework, website launch and additionalProfessional Development Summits are still in the planning and approval stages. It is not certain when the IDOE supported MTSS Initiative will be launched. However, support for MTSS as an Evidence Based Practice willcontinue to be a foundation of the SSIP site school work.
Capacity building for systemic alignment within the SDN and site schools has also already begun. The LEAs have participated in intentionally planned PD for the district level staff focused on Data, Leadership and Instruction.The SSIP Instructional Practices Advisory Council has identified common language competencies and will present these to the Indiana Resource Network (IRN) providers to ensure that all SSIP schools are receiving thesame guidance and support to improve outcomes as planning for implementation occurs.
The structure of the Indiana Department of Education allows for an easier collaboration among offices. IDOE is divided into two structures to support schools. These are the Division of School Improvement, and the Division ofSupport Services. The members of the Core Team for the implementation of the SSIP include members from the Office of Special Education, Office of Outreach, Office of Early Learning and School Improvement Grants. Eachof these offices is included in the Division for School Improvement and report to the Assistant Superintendent for Division of School Improvement. These members bring a diverse perspective that helps to support the goals ofthe SSIP. Additionally, the Key Advisors to the SSIP Core Team include members from the State Development Network Districts, the Leadership Team for all of the offices within the Division of School Improvement, the CaseManagers for the SDN Districts, College and Career Ready Office, Early Learning and Intervention Office, the Indiana Resource Network providers, and the pilot school within the SDN. Additional extended participantsinclude representatives from the fiscal offices within Part B, Title 1 and state funds, the Executive Team for the Department of Education, parent support network, and individual Outreach Coordinators, the Special EducationAdvisory Council, the Indiana Council of Administrators, general and special education teachers, members from the Office of Student Assessment, and members from the Office of Accountability. Members from both the keyadvisors and feedback networks participate in formal and informal stakeholder meetings and will provide varying levels of support to improve the state infrastructure. Stakeholders have been involved in the development ofspecific plans and support for implementation through their involvement on the SSIP Stakeholder committee, or Instructional Practices Advisory Council. Many of these same members have also been involved in thedevelopment of the MTSS statewide supports, and are also supporting systemic alignment within the State Development Networks. Through the evaluation of implementation and measures of student’s outcomes, varyingmembers will continue to participate in providing feedback to the SSIP during Phase III.
Support for EIS programs and providers Implementation of Evidence-Based Practices
(a) Specify how the State will support EIS providers in implementing the evidence-based practices that will result in changes in Lead Agency, EIS program, and EIS provider practices to achieve the SIMR(s) for infants andtoddlers with disabilities and their families.(b) Identify steps and specific activities needed to implement the coherent improvement strategies, including communication strategies and stakeholder involvement; how identified barriers will be addressed; who will be in chargeof implementing; how the activities will be implemented with fidelity; the resources that will be used to implement them; and timelines for completion.(c) Specify how the State will involve multiple offices within the Lead Agency (and other State agencies such as the SEA) to support EIS providers in scaling up and sustaining the implementation of the evidence-based practicesonce they have been implemented with fidelity.
April 1, 2016- PHASE II Submission:
FFY 2016 Part B State Performance Plan (SPP)/Annual Performance Report (APR)
5/15/2018 Page 61 of 65

The support for implementation of the evidence based practices is embedded in several tiers. In the first tier, LEAs within the State Development Network (SDN) will receive guidance and professional development focused onsystem alignment and evidence based practices to support all eight Turnaround Principles. Each LEA is provided a Case Manager who completes monthly check in calls highlighting specific systemic alignment practicesand Turnaround Principles. The Case Managers also assist with providing resources and technical assistance to guide their implementation of the district wide High Quality Plan (HQP).
In the second tier, LEAs with SSIP site schools will receive additional intensive technical assistance to develop and align district goals and implementation planning within the district High Quality Plan (HQP), SchoolImprovement Plan (SIP) or Student Achievement Plan (SAP) and Reading Plan. The SDN districts will meet quarterly with IDOE staff and additional resource providers to receive intentional and targeted PD to support thedevelopment and coordination of systemic alignment. Each PD session provided to the SDN offers Evidence Based Practices (EBPs) for district improvement in three key Turnaround Principles: Leadership, Data, andInstruction.
In the third tier of support, site schools within the SDN will receive the most intensive assistance for implementation of the SSIP. They will receive technical assistance for MTSS implementation beginning during the 2016-17SY, and assistance developing and aligning their district HQP to specific areas of Root Cause within their individual schools. The site schools will receive an on-site visit focused on determining potential areas of root causefor poor reading achievement outcomes for stude nts with disabilities and struggling learners. During the Root Cause Analysis on-site visit, classroom observations during reading instruction in grades K-3 will becompleted, along with interviews of all providers of reading instruction, or reading interventions. This visit will be followed up with the building leaders completing a Partner's Inventory aligned to the Turnaround Principles withdistrict level administrator support. The findings from this visit will be shared with school and district level staff via a formal report with recommendations aligned to the areas of root cause and the menu of EBPs that wereidentified as high leverage practices by the Instructional Practices Advisory Council for the SSIP. Coordinated technical assistance and professional development will be embedded within all the district and school requiredplans based on these recommendations and LEA and school leader decisions.
IDOE used a group of stakeholders, (Instructional Practices Advisory Committee) to review the Evidence Based Practices (EBPs) that were identified by the National Center for Systemic Improvement as “high leverage”practices for addressing the areas of root cause that were identified during PHASE I. Additionally, all of these practices were evaluated based on their capacity to meet the needs of all students, including those with disabilitiesor struggling to learn, by upholding rigorous academic standards and high expectations for all. These practices were in support of improving quality reading instruction, improving early literacy instruction, and increasinghigh expectations within leaders and teachers for students with disabilities and struggling learners. Additional research for best practices was provided for systemic alignment, and Multi-tiered Systems of Support. TheInstructional Practices Advisory Council (IPAC), included experts from IDOE in the area of Reading, Early Learning, Outreach, and Special Education, as well as outside experts in the area of PBIS, UDL and InclusivePractices. This team reviewed each practice and selected practices based on their alignment to the areas of needs, potential for successful implementation and support for improving outcomes for students with disabilities withregard to the Indiana’s State Identified Measureable Result (SiMR). It was determined through the activities of the pilot school that providing a menu of these practices within the Root Cause Analysis (RCA) visit report thatalign specifically to the needs of the school would allow for individual school autonomy and would address possible adaptive challenges.
The following bulleted points identify the requisite Implementation Drivers or the key components of capacity building and infrastructure development that will influence successful implementation of the SSIP in Indiana. Theseare the core components needed to initiate and support classroom, building, and district level change. These have been identified as possible drivers that may vary depending on the individual needs of the districts, schools,and classrooms that are participating in the SSIP. The SSIP Core team within each site school will evaluate their planning for implementation and individual selection of EBPs against the Implementation Driver rubric. Identified levels of support for implementation within each driver for the selected EBPs will be contingent on the specific site school needs and this evaluation process. These drivers will be evaluated after the completion of theRCA visit report, and during the development of the HQP and site school’s SIP and Reading Plans.
Competency Drivers:Recruitment/Selection of Staff (within current school infrastructure or outside, coaches, leaders, etc.) to utilize EBPsTraining needs for staff around use of EBPsCoaching needs to support implementation and fidelity of EBPs usePerformance and Assessment of Fidelity of implementation of EBPs
Organization Drivers:Decision/ Support Data Systems that will ensure outcomes of implementation, both with regard to fidelity of implementation,and students outcomes related to the selected EBPsFacilitative Administrative Supports needed for EBPs (implementation team structure, policies and procedures, use/utilizationof data to inform work, reduction of barriers)Systems Intervention, what is needed to address barriers within the system for implementation of the EBPs, protocols, andleadership capacity
Leadership Drivers:Technical Leadership needs related to the implementation of selected EBPs (reasons for changes, guidance for expectationsand clarity about what needs to be done)Adaptive Leadership needs with alignment of the implementation of selected EBPs to the goals, vision and mission of theLEA, and school, and levels of communication to meet needs of staff.
In order to provide the TA/PD needed to support the implementation of the EBPs that a site school has selected, IDOE will work collaboratively with the Key Advisors to identify which supports would align best to the selectedEBPs and RCA needs as well as the evaluation of the Drivers for Implementation of those EBPs selected. The additional TA/PD required to support the selected EBP will be provided in combination by the Indiana ResourceNetwork staff, or possibly by an outside PD provider if this is appropriate. See the Menu of Evidence Based Practices found in Appendix B of the Comprehensive Manual for Implementation. IDOE will provide support to the siteschool SSIP teams for planning and ongoing implementation evaluation. IDOE SSIP Core Team members will participate in monthly SDN and SSIP calls with site schools to ensure effective implementation of all plans thatsupport SSIP goals.
As a part of the SSIP implementation process, regular evaluation of the Partnering LEAs and SSIP site schools’ plans and practices will be reviewed. As progress with implementation drivers is made, additional scaling up ofthe practices will be supported. Additionally, information regarding the outcomes of these practices will be shared within the SDN and also through the Promising Practices- Making It Happen initiative as a means toencourage non-SDN LEASs/ schools to consider these practices as a means to improve outcomes for all students.
Please see the attached Comprehensive Manual for Implementation- IN-SSIP- specific steps and tools that will be used during each step of implementation can be found within this comprehensive manual.
Evaluation
(a) Specify how the evaluation is aligned to the theory of action and other components of the SSIP and the extent to which it includes short-term and long-term objectives to measure implementation of the SSIP and its impact onachieving measurable improvement in SIMR(s) for infants and toddlers with disabilities and their families.(b) Specify how the evaluation includes stakeholders and how information from the evaluation will be disseminated to stakeholders.(c) Specify the methods that the State will use to collect and analyze data to evaluate implementation and outcomes of the SSIP and the progress toward achieving intended improvements in the SIMR(s).(d) Specify how the State will use the evaluation data to examine the effectiveness of the implementation; assess the State’s progress toward achieving intended improvements; and to make modifications to the SSIP as necessary.
April 1, 2016- PHASE II Submission:
Indiana has utilized the Leading by Convening tools for engaging stakeholders. Specifically identifying circles of participation and potential roles that various stakeholders can play in the Indiana SSIP. It is through these toolsthat additional stakeholders have continued to be identified and will continue to be identified as the SSIP plan begins to move into Phase III within the partner LEAs and site schools involved in the SSIP. The large groupfeedback network identified as the SSIP Stakeholder Committee has met quarterly during Phase I and Phase II of the SSIP implementation process. Members of this group were initially invited to participate during Phase I asrepresentatives of various education organizations, parent support organizations, IDOE departments, and education related roles. Members have continued to be added as the planning has evolved during Phase II. It isplanned that this large group will continue to meet quarterly either in person or virtually in order to review and gather evaluation feedback for Phase III of implementation. As evidenced in the visual display of the Indiana SSIPCircles of Participation, varying stakeholders are part of this feedback network and also play other roles.
Implementation and outcomes will be measured with data sources including interviews and focus groups with key stakeholders; professional development and meetings; review of process documents and records includingprofessional development material; school demographic data; student performance results including benchmark assessments, and results on state standardized tests.
During the infrastructure analysis conducted in Phase I and development of the TOA, Indiana identified the SDN as an existing initiative that will be used to support the collection of data related to implementation of EBPs andthe impact on student performance. Indiana reviewed data extensively to determine SSIP sample group within the SDN is representative of the state population. This data will continue to be reviewed, with the support of an
FFY 2016 Part B State Performance Plan (SPP)/Annual Performance Report (APR)
5/15/2018 Page 62 of 65
external evaluator, to ensure consistency. Each time data is collected, the criteria will be analyzed according to short, medium and long term outcomes. In addition, current SDN protocols used for data collection are beingreviewed and aligned to accurately reflect the data collection requirements of the SSIP and SIMR.
The SSIP process and intended outcomes will be continuously evaluated throughout implementation. Feedback loops were carefully designed to reflect the Theory of Action and align with the Logic Model to provide aframework to evaluate, reflect and inform course corrections.
Within the feedback loop, Indiana has included evidence collection at each stage to ensure active monitoring and successful implementation. For each evidence stage, Indiana is collecting documentation such as materials,agendas, and evaluations of engagement and is developing tools for collecting data related to implementation fidelity and outcomes. This type of evidence will be collected throughout technical assistance and professionaldevelopment related to RCA, District Data Review, and EBPs. In addition, rubrics and protocols are being developed to guide coaching, classroom observation and impact of implementation of EBPs. As evidence is collected,it will be analyzed to determine the effectiveness of professional development, fidelity of implementation, and impact on student performance. Indiana will continuously monitor and make appropriate adjustments to SSIP toreflect feedback and data.
Please see attached Comprehensive Implementation Manual which includes graphics and descriptions of various steps within the Evaluation Process.
Technical Assistance and Support
Describe the support the State needs to develop and implement an effective SSIP. Areas to consider include: Infrastructure development; Support for EIS programs and providers implementation of EBP; Evaluation; andStakeholder involvement in Phase II.
April 1, 2016- Phase II Submission:
IDOE leveraged the assistance from the National Center for Systemic Improvement (NCSI) and other federally funded TA Centers throughout SSIP Phase I and II development and initial implementation as follows:
Participation in bi-weekly to monthly check in calls to: 1) discuss timelines, tools, and resources to support SSIP development andimplementation; 2) deliberate outstanding or emerging questions concerning the SSIP; 3) identify areas where support is needed;4) problem solve specific issues or emerging barriers/challenges; 5) identify opportunities to collaborate and coordinate with otherTA providers and/or states.Guidance - including modeling - of facilitated activities to secure broad stakeholder engagement and input into the analysis anddesign of SSIP recommendations. Specifically in the identification and selection of the evidence-based practices prioritized withinSSIP strategies.Participation in NCSI’s Systems Alignment Cross State Learning Collaborative and the subsequent virtual meetings to supportIndiana efforts to align school turn around/improvement efforts and the SSIP. Specific support in IDOE’s logic model and theory ofaction.Guidance and support in the SiMR revisions and related benchmarks.Identification of evidence-based literacy instruction, high-leverage instructional strategies, and leadership school turn aroundstrategies, via a NCSI technical assistance response.Identification of existing observation rubrics assessing literacy instruction, via a NCSI technical assistance requests.Coordinated discussion between IDOE and the South Carolina Department of Education to facilitate collaboration and coordinationconcerning the modification of IDC’s Success Gap Rubric to meet comparable SSIP approaches.Identification of universally available tools and resources to support preservice and in-service professional learning in the identifiedevidence-based practices (e.g. CEEDAR Early Reading Innovation Configurations and Course Enhancement Modules).
IDOE plans to continue this level of collaboration and coordination with NCSI as follows:
Consult and problem solve on strategies to advance and monitor fidelity of implementation at both the SEA and LEA levels.Development and refinement of the co-drafted literacy instruction observation rubric from the CEEDAR and NCSI Center.Training concerning the use of the literacy observation rubric and/or CEEDAR’s K-5 Reading Instruction Course EnhancementModule, as needed and requested.Continued participation in the Systems Change Cross State Learning Collaborative. As desired, participation in the Literacy CrossState Learning Collaborative.Continued guidance concerning data collection toward benchmarks and targets.
Additionally, IDOE intends to utilize the strong infrastructure of Stakeholder engagement and participation established for the Indiana SSIP and identified in Appendix E of the Comprehensive Manual for Implementation of theIN-SSIP. That said, the IDOE SSIP Team Leader will develop a schedule for regular check in calls, virtual and/or face to face meetings with the national and Indiana Resource Network TA providers, SDN Case Managers, andPartnering LEAs/Site School SSIP Teams to ensure technical assistance activities are aligned with expectations within the SSIP and being provided as needed to support the plans of the Partnering LEAs. This communicationwill also allow for opportunities to leverage all available TA resources to provide the type of professional learning and support needed to strengthen teacher and leader practice. These meetings will involve monthly/bi-monthlyprogress/status reports from each respective TA Center as well as SSIP Partnering LEA and Site Schools. These reports will demonstrate the centers' purposeful alignment and support of the SSIP.
Phase III submissions should include:
• Data-based justifications for any changes in implementation activities.• Data to support that the State is on the right path, if no adjustments are being proposed.• Descriptions of how stakeholders have been involved, including in decision-making.
A. Summary of Phase 3
1. Theory of action or logic model for the SSIP, including the SiMR.2. The coherent improvement strategies or principle activities employed during the year, including infrastructure improvement strategies.3. The specific evidence-based practices that have been implemented to date.
FFY 2016 Part B State Performance Plan (SPP)/Annual Performance Report (APR)
5/15/2018 Page 63 of 65

4. Brief overview of the year’s evaluation activities, measures, and outcomes.5. Highlights of changes to implementation and improvement strategies.
Please see attached report
B. Progress in Implementing the SSIP
1. Description of the State’s SSIP implementation progress: (a) Description of extent to which the State has carried out its planned activities with fidelity—what has been accomplished, what milestones have been met, andwhether the intended timeline has been followed and (b) Intended outputs that have been accomplished as a result of the implementation activities.2. Stakeholder involvement in SSIP implementation: (a) How stakeholders have been informed of the ongoing implementation of the SSIP and (b) How stakeholders have had a voice and been involved in decision-makingregarding the ongoing implementation of the SSIP.
Please see attached report
C. Data on Implementation and Outcomes
1. How the State monitored and measured outputs to assess the effectiveness of the implementation plan: (a) How evaluation measures align with the theory of action, (b) Data sources for each key measure, (c) Description ofbaseline data for key measures, (d) Data collection procedures and associated timelines, (e) [If applicable] Sampling procedures, (f) [If appropriate] Planned data comparisons, and (g) How data management and data analysisprocedures allow for assessment of progress toward achieving intended improvements2. How the State has demonstrated progress and made modifications to the SSIP as necessary: (a) How the State has reviewed key data that provide evidence regarding progress toward achieving intended improvements toinfrastructure and the SiMR, (b) Evidence of change to baseline data for key measures, (c) How data support changes that have been made to implementation and improvement strategies, (d) How data are informing next stepsin the SSIP implementation, and (e) How data support planned modifications to intended outcomes (including the SIMR)—rationale or justification for the changes or how data support that the SSIP is on the right path3. Stakeholder involvement in the SSIP evaluation: (a) How stakeholders have been informed of the ongoing evaluation of the SSIP and (b) How stakeholders have had a voice and been involved in decision-making regarding theongoing evaluation of the SSIP
Please see attached report
D. Data Quality Issues: Data limitations that affected reports of progress in implementing the SSIP and achieving the SIMR
1. Concern or limitations related to the quality or quantity of the data used to report progress or results2. Implications for assessing progress or results3. Plans for improving data quality
Please see attached report
E. Progress Toward Achieving Intended Improvements
1. Infrastructure changes that support SSIP initiatives, including how system changes support achievement of the SiMR, sustainability, and scale-up2. Evidence that SSIP’s evidence-based practices are being carried out with fidelity and having the desired effects3. Outcomes regarding progress toward short-term and long-term objectives that are necessary steps toward achieving the SIMR4. Measurable improvements in the SIMR in relation to targets
Please see attached report
F. Plans for Next Year
1. Additional activities to be implemented next year, with timeline2. Planned evaluation activities including data collection, measures, and expected outcomes3. Anticipated barriers and steps to address those barriers4. The State describes any needs for additional support and/or technical assistance
Please see attached report
FFY 2016 Part B State Performance Plan (SPP)/Annual Performance Report (APR)
5/15/2018 Page 64 of 65
Certify and Submit your SPP/APR
Name: Nancy Zemaitis
Title: Assistant Director, Office of Sped
Email: [email protected]
Phone: 317-232-0568
I certify that I am the Chief State School Officer of the State, or his or her designee, and that the State's submission of its IDEA Part B State Performance Plan/AnnualPerformance Report is accurate.
Selected: Designated by the Chief State School Officer to certify
Name and title of the individual certifying the accuracy of the State's submission of its IDEA Part B State Performance Plan/Annual Performance Report.
IntroductionIndicator 1Indicator 2Indicator 3AIndicator 3BIndicator 3CIndicator 4AIndicator 4BIndicator 5Indicator 6Indicator 7Indicator 8Indicator 9Indicator 10Indicator 11Indicator 12Indicator 13Indicator 14Indicator 15Indicator 16Indicator 17
FFY 2016 Part B State Performance Plan (SPP)/Annual Performance Report (APR)
5/15/2018 Page 65 of 65