fge texas project application for psd greenhouse gas ... · application for a prevention of...
TRANSCRIPT


� � � � � � � � � � �� � � � �


APPLICATION FOR A PREVENTION OF SIGNIFICANT DETERIORATION AIR QUALITY PERMIT
FOR GREENOUSE GAS EMISSIONS FOR THE FGE TEXAS PROJECT
Prepared for
FGE Texas, LLC c/o FGE Power, LLC
21 Waterway Avenue, Suite 300 The Woodlands, TX 77380
Attn: Emerson Farrell (281) 362-2830
Prepared by
SWCA Environmental Consultants 3033 North Central Avenue, Suite 145
Phoenix, Arizona 85012 (602) 274-3831 www.swca.com
SWCA Project No. 23583
May 2013


i
CONTENTS
1.0 INTRODUCTION ................................................................................................................................ 1 Project Description ................................................................................................................................. 3 Project Scope .......................................................................................................................................... 4 Application Organization ....................................................................................................................... 5
2.0 TCEQ FORMS ..................................................................................................................................... 6
3.0 AREA MAP AND PLOT PLAN ......................................................................................................... 6
4.0 PROCESS DESCRIPTION ................................................................................................................. 6 Natural Gas—Fired Combustion Turbines ............................................................................................. 7 TCEQ Form PI-1 .................................................................................................................................... 8 Reciprocating Internal Combustion Engines ........................................................................................ 34 Fugitive Emissions ............................................................................................................................... 35
Natural Gas Piping ......................................................................................................................... 35 Electrical Equipment Insulated with Sulfur Hexafluoride ............................................................. 35
Other Equipment .................................................................................................................................. 35 Condenser and Cooling Tower ...................................................................................................... 35 Diesel Storage Tanks ..................................................................................................................... 35 Lube Oil Reservoirs ....................................................................................................................... 36 Aqueous Ammonia Storage and Unloading System ...................................................................... 36
5.0 GREENHOUSE GAS EMISSION CALCULATIONS ................................................................... 36 Natural Gas–Fired Combustion Turbines ............................................................................................. 38 Reciprocating Internal Combustion Engines ........................................................................................ 38 Fugitive Emissions ............................................................................................................................... 39
Natural Gas Piping ......................................................................................................................... 39 Electrical Equipment Insulated with Sulfur Hexafluoride ............................................................. 39
Emission Summary ............................................................................................................................... 40
6.0 STATE AND FEDERAL REGULATORY REQUIREMENTS .................................................... 40 State Requirements ............................................................................................................................... 40 Federal Major New Source Review / Prevention of Significant Deterioration .................................... 40 New Source Performance Standards .................................................................................................... 48 National Emission Standards for Hazardous Air Pollutants ................................................................. 48
7.0 BEST AVAILABLE CONTROL TECHNOLOGY ........................................................................ 49 BACT Assessment Methodology ......................................................................................................... 49
Step 1 – Identify Control Technologies ......................................................................................... 49 Step 2 – Eliminate Technically Infeasible Options ........................................................................ 50 Step 3 – Rank Remaining Control Technologies by Control Effectiveness .................................. 51 Step 4 – Evaluate Most Effective Controls and Document Results ............................................... 51 Step 5 – Most effective control alternative not eliminated selected as BACT .............................. 51
BACT for Combustion Turbines .......................................................................................................... 52 Step 1 – Identify All Available Control Technologies .................................................................. 52 Step 2 – Eliminate technically Infeasible Options ......................................................................... 63

ii
Step 3 – Rank Remaining Control Technologies ........................................................................... 65 Step 4 – Evaluate and Document remaining Control Technologies .............................................. 66 Step 5 – Select BACT .................................................................................................................... 69
BACT for Diesel Engines ..................................................................................................................... 70 Step 1 – Identify All Available Control Technologies .................................................................. 71 Step 2 – Eliminate Technically Infeasible Options ........................................................................ 71 Step 3 – Rank Remaining Control Technologies ........................................................................... 71 Step 4 – Evaluate and Document Remaining Control Technologies ............................................. 71 Step 5 – Select BACT .................................................................................................................... 71
BACT for Fugitive Emissions .............................................................................................................. 72 Step 1 – Identify All Available Control Technologies .................................................................. 72 Step 2 – Eliminate Technically Infeasible Options ........................................................................ 72 Step 3 – Rank Remaining Control Technologies ........................................................................... 72 Step 4 – Evaluate and Document Remaining Control Technologies ............................................. 72 Step 5 – Select BACT .................................................................................................................... 72
Electrical Equipment Insulated with Sulfur Hexafluoride ................................................................... 73 Step 1 – Identify All Available Control Technologies .................................................................. 73 Step 2 – Eliminate Technically Infeasible Options ........................................................................ 73 Step 3 – Rank Remaining Control Technologies ........................................................................... 74 Step 4 – Evaluate and Document Remaining Control Technologies ............................................. 74 Step 5 – Select BACT .................................................................................................................... 74
Summary of Proposed BACT ............................................................................................................... 75
8.0 ADDITIONAL REQUIREMENTS UNDER PSD........................................................................... 76 Federal Endangered Species Act .......................................................................................................... 76 National Historic Preservation Act ....................................................................................................... 76
9.0 PROPOSED EMISSION AND OPERATIONAL REQUIREMENTS ......................................... 76 Proposed Emission Limits .................................................................................................................... 77
Requirements for Combustion Turbines ........................................................................................ 78 Proposed Work Practice and Monitoring Requirements ...................................................................... 78
Combustion Turbines ..................................................................................................................... 78 Emergency Engines ....................................................................................................................... 80 Fugitive Emissions ......................................................................................................................... 80
Proposed Startup and Shutdown Limits ............................................................................................... 80 Combustion Turbines ..................................................................................................................... 80
Proposed Recordkeeping Requirements ............................................................................................... 81 Proposed Performance Testing Requirements ...................................................................................... 82
Combustion Turbines ..................................................................................................................... 82

iii
Appendices A. GHG Emission Calculations B. Equipment Specifications C. Summary of Recently Issued GHG permits and Pending Applications Under Review
for Combustion Turbines D. Texas Professional Engineer Certification
Figures Figure 1. General location of the project area. ............................................................................................. 2 Figure 2. Area map. .................................................................................................................................... 27 Figure 3. FGE Texas Project – Phase I Site Layout ................................................................................... 28 Figure 4. FGE Texas Project – Phase I Plant Layout ................................................................................. 29 Figure 5. FGE Texas Project – Phase II Site Layout ................................................................................. 30 Figure 6. Combined Cycle Combustion (Phase I-II).................................................................................. 31 Figure 7. Emergency Diesel Engines. ........................................................................................................ 32 Figure 8. Existing and planned CO2 pipelines in relation to the FGE Texas Project. ................................ 57 Figure 9. SACROC Oil Field in relation to the FGE Texas Project. ......................................................... 59
Tables Table 1. Global Warming Potentials .......................................................................................................... 37 Table 2. Summary of Project Annual GHG Potential to Emit ................................................................... 37 Table 3. Summary of Diesel-Fired Engines Annual GHG Potential to Emit ............................................. 39 Table 4. Summary of SF6 Insulated Circuit Breaker Annual GHG Potential to Emit ................................ 40 Table 5. Summary of Small-Scale CO2 Post-Combustion Capture Projects .............................................. 55 Table 6. Emissions of CO2 from Solid and Gaseous Fuels Available For Use in Combustion
Turbines ............................................................................................................................................ 60 Table 7. Turbine Efficiency BACT ............................................................................................................ 61 Table 8. Summary of Estimated Costs for Carbon Capture, Transport, and Storage for the FGE
Texas Project (per power block) ....................................................................................................... 68 Table 9. FGE Proposed BACT Consisting of Inherently Lower-emitting Processes, Practices, and
Designs ............................................................................................................................................. 70 Table 10. Summary of Proposed BACT for Combustion Turbines, Emergency RICEs, and Fugitive
Emissions .......................................................................................................................................... 75 Table 11. Phase I/II Facility – Combustion Turbine Emission Limits ....................................................... 77 Table 12. Phase I/II Facility - Emergency Engine Emission Limits .......................................................... 77 Table 13. Phase I/II Facility- Fugitive Emission Limits ............................................................................ 77

iv
This page intentionally left blank.

1
1.0 INTRODUCTION In accordance with the terms of the federal Prevention of Significant Deterioration (PSD) regulations, FGE Power, LLC (FGE) is applying to the U.S. Environmental Protection Agency (EPA) Region 6 for a PSD permit to construct a greenfield electric generating station and ancillary equipment on an approximately 200-acre site located approximately 3.5 miles south-southwest of the intersection of Interstate 20 and Main Street in Westbrook, Mitchell County, Texas. Figure 1 provides the general location of the project area. FGE proposes to designate the project as the “FGE Texas Project.” The FGE Texas Project will include two combined cycle power blocks, each in a 2-on-1 configuration (two combustion turbines, two supplementally fired (duct burners) heat recovery steam generators [HRSGs], and one steam turbine). The four natural gas–fired combustion turbines (CTs) will be Alstom GT24s, each nominally rated at 230.7 megawatts (MW) gross output (including once-through cooling [OTC] energy) at International Organization for Standardization (ISO) conditions (237 MW at 5 degrees Fahrenheit [°F] and 55% relative humidity [RH] and 201 MW at 95 °F and 20% RH).1 The steam turbine generator is designed to produce up to approximately 336 MW gross of electrical output with duct firing (5 °F and 55 RH %). Alstom’s rated output for a single combined cycle power block is 810 MW, gross (5 °F and 55% RH).2
Benefits of the Project
The FGE Project will provide approximately 1,600 MWs of power that may be dispatched to Northern or Western Texas. The project will contribute to the power needed to address the shortage and reliability issues facing the Texas electrical grid managed by the Electric Reliability Council of Texas (ERCOT). Studies and analysis conducted by or on behalf of ERCOT, the Public Utility Commission of Texas (PUC), and the North American Electric Reliability Corporation have concluded that the margins of electrical production necessary to meet peak demand are or soon will be insufficient. The results could include rolling brownouts or blackouts at certain times and in certain areas of the state. Construction of new electricity generation capacity is critical for the state. The FGE Texas Project provides a significant contribution to new generation.
The location of the FGE Project is such that it can connect to transmission lines to North Texas to provide power to the large and growing population of the Dallas-Forth Worth area, and can provide power to the growing areas around Austin in Georgetown, Round Rock and other communities surrounding Austin. The plants will also be able to connect to transmission lines to West Texas where oil drilling and production from conventional and shale formations have led and will lead to even greater need for electricity from both drilling and the growth of the population and businesses in the area.
The FGE Project as described in more detail below will be some of the most efficient natural gas plants upon commissioning of the plants. The plants will achieve one of the lowest heat rates, one of the measures of efficiency for power plants, in the state, and have the ability to achieve up to 55% efficiency.
The location of the FGE Project has another benefit. Being located between the approximately 10,000 MW of wind power generation in West Texas and the power demand centers, such as the Dallas-Fort Worth area, the plants will provide a supplemental and balancing capability to the grid during periods of low wind conditions. Thus, the FGE Project will contribute to the ability to use renewable power generation.
1 Obtained from Alstom’s “Technical Performance – The Next Generation GT24”, available at: http://www.alstom.com/Global/Power/Resources/Documents/Brochures/next-generation-gt24-gas-turbine-performance.pdf. Accessed October 2012. 2 Alstom turbine performance data represents the maximum value from all normal and LLOC operating scenarios. A copy of the performance test data is included in Appendix B of the application submittal.

2
Figure 1. General location of the project area.

3
Project Summary
On June 3, 2010, the EPA promulgated a final rule, known as the GHG Tailoring Rule, for permitting GHGs under the PSD air permitting program.3 According to the final rule, new sources having the potential to emit more than 100,000 tons per year (tpy) of GHGs, on a carbon dioxide equivalent (CO2e) basis, and modifications to existing facilities increasing GHG emissions more than 75,000 tpy on a CO2e basis are subject to GHG PSD review.
The FGE Texas Project will have GHG emissions in excess of 100,000 tpy and therefore triggers PSD review for GHG regulated pollutants. Therefore, this application is limited to requesting a permit for the emissions of greenhouse gasses (GHGs) and includes a project description and scope, GHG emission calculations, regulatory applicability determination, GHG Best Available Control Technology (BACT) analysis, and proposed GHG emission limits, monitoring, operational, recordkeeping, and performance testing requirements.
Although the state of Texas has been delegated the authority by EPA under its State Implementation Plan (SIP) for operating the PSD and New Source Review (NSR) programs within the state, Texas has yet to revise the SIP to incorporate the permitting of GHG emissions. As such, EPA signed a Federal Implementation Plan (FIP) authorizing the EPA Region 6 to issue permits in Texas for GHG emissions until approval of a SIP incorporating the permitting of such pollutant emissions.4 For the permitting of non-GHG pollutants, FGE is submitting concurrently with this application an Air Quality New Source Review (NSR) Initial Permit Application for approval to construct to the Texas Commission on Environmental Quality (TCEQ).
Project Description The proposed facility would be constructed in two phases, with Phase I consisting of a single power block operating in combined-cycle mode. Phase I is anticipated to begin construction in November 2013 with operations beginning in April of 2016. A second power block consisting of an additional 2-on-1 combined-cycle power block is anticipated to begin construction as soon as March 2014, with operations commencing as early as August 2016 as Phase II. The base load generation capacity of the proposed electric generating facility, at the completion of Phase II, will be a nominal rating of 1,620 MW (gross).
Selective catalytic reduction (SCR) will be employed as Best Available Control Technology (BACT) for emissions of oxides of nitrogen (NOX). In addition, FGE is proposing an oxidation catalyst to reduce emissions of carbon monoxide (CO) and volatile organic compounds (VOCs) from the Alstom GT24s. All of the proposed CTs and duct burners will be fired exclusively with pipeline-quality natural gas. A detailed process description is included in Section 4 of this application.
At completion, the proposed FGE Texas Project would include the following emission sources: • Four (4) natural gas–fired combustion turbines with natural gas–fired duct burners including
planned maintenance, startup and shutdown (MSS) activities; • Two (2) induced draft mechanical wet cooling towers; • Two (2) emergency diesel firewater pump engines; • Two (2) emergency diesel electrical generator engines; • Two (2) 1,250-gallon diesel storage tanks (one per firewater pump engine);
3 Published in the Federal Register, Vol. 75 No. 106, June 3, 2010, available at: http://www.gpo.gov/fdsys/pkg/FR-2010-06-03/pdf/2010-11974.pdf Accessed November 2012. 4 Published in the Federal Register, Vol. 76 No. 85, May 3, 2011, available at: http://www.gpo.fdsys/pkg/FR-2011-05-03/pdf/2011-10285.pdf. Accessed November 2012.

4
• Two (2) 2,000-gallon diesel storage tanks (one per electrical generator engine); • Two (2) 19% aqueous ammonia storage tanks; • Fugitive ammonia and natural gas emissions from piping components; and • Fugitive emission from electrical equipment insulated with sulfur hexafluoride (SF6).
The project will exceed the PSD applicability threshold of 100,000 tons per year (tpy) for GHG emissions; therefore, a GHG BACT review has been conducted for the combustion turbines, the emergency firewater pump engine, the emergency electrical generator, and fugitive GHG emission sources associated with the proposed FGE Texas Project. The combustion turbines will be fired exclusively with pipeline-quality natural gas, and the emergency engines will be fueled exclusively with ultra-low sulfur diesel (ULSD).
The project schedule is dependent on a number of key milestones such as issuance of the GHG and NSR permits, financial closure, start of construction, and start of commercial operation. The permits required to start construction include the PSD permit issued by EPA Region 6 and the NSR permit issued by TCEQ. However, to complete the financial closure of the project the permits must be issued by October 2013. The planned commencement of construction is November 2013, with a projected start of commercial operation of April 2016.
Project Scope The objective of the FGE Texas Project is to provide the most efficient natural gas combined-cycle facility in the marketplace and to serve the growing electrical capacity, energy, and ancillary services market within the historical Electric Reliability Council of Texas (ERCOT) North and West Nodal Zones. The project’s point of interconnection with the ERCOT transmission grid will also facilitate providing comparable services to the ERCOT West Marketplace. However, current market needs and economic support is forecasted to result in a vast majority of the customers served to be located with the ERCOT North Nodal Zones.
The project is critical to the continued reliability and load servicing capability of the ERCOT grid due to a continuing erosion in reserve margins, which are currently projected to fall below the ERCOT grid’s stated planning reserve of 13.75% in 2014.5 Additionally, if incremental capacity is not built, it is forecasted that there will be very limited to negative reserves by the 2017 to 2018 timeframe, thus resulting in the grid’s inability to meet customer demands at that time. This critical issue for the state of Texas’ electric marketplace, regional and local economic development, and citizenship is currently the focus of an intensive, comprehensive process by the Public Utility Commission of Texas, the ERCOT Grid Operator, and numerous constituents throughout the state. While this process is moving as quickly as possible, it is unclear what market structure changes will result of these activities. However, a respected and prominent independent advisor to ERCOT, the Brattle Group, has submitted a report to ERCOT Board of Directors and the Public Utility Commission, which indicates significant and meaningful changes must be made to provide a meaningful opportunity to satisfy this critical shortfall.
While the Texas power markets serve approximately 22,000,000 customers in the aggregate, the target market for the FGE Texas Project is the historical ERCOT North footprint which includes both the rapidly growing Dallas–Fort Worth Metroplex, and the area around Austin, such as Round Rock, Georgetown, and other communities. This area encompasses a population of over 8,000,000 customers and represents the fastest-growing segment within the ERCOT market. The plant will also be able to
5 The Brattle Group. 2012. ERCOT The Texas Connection – Report on the Capacity, Demand, and Reserves in the ERCOT Region. May 2012. Available at: http://www.ercot.com/content/news/presentations/2012/CapacityDemandandReserveReport-2012.pdf. Accessed November 20, 2012.
5
contribute to meeting the growing electrical demand resulting from population and business growth in the West Texas area from oil and gas development.
As previously discussed, FGE proposed to install four Alstom GT24 combined cycle combustion turbines (CCCT) at the FGE Texas Project in order to supply power during high demand. The Alstom technology will allow for proposed facility to operate with the highest base and part load efficiency, unprecedented part-load efficiency. According to Alstom, the next generation GT24 turbines are capable of delivering more than 55% efficiency (heat rate of 5,690 Btu/kWh) while operated in combined cycle mode.6 This is comparable to other similar classes of natural gas-fired combined cycle combustion turbines in the market.
The Alstom turbines are unique in that the turbines can be operated in a current BACT compliant Low Load Operating (LLO) mode (“parking feature”). Using sequential combustion technology, the LLO is achieved by turning the second combustor off, while the first combustor maintains operation at its optimal point allowing the full combined cycle power block to be parked at a significantly reduced minimum load point (approximately 8 to 10 percent of maximum load). Because the first combustor maintains operation at its optimal point, each power block while operating in the parking feature will maintain compliance with greater than 50 percent to base load emission concentrations. In addition, the parking feature is uniquely configured to allow the power block to provide more than 450 MW to the grid in approximately 10 minutes without risk of start failure or excessive wear. 7
The Alstom technology was selected in part for its very broad operating range, thus optimizing the potential to provide critical grid support and ancillary services to the ERCOT marketplace, as well as having heat rate profiles which are approximately 6% to 7% more efficient than competing technology options. Additionally, FGE has secured power block pricing that is substantially below the values requested by competing technology providers. As discussed above, this operating flexibility and efficiency will provide significant benefits to the ERCOT grid when integrating the roughly 10,000 MW of intermittent wind energy resources located between their West Texas location and the load centers of the market, all of which are over 250 miles east of the predominate location of the wind energy projects.
Application Organization The following list provides the individual section summary of the application:
• Section 2.0 of this application provides documents including: Form PI-1 General Application for Air Preconstruction Permit, TCEQ Core Data Form, TCEQ Table 2 – Material Balance, TCEQ Table 6 – Boilers and Heaters, TCEQ Table 29 – Reciprocating Engine, and TCEQ Table 31 – Combustion Turbine.
• Section 3.0 includes an area map and plot plans that show the approximate location of the project with property lines and the proposed layout of the FGE Texas Project.
• Section 4.0 provides a detailed description of the operations and a discussion of the emission sources located at this proposed project, including process flow diagrams.
• Section 5.0 provides a discussion of the methodology used for the emission calculations and TCEQ Table 1(a) – Emission Point Summary.
6 Obtained from Alstom’s “Technical Performance – The Next Generation GT24”, available at: http://www.alstom.com/Global/Power/Resources/Documents/Brochures/next-generation-gt24-gas-turbine-performance.pdf. Accessed October 2012. Note: Gas turbine performance calculated with 100% methane (lower heating value) ISO conditions. 7 Obtained from Alstom’s “Technical Performance – The Next Generation GT24”, available at: http://www.alstom.com/Global/Power/Resources/Documents/Brochures/next-generation-gt24-gas-turbine-performance.pdf. Accessed October 2012).

6
• Section 6.0 of this application includes a discussion of applicable and potentially applicable state and federal regulations.
• Section 7.0 provides the top-down BACT analysis. • Section 8.0 discusses the additional requirements under PSD. • Section 9.0 provides the proposed emissions and operational limits. • Appendix A provides emission calculations. Appendix B contains equipment specifications for
various units at the project. Appendix C contains a summary of recently issued GHG permits and pending applications under review for natural gas-fired combustion turbines. Appendix D provides the Texas Professional Engineer (P.E.) certification statement.
2.0 TCEQ FORMS This application includes the following administrative forms:
• TCEQ Form PI-1 • TCEQ Core Data Form • TCEQ Table 2 – Material Balance • TCEQ Table 6 – Boilers and Heaters • TCEQ Table 29 – Reciprocating Engines • TCEQ Table 31 – Combustion Turbines
A Professional Engineer (P.E.) review has been conducted on the emission estimates. The P.E. seal is included within Appendix D of this submittal.
3.0 AREA MAP AND PLOT PLAN The FGE Texas Project is located approximately 3.5 miles south-southwest of the intersection of Interstate 20 and Main Street in Westbrook, Mitchell County, Texas. An area map which shows the general location of the facility, the surrounding geographical features (including highways, roads, streams, and land uses), and a 3,000-foot radius is included as Figure 2. There are no schools located within 3,000 feet of the proposed facility at the FGE Texas Project. The main uses for the surrounding area are mainly native lands interspersed with agricultural, commercial, light industrial, and residential facilities.
Figures 3 through 5 provide plot plans that show the proposed layout of the FGE Texas Project during Phase I through Phase II. In Phase I (one combined-cycle power block), the only emission points will be two combustion turbine stacks, a single 10 to 12-cell wet cooling tower, a single diesel firewater pump engine, and a single diesel emergency electrical generator. In Phase II a second combined-cycle power block and additional cooling tower, diesel firewater pump engine, and diesel emergency electrical generator will be added.
4.0 PROCESS DESCRIPTION When completed, the FGE Texas Project will consist of four Alstom GT24 CCCTs and associated equipment including two wet cooling towers, two diesel firewater pump engines, two diesel emergency electrical generators, an aqueous ammonia storage and unloading system, and diesel storage tanks.
7
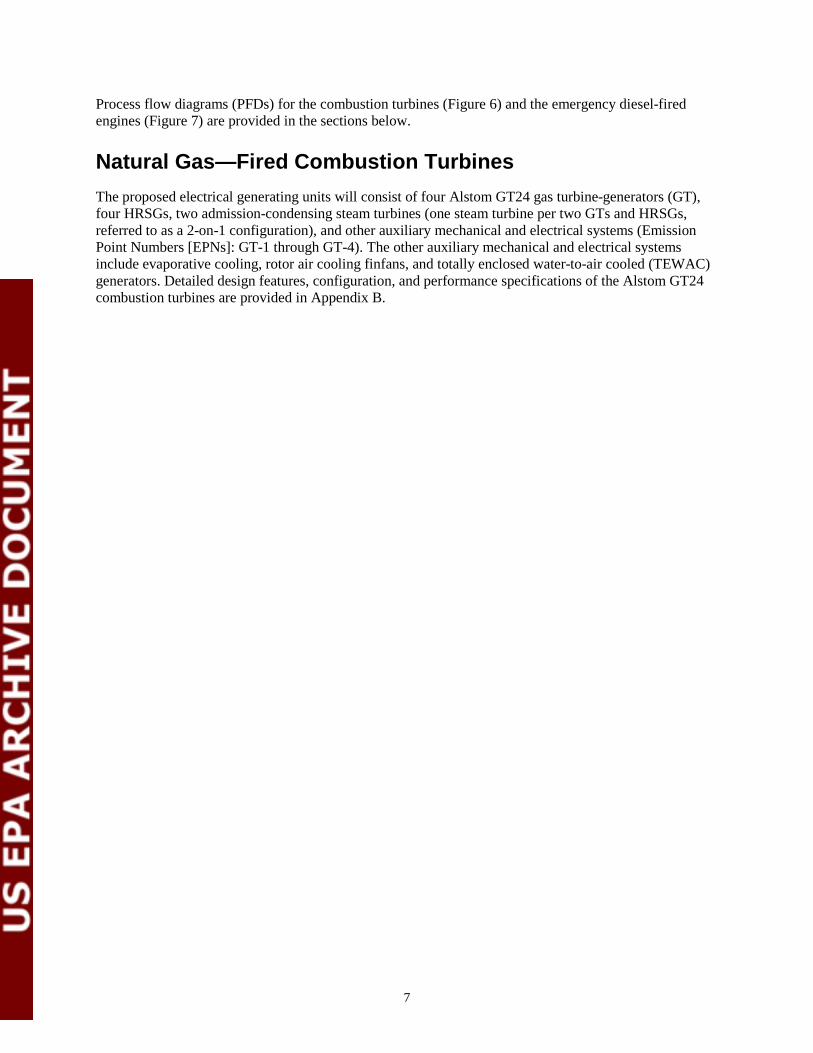
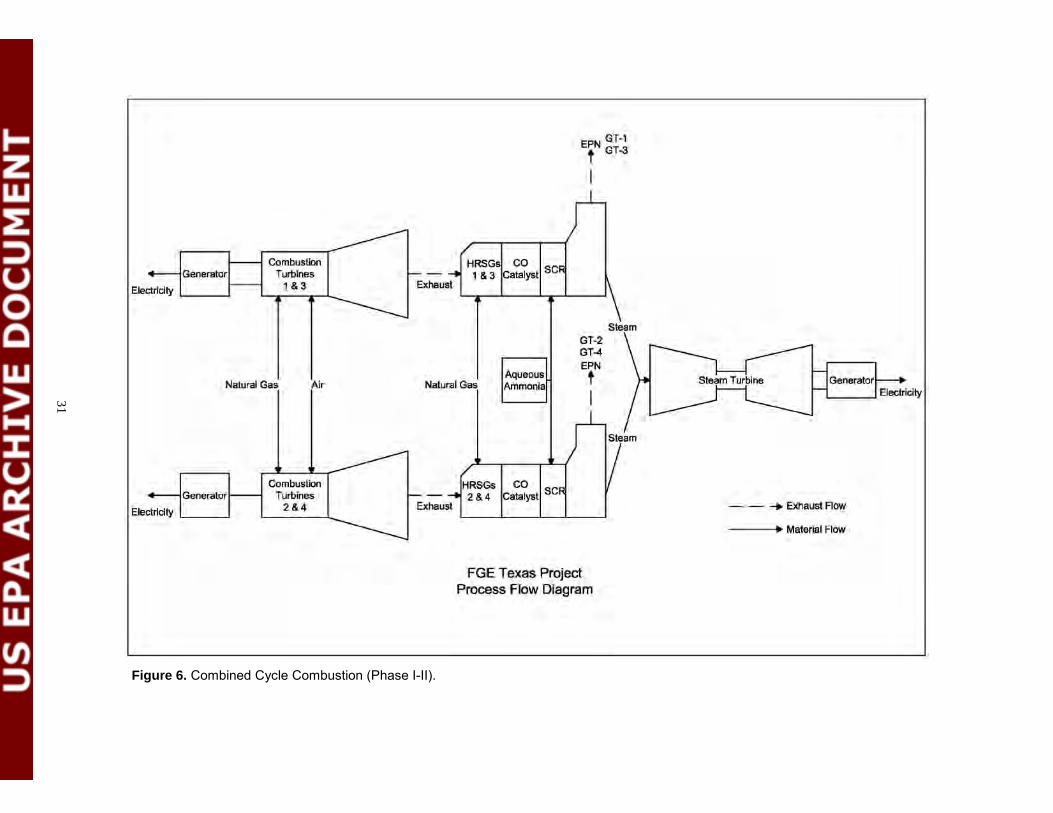
Process flow diagrams (PFDs) for the combustion turbines (Figure 6) and the emergency diesel-fired engines (Figure 7) are provided in the sections below.
Natural Gas—Fired Combustion Turbines The proposed electrical generating units will consist of four Alstom GT24 gas turbine-generators (GT), four HRSGs, two admission-condensing steam turbines (one steam turbine per two GTs and HRSGs, referred to as a 2-on-1 configuration), and other auxiliary mechanical and electrical systems (Emission Point Numbers [EPNs]: GT-1 through GT-4). The other auxiliary mechanical and electrical systems include evaporative cooling, rotor air cooling finfans, and totally enclosed water-to-air cooled (TEWAC) generators. Detailed design features, configuration, and performance specifications of the Alstom GT24 combustion turbines are provided in Appendix B.

TCEQ-10252 (Revised 10/12) PI-1 Instructions This form is for use by facilities subject to air quality requirements and may be revised periodically. (APDG 5171v19) Page __1__ of __9__
TCEQ Form PI-1
Texas Commission on Environmental Quality Form PI-1 General Application for
Air Preconstruction Permit and Amendment
Important Note: The agency requires that a Core Data Form be submitted on all incoming applications unless a Regulated Entity and Customer Reference Number have been issued and no core data information has changed. For more information regarding the Core Data Form, call (512) 239-5175 or go to: www.tceq.texas.gov/permitting/central_registry/guidance.html.
I. Applicant Information
A. Company or Other Legal Name: FGE Power, LLC
Texas Secretary of State Charter/Registration Number (if applicable): TBD
B. Company Official Contact Name: Emerson G. Farrell
Title: CEO & President
Mailing Address: 21 Waterway Avenue, Suite 300
City: The Woodlands State: TX ZIP Code: 77380
Telephone No.: (281) 362-2830 Fax No.: E-mail Address: [email protected]
C. Technical Contact Name: Emerson Farrell
Title: CEO & President
Company Name: FGE Power, LLC
Mailing Address: 21 Waterway Avenue, Suite 300
City: The Woodlands State: TX ZIP Code: 77380
Telephone No.: (281) 362-2830 Fax No.: E-mail Address:
D. Site Name: FGE Texas Project
E. Area Name/Type of Facility: Combined Cycle Gas Turbine Electricity Generation Plant
Permanent Portable
F. Principal Company Product or Business: Electric Power Generation
Principal Standard Industrial Classification Code (SIC): 4911
Principal North American Industry Classification System (NAICS): 221112 (Fossil Fuel Electric Power Generation)
G. Projected Start of Construction Date: November 2013
Projected Start of Operation Date: April 2016
H. Facility and Site Location Information (If no street address, provide clear driving directions to the site in writing.): The FGE Texas Project is located approximately 3.5 miles south-southwest of the intersection of Interstate 20 and Main Street in Westbrook, Mitchell County, Texas.
Street Address:
City/Town: Westbrook County: Mitchell ZIP Code: 79565
Latitude (nearest second): 32°18’30” N Longitude (nearest second): 101°01’23” W

TCEQ-10252 (Revised 10/12) PI-1 Instructions This form is for use by facilities subject to air quality requirements and may be revised periodically. (APDG 5171v19) Page __2__ of __9__
Texas Commission on Environmental Quality Form PI-1 General Application for
Air Preconstruction Permit and Amendment
I. Applicant Information (continued)
I. Account Identification Number (leave blank if new site or facility):
J. Core Data Form.
Is the Core Data Form (Form 10400) attached? If No, provide customer reference number and regulated entity number (complete K and L).
YES NO
K. Customer Reference Number (CN): TBD
L. Regulated Entity Number (RN): TBD
II. General Information
A. Is confidential information submitted with this application? If Yes, mark each confidential page confidential in large red letters at the bottom of each page.
YES NO
B. Is this application in response to an investigation, notice of violation, or enforcement action? If Yes, attach a copy of any correspondence from the agency and provide the RN in section I.L. above.
YES NO
C. Number of New Jobs: 18 permanent operational staff
D. Provide the name of the State Senator and State Representative and district numbers for this facility site:
State Senator: Robert L. Duncan District No.: 28
State Representative: Drew Darby District No.: 72
III. Type of Permit Action Requested
A. Mark the appropriate box indicating what type of action is requested.
Initial Amendment Revision (30 TAC 116.116(e)
Change of Location Relocation
B. Permit Number (if existing):
C. Permit Type: Mark the appropriate box indicating what type of permit is requested. (check all that apply, skip for change of location)
Construction Flexible Multiple Plant Nonattainment Plant-Wide Applicability Limit
Prevention of Significant Deterioration Hazardous Air Pollutant Major Source
Other:
D. Is a permit renewal application being submitted in conjunction with this amendment in accordance with 30 TAC 116.315(c).
YES NO

TCEQ-10252 (Revised 10/12) PI-1 Instructions This form is for use by facilities subject to air quality requirements and may be revised periodically. (APDG 5171v19) Page __3__ of __9__
Texas Commission on Environmental Quality Form PI-1 General Application for
Air Preconstruction Permit and Amendment
III. Type of Permit Action Requested (continued)
E. Is this application for a change of location of previously permitted facilities? If Yes, complete III.E.1 - III.E.4.0
YES NO
1. Current Location of Facility (If no street address, provide clear driving directions to the site in writing.):
Street Address:
City: County: ZIP Code:
2. Proposed Location of Facility (If no street address, provide clear driving directions to the site in writing.):
Street Address:
City: County: ZIP Code:
3. Will the proposed facility, site, and plot plan meet all current technical requirements of the permit special conditions? If “NO”, attach detailed information.
YES NO
4. Is the site where the facility is moving considered a major source of criteria pollutants or HAPs?
YES NO
F. Consolidation into this Permit: List any standard permits, exemptions or permits by rule to be consolidated into this permit including those for planned maintenance, startup, and shutdown.
List: N/A
G. Are you permitting planned maintenance, startup, and shutdown emissions? If Yes, attach information on any changes to emissions under this application as specified in VII and VIII.
YES NO
H. Federal Operating Permit Requirements (30 TAC Chapter 122 Applicability) Is this facility located at a site required to obtain a federal operating permit? If Yes, list all associated permit number(s), attach pages as needed).
YES NO To be determined
Associated Permit No (s.): TBD
1. Identify the requirements of 30 TAC Chapter 122 that will be triggered if this application is approved.
FOP Significant Revision FOP Minor Application for an FOP Revision
Operational Flexibility/Off-Permit Notification Streamlined Revision for GOP
To be Determined None

TCEQ-10252 (Revised 10/12) PI-1 Instructions This form is for use by facilities subject to air quality requirements and may be revised periodically. (APDG 5171v19) Page __4__ of __9__
Texas Commission on Environmental Quality Form PI-1 General Application for
Air Preconstruction Permit and Amendment
III. Type of Permit Action Requested (continued)
H. Federal Operating Permit Requirements (30 TAC Chapter 122 Applicability) (continued)
2. Identify the type(s) of FOP(s) issued and/or FOP application(s) submitted/pending for the site. (check all that apply)
GOP Issued GOP application/revision application submitted or under APD review
SOP Issued SOP application/revision application submitted or under APD review
IV. Public Notice Applicability
A. Is this a new permit application or a change of location application? YES NO
B. Is this application for a concrete batch plant? If Yes, complete V.C.1 – V.C.2. YES NO
C. Is this an application for a major modification of a PSD, nonattainment, FCAA 112(g) permit, or exceedance of a PAL permit?
YES NO
D. Is this application for a PSD or major modification of a PSD located within 100 kilometers or less of an affected state or Class I Area?
YES NO
If Yes, list the affected state(s) and/or Class I Area(s).
List:
E. Is this a state permit amendment application? If Yes, complete IV.E.1. – IV.E.3.
1. Is there any change in character of emissions in this application? YES NO
2. Is there a new air contaminant in this application? YES NO
3. Do the facilities handle, load, unload, dry, manufacture, or process grain, seed, legumes, or vegetables fibers (agricultural facilities)?
YES NO
F. List the total annual emission increases associated with the application (List all that apply and attach additional sheets as needed):
Volatile Organic Compounds (VOC): Please refer to Permit Application Submittal
Sulfur Dioxide (SO2):
Carbon Monoxide (CO):
Nitrogen Oxides (NOx):
Particulate Matter (PM):
PM 10 microns or less (PM10):
PM 2.5 microns or less (PM2.5):
Lead (Pb):
Hazardous Air Pollutants (HAPs):
Other speciated air contaminants not listed above:

TCEQ-10252 (Revised 10/12) PI-1 Instructions This form is for use by facilities subject to air quality requirements and may be revised periodically. (APDG 5171v19) Page __5__ of __9__
Texas Commission on Environmental Quality Form PI-1 General Application for
Air Preconstruction Permit and Amendment
V. Public Notice Information (complete if applicable)
A. Public Notice Contact Name: Emerson Farrell
Title: CEO & President
Mailing Address: 21 Waterway Avenue
City: The Woodlands State: TX ZIP Code: 77380
B. Name of the Public Place: Mitchell County Library
Physical Address (No P.O. Boxes): 340 Oak Street
City: Colorado City County: Mitchell ZIP Code: 79512
The public place has granted authorization to place the application for public viewing and copying.
YES NO
The public place has internet access available for the public. YES NO
C. Concrete Batch Plants, PSD, and Nonattainment Permits
1. County Judge Information (For Concrete Batch Plants and PSD and/or Nonattainment Permits) for this facility site.
The Honorable: Ray Mayo
Mailing Address: 349 Oak Street, Rm. 200
City: Colorado City State: Texas ZIP Code: 79512
2. Is the facility located in a municipality or an extraterritorial jurisdiction of a municipality? (For Concrete Batch Plants)
YES NO
Presiding Officers Name(s):
Title:
Mailing Address:
City: State: ZIP Code:
3. Provide the name, mailing address of the chief executive and Indian Governing Body; and identify the Federal Land Manager(s) for the location where the facility is or will be located.
Chief Executive: Ramiro Fuentes, Mayor of Westbrook
Mailing Address: P.O. Box 124
City: Westbrook State: Texas ZIP Code: 79565-0124
Name of the Indian Governing Body:
Mailing Address:
City: State: ZIP Code:

TCEQ-10252 (Revised 10/12) PI-1 Instructions This form is for use by facilities subject to air quality requirements and may be revised periodically. (APDG 5171v19) Page __6__ of __9__
Texas Commission on Environmental Quality Form PI-1 General Application for
Air Preconstruction Permit and Amendment
V. Public Notice Information (complete if applicable) (continued)
C. Concrete Batch Plants, PSD, and Nonattainment Permits
3. Provide the name, mailing address of the chief executive and Indian Governing Body; and identify the Federal Land Manager(s) for the location where the facility is or will be located. (continued)
Name of the Federal Land Manager(s):
D. Bilingual Notice
Is a bilingual program required by the Texas Education Code in the School District? YES NO
Are the children who attend either the elementary school or the middle school closest to your facility eligible to be enrolled in a bilingual program provided by the district?
YES NO
If Yes, list which languages are required by the bilingual program? Spanish
VI. Small Business Classification (Required)
A. Does this company (including parent companies and subsidiary companies) have fewer than 100 employees or less than $6 million in annual gross receipts?
YES NO
B. Is the site a major stationary source for federal air quality permitting? YES NO
C. Are the site emissions of any regulated air pollutant greater than or equal to 50 tpy? YES NO
D. Are the site emissions of all regulated air pollutants combined less than 75 tpy? YES NO
VII. Technical Information
A. The following information must be submitted with your Form PI-1 (this is just a checklist to make sure you have included everything)
1. Current Area Map
2. Plot Plan
3. Existing Authorizations N/A
4. Process Flow Diagram
5. Process Description
6. Maximum Emissions Data and Calculations
7. Air Permit Application Tables
a. Table 1(a) (Form 10153) entitled, Emission Point Summary
b. Table 2 (Form 10155) entitled, Material Balance
c. Other equipment, process or control device tables
B. Are any schools located within 3,000 feet of this facility? YES NO
TCEQ-10252 (Revised 10/12) PI-1 Instructions This form is for use by facilities subject to air quality requirements and may be revised periodically. (APDG 5171v19) Page __7__ of __9__
Texas Commission on Environmental Quality Form PI-1 General Application for
Air Preconstruction Permit and Amendment
VII. Technical Information
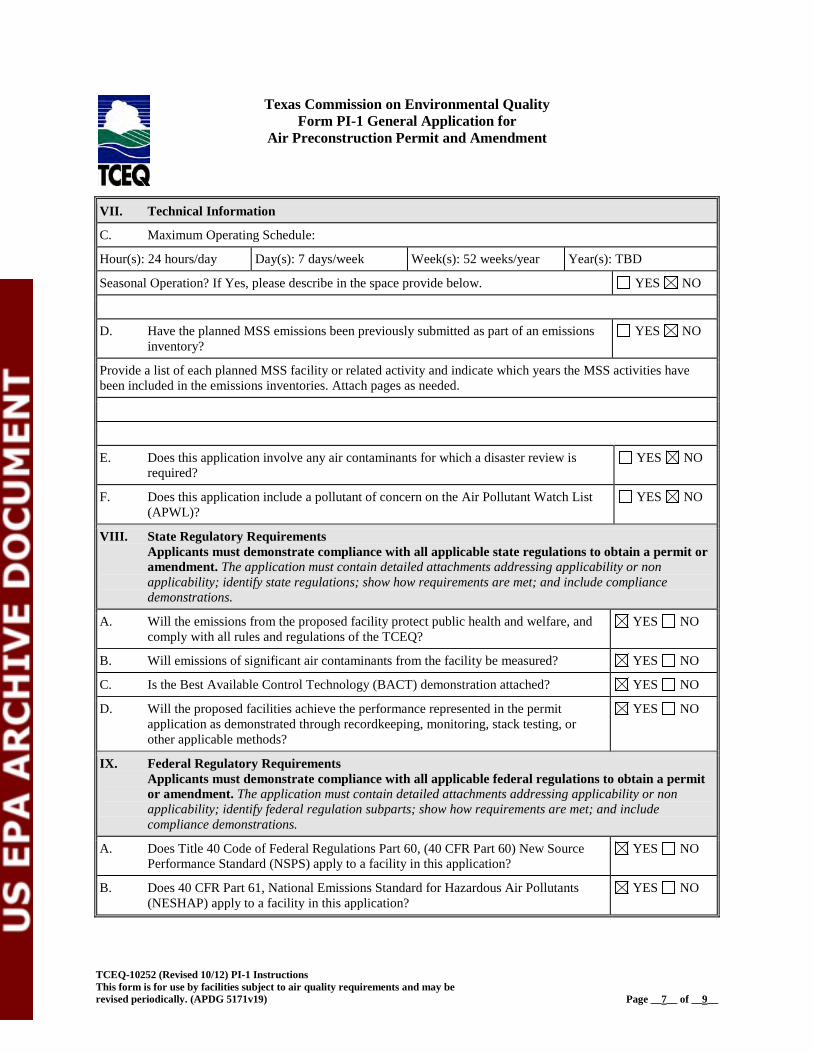
C. Maximum Operating Schedule:
Hour(s): 24 hours/day Day(s): 7 days/week Week(s): 52 weeks/year Year(s): TBD
Seasonal Operation? If Yes, please describe in the space provide below. YES NO
D. Have the planned MSS emissions been previously submitted as part of an emissions inventory?
YES NO
Provide a list of each planned MSS facility or related activity and indicate which years the MSS activities have been included in the emissions inventories. Attach pages as needed.
E. Does this application involve any air contaminants for which a disaster review is required?
YES NO
F. Does this application include a pollutant of concern on the Air Pollutant Watch List (APWL)?
YES NO
VIII. State Regulatory Requirements Applicants must demonstrate compliance with all applicable state regulations to obtain a permit or amendment. The application must contain detailed attachments addressing applicability or non applicability; identify state regulations; show how requirements are met; and include compliance demonstrations.
A. Will the emissions from the proposed facility protect public health and welfare, and comply with all rules and regulations of the TCEQ?
YES NO
B. Will emissions of significant air contaminants from the facility be measured? YES NO
C. Is the Best Available Control Technology (BACT) demonstration attached? YES NO
D. Will the proposed facilities achieve the performance represented in the permit application as demonstrated through recordkeeping, monitoring, stack testing, or other applicable methods?
YES NO
IX. Federal Regulatory Requirements Applicants must demonstrate compliance with all applicable federal regulations to obtain a permit or amendment. The application must contain detailed attachments addressing applicability or non applicability; identify federal regulation subparts; show how requirements are met; and include compliance demonstrations.
A. Does Title 40 Code of Federal Regulations Part 60, (40 CFR Part 60) New Source Performance Standard (NSPS) apply to a facility in this application?
YES NO
B. Does 40 CFR Part 61, National Emissions Standard for Hazardous Air Pollutants (NESHAP) apply to a facility in this application?
YES NO

TCEQ-10252 (Revised 10/12) PI-1 Instructions This form is for use by facilities subject to air quality requirements and may be revised periodically. (APDG 5171v19) Page __8__ of __9__
Texas Commission on Environmental Quality Form PI-1 General Application for
Air Preconstruction Permit and Amendment
IX. Federal Regulatory Requirements Applicants must demonstrate compliance with all applicable federal regulations to obtain a permit or amendment. The application must contain detailed attachments addressing applicability or non applicability; identify federal regulation subparts; show how requirements are met; and include compliance demonstrations.
C. Does 40 CFR Part 63, Maximum Achievable Control Technology (MACT) standard apply to a facility in this application?
YES NO
D. Do nonattainment permitting requirements apply to this application? YES NO
E. Do prevention of significant deterioration permitting requirements apply to this application?
YES NO
F. Do Hazardous Air Pollutant Major Source [FCAA 112(g)] requirements apply to this application?
YES NO
G. Is a Plant-wide Applicability Limit permit being requested? YES NO
X. Professional Engineer (P.E.) Seal
Is the estimated capital cost of the project greater than $2 million dollars? YES NO
If Yes, submit the application under the seal of a Texas licensed P.E.
XI. Permit Fee Information
Check, Money Order, Transaction Number ,ePay Voucher Number: Fee Amount: $ 75,000
Paid online? YES NO
Company name on check:
Is a copy of the check or money order attached to the original submittal of this application?
YES NO N/A
Is a Table 30 (Form 10196) entitled, Estimated Capital Cost and Fee Verification, attached?
YES NO N/A


17


19

20

21

22

23

24

25

26

27
Figure 2. Area map.

28
Figure 3. FGE Texas Project – Phase I Site Layout

29
Figure 4. FGE Texas Project – Phase I Plant Layout

30
Figure 5. FGE Texas Project – Phase II Site Layout
31
Figure 6. Combined Cycle Combustion (Phase I-II).

32
Figure 7. Emergency Diesel Engines.

33
The following process descriptions are for the facility operating in Phases I and II at 100% load during both winter (5 degrees Fahrenheit (°F)/55% relative humidity [RH]) and summer (95°F/20%RH) ambient temperature conditions. As with all GT the operational output will vary with the ambient conditions (i.e., temperature and relative humidity). In addition, the values presented below are approximate and are subject to change per final design.
During Phase I operation two combustion turbines (a single power block) will be operated in combined-cycle mode. The inlet air to each of the combustion turbines will be cooled during high ambient conditions by means of evaporative coolers. The cooling of the inlet air will increase the output of each combustion turbine while lowering each unit’s heat rate (i.e., improved efficiency). Phase II will consist of the addition of a second combined-cycle power block. Each power block (consisting of two combustion turbines and a single steam turbine generator) will generate approximately 728 MW (gross) of power at an ambient temperature of 5°F and 55% relative humidity during combined cycle operation (up to 810 MW gross power at 5°F and 55% relative humidity).
Each combustion turbine will burn pipeline-quality natural gas to rotate an electrical generator to generate electricity. The main components of a combustion turbine generator consist of a compressor, combustor, turbine, and generator. The compressor pressurizes combustion air to the combustor where the natural gas fuel is mixed and burned. The hot exhaust gases from each of the combustion turbines expand across the turbine blades, driving a shaft to power an electric generator. The exhaust gas will then exit the combustion turbine and will be routed to the HRSG for steam production. The steam generated within the HRSG will be utilized to drive the steam turbine and associated electrical generator. Steam produced by each of the HRSGs in a power block will be routed to a single steam turbine capable of generating up to 336 MW of power (gross) at 5°F and 55% RH.
In full combined-cycle operation during Phase I, the exhaust stream from each combustion turbine, HRSG, and duct burner will be released to the atmosphere through a single stack, for a total of two stacks per power block (four stacks total upon completion of Phase II). For the purposes of this application, “normal” operation is defined as loads between 50% to base load. As mentioned previously, a unique feature of the Alstom technology each power block while operating in the parking feature will maintain compliance with the 50 percent to base load emission concentrations.
The parking feature operations can be describe in terms of Plant De-Loading to LLO, Plant Operations at Low-Load, and Reloading of the Plant. The de-loading process down to LLO is divided into two main steps: Steam Conditioning and GT De-Loading.
To maintain within the allowable stress limits of the steam turbine components, the temperature of the high pressure (HP) and the hot reheat (HRH) steam is decreased to a target value, while the plant maintains operating at a dispatched load. During this step, the steam turbine power output and efficiency are marginally decreased as a result of the temperature reduction.
Once the targeted steam temperatures have been reached, the combustion turbines reduce load with the normal gradient (both combustion turbines running in parallel). The water injection valves associated with the steam de-superheaters close with the decreasing combustion turbine exhaust temperature. Within approximately 20 minutes after initiation of the combustion turbine de-loading, the LLO point is reached. The second step ends when the combustion turbine has reached the following parking feature conditions:
• Combustion turbine has reached the LLO emission limits; • Steam turbine has reached “steady state operation mode”; • Low pressure (LP) once-through cooler (OTC) at “air-cooling demand” control; and • HP and intermediate pressure (IP) steam pressures are at HP/IP LLO pressure.

34
The continuous LLO with the GT24 is defined by a particular variable guide vanes (VGV) Low Load Position, the first EnVironmental (EV) combustor in operation, with the second (SEV) combustor switched off and at a defined firing temperature setting. When the combustion turbines are parked for LLO, no frequency response is possible.
When the re-loading process of the LLO is initiated by the operator, both of the combustion turbines load up in parallel and the plant’s power output is increased at either the standard or the fast plant load ramp rate. The steam de-superheaters control the steam temperature gradients with the allowable limits. Once the combustion turbines reach base load operation, most of the combined cycle base load output is already available. The steam de-superheaters will then gradually close and increase the HP and HRH steam temperatures to the nominal values, bring the plant to full load conditions.
FGE is proposing to use natural circulation-type HRSG units, which are designed to produce steam to drive the steam turbine. Each HRSG will be equipped with a natural gas–fired duct burner with a maximum rated heat input capacity of 393 million British thermal units per hour (mmBtu/hr) on a lower heating values (LHV) basis. The heat recovery surface of each unit will be finned tube, modular type for efficient and economical heat recovery and rapid field erection.
Each Alstom GT24 combustion turbine will be equipped with dry-low NOX combustion technology to control NOX emissions. The dry-low NOX technology uses lean premix gas nozzles with multiple stages in order to control flame temperature. Each combustion turbine will also be equipped with a SCR system to control post-combustion NOX emissions and an oxidization catalyst to control CO and VOC emissions. The SCR system will use 19% aqueous ammonia. A catalyst bed and an ammonia injection grid will be located within each HRSG at a temperature region that will favor the reaction of converting NOX in the flue gas and the ammonia into nitrogen and water. The catalyst bed will be made up of a porous ceramic honeycomb substrate coated with vanadium-titanium. For the purposes of this application, “normal” combined cycle operation is defined as loads between 50% to base load and during the low-load operating (LLO) mode and for which an SCR and CO catalyst temperature of 450°F can be maintained.8
To meet the peak demands for electrical power during the hot summer months and cold winter months, the combustion turbines will up to one start-up and shutdown event per turbine per day. FGE is proposing a total number of startup and shutdown (SUSD) events on an annual basis of 365 events per turbine. The details regarding the duration and GHG emissions during the proposed SUSD events are provided in Section 5 of this application. The turbines and HRSG duct burners will be fired exclusively with pipeline-quality natural gas.
Reciprocating Internal Combustion Engines FGE plans to install two diesel-fired reciprocating internal combustion engines (RICEs) to be used for emergency purposes (EPNs: FWP-1, FWP-2, EG-1, and EG-2). The firewater pump engines will be rated up to 389 brake-horsepower (bhp) each, while the emergency electrical generator engines will be rated up to 900 bhp each. Other than during plant emergency situations, the firewater pump and electrical generator engines will be operated for less than one hour per week each for routine testing, maintenance, and inspection purposes only. The emergency engines will be fired with ULSD.
8 Alstom SCR and CO catalyst data provided by turbine vendor. A copy of the estimated combined cycle process and emissions data is included in Appendix B of the application submittal.

35
Fugitive Emissions Fugitive emissions of methane (CH4) and carbon dioxide (CO2) from natural gas piping and of sulfur hexafluoride (SF6) from certain electrical equipment are anticipated for the site.
Natural Gas Piping Pipeline-quality natural gas will be metered and piped via pipeline to the combustion turbines and duct burners. Fugitive emissions, designated as FUG-CH4, from the natural gas piping components associated with the combustion turbines and duct burners will include emissions of CH4 and CO2.
Electrical Equipment Insulated with Sulfur Hexafluoride SF6 is an extremely stable fluorinated compound commonly used in the electrical industry to provide a dielectric, gaseous medium for high-voltage circuit breakers, switchgear, and other electrical equipment. The gas is used for electrical insulation, arc quenching, and current interruption in high-voltage electrical equipment. SF6 is only used in sealed and safe systems which under normal circumstances do not leak gas.
The proposed project will utilize up to twelve 362-kilovolt (kV) circuit breakers (one installed on each of the twelve on-site transformers) and up to sixteen 24-kV circuit breakers (four for each of the four turbines) insulated with SF6 switching. Low pressure alarms and low pressure lockouts will be installed on each proposed circuit breaker to alert operating personnel of any system leakage and prevent improper operation and maintenance on breakers that could lead to the release of SF6 gas. Fugitive emissions associated with the SF6 containing electrical equipment are designated as FUG-SF6.
Other Equipment Condenser and Cooling Tower The FGE Texas Project will utilize a condenser/cooling tower arrangement to condense and cool steam exhausted from the steam turbine. Each power block will have a separate condenser/cooling tower. The condenser will be a surface contact heat exchanger, and each cooling tower will be a multi-cell motor driven, mechanical draft, counterflow tower with film fill. Each cooling tower will be equipped with 10-12 cells and a circulation rate of 140,000 gallons per minute (gpm). The maximum total dissolve solids (TDS) content of the cooling water will be 21,000 parts per million (ppm). The cooling towers will be equipped with high efficiency drift eliminators rated at 0.0005% drift to control particulate matter generated from the drift droplets. However, the cooling towers are not a source of GHG emissions.
Diesel Storage Tanks Diesel fuel combusted in the emergency firewater pump and electrical generator engines will be stored in four horizontal storage tanks. The capacities of each of the diesel storage tanks serving the emergency firewater pump and electrical generator engines (one tank per engine) are anticipated to be approximately 1,250 and 2,000 gallons each, respectively. These tanks will be located inside the individual firewater pump housings and stand-by electrical generator skids. However, the diesel storage tanks are not a source of GHG emissions.

36
Lube Oil Reservoirs Each combustion and steam turbine will be equipped with a dedicated lube oil reservoir. The purpose of the lube oil system is to lubricate the turbine and generator bearing, hydraulically operate the auto-stop, thrust bearing, and low bearing oil trip devices. Lube oil mists are typically generated by these systems which are created by large high speed rotating equipment such as turbines and compressors using recirculated oil for lubricating and cooling the bearings.
Each reservoir will have an empty tank capacity of approximately 30 cubic meters (m3) (8,000 gallons). The GT lube oil reservoirs have external dimensions of 8.4 × 3.0 × 1.3 m (27.6 × 9.8 × 3.4 feet), are electrically heated, and will be closed systems equipped with a vapor extraction fan. The ST lube oil reservoirs are closed systems with a height of approximately 21.3 m (83.9 feet) from the floor, and will be heated via the lube oil centrifuge heater (electrically powered). These systems are anticipated to use Mobil DTE 732 turbine oil (the material safety data sheet [MSDS] is included in Appendix B). However, the lube oil reservoirs are not a source of GHG emissions.
Aqueous Ammonia Storage and Unloading System Aqueous ammonia (19%) will be stored in pressurized tanks and the unloading operations will be equipped with a vapor return line. Therefore, the ammonia storage tanks and unloading operations are not considered as potential emission sources. In addition, the aqueous ammonia storage tank and unloading system are not a source of GHG emissions.
5.0 GREENHOUSE GAS EMISSION CALCULATIONS The proposed project GHG emission calculation methodologies and emission calculations for the emission sources of GHGs are summarized in this section. Detailed emission calculations are included in Appendix A.
The project has the following potential sources of GHG emissions, depending upon the phase of the project:
• Four natural gas combustion turbines, which may operate according to following level of phased project development: o Phase I: combined cycle operation for two combustion turbines (EPNs: GT-1, GT-2) o Phase II: combined cycle operation for four combustion turbines (EPNs: GT-1, GT-2,
GT-3, GT-4) • Two emergency firewater pump diesel-fired engines, which may operate according to following
level of phased project development: o Phase I: one firewater pump diesel-fired engine (EPN: FWP-1) o Phase II: two firewater pump diesel-fired engines (EPNs: FWP-1, FWP-2)
• Two emergency electrical generator diesel-fired engines, which may operate according to following level of phased project development:
o Phase I: one electrical generator diesel-fired engine (EPN: EG-1) o Phase II: two electrical generator diesel-fired engines (EPNs: EG-1, EG-2)
• Fugitive emissions from natural gas piping components (all phases; EPN: FUG-CH4) • Fugitive emissions from circuit breakers containing SF6 (all phases; EPN: FUG-SF6)

37
Under the GHG permitting regulations, EPA regulates and permits emissions of GHG expressed as carbon dioxide equivalents (CO2e). CO2e emissions are calculated by multiplying the mass of each individual GHG by the gas’s associated global warming potential, obtained from Table A-1 to subpart A of 40 Code of Federal Regulations (CFR) 98. Table 1 provides the global warming potential factors used to estimate the total CO2e for GHGs emitted from the proposed project emission units.
Table 1. Global Warming Potentials
Pollutant Global Warming Potential
CO2 1
CH4 21
N2O 310
SF6 23,900
Table 2 provides a summary of the annual GHG potential to emit for the proposed project.
Table 2. Summary of Project Annual GHG Potential to Emit
Emission Source ID
Annual Potential Emissions (tpy)
CO2 CH4 N2O SF6 CO2e
Phase I GT-1 1,459,718 473.22 2.60 - 1,470,461
GT-2 1,459,718 473.22 2.60 - 1,470,461
FWP-1 12 <0.01 <0.01 - 12
EG-1 27 <0.01 <0.01 - 27
FUG-CH4 0.06 9.90 - - 209
FUG-SF6 - - - 1.16E-03 28
Total Phase I Emissions
2,919,475 956.35 5.20 2,941,198
Phase II GT-1 1,459,718 473.22 2.60 - 1,470,461
GT-2 1,459,718 473.22 2.60 - 1,470,461
GT-3 1,459,718 473.22 2.60 - 1,470,461
GT-4 1,459,718 473.22 2.60 - 1,470,461
FWP-1 12 <0.01 <0.01 - 12
FWP-2 12 <0.01 <0.01 - 12
EG-1 27 <0.01 <0.01 - 27
EG-2 27 <0.01 <0.01 - 27
FUG-CH4 0.12 19.80 - - 418
FUG-SF6 - - - 1.16E-03 28
Total Phase II Emissions
5,838,950 1,912.70 10.39 5,882,368

38
Natural Gas–Fired Combustion Turbines The Alstom GT24 combustion turbines and duct burner emission rates were evaluated for the entire range of expected operation (i.e., LLO and 50% to base load) during both winter (5 degrees Fahrenheit (°F)/55% relative humidity [RH]) and summer (95°F/20%RH) ambient conditions. The annual hours of operation for each combustion turbine in combined cycle mode are 8,760 hours. FGE expects to have a maximum of 365 startup events and 365 shutdown events per turbine annually. Each MSS event is expected to not exceed 240 (includes cold startup and shutdown)minutes during combined cycle operations (210 minutes for a cold startup, 181 minutes for a warm startup, 86 minutes for a hot startup, and 30 minutes for a shutdown).
The maximum firing rate and output scenario occurs during winter (5°F, 55% RH). Each of the combined cycle power blocks is rated at a maximum heat input capacity of 4,576 mmBtu/hr (HHV) without duct firing and 5,393 mmBtu/hr (HHV) with duct firing. The maximum hourly emission rates have been estimated based on these conditions. Each HRSG will be equipped with a natural gas–fired duct burner with a maximum rated heat input capacity of 393 MMBtu/hr on a lower heating value (LHV) basis. Annual emissions estimated are based on turbine performance data for the maximum hourly emission rates (including duct firing) and worst-case maximum hours of operation of 8,760 hours per year.
The combustion turbines have been designed for base load operation. However, the Alstom technology allows for “parking” operations that allow the unit to operate at 8% – 10% of peak load (approximately 765 mmBtu/hr, HHV) while still maintaining compliance with the guaranteed emission rates.9
GHG gas emissions during maintenance, startup, and shutdown (MSS) activities would be generated from the combustion of natural gas and the release of unburned methane. The proposed annual operating limit is 8,760 hours for each turbine and includes all hours of startup and shutdown activities. Therefore, the startup and shutdown emissions from the combustion of natural gas are already included in the maximum heat input capacity for 8,760 hours per year. However, each turbine will also release unburned natural gas, consisting of mainly CH4, during startup and shutdown events. Each combustion turbine will have up to 365 startup and 365 shutdown events per year. As a conservative estimate it was assumed that 100% of the unburned hydrocarbon (UHC) emissions per event were unburned CH4. Therefore, it was conservatively estimated that each startup and shutdown event would emit 1,735 and 510 pounds of CH4 per event per turbine, respectively. 10
GHG emissions from the combustion turbines include CO2, CH4, and N2O. Detailed performance data which include the CO2 and CH4 emission rates at various operating loads and ambient conditions are provided in Appendix B. Emissions of N2O were calculated using the emission factors (kg/mmBtu) for natural gas combustion from Table C-2 of the Mandatory Greenhouse Gas Reporting Rules.11 The global warming potentials were derived from Table A-1 of the Mandatory Greenhouse Gas Reporting Rules.
Reciprocating Internal Combustion Engines Two diesel-fired emergency firewater pumps (FWP-1 and FWP-2) sized up to 389-bhp each and two diesel-fired emergency electrical generators (EG-1 and EG-2) sized up to 900-bhp each are proposed for the project. Non-emergency engine operation will be limited to less than 1 hour per week for routine 9 Alstom Estimated Combined Cycle Process and Emissions Data provided by turbine vendor. A copy of the estimated combined cycle process and emissions data is included in Appendix B of the application submittal. 10 Alstom SUSD emissions data provided by turbine vendor. A copy of the estimated combined cycle process and emissions data is included in Appendix B of the application submittal. 11 Default N2O Emission Factors for Various Types of Fuel, 40 CFR 98, Subpart C, Table C-2.

39
testing of each engine. CO2 emission calculations from the diesel-fired engines are calculated using the emission factors for No. 2 distillate fuel oil from Table C-1 of the Mandatory Greenhouse Gas Reporting Rules; CH4 and N2O emission calculations from diesel-fired engines are calculated using the emission factors for petroleum from Table C-2 of the Mandatory Greenhouse Gas Reporting Rules. The global warming potential factors used to calculate CO2e emissions are based on Table A-1 of the Mandatory Greenhouse Gas Reporting Rules.
Both the emergency firewater pump and the emergency electrical generator diesel engines will be limited to non-emergency use of less than 1 hour per week of operation for routine testing, maintenance, and inspection purposes. GHG emissions from each diesel-fired engine are thus calculated based on a maximum of 52 hours per year of operation. GHG emissions from the diesel-fired engines are presented in Table 3.
Table 3. Summary of Diesel-Fired Engines Annual GHG Potential to Emit
Emission Source ID
Annual Potential Emissions (tpy)
CO2 CH4 N2O CO2e
FWP-1 12 <0.01 <0.01 12
FWP-2 12 <0.01 <0.01 12
EG-1 27 <0.01 <0.01 27
EG-2 27 <0.01 <0.01 27
Fugitive Emissions The proposed project has potential fugitive GHG emissions from natural gas piping and electrical equipment insulated with SF6. Fugitive emissions are presented in the sections below.
Natural Gas Piping GHG emission calculations for natural gas/fuel gas piping component fugitive emissions are based on emission factors from Table W -1A of the Mandatory GHG Report Rule. 12 The concentrations of CH4 and CO2 in the natural gas are based on a typical natural gas analysis. Since the CH4 and CO2 content of natural gas is variable, the concentrations of CH4 and CO2 from a typical natural gas analysis are used as a worst case estimate. The global warming potential factors used to calculate CO2e emissions are based on Table A-1 of the Mandatory Greenhouse Gas Reporting Rules.13 Calculations of GHG emissions from natural gas piping fugitives are presented in the appendices.
Electrical Equipment Insulated with Sulfur Hexafluoride The proposed project will utilize up to 28 circuit breakers on-site insulated with SF6. Although there is expected to be minimal SF6 leakage to the atmosphere, SF6 fugitive emissions are calculated herein under the conservative assumption of an annual leak rate of 0.5% by weight.14
12 40 CFR 98 subpart W. 13 Global Warming Potentials, 40 CFR 98, Subpart A, Table A-1. 14 Blackman, J., M. Averyt, and Z. Taylor. 2006. SF6 Leak Rates from High Voltage Circuit Breakers – EPA Investigates Potential Greenhouse Gas Emission Source. Available at: http://www.epa.gov/electricpower-sf6/documents/leakrates_circuitbreakers.pdf. Accessed November 2012.

40
Emissions from circuit breakers insulated with SF6 are therefore calculated as follows:
Annual Emission Rate (tpy) = (Amount of SF6 in Full Charge [lb]) × (SF6 Leak Rate [%/yr]) × (1/2,000 [ton/lb]) × Global Warming Potential of SF6 (23,900)
The fully charged SF6 capacity of the circuit breakers is estimated at 27.5 lb SF6 for each of the 362-kV circuit breakers and 8.25 lb SF6 for each of the 24-kV circuit breakers. Based on the maximum SF6 capacity of each circuit breaker, GHG emissions from the SF6 insulated circuit breakers are presented in Table 4.
Table 4. Summary of SF6 Insulated Circuit Breaker Annual GHG Potential to Emit
Breaker Type Number of Breakers
SF6 Capacity in lb (each)
SF6 Capacity in lb (total)
Max Leakage (%/Year)
Max SF6 Emissions (lb/Year)
Annual Potential CO2e Emissions (tpy)
362 kV 12 27.50 330 0.5% 1.65 20
24 kV 16 8.25 132 0.5% 0.66 8
Total 28 462 2.31 28
Emission Summary The emissions from the proposed project are presented in the TCEQ Table 1(a) found at the end of this section (Appendix A provides detailed emission calculations).
6.0 STATE AND FEDERAL REGULATORY REQUIREMENTS
State Requirements The TCEQ has not been delegated authority by the EPA to issue GHG air permits. Therefore, no relevant Texas regulations are applicable to GHG emissions generated by the proposed FGE Texas Project. However, for the permitting of non-GHG pollutants, FGE is submitting concurrently with this application an application to the TCEQ an Air Quality New Source Review (NSR) Initial Permit Application for approval to construct (submitted under separate cover).
Federal Major New Source Review / Prevention of Significant Deterioration The GHG PSD Tailoring rule defines a major new source of GHG emissions as emitting greater than or equal to 100,000 tpy CO2e and 100 tpy on a mass basis. As shown in Section 5, GHG emissions for the project are expected to be greater than the major source PSD threshold and therefore, the FGE Texas Project is subject to PSD NSR requirements contained in 40 CFR 52.21.
PSD NSR includes the following requirements: • ambient air quality monitoring; • ambient impact analysis; • additional impact analysis; and • control technology review.

41
TEXAS COMMISSION ON ENVIRONMENTAL QUALITY
Table 1(a) Emission Point Summary
Date: April 2013 Permit No.: TBD Regulated Entity No.: TBD
Area Name: FGE Texas Project Customer Reference No.: TBD
Review of applications and issuance of permits will be expedited by supplying all necessary information requested on this Table.
AIR CONTAMINANT DATA
1. Emission Point 2. Component or Air Contaminant Name 3. Air Contaminant Emission Rate
(A) EPN (B) FIN (C) Name (A) Pound Per Hour (B) TPY
GT-1 GT-1 Gas Combustion Turbine (Combined Cycle Operation)
CH4 14.50 63.51
CH4 (MSS Emissions) 2,245 (lb/event) 410
N2O 0.59 2.60
CO2 333,269 1,459,718
CO2e - 1,470,461
GT-2 GT-2 Gas Combustion Turbine (Combined Cycle Operation)
CH4 14.50 63.51
CH4 (MSS Emissions) 2,245 (lb/event) 410
N2O 0.59 2.60
CO2 333,269 1,459,718
CO2e - 1,470,461
EPN = Emission Point Number FIN = Facility Identification Number *Note: Emissions of N2O, and CO2 from the combustion turbines are the same during normal and SUSD operations. Thus, hourly MSS emissions for these pollutants are not listed separately. However, the annual emissions represent the total emissions (normal + MSS operations).

42
TEXAS COMMISSION ON ENVIRONMENTAL QUALITY
Table 1(a) Emission Point Summary
Date: April 2013 Permit No.: TBD Regulated Entity No.: TBD
Area Name: FGE Texas Project Customer Reference No.: TBD
Review of applications and issuance of permits will be expedited by supplying all necessary information requested on this Table.
AIR CONTAMINANT DATA
1. Emission Point 2. Component or Air Contaminant Name 3. Air Contaminant Emission Rate
(A) EPN (B) FIN (C) Name (A) Pound Per Hour (B) TPY
GT-3 GT-3 Gas Combustion Turbine (Combined Cycle Operation)
CH4 14.50 63.51
CH4 (MSS Emissions) 2,245 (lb/event) 410
N2O 0.59 2.60
CO2 333,269 1,459,718
CO2e - 1,470,461
GT-4 GT-4 Gas Combustion Turbine (Combined Cycle Operation)
CH4 14.50 63.51
CH4 (MSS Emissions) 2,245 (lb/event) 410
N2O 0.59 2.60
CO2 333,269 1,459,718
CO2e - 1,470,461
EPN = Emission Point Number FIN = Facility Identification Number *Note: Emissions of N2O, and CO2 from the combustion turbines are the same during normal and SUSD operations. Thus, hourly MSS emissions for these pollutants are not listed separately. However, the annual emissions represent the total emissions (normal + MSS operations).

43
TEXAS COMMISSION ON ENVIRONMENTAL QUALITY
Table 1(a) Emission Point Summary
Date: April 2013 Permit No.: TBD Regulated Entity No.: TBD
Area Name: FGE Texas Project Customer Reference No.: TBD
Review of applications and issuance of permits will be expedited by supplying all necessary information requested on this Table.
AIR CONTAMINANT DATA
1. Emission Point 2. Component or Air Contaminant Name 3. Air Contaminant Emission Rate
(A) EPN (B) FIN (C) Name (A) Pound Per Hour (B) TPY
FWP-1 FWP-1 Emergency Firewater Pump Engine
CH4 0.02 <0.01 N2O <0.01 <0.01
CO2 444.07 11.55
CO2e 445.57 11.58
FWP-2 FWP-2 Emergency Firewater Pump Engine
CH4 0.02 <0.01
N2O <0.01 <0.01
CO2 444.07 11.55
CO2e 445.57 11.58
EG-1 EG-1 Emergency Electrical Generator Engine
CH4 0.04 <0.01
N2O 0.01 <0.01
CO2 1,027.42 26.71
CO2e 1,030.87 26.80
EPN = Emission Point Number FIN = Facility Identification Number

44
TEXAS COMMISSION ON ENVIRONMENTAL QUALITY
Table 1(a) Emission Point Summary
Date: April 2013 Permit No.: TBD Regulated Entity No.: TBD
Area Name: FGE Texas Project Customer Reference No.: TBD
Review of applications and issuance of permits will be expedited by supplying all necessary information requested on this Table.
AIR CONTAMINANT DATA
1. Emission Point 2. Component or Air Contaminant Name 3. Air Contaminant Emission Rate
(A) EPN (B) FIN (C) Name (A) Pound Per Hour (B) TPY
EG-2 EG-2 Emergency Electrical Generator Engine
CH4 0.04 <0.01
N2O 0.01 <0.01
CO2 1,027.42 26.71
CO2e 1,030.87 26.80
FUG-CH4 FUG-CH4 Fugitives: Natural Gas (per power block)
CH4 2.26 9.90
CO2 0.06 0.01
CO2e 47.76 209.21
FUG-SF6 FUG-SF6 Fugitives: SF6 Circuit Breakers
SF6 <0.01 0.0012
CO2e 6.30 27.60
EPN = Emission Point Number FIN = Facility Identification Number

45
TEXAS COMMISSION ON ENVIRONMENTAL QUALITY
Table 1(a) Emission Point Summary
Date: April 2013 Permit No.: TBD Regulated Entity No.: TBD
Area Name: FGE Texas Project Customer Reference No.: TBD
Review of applications and issuance of permits will be expedited by supplying all necessary information requested on this Table.
AIR CONTAMINANT DATA EMISSION POINT DISCHARGE PARAMETERS 1. Emission Point 1. UTM Coordinates of Emission
Point Source
1. Building Height (Ft.)
2. Height Above Ground (Ft.)
3. Stack Exit Data 4. Fugitives (A)
EPN (B) FIN
(C) NAME Zone East (Meters)
North (Meters) (A) Diameter
(Ft.)
(B) Velocity
(FPS)
(C) Temperature
(°F)
(A) Length
(Ft.)
(B) Width (Ft.)
(C) Axis
Degrees GT-1 GT-1 Combustion
Turbine 1 14 309,333 3,576,567 213.0 20.0 22.2 –
63.3 150.0 – 188.0
GT-2 GT-2 Combustion Turbine 2
14 309,380 3,576,578 213.0 20.0 22.2 – 63.3
150.0 – 188.0
GT-3 GT-3 Combustion Turbine 3
14 309,571 3,576,621 213.0 20.0 22.2 – 63.3
150.0 – 188.0
GT-4 GT-4 Combustion Turbine 4
14 309,618 3,576,631 213.0 20.0 22.2 – 63.3
150.0 – 188.0
FWP-1 FWP-1
Firewater Pump Engine
14 309,294 3,576,577 15.0 12.0 0.667 111.0 826.0
FWP-2 FWP-2
Firewater Pump Engine
14 309,294 3,576,577 15.0 12.0 0.667 111.0 826.0
EPN = Emission Point Number FIN = Facility Identification Number

46
TEXAS COMMISSION ON ENVIRONMENTAL QUALITY
Table 1(a) Emission Point Summary
Date: April 2013 Permit No.: TBD Regulated Entity No.: TBD
Area Name: FGE Texas Project Customer Reference No.: TBD
Review of applications and issuance of permits will be expedited by supplying all necessary information requested on this Table.
AIR CONTAMINANT DATA EMISSION POINT DISCHARGE PARAMETERS 1. Emission Point 2. UTM Coordinates of Emission
Point Source
1. Building Height (Ft.)
2. Height Above Ground (Ft.)
3. Stack Exit Data 4. Fugitives (A)
EPN (B) FIN
(C) NAME Zone East (Meters)
North (Meters)
(A) Diameter
(Ft.)
(B) Velocity
(FPS)
(C) Temperature
(°F)
(A) Length
(Ft.)
(B) Width (Ft.)
(C) Axis
Degrees EG-1 EG-1 Electrical
Generator Engine
14 309,321 3,576,463 12.0 1.333 129.0 1,007.0
EG-1 EG-1 Electrical Generator Engine
14 309,321 3,576,463 12.0 1.333 129.0 1,007.0
FUG-CH4
FUG-CH4
Fugitive: Natural Gas
14 309,200 3,577,422 3.0 0.003 0.003 Ambient 200 50 0
FUG-SF6
FUG-SF6
Fugitive: SF6 Circuit Breakers
14 - - 3.0 0.003 0.003 Ambient
EPN = Emission Point Number FIN = Facility Identification Number

47
Currently there are no corresponding NAAQS that have been established for GHGs. Therefore, the PSD NSR background ambient air quality monitoring and impact analysis (i.e., dispersion modeling) are not applicable. Based upon EPA’s recommendations:
Since there are no NAAQS or PSD increments for GHGs, the requirements in sections 52.21(k) and 51.166(k) of EPA’s regulations to demonstrate that a source does not cause or contribute to a violation of the NAAQS is not applicable to GHGs. Thus, we do not recommend that PSD applicants be required to model or conduct ambient monitoring for CO2 or GHGs.15
However, an impacts analysis for non-GHG emissions associated with the FGE Texas Project is being submitted with the TCEQ NSR application.
In addition, a PSD additional impact analysis is not being provided in accordance with EPA’s recommendations:
Furthermore, consistent with EPA’s statement in the Tailoring Rule, EPA believes it is not necessary for applicants or permitting authorities to assess impacts from GHGs in the context of the additional impacts analysis or Class I area provisions of the PSD regulations for the following policy reasons. Although it is clear that GHG emissions contribute to global warming and other climate changes that result in impacts on the environment, including impacts on Class I areas and soils and vegetation due to the global scope of the problem, climate change modeling and evaluations of risks and impacts of GHG emissions is typically conducted for changes in emissions orders of magnitude larger than the emissions from individual projects that might be analyzed in PSD permit reviews. Quantifying the exact impacts attributable to a specific GHG source obtaining a permit in specific places and points would not be possible with current climate change modeling. Given these considerations, GHG emissions would serve as the more appropriate and credible proxy for assessing the impact of a given facility. Thus, EPA believes that the most practical way to address the considerations reflected in the Class I area and additional impacts analysis is to focus on reducing GHG emissions to the maximum extent. In light of these analytical challenges, compliance with the BACT analysis is the best technique that can be employed at present to satisfy the additional impacts analysis and Class I area requirements of the rules related to GHGs.16
Furthermore, the proposed project will not significantly affect residential, commercial, or industrial growth in the area. Approximately 18 new jobs are expected to be created by the addition of the proposed FGE Texas Project. Even if these jobs were to be filled by individuals relocating to the area, it would result in a negligible impact on the existing infrastructure. Because these impacts will be negligible, the corresponding impact on air quality will also be negligible.
Under 40 CFR 52.21, BACT shall be applied to reduce or eliminate air emissions from a new or modified facility. BACT is defined in 40 CFR 52.21(b)(12) as:
An emissions limitation (including a visible emission standard) based on the maximum degree of reduction of each pollutant subject to regulation under the Act which would be emitted from any proposed major stationary source or major modification which the Administrator, on a case-by-case basis, taking into account energy, environmental, and economic impacts and other costs, determines is achievable for such source or modification through application of production
15 Obtained from pages 47–48 of EPA’s PSD and Title V Permitting Guidance for Greenhouse Gases dated March 2011, available at: http://www.epa.gov/nsr/ghgdocs/ghgpermittingguidance.pdf. Accessed November 2012. 16 Obtained from page 48 of EPA’s PSD and Title V Permitting Guidance for Greenhouse Gases dated March 2011, available at: http://www.epa.gov/nsr/ghgdocs/ghgpermittingguidance.pdf. Accessed November 2012.

48
processes or available methods, systems, and techniques, including fuel cleaning or treatment or innovative fuel combustion techniques for control of such pollutant. In no event shall application of best available control technology result in emissions of any pollutant which would exceed the emissions allowed by any applicable standard under 40 CFR parts 60 and 61. If the Administrator determines that technological or economic limitations on the application of measurement methodology to a particular emissions unit would make the imposition of an emissions standard infeasible, a design, equipment, work practice, operation standard, or combination thereof, may be prescribed instead to satisfy the requirement for the application of best available control technology. Such standard shall, to the degree possible, set forth the emissions reduction achievable by implementation of such design, equipment, work practice or operation, and shall provide for compliance by means which achieve equivalent results.17
FGE has completed a BACT analysis using the EPA’s five-step process for the proposed GHG emission units, which is provided in Section 7.
New Source Performance Standards There are currently no New Source Performance Standards (NSPS) for GHGs. However, for the permitting of non-GHG pollutants, FGE is submitting to the TCEQ an Air Quality New Source Review (NSR) Initial Permit Application for approval to construct (submitted under separate cover). The applicable criteria pollutant NSPS are addressed within the PSD NSR Initial Permit Application submitted to TCEQ.
However, on March 27, 2012, the EPA proposed NSPS Subpart TTTT that would control GHG emissions from new power plants.18 The proposed rule would apply to fossil fuel–fired electric generating units that generate electricity for sale and are larger than 25 MW. The EPA proposed that new power plants meet an annual average output based standard of 1,000 pounds of carbon dioxide per megawatt hour (lb CO2/MWh) gross. The design emission rates for the Alstom turbines on a net electrical output basis range from 760 to 832 lb CO2/MWh without duct burner firing and 822 to 889 lb CO2/MWh with maximum duct burner firing. These values do not account for design, performance, and degradation margins. In addition, these values are on a lb CO2/MWh emission rates on a gross electrical output basis will be approximately 2% lower than the proposed rates on a net electrical output basis. Therefore, the proposed CO2 emission rates from the Alstom combined cycle turbines are well within the emission limit proposed in NSPS Subpart TTTT.
National Emission Standards for Hazardous Air Pollutants There are currently no National Emissions Standards for Hazardous Air Pollutants (NESHAP) for GHGs. However, for the permitting of non-GHG pollutants, FGE is submitting concurrently with this application an application to the TCEQ an Air Quality New Source Review (NSR) Initial Permit Application for approval to construct (submitted under separate cover). The applicable criteria pollutant NESHAP are addressed within the PSD NSR Initial Permit Application submitted to TCEQ.
17 40 CFR 52.21(b)(12). 18 Standards of Performance for Greenhouse Gas Emissions for New Stationary Sources: Electric Utility Generating Units, 77 Federal Register 22392, April 13, 2012.

49
7.0 BEST AVAILABLE CONTROL TECHNOLOGY In the EPA guidance document, PSD and Title V Permitting Guidance for Greenhouse Gases (EPA 457/B-11-001), the EPA recommends the use of the five-step “top down” BACT process. This process requires identification and consideration of all available control technologies for each emission source. The applicant must then demonstrate control technologies that are infeasible due to technical, environmental, or economic constraints. All remaining technologies are ranked in order of descending order of control effectiveness. The top-ranked control option must be selected unless the applicant can demonstrate that it is not viable due to either technical or economic infeasibility or adverse environmental impact. If the most effective technology is not selected, then the next most effective alternative should be evaluated until an option is selected as BACT. In an October 1990 draft guidance document,19 the EPA laid out a five-step procedure for conducting a top-down BACT evaluation:
• Step 1 – Identify all available control technologies. • Step 2 – Eliminate technically infeasible options. • Step 3 – Rank remaining control technologies. • Step 4 – Evaluate and document remaining control technologies. • Step 5 – Select BACT.
If it can be demonstrated that BACT is technically, environmentally, or economically impractical on a case-by-case basis for the particular source under evaluation, then the next most stringent level of control is determined and similarly evaluated. BACT is analyzed for each pollutant, even when a particular control technology reduces emissions on more than one pollutant. This process continues until a control technology and associated emission level is determined that cannot be eliminated by any technical, environmental, or economic objections.
BACT Assessment Methodology BACT for the FGE Texas Project has been evaluated using a “top-down” five-step approach. Each of the steps listed above has been evaluated in detail for each project-related GHG emissions source and are outlined in further detail within the following subsections.
Step 1 – Identify Control Technologies The primary objective of Step 1 is to identify all potentially applicable control options. Potentially applicable control options are those air pollution control technologies, or techniques, with a practical potential for application to the emission unit and regulated pollutant under evaluation. Available control options include the application of alternative production processes and control options including fuel cleaning and innovative fuel combustion, where applicable. Potentially applicable control options are categorized as lower emitting processes/practices or add-on controls.
A lower polluting process/practice is considered applicable if it has been demonstrated in a similar application. An add-on control is considered applicable if it can properly function given the physical and chemical characteristics of the pollutant-bearing emission stream. Additionally, combinations of control options should be considered whenever such combinations would provide more effective emissions control. While identified control technologies may be eliminated in subsequent steps based on technical and/or economic infeasibility or environmental, energy, or other impacts, these control technologies with potential application to the emission unit under review are identified in Step 1. 19 EPA New Source Review Workshop Manual, October 1990.

50
A review of U.S. EPA control technology data, technical literature, control technology equipment vendor information, Federal/State/Local permitting files, and engineering experience were researched to identify potentially applicable emission control technologies for the emission units proposed by FGE. A search of EPA’s RACT/BACT/LAER Clearinghouse (RBLC) data was performed in October 2012 to identify emission control technologies and emission limits that were determined by permitting authorities as BACT within the previous 10 years for emission sources comparable to the proposed emission units.
FGE performed a search of the EPA’s RBLC for natural gas–fired combustion turbines, but no entries specifying BACT for GHG emissions were found. However, a review of pending permit applications and issued permit not included in the RBLC were reviewed. A summary of the search results are presented in Appendix C.
Step 2 – Eliminate Technically Infeasible Options The objective of Step 2 is to refine the list of potentially applicable control technology options developed in Step 1 by evaluating the technical feasibility of each of the control technology options. Per EPA’s Draft NSR Workshop Manual, an undemonstrated control technology is considered technically feasible if it is “available” and “applicable.” This means that the control technology must be “commercially available” and “has reached the licensing and commercial sales stage of development.” Therefore, control technologies in the R&D and/or pilot scale stages of development would not be considered “commercially available.”
EPA’s Draft NSR Workshop Manual provides additional guidance on availability and applicability of a given technology for a particular source type:
A control technique is considered available… if it has reached the licensing and commercial sales stage of development. A source would not be required to experience extended time delays or resource penalties to allow research to be conducted on a new technique. Neither is it expected that an applicant would be required to experience extended trials to learn how to apply a technology on a totally new and dissimilar source type. Consequently, technologies in the pilot scale testing stages of development would not be considered available for BACT review.4 Commercial availability by itself, however, is not necessarily sufficient basis for concluding a technology to be applicable and therefore technically feasible. Technical feasibility, as determined in Step 2, also means a control option may reasonably be deployed on or "applicable" to the source type under consideration. Technical judgment on the part of the applicant and the review authority is to be exercised in determining whether a control alternative is applicable to the source type under consideration.
In general, a commercially available control option will be presumed applicable if it has been or is soon to be deployed (e.g., is specified in a permit) on the same or a similar source type. Absent a showing of this type, technical feasibility would be based on examination of the physical and chemical characteristics of the pollutant-bearing gas stream and comparison to the gas stream characteristics of the source types to which the technology had been applied previously. Deployment of the control technology on an existing source with similar gas stream characteristics is generally sufficient basis for concluding technical feasibility barring a demonstration to the contrary.20
20 NSR Workshop Manual (Draft), Prevention of Significant Deterioration (PSD) and Nonattainment New Source Review (NNSR) Permitting, dated October 1990, page 18. Available at: http://www.epa.gov/ttn/nsr/gen/wkshpman.pdf

51
FGE has utilizes this guidance to determine whether the control technology is both available and applicable. Control technologies that are not available or not applicable were determined to be technically infeasible.
Step 3 – Rank Remaining Control Technologies by Control Effectiveness Step 3 is the ranking of the technically feasible control options developed in Step 2 in order from most effective to least effective in terms of emissions reduction potential. For purposes of the BACT analysis presented herein, the unit of measure used for the emissions rate of each pollutant from each emission unit was mmBtu/kWh and lb CO2/MWh for emissions produced by a combustion turbine, and tons per year (tpy) for emission produced by RICEs and fugitive sources.
Achievable emissions limits were established for each of the control technology options based on manufacturer’s data, engineering estimates, published literature and the experience of other sources. In cases where the specified emissions reduction level was different than the reduction experienced at other similar sources, source specific, and/or other technical, economic, energy, or environmental factors were presented to justify the difference.
Step 4 – Evaluate Most Effective Controls and Document Results The purpose of Step 4 is to either confirm the suitability of the top ranked control technology option as BACT, or provide clear justification for a determination that a lower-ranked control technology option is BACT for the case under consideration. In order to establish the suitability of a control technology option, a case-by-case evaluation of the energy, environmental, and economic impacts of the control technology is performed.
The energy impacts analysis determines whether the energy requirements of the control technology would result in any significant energy penalties or benefits. The environmental impacts analysis considers site-specific impacts of the solid, liquid, and gaseous discharges that would result from implementation of the control technology. The economic analysis considers the cost effectiveness and the incremental cost effectiveness to establish whether the control technology would result in a negative economic impact.
If the adverse collateral impacts do not disqualify the top-ranked option from consideration it is selected as the basis for the BACT limit. However, if the permitting agency concurs that unreasonable adverse energy, environmental, or economic impacts are associated with the top control option, the next most stringent option is evaluated. This process continues until the evaluated alternative is not rejected and is selected as BACT.
Step 5 – Most effective control alternative not eliminated selected as BACT In Step 5, the highest ranked control technology not eliminated in Step 4 is selected as BACT. BACT is typically an emission limit unless technological or economic limitations of the measurement methodology make the establishment of an emission limit infeasible. In this case a work practice or operating standard can be imposed.

52
BACT for Combustion Turbines The combustion turbines for the facility will consist of four Alstom GT24 gas combustion turbines, four HRSGs, and a pair of admission-condensing steam turbine.
Step 1 – Identify All Available Control Technologies For combined cycle combustion turbines, there are two potential technological alternatives to limit turbine GHG emissions:
• Add-on Controls: o Carbon capture and sequestration (CCS), including CO2 capture/compression, transport,
and/or storage • Inherently lower-emitting processes, practices, and designs, as applied to:
o combustion turbine; o heat recovery steam generator; o steam turbine; and o plant-wide.
FGE performed a search of the EPA RBLC for natural gas–fired turbines; however, the database contained no entries for BACT determinations for GHG emissions. FGE also reviewed a number of recently issued PSD permits for GHG emissions from combined-cycle natural gas turbines:21 A summary listing of recently issued GHG permits and applications under review for GHG emissions from combustion turbines is provided as Table 1 in Appendix C. None of the identified permits proposed the use of CCS as BACT, having each ruled out the technology as technically and/or financially impracticable at the time. The PSD permits did propose, however, inherently lower-emitting processes, practices, and designs for the combustion turbines.
The following subsections provide a discussion of the available add-on controls and inherently lower-emitting processes, practices, and designs.
CARBON CAPTURE AND SEQUESTRATION
CCS is classified as an add-on pollution control technology, which involves the separation and capture of CO2 from flue gas, pressurizing of the captured CO2 into a pipeline for transport, and injection/storage within a geologic formation. CCS is general applied to “facilities emitting CO2 in large concentrations, including fossil fuel-fired power plants, and for industrial facilities with high-purity CO2 streams (e.g., hydrogen production, ammonia production, natural gas processing, ethanol production, ethylene oxide production, cement production, and iron and steel manufacturing).”22 The following subsections address the potential control options related to the practical application of CCS.
CO2 Capture
Emerging CCS technologies generally consist of processes that separate CO2 from combustion process flue gas, and then inject it into long-term geologic formations such as oil and gas reservoirs, unmineable coal seams, and underground saline formations. 21 U.S. EPA, PSD Greenhouse Gas Permitting Process for facilities located in Arkansas and Texas. Available at: http://yosemite.epa.gov/r6/Apermit.nsf/AirP. Accessed December 2012. 22 U.S. EPA, Office of Air Quality Planning and Standards, PSD and Title V Permitting Guidance for Greenhouse Gases. March 2011. Available at: http://www.epa.gov/nsr/ghgdocs/ghgpermttingguidance.pdf.

53
For large, point sources, there are three types of capture configurations: pre-combustion capture, post-combustion capture, and oxy-combustion capture:
1. Pre-combustion involves the capture of CO2 prior to combustion. It is a technological option available mainly to integrated coal gasification combined-cycle (IGCC) plants. In these plants, coal is gasified to form synthesis gas (syngas with key components of carbon monoxide and hydrogen). Carbon monoxide is reacted with steam to form CO2 which is then removed and the hydrogen is then diluted with nitrogen and fed into the gas turbine combined-cycle.
2. Post-combustion capture involves extracting CO2 in a purified form from the flue gas following combustion of the fuel. This technology is primarily designed for coal-fired power plants and electric generating units (EGU). Currently, all commercial post-combustion capture have been added to the slip steams of coal-fired power plants and is via chemical absorption process using monoethanolamine (MEA)-based solvents.23
3. Oxy-combustion technology is primarily applied to coal-burning power plants where the capture of CO2 is obtained from a pulverized coal oxy-fuel combustion in which fossil fuels are burned in a mixture of recirculated flue gas and oxygen rather than air. The remainder of the flue gas, that is not recirculated, is rich in carbon dioxide and water vapor, which is treated by condensation of the water vapor to capture the CO2.24
Based upon a review of commercially available CO2 capture technologies conducted in 2009, 17 facilities utilizing both chemical and physical capture solvents, were identified in current operation. These facilities in current operation included three post-combustion capture from pulverized coal-fired power plants located in the United States, a coal gasification plant located in the United States, CO2 capture from an oxygen-fired coal combustion plant in Germany, two post-combustion capture from natural gas–fired facilities outside of the United States (Sumitomo Chemicals Plant located in Japan and Prosint Methanol Production Plant located in Brazil), four CO2 capture for natural gas reforming facilities located outside of the United States, and six CO2 capture from natural gas production facilities located in Algeria, Norway, and the United States. The largest facility is a natural gas production facility located in Wyoming (Shute Creek Natural Gas Processing) with a capture rate of 4 million tpy of CO2 for use in enhanced oil recovery. 25
Of the emerging CO2 capture technologies that have been identified, only post-combustion capture via amine absorption is currently commercially viable for natural gas CO2 separation processes. Amine absorption has been applied to processes in the petroleum refining, natural gas processing industries and for exhausts from gas-fired industrial boilers. Other potential CO2 capture technologies are currently only commercially available for combustion of other fuels (e.g., coal gasification CO2 pre-combustion) or are developmental and are therefore commercially unavailable at this time. Table 5 presents a summary listing of the small-scale CO2 post-combustion capture project.
In addition, the removal of CO2 from a fossil fuel-fired power plant is possible using amine absorbents; however, separating the CO2 presents challenges such as:
23 Wes Hermann et al. 2005. An Assessment of Carbon Capture Technology and Research Opportunities – GCEP Energy Assessment Analysis, Spring 2005. Available at: http://gcep.stanford.edu/pdfs/assessments/carbon_capture_assessment.pdf. Accessed December 2012. 24 U.S. Department of Energy, Office of Fossil Energy, National Energy Technology Laboratory. 2008. Oxy-Fuel Combustion. Available at: http://www.netl.doe.gov/publications/factsheets/rd/R&D127.pdf. 25 Table A-2. Summary of CO2 Capture Facilities Operating in 2009. In Report of the Interagency Task Force on Carbon Capture and Storage, August 2010. Available at: http://fossil.energy.gov/programs/sequestration/ccstf/CCSTaskForceReport2010.pdf. Accessed December 2012.

54
• a large volume of gas must be treated (approximately 2 million cubic feet per minute (cfm) for a 500-MW fossil fuel-fired plant);
• the CO2 concentration in flue gas is dilute (exhaust from a coal-fired power plant (typically 12–14 volume percent [vol%]) is significantly higher in CO2 concentration when compared to that of a natural gas–fired combustion turbine (typically 6–8 vol%);
• the flue gas is emitted at a low pressure (typically 15–25 pounds per square inch, absolute [psia]); and
• the flue gas contains impurities (e.g., PM, SOX, NOX, etc.) that can degrade the amine solvent.26
The FGE Texas Project is proposing Alstom GT24 combustion turbines. According to data provided by Alstom, each power block would emit approximately 5 million cfm with a CO2 stack concentration at base load ranges (at 5°F / 55% RH and 95°F / 20% RH) from 4.060 to 4.211 vol% without duct firing and from 4.850 to 4.930 vol% with duct firing.
According to the U.S. Department of Energy’s National Energy Technology Laboratory (DOE-NETL), although several commercially available CO2 capture systems are available, recovering CO2 from dilute flue gas streams is currently not commonly installed fully on a power plant:
Capturing CO2 from more dilute streams, such as those generated from power production, is less common. For example, several power plants produce food-grade CO2. Although there are commercially available CO2 capture technologies, one of the key barriers to their widespread commercial deployment is the lack of experience with these systems at the appropriate scale at power plants. Currently operating CO2 capture systems in coal-based power plant applications include amine and chilled ammonia solvent systems that process about 75,000 to 300,000 tons of CO2 per year. By comparison, a single 550-megawatt (MW) net output coal-fired power plant capturing 90 percent of the emitted CO2 will need to separate approximately 5 million tons of CO2 per year.27
According to the DOE-NETL, in order to further the commercial deployment of CO2 capture systems, the DOE plans to sponsor several large-scale demonstrations from IGCC and conventional power plants in 2014 to 2016 timeframes.28 In addition to these proposed DOE Clean Coal Power Initiative projects,
26 Appendix A – CO2 Capture – State of Technology Development: Supplemental Material in 2009. In Report of the Interagency Task Force on Carbon Capture and Storage, August 2010. Available at: http://fossil.energy.gov/programs/sequestration/ccstf/CCSTaskForceReport2010.pdf. Accessed December 2012. 27 DOE-NETL, Carbon Sequestration: FAQ Information Portal – Carbon Capture. Available at: http://www.netl.doe.gov/technologies/carbon_seq/FAQs/carboncapture2.html. Accessed December 2012. 28 DOE-NETL, Carbon Sequestration: FAQ Information Portal – Carbon Capture. Available at: http://www.netl.doe.gov/technologies/carbon_seq/FAQs/carboncapture2.html. Accessed December 2012.

55
Table 5. Summary of Small-Scale CO2 Post-Combustion Capture Projects
Project Name Description Location Timeframe Capture Technology
CO2 Capture Rate (tpy)
CO2 End Use
Pulverized Coal-fired Facilities
AEP Mountaineer Power Plant
20-MW slipstream from a 1,300-MW coal-fired plant
New Haven, WV
Sept. 2009 – May 2011
Alstom’s Chilled Ammonia Process
110,000 Geologic Storage
First Energy R.E. Burger
1-MW slipstream from a 50-MW demonstration-scale unit
Shadyside, OH
Dec. 2008 – Dec. 2010
ECO2 ® Technology (ammonia-based solvent)
9,125 Unknown
AES Warrior Run Slipstream from a 180-MW coal-fired circulating fluidized bed plant
Cumberland, MD
2000 – present Amine 110,000 Food/beverage
AES Shady Point Power Plant
Slipstream from a 320-MW coal-fired circulating fluidized bed boiler
Panama, OK 1991 – present Amine 72,600 Food/beverage
IMC Chemicals (previously Searles Valley Minerals)
Flue gas from two (2) 52 – 60-MW industrial coal-fired boilers
Trona, CA 1978 – present Amine 297,000 Soda Ash Production
WE Energy Pleasant Prairie
5-MW slipstream from a 1,210-MW coal-fired power plant
Pleasant Prairie, WI
June 2008 – Oct. 2009
Alstom’s Chilled Ammonia Process
15,000 Unknown
Natural Gas-fired Facilities
Sumitomo Chemicals Plant
Slipstream from onsite gas and coal/oil gas processing boilers
Japan 1994 – present Amine 59,400 Food/beverage
Prosint Methanol Production Plant
Slipstream from a gas-fired boiler plant
Brazil 1997 – present Amine 29,700 Food/beverage
Florida Light & Power
48-MW slipstream from a 320-MW natural gas-fired combined cycle power plant
Bellingham, MA
1991 – 2005 Amine 116,800 – 127,750
Food/beverage
Sources: CCS Task Force Report, http://www.epa.gov/climatechange/downloads/CCS-Task-Force-Report-2010.pdf, p. 31. International Energy Agency GHG Research & Development Program, RD&D Database: CO2 Capture Commercial Projects, http://www.ieaghg.org/index.php?/RDD-Database.html. Alstom and AEP Commission Mountaineer CCS Demonstration, Carbon Capture Journal, Oct. 30, 2009, http://www.carboncapturejournal.com/displaynews.php?NewsID=475. MIT Carbon Capture & Sequestration Technologies, AEP Alstom Mountaineer Fact Sheet: Carbon Dioxide Capture and Storage Project, March 7, 2012, http://sequestration.mit.edu/tools/projects/aep_alstom_mountaineer.html. American Electric Power, http://www.aep.com/environmental/climatechange/carboncapture/. Powerspan, FirstEnergy ECO2® Pilot Facility, http://powerspan.com/projects/firstenergy-eco2-pilot-facility/; http://powerspan.com/technology/eco2-co2-capture/independent-review-of-eco2/ Electrical Power Research Institute, CO2 Capture and Storage Newsletter 2(2006), “Visit to the Trona plant MEA CO2 Removal System in Trona, California, in September 2006,” http://mydocs.epri.com/docs/public/000000000001014698.pdf. MIT Carbon Capture & Sequestration Technologies, AEP Alstom Mountaineer Fact Sheet: Carbon Dioxide Capture and Storage Project, November 23, 2011, http://sequestration.mit.edu/tools/projects/pleasant_prairie.html. International Energy Agency GHG Research & Development Program, RD&D Database: Florida Light and Power Bellingham CO2 Capture Commercial Project, http://www.ieaghg.org/index.php?/RDD-Database.html. Reddy, Satish, et al., Fluor’s Econamine FG PlusSM Technology for CO2 Capture at Coal-fired Power Plants, Power Plant Air Pollutant Control “Mega” Symposium, August 25–28, 2008, Baltimore, Maryland, http://web.mit.edu/mitei/docs/reports/reddy-johnson-gilmartin.pdf.

56
the TCEQ issued an initial standard permit on September 28, 2012, to Texas Energy Development Services LLC (TEDS), for a proposed 250-MW electrical generating unit at Point Comfort, Calhoun, Texas. The proposed project consists of a single combined cycle GE LMS100 gas-fired combustion turbine that will be equipped with CO2 capture capabilities. According to the application submitted by TEDS, the proposed facility is scheduled to commence construction in January 2014.
Though promising in terms of full-scale implementation on a natural gas–fired combined cycle combustion turbine unit, the project has yet to be constructed and has not been demonstrated in practice. While several solvent-based CO2 capture processes are commercially available and have been applied to a number of coal-fired power plants and natural gas reforming processes, the technology has not been demonstrated at full-scale on natural gas-fired combustion turbines.
The Report to the Interagency Task Force on Carbon Capture and Storage adds:
Post-combustion CO2 capture offers the greatest near-term potential for reducing power sector CO2 emissions because it can be retrofitted to existing plants and can be tuned for various levels of CO2 capture …, which may accelerate market acceptance. Although post-combustion capture technologies would typically be applied to conventional coal-fired power plants, they can also be applied to the combustion flue gas from IGCC power plants, natural gas combined cycle (NGCC) power plants, and industrial facilities that combust fossil fuels. Currently, several solvent-based capture processes are commercially available, but they have not yet been demonstrated at the scale necessary to help achieve GHG reduction targets.29
CO2 Compression and Transport
Even if carbon capture can be reliably achieved in terms of full-scale implementation, the CO2 must still be compressed to 100 atmospheres (atm) or higher for transport (usually by pipeline), and routed into a geologic formation capable of long-term storage. The compression of the CO2 gas would require a large auxiliary power load, which would result in the combustion of additional fuel and additional CO2 emissions to generate the same amount of power.
The transporting of captured CO2 can have significant challenges and associated environmental impacts including:
• development of transportation infrastructure (e.g., permitting, acquisition of right-of-ways, pipeline routing, etc.); and
• air quality emissions from the construction and operational/maintenance of the pipeline (e.g., fugitive dust, criteria, and GHG emissions associated with the mobile and point sources.
In order to transport the captured and compressed CO2 to a site for potential storage, a project would have to connect to an existing CO2 pipeline, build a new CO2 pipeline, or transport the CO2 via mobile sources (e.g., ship, tanker truck, etc.). As presented on Figure 8, and based on an EPA map of existing and planned CO2 pipelines, the closest potential sequestration site is approximately 25 miles to the north-northwest from the proposed FGE facility. 30 However, it is unknown whether this closest potential
29 Appendix A – CO2 Capture – State of Technology Development: Supplemental Material in 2009. In Report of the Interagency Task Force on Carbon Capture and Storage, August 2010. Available at: http://www.epa.gov/climatechange/Downloads/ccs/CCS-Task-Force-Report-2010.pdf. Accessed December 2012. 30 Figure B-1: Existing and Planned CO2 Pipelines in the United States with Sources. Appendix B – CO2 Pipeline Transport – State of Technology Development: Supplemental Material in 2009. In Report of the Interagency Task Force on Carbon Capture and Storage, August 2010. Available at: http://www.epa.gov/climatechange/Downloads/ccs/CCS-Task-Force-Report-2010.pdf. Accessed December 2012.

57
sequestration site currently has or would have in the future available capacity to transport any or all of the project’s potential CO2 emissions.
The FGE Texas Project is located near the Cline Shale formation, which is estimated to be a significant repository/geological formation for oil and natural gas reserves. However, according to information FGE obtained from various exploration and production (E&P) companies, at this time, enhanced oil recovery (EOR) activities are not thought to be utilized for at least 20 years (if ever) due to new drilling and extraction technologies and methods, as well as the early stage of E&P activities in the Cline Shale. Given the absence of the market need for CO2 for EOR activities in the immediate vicinity, the nearest EOR market need is more than 100 miles to the west near Midland, Texas.
Figure 8. Existing and planned CO2 pipelines in relation to the FGE Texas Project.
CO2 Storage
The long-term storage potential for a formation is a function of the volumetric capacity of a geologic formation and CO2 trapping mechanisms within the formation. The DOE-NETL describes the geologic formations that could potentially serve as CO2 storage sites as follows:
Carbon dioxide storage can take place in several geologic formations. One option is storage in mature oil and gas reservoirs. Once the oil and gas is extracted from an underground formation it leaves a permeable and porous volume that can be readily filled with CO2. Injecting CO2 can also enhance oil production by pushing fluids towards producing wells through a process called enhanced oil recovery (EOR). Most mature oil and gas fields have been extensively studied and documented. The information gathered through the process of oil and gas production is useful in evaluating and demonstrating the suitability of these fields as secure CO2 storage sites. Since the

58
equipment and infrastructure to inject CO2 and to remove oil and gas are similar, few field modifications may be required.
A second option for CO2 storage is injection into saline formations. Saline formations consist of porous rock filled with brine, or salty water, and span large volumes deep underground. Studies have revealed that saline formations have the largest potential volume for storing CO2 around the world. Using current U.S. CO2 emission rates, studies have shown over 450 years of storage potential in the identified areas. Current studies are underway to more fully understand saline formations and to determine their suitability for long-term CO2 storage.
Carbon dioxide can also be stored within unmineable coal seams. Some coal seams may be too deep or too thin to be mined but may still serve as locations to store CO2. Coal seams may also contain methane (CH4), which can be produced in conjunction with CO2 injection. In coal seams the injected CO2 can be chemically trapped by being adsorbed to the coal. This trapping mechanism allows for permanent storage of CO2. Although the estimated storage volume of coal seams is lower than the first two options, the availability of CH4 as a byproduct makes it an attractive alternative.
Two final options currently under investigation are basalt formations and organic shale basins formations for CO2 storage. Basalt is a type of volcanic rock and has the potential to chemically absorb the stored CO2 through mineralization, thereby permanently trapping the CO2. A major challenge in using basalt is that the formation typically has low permeability. Research is currently being done to evaluate the suitability of basalt for CO2 storage. Shale formations are found across the United States and are typically made up of low porosity and low permeability rocks best suited as confining zones. However, some shales, like coal, have the ability to trap CO2 through adsorption, making them potentially attractive for storage. The advents of new drilling and field technologies that can enable injection of CO2 into shale formations have opened the possibility of shale as a potential option for CO2 storage. As these new methods continue to develop, shale may become another viable option for long-term CO2 storage.31
According to the Bureau of Economic Geology, the Scurry Area Canyon Reed Operators (SACROC) Research Project has injected over 175 million tonnes of CO2 into the SACROC oilfield located near the eastern edge of the Permian Basin in Scurry, Texas. Figure 9 presents the proposed location of the FGE Texas Project in relation to the Permian Basin and SACROC Oilfield.32
INHERENTLY LOWER-EMITTING PROCESSES, PRACTICES, AND DESIGNS
As discussed, inherently lower-emitting processes, practices, and designs can be identified as BACT for the combustion turbines, the heat recovery steam generator, the steam turbine, and for plant-wide operations. A summary of available, lower greenhouse gas emitting processes, practices, and designs for each of these components is presented below.
31 DOE-NETL. 2012. Carbon Storage: What are the different options for CO2 storage? Available at: http://www.netl.doe.gov/technologies/carbon_seq/FAQs/carbonstorage2.html. Accessed December 2012. 32 Figure B-1: Existing and Planned CO2 Pipelines in the United States with Sources. Appendix B – CO2 Pipeline Transport – State of Technology Development: Supplemental Material in 2009. In Report of the Interagency Task Force on Carbon Capture and Storage, August 2010. Available at: http://www.epa.gov/climatechange/Downloads/ccs/CCS-Task-Force-Report-2010.pdf. Accessed December 2012.

59
Combustion Turbine Energy Efficiency Processes, Practices, and Designs
CO2 is product of complete combustion where all the carbon in the fuel forms CO2 and all the hydrogen forms water (H2O). This is a fundamental result in any fossil fuel–fired power plant regardless of the generation technology. The theoretical combustion equation for methane (CH4) is as follows:
CH4 + O2 = CO2 + 2H2O
Therefore, it is not possible to reduce the amount of CO2 generated from combustion, as CO2 is the essential product of the chemical reaction between the fuel and the oxygen in which it burns, not a byproduct caused by imperfect combustion.
The only effective means to reduce the amount of CO2 generated by a fossil fuel–burning power plant is to increase the efficiency of the plant by generating as much electric power as possible from the combustion of the fuel, and thereby reducing the amount of fuel needed to meet the plant’s required power output. The following subsections provide a discussion on the available, lower GHG-emitting processes, practices, and designs for combustion turbines.
Figure 9. SACROC Oil Field in relation to the FGE Texas Project.
Fuel Selection – According to EPA, the use of fuels with low carbon and high heat intensity should be considered in a GHG BACT analysis, provided a change in the fuel does not fundamentally redefine the source. The use of natural gas fuels meets these criteria, as demonstrated in Table 6 summarizing emission factors for various solid and gaseous fuels.

60
Table 6. Emissions of CO2 from Solid and Gaseous Fuels Available For Use in Combustion Turbines
Fuel Option Emission Factor (kg CO2 / MMBtu)
Carbon Intensity (relative to natural gas)
Natural Gas / Fuel Gas Blend 53.02–59.00 –
Propane Gas 61.46 1.04–1.16
Distillate No. 2 73.96 1.25–1.39
Biomass Liquids 68.44–81.55 1.16–1.54
Biomass Solids 93.80–118.17 1.59–2.23
Source: 40 CFR Part 98, Table C-1
As natural gas has the lowest carbon intensity and GHG emissions of the possible fuel sources that can be combusted in a turbine, the project meets BACT for the proposed fuel source.
High Efficiency Turbines – FGE proposes to install a total of four Alstom GT24 combustion turbines in a 2-on-1 combined cycle configuration as the high temperature flue gases exhausted from the combustion turbines are directed to a HRSG equipped with supplemental duct burners. The steam generated in the HRSG is then routed to a steam turbine for additional electrical power generation. The most efficient way to generate electricity from a natural gas fuel source is the use of a combined cycle design, as this configuration recovers additional thermal energy, otherwise wasted in a simple cycle plant, to create additional electrical power and ultimately increase the plant’s energy efficiency. The EPA guidance document states, “combined-cycle CTs, which generally have higher efficiencies than simple-cycle turbines, should be listed as options when an applicant proposes to construct a natural gas-fired facility.” 33
Typically for fossil fuel technologies, efficiency ranges from approximately 30%–50% (HHV). A typical coal-fired Rankine cycle power plant has a base load efficiency of approximately 30% (HHV), while a modern natural gas–fired combined cycle unit operating under optimal conditions has a base load efficiency of approximately 50% (HHV).34 According to Alstom, the GT24 combustion turbines operating in combined cycle configuration and under optimal conditions have a base load efficiency of up to 60% (HHV).35
Even though a search through the EPA’s RBLC for GHG emissions for natural gas–fired turbines did not identify any BACT determinations, FGE did find recently issued PSD permit and permit applications for GHG emissions from power plants utilizing combined-cycle natural gas turbines. Each of these permits identified inherently lower-emitting processes, practices, and designs discussed below that could be used to establish BACT for the combined-cycle natural gas turbines proposed by FGE. The turbine efficiency designated as BACT on both a pollutant emissions basis (CO2/MWh) and an energy efficient basis (Btu/kWh) are discussed in Table 7. A detailed listing of recently issued GHG permits and applications under review for GHG emissions from combustion turbines is provided as Table C-1 in Appendix C.
33 U.S. EPA, Office of Air Quality Planning and Standards, PSD and Title V Permitting Guidance for Greenhouse Gases. March 2011. Available at: www.epa.gov/nsr/ghgdocs/ghgpermttingguidance.pdf. 34 Report of the Interagency Task Force on Carbon Capture and Storage, August 2010. Available at: http://www.epa.gov/climatechange/Downloads/ccs/CCS-Task-Force-Report-2010.pdf. Accessed December 2012. 35 Obtained from Alstom’s “Technical Performance – The Next Generation GT24”, available at: http://www.alstom.com/Global/Power/Resources/Documents/Brochures/next-generation-gt24-gas-turbine-performance.pdf. Accessed October 2012.

61
Table 7. Turbine Efficiency BACT
Project BACT
lb CO2/MWh Btu/kWh
Palmdale Hybrid Power Project 774 7,319
Lower Colorado River Authority Thomas C. Ferguson Plant 918 7,720
Calpine Channel Energy Center 920 7,730
Calpine Deer Park Energy Center 920 7,730
Cricket Valley Energy Center N/A 7,605
Pioneer Valley Energy Center 895 N/A
In addition to the high-efficiency primary components of a combustion turbine, there are a number of other design features employed within the turbine that can improve the overall efficiency of the machine. These additional features include:
• periodic burner tuning • insulation • automatic instrumentation and controls • good combustion, operating, and maintenance practices
Periodic Burner Tuning – combustion turbines experience degradation and loss in performance as they are operated. Regularly scheduled maintenance programs are used to maintain optimal thermal efficiency and performance. Thermal efficiency and performance for the duct burners and HRSG are maintained by periodic tuning.
Insulation – Optimal utilization of the HRSG is dependent on minimizing heat transfer to the environment. Heat transfer to the environment is minimized through the use of insulation and by maximizing the contact surface area of the exhaust gases with the HRSG.
Automatic Instrumentation and Controls – Distributed digital system controls are used to automate processes for optimal operation. Higher efficiencies and lower emissions are obtained through automation and easy-to-read digital readouts, which simplify turbine operation.
Good Combustion, Operating, and Maintenance Practices – Vendor-specified combustion, operation, and maintenance procedures and practices are used to ensure optimal equipment efficiencies. Maintenance and operation records are maintained, and employees are trained and certified to Standard Operating Procedures (SOPs) that are developed and implemented along vendor-established guidelines.
Heat Recovery Steam Generator Energy Efficiency Processes, Practices, and Designs
The exhaust gases from the turbines are routed to the HRSGs, which utilize heat exchangers to convert the waste heat from the turbines to power a steam generator. Duct burners are used to provide the additional heat as needed to power the steam generator. Plant efficiency is thus maximized with the use of an HRSG. The exiting HRSG flue gases are directed to the SCR system. The HRSG is designed to maximize heat transfer via the following design process considerations:
• heat exchanger design • insulation

62
• fouling • steam leaks and repair
Heat Exchanger Design – HRSGs are shell-and-tube style heat exchangers designed to maximize the contact surface between the turbine exhaust gas and the feed water. The heat transfer is carried out at multiple pressure levels within the HRSG, with fins used to extend heat transfer surfaces. In the low-pressure section, condensate is heated using the combustion turbine exhaust gas. Steam is further heated and pressured as it moves through the heat exchanger until the saturated high-pressure steam moves through the superheater section of the HRSG, where additional heat is added from duct-burners, as necessary. The expansion of the superheated, high-pressure steam then powers the turbine. Exhaust gas bypass systems and economizer sections are utilized during startup and shutdown to reduce startup and shutdown times, minimizing exhaust emissions and reducing cold-end corrosion.
Insulation – HRSGs are designed to minimize waste heat from combustion by utilizing that waste heat to generate steam to power a steam turbine. The efficient transfer of this heat from the turbine exhaust gases and the minimization of heat losses to the environment is thus an integral part of HRSG design. As described in heat exchanger design, heat transfer surfaces between the exhaust gases and the feed water are maximized through the use of fins to extend surfaces. Additionally, the shell-side housing of the HRSG is well insulated to prevent unnecessary heat losses to the environment.
Fouling – Fouling occurs when deposition of constituents in the exhaust gases occurs on heat transfer surfaces with the heat exchanger. This fouling “insulates” the heat exchange surfaces from heat transfer between the exhaust gases and the feed water, reducing heat transfer efficiency. Fouling is reduced through filtration of the inlet exhaust gases and periodic cleaning of heat exchange surfaces.
Steam Leaks and Repair – Steam loss through venting and leakage reduces the efficiency of the heat exchanger. Venting operations are utilized in certain system areas, such as de-aerator vents, to improve operation. Restricting the venting outlets is used to maximize steam retention for power generation. Reduction in power generation efficiency is apparent if the leak is large enough, and will thus be identified quickly through automatic monitoring and low-pressure alarms. Smaller steam leaks are identified and repaired quickly through the proper implementation of operator SOPs requiring routine checks of the equipment.
Steam Turbine Energy Efficiency Processes, Practices, and Designs
Several aspects of steam turbine design can affect the efficiency of power generation from the turbines: • reheat cycles • exhaust steam condensers • steam turbine generator cooling
Reheat Cycles – Steam turbine efficiency is dependent on the nature of the steam entering the turbine. Reheat cycles are therefore used to achieve higher steam temperatures and pressures and reduce moisture content of the exhaust steam, increasing turbine efficiency.
Use of Exhaust Steam Condenser – Steam turbine efficiency is improved by lowering the exhaust pressure of the steam. This lowering of the exhaust pressure creates a vacuum, creating a natural draw through the turbine and thus increasing turbine efficiency. Condensing units are utilized to lower the exhaust steam to the saturation point, which reduces the exhaust pressure.

63
Steam Turbine Generator Cooling Design – The design of the steam turbine generator can also affect steam turbine efficiency. Cooling the steam turbine generator can improve efficiency. Modern generators are typically cooled through open-air cooling, totally enclosed water-to-air cooling, or hydrogen cooling.
Plant-wide Energy Efficiency Processes, Practices, and Designs
Additional processes, including the use of multiple combustion trains and the use of cooling towers, can improve overall efficiency of the project:
Multiple Combustion Trains – Part-load operation is improved through the use of multiple combustion turbine and HRSG trains. Optimum operating conditions are obtained through the automated shutting down/ramping up of less- and more-efficient operating trains.
Cooling Towers – A closed-loop design, which includes a cooling tower to cool the water, will be utilized for the project. Closed-loop designs are either natural circulation or forced circulation. Both natural circulation and forced circulation designs require higher cooling water pump heads; therefore, increasing the pump’s power consumption and reducing overall plant efficiency. Additionally, to provide the forced circulation, fans are used for the forced circulation designs, which consume additional auxiliary power and reduce the plant’s efficiency.
Step 2 – Eliminate technically Infeasible Options The EPA considers a technology to be technically feasible if it meets the following criteria:
1. If it has been demonstrated and operated successfully on the same type of sources under review. 2. If it is available and applicable to the source type under review.
The following subsections present a discussion on the technical feasibility of CO2 capture, compression and transportation, and sequestration.
CARBON CAPTURE AND SEQUESTRATION
CO2 Capture
As presented, CO2 capture processes include adsorption, physical absorption, chemical absorption, cryogenic separation, and membrane separation. These technologies are in various stages of development from bench-scale to pilot-scale demonstrations.
Absorption
Chemical absorption is characterized by the occurrence of a chemical reaction between the pollutant in gas phase and a chemical in liquid phase to form a compound. The most prevalent chemical for CO2 removal from flue gas are amine solutions. Gas scrubbing systems employing amine are used for a wide variety of gas or liquid hydrocarbon treatment applications. Close contact between the gas and liquid amine solution is required to promote the mass transfer between the two phases. CO2 has a high solubility in the amine scrubbing solution. Several amine solvents are commercially used include monoethanolamine (MEA), diethanolamine (DEA), triethanolamine (TEA), diisoproponalamine (DIPA), diglycolamine (DGA), methyldiethanolamine (MDEA), n-methylethanolamine (NMEA), alkanolamine, and various proprietary mixtures of these amines. Other chemical absorbents including ammonia, potassium carbonate, and lime are also in experimental phases.

64
MEA has been tested in gas turbine applications and offers high capture efficiency, high selectivity, and lowest energy use compared to the other existing processes. However, despite these benefits, MEA requires additional heat recovery which is unobtainable with the current HRSG configuration or installation of supplemental firing which is beyond the scope of this project. Northeast Energy Associates conducted CO2 capture to produce 320 to 350 tons per day CO2 using a Fluor Econamine scrubber on 15% of the flue gas from its 320-MW natural gas combined cycle facility in Bellingham, Massachusetts, from 1991 to 2005. The CO2 was not sequestered, but was produced for the commercial (food-grade) CO2 market and ultimately made its way into the atmosphere. The process was curtailed in 2005 because the CO2 market no longer made the operation profitable.
Physical sorbents include propylene carbonate, SelexolTM, RectisolTM, and MorphysorbTM. Close contact between the scrubbing solvent and gas forces the CO2 into solution. The process has been commercially used to remove CO2 from natural gas production. Although the energy required to regenerate the physical sorbents is much less than that required for chemical sorbents, they are less effective in dilute gas streams such as combustion turbine exhaust.
Adsorption
Laboratory evaluations of natural zeolite, manufactured zeolite sieves, and activated carbon have all shown that these materials preferentially adsorb CO2 over nitrogen, oxygen, and water vapor at elevated pressures. Although these materials show promise for CO2 capture from high pressure gas streams, they are unsuited for low pressure combustion exhaust streams. Therefore, adsorption is considered technically infeasible.
Separation
Polymer-based membrane separation of CO2 is currently under investigation. Membrane separation is potentially less energy-intensive than other methods because there is no chemical reaction or phase change. Currently, potential membrane materials are prone to chemical and thermal degradation. This technology is still experimental and not commercially available. Membrane technology is considered technically infeasible for this project.
In cryogenic separation of CO2, the gas is cooled and compressed to condense CO2. This process is only effective on dry gas streams with high CO2 concentrations and is not feasible for the dilute gas streams from combustion exhaust.
Transportation and Sequestration
Provided CO2 capture and compression could be reliably achieved, the high-volume stream must be transported, typically by pipeline, to longer-term storage to a geologic formation capable of long-term storage. The DOE-NETL states:
A storage site is defined as an underground geologic location where carbon dioxide (CO2) can be potentially stored. The main characteristics of a CO2 storage site refer to its potential to safely and permanently store large amounts of CO2 underground. These characteristics include capacity, injectivity, integrity, and depth.
A storage site needs to have enough capacity to contain large amounts of compressed CO2. The storage capacity varies depending on the location of the site and the different geologic formation properties and structures in the area. Some areas may not be suitable for CO2 storage or limited to a small amount of storage, like a few hundred tons. The storage sites of greatest interest are those which have the potential to store millions of tons of CO2. The capacity of a storage site

65
is directly related to porosity. A porous formation, which acts like a sponge, can allow the injected CO2 to fill the void areas without damaging its surrounding layers.
Similarly, the injectivity of the CO2 is directly related to the permeability of the formation. Permeability is the ability of a porous material to allow fluids to flow across them. A porous formation without adequate permeability will not allow much CO2 to be injected and therefore would be a poor storage site.
The integrity of a CO2 storage site deals with its ability to confine CO2 safely within a predetermined volume. A storage site must have one or more confining zones above the injected formation. These confining zones contain non-porous, low permeability layers of rock that can prevent CO2 from rising to the surface or from potentially contaminating underground water sources. There are also various chemical and physical processes that take place in the storage formation that assist in permanently trapping the CO2 underground.
In most cases, CO2 will be injected as a supercritical fluid (below 2,800 feet), where it will behave more like a liquid than a gas…The decision to select a particular geologic unit for geologic storage usually depends on having a detailed understanding of the reservoir characteristics and the behavior and fate of the injected fluids and their impact on the geologic strata receiving the fluids. Critical factors include: economic analysis of the location of the site, the distance from the CO2 source to the site, the depth of the reservoir (which influences drilling and injectivity of CO2), the volume of CO2 that the site can contain, the trapping mechanisms and sealing capacity, and the ultimate fate of the stored CO2. Many of these issues will be affected by the different classes of reservoirs that are being targeted for injection.36
Finally, carbon sequestration has potential environmental impacts that must be investigated and considered before declaring sequestration viable as BACT, including:
• impacts from brine displacement into fresh water aquifers or surface water; • CO2 leakage into underground or surface drinking water supplies; and • subsequent impacts to local flora and fauna.
While amine absorption technology for the capture of CO2 has been applied to natural gas–fired processes in the petroleum industry and natural gas processing industry, and therefore it is technically feasible to apply the technology to that of power plant turbine exhaust streams. However, the technologies have not been proven to be reliable, nor are they ready for full-scale commercial deployment. Although numerous research pilot-scale projects for high-volume carbon sequestration are underway, these projects are still a few years from implementation. Furthermore, although a single natural gas–fired combined cycle combustion turbine project with CO2 capture capabilities has been issued a standard permit by the TCEQ, this project has yet to be constructed. Although FGE questions whether it is feasible to implement CCS on a full-scale natural gas-fired combustion turbine project, an economic feasibility analysis for implementing CCS for control of the CO2 emissions from the four combustion turbines is discussed in detail in Step 4 of this section.
Step 3 – Rank Remaining Control Technologies Since CCS is eliminated in Step 4 as an economically infeasible control technology, the only remaining technology identified in Step 1 is inherently lower-emitting processes, practices, and designs. Since only
36 DOE-NETL. 2012. Carbon Storage: What are the characteristics of a storage site? Available at: http://www.netl.doe.gov/technologies/carbon_seq/FAQs/carbonstorage1.html. Accessed December 2012.

66
one control technology remains at this step of the BACT analysis, a ranking of the control technologies is not necessary for this application.
Step 4 – Evaluate and Document remaining Control Technologies
COST ANALYSIS
In addition to evaluating the technical feasibility of CCS, FGE evaluated the cost impacts associated with the installation and operation of the CO2 capture and compression equipment, transport via a pipeline, and storage based on published methodologies. As discussed above in Step 1, CCS technology has been demonstrated on a few IGCC plants, some other smaller scale processes, and has been proposed for use on the Texas Energy Development Services’ 250 MW electrical generating unit in Calhoun County Texas. While FGE considers CCS to be technically infeasible and/or unproven in terms of full scale implementation on natural gas-fired combined cycle power plant (CCPP), FGE is providing additional data illustrating that the technology is also economically infeasible for the proposed project. The total construction cost of a CCS system, including CO2 capture, CO2 compression, and CO2 transportation system (pipeline) is primarily dependent on the amount of CO2 captured (“Capture Rate”) from the combined-cycle power plant per MWh of electricity produced. Most of the costs (70-90%) are incurred by the equipment and installation cost of the CO2 capture and compression system37. CCS systems in general are designed for capturing up to 90% of the CO2 present in the flue gas volume generated.
The following subsections provide a discussion of the preliminary design and operational details, the cost associated with the installation and operation of the CO2 capture and compression equipment, a pipeline, and storage evaluated in this cost analysis specific to the FGE Texas Project.
Preliminary Design Details
For the purposes of the theoretical design of a CCS system on the FGE Texas Project the following information was provided by the vendor (Alstom Power) and obtained from published cost estimating sources:
• Anticipated Flue Gas Flow Rate (klb/hr) = 1,439.0 to 4,111.4 • Flue Gas Discharge Temperature (°F) = 157 to 188 • Flue Gas CO2 Concentration (vol. %) = 2.03 to 4.93 • CO2 Target Removal Rate = 90%
The estimated annual CO2 emissions at maximum annual fuel usage for a single power block at the proposed FGE facility are 2,919,436 tons per year38. With an estimated 90% reduction from a carbon capture system, the total captured CO2 would be a maximum of approximately 2,627,492 tons per year.
Cost Impacts of CO2 Capture and Compression Equipment
The capture and compression equipment associated with CCS would have cost impacts based on the installation of the additional process equipment (e.g., amine units, cryogenic units, dehydration units, and compression facilities) along with the annual operation and maintenance (O&M) costs. Furthermore, the operation of the additional process equipment required to separate, cool, and compress the CO2 would require significant energy expenditure. The additional energy required by the carbon capture equipment must be provided from additional combustion units and/or increase the parasitic load on the proposed
37 Value from Report of the Interagency Task Force on Carbon Capture and Storage (August 2010). 38 CO2 emissions from Appendix A - Table 2 - Combustion Turbines (Combined Cycle) Emissions.

67
FGE Texas Project facilities. Allowing for the impact of the power and steam requirements for the carbon capture and compression equipment, the resultant FGE Texas Power net heat rate (efficiency) would be increased more than 1,000 Btu/kWh. This energy to operate this equipment has an associated cost. These are additional costs that would be realized by either generation loss by the facility or by purchase of the power to operate this additional equipment from the grid. Moreover, additional CO2 is created to facilitate the capture process.FGE conducted an analysis of the capital cost impact of CCS capture and compression equipment on the FGE Texas Project using project specific data along with the methodology provided by the Report of the Interagency Task Force on Carbon Capture and Storage (Interagency CCS Report) dated August 2010 (pages 33-34, 37, 44). The cost for capture and compression from a “new” CCPP facility are estimated to be $95/tonne ($86/ton) on “Cost of CO2 Capture” basis and the “Cost of CO2 Avoided” was estimated to be $114/tonne CO2 avoided ($104/ton) both in 2010 U.S. dollars39.
The “Cost of CO2 Avoided” is the measure most frequently used to quantify the cost of CCS, and is defined as the incremental levelized capture costs for a year divided by the difference in intensities between the reference and capture cases multiplied by the MWh produced in the capture case. According to the Interagency CCS Report, the “Cost of CO2 Avoided” includes the full cost of CCS (e.g., capture and compression, transport, and storage) as the CO2 is not avoided unless the CO2 is sequestered.
While the “Cost of CO2 Capture” is defined at the incremental levelized capture costs in a given year divided by the volume of CO2 captured for a given year and only includes the costs associated with the capture and compression of the CO2. These two costs on a dollar per ton CO2 basis represent the annualized costs of CO2 captured and avoided. Calculations of the estimated “Cost of CO2 Capture” and “Cost of CO2 Avoided” for the proposed FGE Texas Project are provided below.
Assuming 90% Capture Rate, the annualized cost on a per power block basis equates to:
$86/ton CO2 * (90% * 2,919,436 ton CO2 / yr) = $226 million/yr (Cost of CO2 Capture)
$104 ton CO2 * (90% * 2,919,436 ton CO2 / yr) = $273 million/yr (Cost of CO2 Avoided)
Therefore, the annualized cost impact of the first major component of CCS (capture and compression) estimated via the Interagency CCS Report would range on a per power block basis from approximately $226 to $273 million.
Cost Impacts of CO2 Transport
Costs associated with the transportation of the captured CO2 through a pipeline were estimated for the FGE Texas Project. Based on the estimated CO2 flow rate, a 6-inch to 10-inch pipeline would be required to transport the captured CO2
40. The cost associated to construct a pipeline of this size would be approximately $650,000 to $750,000 per mile41. Appendix A of this application provides cost calculations for the CO2 transport.
As discussed in Step 1 of the Combustion Turbine BACT Analysis (CO2 Compression and Transport) the closest potential transportation route (an existing Kinder Morgan CO2 pipeline) is approximately 25 miles to the north-northwest from the proposed FGE facility. However, it is unknown whether this Kinder
39 Value from Report of the Interagency Task Force on Carbon Capture and Storage (August 2010). 40 Pipeline sizes based on distance transported of pure CO2 gas flowing at 282,340 lb/hr, as obtained from SNC Lavalin on April 12, 2013. 41 Pipeline capital cost and O&M costs based on equations from DOE NETL analysis as described in CO2 Transport, Storage & Monitoring Costs Quality Guidelines for Energy Systems Studies (March 2010) utilizing estimated pipeline length and diameter values. Calculations included in Appendix A.

68
Morgan CO2 pipeline has, or would have in the future, available capacity to transport any or all of the project’s potential CO2 emissions. Simply because the pipeline exists does not mean it is useable by the FGE Texas Project. The owner (unless otherwise legally obligated) would not be required to provide a conveyance to or accept from FGE the captured CO2.
In addition and based upon information FGE obtained from local E&P companies, with the absence of the market need for CO2 for EOR activities in the immediate vicinity, the nearest enhanced oil recovery (EOR) market need is more than 100 miles to the west near Midland, Texas. According to information FGE obtained from various exploration and production (E&P) companies, at this time, EOR activities are not thought to be utilized for at least 20 years (if ever) due to new drilling and extraction technologies and methods, as well as the early stage of E&P activities in the Cline Shale. Given the absence of the market need for CO2 for EOR activities in the immediate vicinity, the nearest EOR market need is more than 100 miles to the west near Midland, Texas.
FGE has provided a range of costs to install the necessary pipeline to transport the captured CO2 to the nearest existing CO2 pipeline (25 miles) or to build a separate line to the nearest EOR market (100 miles). The total installed cost for the pipeline was estimated at $16.1 to $74.6 million, with an annual O&M cost estimated at 5% of the installed capital cost of approximately $800k to $3.7 million.
Storage Cost Considerations
CO2 storage is the final step of CCS and refers to the process of injecting CO2 into subsurface geologic formations for long-term sequestration and since the 1970s engineered injection of CO2 into geologic reservoirs has also occurred in the contest of EOR. According to the Interagency CCS Report, there is additional capital cost associated with long-term storage of the captured and transported CO2. The cost for storage for a new CCPP is estimated to be $20/tonne of captured CO2 ($18/ton)42. With an estimated 90% reduction from a carbon capture system, the total cost impact associated with the storage of a maximum of approximately 2,627,492 tons per year would have an annualized cost of approximately $47.8 million per year. The storage cost is greatly dependent on numerous factors; such as location, type of reservoir, extent of monitoring activities, etc. In addition, additional revenues from the sale of the CO2 as well as the increase in oil production may offset some of the costs in the context of EOR operations.
A summary of the cost impacts associated with the carbon capture system, CO2 transportation pipeline and CO2 storage for the FGE Texas Project have been summarized in Table 8.
Table 8. Summary of Estimated Costs for Carbon Capture, Transport, and Storage for the FGE Texas Project (per power block)
Parameter Carbon Capture Information Source
Installed Capital Costs
Carbon Capture System (Cost of CO2 Capture to Cost of CO2 Avoided)
$226 to $273 million Interagency Task Force
Pipeline
$16.1 to $74.6 million DOE/NETL-2010/1447 March 2010
Subtotal of Installed Capital Costs $242.1 to $347.6 million [sum of installed capital costs] Annual O&M Costs
Pipeline $800K to $3.7 million Estimated at 5% of capital cost Storage $47.8 million Interagency Task Force Subtotal Annual O&M Costs $6.8 to $9.7 million [sum of annual O&M costs]
42Value from Report of the Interagency Task Force on Carbon Capture and Storage (August 2010).

69
Capital and operational CO2 capture/compression and transportation pipeline costs for the FGE Texas Project can be decoupled as follows:
• For a 90% Capture Rate and utilizing the technology of today, the capital cost increase to install a CO2 capture and compression system based on the Report of the Interagency Task Force on Carbon Capture and Storage (August 2010) still demonstrates an annualized cost impact for just the carbon capture and compression equipment of >$226 million (per each phase, i.e., each 2x1 configuration).
• For a 90% Capture Rate, energy penalty for the Alstom KA24-2 combined-cycle arrangement will be about 14%. This in turn will lower the net power output of the CCPP, or in other words, increase the fuel cost per MWh of electricity produced by approximately 7%, thus requiring a larger plant to net the same electrical energy to the market/grid. Assuming a cost impact of 0.05 $/kWh, this parasitic power loss would amount to an estimated annual cost of lost generation approximately $36.9 to $52.6 million per year based on a single power block operating 6,500 hours.
• Given the absence of the market need for CO2 for EOR activities in the immediate vicinity, the additive cost of building transport (pipelines) to the nearest EOR market need (>100 miles to the west near Midland, Texas) would cost approximately $16.1 to $74.6 million. In addition and estimated at 5% of the capital cost, the annual pipeline O&M costs would be $800\k to $3.7 million annually.
• While additional revenues from the sale of the capture, compressed, and transported CO2 could offset some of the cost in the context of EOR operations, the revenues generated are uncertain and would not be sufficient to offset the cost of the pipeline based on the location of the FGE Texas Project and the nearest EOR markets.
Based on guidance received from EPA Region 6, if the cost to implement CCS increases the capital cost of the project by more than 25%, the addition of CCS is considered economically infeasible. Based on the analysis presented above, the addition of CCS would increase the FGE Texas Projects’ capital cost per phase (i.e., 2x1 configuration) by >30% of the total project cost. Therefore, FGE considers CCS to be economically infeasible for this project, and it is removed from consideration as BACT.
After identifying the available and technically feasible control technologies, the economic, environmental, and energy impacts are evaluated to select the best control option. FGE has determined that the remaining control technologies have no adverse impacts that require additional evaluation. As FGE proposes to implement the processes, practices, and designs identified as BACT in Step 1 for the combustion turbines, the HRSG, the steam turbine, and for plant-wide operations, no further evaluation is necessary.
Step 5 – Select BACT FGE proposes as BACT the following inherently lower-emitting processes, practices, and designs for the combustion turbines, the heat recovery steam generator, the steam turbine, and for plant-wide operations for the FGE Texas Project discussed in Step 1, which are summarized in Table 9 below.

70
Table 9. FGE Proposed BACT Consisting of Inherently Lower-emitting Processes, Practices, and Designs
Inherently Lower-emitting Processes, Practices, and Designs
Proposed BACT
Combustion Turbines • Use of combined cycle technology • Use of natural gas fuel • Efficient turbine design • Turbine inlet air cooling (i.e., evaporative cooling and high fogging) • Periodic turbine combustion tuning • Reduction in thermal heat loss (e.g., insulation material) • Instrumentation and controls
HRSGs • Use of natural gas fuel (duct firing) • Efficient heat exchanger design • Insulation of HRSG • Routine maintenance to minimize fouling of heat exchanger • Minimize vented/purged steam
Steam Turbine • Use of reheat cycles • Use of exhaust steam condenser • Efficient blade design • Efficient generator design
In order to establish an enforceable BACT condition, FGE proposes an appropriate heat-input rate efficiency limit (mmBtu/MWh), which can be achieved over the anticipated life of the facility. FGE proposes a heat rate (HHV, net) for the Alstom GT24 turbines that includes a conservative design, performance, and degradation margins.
The design base load net heat rate for the Alstom GT24 combustion turbines is 6,408 BtukWh (HHV, gross basis) without duct firing. The following margins were used to adjust the design base load heat rate for the proposed combustion turbine being considered for the FGE Texas Project:
• Design Margin (to account for potential differences in the design heat rate and the actual tested heat rate) = 3.3%
• Performance Margin (to account for potential efficiency losses prior to CT overhaul) = 6.0% • Degradation Margin (to account for potential variability in the auxiliary plant equipment as a
result of use over time) = 3.0% • Conversion of gross output to net = 2.0%
Taking into account these adjustments, FGE is proposing the following BACT limits for the project, which can be achieved over the anticipated life of the facility:
• 7,325 Btu/kWh (HHV) equivalent (net, without duct firing); and • 832 lb CO2/MWh (net, without duct firing)
BACT for Diesel Engines Two diesel-fired emergency firewater pumps (FWP-1 and FWP-2) sized up to 389-bhp each and two diesel-fired emergency electrical generators (EG-1 and EG-2) sized up to 900-bhp each are proposed for the project.

71
Step 1 – Identify All Available Control Technologies Step 1 of the top-down BACT analysis is to identify all feasible control technologies. The following technologies were identified as potential control options for emergency engines:
• Use of low-carbon fuel • Use of good operating and maintenance practices
Fuel options include engines powered with electricity, natural gas, or liquid fuel, such as gasoline or fuel oil. Good operating and maintenance practices for the engines include the following:
• Operating with recommended fuel-to-air ratio recommended by the manufacturer • Appropriate maintenance of equipment, such as periodic readiness testing
Step 2 – Eliminate Technically Infeasible Options This step of the top-down BACT analysis eliminates any control technology that is not considered technically feasible unless it is both available and applicable. The purpose of the electricity generation engine is to provide a power source during emergencies, which includes outages of the combustion turbines, natural gas supply outages, and natural disasters, such as floods and hurricanes. The purpose of the firewater pump engine is to provide fire suppression in the event of a fire. As such, the engines must be available during emergencies. Electricity and natural gas may not be available during an emergency and therefore cannot be used as an energy source for the emergency engines.
The engines must be powered by a liquid fuel that can be stored on-site in a tank and supplied to the engines on demand, such as motor gasoline or diesel. The default CO2 emission factors for gasoline and diesel are very similar, 70.22 kg/mmBtu for gasoline and 73.96 kg/mmBtu for diesel. However, diesel fuel has a much lower volatility than gasoline and can be stored for longer periods of time. Therefore, due to the need to store the emergency engine fuel on-site and the ability to store diesel for longer periods of time than gasoline, it is technically infeasible to utilize a lower-carbon fuel than diesel.
The use of good operating and maintenance practices is technically feasible for the emergency engines. Also, a low annual capacity factor for the engines is technically feasible since the engines will only be operated either for readiness testing or for actual emergencies.
Step 3 – Rank Remaining Control Technologies The use of good operating and maintenance practices is proposed for the diesel-fired engines. Since FGE proposes to implement feasible control options, ranking these control options is not necessary.
Step 4 – Evaluate and Document Remaining Control Technologies The use of good operating and maintenance practices is proposed for the diesel-fired engines. Since FGE proposes to implement feasible control options, ranking these control options is not necessary.
Step 5 – Select BACT As a result of this analysis, appropriate operation of the engines through proper fuel to air ratios and maintenance based on recommended readiness testing and low annual hours of operation are selected as BACT for the proposed engines.

72
BACT for Fugitive Emissions The proposed project will include natural gas piping components. These components are potential sources of CH4 emissions due to leaks.
Step 1 – Identify All Available Control Technologies Step 1 of the top-down BACT analysis is to identify all feasible control technologies. The following technologies were identified as potential control options for piping fugitives:
• Implementation of an LDAR program using a handheld analyzer • Implementation of alternative monitoring using a remote sensing technology such as infrared
cameras • Implementation of AVO leak detection program
Step 2 – Eliminate Technically Infeasible Options This step of the top-down BACT analysis eliminates any control technology that is not considered technically feasible unless it is both available and applicable. The use of instrument LDAR and remote sensing technologies are technically feasible. Since pipeline natural gas is odorized with a small amount of mercaptan, an AVO leak detection program for natural gas piping components is technically feasible.
Step 3 – Rank Remaining Control Technologies The use of an LDAR program with a portable gas analyzer meeting the requirements of 40 CFR 60, Appendix A, Method 21, can be effective for identifying leaking methane. Quarterly instrument monitoring with a leak definition of 10,000 ppmv (TCEQ 28M LDAR Program) is generally assigned a control efficiency of 75% for valves, relief valves, sampling connections, and compressors, and 30% for flanges. Quarterly instrument monitoring with a leak definition of 500 ppmv (TCEQ 28VHP LDAR Program) is generally assigned a control efficiency of 97% for valves, relief valves, and sampling connections, 85% for compressors, and 30% for flanges. The EPA has allowed the use of an optical gas imaging instrument as an alternative work practice for a Method 21 portable analyzer for monitoring equipment for leaks in 40 CFR 60.18(g). For components containing inorganic or odorous compounds, periodic AVO walk-through inspections provide predicted control efficiencies of 97% control for valves, flanges, relief valves, and sampling connections, and 95% for compressors. 43
Step 4 – Evaluate and Document Remaining Control Technologies The frequency of inspection and the low odor threshold of mercaptans in natural gas make AVO inspections an effective means of detecting leaking components in natural gas service. As discussed in Step 3, the predicted emission control efficiency is comparable to the LDAR programs using Method 21 portable analyzers.
Step 5 – Select BACT Due to the very low VOC content of natural gas, FGE will not be subject to any VOC leak detection programs by way of its State/PSD air permit, TCEQ Chapter 115 – Control of Air Pollution from Volatile Organic Compounds, New Source Performance Standards (40 CFR 60), National Emission Standard for 43 TCEQ. TCEQ – Control Efficiencies for TCEQ Leak Detection and Repair Programs (revised July 2011). Available at: http://www.tceq.texas.gov/assets/public/permitting/air/Guidance/NewSourceReview/control_eff.pdf. Accessed November 2012.

73
Hazardous Air Pollutants (40 CFR 61); or National Emission Standard for Hazardous Air Pollutants for Source Categories (40 CFR 63). Therefore, any leak detection program implemented will be solely due to potential greenhouse emissions. Since the uncontrolled CO2e emissions from the natural gas piping represent approximately 0.01% of the total site wide CO2e emissions, any emission control techniques applied to the piping fugitives will provide minimal CO2e emission reductions.
Based on this top-down analysis, FGE concludes that daily AVO inspections is BACT for piping components in natural gas service.
Electrical Equipment Insulated with Sulfur Hexafluoride The following proposes appropriate GHG BACT for SF6 emissions.
Step 1 – Identify All Available Control Technologies In determining whether a technology is available for controlling and reducing SF6 emissions from circuit breakers, permits and permit applications and EPA’s RBLC were consulted. In addition, currently available literature was reviewed to identify emission reduction methods.44,45,46 Based on these resources, the following available control technologies were identified:
• Use of new and state-of-the-art circuit breakers that are gas-tight and require less amount of SF6. • Evaluating alternate substances to SF6 (e.g., oil or air blast circuit breakers). • Implementing an LDAR program to identify and repair leaks and leaking equipment as quickly
as possible. • Systematic operations tracking, including cylinder management and SF6 gas recycling cart use. • Educating and training employees with proper SF6 handling methods and maintenance operations.
Step 2 – Eliminate Technically Infeasible Options Of the control technologies identified above, only substitution of SF6 with another non-GHG substance is determined as technically infeasible. Though dielectric oil or compressed air circuit breakers have been used historically, these units require large equipment components to achieve the same insulating capabilities of SF6 circuit breakers. In addition, per the EPA, “No clear alternative exists for this gas that is used extensively in circuit breakers, gas-insulated substations, and switch gear, due to its inertness and dielectric properties.”47 According to the report NTIS Technical Note 1425, SF6 is a superior dielectric gas for nearly all high voltage applications.48 It is easy to use, exhibits exceptional insulation and arc-interruption properties, and has proven its performance by many years of use and investigation. It is clearly superior in performance to the air- and oil-insulated equipment which was used prior to the
44 Robert Mueller. 10 Steps to Help Reduce SF6 Emissions in T&D. Airgas Inc. Available at: http://www.airgas.com/documents/pdf/50170-120.pdf. 45 U.S. EPA. 2008. SF6 Emission Reduction Partnership for Electric Power Systems 2007 Annual Report. Available at: http://www.epa.gov/electricpower-sf6/documents/sf6_2007_ann_report.pdf. 46 J. Blackman (U.S. EPA, Program Manager, SF6 Emission Reduction Partnership for Electric Power Systems), M. Averyt (ICF Consulting), and Z. Taylor (ICF Consulting). 2006. SF6 Leak Rates from High Voltage Circuit Breakers – U.S. EPA Investigates Greenhouse Gas Emissions Source. Available at: http://www.epa.gov/electricpower-sf6/documents/leakrates_ circuitbreakers.pdf. 47 U.S. Environmental Protection Agency. 2008. SF6 Emission Reduction Partnership for Electric Power Systems 2007 Annual Report. Available at: http://www.epa.gov/electricpower-sf6/documents/sf6_2007_ann_report.pdf. 48 Chrsitophorous, L.G., J.K. Olthoff, and D.S. Green. 1997. Gases for Electrical Insulation and Arc Interruption: Possible Present and Future Alternatives to Pure SF6. NIST Technical Note 1425.

74
development of SF6-insulated equipment. The report concluded that although “various gas mixtures show considerable promise for use in new equipment, particularly if the equipment is designed specifically for use with a gas mixture …it is clear that a significant amount of research must be performed for any new gas or gas mixture to be used in electrical equipment.”
Step 3 – Rank Remaining Control Technologies The use of state-of-the-art SF6 technology with leak detection to limit fugitive emissions is the highest ranked control technology that is technically feasible for this application. Since FGE proposes to implement feasible control options, ranking these control options is not necessary. Step 4 – Evaluate and Document Remaining Control Technologies No adverse energy, environmental, or economic impacts are associated with the aforementioned technically feasible control options. Since the use of alternative, non-GHG substance for SF6 as the dielectric material in the breakers is not technically feasible, energy, environmental, or economic impacts were not addressed in this analysis.
Step 5 – Select BACT Based on this top-down analysis, FGE concludes that using state-of-the-art, enclosed-pressure SF6 circuit breakers with leak detection would be the BACT option. The circuit breakers will be designed to meet the latest of the American National Standards Institute (ANSI) C37.013 standard for high-voltage circuit breakers.49 The proposed circuit breakers will have low pressure alarm and a low pressure lockout. This alarm will function as an early leak detector that will bring potential fugitive SF6 emissions problems to light before a substantial portion of the SF6 escapes. The lockout prevents any operation of the breaker due to lack of “quenching and cooling” SF6 gas.
FGE will monitor emissions annually in accordance with the requirements of the Mandatory Greenhouse Gas Reporting rules for Electrical Transmission and Distribution Equipment Use.50 Annual SF6 emissions will be calculated according to the mass balance approach in Equation DD-1 of Subpart DD.
FGE therefore proposes the following work practices as SF6 BACT: • Use of state-of-the-art circuit breakers that are gas-tight and guaranteed to achieve a leak rate
of 0.5% by year by weight or less (the current maximum leak rate standard established by the International Electrotechnical Commission [IEC]);
• Implementing an LDAR program to identify and repair leaks and leaking equipment as quickly as possible;
• Systematic operations tracking, including cylinder management and SF6 gas recycling car use; and
• Educating and training employees with proper SF6 handling methods and maintenance operations.
49 ANSI Standard C37.013, Standard for AC High-Voltage Generator Circuit Breakers on a Symmetrical Current. 50 See 40 CFR 98, subpart DD.

75
Summary of Proposed BACT The BACT limit and technology analyses presented above for the FGE Texas Power Project are summarized in Table 10.
Table 10. Summary of Proposed BACT for Combustion Turbines, Emergency RICEs, and Fugitive Emissions
Emission Unit Pollutant Limit Control Technology / Standard
Averaging Time / Compliance Method
Combustion Turbines Thermal Efficiency
7,325 Btu/kWh (HHV) equivalent (net, w/o duct firing)
Inherently lower-emitting processes, practices, and designs
365-day rolling average / CEMS
CO2 832 lb CO2/MWh (net, w/o duct firing)
30-day rolling average / CEMS
CO2 1,459,718 tpy per turbine Inherently lower-emitting processes, practices, and designs & fuel selection
12-month rolling average / fuel monitoring
CH4 473 tpy per turbine
N2O 3 tpy per turbine
CO2e 1,470,461 tpy per turbine
Emergency Firewater Pump Engines
CO2 12 tpy Good combustion practices operation and maintenance
Fuel usage records
CH4 0.01 tpy
N2O 0.01 tpy
CO2e 12 tpy
Emergency Electrical Generator Engines
CO2 27 tpy Good combustion practices operation and maintenance
Fuel usage records
CH4 0.01 tpy
N2O 0.01 tpy
CO2e 27 tpy
Fugitive Emissions – Natural Gas Piping
CH4 10 tpy AVO Program
CO2 0.1 tpy
CO2e 209 tpy
Fugitive Emissions – SF6 Containing Electrical Equipment
SF6 0.01 tpy State-of-the-art circuit breakers, LDAR Program, Training Program
CO2e 28 tpy
The proposed BACT limits required for this air quality permit application resulted in the following conclusions:
• There are no post combustion control technologies for GHG emissions that technically proven for full-scale implementation and economically feasible for a natural gas-fired combined cycle combustion turbine facility. Carbon capture and sequestration (CCS) was evaluated for this project, but was determined to be both technologically and economically infeasible for the proposed FGE Texas Project.
• Energy efficient design and operation of the combustion turbines and emergency engines was determined to be BACT for GHG emissions. GHG BACT emission limits for the combustion turbines and emergency engines have been proposed on mass GHG emissions basis in tpy. In addition, the GHG BACT emissions limit for the combustion turbine will also include a

76
heat rate limit measured in Btu/kWh (HHV, gross) and a pound of CO2 per megawatt-hour (lb CO2/MWh [net]) basis.
• An audio/visual/olfactory (AVO) program will be used to detect any leaks on the natural gas piping system and repairs will be performed as soon as practicable.
• FGE will install state-of-the-art circuit breakers that are gas-tight and guaranteed to achieve at a minimum a leak rate of 0.5% by weight per year, implementing a leak detection and repair (LDAR) program to identify leaks and leaking equipment as quickly as possible, and educating/training employees regarding the proper SF6 handling methods and maintenance procedures.
8.0 ADDITIONAL REQUIREMENTS UNDER PSD
Federal Endangered Species Act Section 7 of the Federal Endangered Species Act (ESA) requires that any activity funded, authorized, or implemented by a federal agency does not jeopardize the continued existence of a listed species or result in the destruction or adverse modification of designated critical habitat (16 United States Code 1536). Under 40 CFR 402, the EPA, in consultation with the U.S. Fish and Wildlife Service (USFWS) and/or the National Oceanic and Atmospheric Administration Fisheries Service, is required to prepare a biological assessment to determine the impact of the proposed action on endangered species. Threatened and endangered species (TES) are those species recognized by the USFWS as listed or proposed to be listed and those designated candidate TES under the ESA.
FGE has conducted this biological assessment and a copy of the biological assessment will be provided to EPA Region 6 under separate cover.
National Historic Preservation Act Section 106 of the National Historic Preservation Act requires federal agencies, in consultation with State and/or Tribal Historic Preservation Officers, to ensure that the actions authorized are not likely to affect cultural resources, and afford the Advisory Council for Historic Preservation the opportunity to comment on the impact to historic properties and preservation as result of federal action.
FGE has conducted a site survey in accordance with the survey methods defined in the U.S. Department of the Interior Standards and Guidelines and the guidelines of the Council of Texas Archaeologists. A copy of the cultural resources assessment will be provided to EPA Region 6 under separate cover.
9.0 PROPOSED EMISSION AND OPERATIONAL REQUIREMENTS
Based on the proposed BACT discussed in Section 7, FGE is proposing the following emission and operational limit requests for the project.

77
Proposed Emission Limits FGE is proposing the following emission limits, as described in Tables 11 through 13.
Table 11. Phase I/II Facility – Combustion Turbine Emission Limits
Emission Unit (EPN) Description
GHG Mass Basis BACT
Pollutant GHG Potential
Emissions (tpy) (includes duct
firing) Pollutant
Output-based BACT CO2 Limit (w/o duct firing)
CO2e (tpy)
Annual BACT Limit
(tpy CO2e)
GT-1 through GT-4 (per turbine)
Alstom GT24/HRSG
CO2 1,459,718 CO2 832 lb/MWh 1,459,718 1,470,461
CH4 473.22 CH4 7,325 Btu/MWh 9,938
N2O 2.60 N2O 806
Table 12. Phase I/II Facility - Emergency Engine Emission Limits
ID No. Description GHG Pollutants Emergency Engine
Emissions Limit
Pollutant Mass Basis (tpy)
CO2e Basis (tpy)
CO2e (tpy)
Total CO2e (tpy)
FWP-1 Emergency Firewater Pump Engine (389-HP)
CH4 <0.01 <0.01 <0.01 11.58
CO2 11.55 11.55 11.55
N2O <0.01 0.03 0.03
FWP-2 Emergency Firewater Pump Engine (389-HP)
CH4 <0.01 <0.01 <0.01 11.58
CO2 11.55 11.55 11.55
N2O <0.01 0.03 0.03
EG-1 Emergency Electrical Generator Engine (900-HP)
CH4 <0.01 0.02 0.02 26.80
CO2 26.71 26.71 53.72
N2O <0.01 0.07 0.07
EG-2 Emergency Electrical Generator Engine (900-HP)
CH4 <0.01 0.02 0.02 26.80
CO2 26.71 26.71 53.72
N2O <0.01 0.07 0.07
Table 13. Phase I/II Facility- Fugitive Emission Limits
ID No. Description GHG Pollutants Fugitive Sources
Emissions Limit
Pollutant Mass Basis (tpy)
CO2e Basis (tpy)
CO2e (tpy)
Total CO2e (tpy)
FUG-CH4 Fugitive natural gas emissions from piping components (including valves & flanges)
CH4 19.8 415.8 415.8 418
CO2 0.12 0.12 0.12
FUG-SF6 SF6 insulated electrical equipment SF6 0.0012 27.60 27.60 28

78
Requirements for Combustion Turbines To ensure the facility meets BACT, FGE is proposing the following emission and operational limits for the combustion turbines:
1. Perform an initial emission test for CO2 within 180 calendar days from the date of initial startup of a combustion turbine. Using the emission factors from 40 CFR Part 98, GHG emissions from the combustion turbines are proposed to not exceed 832 lb CO2/MWh (net), not including duct firing, during the test. FGE will calculate the limit as follows: • Measure net hourly energy output (MWh [net]); • Ensure the combustion turbine generator (CTG) is operating above 90% of its design capacity
without duct burning firing; and • Correct the results to ISO conditions (59°F, 14.7 psia, and 67% RH).
1. FGE shall not exceed an average net heat rate of 7,325 Btu/kWh (HHV), not including duct firing, on a 365-day rolling average. To determine this limit, FGE will calculate the average net heat rate on a hourly basis consistent with equation F-20 and procedures provided in 40 CFR Part 75, Appendix F, § 5.5.2 and the measured net hourly energy output (kWh).
2. FGE proposes to determine the hourly CO2 emission rate from 40 CFR Part 75, Appendix G, using Fc factors updated monthly from fuel analysis, FGE proposes to install and operate an associated data acquisition and handling system in accordance with the CO2 CEMS system provided in 40 CFR 75.10(a)(3) and (a)(5).
3. Fuel for the CTGs is proposed to be limited to natural gas with a fuel sulfur content of up to 5 grains of sulfur per 100 dry standard cubic feet (gr S/100 dscf). The gross calorific value of the fuel shall be determined monthly by the procedures contained in 40 CFR 75, Appendix F, §5.5.2 and records shall be maintained of the monthly fuel gross calorific value for a period of 5 years. Upon request, FGE proposes to provide a sample and/or analysis of the fuel-fired in the combustion turbines or shall allow EPA to take a sample for analysis.
Proposed Work Practice and Monitoring Requirements FGE proposes the following monitoring requirements for those emission units identified in this application.
Combustion Turbines 1. FGE proposes to calculate the amount of CO2 emitted from combustion in tons per hour (tons/hr)
on a 365-day rolling average, and converted to tpy based on equation G-4 of 40 CFR 75 and the average net heat rate on an hourly basis based on the heat input calculation procedures contained in 40 CFR 75, Appendix F, equation F-20.
2. The calculated CO2 emissions shall be compared to the measured CO2 emissions from the O2 emission monitor, and if FGE is using the CO2 monitor (CEMS) methodology, then the calculated hourly stack gas volumetric flow rate on a daily basis.
3. FGE proposes to calculate the CH4 and N2O emissions on a 365-day rolling average. FGE proposes to determine compliance with the CH4 and N2O emissions limits contained in this section using the default CH4 and N2O emission factors contained in Table C-2 of 40 CFR 98 and the measured actual hourly heat input (HHV).

79
4. FGE proposes to calculate the CO2e emissions on a 365-day rolling average, based on the procedures and global warming potential contained in Greenhouse Gas Regulations, 40 CFR 98.A, Table A-1.
5. The flow rate of the fuel combusted in combustion turbine emission unit is proposed to be measured and recorded using an operational non-resettable elapsed flow meter.
6. FGE proposes to measure and record the new energy output (MWh [net]) on an hourly basis.
7. On or before the date of initial performance test required by 40 CFR 60.8, and thereafter, FGE proposes to install, and continuously operate, and maintain the HRSG equipped with an SCR so emissions are at or below the emissions limits specified in this permit application.
8. On or after initial performance testing, FGE proposes to use the combustion turbine, HRSG, steam turbine and plant-wide energy efficiency processes, work practices, and designs as represented in the permit application.
9. FGE proposes to determine the CO2 hourly emission rate (lb CO2/hr) for the combustion turbine generator and HRSG using an O2 monitor according to appendix F to 40 CFR 75. In accordance to 40 CFR 75.20(c)(4), FGE proposes to determine hourly CO2 concentration and mass emissions with a fuel flow monitoring system; a continuous O2 concentration monitor; fuel F and Fc factors; and, where O2 concentration is measured on a dry basis (or where Equation F–14b in Appendix F to 40 CFR 75 is used to determine CO2 concentration), either, a continuous moisture monitoring system, as specified in 40 CFR 75.11(b)(2), or a fuel-specific default moisture percentage (if applicable), as defined in 40 CFR 75.11(b)(1); and by using the methods and procedures specified in Appendix F to 40 CFR 75.
10. FGE proposes to install, calibrate, and operate a fuel flow meter and perform periodic scheduled gross caloric value (GCV) fuel sampling for the combustion turbine generator and HRSG, and shall meet the applicable requirements, including certification testing, of 40 CFR 75, Appendix D and 40 CFR 60 to be used in conjunction with the Fc factor based on the procedures to calculate the CO2 emission rate in 40 CFR 75, Appendix F.
11. Oxygen analyzers are proposed to continuously monitor and record oxygen concentration in the combustion turbine generator and heat recovery steam generator identified as CTG/HRSG. It shall reduce the oxygen readings to an averaging period of 6 minutes or less and record it at that frequency.
12. The oxygen analyzers are proposed to be quality-assured at least quarterly using cylinder gas audits (CGAs) in accordance with 40 CFR 60, Appendix F, Procedure 1, Section 5.1.2, with the following exception: a relative accuracy test audit is not required once every four quarters (i.e., two successive semiannual CGAs may be conducted).
13. As an alternative to installing an oxygen analyzer, FGE proposes to install a CO2 CEMS and volumetric stack gas flow monitoring system with an automated data acquisition and handling system for measuring and recording CO2 emissions discharged to the atmosphere.
14. In accordance with 40 CFR 75, Appendix D and 40 CFR 60, FGE proposes to ensure that all required fuel flow meter is installed, a periodic schedule for GCV fuel sampling is initiated and all certification tests are completed on or before the earlier of 90 unit operating days or 180 calendar days after the date the unit commences commercial operation (as defined in 40 CFR 75, Appendices D and G).
15. FGE proposes to ensure compliance with the specifications and test procedures for fuel flow meter and/or CO2 emission monitoring system at stationary sources, 40 CFR 75 and 40 CFR 60.

80
16. FGE proposes to meet the appropriate quality assurance requirements specified in 40 CFR 75, Appendices D and F and 40 CFR 60 for the fuel flow meter and/or CO2 emission monitoring system.
Emergency Engines 1. The emergency diesel-fired firewater pump engines (FWP-1 and FWP-2) and electrical generator
engines (EG-1 and EG-2) are authorized to combust diesel fuel containing no more than 0.015 percent sulfur by weight.
2. The emergency diesel-fired firewater pump engines (FWP-1 and FWP-2) and electrical generator engines (EG-1 and EG-2) are limited to 52 hours of non-emergency operation per year for each unit and a heat input value of 2.7 mmBtu/hr and 6.3 mmBtu/hr for the diesel-fired firewater pump engines and the diesel-fired electrical generator engines, respectively.
3. FGE will install and maintain operational non-resettable elapsed time meters for the firewater pump engines (FWP-1 and FWP-2) and electrical generator engines (EG-1 and EG-2).
Fugitive Emissions 1. For fugitive emission calculations, CH4 emissions are proposed to be calculated annually
(calendar year). FGE proposes to not exceed 19.8 tpy of methane and 0.12 tpy of CO2 from all piping components and an overall emissions limit of 418 tpy of CO2e. Emissions are proposed to be calculated annually based on the emission factors from Table W-1A of 40 CFR 98.W.
2. FGE proposes to implement an as-observed AVO method for detecting leaking from natural gas piping components.
3. For SF6 emissions, FGE proposes to calculate annually (calendar year) in accordance with the mass balance approach provided in equation DD-1 of the Mandatory Greenhouse Gas Reporting rules for Electrical Transmission and Distribution Equipment Use, 40 CFR 98, Subpart DD. FGE proposes to not exceed twelve 27.5-lb SF6 circuit breakers and sixteen 8.25-lb SF6 circuit breakers with leak detection.
4. FGE proposes to maintain a file of all records, data measurements, reports, and documents related to the fugitive emission sources including, but not limited to, the following: all records or reports pertaining to maintenance performed, all records relating to compliance with the Monitoring and Quality Assurance and Quality Control procedures outlined in 40 CFR 98.304.
Proposed Startup and Shutdown Limits Combustion Turbines
1. FGE proposes to minimize emissions during startup and shutdown activities by operating and maintaining the facility and associated air pollution control equipment in accordance with good air pollution control practices, safe operating practices, and protection of the facility.
2. Emissions during startup and shutdown activities are proposed to be minimized by limiting the duration of operation in SUSD mode as follows: • A startup of CTG is defined as the period that begins when there is measureable fuel flow to
the CTG and ends when the CTG load reaches 50%. A startup for each CTG is limited to 210 minutes.

81
• A shutdown of each CTG is defined as the period that begins when CTG load falls below 50% and ends when there is no longer measureable fuel flow to CTG. A shutdown for CTG is limited to 30 minutes. FGE proposes to record the time, date, fuel heat input (HHV) in mmBtu/hr and duration of each SUSD event in order to calculate total CO2e emissions. The records are proposed to include hourly CO2 emission levels as measured by the fuel flow meter and/or O2 emission monitor (or CO2 CEMS with volumetric stack gas flowrate) and the calculations based on the actual heat input for the CO2, CO2e, O2, N2O, and CH4 emissions during each SUSD event based on the equations represented in the permit application. FGE proposes to keep these records for 5 years following the date of such event.
Proposed Recordkeeping Requirements 1. In order to demonstrate compliance with the GHG emission rates, FGE proposes to monitor the
following parameters and summarize the data on a calendar month basis for the combustion turbines: • Operating hours for all air emission sources; • The natural gas fuel usage for all combustion sources, using continuous fuel flow monitors
(a group of equipment can utilize a common fuel flow meter, as long as actual fuel usage is allocated to the individual equipment based upon actual operating hours and maximum firing rate);
• Record the number and duration of start-ups for each engine; and • Record the number and duration of shutdowns for each engine.
2. FGE proposes to maintain site-specific procedures for best/optimum maintenance practices and vendor-recommended operating procedures and operation and maintenance manuals.
3. FGE proposes to maintain records that include the following: the occurrence and duration of any startup, shutdown, or malfunction, performance testing, calibrations, checks, GHG emission units and CO2 emission CEMS maintenance (if a CO2 CEMS is present), duration of any periods during which a monitoring device is inoperative, and corresponding emission measurements.
4. FGE proposes to maintain records for 5 years from the date of any of the following: the duration of startup, shutdown, the initial startup period as defined in Section IV for the emission units, pollution control units and CEMS (if a CO2 CEMS is present), malfunctions, performance testing, calibrations, checks, maintenance, and duration of an inoperative monitoring device and emission units with the required corresponding emission data.
5. FGE proposes to maintain records of all GHG emission units and CO2 emission CEMS certification tests (if a CO2 CEMS is present) and monitoring and compliance information required by this permit.
6. FGE proposes to implement the AVO program and keep records of the monitoring results, as well as the repair and maintenance records.
7. At least once per year, FGE proposes to obtain an updated analysis of the inlet gas to document the CO2 and methane content of the gas streams.
8. FGE proposes to maintain records and submit a written report of all excess emissions to EPA semi-annually, except when: more frequent reporting is specifically required by an applicable subpart; or the Administrator or authorized representative, on a case-by-case basis, determines that more frequent reporting is necessary to accurately assess the compliance status of the source. FGE is proposing to include in each semi-annual report the following:

82
• Time intervals, data, and magnitude of the excess emissions, the nature and cause (if known), corrective actions taken, and preventive measures adopted;
• Applicable time and date of each period during which the monitoring equipment was inoperative (monitoring down-time);
• A statement in the report of a negative declaration; that is; a statement when no excess emissions occurred or when the monitoring equipment has not been inoperative, repaired, or adjusted;
• Any failure to conduct any required source testing, monitoring, or other compliance activities; and
• Any violation of limitations on operation, including but not limited to restrictions on hours of operation of the emergency generator or fire pump.
9. All records required by this PSD Permit shall be retained for not less than 5 years following the date of such measurements, maintenance, and reports.
Proposed Performance Testing Requirements Combustion Turbines
1. Upon completion of the first phase of construction, FGE proposes to perform an initial stack test for the combustion turbines to establish the actual quantities of air contaminants being emitted into the atmosphere and to determine the initial compliance with the CO2 emission limits. Sampling shall be conducted in accordance with 40 CFR 60.8 and EPA Method 3a or 3b for the concentration of CO2 for the CTGs.
2. Upon completion of the second phase of construction, FGE proposes to perform an initial stack test for the combustion turbines to establish the actual quantities of air contaminants being emitted into the atmosphere and to determine the initial compliance with the CO2 emission limits established in this permit. Sampling shall be conducted in accordance with 40 CFR 60.8 and EPA Method 3a or 3b for the concentration of CO2 for the CTGs.
3. Within 60 days after achieving the maximum production rate at which the combustion turbines will be operated, but not later than 180 days after initial startup of the facility, FGE proposes to conduct performance tests(s) and a submit a written report of the performance testing results to the EPA.
4. FGE proposes to submit a performance test protocol to EPA no later than 30 days prior to the test to allow review of the test plan and to arrange for an observer to be present at the test for both the FD2- and FD3-series CTG. The performance test shall be conducted in accordance with the submitted protocol, and any changes required by EPA. If there is a delay in the original test date, the facility proposes to provide at least 7 days prior notice of the rescheduled date of the performance test.
5. FGE proposes to perform stack sampling and other testing as required to establish the actual quantities of CO2 emissions being emitted into the atmosphere from the combustion turbines and HRSG and to determine the initial compliance with all emission limits established in this permit for the CTGs. Sampling shall be conducted in accordance with EPA Methods 1-4 and 3b for the concentration of CO2 for the CTGs.
6. FGE proposes to conduct fuel sampling for the combustion turbines and HRSG in accordance with 40 CFR 75 and 40 CFR 98.

APPENDIX A
GHG Emission Calculations


Case 1 2a 2b 3 4 5 6 7 8 9a 9bLoad 100% 100% 100% 90% 80% 70% 60% 50% LLOC 100% 100%EC ON ON ON ON ON ON ON ON ON OFF OFFHF ON OFF OFF OFF OFF OFF OFF OFF OFF OFF OFFDF ON ON OFF OFF OFF OFF OFF OFF OFF OFF ON
Gross Output at CT Generator, per turbine (kW) 201,378 166,877 201,378 165,316 146,541 128,223 109,906 91,842 3,132 237,360 237,360Gross Output at ST Generator (kW) 325,288 319,505 221,705 199,814 188,636 172,562 159,268 145,749 57,806 239,425 336,011
Gross Power Output (kW) 1 728,044 653,259 624,461 530,446 481,718 429,008 379,080 329,433 64,070 714,145 810,731Total Heat Input - LHV (mmBtu/hr) 4,420.4 3,945.6 3,635.6 3,057.0 2,781.8 2,525.2 2,272.3 2,015.7 689.9 4,124.1 4,860.0Total Heat Input - HHV (mmBtu/hr) 4,905.3 4,378.4 4,034.4 3,392.4 3,087.0 2,802.2 2,521.6 2,236.8 765.6 4,576.5 5,393.2
Heat Rate - LHV (Btu/kWh) 2 6,072 6,040 5,822 5,763 5,775 5,886 5,994 6,119 10,768 5,775 5,995Heat Rate - HHV (Btu/kWh) 2 6,738 6,702 6,461 6,395 6,408 6,532 6,652 6,790 11,949 6,408 6,652
CO2 Emissions, per turbine (lb/hr) 299,889 290,283 237,400 207,597 189,304 171,664 154,567 137,093 47,291 280,201 333,269lb CO2 / MWh 3 824 889 760 783 786 800 815 832 1,476 785 822
lb CO 2 / MWh Btu/kW-hr (LHV) Btu/kW-hr (HHV)lb CO 2 / MWh Btu/kW-hr (LHV) Btu/kW-hr (HHV)lb CO 2 / MWh Btu/kW-hr (LHV) Btu/kW-hr (HHV)lb CO 2 / MWh Btu/kW-hr (LHV) Btu/kW-hr (HHV)
760 1,476 lb CO 2 / MWh 5,763 10,768 Btu/kW-hr (LHV) 6,395 11,949 Btu/kW-hr (HHV)760 889 lb CO 2 / MWh 5,763 6,119 Btu/kW-hr (LHV) 6,395 6,790 Btu/kW-hr (HHV)760 889 lb CO 2 / MWh 5,775 6,072 Btu/kW-hr (LHV) 6,408 6,738 Btu/kW-hr (HHV)822 889 lb CO 2 / MWh 822 6,072 Btu/kW-hr (LHV) 6,652 6,738 Btu/kW-hr (HHV)
DF = Duct Firing
Range (100% Operation)Range (100% Operation & DF)
LLOC = Low-load Operating ConditionEC = Evaporative CoolingHF = High Fogging
Range (all operating - excluding Case 8)
Average (all operating - excluding Case 8) 810 6,423 7,128Average (100% Operation) 816 5,941 6,592
Average (100% Operation & DF) 845 6,035 6,697Range (all cases)
Average (all cases) 870 6,364 7,063
FGE Texas ProjectEmission Calculations
Table 1 - Combined Cycle Combustion Turbine Test Data

Assumptions Value UnitsCombined Cycle, both
turbines w/ duct burners
Combined Cycle, per turbine basis
Power Output 1 474,720 237,360 kWHeat Input, LHV 1 4,860 2,430 mmBtu/hrHeat Input, HHV 1 5,393 2,697 mmBtu/hrAnnual Hours of Operation (Total) 8,760 8,760 hr/yr
Annual Emissions
lb/hr lb/MMBtu tpyCO2 333,269 - 1,459,718CH4
2 14.50 - 63.51N2O 3 0.59 2.20E-04 2.60
CO 2 e 4 1,461,857
FGE Texas Project
3 N2O emission factor from 40 CFR 98 Subpart C, Table C-2 for natural gas. For conservatism, the higher heating value (HHV) was used.4 Global warming potentials obtained from Table A-1 to Subpart 98 - Global Warming Potentials Equation A-1 CO2e = ∑GHGi x GWPi Where: CO2e = Carbon dioxide equivalent (tons/year) GHGi = Mass emissions of each GHG (tons/year) GWPi = Global warming potential for each GHG
Emission Calculations
Table 2 - Combustion Turbines (Combined Cycle) Emissions
Alstom GT24 Two-on-One Multi Shaft Natural Gas Turbine Potential to Emit (EPN: GT-1, GT-2, GT-3, and GT-4)
1 Alstom turbine performance data represents the maximum value from all normal and LLOC operating scenarios. A copy of the performance test data is included in Appendix B of the application submittal.2 Assumed all unburned hydrocarbon (UHC) emissions as CH4.
Emission FactorPollutant 1Combined Cycle - Single Turbine
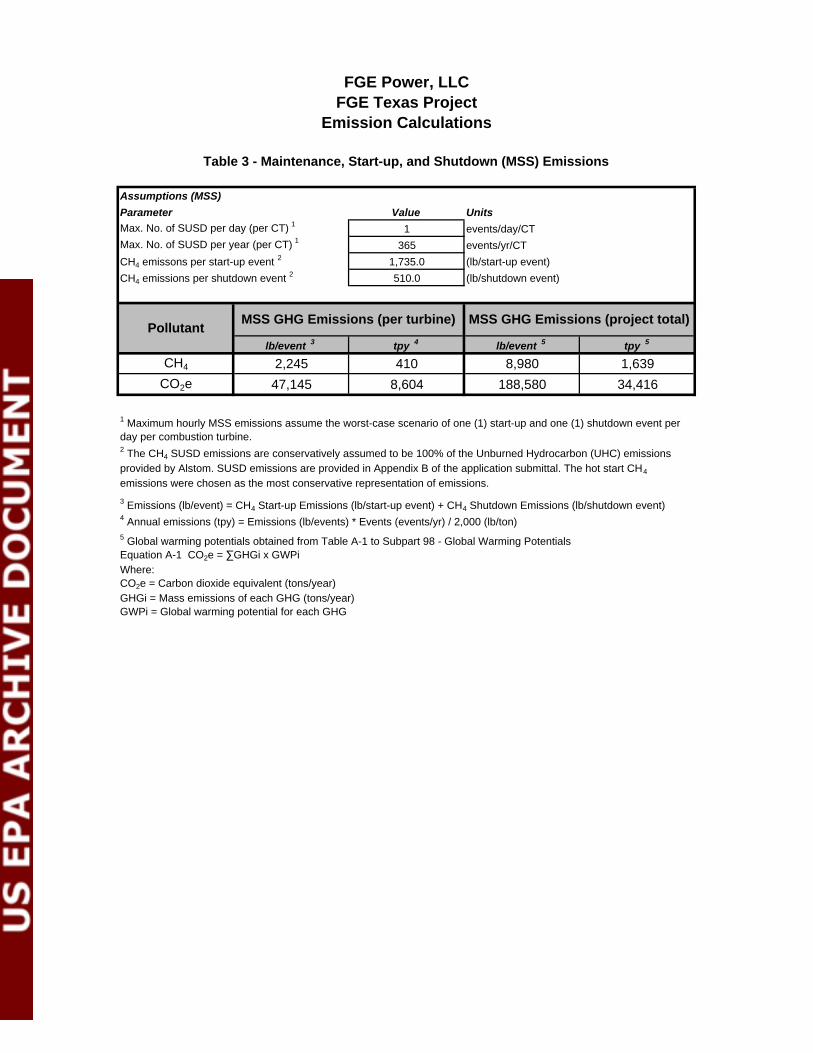
Parameter Value UnitsMax. No. of SUSD per day (per CT) 1 1 events/day/CTMax. No. of SUSD per year (per CT) 1 365 events/yr/CTCH4 emissons per start-up event 2 1,735.0 (lb/start-up event)CH4 emissions per shutdown event 2 510.0 (lb/shutdown event)
lb/event 3 tpy 4 lb/event 5 tpy 5
CH4 2,245 410 8,980 1,639CO2e 47,145 8,604 188,580 34,416
Emission CalculationsFGE Texas ProjectFGE Power, LLC
1 Maximum hourly MSS emissions assume the worst-case scenario of one (1) start-up and one (1) shutdown event per day per combustion turbine.
Assumptions (MSS)
Pollutant MSS GHG Emissions (per turbine) MSS GHG Emissions (project total)
3 Emissions (lb/event) = CH4 Start-up Emissions (lb/start-up event) + CH4 Shutdown Emissions (lb/shutdown event)4 Annual emissions (tpy) = Emissions (lb/events) * Events (events/yr) / 2,000 (lb/ton)5 Global warming potentials obtained from Table A-1 to Subpart 98 - Global Warming Potentials Equation A-1 CO2e = ∑GHGi x GWPi Where: CO2e = Carbon dioxide equivalent (tons/year) GHGi = Mass emissions of each GHG (tons/year) GWPi = Global warming potential for each GHG
2 The CH4 SUSD emissions are conservatively assumed to be 100% of the Unburned Hydrocarbon (UHC) emissions provided by Alstom. SUSD emissions are provided in Appendix B of the application submittal. The hot start CH4
emissions were chosen as the most conservative representation of emissions.
Table 3 - Maintenance, Start-up, and Shutdown (MSS) Emissions

Assumptions Units
Firewater PumpEmergency Generator
Power Output 1 389 900 bhpHeat Input 2 2.7 6.3 mmBtu/hrAnnual Hours of Operation (Total) 52 52 hrs/yr
Emission Factor 3,4
Hourly Emissions
Annual Emissions
Emission Factor 3,4
Hourly Emissions
Annual Emissions
kg/mmBtu lb/hr tpy kg/mmBtu lb/hr tpy
CO2 73.96 444.07 11.55 73.96 1,027.42 26.71CH4 3.00E-03 0.02 0.00 3.00E-03 0.04 0.00N2O 6.00E-04 0.00 0.00 6.00E-04 0.01 0.00
CO 2 e 5 445.57 11.58 1,030.87 26.80
Value
4 CH4 and N2O emission factors from 40 CFR 98 Subpart C, Table C-2 for diesel. For conservatism, the higher heating value (HHV) was used.
3 CO2 emission factor obtained from 40 CFR 98 Subpart C, Table C-1 for diesel (Distillate Fuel Oil No. 2).
5 Global warming potentials obtained from Table A-1 to Subpart 98 - Global Warming Potentials Equation A-1 CO2e = ∑GHGi x GWPi Where: CO2e = Carbon dioxide equivalent (tons/year) GHGi = Mass emissions of each GHG (tons/year) GWPi = Global warming potential for each GHG
Pollutant
Emergency Firewater Pump Engine - Single Engine
Emergency Electrical Generator Engine - Single Engine
1 Actual engines not yet selected; therefore, engines sized for maximum expected need for predicated applications. Specific engine manufacturer specifications will be provided when actual engines are chosen.2 Heat input calculated assuming a brake-specific fuel capacity of 7,000 Btu/hp-hr.Estimated Heat Input (mmBtu/hr) = Average Brake-Specific Fuel Consumption (BSFC) (Btu/hp-hr) * Maximum Power Output (hp) * (1 mmBtu/1,000,000 Btu)
FGE Texas ProjectEmission Calculations
Table 4 - Diesel Engine Potential to Emit

Parameter Value Units0.975 vol%
1.1E-02 vol%0.00040300.00005262
1.102211
8,760 (hr/yr)
Emission Factor 1
(scf/hr/source) (CO2e tpy) (tpy) (lb/hr) (CO2e tpy) (tpy) (lb/hr) (tpy) (lb/hr)
Connector 0.017 0 0 0 0.00 0.00 0.00 0.00 0.00 0.00 0.00 0.00Flanges 0.121 38 98 170 78.02 3.72 0.85 0.81 0.04 0.01 78.83 18.00
Open-ended lines 0.031 7 35 53 6.17 0.29 0.07 0.02 0.00 0.00 6.19 1.41Sampling Connections 0.121 2 0 3 1.15 0.05 0.01 0.00 0.00 0.00 1.15 0.26
Pump seals 13.300 1 0 1 63.06 3.00 0.69 0.00 0.00 0.00 63.07 14.40Pressure Relief Valve 0.193 0 3 4 2.75 0.13 0.03 0.00 0.00 0.00 2.75 0.63
Valves 0.121 34 65 124 56.80 2.70 0.62 0.43 0.02 0.00 57.22 13.06Total - - - - 207.95 9.90 2.26 1.26 0.06 0.01 209.21 47.76
each total(lb) (lb) (lb/yr)
362 kV 12 27.5 330 1.6524 kV 16 8.25 132 0.66Total 28 - 462 2.31
1 Factors obtained from 40 CFR part 98 subpart W, Table W-1A - Default Whole Gas Emission Factors for Onshore Petroleum and Natural Gas Production. Emission factor for Valve was used for Flanges and Sampling Connections.
2 Component count estimates for piping in both aqueous ammonia and natural gas service associated with the Alstom Skid (on a per skid baisis) provided by the vendor. All other component counts for piping in both aqueous ammonia and natural gas service (per power block) p3 Total component counts include the Alstom Skid plus Outside of Alstom Skid , with a 25% safety factor.4 40 CFR part 98 subpart W Equation W-1: Mass (tpy CO2e) = Count x EF (scf/hr/source) x GHG Concentrations (vol%) x Conv (scf to metric tones) x annual hours of operation (hr/yr). Note emissions have been converted from metric tones to U.S. tons.Mass GHG (tpy) = Mass (CO2e tpy) / GWPMass GHG (lb/hr) = Mass (tpy) * 2,000 (lb/ton) / Annual Hours of Operation (hr/yr)
CH4 Content of Natural Gas 1
CO2 content of Natural Gas 1
Conversion factor for CH4 (scf to metric tones) 1
Conversion factor for CO2 (scf to metric tones) 1
Conversion factor (metric tones to tons)GWP for CH4
GWP for CO2
Annual Hours of Operation
FGE Texas ProjectEmission Calculations
Fugitive CH4 Emissions (per power block) 4
Fugitive CO2 Emissions (per power block) 4Component Count
(per Alstom Skid) 2Component Count (Outside Alstom
Skid) 2
Total Fugitive CO2e Emissions (per power
block) 5Equipment TypeTotal Estimated
Component Count (per power block) 3
Assumptions
Table 5 - Natural Gas Fugitive Emissions (EPN: FUG-CH4)
5 Global warming potentials obtained from Table A-1 to Subpart 98 - Global Warming Potentials Equation A-1 CO2e = ∑GHGi x GWPi Where: CO2e = Carbon dioxide equivalent (tons/year) GHGi = Mass emissions of each GHG (tons/year) GWPi = Global warming potential for each GHG
Table 5Electric Equipment Insulated with SF6 Fugitive Emissions (EPN: FUG-SF6)
1 Circuit breaker capacity data provided by the vendor. 2 Circuit breaker fugitive emissions based on 0.5% annual leak rate as cited in J. Blackman, M. Averyt, and Z. Taylor, “SF6 Leak Rates from High Voltage Circuit Breakers – EPA Investigates Potential Greenhouse Gas Emission Source,” available at: http://www.epa.gov/electricpower-sf6/documents/leakrates_circuitbreakers.pdf.
0.001155
Fugitive CO2e Emissions 3
(ton/yr)19.71757.887
27.6045
Fugitive SF6 Emissions 2
(ton/yr)0.0008250.00033
3 Global warming potentials obtained from Table A-1 to Subpart 98 - Global Warming Potentials Equation A-1 CO2e = ∑GHGi x GWPi Where: CO2e = Carbon dioxide equivalent (tons/year) GHGi = Mass emissions of each GHG (tons/year) GWPi = Global warming potential for each GHG
SF6 Capacity 1
Breaker Type QuantityFugitive SF6
Emissions 2

Greenhouse GasGlobal Warming
Potential 1
CO2 1CH4 21N2O 310SF6 23,900
CO2 CH4 N2O SF6 CO2e 3
tpy tpy tpy tpy tpy
GT-1 1,459,718 473.22 2.60 - 1,470,461GT-2 1,459,718 473.22 2.60 - 1,470,461
FWP-1 12 4.68E-04 9.37E-05 - 12EG-1 27 1.08E-03 2.17E-04 - 27
FUG-CH4 0.06 9.90 - - 209FUG-SF6 - - - 1.16E-03 28
Total 2,919,475 956.35 5.20 - 2,941,198
GT-1 1,459,718 473.22 2.60 - 1,470,461GT-2 1,459,718 473.22 2.60 - 1,470,461GT-3 1,459,718 473.22 2.60 - 1,470,461GT-4 1,459,718 473.22 2.60 - 1,470,461
FWP-1 12 4.68E-04 9.37E-05 - 12FWP-2 12 4.68E-04 9.37E-05 - 12EG-1 27 1.08E-03 2.17E-04 - 27EG-2 27 1.08E-03 2.17E-04 - 27
FUG-CH4 0.12 19.80 - - 418FUG-SF6 - - - 1.16E-03 28
Total 5,838,950 1,912.70 10.39 - 5,882,368
3 Global warming potentials obtained from Table A-1 to Subpart 98 - Global Warming Potentials Equation A-1 CO2e = ∑GHGi x GWPi Where: CO2e = Carbon dioxide equivalent (tons/year) GHGi = Mass emissions of each GHG (tons/year) GWPi = Global warming potential for each GHG
Phase 1
Phase 2
2 GT-1, GT-2, GT-3, and GT-4 CH4 and CO2e emissions include both "normal " operations and MSS emissions.
FGE Texas ProjectEmission Calculations
Table 6 - Greenhouse Gases Potential to Emit
1 40 CFR 98 Subpart A, Table A-1
Emission Source 2
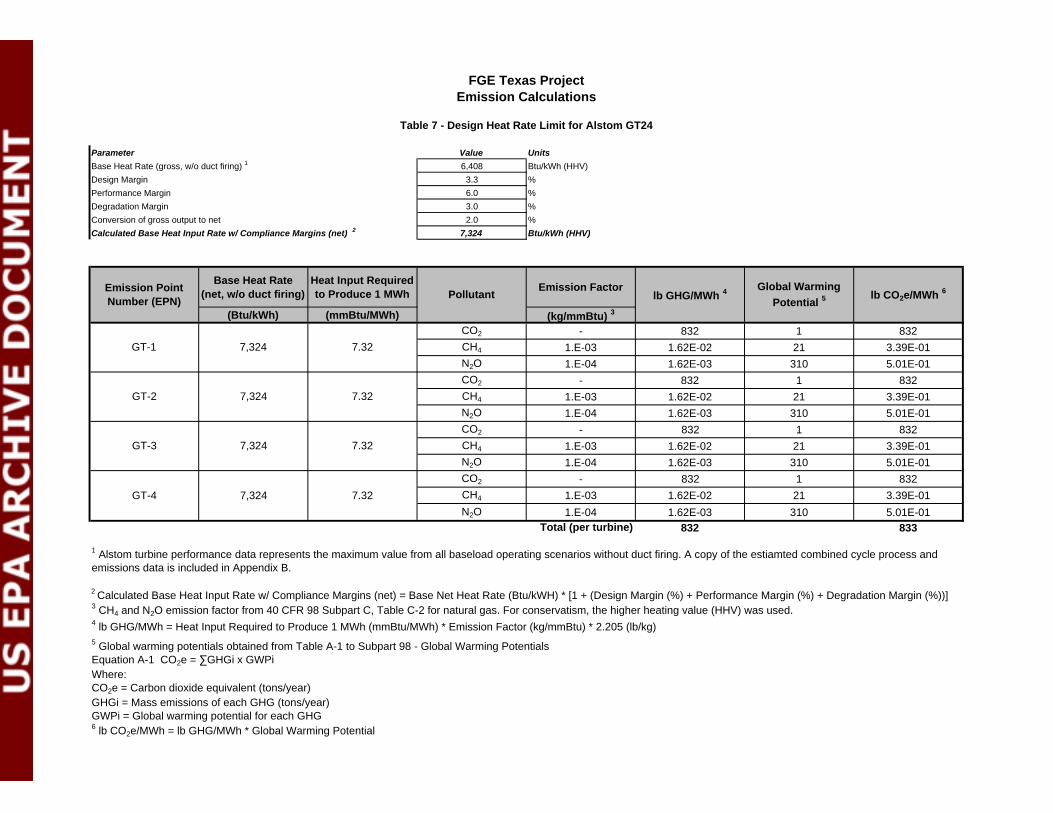
Parameter Value Units6,408 Btu/kWh (HHV)
3.3 %6.0 %3.0 %2.0 %
7,324 Btu/kWh (HHV)
Base Heat Rate (net, w/o duct firing)
Heat Input Required to Produce 1 MWh Emission Factor
(Btu/kWh) (mmBtu/MWh) (kg/mmBtu) 3
CO2 - 832 1 832CH4 1.E-03 1.62E-02 21 3.39E-01N2O 1.E-04 1.62E-03 310 5.01E-01CO2 - 832 1 832CH4 1.E-03 1.62E-02 21 3.39E-01N2O 1.E-04 1.62E-03 310 5.01E-01CO2 - 832 1 832CH4 1.E-03 1.62E-02 21 3.39E-01N2O 1.E-04 1.62E-03 310 5.01E-01CO2 - 832 1 832CH4 1.E-03 1.62E-02 21 3.39E-01N2O 1.E-04 1.62E-03 310 5.01E-01
832 833
Emission Point Number (EPN) Pollutant lb GHG/MWh 4 Global Warming
Potential 5 lb CO2e/MWh 6
7,324 7.32
GT-1 7,324 7.32
GT-2 7,324 7.32
5 Global warming potentials obtained from Table A-1 to Subpart 98 - Global Warming Potentials Equation A-1 CO2e = ∑GHGi x GWPi Where: CO2e = Carbon dioxide equivalent (tons/year) GHGi = Mass emissions of each GHG (tons/year) GWPi = Global warming potential for each GHG6 lb CO2e/MWh = lb GHG/MWh * Global Warming Potential
1 Alstom turbine performance data represents the maximum value from all baseload operating scenarios without duct firing. A copy of the estiamted combined cycle process and emissions data is included in Appendix B.
2 Calculated Base Heat Input Rate w/ Compliance Margins (net) = Base Net Heat Rate (Btu/kWH) * [1 + (Design Margin (%) + Performance Margin (%) + Degradation Margin (%))]3 CH4 and N2O emission factor from 40 CFR 98 Subpart C, Table C-2 for natural gas. For conservatism, the higher heating value (HHV) was used.4 lb GHG/MWh = Heat Input Required to Produce 1 MWh (mmBtu/MWh) * Emission Factor (kg/mmBtu) * 2.205 (lb/kg)
Total (per turbine)
Conversion of gross output to netCalculated Base Heat Input Rate w/ Compliance Margins (net) 2
Base Heat Rate (gross, w/o duct firing) 1
Design Margin Performance MarginDegradation Margin
FGE Texas ProjectEmission Calculations
Table 7 - Design Heat Rate Limit for Alstom GT24
GT-3 7,324 7.32
GT-4


APPENDIX B
Equipment Specifications


PWER/BPROB/GSPWPS10/eng/THS/06.11/CH/7282 © - ALSTOM 2011. ALSTOM, the ALSTOM logo and any alternative version thereof are trademarks and service marks of ALSTOM. The other names mentioned, registered or not, are the property of their respective companies. The technical and other data contained in this document is provided for information only. ALSTOM reserves the right to revise or change this data at any time without further notice.
GAS PRODUCT SOLUTIONS
Technical PerformanceThe Next Generation GT24
The pioneer in operational flexibility
The Next Generation GT24 Gas Turbine offers outstanding performance,
operating and fuel flexibility as well as availability. Alstom’s gas turbine is the ideal solution for all applications in combined cycle and cogeneration, and for all operating profiles.
• Superior value from high technology • Today’s products already feature tomorrows requirements• Evolutionary product to meet customer needs
Unprecedented operational flexibility, efficiency and low emissions
GT24 - performance
Fuel Natural Gas
Frequency Hz 60
Gross electrical output MW 230.7
Gross electrical efficiency (LHV) % 40.0
Gross heat rate (LHV)kJ/kWhBtu/kWh
9,0008,531
Turbine speed rpm 3,600
Compressor pressure ratio 35.4 : 1
Exhaust mass flow kg/slb/s
5051,113
Exhaust gas temperature °C °F
597 1,107
General Notes:
1. Gas turbine electric output and heat rate at the generator terminals including generator losses, but excluding inlet and outlet losses.
2. Gas turbine performance calculated with 100% methane (Lower Heating Value) ISO conditions.
GT24
Key benefitsAdvanced class gas turbine technology with superior base and part load efficiency and operational flexibility. Superior fuel flexibility for operating on the widest range of natural gas compositions.

PWER/BPROS/NXGTKG11/eng/GAS/07.12/CH/7475 © ALSTOM 2012. All rights reserved. Information contained in this document is indicative only. No representation or warranty is given or should be relied on that it is complete or correct or will apply to any particular project. This will depend on the technical and commercial circumstances. It is provided without liability and is subject to change without notice. Reproduction, use or disclosure to third parties without Alstom’s express written authority is strictly prohibited.
GAS PRODUCT SOLUTIONS
The pioneer in operational flexibilityThe latest KA24/GT24
offers significantly
lower cost of electricity
by way of improved
performance and
operational flexibility
to meet the needs
of today’s dynamic
power markets.
The Next Generation KA24/GT24
Capabilities of the upgraded KA24*
Proven highly reliable product platform with enhanced features:
Best
Lowest 2
Unique
World-leading
Additional operational flexibility features added:
Unique NEW
On-line switchable operation mode
NEW
* gross figures; performance for 2-on-1 configuration
700 MW60 %

PWER/BPROS/NXGTKG11/eng/GAS/07.12/CH/7475 © ALSTOM 2012. All rights reserved. Information contained in this document is indicative only. No representation or warranty is given or should be relied on that it is complete or correct or will apply to any particular project. This will depend on the technical and commercial circumstances. It is provided without liability and is subject to change without notice. Reproduction, use or disclosure to third parties without Alstom’s express written authority is strictly prohibited.
GAS PRODUCT SOLUTIONS
THE NEXT GENERATION KA24/GT24 IS AVAILABLE TODAY!
The Next Generation GT24
This latest GT24 upgrade
COMPRESSOR |
SEV-BURNER |
LP-TURBINE |
As a final step,
Serving today’s and tomorrow’s power needs
Continuing evolution of the GT24
The latest upgrade
Since its introduction
230 MW40% Efficieny*
1999 2002 2006 2011230 MW*
40% Efficieny*
Multi-shaft KA24 Reference (CCPP) Plant
Alstom has designed
To find out more about the
KA24/GT24 Next Generation,
visit our website:
www.alstom.com/KA24
or contact your local
Alstom representative.

POWER
The Next Generation KA24/GT24 From Alstom,
The Pioneer In Operational Flexibility
Technical Paper

The Next Generation KA24/GT24 From Alstom, The Pioneer in Operational Flexibility
The Next Generation KA24/GT24 From Alstom, The Pioneer In Operational Flexibility © ALSTOM 2011. All rights reserved. Information contained in this document is indicative only. No representation or warranty is given or should be relied on that it is complete or correct or will apply to any particular project. This will depend on the technical and commercial circumstances. It is provided without liability and is subject to change without notice. Reproduction, use or disclosure to third parties, without express written authority, is strictly prohibited.
The Next Generation KA24/GT24
From Alstom, The Pioneer In Operational Flexibility
Sasha Savic, Karin Lindvall, Tilemachos Papadopoulos and Michael Ladwig
1 Introduction....................................................................................................................3
2 Market Trends and Requirements...................................................................................4
3 The Next Generation GT24 .............................................................................................6
4 KA24 Plant Features and Benefits ................................................................................12
5 Technology Validation for Reliable Plants .....................................................................18
5.1 Alstom's F-class Operational records..................................................................18
5.2 Next Generation GT24 Validation .......................................................................19
6 Retrofit Packages .........................................................................................................23
7 Summary......................................................................................................................24
8 References....................................................................................................................25

The Next Generation KA24/GT24 From Alstom, The Pioneer In Operational Flexibility
The Next Generation KA24/GT24 From Alstom, The Pioneer In Operational Flexibility © ALSTOM 2011. All rights reserved. Information contained in this document is indicative only. No representation or warranty is given or should be relied on that it is complete or correct or will apply to any particular project. This will depend on the technical and commercial circumstances. It is provided without liability and is subject to change without notice. Reproduction, use or disclosure to third parties, without express written authority, is strictly prohibited.
3
1 Introduction
In the recent years operators of a Combined Cycle Power Plant (CCPP) in the US power generation market
have experienced the requirement for high operational flexibility due to changing electrical demand. Based on
current forecasts, this trend for increased operational flexibility is expected to continue. While demand will continue to vary greatly, the growing portion of renewable sources of electricity production are expected to
require combined cycle plants to be more and more used to levelize the overall production of electricity in many
power market. As such, operational flexibility of gas turbines and combined cycle power plants is expected to play an even more important role in the US power generation market in the future.
For different demand conditions different optimization criteria have to be considered. During periods of high demand, operators want to maintain peak output reliably, whilst during off-peak periods combined cycle power
plants are shut-down or operated at minimum stable load.
To meet these goals and market challenges, the next generation GT24 gas turbine, capable of delivering 230
MW at 40% efficiency (heat rate of 8,530 Btu/kWh), and the corresponding KA24 combined cycle power plant,
which can achieve more than 700 MW output in a 2-on-1 configuration, has been developed by Alstom. In the
year 2011 the GT24 is celebrating it’s 15th Birthday since it’s introduction to the market. Since it’s early days
this product was recognised for it’s exceptional operational flexibility, high part-load efficiency and fast start-up
capabilities. From the very beginning this gas turbine technology incorporated features such as multiple
variable compressor guide vanes and sequential combustion, which set a new industry standard regarding
operational flexibility. Therefore Alstom is the pioneer in operational flexibility.
The paper describes in detail benefits which this next generation GT24 and the corresponding KA24 will provide to it’s users and operators. The unique features such as Low Load Operation (LLO), flexible operation modes
and superior part-load efficiency are further explained in the view of techno-economic parameters. The major
development steps of this upgrade, evolving from a platform, which accumulated more than 4.5 million fired hours and more than 75’000 starts, is detailed. In order to demonstrate the development targets prior to market introduction, a strict, in-depth validation program, following the Alstom Product Development Quality
(PDQ) process has been performed. Alstom is ready now to offer this product, which can achieve more than 60% efficiency or a heat rate of less than 5,690 Btu/kWh.

The Next Generation KA24/GT24 From Alstom, The Pioneer In Operational Flexibility
The Next Generation KA24/GT24 From Alstom, The Pioneer In Operational Flexibility © ALSTOM 2011. All rights reserved. Information contained in this document is indicative only. No representation or warranty is given or should be relied on that it is complete or correct or will apply to any particular project. This will depend on the technical and commercial circumstances. It is provided without liability and is subject to change without notice. Reproduction, use or disclosure to third parties, without express written authority, is strictly prohibited.
4
2 Market Trends and Requirements
The US power market is driven by two fundamental factors: economics and environmental pressure. Building
new power plants to meet future growing demand means also having to take into consideration more stringent
global environmental standards. There is a great support for low carbon technology and renewables. Expected
stringent environmental rules driven by EPA, lower natural gas prices (due to shale gas extraction), and state
policies will result in another wave of gas power investments and significant expansion of wind and solar
technology.
In addition to reducing capital costs, the increasing all-round efficiency is becoming one of the main market
drivers for gas turbine and combined cycle development, so as to lower fuel consumption, and at the same
time produce lower emissions (NOx, CO, CO2, etc.) with the ultimate goal of having a reduction in the cost of
electricity.
The shift in structural set-up from a regulated to a de-regulated power market resulted in the fact that many of
the advanced gas-fired combined cycle power plants installed in the late 1990’s and early 2000’s were
specified and designed based on base-load dispatch due to their relative high base-load efficiencies. The advent
of the renewable power market has seen a dramatic shift in the role of gas-fired power plants, in particular
combined cycle power plants. Today however, both existing and newly built combined cycle power plants are
changing their typical operational profiles, moving towards heavy cycling and intermediate dispatch regimes.
These gas-fired power plants are experiencing increasing periods of operation at part- and minimum stable
load as well as frequent stop/starts (up to daily cycling). The impact of increased renewable power on grid
networks is expected to see even greater need for combined-cycles to undertake a demand/supply balancing
role, with increased periods operating at reduced or minimum load settings and/or actual shut-downs.
As today’s markets require for most of the time operation in some kind of part-load or cycling regime, it is of
high importance to consider a mixture of operational profiles in an assessment of competing plant
technologies. To model the future most likely operation of a plant in a best way, weighting factors should be
applied to possible operational profiles. Based on Alstom’s experience of the KA24 fleet and its 50 Hz sister
product, the KA26 fleet, with over 4 million fired hours, the base-load operation amounts to less than 25% of
the overall operating profile. On the other hand we see plants mainly operating in the range of 60-95% plant
load with some operation at part-loads as low as 40%.

The Next Generation KA24/GT24 From Alstom, The Pioneer In Operational Flexibility
The Next Generation KA24/GT24 From Alstom, The Pioneer In Operational Flexibility © ALSTOM 2011. All rights reserved. Information contained in this document is indicative only. No representation or warranty is given or should be relied on that it is complete or correct or will apply to any particular project. This will depend on the technical and commercial circumstances. It is provided without liability and is subject to change without notice. Reproduction, use or disclosure to third parties, without express written authority, is strictly prohibited.
5
Comparing the characteristics required by power generators from their combined cycles 5-10 years ago with
those of today, a very different landscape appears. In the past the typical key customer CCPP specification
requirements focused on:
• Highest base-load efficiency based on approx. 8000 operating hours per annum
• Lowest specific sales price ($/kW)
• Lowest overall operational costs
• Shortest delivery schedule
• Experience
• Low (NOx/CO) emissions at base-load
Due to the explained changes in the market, the specifications of today’s CCPP must be based on:
• Highest overall weighted efficiency based on expected operating hours and load regime
• Lowest cost of electricity based on both, base- and part-load profiles
• Lowest overall operational costs based on the anticipated dispatching
• Reliability, availability and starting reliability
• Lowest minimum load during off-peak periods to minimize fuel consumption - ‘parking mode’
• Longer intervals between inspections to lower operation & maintenance cots
• Start-up capabilities (particularly for hot / warm plant conditions)
• Loading / de-loading gradients & transient capabilities
• High cycling capability of all plant components
• Low emissions (NOx, CO, …) including CO2 over widest possible load range
We see that today’s market is requesting many more requirements and capabilities compared with the past.
The combined cycle power plant technology that is able to fulfill the most of the requirements above is the
technology that is able to offer the highest operational flexibility. Such a solution will best suit the needs of a
dynamic power market. This is even more so when keeping in mind that once the asset is bought and installed,
it cannot be readily changed, at least not for many years.

The Next Generation KA24/GT24 From Alstom, The Pioneer In Operational Flexibility
The Next Generation KA24/GT24 From Alstom, The Pioneer In Operational Flexibility © ALSTOM 2011. All rights reserved. Information contained in this document is indicative only. No representation or warranty is given or should be relied on that it is complete or correct or will apply to any particular project. This will depend on the technical and commercial circumstances. It is provided without liability and is subject to change without notice. Reproduction, use or disclosure to third parties, without express written authority, is strictly prohibited.
6
3 The Next Generation GT24
In 2011 we are celebrating the 15th Birthday of the GT24 gas turbine technology together with its 50 Hz
version the GT26. Since it’s introduction to the market, the advanced class GT24/GT26 gas turbines have
demonstrated significant user’s advantages of this technology platform. Unprecedented operational flexibility,
superior part-load efficiency, low emissions over a wide load range with world-class levels of reliability and
availability are characteristics of these gas turbines.
The main technology differentiator of Alstom’s GT24/GT26 advanced-class gas turbines is the ‘sequential (2-
stage) combustion’ principle (Figure 3.1). The GT24/GT26 combustion system is based on a well-proven
Alstom combustion concept using the EV (EnVironmental) burner in a first, annular combustor, followed by the
high pressure (HP) turbine, SEV (Sequential EnVironmental) burners in the second, annular combustor, and
the low pressure (LP) turbine. The dry low NOx EV-burner has a long operating history and is used in the
whole Alstom gas turbine portfolio. Sequential combustion - ‘the reheat principle for gas turbines’ - had already
been applied to earlier Alstom gas turbines by using two side-mounted silo combustors. Integrating the concept
of dry low NOx EV-burner and sequential combustion into a single-shaft gas turbine resulted in the GT24/GT26
– an advanced-class (F-class) GT-technology with high power density and low emissions [1].
Figure 3.1: GT24 sequential combustion system
This sequential combustion combined with multiple variable compressor guide vanes set a new industry
standard regarding part-load efficiency and turn-down capability. These two main contributors to operational
flexibility were already introduced by Alstom in 1996, making Alstom the true pioneer of operational flexibility.

The Next Generation KA24/GT24 From Alstom, The Pioneer In Operational Flexibility
The Next Generation KA24/GT24 From Alstom, The Pioneer In Operational Flexibility © ALSTOM 2011. All rights reserved. Information contained in this document is indicative only. No representation or warranty is given or should be relied on that it is complete or correct or will apply to any particular project. This will depend on the technical and commercial circumstances. It is provided without liability and is subject to change without notice. Reproduction, use or disclosure to third parties, without express written authority, is strictly prohibited.
7
Since the first introduction of the GT24 gas turbine in 1996, there have been three upgrades (Figure 3.2):
1) In 1999, with the modification of the first combustion chamber (implementation of the Alstom
standard EV burner) and a first turbine upgrade (conversion from the then called A-configuration to
B-configuration) - Upgrade 1999
2) In 2002, with the introduction of the first compressor redesign - Upgrade 2002
3) In 2006, a rating increase with a second compressor upgrade together with a slight turbine inlet
temperature increase as well as staged EV combustion - Upgrade 2006
In 2002 the GT24/GT26 compressor was redesigned for an increased mass flow of approx. 5%, with the goal of
having a similar increase in the combined cycle power output. This was achieved through both, optimized
airfoil design and re-staggering of the compressor blades. The result was a design that required no change to
the rotor and stator flow path contour. Compressor blade length and channel height, rotor and compressor
vane fixation grooves, as well as blade and vane material all remained unchanged. Hence the design was
retrofitable.
The next modification of the GT24 compressor took place in 2006. The compressor was re-staggered in the
front stages to increase the mass flow further. Additionally, for optimization of efficiency and cooling air bleed
conditions, some re-stagger was carried out in the high-pressure part of compressor. However, the actual flow
path as defined by the outer casing and the rotor profile remained unchanged and this further upgrade is also
fully retrofitable into the earlier engines. Besides the re-staggering, additional measures to optimize the
compressor blade clearance have been introduced to increase the performance [2].
2002
2006
2011
1999
* In 2-on-1 CCPP configuration
Standard EV-burnerLP-Turbine Upgrade
• Superior Part Load Efficiency
• Start up <60 min• Fuel flexibility
36 x GT24
Compressor Upgrade Exhaust Housing
Upgrade
• Increased mass flow• Improved all-round
performance (base-load and part-load)
>20 GT24 upgrades
Compressor Optim.Turbine and Comb.Perf. Improvement
Staged EV combustion
• Increased mass flow• Improved cooling and
leakage• Start-up optimization• Lower Emissions
1x GT241x GT24 upgraded
** subject to purge credit granted
Compressor UpgradeCompressor UpgradeCompressor UpgradeCompressor UpgradeSEV Burner SEV Burner SEV Burner SEV Burner OptimOptimOptimOptim....LPLPLPLP----Turbine UpgradeTurbine UpgradeTurbine UpgradeTurbine Upgrade• Best in class all-round performance• Unprecedented part-load efficiency (virtually const. fFrom 100% to 80% load)• Low Load Operation• 10 min Spinning Reserve of >450 MW*• Start-up of ~30 min** • Switchable Operation Modes (PO and MCO)2002
2006
2011
1999
* In 2-on-1 CCPP configuration
Standard EV-burnerLP-Turbine Upgrade
• Superior Part Load Efficiency
• Start up <60 min• Fuel flexibility
36 x GT24
Compressor Upgrade Exhaust Housing
Upgrade
• Increased mass flow• Improved all-round
performance (base-load and part-load)
>20 GT24 upgrades
Compressor Optim.Turbine and Comb.Perf. Improvement
Staged EV combustion
• Increased mass flow• Improved cooling and
leakage• Start-up optimization• Lower Emissions
1x GT241x GT24 upgraded
** subject to purge credit granted
Compressor UpgradeCompressor UpgradeCompressor UpgradeCompressor UpgradeSEV Burner SEV Burner SEV Burner SEV Burner OptimOptimOptimOptim....LPLPLPLP----Turbine UpgradeTurbine UpgradeTurbine UpgradeTurbine Upgrade• Best in class all-round performance• Unprecedented part-load efficiency (virtually const. fFrom 100% to 80% load)• Low Load Operation• 10 min Spinning Reserve of >450 MW*• Start-up of ~30 min** • Switchable Operation Modes (PO and MCO)
Figure 3.2: GT24 performance and flexibility evolution

The Next Generation KA24/GT24 From Alstom, The Pioneer In Operational Flexibility
The Next Generation KA24/GT24 From Alstom, The Pioneer In Operational Flexibility © ALSTOM 2011. All rights reserved. Information contained in this document is indicative only. No representation or warranty is given or should be relied on that it is complete or correct or will apply to any particular project. This will depend on the technical and commercial circumstances. It is provided without liability and is subject to change without notice. Reproduction, use or disclosure to third parties, without express written authority, is strictly prohibited.
8
Additionally, the LP turbine inlet temperature was increased in order to improve the gas turbine engine and
plant efficiency. This step could be taken based on good field experience with the GT24 and GT26 fleet in
combination with additional hardware modifications concerning Thermal Barrier Coating (TBC) and cooling in
the LP turbine.For additional efficiency benefits the cooling and leakage air consumption has been optimized.
Using the field experience and data obtained from the GT26 Test Power Plant in Switzerland, the cooling
requirements in the SEV combustor could be adjusted to have an optimum between lifetime and efficiency. The
main features of the upgrade 2006 ( compressor and turbine) were implemented in a retrofit plant in Canada
and has successfully achieved more than 35’000 fired hours of commercial experience. The staged EV
combustion is in commercial operation in a GT24 in Mexico since April 2011 and implemented in GT26 fleet
since 2006.
Upgrade 2011 overview
Based on this continued development experience a further evolutionary step for upgrading the GT24 gas
turbine has been achieved. The upgrade is utilizing the features of the latest GT26 upgrade [3] including
optimization steps performed on the secondary air flow system. The scaling approach was applied to the
maximum extent. The latest evolutionary step further enhances the key benefits of this gas turbine and the
associated KA24 combined cycle power plant. In specific this upgrade is designed for:
• Lower specific investment
• Superior operational flexibility:
o Best-in-class part-load performance
o Turn-down-capability down to 40% CCPP power and below
o Two operation modes: maintenance cost and performance optimized operation mode
o Increased robustness against natural gas composition variation
• Reduced emissions:
Low NOx emissions at base load with a unique part load characteristic resulting in decreased NOx
emissions at very low loads
• Low Load Operation (“LLO”), whereby the full CCPP can be parked at a significantly reduced minimum
load point at below 20% plant load.
The next generation GT24 contains the well-proven EV burner from the 2006 upgrade of the GT24/GT26. The
HP turbine was also taken over from the previous ratings without design changes. Evolutionary modifications
are mainly limited to the following components (see Figure 3.3):
• Compressor
The modified compressor allows a further increase in mass-flow for higher engine performance at
improved operational flexibility and high efficiency.
• SEV (2nd stage) combustor
The SEV combustor is improved for increased fuel flexibility at yet lower emissions.

The Next Generation KA24/GT24 From Alstom, The Pioneer In Operational Flexibility
The Next Generation KA24/GT24 From Alstom, The Pioneer In Operational Flexibility © ALSTOM 2011. All rights reserved. Information contained in this document is indicative only. No representation or warranty is given or should be relied on that it is complete or correct or will apply to any particular project. This will depend on the technical and commercial circumstances. It is provided without liability and is subject to change without notice. Reproduction, use or disclosure to third parties, without express written authority, is strictly prohibited.
9
• Low Pressure (LP) Turbine
The LP Turbine is optimized for high efficiency and allows for a unique flexible operation at increased
inspection intervals of up to 30%. Compressor:
Increased mass flow
Optimised blade design
Increased turn-down ratio
SEV Burner:
Optimized SEV burner
Improved sealing
Leakage reduction
LP Turbine :
Airfoil profile optimization
Leakage reduction
Enhanced cooling scheme
Compressor:
Increased mass flow
Optimised blade design
Increased turn-down ratio
Compressor:
Increased mass flow
Optimised blade design
Increased turn-down ratio
SEV Burner:
Optimized SEV burner
Improved sealing
Leakage reduction
SEV Burner:
Optimized SEV burner
Improved sealing
Leakage reduction
LP Turbine :
Airfoil profile optimization
Leakage reduction
Enhanced cooling scheme
LP Turbine :
Airfoil profile optimization
Leakage reduction
Enhanced cooling scheme
Figure 3.3: Overview of major areas of evolutionary design modifications
Compressor
The compressor upgrade results in an increased inlet mass-flow, and was designed for high efficiency over a
wide ambient and load range. The architecture is based on the 22-stage well-proven Controlled Diffusion
Airfoils (CDA) design as already used in the current GT24 engine. The outer annulus is increased to match the
mass-flow increase. The compressor blading design was performed using tools developed by Rolls Royce, with
whom Alstom has an unlimited technology sharing agreement. To increase the part-load performance even
further, the variable vane row count has been increased from three to four. All upgrade design features are
based on scaling of the latest GT26 upgrade compressor [3].
Figure 3.4: Compressor cross-section with four variable guide vanes

The Next Generation KA24/GT24 From Alstom, The Pioneer In Operational Flexibility
The Next Generation KA24/GT24 From Alstom, The Pioneer In Operational Flexibility © ALSTOM 2011. All rights reserved. Information contained in this document is indicative only. No representation or warranty is given or should be relied on that it is complete or correct or will apply to any particular project. This will depend on the technical and commercial circumstances. It is provided without liability and is subject to change without notice. Reproduction, use or disclosure to third parties, without express written authority, is strictly prohibited.
10
SEV Combustor
The SEV combustor architecture and structural parts remain unchanged to the current GT24. The modifications
are limited to the SEV burner and the SEV fuel lance as well as improved seals to reduce leakages. The burner
modifications ensure a better mixing of the fuel with the airflow resulting in lower emissions over a wide
operation range. Additionally, the robustness of the SEV combustion system against fuel gas composition
changes could be enhanced: fuel gases with up to 18 volume percent of higher hydrocarbons can be now
handled by the standard hardware, without fuel preheating or other fuel conditioning.
Figure 3.5: Modifications to the SEV combustion system
As with the earlier GT24 upgrades, the SEV combustion system will maintain its superior NOx emissions
characteristic with almost no additional contribution to the NOx emissions produced in the EV combustor. This
results in a unique engine NOx characteristic for the entire plant load range from 100% down to 40% and below
(at the low load parking point at less than 20% CCPP load) – see Figure 3.6.
10%20%30%40%50%60%70%80%90%100%
Relative CCPP Load
NO
xE
mis
sio
n (
vp
pm
)
0
25
Typical GT24 NOx Emission
Typical Single CombustorEngine Characteristic
Low Load
10%20%30%40%50%60%70%80%90%100%
Relative CCPP Load
NO
xE
mis
sio
n (
vp
pm
)
0
25
Typical GT24 NOx Emission
Typical Single CombustorEngine Characteristic
Low Load
Figure 3.6: Unique GT24 NOx characteristic due to sequential combustion
Improved
sealing
SEV lanceSEV burner
Improved
sealing
SEV lanceSEV burner

The Next Generation KA24/GT24 From Alstom, The Pioneer In Operational Flexibility
The Next Generation KA24/GT24 From Alstom, The Pioneer In Operational Flexibility © ALSTOM 2011. All rights reserved. Information contained in this document is indicative only. No representation or warranty is given or should be relied on that it is complete or correct or will apply to any particular project. This will depend on the technical and commercial circumstances. It is provided without liability and is subject to change without notice. Reproduction, use or disclosure to third parties, without express written authority, is strictly prohibited.
11
Low Pressure Turbine
The upgrade package includes an improved LP turbine which is scaled from the latest GT26 upgrade to the
maximum extent.The benefits of the modified LP turbine are (i) higher component efficiency and (ii) the ability
to switch on-line between two operation modes thereby enabling extended operation intervals between
inspections of up to 30%. All four LP turbine stages contain airfoils with optimized profiles and cooling schemes.
The blade shroud design was improved to reduce the over-tip leakages. In addition the vane-part count per row
is reduced from the current GT24 to minimize the hot gas surface, which requires cooling. The turbine outlet
annulus is increased to accommodate the higher inlet mass-flow delivered by the upgraded compressor.
Increased efficiency
- Airfoil profile optimization
Optimised cooling
- Reduced number ofvanes 1, 2 and 4
Reduced losses
- Improved shrouds
Increased efficiency
- Airfoil profile optimization
Increased efficiency
- Airfoil profile optimization
Optimised cooling
- Reduced number ofvanes 1, 2 and 4
Optimised cooling
- Reduced number ofvanes 1, 2 and 4
Reduced losses
- Improved shrouds
Reduced losses
- Improved shrouds
Figure 3.7: Modifications to the LP turbine
Figure 3.8 shows the vane and blade parts for stages 1 and 3. 3D airfoil profiling has been applied throughout
all stages to achieve a high aerodynamic efficiency. As with the compressor, the turbine was designed using
the Rolls Royce design tools under a technology sharing agreement.
Vane 3
Blade 3
Vane 1
Blade 1Vane 3
Blade 3
Vane 3
Blade 3
Vane 1
Blade 1
Vane 1
Blade 1
Figure 3.8: Turbine parts for stage 1 and stage 3 of the improved LP turbine

The Next Generation KA24/GT24 From Alstom, The Pioneer In Operational Flexibility
The Next Generation KA24/GT24 From Alstom, The Pioneer In Operational Flexibility © ALSTOM 2011. All rights reserved. Information contained in this document is indicative only. No representation or warranty is given or should be relied on that it is complete or correct or will apply to any particular project. This will depend on the technical and commercial circumstances. It is provided without liability and is subject to change without notice. Reproduction, use or disclosure to third parties, without express written authority, is strictly prohibited.
12
4 KA24 Plant Features and Benefits
Next Generation Performance
The Alstom KA24-2 combined cycle reference power plant is a 2-on-1 configuration, designed to be the leader
not only in operational flexibility but also in all-round performance in it’s class. For typical cooling tower and
ISO ambient conditions, the KA24-2 is capable of delivering:
When fully optimized the KA24-2 has the capability to deliver:
• More than 700 MW gross output
• More than 60% gross efficiency / less than 5,690 Btu/kWh gross heat rate
• Further increased part-load efficiency
This plant performance is based on the following GT24 (2011) performance data:
General Notes:
1. Gas turbine gross electrical output and heat rate at the generator terminals, including generator losses but excluding duct and auxiliary losses
2. Gas turbine performance calculated with 100% methane, ISO conditions, including contribution from Once-Through-Cooler (OTC) to Water/Steam Cycle
>660 MW net power output, >58.3% net efficiency / <5860 Btu/kWh

The Next Generation KA24/GT24 From Alstom, The Pioneer In Operational Flexibility
The Next Generation KA24/GT24 From Alstom, The Pioneer In Operational Flexibility © ALSTOM 2011. All rights reserved. Information contained in this document is indicative only. No representation or warranty is given or should be relied on that it is complete or correct or will apply to any particular project. This will depend on the technical and commercial circumstances. It is provided without liability and is subject to change without notice. Reproduction, use or disclosure to third parties, without express written authority, is strictly prohibited.
13
Low Load Operation
Low Load Operation (LLO) is Alstom’s unique feature stemming out of sequential combustion gas turbine. For
customers operating in markets where daily stop/starts and/or parking at as low load as possible are required,
the LLO feature offers additional flexibility. LLO allows operators to park the entire plant below 20% combined
cycle power plant load with both GTs and the ST in operation. Compared to a 40-50% plant load, which is the
current industry standard, the LLO feature provides a unique spinning reserve capability of the KA24-2,
enabling to provide more than 450 MW additionally to the grid in 10 minutes without a risk of start failure and
without cyclic lifetime consumption of the gas turbine.
Due to the sequential combustion technology the emissions at the LLO point stay at low levels ensuring that
the plant complies with the most stringent single-digit emission regulations such as 2 ppm NOx, CO and NH3
slip. The LLO is achieved by switching off the second combustor (SEV), while the first combustor (EV) operates
in its optimal point (thus producing base-load like emissions).
A simplified case study for the KA24-2 operating at the LLO operation point may demonstrate the economic
benefits when compared to industry standard minimum stable operation at 50% plant load:
Main market parameters
Fuel Price ($/mmBtu) 4.5
CO2 Tax ($/Tonne) 0
Electricity price ($/MWh) 45
Expected operating regime
Operating hours / year 4000
Number of starts / year 200
Operating regime Cycling
Typical Plant Capacity for Cooling Tower application on ISO ambient conditions
Net Output (MW) 660
Net Efficiency (%) 58
Net Heat Rate (Btu/kWh) 5883
For the above parameters, the difference in fuel consumed when the plant is operating at minimum stable load
of 50% to that of a plant operating at below 20% assuming that this operation is applicable to approximately
650 hours a year, results in annual savings of M$ 1.6. Assuming a 20 years of plant life, present value of this
feature amounts to M$ 17.8.

The Next Generation KA24/GT24 From Alstom, The Pioneer In Operational Flexibility
The Next Generation KA24/GT24 From Alstom, The Pioneer In Operational Flexibility © ALSTOM 2011. All rights reserved. Information contained in this document is indicative only. No representation or warranty is given or should be relied on that it is complete or correct or will apply to any particular project. This will depend on the technical and commercial circumstances. It is provided without liability and is subject to change without notice. Reproduction, use or disclosure to third parties, without express written authority, is strictly prohibited.
14
When compared to starts and stops, LLO provides plant operators the following benefits:
• Reduction of cyclic lifetime impact, thus benefitting on the maintenance cost side
• Faster re-loading when the power is demanded, allowing power companies to offer higher availabilities
to grid operators
• Provision of a spinning reserve capacity able to meet rising load demands
• Avoidance of potential risk of start-up failures, which - depending on the dispatch prices - can have
manifold negative impacts on the profitability (high liquidated damages and lost additional revenues, as
well as losing priorities when dispatching due to unavailability).
• Reduction of cumulative emissions compared to parking a plant at a higher part load
• Avoidance of possible increased noise and water plume emissions possible during start-ups
Flexible operation modes
The next generation GT24 features Alstom’s unique flexible operation modes, already available for the GT26
and for Alstom’s conventional class gas turbine GT13E2. It allows with one set of hardware the on-line
selection between a “maintenance cost optimized” operation mode with extended inspection intervals and a
“performance optimized” operation mode for maximum output/efficiency to meet variable market
requirements, while the plant is connected to the grid. The inspection interval criteria are shown in Figure 4.1:
Compared with the Upgrade 2006 an increase of around 30% can be achieved, resulting in a corresponding
increased availability and reduced maintenance cost.
Cyc
lic
Even
ts (
sta
rt/ S
top
, tr
an
sie
nts
)
Operating Hours
+ 30% increase
Figure 4.1: Longer inspection intervals with the next generation GT24
The operator has the option to run during high part load operation in the performance optimized mode. In this
mode the firing temperature is increased – as a result a higher exhaust gas temperature is achieved for better
combined-cycle performance. In the maintenance cost optimized mode, the firing- and the exhaust-
temperature are lower, resulting in a small reduction in performance. Hence the interval between the GT24
inspections is extended by up to 30% and can achieve 4.5 years for a hot gas path inspection. This on-line

The Next Generation KA24/GT24 From Alstom, The Pioneer In Operational Flexibility
The Next Generation KA24/GT24 From Alstom, The Pioneer In Operational Flexibility © ALSTOM 2011. All rights reserved. Information contained in this document is indicative only. No representation or warranty is given or should be relied on that it is complete or correct or will apply to any particular project. This will depend on the technical and commercial circumstances. It is provided without liability and is subject to change without notice. Reproduction, use or disclosure to third parties, without express written authority, is strictly prohibited.
15
switchable feature offers a further increase in the degree of operational flexibility delivered by the GT24 and the
corresponding KA24 combined cycle power plant.
Sequential combustion operation concept
.
1 2 3
Relative GT Load
GT Exhaust Temperature
SEV Combustor Temperature
VGV Position
0% PO*
SEV Ignition~10% Load
EV Combustor Temperature1
2
3
MCO*
* MCO: Maintenance Cost Optimized modePO: Performance Optimized mode
1 2 3
Relative GT Load
GT Exhaust Temperature
SEV Combustor Temperature
VGV Position
0% PO*
SEV Ignition~10% Load
EV Combustor Temperature1
2
3
MCO*
* MCO: Maintenance Cost Optimized modePO: Performance Optimized mode
11 22 33
Relative GT Load
GT Exhaust Temperature
SEV Combustor Temperature
VGV Position
0% PO*
SEV Ignition~10% Load
EV Combustor Temperature1
2
3
MCO*
* MCO: Maintenance Cost Optimized modePO: Performance Optimized mode
Figure 4.2: Operation concept
Sequential combustion results in a unique operational flexibility. This is becoming clear when looking on the
GT24 operation concept (Figure 4.2): After ignition of the first combustion chamber the firing temperature
reaches at around 10% relative GT load already it’s design value and stays virtually constant till base-load, thus
providing optimal conditions for low NOx emissions over a wide load range
The second combustor is ignited by self-ignition due to already high inlet temperature at around 10% relative
GT load. The GT loading is then performed by increasing the firing temperature in the SEV combustor together
with opening of the VGV’s to increase the air inlet mass flow. This is done in such a way that the GT exhaust
temperature stays nearly constant over a wide load range, thus enabling the high plant part load efficiency and
reducing the thermal stresses of the HRSG in case of load balancing operation.

The Next Generation KA24/GT24 From Alstom, The Pioneer In Operational Flexibility
The Next Generation KA24/GT24 From Alstom, The Pioneer In Operational Flexibility © ALSTOM 2011. All rights reserved. Information contained in this document is indicative only. No representation or warranty is given or should be relied on that it is complete or correct or will apply to any particular project. This will depend on the technical and commercial circumstances. It is provided without liability and is subject to change without notice. Reproduction, use or disclosure to third parties, without express written authority, is strictly prohibited.
16
Sequential combustion can be therefore considered as a mean of separating the emission production, which is
mainly done in the first combustor, from the power generation, which is mainly done through the second
combustor. This results in unique benefits:
• Highest part-load efficiency and thus lowest CO2 production
• Highest turn-down capability of the entire plant
• Unique NOx emission characteristics with NOx decrease when de-loading
Part Load Behavior
Figure 4.3: KA24 Part-load characteristics
The result of the above described operation concept is a superior part-load efficiency characteristics of the
KA24 CCPP. One distinct characteristic is the fact that the plant efficiency stays nearly constant from 100%
down to 80% combined cycle, a capability unique in the market.
Further analysis of the case study as defined in the LLO section above is performed for the part-load
characteristics as shown in Figure 4.3. For the cycling operating regime (4’000 OH / Year, 200 starts, 60% of
the time operation at part-loads between 60 and 95%) annual savings of fuel when compared to typical single
combustor part load characteristic exceed 6’500 tones per year. At the fuel cost of 4.5 $/mmBtu, annual
savings are close to M$ 1.5, and if discounted over 20 years of plant life, this can amount to as much as more
than M$ 15 of present value. As the economical impact of the part load performance is significant, the
additional effort to perform a careful evaluation of various load profiles in addition to the base-load is certainly

The Next Generation KA24/GT24 From Alstom, The Pioneer In Operational Flexibility
The Next Generation KA24/GT24 From Alstom, The Pioneer In Operational Flexibility © ALSTOM 2011. All rights reserved. Information contained in this document is indicative only. No representation or warranty is given or should be relied on that it is complete or correct or will apply to any particular project. This will depend on the technical and commercial circumstances. It is provided without liability and is subject to change without notice. Reproduction, use or disclosure to third parties, without express written authority, is strictly prohibited.
17
worth the effort. Additionally, as more than 18’000 tones of CO2 can also be avoided, in a likely case of future
regulations introducing a CO2 tax, even higher economic impact can be expected.
Spinning Reserve, Fast Starts
Besides superior part-load performance, Alstom’s KA24 has been designed to ensure that grid electricity supply
can be maintained, should there be an unexpected loss of generating capacity. With the LLO feature the KA24
provides a unique operational spinning reserve capacity by being able to deliver more than 450 MW
additionally within 10 minutes, as illustrated in the Figure 4.4.
General Possibilities of Reducing Load
0
10
20
30
40
50
60
70
80
90
100
110
Time
GT
re
lati
ve l
oa
d (
%) Typical minimum GT
load given by emission regulations & GT
emission characteristic
GT26 LLO: Reduced load at low
emission levelsGT Shutdown and Restart:
Thermal stress cycles, starting reliability, no online
power reserve.
Period of low power demand and/or reduced
power tariff
GT24 LLO
General Possibilities of Reducing Load
0
10
20
30
40
50
60
70
80
90
100
110
Time
GT
re
lati
ve l
oa
d (
%) Typical minimum GT
load given by emission regulations & GT
emission characteristic
GT26 LLO: Reduced load at low
emission levelsGT Shutdown and Restart:
Thermal stress cycles, starting reliability, no online
power reserve.
Period of low power demand and/or reduced
power tariff
General Possibilities of Reducing Load
0
10
20
30
40
50
60
70
80
90
100
110
Time
GT
re
lati
ve l
oa
d (
%)
General Possibilities of Reducing Load
0
10
20
30
40
50
60
70
80
90
100
110
Time
GT
re
lati
ve l
oa
d (
%) Typical minimum GT
load given by emission regulations & GT
emission characteristic
GT26 LLO: Reduced load at low
emission levelsGT Shutdown and Restart:
Thermal stress cycles, starting reliability, no online
power reserve.
Period of low power demand and/or reduced
power tariff
GT24 LLO
Figure 4.4: Ramp up from LLO to base-load – 10 minutes spinning reserve
Fast start-up times are achieved through careful identification and design of all plant components. Hot start-up
times of 30 minutes are possible without lifetime implications on any of the plant rotating equipment as well as
steam generators.

The Next Generation KA24/GT24 From Alstom, The Pioneer In Operational Flexibility
The Next Generation KA24/GT24 From Alstom, The Pioneer In Operational Flexibility © ALSTOM 2011. All rights reserved. Information contained in this document is indicative only. No representation or warranty is given or should be relied on that it is complete or correct or will apply to any particular project. This will depend on the technical and commercial circumstances. It is provided without liability and is subject to change without notice. Reproduction, use or disclosure to third parties, without express written authority, is strictly prohibited.
18
5 Technology Validation for Reliable Plants
5.1 Alstom's F-class Operational records
In the power industry, it is important for any operator to focus not only on the operating hours experience but
also to understand if the entire plant technology is fit for various operational scenario i.e. from peaking over
cycling and intermediate operation to base-load. Variations are expected to be seasonal and regional and very
difficult to predict. Only those combined cycle power plants are said to be successful today in the market if it
successfully demonstrates that all types of duty cycle operation can be met without constraints.
The KA24/KA26 combined cycle power plants are already providing such flexibility. Figure 5.1 shows the
operating characteristics during the past 5 years for KA24/KA26 demonstrating that these Alstom’s F-class
reference power plants are best suited for the full range of operating regimes.
Figure 5.1: Average KA24 / KA26 fleet operating regime (2006-10)
The GT24/GT26 fleet has now achieved more than 4.5 million fired operating hours with more than 75’000
starts. The GT24 fleet itself has accumulated more than 2.3 million fired hours with more than 50’000 starts.
Significant experience has been gained with conventional base-load operation, but also with intermediate
cycling and daily start and stop operation. The GT24 and the KA24 combined cycle power plant have
demonstrated its flexibility and reliable start-up characteristics.

The Next Generation KA24/GT24 From Alstom, The Pioneer In Operational Flexibility
The Next Generation KA24/GT24 From Alstom, The Pioneer In Operational Flexibility © ALSTOM 2011. All rights reserved. Information contained in this document is indicative only. No representation or warranty is given or should be relied on that it is complete or correct or will apply to any particular project. This will depend on the technical and commercial circumstances. It is provided without liability and is subject to change without notice. Reproduction, use or disclosure to third parties, without express written authority, is strictly prohibited.
19
5.2 Next Generation GT24 Validation
Validation Strategy
In order to ensure validated and highly reliable products Alstom is using a gated Product Development Quality
(PDQ) process. This process defines at a very early stage during the design phase for each component, the
appropriate validation measure to reduce risk to a minimum level. The PDQ process has been applied for the
next generation GT24/GT26 with regard to the validation of tools, parts, components and complete engine. For
each component various validation steps have been performed such as design feature validation (to validate
the cooling channel design), component validation, full engine validation in the Alstom GT26 Test Power Plant
and field monitoring. In general, as the GT24 upgrade is based on scaling from the latest GT26 upgrade to the
maximum extent, the results from GT26 engine validation can be read across.
SpecifyDerive
ConceptValidate
Detail
Design
Introduce
to
fleet
Design
validation
Component Technology
validation
Technology Validation in
real engine
Field
Monitoring
Gate reviews
Figure 5.2: Validation steps according to Alstom’s PDQ process

The Next Generation KA24/GT24 From Alstom, The Pioneer In Operational Flexibility
The Next Generation KA24/GT24 From Alstom, The Pioneer In Operational Flexibility © ALSTOM 2011. All rights reserved. Information contained in this document is indicative only. No representation or warranty is given or should be relied on that it is complete or correct or will apply to any particular project. This will depend on the technical and commercial circumstances. It is provided without liability and is subject to change without notice. Reproduction, use or disclosure to third parties, without express written authority, is strictly prohibited.
20
Technology validation in real engine
The full upgrade package has been implemented in the GT26 Test Power Plant in Birr, Switzerland. A dedicated
test campaign started in 2011 and after successful validation enabled market introduction of the next
generation GT24/GT26.
The Alstom Test Power Plant is connected to the Swiss grid. It is dedicated for upfront testing of upgrades in all
kinds of operation regimes, i.e. from base-load to extreme off-design conditions, before products are released
to the market.
Figure 5.3: GT26 Test Power Plant
Special instrumentation techniques applied are shown in Figure 5.4. For this test and validation campaign,
Alstom has installed more than 4’000 additional test-instrumentation above standard to ensure maximum
engine performance monitoring under all operating conditions.
Strain gaugeStrain gauge
PyrometersPyrometers
Kiel Heads Kiel Heads
TelemetryTelemetry
Hot Gas RakesHot Gas Rakes
5-hole Probe5-hole Probe
Thermal Paints for
hot gas path
Figure 5.4: Special instrumentation overview for GT Test Power Plant

The Next Generation KA24/GT24 From Alstom, The Pioneer In Operational Flexibility
The Next Generation KA24/GT24 From Alstom, The Pioneer In Operational Flexibility © ALSTOM 2011. All rights reserved. Information contained in this document is indicative only. No representation or warranty is given or should be relied on that it is complete or correct or will apply to any particular project. This will depend on the technical and commercial circumstances. It is provided without liability and is subject to change without notice. Reproduction, use or disclosure to third parties, without express written authority, is strictly prohibited.
21
Turbine validation
The turbine technology validation was done in three-steps. As a first-step, the turbine internal cooling schemes
and their internal heat transfer was validated in an in-house test facility using Perspex models and thermo-
sensitive liquid crystal measurement technique (Figure 5.5).
Figure 5.5: Internal heat transfer validation using thermo-sensitive liquid crystals and Perspex models
The second-step of turbine component validation was done during two engine test campaigns in the GT26 Test
Power Plant. The first test campaign was a dedicated thermal paint run for the improved hot gas parts (Figure
5.6). The second campaign was a performance and mapping test campaign to validate the LP Turbine
performance characteristic over the entire range of operating conditions.
Figure 5.6: GT26 test power plant - thermal paint test of the LP Turbine

The Next Generation KA24/GT24 From Alstom, The Pioneer In Operational Flexibility
The Next Generation KA24/GT24 From Alstom, The Pioneer In Operational Flexibility © ALSTOM 2011. All rights reserved. Information contained in this document is indicative only. No representation or warranty is given or should be relied on that it is complete or correct or will apply to any particular project. This will depend on the technical and commercial circumstances. It is provided without liability and is subject to change without notice. Reproduction, use or disclosure to third parties, without express written authority, is strictly prohibited.
22
Based on the good results from the tests in the Test Power Plant, the LP turbine hardware was released for a
front-runner operation in a commercial KA26 unit in Spain. Performance guarantees were exceeded. This
front-runner saw its first scheduled borescope inspection in September 2010 at 5’529 OH, 45 starts. As Figure
5.7 shows the LP turbine has been in excellent condition. As of September 2011 the turbine has accumulated
more than 8’000 OH.
Blade 2Blade 1
Vane 2Vane 1
Figure 5.7: LP turbine frontrunner borescope inspection
Compressor validation
The compressor validation was done in a two step approach. First step being tests in a scaled rig and second
step was full engine validation in the GT26 Test Power Plant. During the mapping of a GT compressor when
the engine is connected to the grid, the operating line from idle to full load can be validated. In order to gain a
full compressor map over the entire speed, ambient temperature and pressure ratio range a full 22-stage
scaled-rig was built and tested. The scaled-rig included bleed slots and inlet and outlet geometry and all
variable rows as the full-scale GT24. On top of compressor mappings, upfront start-up optimizations for start-
up power and time were undertaken. The mapping of the compressor was carried out up to the surge limit, far
beyond the GT24 operating line requirements. The rig is one of the world largest axial compressor rigs for
pressure ratios above 30. The instrumentation scope for the rig includes pressure taps throughout the
compressor, both steady and transient temperature measurements, strain gauges, tip timing and clearance
measurements.

The Next Generation KA24/GT24 From Alstom, The Pioneer In Operational Flexibility
The Next Generation KA24/GT24 From Alstom, The Pioneer In Operational Flexibility © ALSTOM 2011. All rights reserved. Information contained in this document is indicative only. No representation or warranty is given or should be relied on that it is complete or correct or will apply to any particular project. This will depend on the technical and commercial circumstances. It is provided without liability and is subject to change without notice. Reproduction, use or disclosure to third parties, without express written authority, is strictly prohibited.
23
SEV Burner validation
The SEV Burner validation was done in a two-step approach. The first step was to carry out a single burner test
in atmospheric and high-pressure rigs. The single burner high-pressure test rig is used to measure and analyze
the mixing and emission behavior, to check the flame stability limits and the acoustic behavior. Parameter
variations are done for inlet and outlet boundary conditions, and in particular for various fuel types (varying
heating values and higher hydrocarbons content). The instrumentation on the rig contains more than 500
measurement locations for temperatures, pressures, acoustics, emissions and flame positioning. Out of the
single burner test rig different burner fuel lance configurations were selected for full-engine tests in the Alstom
Test Power Plant at Birr in Switzerland. In a test series the best configuration was selected for implementation.
This configuration was then mapped for the full operating concept and a large ambient range.
6 Retrofit Packages
Alstom ensures that the improvements to the GT24/GT26 platform can be offered as retrofit packages
wherever possible. In this respect the LP turbine of the next generation GT24/GT26 is offered as an upgrade.
The first LP turbine was already retrofitted in the GT26 unit Castejon in Spain. As reported by the plant owner
HC Energía, this retrofit package helped to even further improve the competitiveness of the asset, by enabling
even higher operational flexibility, with improved performance and additionally extended intervals between
inspections (1).
The GT24 turbine retrofit package enables an extension of the hot gas path inspection intervals by up to 8’000
operating hours while simultaneously increasing the output by more than 10 MW and decreasing the heat rate
by more than 88 Btu/kWh in performance optimized operation mode, which corresponds to + 5 MW and –50
Btu/kWh in the maintenance cost optimized operation mode. As the result of the extended interval between
the hot gas path inspections, maintenance costs can be reduced and in combination with the improved
performance, the overall plant economics improve. The actual performance improvement values are subject to
specific configuration of the GT24 and it’s plant components.

The Next Generation KA24/GT24 From Alstom, The Pioneer In Operational Flexibility
The Next Generation KA24/GT24 From Alstom, The Pioneer In Operational Flexibility © ALSTOM 2011. All rights reserved. Information contained in this document is indicative only. No representation or warranty is given or should be relied on that it is complete or correct or will apply to any particular project. This will depend on the technical and commercial circumstances. It is provided without liability and is subject to change without notice. Reproduction, use or disclosure to third parties, without express written authority, is strictly prohibited.
24
7 Summary
Alstom’s position as the pioneer in operational flexibility continues. The outcome of this next generation GT24 is
a proven advanced-class gas turbine technology, with the best-in-class all-round performance to further
increase the competitiveness for power plant operators. Moreover, the commonly known strengths of the GT24
– long recognized and appreciated for its high all-round operational flexibility and the high fuel flexibility – have
been further extended. The benefits for operators of the next generation KA24-2 are:
• More than 700 MW gross when fully optimized
• More than 60% gross efficiency / less than 5,690 Btu/kWh gross heat rate
• The best-in-class part-load efficiency with efficiency nearly costant from 100% down to 80% load
• Increased inspection intervals resulting in higher availability
• Reduced maintenance costs
• Switchable (on-line) operation modes to adjust the gas turbine performance according to market
requirements and thereby offering better inspection planning
• Low Load Operation for parking the entire combined-cycle power plant at less than 20% CCPP load and
still meet the emission requirements
• A spinning reserve for delivering more than additional 450 MW in 10 minutes from Low Load to Base-
load.
• Fast hot start-up times of 30 minutes
Alstom’s development philosophy is to attain the balance between providing advanced technology while
maintaining the proven levels of high availability and reliability based on an evolutionary approach. The latest
upgrade of the GT24 is a perfect example for this approach. Based on the basis of a well-proven gas turbine,
Alstom has further developed the Compressor, the SEV Combustor and the LP turbine while keeping the EV
combustor and HP turbine unchanged.
Validation is a key step within Alstom’s development process - for the latest upgrade the validation has been
performed to the maximum extent on the 50 Hz version, the GT26 engine, with results being transferable to
the GT24 engine:
• Technology validation under real engine conditions in the Alstom GT26 Test Power Plant in Switzerland
• Full testing of Compressor, SEV Combustor and LP turbine in various test rigs
• Validation of the LP turbine technology, operating commercially in a retrofitted unit for more than
8’000 operation hours

The Next Generation KA24/GT24 From Alstom, The Pioneer In Operational Flexibility
The Next Generation KA24/GT24 From Alstom, The Pioneer In Operational Flexibility © ALSTOM 2011. All rights reserved. Information contained in this document is indicative only. No representation or warranty is given or should be relied on that it is complete or correct or will apply to any particular project. This will depend on the technical and commercial circumstances. It is provided without liability and is subject to change without notice. Reproduction, use or disclosure to third parties, without express written authority, is strictly prohibited.
25
8 References
[1] Superior fuel flexibility for today’s and future market requirements
Douglas Pennell, Matthias Hiddemann, Peter Flohr
Paper presented at Power Gen Europe, June 2010.
[2] A Further Retrofit Upgrade for Alstom’s Sequential Combustion GT24 Gas Turbine
Kai Lanzenberger, Johann Daxer, Stephen Philipson, Alexander Hoffs
Paper presented at Power-Gen International, Dec 2007
[3] The next generation Alstom GT26, the pioneer in operational flexibility,
Matthias Hiddemann, Frank Hummel, Jürg Schmidli, Pablo Argüelles
Paper presented at Power-Gen Europe, Milano, Italy, June 2011
[4] Development and Design of Alstom’s Staged fuel Gas Injection EV burner for Nox Reduction
Martin Zajadatz, Rudolf Lachner, Stefano Bernero, Christian Motz, Jonathan Duckers, Peter Flohr
Paper presented at Power-Gen Europe conference, Cologne, Germany, May 2006

Alstom Power
© ALSTOM 2011. All rights reserved. Information contained in this document is indicative only. No representation or warranty is given or should be relied on that it is complete or correct or will apply to any particular project. This will depend on the technical and commercial circumstances. It is provided without liability and is subject to change without notice. Reproduction, use or disclosure to third parties, without express written authority, is strictly prohibited.
Photo credit:
www.alstom.com/power


APPENDIX C
Summary of Recently Issued GHG permits and pending Applications Under Review for Combustion Turbines


C-1
Table C-1. Recently Issued Permits and Applications Under Review for Greenhouse Gases Emissions from Combustion Turbines
No. Permit Authority
Permit Number Company Name Facility Name Location
# of Units
Unit Description Model
Capacity Control Technology
Thermal Efficiency
PTE Proposed BACT Limits
Monitoring BTU (HHV) per
kWh (gross) tpy CO2e Parameter Units
Recently Issued Permits
1 USEPA R6 PSD-TX-955-GHG (issued 11-29-2012)
Calpine Corporation Channel Energy Center Pasadena, Texas
1 Siemens FD2/FD3 168-180 MW Combined cycle operation Efficient design Process monitoring
7,730 1,003,355 1,002,391 tpy CO2 [365-day rolling avg] Fuel monitoring, CEMS
18.55 tpy CH4 [365-day rolling avg]
1.86 tpy N2O [365-day rolling avg]
0.460 tons/MWh [30-day rolling avg]
7,730 Btu/kWh [30-day rolling avg]
2 USEPA R6 PSD-TX-979-GHG (issued 11-29-2012)
Calpine Corporation Deer Park Energy Center Dallas, TX
1 Siemens FD2/FD3 168-180 MW Combined cycle operation Efficient design Process monitoring
7,730 1,045,635 1,044,629 tpy CO2 [365-day rolling avg] Fuel monitoring, CEMS
19.34 tpy CH4 [365-day rolling avg]
1.93 tpy N2O [365-day rolling avg]
0.460 tons/MWh [30-day rolling avg]
7,730 Btu/kWh [30-day rolling avg]
3 USEPA R1 (issued 4-12-2012) Pioneer Valley energy Center Westfield, MA
1 Mitsubishi M501G 431 MW Combined cycle operation N/A N/A 825 CO2e/MWh (initial source test) N/A
895 CO2e/MWh [365-day rolling avg] N/A
4 USEPA R9 (issued 10-18-2011) Palmdale Hybrid Power Project Palmdale, California
2 GE 7FA (with a 50 MW solar thermal array field)
N/A Combined cycle operation 7,319 N/A 7,319 Btu/kWh (HHV) N/A
5 USEPA R6 PSD-TX-1244-GHG (9-28-2011)
Lower Colorado River Authority Thomas C. Ferguson Power Plant Horseshoe Bay, TX
2 GE 7FA 195 MW Combined cycle operation Efficient design
N/A 909,833 908,958 tpy CO2 Fuel monitoring or CEMS
16.80 tpy CH4
1.70 tpy N2O
0.46 ton CO2/MWh (net)
7,720 Btu/kWh (HHV)
[365 day rolling avg]
6 USEPA R9 PSD-SD-11 (draft) Pio Pico Energy Center, LLC Pio Pico Energy Center Otay Mesa, CA
3 GE LMS100 100 MW 930 mmBtu/hr
Simple cycle operation Efficient design
N/A N/A 1,181 lb CO2/MWh (net) Btu/kwH (HHV - gross) Fuel monitoring CEMS, CMS
9,196
7 USEPA R2 (draft 5-25-2011) Cricket Valley Energy Center Dover, NY
3 GE 7FA N/A Combined cycle operation N/A N/A 7,605 Btu/kwH (HHV – ISO w/o duct firing) N/A
Applications Pending
8 USEPA R6 N/A (submitted 11-26-2012)
NRG Texas Power LLC SR Berton Unit 5 La Porte, Texas
2 GE 7FA-05 255 MW N/A N/A N/A N/A N/A N/A
9 USEPA R6 N/A (submitted 11-26-2012)
NRG Texas Power LLC Cedar Bayou Unit 5 Baytown, Texas
2 GE 7FA-05 255 – 264 MW N/A N/A N/A N/A N/A N/A
Siemens F(5)
M 501GAC

C-2
Table C-1. Recently Issued Permits and Applications Under Review for Greenhouse Gases Emissions from Combustion Turbines (Continued)
No. Permit Authority
Permit Number Company Name Facility Name Location
# of Units
Unit Description Model
Capacity Control Technology
Thermal Efficiency
PTE Proposed BACT Limits
Monitoring BTU (HHV) per
kWh (gross) tpy CO2e Parameter Units
10 USEPA R6 N/A (submitted 11-13-2012)
Guadalupe Power Partners LP Guadalupe Generating Station Marion, Texas
2 GE 7FA.03 383 – 454 MW Simple cycle operation 10,673 – 11,456
511,429 – 681,839
511,429 tpy CO2e
11,121 Btu/kWh
GE 7FA.04 522,722 tpy CO2e
10,826 Btu/kWh
4GE 7FA.05 601,520 tpy CO2e
10,673 Btu/kWh
Siemens 5000F(5) 681,839 tpy CO2e
11,456 Btu/kWh
11 USEPA R6 N/A (submitted 10-1-2012)
Copano Processing, LP Houston Central Gas Plant Sheridan, TX
2 Solar Mars 100 15,000 hp Efficient design Waste heat recovery Process monitoring
N/A 65,097 1.32 ton CO2e/hp-hr monitoring AFR monitoring Quarterly source test
12 USEPA R6 N/A (proposed BACT limits 9-21-2012)
El Paso Electric Company Montana Power Station El Paso, TX
4 GE LMS100 100 MW Simple Cycle Operation Efficient design Evaporative cooling Good operating practices Fuel selection
9,074 227,840 227,840 tpy CO2e [365-day rolling avg] CEMS, Fuel quality monitoring
1,194 lb CO2/MWh [30-day rolling avg]
13 USEPA R6 NA (submitted 9-18-2012)
Air Liquide Large Industries, Bayou Cogeneration Plant Pasadena, Texas
4 GE 7EA 80 MW Good combustion practices, operation and maintenance Fuel selection
8,334 N/A 485,112 tpy CO2 365-day rolling average / CEMS
14 USEPA R6 N/A (revised 8-6-2012) La Paloma Energy Center Harlingen, TX
2 GE F7FA 183 MW Combined cycle operation Energy Efficiency, Practices and Designs
7,528 1,300,674 1,299,423 tpy CO2 Fuel monitoring or CEMS
24.10 tpy CH4
2.40 tpy N2O
895.6 lb CO2/MWh
Siemens SGT6-5000F(4) 265 MW 7,649 1,451,772 1,450,376 tpy CO2
26.80 tpy CH4
2.70 tpy N2O
910.0 lb CO2/MWh
Siemens SGT6-5000F(5) 271 MW 7,720 1,642,317 1,640,737 tpy CO2
30.40 tpy CH4
3.00 tpy N2O
918.5 lb CO2/MWh
15 USEPA R6 N/A (submitted 7-10-2012)
DCP Midstream, LP Jefferson County NGL Fractionation Plant Jefferson County, TX
2 Solar Saturn T-4700 43 mmBtu/hr Efficient design Waste heat recovery Process monitoring
N/A 24,610 24,610 tpy CO2e None proposed
16 USEPA R6 N/A (submitted 6-20-2012)
Calhoun Port Authority ES Joslin Power Station Point Comfort, TX
3 GE 7FA 208 MW Combined cycle operation Efficient design Evaporative cooling Steam turbine bypass
N/A N/A 7,730 Btu/kWh (HHV) N/A
17 USEPA R6 N/A (submitted 5-25-2012)
DCP Midstream, LP Hardin County NGL Fractionation Plant Hardin County, TX
2 Solar Saturn T-4700 43 mmBtu/hr Efficient design Waste heat recovery Process monitoring
N/A 24,610 24,610 tpy CO2e None proposed
18 USEPA R6 N/A (submitted 12-21-2011)
Freeport LNG Development Liquefaction Plant Freeport, TX
1 GE Frame 7EA 87 MW Efficient design Waste heat recovery Evaporative cooling
N/A 562,693 562,141 tpy CO2 Fuel monitoring or CEMS
0.03 tpy CH4
1.06 tpy N2O

APPENDIX D
Texas Professional Engineer Certification


D-1
Texas Professional Engineer Certification
I, the undersigned, hereby certify that, to the best of my knowledge, any greenhouse gas emission
estimates reported or relied upon in this application are true, accurate, and complete and are based on
reasonable techniques available for calculating greenhouse gas emissions.
Signature Date 25 April 2013
Richard Young, P.E., P.G.
Sustainability and Climate Change Manager
SWCA Environmental Consultants