fiaas forum - finity consulting · 3/24/2015 · eq risk a real challenge (and not the only one!)...
TRANSCRIPT

© 2015 Finity Consulting Pty Limited
FIAAS Forum
24 March 2015
Finity Consulting Pty Limited 2015 Supplied subject to the FIAAS terms of agreement and http://www.finity.com.au terms of use of the Finity client website available at: http://www.finity.com.au/Website_Terms_of_Use.pdf Queries can be directed to [email protected]

Agenda
Use of catastrophe model results by actuaries – GIPC
guidance note
Royal Commission into Child Sexual Abuse
Risk Margins – APRA industry review
Reminder of Chatham House rule:
“Participants are free to use the information received, but neither
the identity nor the affiliation of the speaker(s), nor that of any
other participant, may be revealed.”
2

© 2014 Finity Consulting Pty Limited
Use of Catastrophe Models
by Actuaries
GIPC Guidance Note

Some introductory comments
4
Context of the note
“It does not represent a professional standard or
Practice Guideline” … (2)
“some tools …to assist…in gaining comfort in” relying on
work of others … (6)
“It is not suggesting that an actuary either asks all these
questions or carries out all the investigations” … (22)
Provides good assistance in how to tackle technical aspects

The catastrophe modelling process
5
Interpretation of
the science
Representative
set of events
Mathematical
representation
of damage and
loss outcomes
Simulated
loss
distribution
View of return
periods, PML
etc X
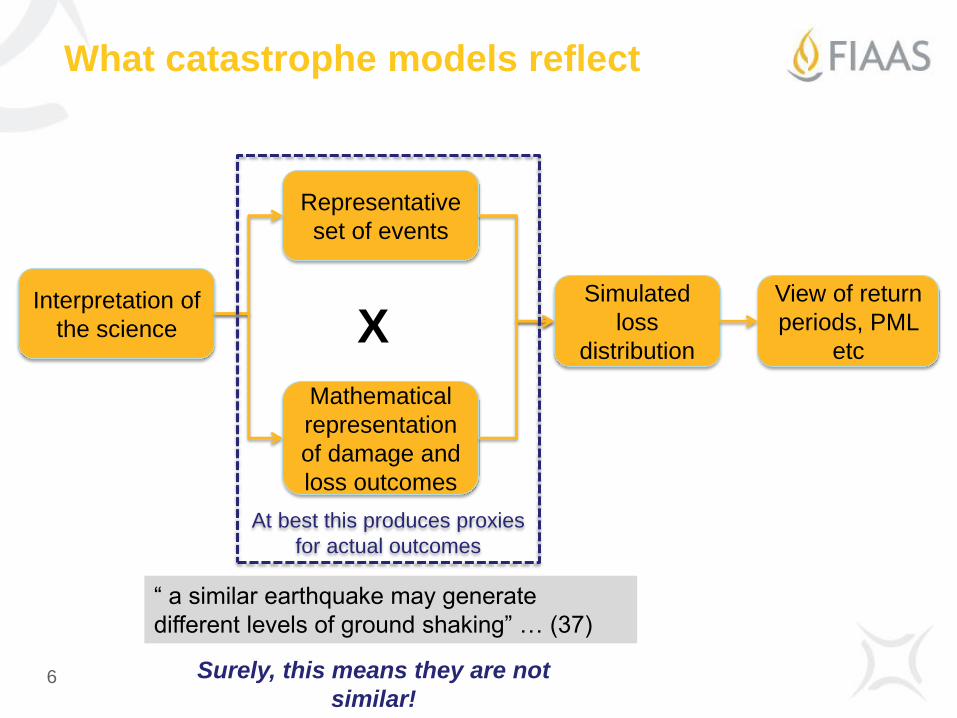
What catastrophe models reflect
Interpretation of
the science
Representative
set of events
Mathematical
representation
of damage and
loss outcomes
Simulated
loss
distribution
View of return
periods, PML
etc X
“ a similar earthquake may generate
different levels of ground shaking” … (37)
Surely, this means they are not
similar!
At best this produces proxies
for actual outcomes
6
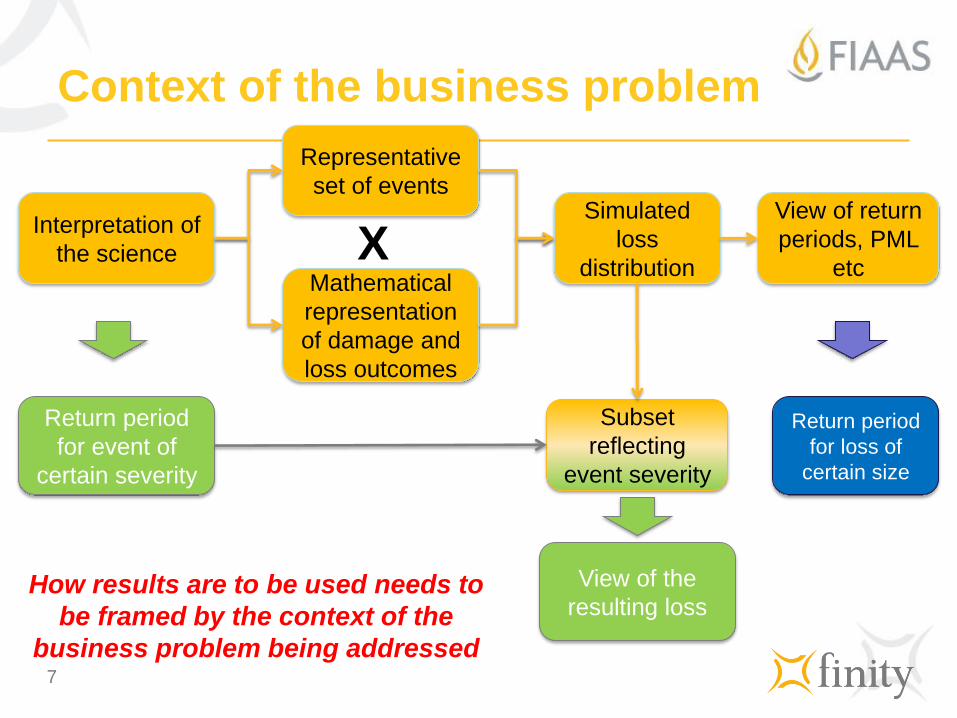
Context of the business problem
Interpretation of
the science
Representative
set of events
Mathematical
representation
of damage and
loss outcomes
Simulated
loss
distribution
View of return
periods, PML
etc X
How results are to be used needs to
be framed by the context of the
business problem being addressed
Return period
for loss of
certain size
Return period
for event of
certain severity
View of the
resulting loss
Subset
reflecting
event severity
7
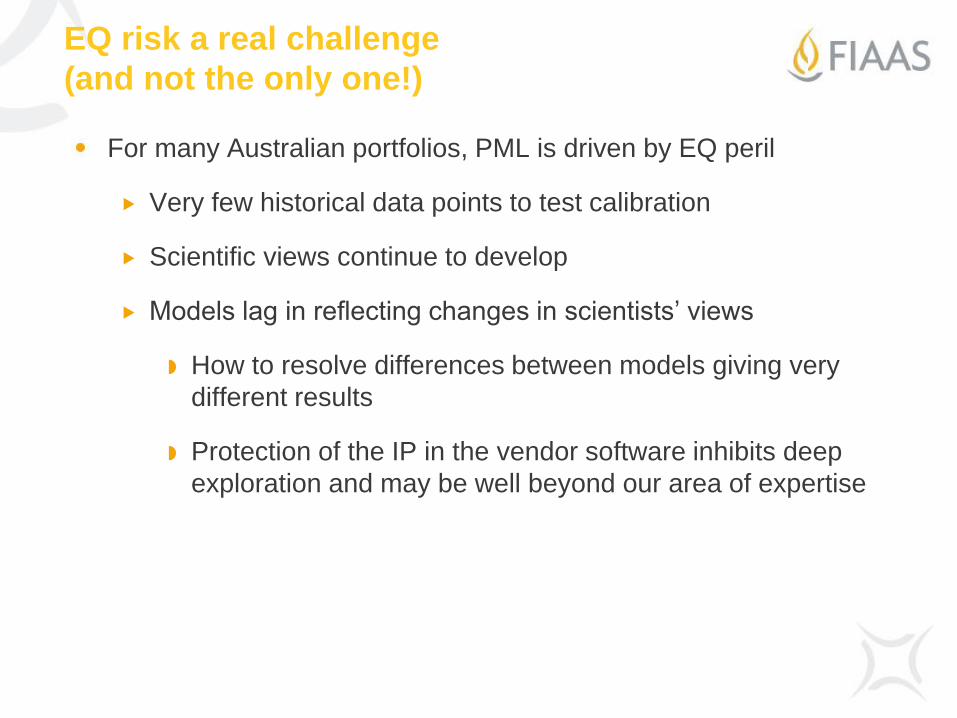
EQ risk a real challenge
(and not the only one!)
For many Australian portfolios, PML is driven by EQ peril
Very few historical data points to test calibration
Scientific views continue to develop
Models lag in reflecting changes in scientists’ views
How to resolve differences between models giving very
different results
Protection of the IP in the vendor software inhibits deep
exploration and may be well beyond our area of expertise
© 2015 Finity Consulting Pty Limited
Royal Commission into Child
Sexual Abuse
National Redress & Implications for Civil
Liability

Outline
Child Sexual Abuse in Australia
National Redress Estimates
Possible Implications for Civil Liability
Reasonable Responses of Insurers
10

Institutional Child Sexual
Abuse in Australia

Sources of Information
Royal Commission Private Sessions
Close to 2,000 interviews with survivors of institutional child
sexual abuse
Claims Project Information
More than 2,700 claims resolved between 1995 and 2014
including civil claims from insurers and government bodies as
well as faith based redress schemes (Catholic & Salvation Army)
12
Sources of Information
State based Redress Schemes
Redress WA
Queensland ex gratia
Tasmanian Abuse in Care ex gratia
13

Where the Abuse Occurred
14
Estimated Child Sexual Abuse by Institution Type
Residential Care
Foster Care
Education
Other Religious Institutions
Recreation / Sport
Health and Allied
Other/unknown

Where the Abuse Occurred
NSW and VIC are most highly represented
15
0%
5%
10%
15%
20%
25%
30%
35%
40%
NSW WA QLD VIC SA TAS ACT NT
Proportion of Abuse by State - Private Session Data
National Redress
Estimates
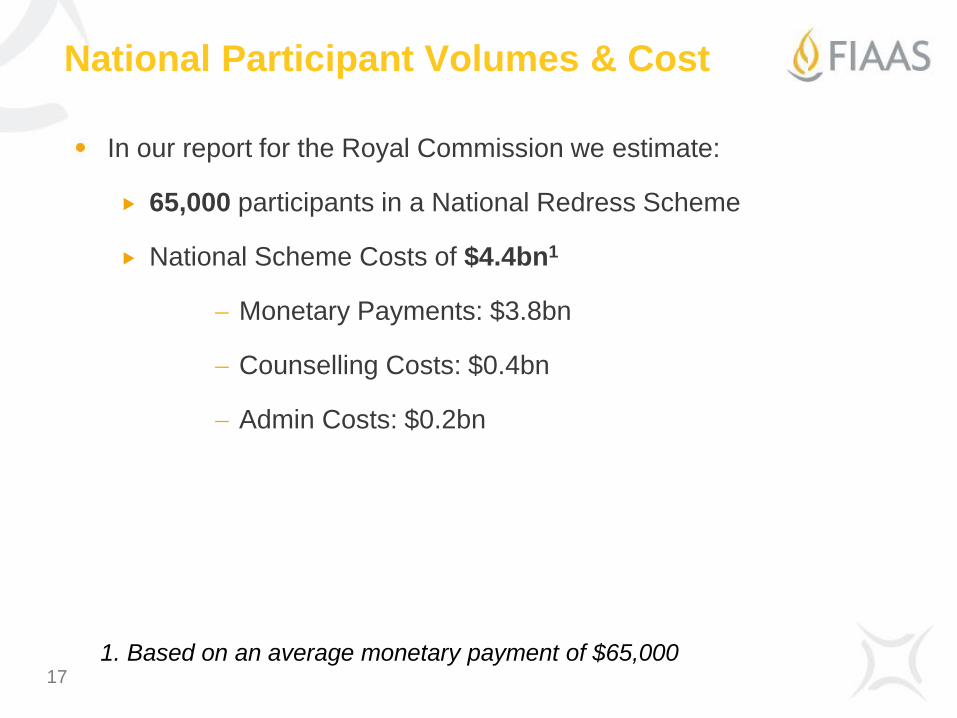
National Participant Volumes & Cost
In our report for the Royal Commission we estimate:
65,000 participants in a National Redress Scheme
National Scheme Costs of $4.4bn1
Monetary Payments: $3.8bn
Counselling Costs: $0.4bn
Admin Costs: $0.2bn
17
1. Based on an average monetary payment of $65,000

Participant Volumes
National estimates based on extrapolation of State based Redress
Schemes
18
Redress WA Extrapolation Example
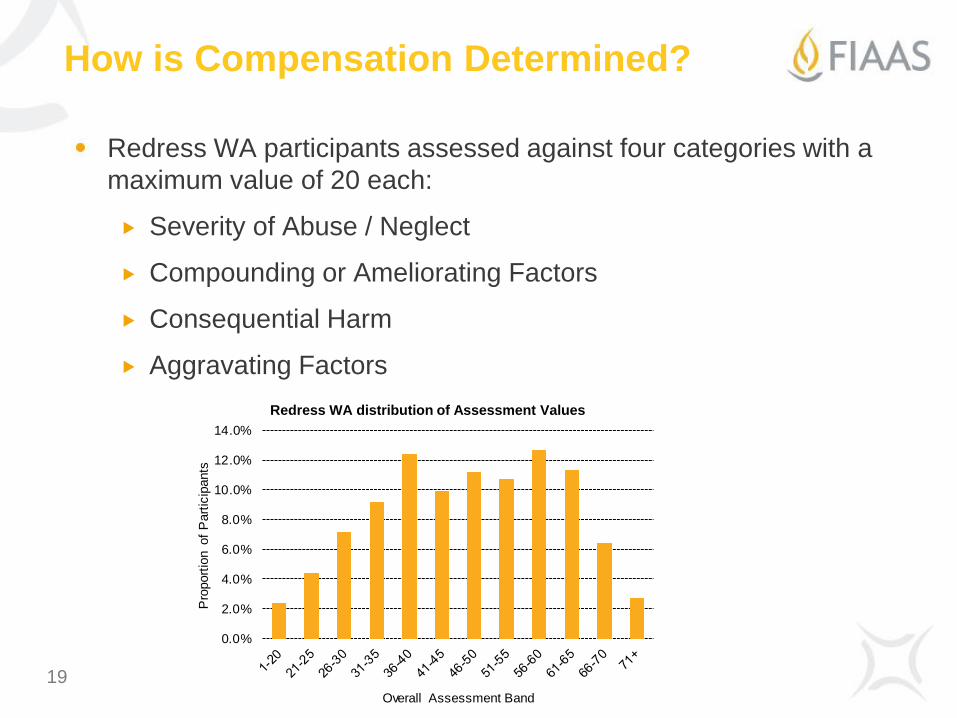
How is Compensation Determined?
Redress WA participants assessed against four categories with a
maximum value of 20 each:
Severity of Abuse / Neglect
Compounding or Ameliorating Factors
Consequential Harm
Aggravating Factors
19
0.0%
2.0%
4.0%
6.0%
8.0%
10.0%
12.0%
14.0%
Pro
port
ion o
f P
art
icip
ants
Overall Assessment Band
Redress WA distribution of Assessment Values
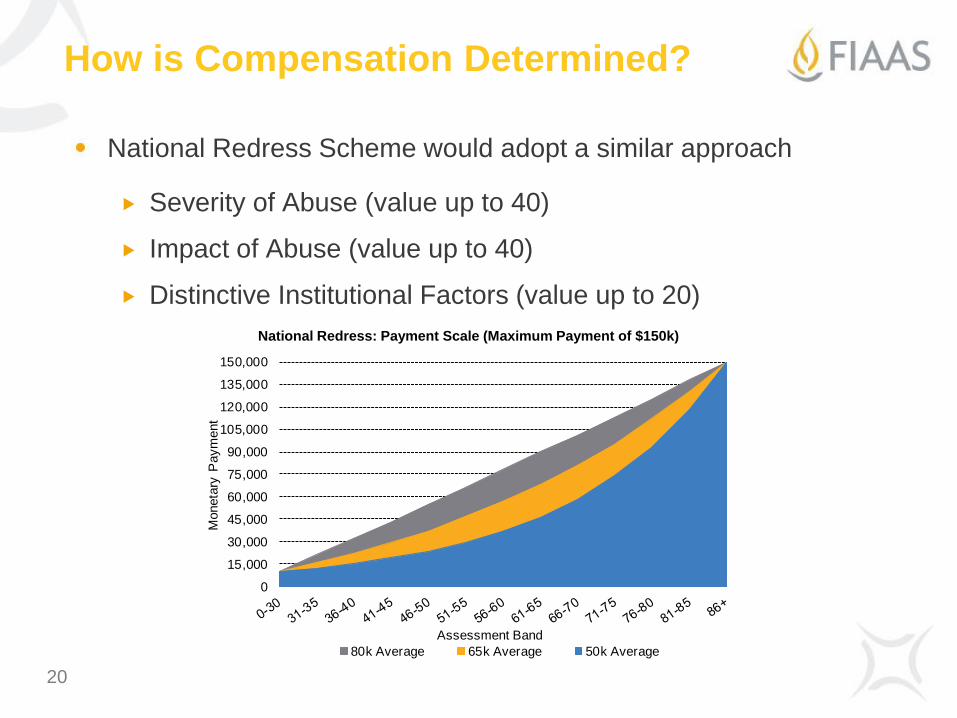
How is Compensation Determined?
National Redress Scheme would adopt a similar approach
Severity of Abuse (value up to 40)
Impact of Abuse (value up to 40)
Distinctive Institutional Factors (value up to 20)
20
National Redress: Payment Scale (Maximum Payment of $150k)
0
15,000
30,000
45,000
60,000
75,000
90,000
105,000
120,000
135,000
150,000
Moneta
ry P
aym
ent
Assessment Band
80k Average 65k Average 50k Average

Possible Implications for
Civil Liability
Recommendations of Consultation Paper
• There are three aspects of Civil Litigation that the Royal
Commission suggest changing in their consultation paper
Duty of Care
Statute of Limitations
Legal Personality (someone to sue)
22
“In Australia there are very few examples of
litigation in which a claim of negligence in
relation to child sexual abuse proceeded to
trial and judgement in court. The majority
of cases either settle or fail” Consultation
Paper p208

Duty of Care
• Institutions have a non-delegable duty of care to children in their
custody
• BUT this does not extend to the deliberate criminal acts of
employees or volunteers
• Vicarious liability does not apply as courts have determined abuse is
not in the normal ‘course of employment’
• Options Proposed in Consultation Paper:
• Imposing an absolute liability on institutions for acts committed by
employees, contractors or volunteers
• Imposing liability on the institutions, with the onus of proof reversed
such that the institution would have to prove that it took reasonable
precautions to prevent the abuse
• Either of these may result in major changes in civil litigation
23

Statute of Limitations / Legal Personality
24
• Limitation periods vary across states but most common is 3 years,
commencing from age 18 for minors
• The Consultation paper discusses a range of options from including
extending limitation periods to removing them altogether
• Victoria has already released a draft bill that would remove the
limitation period for criminal child abuse
• An entity can only be sued if it has a distinct ‘legal personality’ (issue
made famous in Ellis / Pell case)
• There are a number of options presented but the Royal Commission
is clear in its recommendation that this issue should be addressed

Reasonable Responses
of Insurers

Considerations for Insurers
Unlikely to be any legal liability for Redress: Insurance Contracts are
not likely to be triggered
BUT, the existence of a national redress scheme is likely to have a
strong impact on the behaviours of survivors and their legal
representatives
These behavioural changes will depend heavily on the structure and
design of the redress scheme i.e. level of payments offered, whether
or not a deed of release is required of redress participants etc.
If Statute of Limitations and Duty of Care rules are changed there
could be a large impacts for civil litigation and hence insurers

Where to from here?
There are a large number of uncertainties and contingencies that will
make it difficult for actuaries respond in their liability valuations as
yet.
However, the appointed actuary must make adequate inquiries
about the potential exposures and should not just rely on what has
been identified to date
Further, where an insurer identifies potential exposures, these risks
should be adequately addressed in the insurer’s Financial
Condition Report
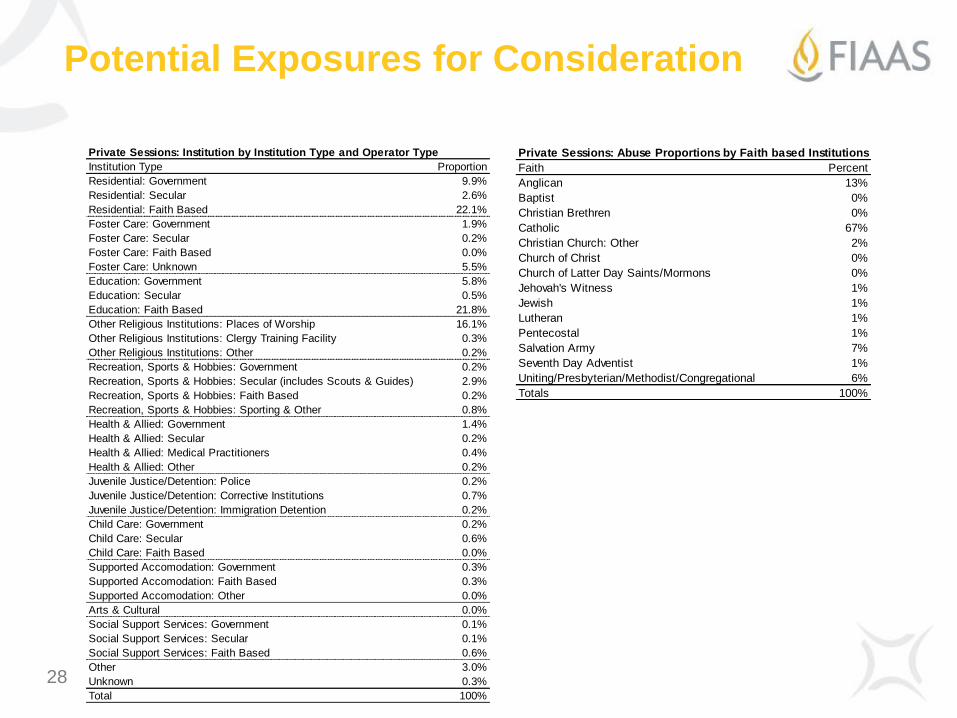
Potential Exposures for Consideration
28
Private Sessions: Institution by Institution Type and Operator Type
Institution Type Proportion
Residential: Government 9.9%
Residential: Secular 2.6%
Residential: Faith Based 22.1%
Foster Care: Government 1.9%
Foster Care: Secular 0.2%
Foster Care: Faith Based 0.0%
Foster Care: Unknown 5.5%
Education: Government 5.8%
Education: Secular 0.5%
Education: Faith Based 21.8%
Other Religious Institutions: Places of Worship 16.1%
Other Religious Institutions: Clergy Training Facility 0.3%
Other Religious Institutions: Other 0.2%
Recreation, Sports & Hobbies: Government 0.2%
Recreation, Sports & Hobbies: Secular (includes Scouts & Guides) 2.9%
Recreation, Sports & Hobbies: Faith Based 0.2%
Recreation, Sports & Hobbies: Sporting & Other 0.8%
Health & Allied: Government 1.4%
Health & Allied: Secular 0.2%
Health & Allied: Medical Practitioners 0.4%
Health & Allied: Other 0.2%
Juvenile Justice/Detention: Police 0.2%
Juvenile Justice/Detention: Corrective Institutions 0.7%
Juvenile Justice/Detention: Immigration Detention 0.2%
Child Care: Government 0.2%
Child Care: Secular 0.6%
Child Care: Faith Based 0.0%
Supported Accomodation: Government 0.3%
Supported Accomodation: Faith Based 0.3%
Supported Accomodation: Other 0.0%
Arts & Cultural 0.0%
Social Support Services: Government 0.1%
Social Support Services: Secular 0.1%
Social Support Services: Faith Based 0.6%
Other 3.0%
Unknown 0.3%
Total 100%
Private Sessions: Abuse Proportions by Faith based Institutions
Faith Percent
Anglican 13%
Baptist 0%
Christian Brethren 0%
Catholic 67%
Christian Church: Other 2%
Church of Christ 0%
Church of Latter Day Saints/Mormons 0%
Jehovah's Witness 1%
Jewish 1%
Lutheran 1%
Pentecostal 1%
Salvation Army 7%
Seventh Day Adventist 1%
Uniting/Presbyterian/Methodist/Congregational 6%
Totals 100%
© 2014 Finity Consulting Pty Limited
2013 Industry Risk Margins
29

Stand-alone Margins (OSC, Direct)
30
CTP has an
unusually
narrow range of
results
Source: Figure 1 – APRA 2013 Industry Review
Report
Other L-Tail
classes are
broadly similar Long-Tail
Commercial
Lines
Personal
Lines S-Tail P-lines
property has
lowest result

Stand-alone Margins (PL, Direct)
31
Long-
Tail
Commercial
Lines
Personal
Lines
Source: Figure 2 – APRA 2013 Industry Review
Report
Long-tail margins
are closer to
Commercial
classes
Employers
Liability is
lower than
OSC
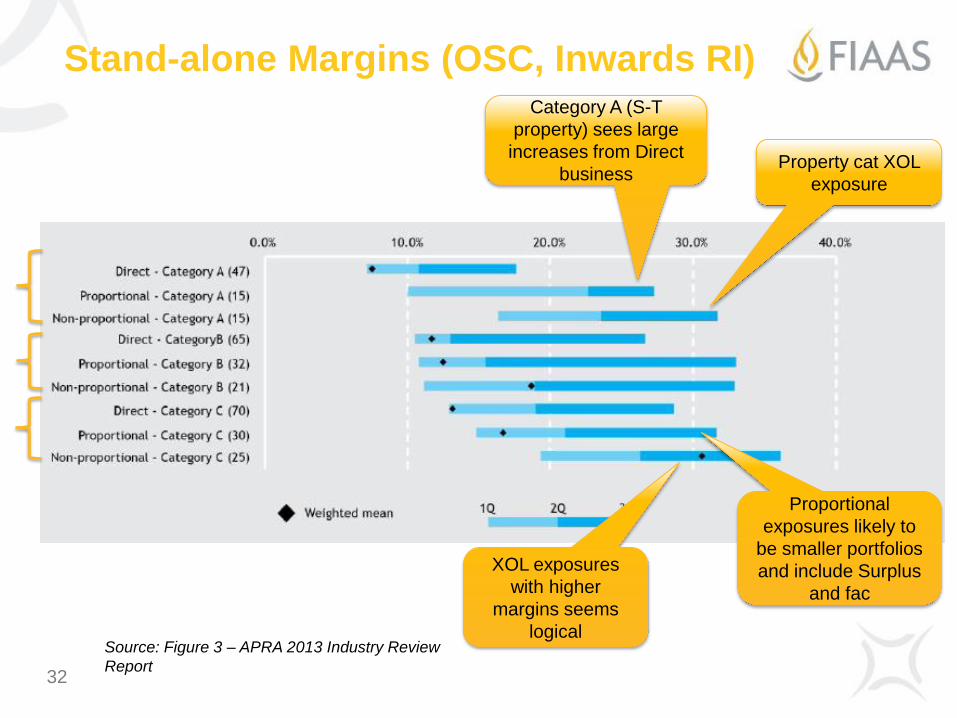
Stand-alone Margins (OSC, Inwards RI)
32
Source: Figure 3 – APRA 2013 Industry Review
Report
Category A (S-T
property) sees large
increases from Direct
business Property cat XOL
exposure
XOL exposures
with higher
margins seems
logical
Proportional
exposures likely to
be smaller portfolios
and include Surplus
and fac
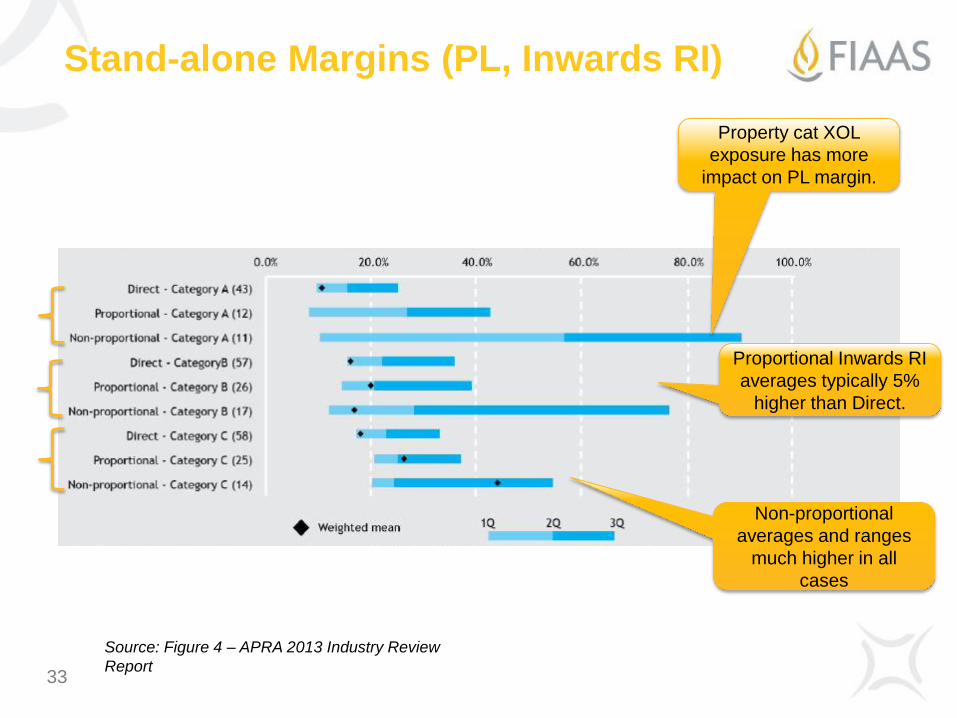
Stand-alone Margins (PL, Inwards RI)
33
Property cat XOL
exposure has more
impact on PL margin.
Source: Figure 4 – APRA 2013 Industry Review
Report
Proportional Inwards RI
averages typically 5%
higher than Direct.
Non-proportional
averages and ranges
much higher in all
cases

Approach – Stand-alone Risk Margins
Many insurers using the Institute Risk Margin Framework
More reliance on Industry Papers for PL Risk Margins (PL/OSC
scaling factors)
34
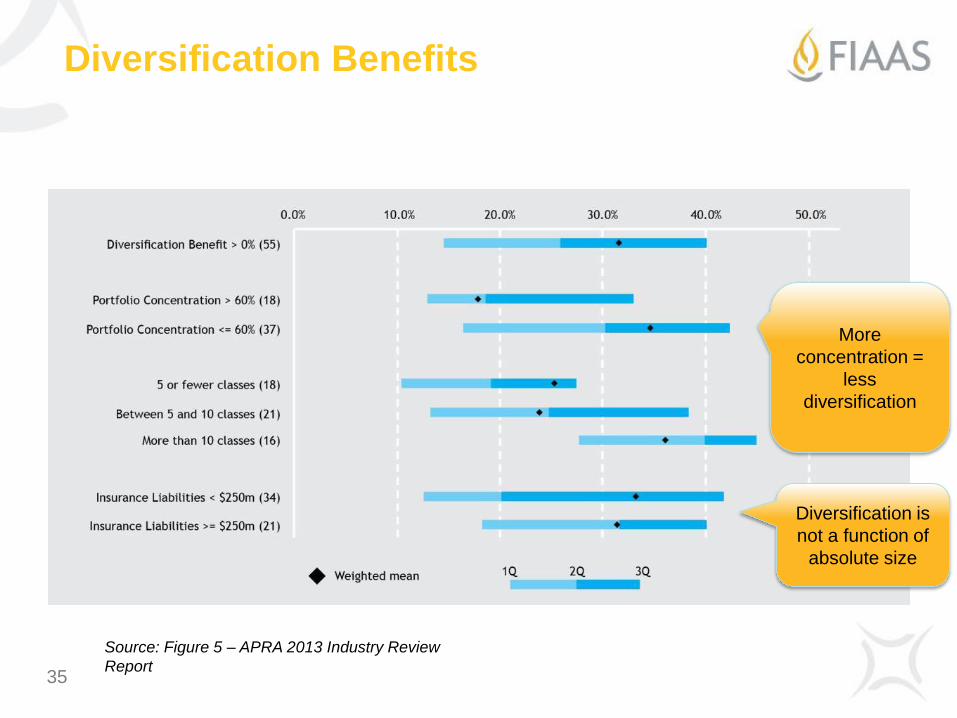
Diversification Benefits
35
Source: Figure 5 – APRA 2013 Industry Review
Report
More
concentration =
less
diversification
Diversification is
not a function of
absolute size

Changes in Industry Risk
Margins since 2007
36

Diversified Risk Margins – Direct
Risk margins have generally decreased by 1-2% (LMI is the main
exception, with sizeable increases)
OSC PL
APRA Class 2013 2007 Change 2013 2007 Change
Household 4.3% 5.6% -1.3% 7.8% 8.8% -1.0%
Domestic Motor 4.7% 5.6% -0.9% 6.5% 7.0% -0.5%
Commercial Motor 5.2% 7.1% -1.9% 7.8% 9.1% -1.3%
Travel 7.0% 7.7% -0.7% 10.1% 6.8% 3.3%
Fire and ISR 7.2% 8.5% -1.3% 11.0% 13.0% -2.0%
Marine 7.7% 9.5% -1.8% 10.2% 12.3% -2.1%
Aviation 8.9% 6.7% 2.2%
Consumer Credit 6.7% 8.2% -1.5% 13.8% 14.5% -0.7%
Other Accident 6.5% 8.2% -1.7% 10.8% 12.3% -1.5%
Mortgage 15.7% 9.4% 6.3% 26.5% 18.4% 8.1%
CTP 8.2% 9.3% -1.1% 11.0% 12.3% -1.3%
Public and Product Liability 9.6% 11.2% -1.6% 11.7% 12.6% -0.9%
Professional Indemnity 12.4% 13.8% -1.4% 15.3% 17.0% -1.7%
Employers' Liability 10.0% 12.5% -2.5% 9.8% 11.7% -1.9%
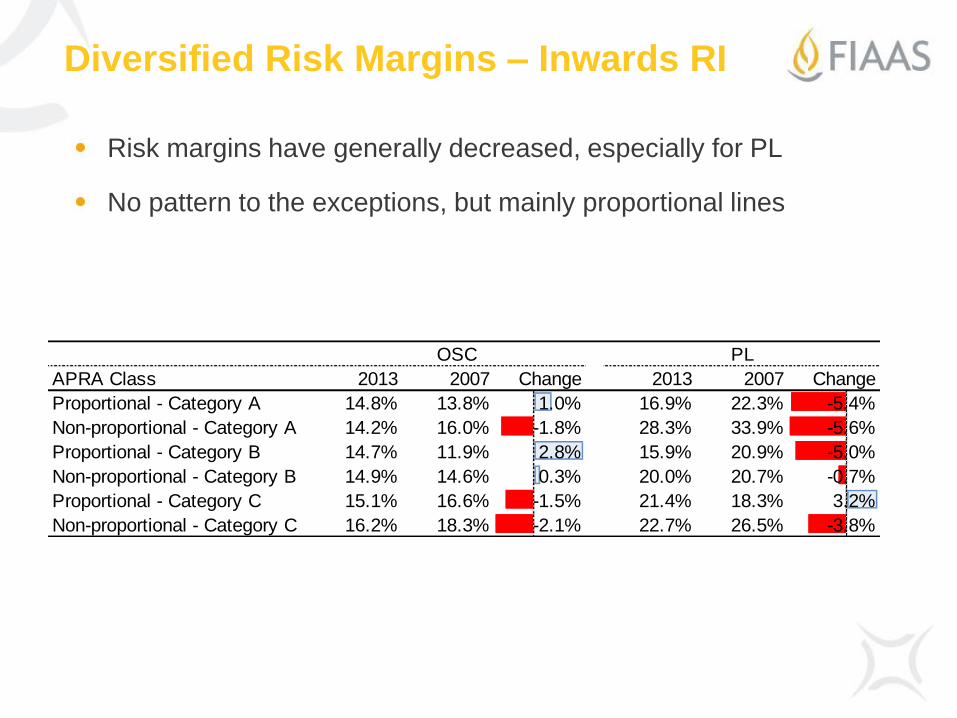
Diversified Risk Margins – Inwards RI
Risk margins have generally decreased, especially for PL
No pattern to the exceptions, but mainly proportional lines
OSC PL
APRA Class 2013 2007 Change 2013 2007 Change
Proportional - Category A 14.8% 13.8% 1.0% 16.9% 22.3% -5.4%
Non-proportional - Category A 14.2% 16.0% -1.8% 28.3% 33.9% -5.6%
Proportional - Category B 14.7% 11.9% 2.8% 15.9% 20.9% -5.0%
Non-proportional - Category B 14.9% 14.6% 0.3% 20.0% 20.7% -0.7%
Proportional - Category C 15.1% 16.6% -1.5% 21.4% 18.3% 3.2%
Non-proportional - Category C 16.2% 18.3% -2.1% 22.7% 26.5% -3.8%

© 2014 Finity Consulting Pty Limited
Benchmarking tool
Finity has created a small spreadsheet to
quickly benchmark your portfolio against the
2013 industry risk margins.
39

FIAAS 2015
40

FIAAS 2015 Agenda
Suggested dates for 2015 forums –
26 May
25 August
24 November