fibi first international bank of israel o verview 30.06.14
TRANSCRIPT

FIBI
FIRST INTERNATIONAL BANK OF ISRAEL
Overview 30.06.14

FIBI
FIRST INTERNATIONAL BANK OF ISRAEL
2
Net Profit and ROE (NIS Millions)
* Assuming equity capital (tier 1) to risk components ratio (9.35%) in the Israeli banking industry average (Other 4 leading Banks) as of 30.06.14, the ROE is 8.9% in H1.2014 and in Q2.2014 10.3%.** The Net profit includes annual amortization of 52 NIS Millions, reflecting an 0.8% reduction on the ROE.
Average capital
equity capital (tier 1) to risk components ratio
6,866
10.00%
6,651 3.9%+
ROE
141 NIS Millions
8.8%
9.7%*9.2%
6,6076,840
7%
2.8%+

FIBI
FIRST INTERNATIONAL BANK OF ISRAEL
3
Statements of income H1/2014 – H1/2013 ((NIS Millions
H1/2014H1/2013Gross change
Change in %
Interest income, net1,0841,095(11)(1%)Expenses from credit losses (0.01% provision rate) 344(41)(93%)Net interest income after expenses from credit losses1,0811,051303%Total non-interest income814844(30)(4%)Of which: non-interest financing 89138(49)(36%)Commissions (Without the effect of initial implementation of FAS 91) FAS 91 effect
731(49)
690-
41(49)
6%-
Other Income (Including realization of FIBI London 31 NIS Million against previous year profit from sale of buildings)
431627169%
Total income (after expenses from credit losses)1,8951,895--Total operating and other expenses1,4261,4206-Of which: Salaries and related expenses854862(8)(1%)Maintenance and depreciation of premises and equipment2192181-Amortizations and impairment of intangible assets8487(3)(3%)Other expenses269253166%Profit before taxes469475(6)(1%)Provision for taxes on profit195202(7)(3%)The bank’s share in profit of equity-basis investees, after taxes1622(6)(27%)Net profit280285(5)(2%)ROE8.3%8.8% Equity capital (tier 1) to risk components ratio (end of period)
10.00%(*)
Bank of Israel average interest rate 0.83%1.65%(0.82%)
(*)Equity capital (tier 1) ratio is 10.11% on 31.12.13 .
FIBI
FIRST INTERNATIONAL BANK OF ISRAEL
4
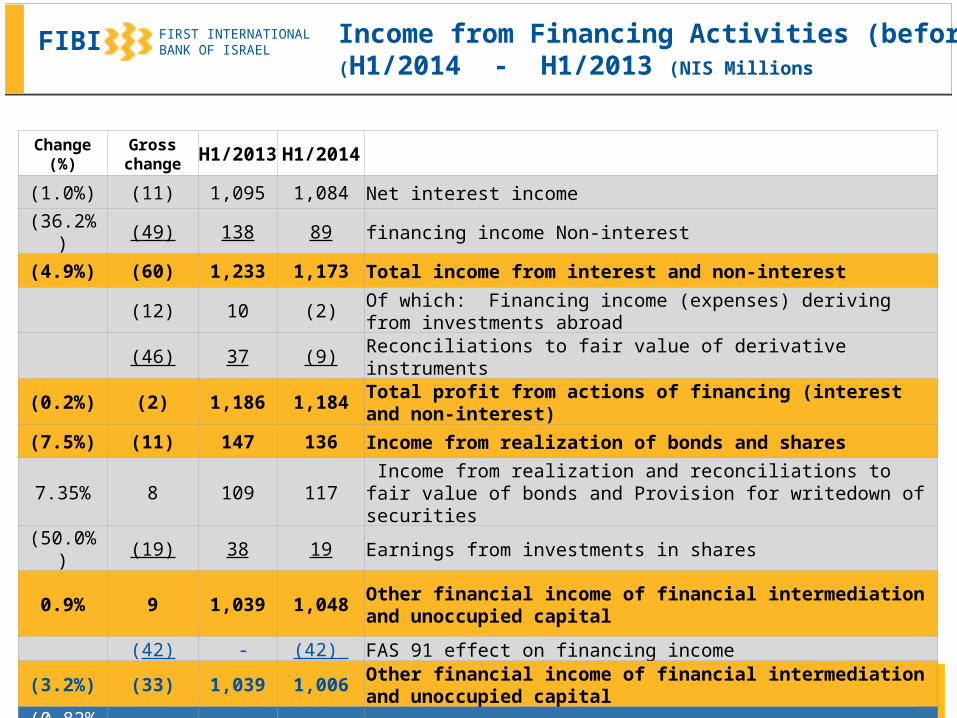
Income from Financing Activities (before Tax) (H1/2014 - H1/2013 (NIS Millions
H1/2014H1/2013Gross change
Change (%)
Net interest income1,0841,095(11)(1.0%)
financing income Non-interest89138(49)(36.2%)
Total income from interest and non-interest1,1731,233(60)(4.9%)
Of which: Financing income (expenses) deriving from investments abroad
(2)10(12)
Reconciliations to fair value of derivative instruments(9)37(46)
Total profit from actions of financing (interest and non-interest)1,1841,186(2)(0.2%)
Income from realization of bonds and shares136147(11)(7.5%)
Income from realization and reconciliations to fair value of bonds and Provision for writedown of securities
11710987.35%
Earnings from investments in shares1938(19)(50.0%)
Other financial income of financial intermediation and unoccupied capital
1,0481,03990.9%
FAS 91 effect on financing income(42) -(42)Other financial income of financial intermediation and unoccupied capital
1,0061,039(33)(3.2%)
Bank of Israel average interest rate 0.83%1.65%(0.82%)

FIBI
FIRST INTERNATIONAL BANK OF ISRAEL
5
Statements of income Q2/2014 – Q2/2013 (NIS Millions)
Q2/2014Q2/2013Gross change
Change in %
Interest income, net547551(4)(1%)Expenses from credit losses (0.01% provision rate) ((712(19)
Net interest income after expenses from credit losses554539153%
Total non-interest income417417--Of which: non-interest financing Of which: Reconciliations to fair value of derivative instruments
48((7
6211
(14)(18)
(23%)
Commissions (Without the effect of initial implementation of FAS 91) FAS 91 effect
360(25)
350-
10(25)
2.9%-
Other Income (Including realization of FIBI London 31 NIS Million against previous year profit from sale of buildings)
34529
Total income (after expenses from credit losses)971956152%Total operating and other expenses705716(11)(2%)Profit before taxes2662402611%Provision for taxes on profit109971212%
The bank’s share in profit of equity-basis investees, after taxes811(3)(27%)
Net profit160149117%ROE9.7%9.3%
Bank of Israel average interest rate 0.75%1.55%(0.80%)

FIBI
FIRST INTERNATIONAL BANK OF ISRAEL
6
Operating & Other Expenses(NIS Millions)
1-6/2014
1-6/2013
16
*
*Including amortization of 26 NIS Millions in H1/14.
VAT increase resulted in an increase in expenses of about 11 NIS million VAT increase resulted in an increase in expenses of about 11 NIS million
8-
6
0.4%
Without the increase in commissions paid in
relation to capital market operations Expenses rate
increases only by 0.1%
1
3

FIBI
FIRST INTERNATIONAL BANK OF ISRAEL
73.1%
72.6%72.6%
74.0%
74.9%74.9% 75.1%75.1%
75.3%75.3%
73.2%73.2%
74.9%74.9%
Consolidated Operational Efficiency Ratio Total Operating Expenses to Total Income
Total Income
Total Operating Expenses
%%Total Operating Expenses / Total Income (Before Expenses for credit losses)
Total Operating Expenses / Total Income (After Expenses for credit losses) %%
7

FIBI
FIRST INTERNATIONAL BANK OF ISRAEL
30.06.1430.06.14 31.12.1331.12.13
Capital Notes 5.6
Capital Available for Investment 5.1
Public Deposits
90.7
Gov. & Bank Bonds2.0
Credit to the Public67.8
State of Israel Bonds 8.0
Bank of Israel Deposits 23.3
Corporate Bonds (foreign & Israel currency) 0.9
Structures, Hedge funds &Stocks 0.6
Market risk in VAR(0.03)
(*) illustration – not to scale8
FIBI Strategic Assets & Liabilities compositeFIBI Strategic Assets & Liabilities composite(*) (*) 3300..0606.1.144 (NIS Billion(NIS Billions)s)
FIBI Strategic Assets & Liabilities Structure )NIS Billions(
capital to risk assets Total ratio
equity capital (tier 1) to risk components ratio
Deposits to Deposits to Credit RatioCredit Ratio
Liquid Assets Liquid Assets to Deposits to Deposits
RatioRatio
14.78% 14.78%
10.00% 10.11%
133.7% 129.7%
39.2% 38.4%
capital available for Investments to investment capital Ratio
30.9% 28.2%

FIBI
FIRST INTERNATIONAL BANK OF ISRAEL
9
Statement Of Changes in Equity H1/2014((NIS Millions
Balance At 31/12/13 Total Shareholders Equity(non-controling interests (Including
7,120
Net Earnings280
Dividend(230(
Net profit Attributed to non-controlling interests10
Balance At 30/6/14 Total Shareholders Equity(non-controling interests (Including
7,180
Equity capital (tier 1) ratio (Basel III, 30/6/14) is 10.00%, compared to -10.11% (31.12.13) following dividend distribution.
The Highest dividend yield in the Israeli banking system Dividend yield of 3.5% in 2013, and 4% in 2014.

FIBI
FIRST INTERNATIONAL BANK OF ISRAEL
10
Credit to the Public by segments (NIS Millions)
30.6.1430.6.13
Gross Change
Compared to
30.6.13
Average balances
growth rates compared to the average
H1/2013
Private + Retail (Households)
16,38015,6324.8%5.0%
Mortgage 17,80916,8265.8%6.4%
Total private clients34,18932,4585.3%5.7%
Corporate 20,88121,973((5.0%(1.8%)
Commercial + Small Business
12,76513,030(2.0%)(3.1%)
Total Credit to the Public
67,83567,4610.6%1.5%
– ()30.6.13
)23%(
)19%(
)33%()25%(
FIBI
FIRST INTERNATIONAL BANK OF ISRAEL
11
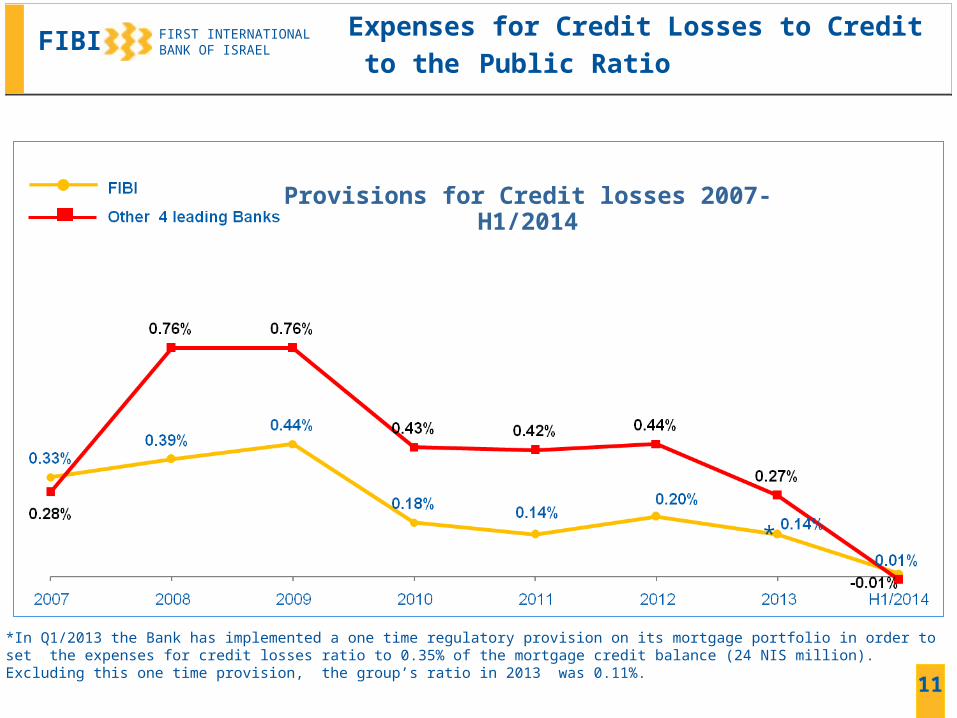
Provisions for Credit losses 2007-H1/2014
*In Q1/2013 the Bank has implemented a one time regulatory provision on its mortgage portfolio in order to set the expenses for credit losses ratio to 0.35% of the mortgage credit balance (24 NIS million). Excluding this one time provision, the group’s ratio in 2013 was 0.11%.
Expenses for Credit Losses to Credit to the Public Ratio
*

FIBI
FIRST INTERNATIONAL BANK OF ISRAEL
12
Deposits from the Public breakdown by segments ((NIS Millions
30.6.1430.6.13
Gross Change
Compared to
30.6.13
Average balances
growth rates compared to the average
H1/2013
Total private clients
47,91249,291(2.8%)(2.4%)
Corporate30,80022,03739.8%37.5%
Commercial + Small Business
11,97411,2056.9%4.6%
Total 90,68682,5339.9%9.0%
– ()30.6.13
)13%(
)60%()27%(

FIBI
FIRST INTERNATIONAL BANK OF ISRAEL
13
14%
9%
15%
325
286 39
31
8
Continued growth in client assets portfolio (deposits and securities) - average balances (NIS Billions)

FIBI
FIRST INTERNATIONAL BANK OF ISRAEL
13.42%
*
14.30%14.57%
13.42%
*
*
*
**
* **-1.3* **-1.3-0.65 -0.47 0.66-
Minimal Regulatory Requirement For
HAPOALIM & LEUMI
Minimal
Regulatory
requirement
Ga
p
Equity capital (tier 1) ratio
14
%%%

FIBI
FIRST INTERNATIONAL BANK OF ISRAEL
.*In annual terms **Calculated only on the balance sheet credit.
***Including dividend paid on the last 12 months.
10.00%
9.53%
9.34%
9.20%
9.00%
equity capital (tier 1) to risk components ratio
133.7%
106.7%
114.5%
126.2%
103.3%
Deposits from the public to credit to
the public
73.1%
62.2%
79.7%
86.9%
59.0%
Total operating expenses /
Revenue (before credit losses
expenses)
90.6%
53.2%
67.4%
62.9%
66.7%
NPL-Provision for credit losses to total impaired credit (without
mortgages)
Other 4 leading Banks Average 9.35% 111.5% 72.0% 60.4%
15
FIBI is demonstrating relative strength in main financial ratios Q2/2014
***4.0%
1.56%
-
-
0.87%
Dividend yield (according to
14.8.14)*
-
(0.04%)
(0.00%)
(0.03%)
(0.12%)
0.06%
Expenses for credit losses to
credit to the public*
((0.02%
1
2
3
4
5
1
2
3
4
5 1
2
3
4
5
1
1
2
3
4
5
5
2
4
3

FIBI
FIRST INTERNATIONAL BANK OF ISRAEL
16
Subsidiaries net profit
Specialization
Net profit 1-
6/2014
Nis Millions
ROE
equity capital (tier 1) to risk components ratio
Growth centers
Retail customers
Commercial/ Corporate
Defense forces personnel
Factoring
39.37.2%9.83%
• Extension of the agreement with Hever
• Renewal of activities with Small Business Fund
Capital Markets, Trust & Custody services
Private & affluent banking
22.810.9%16.30%
• Expansion activities with private and institutional clients
• Developing wealthy clients branches
Retail customers
Teachers sector
Israeli-Arab sector
20.99.1%14.86%
• Winning in the teachers loans tender
• Growth at the Israeli-Arab sector
Ultra orthodox sector17.710.0%12.70%
• Increasing network coverage in the ultra orthodox sector including new branches opening

FIBI
FIRST INTERNATIONAL BANK OF ISRAEL
17
Highlights for the first half of 2014
Q2/2014
H1/2014
Net profitNet profit
Net profit of 280 NIS million and ROE of 8.3% (Assuming adjustment of equity capital (tier 1) to risk components ratio to the Israeli banking industry average, the ROE is 8.7%)
Net profit of 160 NIS million and ROE of 9.7% (Assuming adjustment of equity capital (tier 1) to risk components ratio to the the Israeli banking industry average, the ROE is 10.1%)
Income from interest & inflation
Substantial Substantial Macro & Macro &
AccountingAccountingeffectseffects
The Interest income was influenced by a decline in the bank of Israel interest rate in the period (0.82%) and an effect of the negative CPI on the CPI-linked positions
Expense for Fair Value of derivatives for the H1/2014 compared with H1/2013 (timing differences) resulted a decrease in financial income of approximately 46 NIS Million.
FAS 91 FAS 91 led to a decrease in profit of about 5 NIS million, due to an increase in
financial income by approximately 42 NIS Million corresponding with a reduction of approximately 49 NIS million in income from commissions.
Fair Value of derivatives

FIBI
FIRST INTERNATIONAL BANK OF ISRAEL
18
Highlights for the first half of 2014
Continued growth in customer’s
capital markets activity
Continued growth in client assets portfolio (deposits and securities) of 39 NIS Billion (14%)
Growth in operating income
An increase of 5.9% in income from commission (adjusted to FAS 91), mainly due to an increase in clients activity in capital markets
Implementation of customer centric
approach by consolidating all dealing rooms
Aimed at providing response and an overall view of all clients needs in the field of investment and passive
Continued Continued growth in growth in activityactivity
Subsidiaries Continued development of corporate clients through the Small Business Fund Focus in growth segments (Ultra-Orthodox, teachers, security forces, Arab sector)
Operating expenses growth rate of only 0.4% in comparison to H1/13 Mainly resulted by an increase in VAT and in expenses related to capital markets
Moderate Moderate increase in increase in operating operating expensesexpenses consistent
budgetary restraint
Moderate increase in operating expenses
Continued expenses restraint trend – no growth as of H1/2011 (3 years) Divestment of FIBI London in Order to focus on core banking activities in Israel
which increased net profits by 26 NIS Millions Organizational changes in the management of the Bank and its subsidiaries
(reducing the number of divisions and management members) Merging of branches and reducing the branches size Merging of the portfolio management company of FIBI and UBANK
FIBI
FIRST INTERNATIONAL BANK OF ISRAEL
19
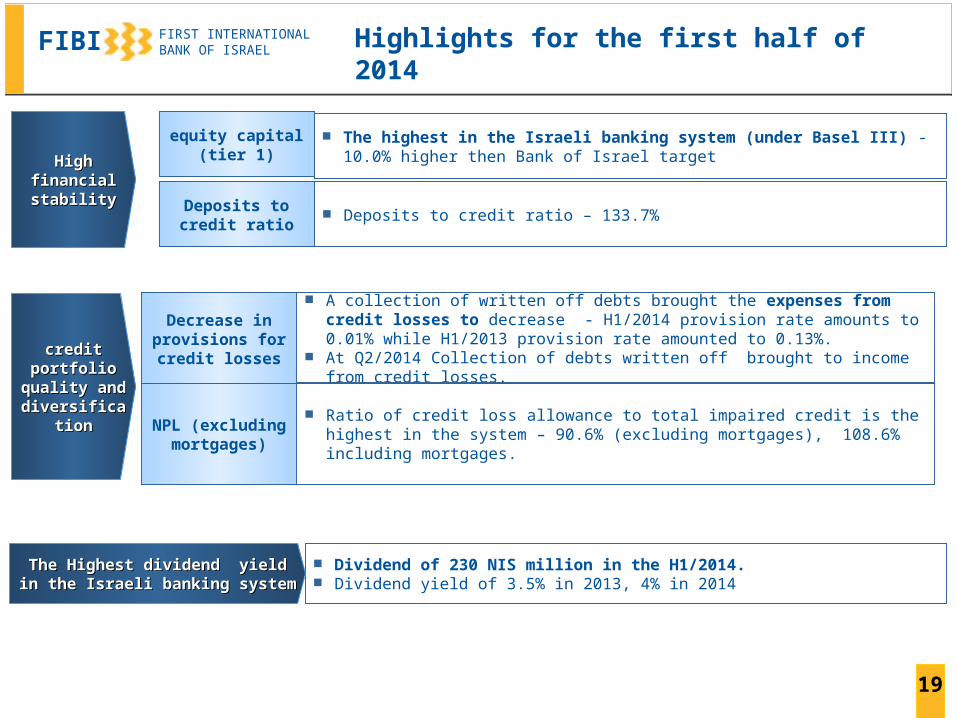
Highlights for the first half of 2014
Dividend of 230 NIS million in the H1/2014. Dividend yield of 3.5% in 2013, 4% in 2014
The Highest dividend yield in the The Highest dividend yield in the Israeli banking system Israeli banking system
credit portfolio credit portfolio quality and quality and
diversificationdiversification
A collection of written off debts brought the expenses from credit losses to decrease - H1/2014 provision rate amounts to 0.01% while H1/2013 provision rate amounted to 0.13%.
At Q2/2014 Collection of debts written off brought to income from credit losses.
Ratio of credit loss allowance to total impaired credit is the highest in the system – 90.6% (excluding mortgages), 108.6% including mortgages.
Decrease in provisions for credit losses
NPL (excluding mortgages)
High financial High financial stabilitystability
equity capital )tier 1(
The highest in the Israeli banking system (under Basel III) - 10.0% higher then Bank of Israel target
Deposits to credit ratio
Deposits to credit ratio – 133.7%