fibre substitution in the united kingdom...
TRANSCRIPT

FIBRE SUBSTITUTION IN THE
UNITED KINGDOM
WORSTED SPINNING SECTOR
by
John Zeitsch*
and
Denis Lawrence
Contributed Paper Presented to 36th Annual Conferencrl of the Australian Agricultural Economics Society. Canberra, 10-12 February, 1992.
• Director, Swan Consultants (Canberra) Pty Ltd, 3 H&II Street, Lyneham, ACT, 2602. The participation of Swan Consultants (Canberra) in this project has been made possible by a grant from the Wool Research and Development Fund.
CONTENTS
EXECUTIVE SUMMARY
1
2
3
4
5
6
INTRODUCTION
FIBRES AND FABRIC PRODUCTION
PREVIOUS STUDIES
THE GENERALISED McFADDEN COST FUNCTION MODEL
RESULTS
IMPERFECT ADJUSTMENT
iii
1
3
10
11
15
18
6.1 The Planning Price Approach 19
6.2 Results 21
7 FORECASTING WOOL'S WORSTED MARKET SHARE 29
APPENDIX 1: DATA SOURCES 35
REFERENCES ~
TABLES 5.1 Estimated Unit Fibre Demand Equations 15
5.2 Mean Elasticities of Fibre Substitution for the UK Worsted Spinning Sector -1971 to 1990 16
5.3 Mean Fibre Input Demand Elasticities for the UK Worsted Spinning Sector -1971 to 1990 17
6.1 Estimated Actual and Planning Price Model Equations 22
6.2 Mean Short-run and Long-run Fibre Input Demand Elasticities for the UK Worsted Spinning Sector-1971 to 1990 28
7.1 Gross Price Elasticities of Fibre Demand 31
7.2 Fibre Prices Paid by United Kingdom Spinners (pounds sterling/kg) - 1991 32
-----------------------------------------------------------FIGURES 1 Fibre Consumed in the UK Worsted Spinning Sector iii
2 United Kingdom Fibre Price Indicesili
3 Forecast Change in Long-run Fibre Market Share iv
2.1 Production and Use of Fabrics 3
2.2 Fibre Consumed in the UK Worsted Spinning Sector 7
2.3 United Kingdom Fibre Price Indices 7
2.4 UK Wool and Synthetic Fibre Prices (pounds sterling/kg) 8
2.5 UK Worsted Spinning Sector- Fibre Volume Shares for 1971 and 1990 9
6.1 Adjustment of planning prices 25
6.2 Adjusunent of quantities 26
7.1 Assumed Production Structure for Worsted Products 30
7.2 Shott-run Percentage Change in Fibre Market Volume Share from Recent Changes in Fi~re Prices 33
7.3 Forecast Change in Long-run Fibre Market Share 34
BOXES 2.1 Differences Between Woollen and Worsted Fabrics
2.2 Processing Wool for Worsteds and Woollens
2.3 Sources of Textile Fibres
4
5
6
ii
EXECUTIVE SUMMARY
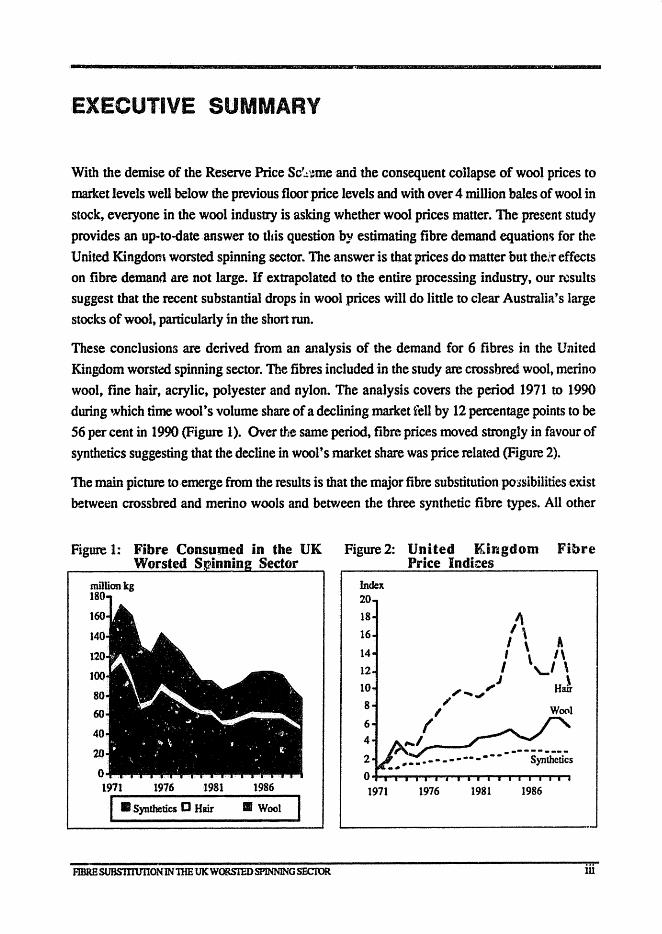
With the demise of the Reserve Price Sd.!~meand the consequent collapse of wool prices to market levels well below the previous floor price levels and with over 4 million bales of wool in stock, everyone in the wool industry is asking whether wool prices matter. The present study provides an up-to-date answer to tl,is question by estimating fibre demand equation~ for the United Kingdorn worsted spinning sector. The answer is that prices do matter but the.ir effects on fibre demand are not large. If extrapolated to the entire processing industry, our results suggest that the recent substantial drops in wool prices will do little to clear Australia's large stocks of wool, particularly in the short run.
These conclusions are derived from an analysis of the demand for 6 fibres in the United Kingdom worsted spinning sector. The fibres included in the study are crossbred wool, merino wool, fine hair, acrylic, polyester and nylon. The analysis covers the period 1971 to 1990 during which time wool's volume share of a declining market fell by 12 percentage points to be
56 per cent in 1990 (Figure 1). Over the same period, fibre prices moved strongly in favour of
synthetics suggesting that the decline in wool's market share was price related (Figure 2).
The main picture to emerge from the results is that the major fibre substitutionpo:)sibilities exist between crossbred and merino wools and between the three synthetic fibre types. All other
in the UK Figure 2: United K.ir~gdom Fibre Sector Price indi::es
~------------~~--~------~ million kg
1976 1981 1986
I • Synthetics D Hair • Wool
FIBRESUBS1T1Ul10NlNnIEUKWORS11IDSPINNlNGSECrOR
Index 20
18
16
14
12
10
8
6
4
2
/, I \ A I \ 1\ I \,-, \
,J H' , .... "" I1U' ;'
I I
,..,.,/ ........ -,.,
O~~~~~~~~~~~~
1971 1976 1981 1986
ill
inter .. fibre group effects are quite small with the exception of the ~ffects of wool price changes on the consumption of the minor synthetics, polyester and nylon. The demand for both wool
types remains relatively unaffected by a change in the relative price·ofhair or any of the three
synthetics.
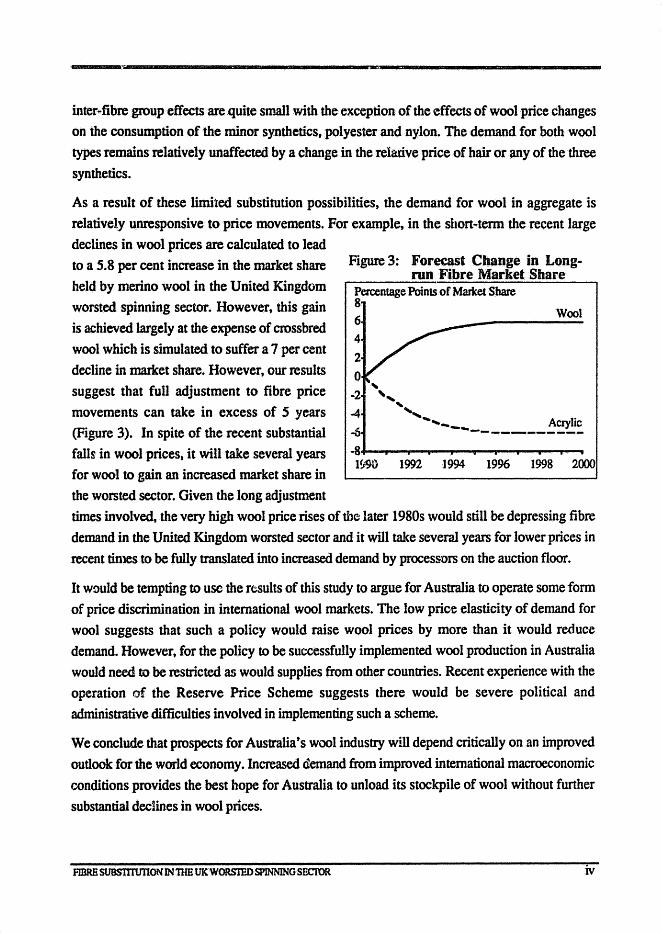
As a result of these limited substitution possibilities, the demand for wool in aggregate is
relatively unresponsive to price movements. For example, in the sbort .. term the recent large declines in wool prices are calculated to lead to a 5.8 per cent increase in the market share held by merino wool in the United Kingdom worsted spinning sector. However, this gain
is achieved largely at the expense of crossbred
wool which is simulated to suffer a 7 per cent
decline in market share. However, our results suggest that full adjustment to fibre price
movements can take in excess of 5 years (Figure 3). In spite of the recent substantial
falls in wool prices. it will take several years for wool to gain an increased market share in
the worsted sector. Given the long adjustment
Figure 3: Forecast Change in Longrun Fibre Market Share
Percentage Points of MaJket Share 8 6
o -2
-4
-6
" "
Wool
" ........ ___ Acrylic -- ... ---------
-8-1--.--.--....-..---.-..... -....-...-....-.... 1!r% 1992 1994 1996 1998 2000
times involved, the very high wool price rises of the later 1980s would still be depressing fibre
demand in the United Kingdom worsted sector and it will take several years for lower prices in
recent times to be fully translated into increased demand by processors on the auction floor.
It wDuld be tempting to use the results of this study to argue for Australia to operate some fonn
of price discrimination in international wool markets. The low price elasticity of demand for wool suggests that such a policy would raise wool prices by more than it would reduce demand. However, for the policy to be successfully implemented wool production in Australia
would need to be restricted as would supplies from other countries. Recent experience with the operation of the Reserve Price Scheme suggests there would be severe political and
administrative difficulties involved in implementing such a scheme.
We conclude that prospects for Australia's wool industry will depend critically on an improved
outlook for the world economy. Increased aemand from improved international macroeconomic
conditions provides the best hope for Australia to unload its stockpile of wool without further
substantial decUnes in wool prices.
FIBRH SUBS1lTU'I1ONlNnm UKWORSmOSPJNNING SECTOR Iv
------.~"----------------------------------------------------FIBRE SUBSTITUTION IN THE UNITED KINGDOM
WORSTED SPINNING SECTOR
1. Introduction
Australian woolgrowers are financially vulnerable to the large amount of capital they have
invested in the huge stockpile of wool accumulated by the Australian Wool Corporation during
its operation of the Reserve Price Scheme. The efficient management and disposal of this
stockpile will greatly influence woolgrowers' incomes for many years to come. Knowledge of
future market demand and the factors that influence it are essential to optimal disposal of the
stockpile. They are also essential to fully understand what will be the long-tenn impact of the
large falls in wool prices following abandonment of the Reserve Price Scheme.
This study provides an up-to-date analysis of the microeconomic factors, panicularly fibre
substitution, affecting wool demand in a large and important wool-using sector of the United
Kingdom. Mill level data are used for the UK worsted spinning sector, the output of which is
used principally to produce apparel. The results for the UK are taken to be representative of
demand response at the spinning stage.
Fibre substitution in response to relative price changes can occur at several stages during
processing or at the fmal demand stage of the textile 'pipeline'. Fibre demand during the
processing stages is derived from fmal demand in the sense that processors will only make
production decisions which are consistent with consumer's tastes and preferences for end use
characteristics or qualities in apparel. The spinning stage of processing where raw fibres are
spun into yarns is the principal stage at which fibre choice decisions are made. Substitution of
fibres will occur in response to relative price changes depending on the extent to which different
fibres can be spun into yarns with similar end-use characteristics. Consumers will then
substitute apparel qualities in response to relative price changes resulting from the cost of
producing yam with the relevant end-use characteristics or qualities.
U!Je of mill level data at the spinning stage thus enables us to focus on the critical point of the
process where fibre choice decisions are made. It avoids the introduction of errors that can
occur when constant conversion factors are used to convert final demand data to mill level, as was done by Ball, et al. (1989). Use of mill level data also enables the substitution elasticities
1
between wool and other fibres to be obtained directly from the model results. The study of Short and Beare (1990) only obtained the United States retail demand elasticities directly and
not the derived demand elasticity for wool fibre which could only be obtained through further manipulation of their results.
Fibre substitution at the spinning stage is examined in this study using the Generalised McFadden cost function methodology. This functional form was developed by Diewert and Wales (1987) to overcome some of the practical shortcomings of earlier flexible functional fonns such as the translog. It allows for imposition of the correct curvature conditions during estimation without loss of flexibility properties. Use of this methodology and data source has permitted the inclusion of a larger number of fibre types than has previously been possible.
Two wool types {crossbred and merino}, three synthetic types (acrylic, polyester and nylon)
and hair fibres are included in the analysis.
Slow response times to changes in relative fibre prices are an important characteristic of apparel production. Earlier studies of fibre substitution have lacked a comprehensive theoretical framework to take account of this important feature. In this study a planning price model of imperfect adjustment is estimated (Woodland 1977, Lawrence 1987). In this model, processors respond fully each period to a notional set of planning prices which in turn adjust gradually to
actual prices. The rate at which the planning prices adjust to actual prices is estimated as part of
the overall estimating system. Wool demand can thus respond at a faster or slower rate than
synthetic fibre demand Using this method, the response pattern of demand following a relative price change can be plotted over time. This information is vital to a thorough understanding of
fibre demand
In the following section the process of fibre and fabric production is reviewed and the
characteristics of the UK worsted spinning sector examined. Previous studies are then briefly reviewed. The Generalised McFadden cost function model is presented in the fourth and fifth
sections followed by the planning price model in the sixth section. The influence of final
demand level factors on fibre demand is then examined in the seventh section and the important
policy implications emanating from the study are summarised.
FmRESUBS1T1VIlON lNTIm UK WORSTED SPlNNINGSECIOR 2
2. Fibres and Fabric Production
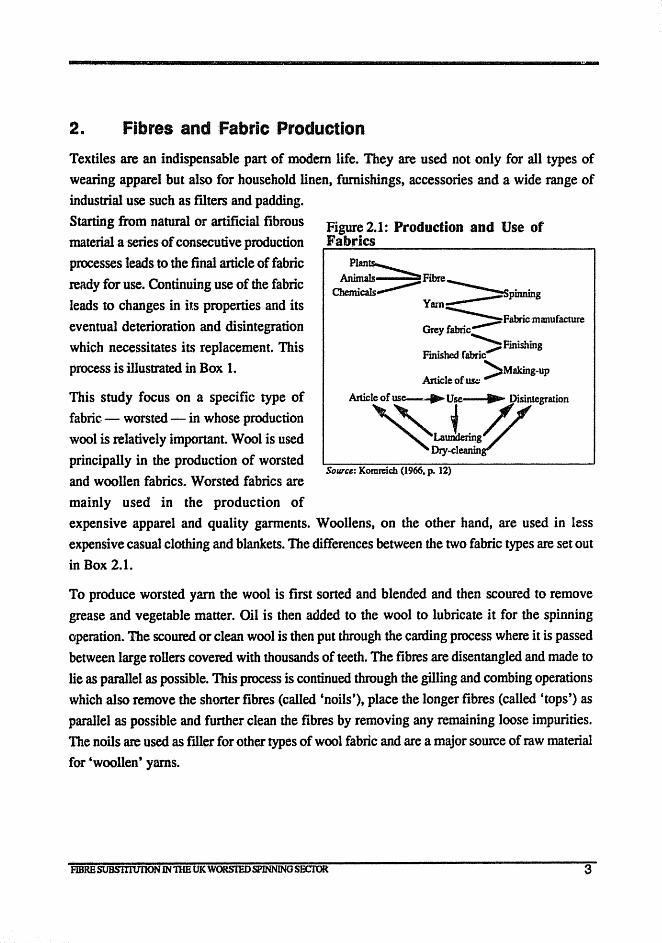
Textiles are an indispensable part of modem life. They are used not only for all types of wearing apparel but also for household linen, furnishings, accessories and a wide range of industrial use such as filters and padding. Starting from natural or artificial fibrous material a series of consecutive production processes leads to the final article of fabric ready for use. Continuing use of the fabric leads to changes in its properties and its eventual deterioration and disintegration which necessitates its replacement. This process is illustrated in Box 1.
This study focus on a specific type of fabric - worsted - in whose production wool is relatively important. Wool is used
principally in the production of worsted and woollen fabrics. Worsted fabrics are
mainly used in the production of
Figure2.1: Production and Use of Fabrics
Plan~ Animals Fibre
Chemicals""""""'" ------ .. ---::::Spmrung Yam--
~Fabricmanufacture Grey fabric","",",----.
----""Fmishin Finished fabric........ g
>Making-up Article of ww
SOUTce: Kornreich (1966. p. 12)
expensive apparel and quality garments. Woollens, on the other hand, are used in less expensive casual clothing and blankets. The differences between the two fabric types are set out in Box 2.1.
To produce worsted yarn the wool is ftrst soned and blended and then scoured to remove grease and vegetable matter. Oil is then added to the wool to lubricate it for the spinning operation. The scoured or clean wool is then put through the carding process where it is passed between large roners covered. with thousands of teeth. The fibres are disentangled and made to
lie as parallel as possible. This process is continued through the gilling and combing operations which also remove the shorter fibres (called 'noils'), place the longer fibres (called 'tops') as parallel as possible and further clean the fibres by removing any remaining loose impurities. The noils are used as ftller for other types of wool fabric and are a major source of raw material for 'woollen' yarns.
FIBRBSUBS1TIUl1ON IN nIB UK WORSTEDSPINNINGSOCTOR 3
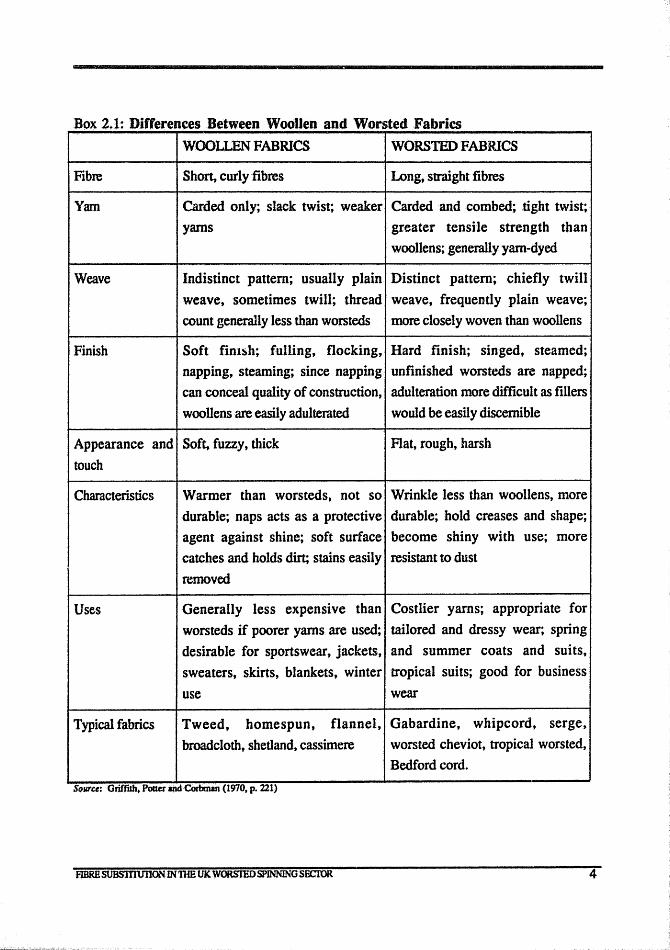
Box 2.1: Differences Between Woollen and Worsted Fabrics
Fibre
Yam
Weave
Finish
WOOLLEN FABRICS WORSTED FABRICS
Short, curly fibres Long, straight fibres
Carded only; slack twist; weaker Carded and combed; tight twist;
yarns greater tensile strength than
woollens; generally yam-dyed
Indistinct pattern; usually plain Distinct pattern; chiefly twill
weave, sometimes twill; thread weave, frequently plain weave;
count generally less than worsteds more closely woven than woollens
Soft finbh; fulling, flocking, Hard finish; singed, steamed;
napping, steaming; since napping unfinished worsteds are napped;
can conceal quality of construction, adulteration more difficult as fillers
woollens are easily adulterated would be easily discernible
Appearance and Soft, fuzzy, thick
touch
Flat, rough, harsh
Characteristics
Uses
Typical fabrics
Warmer than worsteds, not so Wrinkle less than woollens, more
durable; naps acts as a protective durable; hold creases and shape;
agent against shine; soft surface become shiny with use; more
catches and holds dirt; stains easily resistant to dust
removed
Generally less expensive than Costlier yarns; appropriate for
worsteds if poorer yams are used; tailored and dressy wear; spring
desirable for sportswear, jackets, and summer coats and suits,
sweaters, skirts, blankets, winter tropical suits; good for business
use wear
Tweed, homespun, flannel, Gabardine, whipcord, serge,
broadcloth, shetland, cassimere worsted cheviot, tropical worsted,
Bedford cord.
SOlll'ce: Griffllh. Potter andCorbman (1970. p. 221)
F1.BRB SUBS'ITIUllONIN TIm UK. WOR.STED SPINNING SECIOR 4
--
Box 2.2: Processing Wool for Worsteds and Woollens
SORTING BLFlIDING SCOURING
OORWOOUENS IDa WORSTEDS
; I CARDING 1 I CARDING I
I COMBING
(REMOVES SHORT FIBRES; MAKES FIBRES PARAU.EL)
I
DRAWING (THINS SUVERS)
I
SPlNNING SPINNING (yARNS.BECOMEFUZlY. (YARNS BECOMESMoorH.
nHCK.SOFr) 11iIN, ROUND. HARD)
• • WE.I\VING WPAVING
• • FINISHING FINISHING
Sourel: Griffith, Potter and Corbman (1970, p. 218)
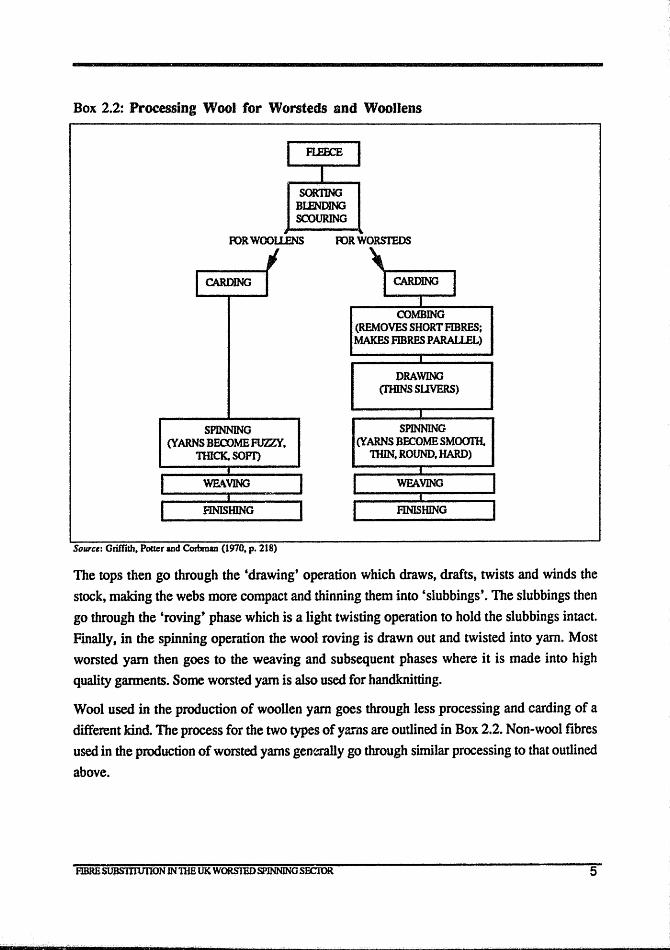
The tops then go through the 'drawing' operation which draws, drafts, twists and winds the
stock, making the webs more compact and thinning them into 'slubbings'. The slubbings then
go through the 'roving' phase which is a light twisting operation to hold the slubbings intact.
Finally J in the spinning operation the wool roving is drawn out and twisted into yarn. Most
worsted yarn then goes to the weaving and subsequent phases where it is made into high
quality gannents. Some worsted yam is also used for handknitting.
Wool used in the production of woollen yam goes through less processing and carding of a
different kind The process for the two types of yarns are outlined in Box 2.2. Non-wool fibres
used in the production of worsted yams generally go through similar processing to that outlined
above.
FlBRESUBSmVIlON INnlE UK WORSrnOSPlNNING SEClOR 5
Box 2.3: Sources of textile fibres
Fibre source
Saurc,: Egan (1991)
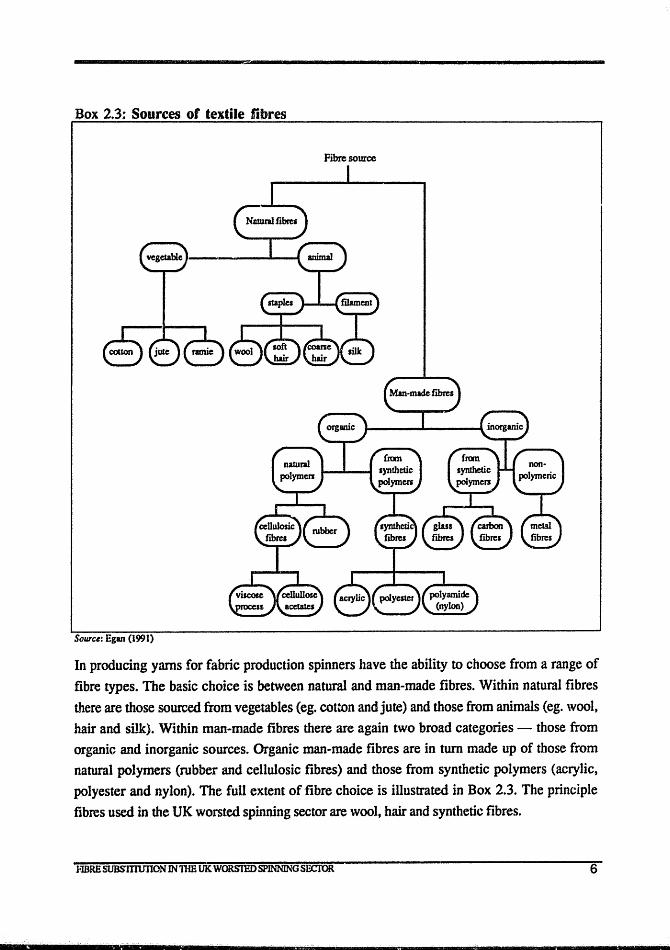
In producing yarns for fabric production spinners have the ability to choose from a range of
fibre types. The basic choice is between natural and man-made fibres. Within natural fibres there are those sourced from vegetables (eg. cotton and jute) and those from animals (eg. wool, hair and silk). Within man-made fibres there are again two broad categories - those from organic and inorganic sources. Organic man-made fibres are in tum made up of those from natural polymers (rubber and cellulosic fibres) and those from synthetic polymers (acrylic, polyester and nylon). The full extent of fibre choice is illustrated in Box 2.3. The principle fibres used in the UK worsted spinning sector are wool, hair and synthetic fibres.
HBRE SUBS1l1UI1ON IN nm UKWORSfEDSPlNNINGSECfOR 6
-Figure 2.2: Fibre Consumed in tbe UK Worsted Spinning Sector
million kg 1
1973 1975 1977 1979 1981
I_ Synthetics D Hair
SOUTce: Swan Consultants (Canberra) database
1983 1985
• Wool I 1987 1989
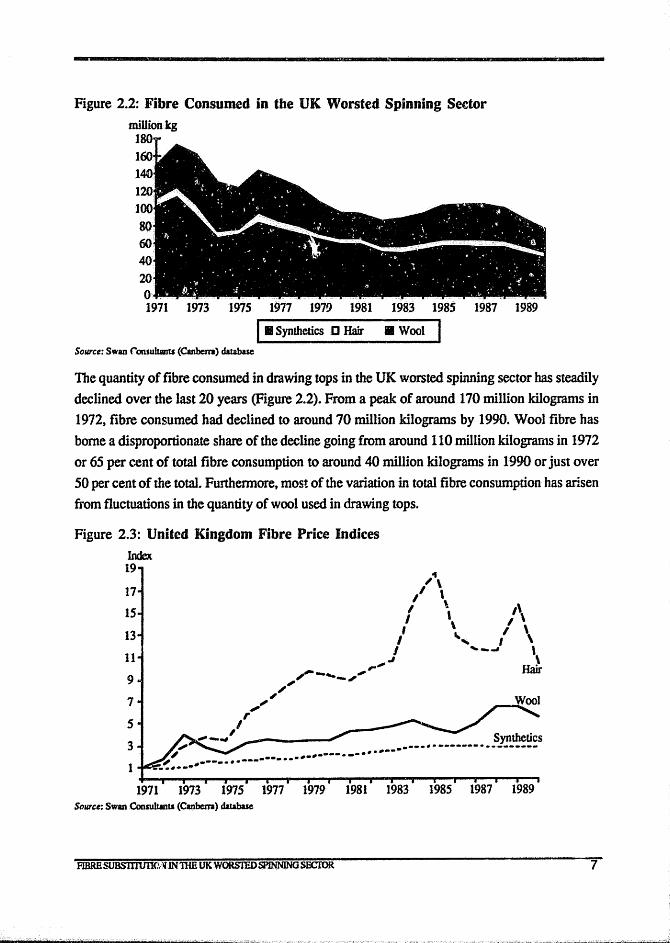
The quantity of fibre consumed in drawing tops in the UK worsted spinning sector has steadily declined over the last 20 years (Figure 2.2). From a peak of around 170 million kilograms in 1972, fibre consumed had declined to around 70 million kilograms by 1990. Wool fibre has borne a disproportionate share of the decline going from around 110 million kilograms in 1972 or 65 per cent of total fibre consumption to around 40 million kilograms in 1990 or just over 50 per cent of the total. Furthennore. most of the variation in total fibre consumption has arisen from fluctuations in the quantity of wool used in drawing tops.
Figure 2.3: United Kingdom Fibre Price Indices
Index 19
~\
" \ I \ ,'\ I , , \ / ,
I ~" \ 13
11
9
7
5
3
1
/-.... _,' J ..... _.... \
~, Hm
" ",'
,," ,.,-~, _----", Synthetics -----.--... ~-------.. -------... ---.---
-~ .. -------... ----.. -.-.--1971 1973 1975 1977 1979 1981 1983 1985 1987 1989
SOUTce: Swan Consutt.lts (Canberra) database
FlBRBSUBS1mm(1:)UNlHE UK WORSTEDSPlNNlNG SECIOR 7
Price indices for the three major fibre types used - wool, hair and synthetics - are presented
in Figure 2.3 for the 20 year period 1971 to 1990. Price increases for hair have far t)utsoipped
those for the other two fibre categories, increasing 10 fold over the period. Wool prices have
increased around 6 fold over the period while synthetics prices have less than tripled. Given the
divergences in the rate of increase in fibre prices and the corresponding change in relative fibre
prices over the last 20 years, one would expect to see at least some evidence of fibre
substitution having occurred
Figure 2.4: UK Wool and Synthetic Fibre Prices (pounds sterling/kg) £I1cg
5.0
4.5
4.0
3.5
3.0
2.5
2.0
1.5 ...
I " I , I
,~
r-, I \
I \ I \
I Merino f
" .. "", .. -......... _-- ...... ~.-- Nylon
.'" A r .",. __ -_~ ... ""'- _ .. e>-------------:!1.!S tIIfI"I----- - ~-----.:.,.,.-----.---___ tf/1 ...... --
1.0 4 _ .... ."",.... ~----:: .. --........ Polyster '~." .,.,,----... -- .. ----~....: ..............
0.5 ----.-------0.0 +---.---,r--...,....-r.......,..---r----r'.......,..--..,.---r'-,...-..,.--,.-r-..,.--,.-,.--r---.
1971 1973 1975 1977 1979 1981 1983 1985 1987 1989 Swan Consultants (Canberra) database
SO/ITce:
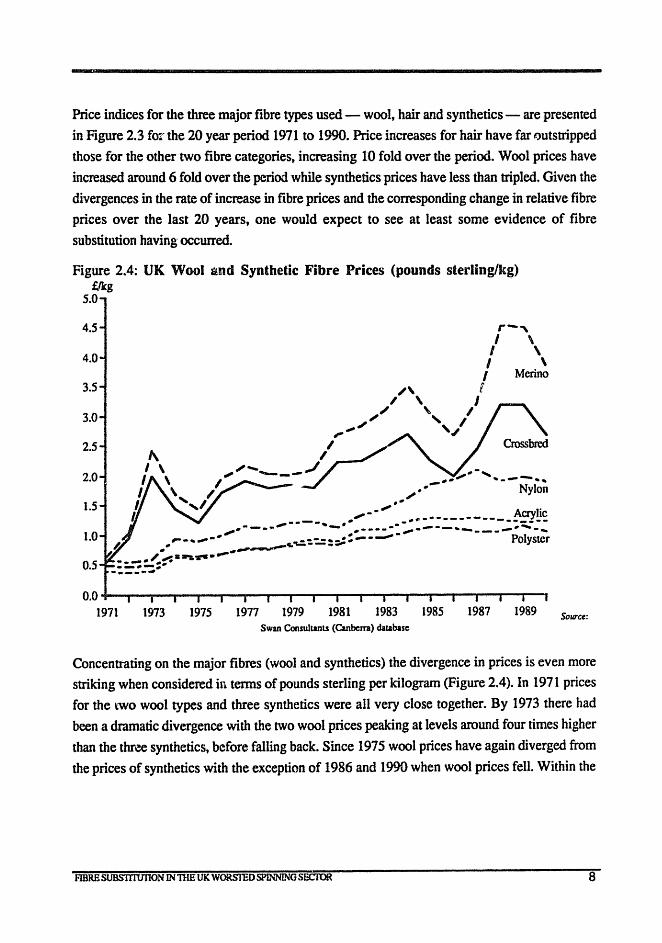
Concentrating on the major fibres (wool and synthetics) the divergence in prices is even more
striking when considered in tenns of pounds sterling per kilogram (Figure 2.4). In 1971 prices
for the two wool types and three synthetics were all very close together. By 1973 there had
been a dramatic divergence with the two wool prices peaking at levels around four times higher
than the three synthetics, before falling back. Since 1975 wool prices have again diverged from
the prices of synthetics with the exception of 1986 and 1990 when wool prices fell. Within the
FIBRE SUBSlTIUI10N IN1HH UK W<>RSrnDSPINNING SECIOR 8
wool category, the price of merino wool has steadily diverged from that of crossbred. The
operation of the Reserve Price Scheme has contributed to this in recent years. Within the
synthetics category, the prices of acrylic and polyester fibres have moved in unison and shown
the least increase over the period while nylon fibre prices have increased relative to them.
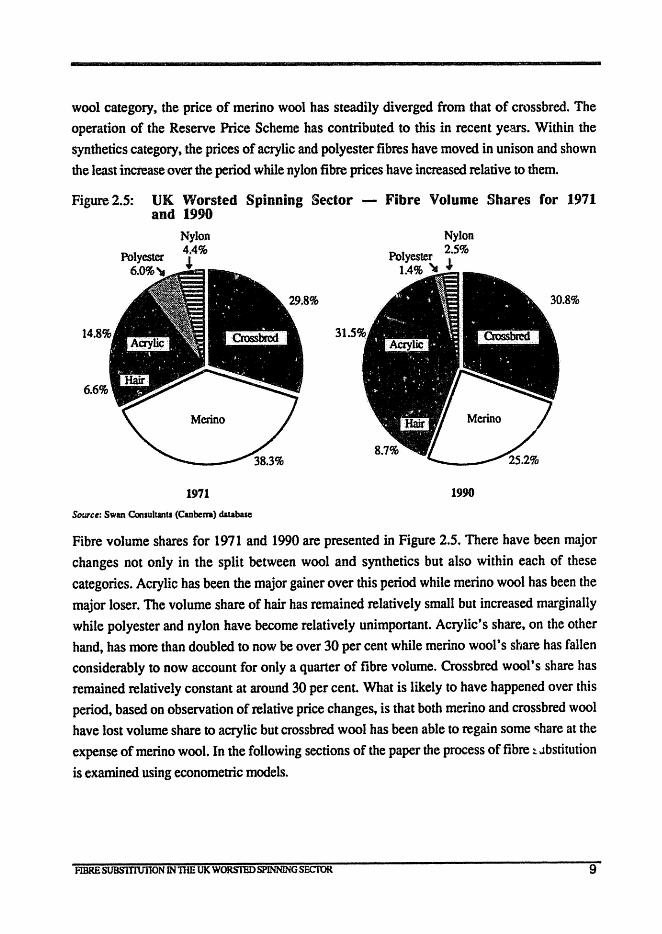
Figure 2.S: UK Worsted Spinning Sector - Fibre Volume Shares for 1971 and 1990
6.6%
Nylon 4.4%
1971
Source: Swan Consultants (Canbem) database
31
Nylon Polyester 2.5%
1.4% '- J.
1990
Fibre volume shares for 1971 and 1990 are presented in Figure 2.5. There have been major
changes not only in the split between wool and synthetics but also within each of these
categories. Acrylic has been the major gainer over this period while merino wool has been the
major loser. The volume share of hair has remained relatively small but increased marginally
while polyester and nylon have become relatively unimportant. Acrylic's share, on the other
hand, has more than doubled to now be over 30 per cent while merino wool's share has fallen
considerably to now account for only a quarter of fibre volume. Crossbred wool's share has
remained relatively constant at around 30 per cent. What is likely to have happened over this
period, based on observation of relative price changes, is that both merino and crossbred wool
have lost volume share to acrylic but crossbred wool has been able to regain some "ihare at the
expense of merino wool. In the following sections of the paper the process of fibre t Jbstitution
is examined using econometric models.
FlBRESUBS'lTIUl1ON lNntE UK WORSTEOSPINNING SECTOR 9
3. Previous Studies
A number of studies have examined fibre substitution at various stages of the gannent-maIdng process over the last decade. Zeitsch (1979) estimated a model of wooVsynthetic fibre substitution in the United Kingdom worsted spinning sector. The modelled specified was consistent with a multi-stage decision-making process in which the producer first minimised the cost of combining fibres with other inputs. Then, given the level of aggregate fibre demand determined at the first level, the cost of combining wool and synthetic fibres is minimised. The model was estimated using half-yearly data covering the period 1960 to 1970. The results indicated that wool and synthetic fibres were good substitutes over the data period with an estimated elasticity of substitution of around 4. The results also indicated that spinners took approximately one year to fully adjust to a change in fibre prices. The International Wool Secretariat's main marketing program, 'Woolmark', was found to have significantly shifted the demand for wool. The 'Woolmark' program was estimated to have a benefit/cost ratio in excess of 5 fei' Australian wool growers. There were few earlier studies of the competition between wool and synthetics due to the perceived 'non-price' nature of much of this competition, data problems due to changing quality of synthetic fibres over time and the absence of continuous data series.
Veldhuizen and Richardson (1984) also used total mill consumption data to analyse price competition between wool and synthetics at the yarn production stage. They estimated various lag structures using reciuced form single equation estimation to derive factor demands for Japan, Italy and West Germany. They found that the price of wool relative to the price of synthetics was a significant determinant of wool demand but elasticities were generally
inelastic, even in the long-run.
A systems approach to estimating the derived demand for different fibres was first applied by Dewbre, Vlastuin, and Ridley (1986). A two-stage estimation process was used where aggregate demand for apparel fibre was determined in the first stage as a function of the demand for final apparel products. Aggregate apparel flbre demand was allocated between the fibres wool, cotton and synthetics in the second stage of estimation. The model was estimated using data for the 8 major OECD wool-consuming countries and was based on cost-minimising behaviour. Wool, cotton and synthetic fibres were each found to have own-price elasticities of around -0.2 in the medium tenn. Cross elasticities between fibre types were even smaller in the medium tenD indicating relatively little scope for substitution.
FIBRESUBS1TlUlION INrnE UK WOR5I'EDSP1NNING SECTOR 10
Harris (1988) applied duality theory using a translog cost function to analyse the US demand
for taw materials used in the domestic production of apparel goods. Using the assumption of
weak separability t demand for apparel fibres was divided into two sub-models. Fibre demand
wac; first allocated between natural fibres and cellulosic and non-ce1l4sic fibres. Demand for
natural fibres was then allocated between wool and cotton. This model was extended by Ball,
Beare and Harris (1989) who introduced dynamics by use of a 'partial adjusnnent translog'
model. This model imposed the same rate of adjustment across the demand for all fibres.
Adjustment of fibre demand was found to be relatively slow with only around half the
adjustment having taken place after five years. In the long-run own-price elasticities of demand
for cotton, wool, polyester and rayon were found to lie in the range of -O~6 to -0.9. Greater
scope for substitution between fibre types was found to exist in the long-run than bad been
found in most earlier studies. The demand for wool was found to be significantly influenced by
the prices of cotton and polyester.
Shan and Beare (1990) applied the Almost Ideal Demand System to household survey data
collected in the United States to consider substitution between fibres across several different
end uses. Substitution between wool, cotton and synthetic fibres was examined at the retail
level. For men's apparel, fibre demand was estimated for jackets, coats, suits and knitwear.
For women t s apparel, fibre demand was estimated for skirts, jackets, pants-suits and knitwear.
The own-price elasticity estimates obtained for wool were generally price elastic, and the
magnitude of the cross-price elasticlties indicated there was significant competition between fibres. The retail elasticities obtained from this study were considerably higher than the corresponding raw fibre elasticities obtained in previous studies. This result suggested that
changes in fibre blends could be a significant source of fibre competition. The study also
concluded that distonions in the relative prices of apparel made from different fibres would
have substantial impacts on fibre consumption patterns. Results presented by Shon and Beare,
however, were only for retail demand elasticities and not the derived demand elasticities for
wool fibre which could only be obtained through further manipulation of their results.
4. The Generalised McFadden Cost FunctiQf,I Model
Duality theory and the cost function provide a convenient !lfld flexible framework for examining
the responsiveness of the UK Worsted Spinning Sector to changes in fibre prices. While there
are functional fonns of tbe production function which are sufficiently flexible to allow
elasticities of substitution to vary, there are several advantages in using a dual cost function
FIBRBSUBS1TlUIION 1N1HE UK WORSIEDSPINNlNGSECIOR 11
approach to derive estimates of production parameters. Cost functions are linear homogeneous
in prices, regardless of the homogeneity properties of the production function, and the
estimation equations have prices as independent variables instead of factor quantities, which more closely approximates the situation faced by individual finns.
Denoting the N input quantities by the vector x, input prices by the vector p>>O, output by y,
and tbefirmts production function by y = f(x), then the producer's cost function can be represented as the solution to the following constrained minimisation problem;
(4.1) C(p;y) = min.(pT x: f(x) ~ y, x ~ 0 ) & N
With numerous producers each having no control over the prices they pay for inputs, spinning sector input demand is well modelled by the cost function framework where producers vary their input usage each period to minimise the cost of producing a given amount of output.
The cost function (1) will be linearly homogeneous, increasing and concave in input prices p. If
the cost function is also differentialable with respect to p then the input demand functions can be
derived by applying Shephard's (1953) Lemma:
(4.2) x.(p;y) = dC(p;y)/dp. 1 1
The main focus of this study is on fibre substitution within the UK Worsted Spinning Sector. A system of demand equations is estimated for 6 fibres (crossbred wool, merino wool, hair, acrylic, polyester and nylon) using annual data for the 20 year period 1971 to 1990. Aggregate fibre usage is assumed to be 'Leontier' with other inputs such as labour, capital and materials. This means that fibre usage moves in fixed proportions to the output of the worsted spinning
sector. To conserve degrees of freedom, constant returns to scale with respect to aggregate fibre
usage are imposed. This facilitates estimation of a unit cost function where costs are minimised
per unit of aggregate fibre consumed.
Desirable characteristics of a functional form for the cost function are that it be flexible (able to provide a second-order approximation to an arbitrary twice continuollsly differentiable profit function)t parsimonious (have the minimal number of free parameters required for flexibility),
and C'.onsistent with the required theoretical properties of a cost function. While thettanslog and Generalised Leontief fOImS have become popular because of their flexibility and relative ease of implelnentation, they often suffer in empirical applications from failure to satisfy the required curvature properties at all (or any) of the observation points. In response to this problem, recent
developments in functional forms have led to the development of functions which are flexible
FiiiiE"SUBS1TIUllON INum UK WORS1lIDSPINNING SECrOR 12
--------------------------------------------------------------and easily verified as satisfying curvaturecoi~ditions globally. If the curvature conditions are
not satisfied they can be imposed with minimal cost .to flexibility properties although non· linear regression techniques then have to- be used.
The functional fonn used for the cost function is the Generalised McFadden (OM) developed
by Diewert and Wales (1987). The OM function is superior to earlier flexible fonns such as the
translog in that curvature conditions can be imposed on the model without loss of flexibility.
Empirical implementations of the GM form and the derivative Symmetric OM fonn in the
international trade context can be found in Diewert and Morrison (1986) and Lawrence (1987,
1989, 199Oa, 199Oc). The OM function has been applied to Australian agriculture by Lawrence and Zeitsch (1989, 1990) and Lawrence (1990b).
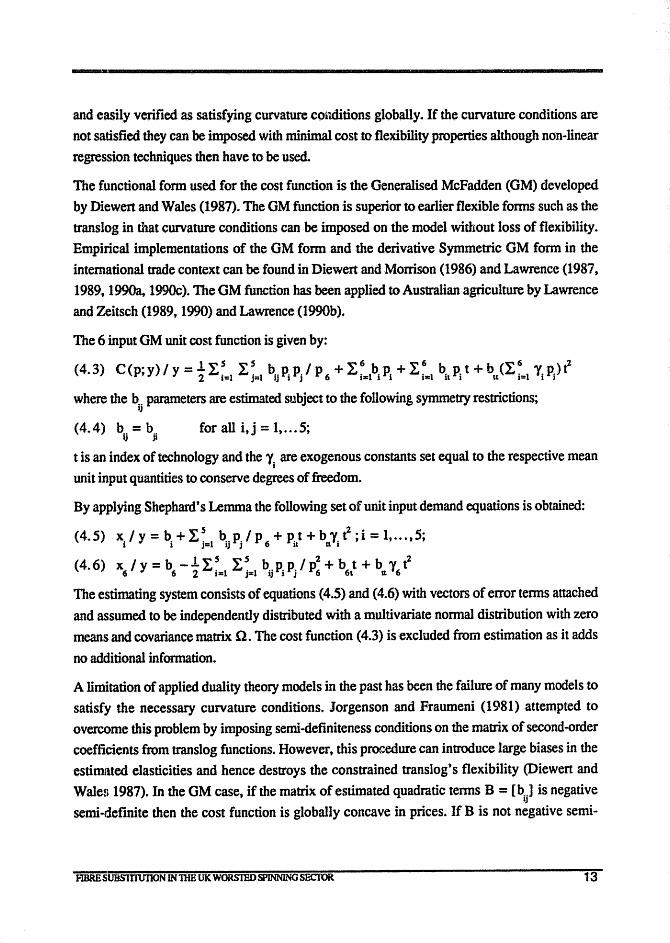
The 6 input OM unit cost function is given by:
(4.3) C (p; y) I y = t L :=1 L : ... 1 bij Pi Pj I P 6 + L ~=lbiPl + I, ~=1 bit Pi t + bu (I, :=1 1j PiltZ
where the b .. parameters are estimated subject to the following symmetry restrictions; lJ
(4.4) b = b for all i,j = 1, ... 5; ij ji
t is an index of technology and the '"( are exogenous constants set equal to the respective mean i
unit input quantities to conserve degrees of freedom.
By applying Shephard's Lemma the following set of unit input demand equations is obtained:
(4.5) x I y = b. + L S b .. p.1 p + P. t + b 1. tZ ; i = 1, ••. t 5;
i 1 j=1 IJ J 6 it U I
(4.6) x I y = b - ~ LSI, S b p P I p2 + b t + b 'Y t2 6 6 2 1=1 j=1 ij i j 6 6\ U 6
The estimating system consists of equations (4.5) and (4.6) with vectors of error tenDS attached
and assumed to be independently distributed with a multivariate nonna! distribution with zero
means and covariance matrix n. The cost function (4.3) is excluded from estimation as it adds
no additional information.
A limitation of applied duality theory models in the past has been the failure of many models to satisfy the necessary curvature conditions. Jorgenson and Fraumeni (1981) attempted to
overcome this problem by imposing semi~efiniteness conditions on the matrix of second-order
coefficients from translog functions. However, this procedure can introduce large biases in the
estimated elasticities and hence destroys the constrained translog's flexibility (Diewert and
Wales 1987). In the OM case, if the matrix of estimated quadratic tennsB = [b..l is negative lJ
semi-definite then the cost function is globally concave in prices. If B is not negative semi-
13
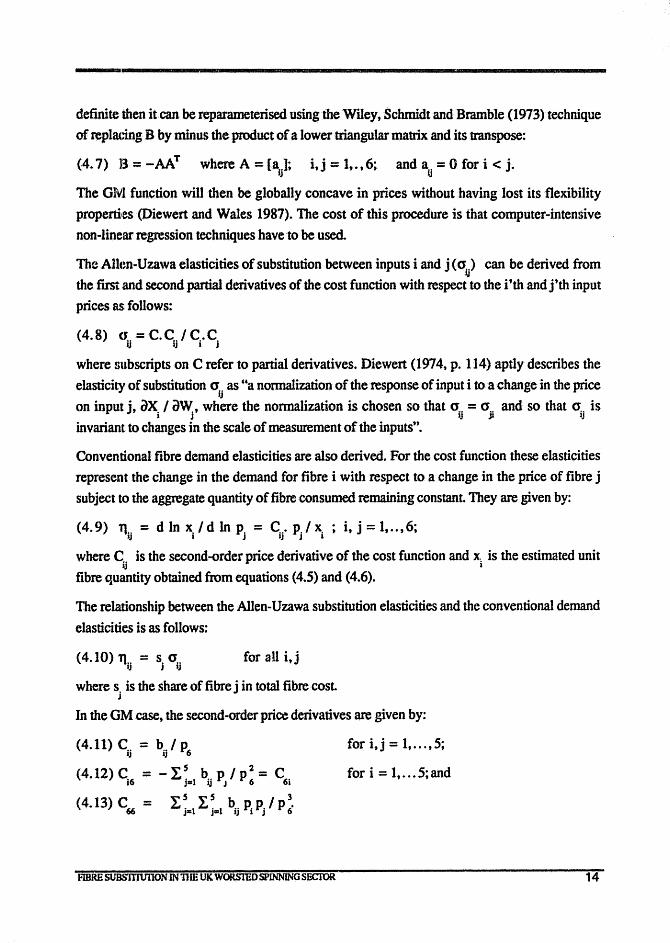
definite then it can be reparameterised usingtbe Wiley, Schmidt and Bramble (1973) technique
of ~plating B by minus the product of a lower triangular matrix and its transpose:
(4.7) 13 = _AAT where A = [aij]; i,j = 1,.,6; and a
jj = 0 for i < j.
The ONI function will then be globally concave in prices without having lost its flexibility
properti1es (Diewert and Wales 1987). The cost of this procedure is that computer-intensive
non-linear regression techniques have to be used.
The Allcm-Uzawa elasticities of substitution between inputs i and j (o..} can be derived from 1J
the first and second partial derivatives of the cost function with respect to the i'th and j'tb input
prices as follows:
(4.8) aij = C.Cjj! Cj"C
j
where subscripts on C refer to partial derivatives. Diewert (1974, p. 114) aptly describes the
elasticity of substitution (fjj as "a nonnalization of the response of input i to a change in the price
on input j, ax, ! awj, where the nonnalization is chosen so that 0 .. = 0,. and so that 0 .. is
I IJ Jl lJ
invariant to changes in the scale of measurement of the inputs".
Conventional fibre demand elasticities are also derived. For the cost function these elasticities
represent the change in the demand for fibre i with respect to a change in the price of fibre j
subject to the aggregate quantity of fibre consumed remaining constant. They are given by:
(4.9) T'ljj = d In Xi! din Pj = Cjf Pj! Xi ; it j = 1, .. ,6;
where C" is the second-order price derivative of the cost function and X:, is the estimated unit 1J I
fibre quantity obtained from equations (4.5) and (4.6).
The relationship between the Allen-Uzawa substitution elasticities and the conventional demand
elasticities is as follows:
(4.10) '111' = S. O'~l iJ J '.,
for all i,j
where s. is the share of fibre j in total fibre cost J
In the OM case, the second-order price derivatives are given by:
(4.11) Ci' = b .. ! P6 for i,j = 1, ... ,5; J IJ
(4.12) C = - ~5j b .. p ! p2 = C, for i = l, ..• 5;and 16 .. 1 1J J 6 61
(4 13) C ~ 5 ~ 5 b ! 3 • 66 = '" j=1 "- jel ij Pi Pj P 6'
FIBRE SUBS11WIlON INnlE UK WORSrnDSPINNING SECfOR 14
5. Results
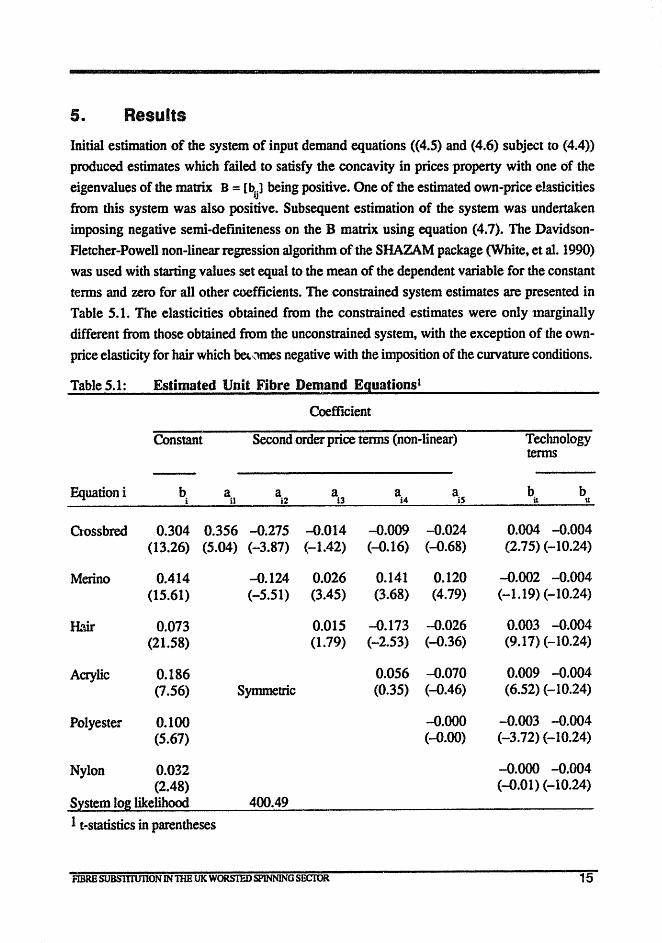
Initial estimation of the system of input demand equations «4.5) and (4.6) subject to (4.4»
produced estimates which failed to satisfy the concavity in prices property with one of .the
eigenvalues of the matrix B = [b . .) being positive. One of the estimated own-price eluticities 'J
from this system was also positive. Subsequent estimation of the system was undertaken
imposing negative semi-defIniteness on the B matrix using equation (4.7). The .Davidson
Fletcher-Powell non-linear regression algorithm oCthe SHAZAM package (White, et al. 1990)
was used with starting values set equal to the mean of the dependent variable for the constant
terms and zero for all other coefficients. The constrained system estimates are presented in
Table 5.1. The elasticities obtained from the constrained estimates were only marginally
different from those obtained from the unconstrained system, with the exception of the own
price elasticity for hair which ba,(tmes negative with the imposition of the curvature conditions.
Table 5.1: Estimated Unit Fibre Demand Eguationsl
Coefficient
Constant Second order price terms (non-linear) Technology terms
Equation i b. a ai2
a a a b b 1 it i3 i4 is it tt
Crossbred 0.304 0.356 -0.215 -0.014 -0.009 -0.024 0.004 -0.004 (13.26) (S.04) (-3.81) (-1.42) (--O.16) (-0.68) (2.75) (-10.24)
Merino 0.414 -0.124 0.026 0.141 0.120 -0.002 -0.004 (15.61) (-5.51) (3.45) (3.68) (4.79) (-1.19) (-10.24)
H3ir 0.013 0.015 -0.173 -0.026 0.003 -0.004 (21.58) (1.79) (-2.53) (-0.36) (9.17) (-10.24)
Acrylic 0.186 0.056 -0.010 0.009 -0.004 (1.56) Symmetric (0.35) (-0.46) (6.52) (-10.24)
Polyester 0.100 -0.000 -0.003 -0.004 (5.61) (-0.00) (-3.12) (-10.24)
Nylon 0.032 -0.000 -0.004 (2.48) (-0.01) (-10.24)
S~stem log likelihood 400.49
1 t-statistics in parentheses
FlBRB SUBS1TlUI10N IN TIm UK WORSllIDSPlNNlNG SECroR 15
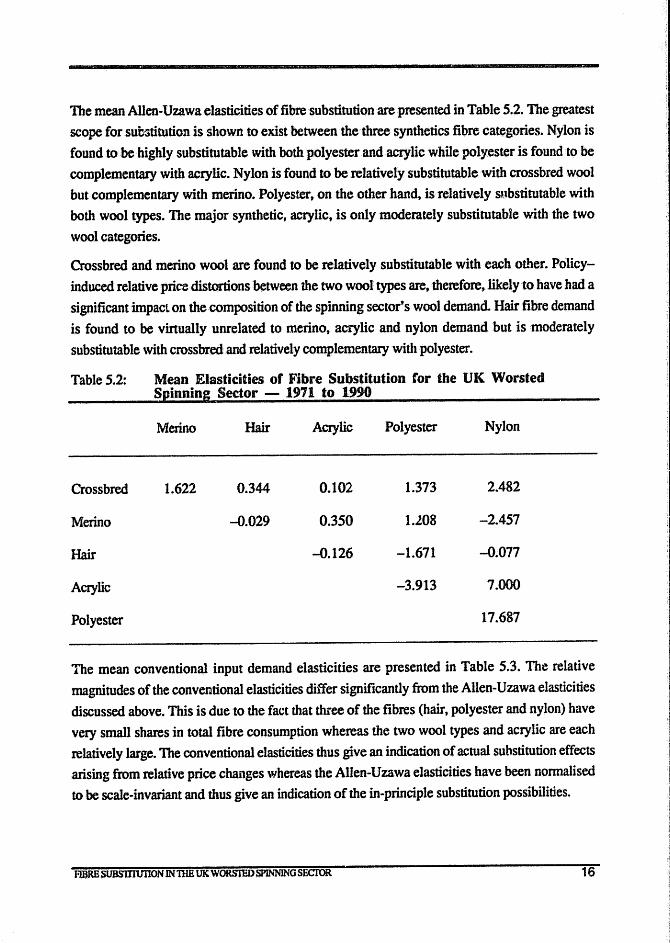
The mean AlIen-Uzawaelasticities of fibre substitution are presented in Table 5.2. The greatest
scope for sub-:nitution is shown to exist between the three synthetics fibre categories. Nylon is found to be highly substitutable with both polyester and acrylic while polyester is found to be
complementary with acrylic. Nylon is found to be relatively substitutable with crossbred wool
but complementary with merino. Polyester, on the other band, is relatively sJJbstitutable with
both wool types. The major synthetic, acrylic, is only moderately substitutable with the two
wool categories.
Crossbred and merino wool are found to be relatively substitutable with each other. Policy
induced relative pricadistortions between the two wool types are, therefore, likely to have had a
significant impact on the composition of the spinning sector's wool demand. Hair fibre demand
is found to be vinually unrelated to merino, acrylic and nylon demand but is moderately
substitutable with crossbred and relatively complementary with polyester.
Table 5.2:
Crossbred
Merino
Hair
Acrylic
Polyester
Mean Elasticities or Fibre Substitution for the UK Worsted Spinning Sector - 1971 to 1990
Merino Hair
1.622 0.344
-0.029
Acrylic
0.102
0.350
-0.126
Polyester Nylon
1.373 2.482
l.l08 -2.457
-1.671 -0.077
-3.913 7.000
17.687
The mean conventional input demand elasticities are presented in Table 5.3. The relative
magnitudes of the conventional elasticities differ significantly from the Allen-Uzawa elasticities
discussed above. This is due to the fact that three of the fibres (hair, polyester and nylon) have
very small shares in total fibre consumption whereas the two wool types and acrylic are each
relatively large. The conventional elasticities thus give an indication of actual substitution effects
arising from relative price changes whereas the Allen-Uzawa elasticities have been nonnalised
to be scale-invariant and thus give an indication of the in-principle substitution possibilities.
F1BRB SUBS1TlUl1ON IN1H£ UK WORSTED SPINNING SECfOR 16
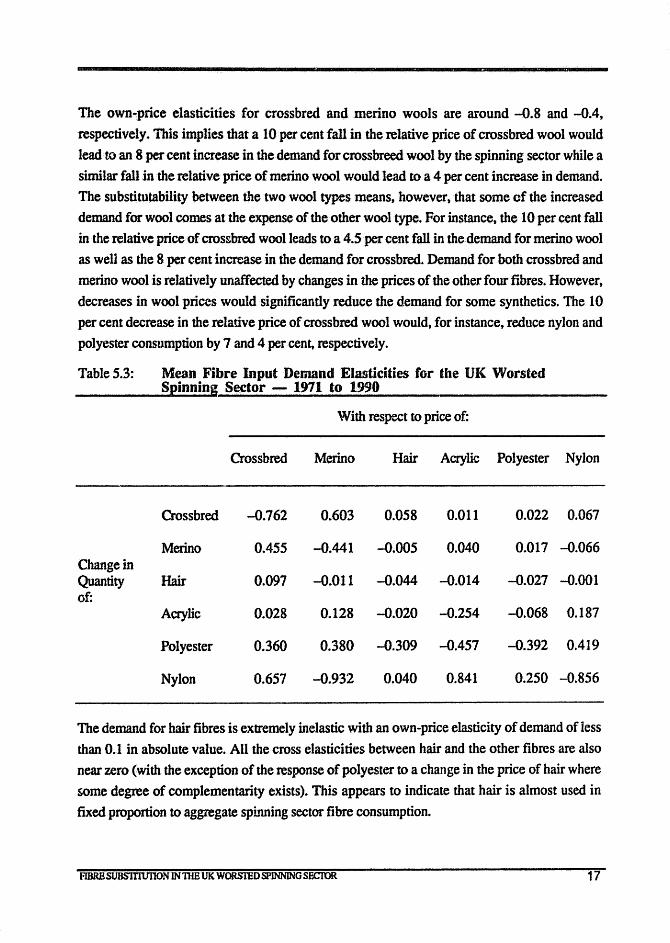
The own·price elasticities for crossbred and merino wools are around -0.8 and -0.4,
respectively. This implies that a 10 per cent fall in the relative price of crossbred wool would
lead to an 8 per cent increase in the demand for crossbreed wool by the spinning sector while a
similar fall in the relative price of merino wool would lead to a 4 per cent increase in demand. The substitutability between the two wool types means, however, that some of the increased
demand for wool comes at the expense of the other wool type. For instance, the 10 per cent fall
in the relative price of croS&bred wool leads to a 4.5 per cent fall in thedemand for merino wool
as well as the 8 per cent increase in the demand for crossbred. Demand for both crossbred and
merino wool is relatively unaffected by changes in the prices of the other four fibres. However,
decreases in wool prices would significantly reduce the demand for some synthetics. The 10
per cent decrease in the relative price of crossbred wool would, for instance, reduce nylon and
polyester consumption by 7 and 4 per cent, respectively.
Table 5.3: Mean Fibre Input Demand Elasticities for the UK Worsted Spinning Sector - 1971 to 1990
With respect to price of:
Crossbred Merino Hair Acrylic Polyester Nylon
Crossbred -0.762 0.603 0.058 0.011 0.022 0.067
Merino 0.455 -0.441 -0.005 0.040 0.017 -0.066 Change in Quantity Hair 0.097 -0.011 -0.044 -0.014 -0.027 -0.001 of:
Acrylic 0.028 0.128 -0.020 -0.254 -0.068 0.187
Polyester 0.360 0.380 -0.309 -0.457 -0.392 0.419
Nylon 0.657 -0.932 0.040 0.841 0.250 -0.856
The demand for hair fibres is extremely inelastic with an own-price elasticity of demand of less
than 0.1 in absolute value. All the cross elasticities between hair and the other fibres are also
near zero (with the exception of the response of polyester to a change in the price of hair where
some degree of complementarity exists). This appears to indicate that hair is almost used in
fixed proportion to aggregate spinning sector fibre consumption.
FlBRBSUBS1T1UIlON IN TIlE UK WORSTEDSPJNNING SECroR 17
The demand for nylon is relatively price responsive with an own-price elasticity of -0.9. A
10 per cent increase in the price of nylon would reduce nylon demand by 9 per cent while
increasing the demand for polyester and acrylic by 4 per cent and 2 per cent, respectively. It
would have a negligible impact on the demand for the natural fibres. The major synthetic,
acrylic, is less price responsive with an own-price elasticity of around -0.3. A 10 per cent
increase in the price of acrylic would reduce acrylic consumption by 3 per cent and reduce
polyester consumption by 5 per cent while increasing nylon consumption by 8 per cent. It
would also have a t~egligible impact on the consumption of natural fibres. Polyester demand is
moderately price responsive with an own-price elasticity of -0.4. A 10 per cent increase in the
relative price of polyester would i. ... crease nylon consumption by around 3 per cent but have
little impact on the other fibres.
The main picture to emerge from these results is that the major fibre substitution possibilities
exist between crossbred and merino wools and between the three synthetic fibre types. All other
inter-fibre group effects are quite small with the exception of the effects of wool price changes
on the c .. >Dsumption of the minor synthetics, polyester and nylon. The demand for both wool
types remains relatively unaffected by a change in the relative price of hair or any of the three
synthetics.
6. Imperfect Adjustment
The response of fibre demand to relative price changes can often take a long time to work its
way through the system and be felt in terms of changed demand for woolgrowers' output. The
process of fibre substitution is inherently dynamic and the existence of adjustment costs mean
that the response to changes in relative prices is likely to be spread out over a number of years.
However, the cost function model of the preceding section and most previous studies of fibre
demand assume there is instantaneous or full adjustment within the current observation period.
Studies that have attempted to allow for slow adjustment have usually done so by incorporating
ad hoc lag structures on prices. In the case of the six fibre model reported in the preceding
sections, all adjustment is assumed to have been completed within one year.
Ball, Beare and Harris (1989) introduced dynamics into the study of fibre demand in a more
systematic way than earlier studies. They found substantial differences in magnitude between
long-run and short-run demand elasticities with only around half the adjustmem naving
occurred after five years. However, their study used an ad hoc 'partial adjusunent translog'
approach which has the disadvantage of imposing the same rate of adjustment across the
FlBRBSUBS1TIUIlON 1N1lIE UKWOP.srEOSPlNNINGSECfOR 18
.. - '~W'

demand for all fibres. It would be preferable to have a dynamic model which allows different
rates of adjustment for different fibres as the constraints on adjusting fibre consumption are likely to differ between fibre types.
The question of how long it takes fibre demand to respond to a change in relative prices has
assumed a new imponance with the demise of the wool Reserve Price Scheme. How long it
will take for the increased demand for wool (ollowing the substantial reductions in auction
prices to be fully taken up will have important implications for growers' incomes and the
disposal of the wool stockpile. To help shed light on these dynamic processes a planning price
model of demand in the UK worsted spinning sector is reported in this section.
6. 1 The Planning Price Approach
An approach to modelling imperfect adjustment which has received little attention is the use of
"planning prices" as developed by Woodland (1976, 1977) and applied by Lawrence (1987).
Under this approach produc.-;, '& do not adjust fully to current prices within the observation
period. Instead they adjust fu~ly within the period to planning prices which in tum adjust
gradually to actual prices. This behaviour may be interpreted in one of two ways. First, firms
may have to commit themselves to input decisions before current prices are known or, even if
current prices are known, the finn may wish to wait and see if price changes are pennanent
before fully adjusting to a new current price. This may be likened to a partial adjustment
process whereby producers adjust only part-way towards a new price in the current period
depending on their expectations of future price movements. Either way, planning prices will
adjust to actual prices only gradually.
An alternative interpretation is that the use of planning prices is a dual representation of a
quantity adjustment path. For instance, if input prices change to a new level and then remain at
that level then producers faced with adjustment costs and quasi-fixed inputs will gradually
change their input mix to approach the new optimal quantities if the adjustment path is stable.
Thus, it may not be possible or profitable to fully adjust inputs such as capital, ~~"'1icularly that
in the form of buildings, in the current period. Rather, capital would be increased towards its
new optimal level over a number of periods. If producers are technically efficient then the
quantity adjustment path will follow the boundary of the transformation frontier. However,
corresponding to each point on the boundary of the transfonnation frontier there will be a
nonnal vector of prices for which that quantity decision is optimal. Hence, a planning prke path
FlBRBSUBSllTUTION IN THE UK WORSTEOSP.INNINGSECfOR 19
which approaches the new price vector will be a dual representation of, and observationally equivalent to, an optimal adjustment path.
The planning price approach has the advantage, over early attempts to model quantity adjustment paths, of automatically ensuring technical efficiency at each point. It has the dis~.dvantage that an adjustment relationship of planning to actual prices must be specified to make the approach operational. This introduces a degree of arbitrariness.
In this application the following adaptive price adjustment model is used.
(6.1) Clu - ~.t-l = Ai (Pit - ~.t-)
where the CIu are planning prices and Pit actual prices. If Ai = 1 then adjustment of planning to actual prices is instantaneous. For the adjustment process to be stable the adjustment parameters A must lie in the interval (0,2), If A is in the range (0, 1) then adjustment to the new price is
i i
monotonic while it is cyclical if Ai is in the range (1, 2), To make this mechanism implementable the following version is estimated:
(6.2) a. = A. I t-l (1- ,,-.)J P . + (1- A)' a. -~ i 1=0 1 t-J i ~o
where the base period planning price qio is treated as a parameter and estimated along with the adjustment coefficient A. .• Embedding this pric.e relationship within a standard functional form
1
for the cost function means that non-linear regression techniques must be used. The Davidson-
Fletcher-Powell non-linear algorithm in the SHAZAM package was again used
The planning price model estimated uses a unit Generalised Leontief cost function. Given the computational complexity of the estimation procedure, use of the Generalised McFadden form would be prohibitive. Although the number of parameters to be estimated is only increased by
two for each price term, if there are 20 observations there are now around 20 highly non-linear components within each planning price. A functional fonn which is sparing in its use of price terms is thus required. The translog fonn is not suited to the planning price procedure because the dependent variables of the share equations contain the planning price terms which are not
known before estimation.
Estimation of a six fibre input demand system analogous to that of the preceding section is also computionally prohibitive. Consequently, the three major fibres (crossbred and merino wools and acrylic) were included in the planning price model estimated. Constant returns to scale were imposed with respect to the aggregate consumption of these fibres. TIie three minor fibres (hair, polyester and nylon) were assumed to enter in fixed proportions to outpuL
FIBRE SUBS1TIUIlON IN1lIE UK WORSIlID SPINNING SECfOR 20
The 3 fibre unit Generalised Leontief cost function is given by:
(6.3) C(p,y) I y = I:=1 I ;=1 bij ~tqjt + I:=1 bit ~t + I:=l bin ql where time subscripts have been deleted, y is the aggregate consumption of wool and acrylic
fibres and the ~ are planning prices as given by (6.2). The parameters bij satisfy the following symmetry restriction:
(6.4) b = b ij ji
for all i,j = 1, 2, 3.
The fibre demand equations derived from (6.3) by differentiating with respect to prices are: 1
(6.5) x.1 y = I ~ b. (q.l qJ2 + b. t + b. t2 ; i = 1,2,3. 1 J=1 d J 1 It 111
The estimating system thus consists of (6.5) subject to (6.4) where the planning prices are
given by (6.2). The parameters of the net output supply equations (bi;, bit and bin)' the planning
price adjusbllent coefficients (A.i) and the base period planning prices (~o) are all chosen
simultaneously to maximise the concentrated likelihood function of (6.5).
Estimation of this model enables tests to be carried out of the validity of the instantaneous
adjusbllent model nonnally used by testing whether A.. = 1 for i = 1, 2, 3. The relationship I
between planning and actual prices, and instantaneous and imperfect quantity adjustment paths,
will be plotted by tracking the effects of simulated price changes.
6.2 Results
The maximum likelihood parameter estimates for the Generalised Leontief models using both
actual prices and planning prices are presented in Table 6.1. Both estimated cost functions are
positive at all observation points and satisfy the curvature requirements of being concave in
prices at all observation points. The gradients with respect to prices have the correct signs and
so both estimated cost functions are well behaved. The non-linear model was estimated using
the linear estimates of the instantaneous adjustment model as starting values for the price and
technology parameters in the planning price model along with values of 0.8 and 1.0 for the
adjusttnent coefficients and base period planning prices, respectively.
FIBRE SUBS1.TIUIlON IN 1HEUK WORS11ID SPINNING SECIOR 21
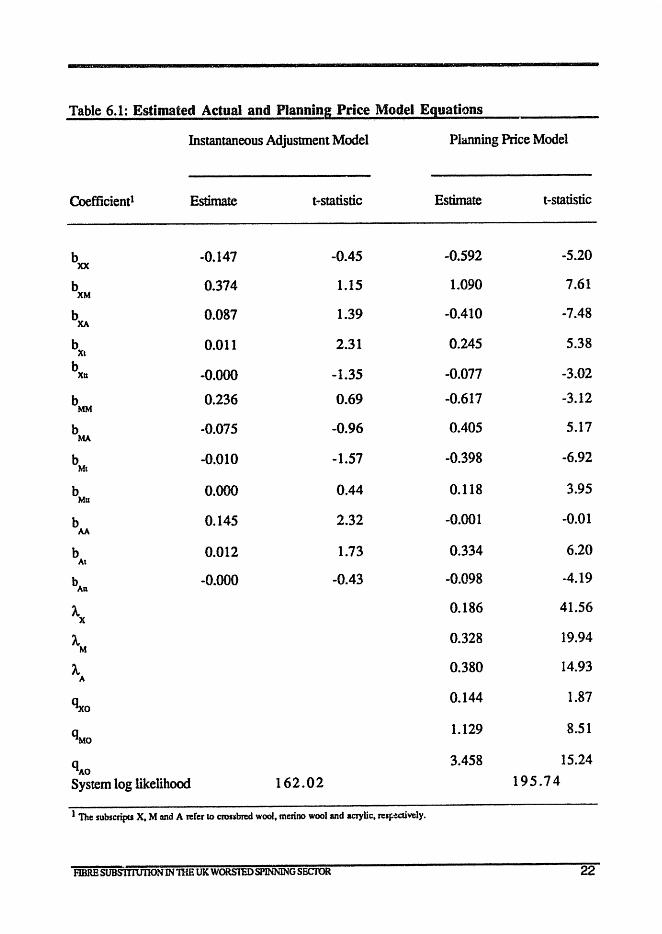
Table 6.1: Estimated Actual and Planning Price Model Equations
Instantaneous Adjustment Model Planning Price Model
Coefficientl Estimate t-statistic Estimate t -statistic
bxx -0.147 -0.45 -0.592 -5.20
b XM
0.374 1.15 1.090 7.61
b 0.087 1.39 -0.410 -7.48 XA
b Xl
0.011 2.31 0.245 5.38
b -0.000 -1.35 -0.077 -3.02 Xu
bMM
0.236 0.69 -0.617 -3.12
b -0.075 -0.96 0.405 5.17 MA
b -0.010 -1.57 -0.398 -6.92 Mt
b Mu
0.000 0.44 0.118 3.95
b 0.145 2.32 -0.001 -0.01 AA
b 0.012 1.73 0.334 6.20 At
bAil -0.000 -0.43 -0.098 -4.19
A 0.186 41.56 X
A.M 0.328 19.94
A. 0.380 14.93 A
£lxo 0.144 1.87
qMO 1.129 8.51
qAO 3.458 15.24
System log likelihood 162.02 195.74
1 The subscripts X, M and A refer to cronbrcd wool, merino wool and acrylic, reSf«uvely.
FIBRE SUBSiTIurIoN INmB UK WORSIlIDSPINNlNG SECTOR 22
The first result of interest to be examined is whether the two models are significantly different; ie., are the adjustment coefficients in the planning price model significantly different from 1.0 indicating that imperfect adjustment is of importance? The hypothesis that all adjustment coefficients are equal to unity (subject to the base period planning prices being unrestricted) may be tested. by use of the likelihood ratio test The test statistic has a value of 67.44 (twice the difference between the two log likelihood values) compared to a 1 per cent critical Chi .. square value of 11.34 with 3 degrees of freedom. Consequently, the hypothesis of instantaneous adjustment is strongly rejected by the model. This indicates that it is important to allow for imperfect adjustment when modelling fibre substitution and fibre demand response. This result is not unexpected but it remains to establish whether the planning price model provides
reasonable estimates of the imperfect adjustment process.
As the base period planning prices are estimated in this model, examination of the estimated base period values and the relationship between actual prices and the estimated planning price series provides one method of checking the reasonableness of the model. In the estimated model the base period planning price refers to the planning price for the year 1970. While the complete data set was only available from 1971 onwards it is reasonable to assume that the actual prices prevailing in 1970 would be close to the 1971 price index values of 1.0. The base period planning price estimated for merino wool is around 1.1 which is close to what might be
expected. The estimated initial prices for crossbred wool and acrylic fibre, however, appear less reasonable with values of around 0.1 and 3.5, respectively. The high value for acrylic fibre is
particularly implausible.
Comparisons of the actual price and estimated planning price series for the observation period tend to confmn these impressions. The planning price series for merino wool closely follows the actual price series, ranging from 1.08 to 6.19 compared to the actual price range of 1.00 to 6.21. Crossbred wool planning prices also follow but lag further behind actual prices, ranging
from 0.30 to 4.89 compared to the actual price range of 1.00 to 5.20. Acrylic fibre planning prices, however, track actual acrylic prices less well, being considerably higher than actual
prices for the fIrst half of the period. These comparisons would appear to indicate that less reliance can be placed on the model's results with regard to acrylic fibre than its predictions for
both merino and crossbred we)1.
The parameter estimates of most interest in the model are those of th~ planning price adjustment coefficients. Using one interpretation, these parameters indicate how quickly planning prices change when there is a. change in the actual price. The three parameters all lie in the range (0, 2)
FIBRE St.1BS1TIU11ON IN1llE UK WORS1liOSPINNING SECIOR 23
required for stability of the adjustment process. Furthennore, they all lie in the range (0, 1)
indicating that adjustment in all three cases is monotonic rather than cyclical. All three
adjustment coefficients are relatively low indicating that it takes considerable time for
adjustment to a relative price change to work its way through the system. The demand for
crossbred wool is the slowest to adjust with an estimated adjustment coefficient of around 0.2.
Starting from a position of longrun equilibrium where the initial actual and planning prices are
equal, a decrease in the actual price of crossbred wool of 10 per cent would lead to a decrease in
the planing price of 2 per cent in the fmt period. The adjustment of the planning prices to the
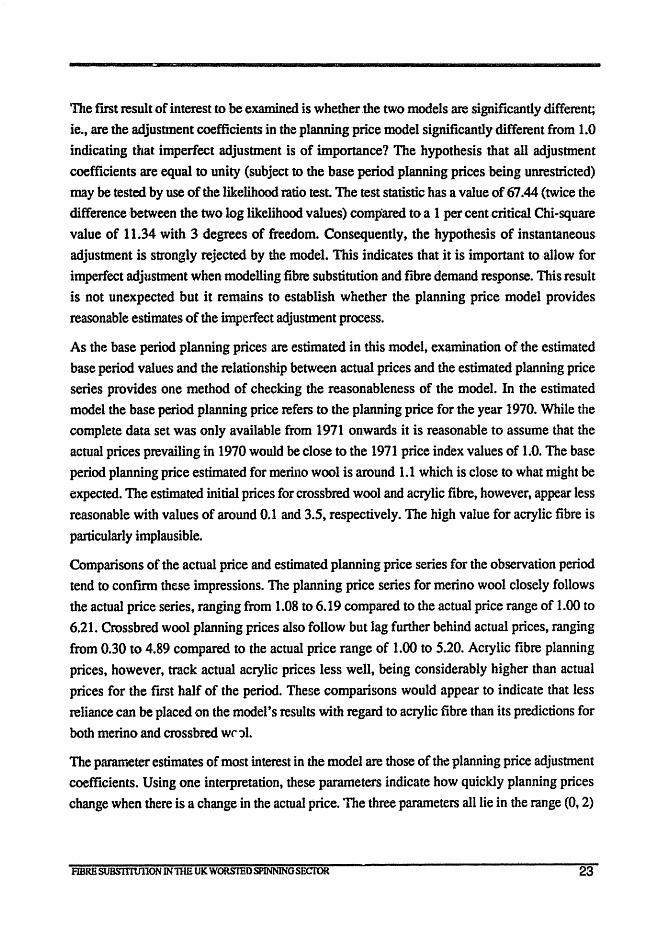
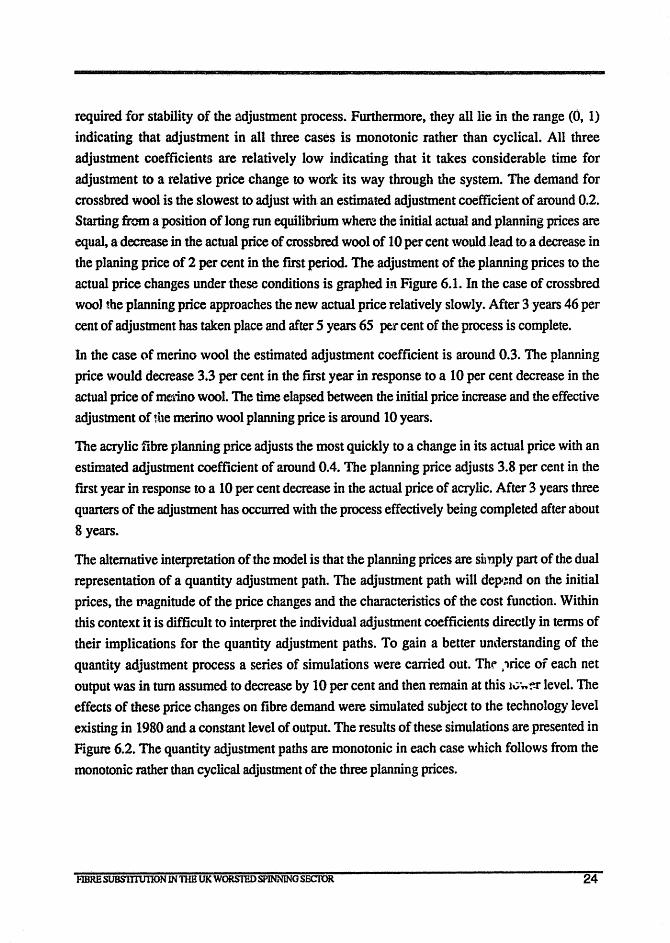
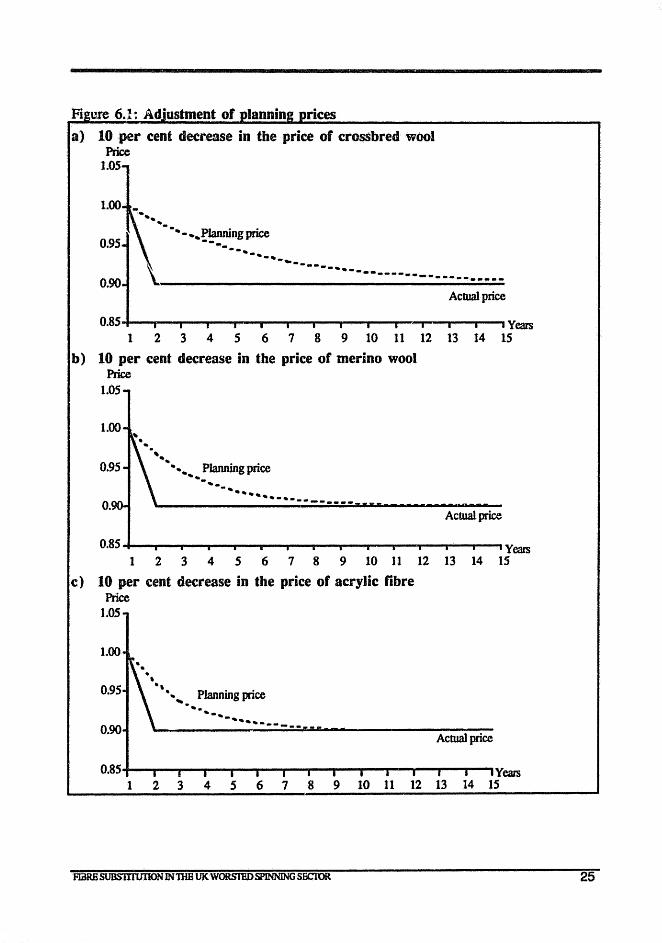
actual price changes under these conditions is graphed in Figure 6.1. In the case of crossbred woo) the planning price approaches the new actual price relatively slowly. After 3 years 46 per
cent of adjustment has taken place and after 5 years 65 per cent of the process is complete.
In the case of merino wool the estimated adjustment coefficient is around 0.3. The planning
price would decrease 3.3 per cent in the first year in response to a 10 per cent decrease in the
actual price of meiino wool. The time elapsed between the initial price increase and the effective
adjustment of the merino wool planning price is around 10 years.
The acrylic fibre planning price adjusts the most quickly to a change in its actual price with an
estimated adjustment coefficient of around 0.4. The planning price adjusts 3.8 per cent in the
first year in response to a 10 per cent decrease in the actual price of acrylic. After 3 years three
quarters of the adjustment has occurred with the process effectively being completed after about
8 years.
The alternative interpretation of the model is that the planning prices are sil nply part of the dual
representation of a quantity adjustment path. The adjustment path will depr.nd on the initial
prices, the magnitude of the price changes and the characteristics of the cost function. Within
this context it is difficult to interpret the individual adjustment coefficients directly in terms of
their implications for the quantity adjustment paths. To gain a better understanding of the
quantity adjustment process a series of simulations were carried out. Thr .,rice of each net
output was in turn assumed to decrease by 10 per cent and then remain at this lv,""f.f level. The
effects of these price changes on fibre demand were simulated subject to the technology level
existing in 1980 and a constant level of output The results of these simulations are presented in
Figure 6.2. The quantity adjustment paths are monotonic in each case which follows from the
monotonic rather than cyclical adjustment of the three planning prices.
FlBRESUBS1TlUIlON IN mE UK WORSTED SPlNNlNG SECIOR 24
rices
a) 10 per cent decrease in the price of crossbred wool Price
1.05
1.00 -.... .... - - .. - .... Planning price -. -. --._-0.95
--.----_._--.. _---------------------0.90
Actual price
0.85 =y= • Years 1 2 3 4 5 6 7 8 9 10 11 12 13 14 IS
b) 10 per cent decrease in the price of merino wool Price
1.05
o. Actual price
0.85 -i-_-__ ....... ___ ~ __ - ___ - __ _r-...___....-...,...--. Years
123 4 5 6 7 8 9 10 11 12 13 14 15
c) 10 per cent decrease in the price of acrylic fibre Price
1.05
1.00
0.95
0.90
. . . , ., ... Planning price
' . ... -.-., ... --------Actual price
0.85 Years 1 2 3 4 5 6 7 8 9 10 11 12 13 14 15
FIilRESUBSlTIlJllON IN1lIB UKWORSTEDSPlNNING SECTOR 25
Pi ure 6.2: Adoustment of uantities a) 10 per cent decrease in the price of crossbred wool
b)
c)
Quantity Index Crossbred 1.15
o.
.-,,------ -.---'. -~-__ --._ •• _. Acrylic .---_.. ---",#--.---~--------- -~~---.------- ----.- .--...... _",,,,
•• ----.. _--- .. -._----._---
- Instantaneous Adjustment
- --- Imperfect Adjustment
-------------------------Merino
0~5+-~--T-~--r_~~----~~--~~--~_r--r_~Y~
1 2 3 4 5 6 7 8 9 10 11 12 13 14 15 10 per cent decrease in the price of merino wool Quantity Index
1.2
1.1
1.0
0.9
0.8
0.7
-- .. r __ _
. -.-----~------' .. -. ---... -------_·-··--.a .. '-
Merino
Acrylic
Crossbred
0.6 +-..... - ____ -...---1'-..... __ - ..... --1'-............. --.---,.----, Years
1 2 3 4 5 6 7 8 9 10 11 12 13 14 15 10 per cent decrease in the price of acrylic fibre Quantity Index 1.10
l.05 . . ,,-l ,
.. .. ",.
",-
.- .------------Crossbred
Acrylic 1.OO~------------------
Merino
0.95 Yeas 2 3 4 5 6 7 8 9 10 11 12 13 14 15
FIBRBSUBSlTIUIlON IN mE UK WORSTED SPINNING SECTOR 26
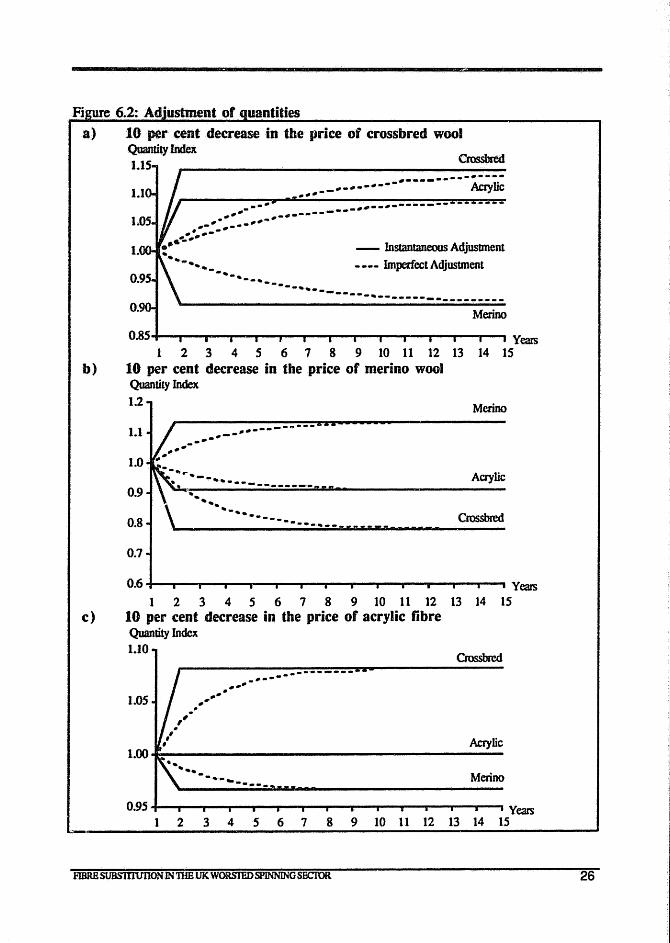
Adjustment of fibre quantities to a 1 o per cent decrease in the relative price of crossbred wool is
again slow t taking many years to be completed. Demand for crossbred wool increase~ substantially in the long-run but this takes a number of years to be felt. Acrylic demand al increases eventually while demand for merino wool falls. The reverse occurs in response to a tOper cent decline in the relative price of merino wool. Demand for merino wool increases
substantially while demand for acrylic and crossbred wool both fall. In this case the response to the relative price change occurs m07e quickly and a large proportion of the response has been
completed after 5 years. The response time is quickest to a fall in the relative price of acrylic
although this had negligible impact on the demand for acrylic itself. There is, however, some
change in the composition of wool demand. These results serve to highlight the fact that it will take several years for the large falls in wool prices following abandonment of the Reserve Price Scheme to be fully translated into increased demand for wool by processors.
Finally, the conventional fibre demand elasticities obtained from the two models are presented in Table 6.2. It should be noted that the instantaneous adjustment model elasticities represent
the one period response to a change in actual prices while the planning price model elasticities
represent the response to a change in the planning price, not the actual price, and can be
interpreted as long-run elasticities. Accordingly, the planning price model own-price elasticities
are all substantially larger than the corresponding instantaneous adjustment elasticities because considerably more adjustment is allowed for in the planning price case. In the case of crossbred wool the long-run demand elasticities is around twice the size of the instantaneous adjustment elasticities with a value of -1.1. The merino wool long-run demand elasticity is around four times the size of the instantaneous adjusttnent elasticity with a value of -1.5. Although the long
run acrylic fibre demand elasticity is around twice the magnitude of the equivalent instantaneous
adjustment elasticity, both elasticities are very small.
The long-run cross-price elasticities are also considerably larger than their instantaneous adjustment equivalents. The two wool types are considerably more substitutable in the long
run. The relationship between acrylic and the two wool types reverses between the two models.
In the instantaneous adjustment model the relationship between acrylic and wool is weak with acrylic being slightly complementary with merino wool. In the long-run, planning price case acrylic is found to be complementary with crossbred wool and to exhibit significant substitutability with merino wool. The results regarding acrylic have to be interpreted with caution given the relatively poor correspondence between planning and actual prices. The
pattemand size of elasticities in the instantaneous adjustment model is generally similar to that
FlBREstJBSlYIUllON INnmUK WORSTEDSPlNNlNGSECIOR 27
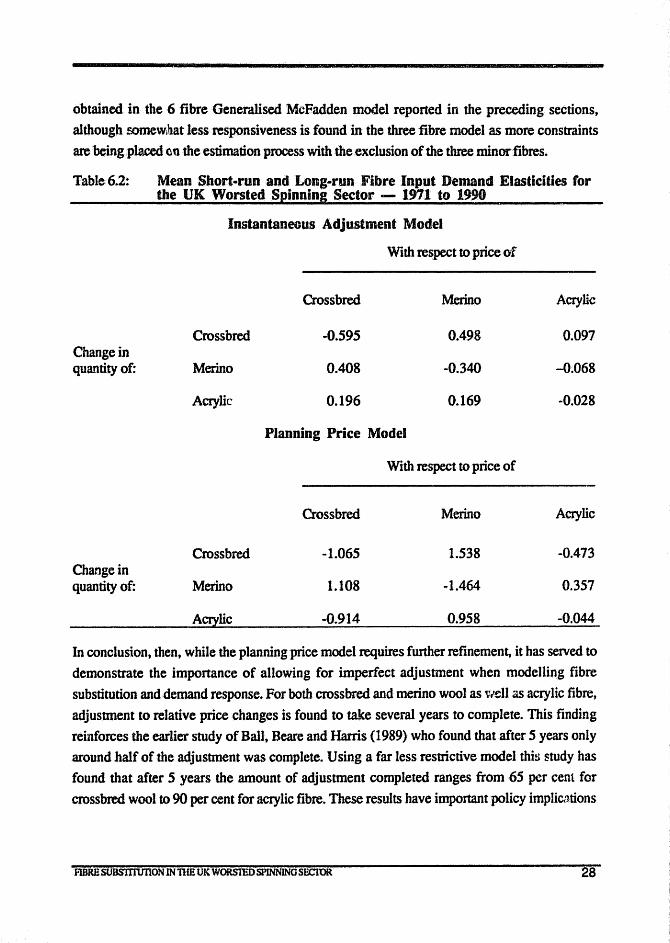
obtained in the 6 fibre Generdlised McFadden model reported in the preceding sections, although romeWlhat less responsiveness is found in the three fibre model as more constraints are being placed (lQ the estimation process with the exclusion of the three minor fibres.
Table 6.2:
Change in quantity of:
Chaogein quantity of:
Mean Short-run and Long-run Fibre Input Demand Elasticities for the UK Worsted Spinning Sector - 1971 to 1990
Instantaneous Adjustment Model
With respect to price of
Crossbred Merino Acrylic
Crossbred -0.595 0.498 0.097
Merino 0.408 -0.340 -0.068
Acrylic 0.196 0.169 -0.028
Planning Price Model
With respect to price of
Crossbred Merino Acrylic
Crossbred -1.065 1.538 -0.473
Merino 1.108 -1.464 0.357
Acrylic -0.914 0.958 -0.044
In conclusion, then, while the planning price model requires further refinement, it has served to
demonstrate the importance of allowing for imperfect adjustment when modelling fibre
substitution and demand response. For both crossbred and merino wool as well as acrylic fibre,
adjustment to relative price changes is found to take several years to complete. This finding
reinforces the earlier study of Ball, Beare and Harris (1989) who found that after 5 years only around half of the adjustment was complete. Using a far less restrictive nrodel this study has found that after 5 years the amount of adjustment completed ranges from 65 per cent for
crossbred wool to 90 per cent for acrylic fibre. These results have important policy implic.ltions
FIBRE st1BS1TIUJlON INnlE UK WORSIEDSPINNING SECIOR 28
for the Australian wool industry. It will take a lengthy period for the effects of the large price
reductions following the collapse of the Reserve Price Scheme to work their way through into
increased demand for wool by processors.
7. Forecasting Wool's Worsted Market Share
The estimated model provides insights into how movements in relative fibre prices affect fibre
demand - given that the total demand for fibre is held constant. However, fibre price
movements also affect retail prices which indirectly affects fibre demand via changes in retail
demand. These so-called 'expansion' effects need to be takertinto account to obtain the
complete picture of the effect of fibre price changes on fibre demand.
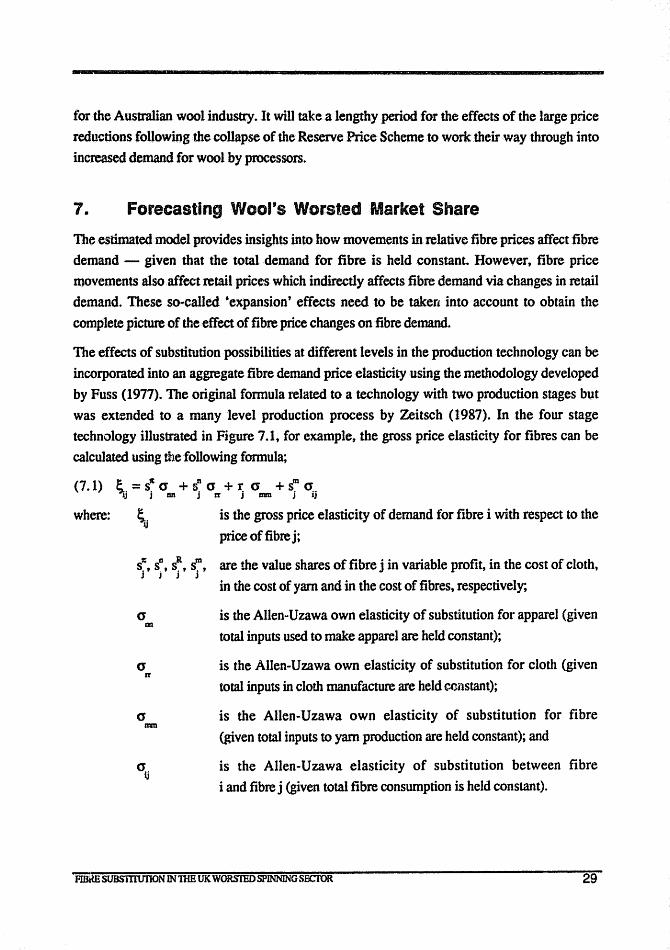
The effects of substitution possibilities at different levels in the production technology can be
incorporated into an aggregate fibre demand price elasticity using the methodology developed
by Fuss (1977). The original fonnula related to a technology with two production stages but
was exrendedto a many level production process by Zeitsch (1987). In the four stage
technology illustrated in Figure 7.1, for example, the gross price elasticity for fibres can be
calculated using the following fonnula;
(7.1) ;" = s~ a + SD a + t: (J + s~ a,. lJ J nn j It J mm J lJ
where: is the gross price elasticity of demand for fibre i with respect to the
price of fibre j;
Sf; SD SR sm are the value shares of fibre J' in variable profit, in the cost of cloth, j'j'j'j'
in the cost of yam and in the cost of fibres, respectively;
a is the Allen~Uzawa own elasticity of substitution for apparel (given m
total inputs used to make apparel are held constant);
a is the Allen-Uzawa own elasticity of substitution for cloth (given It
total inputs in cloth manufacture are held CCllstant);
(J is the Allen-Uzawa own elasticity of substitution for fibre mm
(given total inputs to yarn production are held constant); and
aij
is the Allen-Uzawa elasticity of substitution between fibre
i and fibre j (given total fibre c.onsurnption is held constant).
Fi'iimSUBS1llUfiON INnIE UK WORSTED SPINNING SECfOR 29
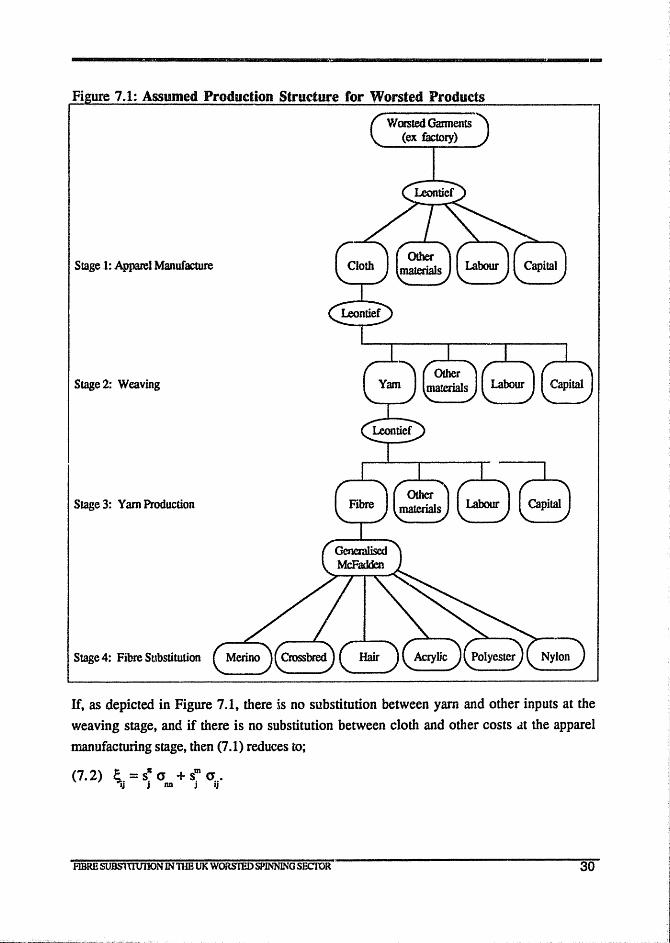
----------------------------------------------------------------Fi ure 7.1: Assumed Production Structure for Worsted Products
Stage 1: Apparel Manufacture
Stage 2: Weaving
Stage 3: Yarn Production
Stage 4: Fibre Substitution
If, as depicted in Figure 7.1, there is no substitution between yarn and other inputs at the
weaving stage, and if there is no substitution between cloth and other costs .1t the apparel
manufactuting stage, then (7.1) reduces to;
(7. 2) ~ = s· a + s~ 0 .. _ lj jnn J lJ
FlBRB SUJlS1TIUJ1ONIN nIB UK WORS'IED SPINNING SECfOR 30
In tenns of price elasticities (7.2) can be rewritten as;
(7.3) ~ = s; ~~ + "\j where SC is the share of the j th fibre in total garment costs, ~B is the ex-factory demand
j M
elasticity for apparel and '\ is the cympensated price elasticity of demand fcrt;'bre i with respect to the price of fibre j.
The first tenn in (7.3) captures the effect of fibre price movements on the aggregate demand for apparel. The second term picks up the effects of substitution amongst fibres gel1erated by fibre price movements.
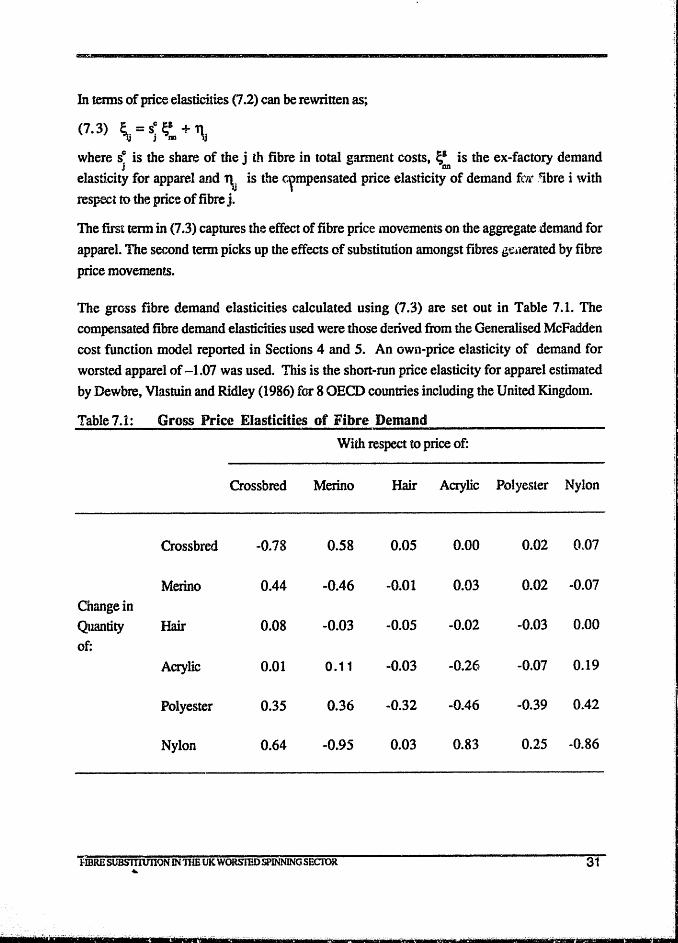
The gross fibre demand elasticities calculated using (7.3) are set out in Table 7.1. The compensated fibre demand elasticities used were those derived from the Generalised McFadden cost function model reponed in Sections 4 and 5. An own-price elasticity of demand for worsted apparel of -1,(17 was used. This is the short-run price elasticity for apparel estimated by Dewbre, Vlastuin and Ridley (1986) for 8 OECD countries including the United Kingdom.
Table 7.1: Gross Price Elasticities of Fibre Demand
With respect to price of:
Crossbred Merino Hair Acrylic Polyester Nylon
Crossbred -0.78 0.58 0.05 0.00 0.02 0.07
Merino 0.44 -0.46 -0.01 0.03 0.02 -0.07
C"hangein Quantity Hair 0.08 -0.03 -0.05 -0.02 -0.03 0.00
of: Acrylic 0.01 0.11 -0.03 -0.26 -0.07 0.19
Polyester 0.35 0.36 -0.32 -0.46 -0.39 0.42
Nylon 0.64 -0.95 0.03 0.83 0.25 -0.86
FIBRE SUBS1TIUIlQN lN1HB UK WORSllID SPINNINGSEcroR 31 ...
These gross price elasticities can be used to calculate tbegain in market share which wool is
likely to achieve following the abandonment of the wool Reserve Price Scheme in February 1991.
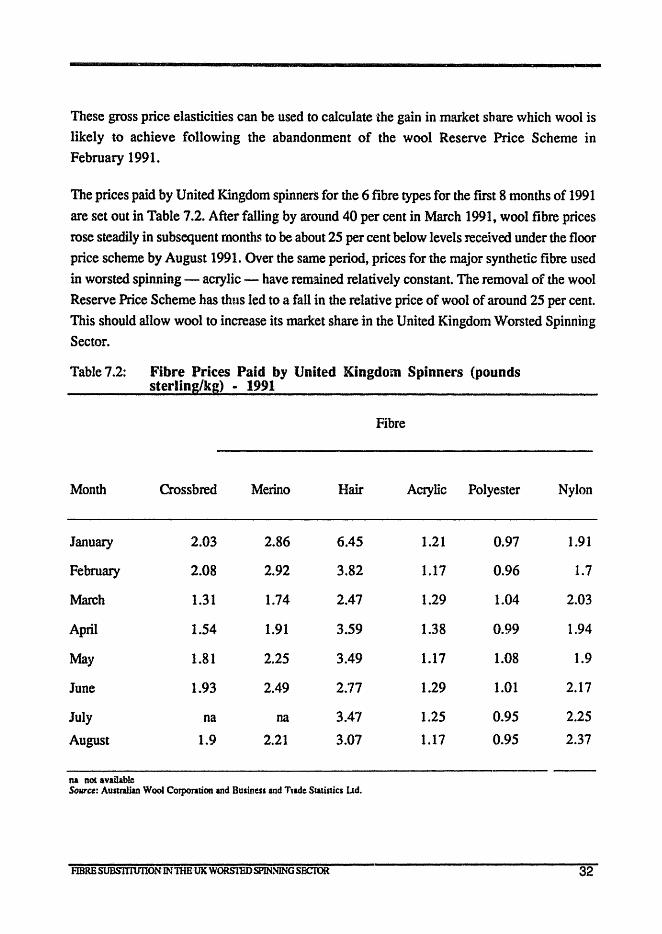
The prices paid by United Kingdom spinners for the 6 fibre types for the first 8 months of 1991
are set out in Table 7.2. After falling by around 40 per cent in March 1991, wool fibre prices
rose steadily in subsequent months to be about 25 per cent below levels received under the floor
price scheme by August 1991. Over the same period, prices for the major synthetic fibre used
in worsted spinning - acrylic - have remained relatively constant. The removal of the wool
Reserve Price Scheme has thus led to a fall in the relative price of wool of around 25 per cent.
This should allow wool to increase its market share in the United Kingdom Worsted Spinning
Sector.
Table 7.2: Fibre Prices Paid by United Kingdom Spinners (pounds sterling/kg) • 1991
Fibre
Month Crossbred Merino Hair Acrylic Polyester
January 2.03 2.86 6.45 1.21 0.97
February 2.08 2.92 3.82 1.17 0.96
March 1.31 1.74 2.47 1.29 1.04
April 1.54 1.91 3.59 1.38 0.99
May 1.81 2.25 3.49 1.17 1.08
June 1.93 2.49 2.77 1.29 1.01
July na na 3.47 1.25 0.95
August 1.9 2.21 3.07 1.17 0.95
na not available SOUTee: Australian Wool Corporation and Business and Ttadc Statistics lJd.
FIBRESUBS1TIUIlON IN TIm UK WORS'IED SPINNING SECrOR
Nylon
1.91
1.7
2.03
1.94
1.9
2.17
2.25
2.37
32
The fibre price information in Table 7.2 can be combined with the estimated price elasticities in
Table 7.1 to forecast what recent fibre price movements imply for wool's market share in the
worsted spinning sector. Specifically, the percentage change in fibre ~hares can be calculated as follows:
! (7.4) Xi = ~;.. Pit
(7.5) i = ~ s i f.:t j j
(7.6) n1s = i -i i i
where: X. is the percentage change in the demand for fibre i; 1
Pit is the percentage change in the price of the k th fibre;
x is the percentage change in aggregate fibre demand;
s is the value share of the j th fibre in total fibre costs; and j
ms. is the percentage change in the volume market share of the ith fibre. 1
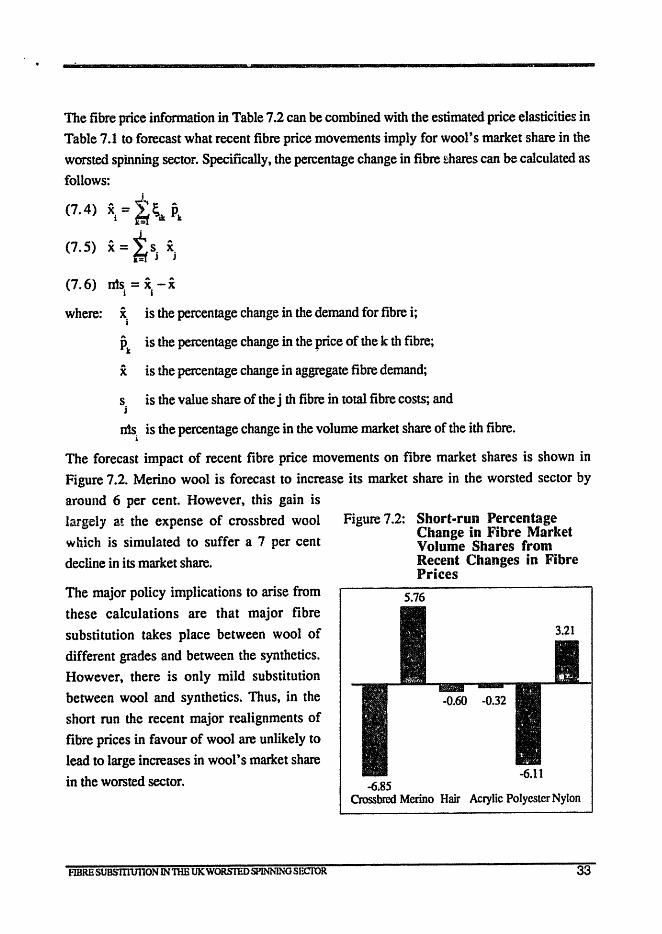
The forecast impact of recent fibre price movements on fibre market shares is shown in
Figure 7.2. Merino wool is forecast to increase its market share in the worsted sector by
a.round 6 per cent. However, this gain is
largely at the expense of crossbred wool
which is simulated to suffer a 7 per cent
decline in its market share.
The major policy implications to arise from
these calculations are that major fibre
substitution takes place between wool of
different grades and between the synthetics. However, there is only mild substitution
between wool and synthetics. Thus, in the
short run the recent major realignments of
fibre prices in favour of wool are unlikely to
lead to large increases in wool t s market share
in the worsted sector.
FIBRE SUBSITIUI10N INTImUKWORSrnDSPINNlNG SECTOR
Figure 7.2:
-6.85
Short-run Percentage Change in Fibre Market Volume Shares from Recent Changes in Fibre Prices
Crossbred Merino Hair Acrylic Polyester Nylon
33
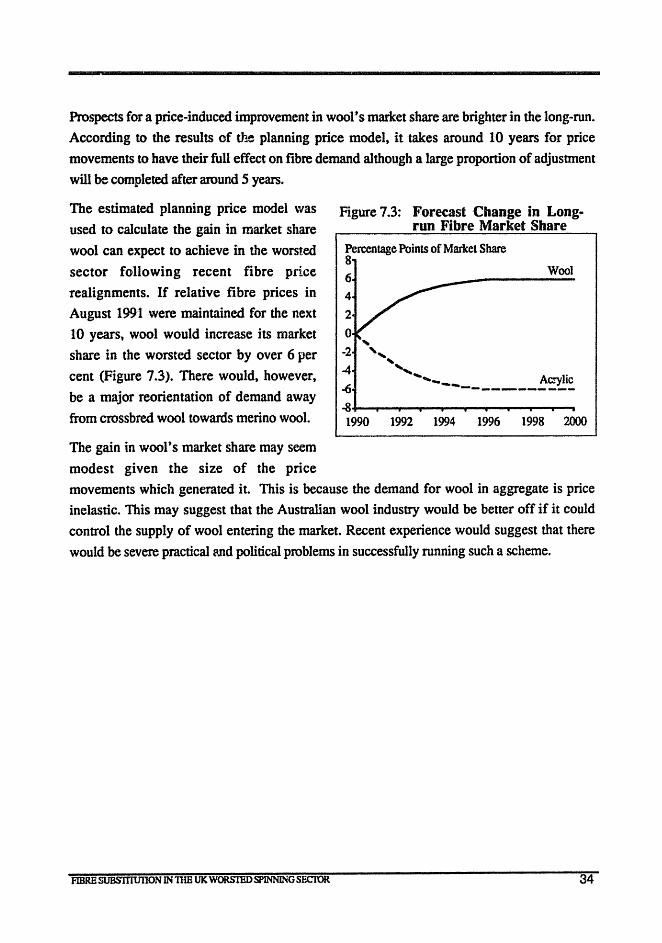
Prospects for a price~induced improvement in wool's market share are brighter in the long-run.
According to the results of the planning price model, it takes around 10 years for price
movements to have their full effect on fibre demand although a large proportion of adjustment
will be completed after around 5 years.
The estimated planning price model was Figure 7.3: Forecast Change in Long-used to calculate the gain in market share run Fibre Market Share
wool can expect to achieve in the worsted
sector following recent fibre price
realignments. If relative fibre prices in
August 1991 were maintained for the next
10 years, wool would increase its market
share in the worsted sector by over 6 per
cent (Figure 7.3). There would, however,
be a major reorientation of demand away
from crossbred wool towards merino wool.
The gain in wool's market share may seem
modest given the size of the price
Percentage Points of Market Share 8 6 4
2
o -2
4
-6
, "
Wool
, , ..... .... ___ Acrylic
-~-------- .. ~+-~~~~~-r~--P-~~~ 1990 1992 1994 1996 1998 2000
movements which generated it. This is because the demand for wool in aggregate is price
inelastic. This may suggest that the Australian wool industry would be better off if it could
control the supply of wool entering the market. Recent experience would suggest that there
would be severe practical and political problems in successfully running such a scheme.
FIBR£SUBS1TlUIlON IN nIB UK WORS'IlIDSPlNNlNGSECTOR 34
APPENDIX 1: DATA SOURCES
To estimate the fibre substitution models" data is required on the price and quantity of each fibre consumed by the UK worsted spinning sector. Annual data forthe 20 year period 1971 to 1990
on the actual weight offibreconsumed in the production of tops and noils was obtained from the UK Wool Industry Bureau of Statistics (Confederation of British Wool Textiles Limited,
various years). Consistent time-series infonnation is available for three wool, two hair and four man-made fibre categories. The two crossbred wool categories were aggregated to fonn a total crossbred series as were the mohair and other hair categories to form a total hair series. Information on the consumption of synthetic fibres was available for acrylic, polyester, nylon and other man-made fibres. The other man-made fibres category was combined with the polyester series with which it moved in unison.
The price of crossbred and merino wool fibre was taken to be the Australian auction price plus transport margins converted to pounds Sterling using annual exchange rate data. Annual
average Australian auction prices for 23 and 27 micron grade wool were obtained from
Australian Wool Corporation (various years) and used as proxies for the price of merino and crossbred wool, respectively. Transport margins between Australia and the UK were approximated by sea freight rates for wool obtained from Gabtys (1991). Exchange rates were
obtained from OECD (various years).
Comparable prices of synthetic and hair fibre were obtained from UK import statistics. Standard International Trade Classification (SITC) categoty 266.5 provides information on
"synthetic staple fibres, not carded, combed or otherwise processed for spinning" while the
subcategories 266.51,266.52 and 266.53 provide infonnation on nylon, polyester and aCt:ylic,
respectively. Separate information fOl" each of the subcategories was available for the period 1978 to 1990 but only the aggregate of the three was available for the years 1971 to 1977.
Prices for the earlier years were estimated by regressing the prices of the three components against the total synthetic price for the years 1978 to 1990 and forecasting the individual prices
given the known aggregate price for the earlier period. SITC category 268.3 provides information on "fine animal hair, not carded or combed". The UK import data were obtained
from Business and Trade Statistics Limited of Surrey_
FIBRBSUBS1TIUJlON IN nIB UK WORSTED SPINNING SECroR 35

REFERENCES
Australian Wool Corporation (various years), Wool Market News Annual Price Summary, Melbourne.
Ball, K., S. Beare and D. Harris (1989), 'The Dynamics of Fibre Substitution in the Raw Fibre
Market: A Partial Adjustment Translog Model', Contributed Paper to Conference of Economists, Adelaide.
Confederation of British Wool Textiles Limited (various years), Wool Industry Bureau of Statistics Monthly Bulletin of Statistics.
Dewbre, J., C. Vlastuin and H. Ridley (1986), 'An Analysis of Demand for Apparel and
Apparel Fibre including Wool', Contributed Paper presented to the 30th Annual
Conference of the Australian Agricultural Economics Society, Canberra.
Diewert, W.E. (1974), "Applications of Duality Theory", in M.D. Intrilligator and D.A.
Kendrick (eds), Frontiers of Quantitative Economics, vol. II, North-Holland, Amsterdam,
pp. 106-171.
Diewert, W.E. and C.J. Morrison (1986), 'Export Supply and Import Demand Functions: A
Production Theory Approach', Depanment of Economics Discussion Paper No. 86-10,
University of British Columbia.
Diewert, W.E. and T.J. Wales (1987), 'Flexible Functional Forms and Global Curvature
Conditions', EcoMmetrica 55, 43~68.
Egan, H. (1991), 'Fibre Share Statistics', Australian Wool Corporation, April.
Fuss, M.A. (1977), ''The Demand for Energy in Canadian Manufacturing: an Example of the
Estimation of Production Structures with Many Inputs", Journal of Econometrics 5, 89-116.
Gabrys, M. (1991), 'Sea Freight Rates for Wool', Australian Wool Corporation, facsimile
communication.
Griffith, R., M. Potter and B. Corbman (1970), Fibre to Fabric, McGraw-HilI, Sydney.
Harris, D. (198~), 'Substitution between Raw Fibres: Apparel Manufacturing in the United
States', MEc Thesis, Faculty of Economics and Commerce, Monash University.
FlBRESUBS'ITIUllON INnIR UK WORSllID5PJNNINGSECIOR 36
Jorgenson, D.W. and B.M. Fraumeni (1981), "Relative Prices and Technical Change", in
E. Berndt andB. Field (eds), Modelling and Measuring Natural Resource Substitution, MIT Press, Cambridge.
Kornreich,E. (1966), Introduction to Fibres and Fabrics: Their Manufacture and Properties, Heywood, London.
Lawrence, D.A. (1987), 'Export Supply and Import Demand Elasticities'. ·')hD Thesis,
University of British Columbia.
Lawrence, D.A. (1989), "An Aggregator Model of Canadian Export Supply and Import
Demand Responsiveness", Canadian Journal ufEconomics 22,503-21.
Lawrence,D.A. (1990a), "An Adjustment Costs Model of Expon Supply and Import
Demand", Journal of Econometrics 46, 381-98
Lawrence, D. (l990b), 'A Generalised McFadden. Cost Function for Australian Agriculture"
Contributed Paper to the 34th Annual Conference of the Australian Agricultural Economics
Society, Brisbane.
Lawrence, D. (199Oc), 'The Supply Response of Australian Agricultural Exports', Contributed
Paper to the 34th Annual Conference of the Australian Agricultural Economics Society,
Brisbane.
Lawrence, D. and J. Zeitsch (1989), 'Production Flexibility Revisited', Contributed Paper to
the 33rd Annual Conference of the Australian Agricultural Economics Society,
Christchurch, New Zealand, 7-9 February.
Lawrence, D. and J. Zeitsch (1990), 'A Disaggregated Model of Agricultural Production
Response', Invited Paper Presented to the 34th Annual Conference of the Australian
Agricultural Economics Society, Brisbane.
Organisation for Economic Co-operation and Development (OECD) (1991), National Accounts, Main Aggregates 1960-1989, Vol. 1, Paris.
Shephard, R.W. (1953), Cost and Production Functions, Princeton University Press,
Princeton.
Short, C. and S. Beare (1990). 'Fibre Substitution in Retail Demand for Apparel', Contributed
Paper presented to 34th Annual Conference of the Australian Economics Society t
Brisbane.
FIBRBSUBSllIUllON IN mE UKWORSTEOSP1NNJNGSECTOR 37
Veldhuizen. J and R. Richardson (1984), 'Price Competition between Wool and Synthetic
Fibres - Some Empirical Results', Contribute\!P? :~r presented to the 28th Annual
Conference of the Australian Agricultural Economics Society,Brisbane.
White, KJ., S.D. Wong, D. Whistler and S.A. Haun (1990), SHAZAM User's Reference Manual Version 6.2, McGraw-Hill
Wiley, D.B., W.H. Schmidt and W.J. Bramble (1973), "Studies of a Class of Covariance
Structure Models",Journal o/the American Statistical Association 68,317-23.
Woodland, A.D. (1976), 'Modelling the Production Sector of an Economy: A Selective Survey
and Analysis', Department of Economics Working Paper No. 76-21, University of British
Columbia.
Woodland, A.D. (1977), "Estimation of a Variable Profit and of Planning Price Functions for
Canadian Manufacturing, 1947-70", CaNJdianJourna/ o/Economics 10,355-77.
Zeitsch, J. (1979), 'The Impact of Woolmark on Wool Fibre Demand in the United Kingdom
Worsted Spinning Sector' , Contributed Paper presented to 23m Annual Conference of the
Australian Agricultural Economics Society, Canberra.
Zeitsch, J. (1987), 'A Methodology to Add Input Demand Equalities to the MTM Model',
Paper prepared for Appraisal by Consultants, Directorate for Food, Agriculture and
Fisheries, OBCD, Paris, Mimeographed.
FIBRBS1.1BS1TI'U1lON IN TIm UK WORSlEDSPINNlNG SECTOR . 38