fidelity asian values plc · builder hyundai heavy industries given the ... holding in ekovest...
TRANSCRIPT
Managed by
Fidelity AsianValues PLC
Half-Yearly Report
For the 6 months ended 31 January 2011

Contents
Investment Objective & Performance Summary 1
Summary of Results 2
Half-Yearly Report 3
Directors’ Responsibility Statement 6
Twenty Largest Investments 7
Financial Statements 10
Investor Information 21
Directory 22
Warning to Shareholders –“Boiler Room”Scams 23

Investment Objective & Performance Summary
The investment objective of the Company is to achieve long term capitalgrowth through investment principally in the stock markets of the AsianRegion (excluding Japan).
Performance (on a total return basis)
Six months to31 January 2011
Net asset value (“NAV”) per share – undiluted +19.6%
NAV per share – diluted +16.5%
Ordinary share price +17.5%
MSCI All Countries (Combined)Far East Free ex Japan Index – sterling adjusted +15.4%
Standardised performance (on a total return basis %)
Year Year Year Year Yearto to to to to
31/01/07 31/01/08 31/01/09 31/01/10 31/01/11
NAV per share – undiluted +8.7 +19.4 -31.6 +72.7 +33.5
NAV per share – diluted +11.3 +19.4 -31.6 +72.7 +29.9
Share price +6.7 +20.8 -28.5 +68.3 +30.3
Sources: Fidelity and DatastreamPast performance is not a guide to future returns
Fidelity Asian Values PLC Half-Yearly Report 2011 Page 1

Summary of Results
31 January 31 July2011 2010 % change
AssetsTotal assets employed1 £150.5m £122.9m +22.5
Shareholders’ funds £141.2m £117.2m +20.5
NAV per share – undiluted 229.77p 192.19p +19.6
NAV per share – diluted2 223.58p 191.99p +16.5
Borrowings as % of shareholders’ funds 6.6% 4.9%
Borrowings less cash as % of shareholders’ funds 4.6% 3.8%
Stock market data
MSCI All Countries (Combined) Far East Free ex Japan Index3 329.33 287.48 +15.4%
Ordinary share price period end 206.50p 175.75p +17.5%
high 213.00p 189.00p
low 174.00p 136.75p
Discount to NAV – undiluted period end 10.1% 8.6%
high 11.3% 13.7%
low 7.5% 2.8%
Discount to NAV – diluted period end 7.6% 8.5%
Subscription share price period end 32.50p 19.00p
high 38.80p 31.50p
low 16.30p 19.00p
Returns for the six months to 31 January 2011 2010
Capital return per ordinary share – undiluted 38.03p 21.72p
Revenue (loss)/return per ordinary share – undiluted (0.24p) 0.16p
Total returns4 for the six months to 31 January 2011 2010
NAV per share – undiluted +19.6% +14.5%
Ordinary share price +17.5% +12.1%
MSCI All Countries (Combined) Far East Freeex Japan Index2 +15.4% +8.2%
1 total assets less current liabilities, excluding loan liability2 the diluted NAV is reported since the NAV of each of the Company’s ordinary shares exceeds the
subscription share exercise price. Hence if the subscription shares had converted into ordinary sharesat the period end date, the NAV per ordinary share would have been diluted
3 total return index, sterling adjusted4 includes reinvested income
Page 2 Fidelity Asian Values PLC Half-Yearly Report 2011

Half-Yearly Report as at 31 January 2011
PERFORMANCEFor the six months to 31 January 2011, the Company’s net asset value registereddouble-digit returns and significantlyoutperformed its benchmark. The Companyreturned 19.6%, compared with 15.4% forthe benchmark MSCI All Countries(Combined) Far East ex Japan Index. (All figures in sterling terms and on a totalreturn basis).
MARKETSFar East Pacific ex Japan equities advanced strongly over the six-monthreview period. Strong foreign inflowscharacterised the period, indicatingdemand for growth-oriented securities inthe region. Investor sentiment was boostedby the announcement of a second round ofquantitative easing in the US and renewedstrength in global recovery. There werepositive earnings from Asian companieswhich drove share prices higher. Meanwhile,investors also kept a watch on theescalating sovereign debt crisis in theEurozone and geopolitical tensions in theKorean peninsula. While investors wereconcerned about rising inflation they chose to focus on broader monetary policy,which remained largely accommodative. All sectors advanced with energy andindustrials in the forefront of gains, whiletelecommunications and utilities lagged.
Macroeconomic data for the quarter endingDecember was positive. China’s industrialproduction, retail sales, and fixed assetinvestment remained robust and surpassedconsensus expectations. Growth inindustrial output supported expansion inSingapore and South Korea. Inflation inChina, Indonesia, Korea, Malaysia, Taiwan,and Thailand escalated during the fourthquarter; central banks in China, Taiwan,
and Korea raised interest rates in response.With the exception of Singapore, exportgrowth in Asia ex Japan countriesaccelerated in November. The combinedexports of China, Korea, Singapore, Taiwan,and Thailand (accounting for three quarters of the region’s total) rose by7.3% month-on-month on a seasonallyadjusted basis, versus 3.3% in October and a 0.6% decline in September.
PORTFOLIO REVIEWThe portfolio’s overweight in consumerdiscretionary was beneficial. The position inSJM Holdings, a Macau-based casinooperator, and retail supply chain manager Li & Fung were among the top contributorsto relative returns. While the formerbenefited from an increase in earnings, thelatter’s acquisitions were endorsed byinvestors. Meanwhile, overall securityselections within financials were positive.Not holding a stake in China Life Insuranceenhanced value against the backdrop ofdwindling market share, slow premiumgrowth and an uncertain outlook for the
Fidelity Asian Values PLC Half-Yearly Report 2011 Page 3
Jul2010
Aug2010
Sep2010
Oct2010
Nov2010
Dec2010
Jan2011
+19.6%+17.5%+15.4%
Sources: Fidelity and Datastream
95
100
105
110
115
120
125
NAV
MSCI All Countries (Combined)Far East Free ex Japan Index (£)
Share price
Total return performance for the six months to 31 January 2011

Half-Yearly Report
Page 4 Fidelity Asian Values PLC Half-Yearly Report 2011
equity markets which contribute to itsearnings. Selected high conviction positionsalso contributed to relative performance.Notably, a holding in Thailand-based KrungThai Bank bolstered performance onaccount of better-than-expected profits andexpectations that strong economic growthcould help boost lending at higher margins.The overweight in information technology,in particular electronic equipmentmanufacturers such as Samsung Electronics,and non-exposure to telecommunicationsnames were also positive for performance.Conversely, the overweight stance in ChinaMerchants Bank eroded value given thetough operating environment. Additionally,share prices in car and battery producerBYD Company declined because of a fall invehicle sales. Elsewhere, non-exposure tosmartphone manufacturer HTC hurt relativeperformance as share prices surged inresponse to a sharp rise in earnings.
The portfolio continues to focus on researchdriven bottom-up stock picking. Companiesthroughout the region face a diverse set ofchallenges and opportunities with rapidlyrising inflation and restrictive monetary andregulatory policy environment on the onehand, and increased focus on infrastructureand capacity building on the other.Moreover, with consumption growth likelyto remain strong, the Manager hasincreased exposure to consumerdiscretionary and industrials. Conversely,the exposure to shares in financials andenergy was decreased to reflect slowgrowth expectations.
As companies and regional governmentembark on infrastructure and capacityexpansion, the Manager increased theholdings in machinery and construction andcivil engineering firms. The Manager
introduced a holding in South Korean shipbuilder Hyundai Heavy Industries given thestrong outlook for demand from offshore oilexploration industry and robust growth innon-shipping divisions. The Manager alsobought new positions in Malaysia-basedindustrial groups in anticipation of benefitsfrom the Economic Transformation Planannounced by the government. Theholding in Ekovest Berhad reflects thisconviction as the firm has extensiveexperience working with governmentbodies. Within consumer discretionary, theManager bought casino and resortsoperator Genting (Singapore) whichbenefits from rising consumer spending inthe region. He also bought a stake inBrilliance China Automotive Holdings whichis a luxury car distributor and is not likely tobe impacted by the ongoing bankingrestrictions. Meanwhile, the Manager sold aposition in Singapore-based bank DBSGroup Holdings in absence of any growthcatalysts and increased competition.Furthermore, he also offloaded the stake inChina Overseas Land and Investment givena lack of demand amid rising regulatoryrestrictions on the property sector.
OUTLOOK FOR THE REGIONLoose monetary policies and increasingmoney supply in the west are making theirway into South East Asia, attracted byhigher relative growth, which is resulting in rising asset prices and inflationarypressures. This, in turn, could lead to short-term corrections in equity valuations.Nevertheless, healthy financial systems,robust domestic demand, low debt levelsand high savings rates are all likely tosupport a multi-year growth cycle in Asia.Moreover, recent economic data, includingindustrial production and consumption,have also created room for local central

Half-Yearly Report
banks to further tighten their monetarypolicy. Given this environment, a bottom-upstock picking approach is most suitable toidentify companies that have the potentialto deliver strong long-term growth.
PRINCIPAL RISKS ANDUNCERTAINTIESThe Board believes that the principal risksand uncertainties faced by the Companycontinue to fall in the following categories;market risks, performance risks, income-dividends risks, share price risks, gearingrisks and control systems risks. Informationon each of these is given in the BusinessReview section of the Annual Report for theyear ended 31 July 2010.
GOING CONCERNThe Board receives regular reports from theManager and the Directors have areasonable expectation that the Companyhas adequate resources to continue inoperational existence for the foreseeablefuture. Thus they continue to adopt thegoing concern basis of accounting inpreparing the financial statements asoutlined in the Annual Report for the yearended 31 July 2010.
By order of the BoardFIL Investments International17 March 2011
Fidelity Asian Values PLC Half-Yearly Report 2011 Page 5
Page 6 Fidelity Asian Values PLC Half-Yearly Report 2011
Directors’ Responsibility Statement
The Directors confirm to the best of theirknowledge that:
a) the condensed set of financialstatements contained within the Half-Yearly financial report has beenprepared in accordance with the UKAccounting Standards Board’s Statement‘Half-Yearly Financial Reports’;
b) the Half-Yearly report narrative on pages 3 to 5 (constituting the interimmanagement report) includes a fairreview of the information required byRule 4.2.7R of the FSA’s Disclosure andTransparency Rules and their impact onthe condensed set of financialstatements and a description of theprincipal risks and uncertainties for theremaining six months of the financialyear; and
c) in accordance with Disclosure andTransparency Rule 4.2.8R there havebeen no related parties transactionsduring the six months to 31 January2011 and therefore nothing to report on any material effect by such atransaction on the financial position or the performance of the Companyduring that period; and there have been no changes in this position sincethe last Annual Report that could have a material effect on the financial positionor performance of the Company in the first six months of the currentfinancial year.
The Half-Yearly financial report has not been audited or reviewed by theCompany’s Independent Auditor.
The Half-Yearly financial report was approved by the Board on 17 March 2011 and theabove responsibility statement was signed on its behalf by Hugh Bolland, Chairman.
Fidelity Asian Values PLC Half-Yearly Report 2011 Page 7
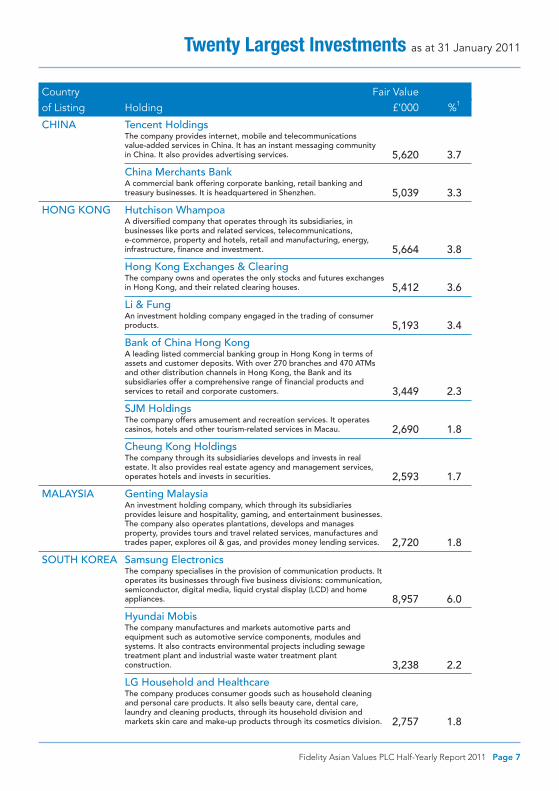
Twenty Largest Investments as at 31 January 2011
Country Fair Value of Listing Holding £’000 %1
CHINA Tencent HoldingsThe company provides internet, mobile and telecommunications value-added services in China. It has an instant messaging community in China. It also provides advertising services. 5,620 3.7
China Merchants BankA commercial bank offering corporate banking, retail banking andtreasury businesses. It is headquartered in Shenzhen. 5,039 3.3
HONG KONG Hutchison WhampoaA diversified company that operates through its subsidiaries, inbusinesses like ports and related services, telecommunications, e-commerce, property and hotels, retail and manufacturing, energy,infrastructure, finance and investment. 5,664 3.8
Hong Kong Exchanges & ClearingThe company owns and operates the only stocks and futures exchangesin Hong Kong, and their related clearing houses. 5,412 3.6
Li & FungAn investment holding company engaged in the trading of consumerproducts. 5,193 3.4
Bank of China Hong KongA leading listed commercial banking group in Hong Kong in terms ofassets and customer deposits. With over 270 branches and 470 ATMsand other distribution channels in Hong Kong, the Bank and itssubsidiaries offer a comprehensive range of financial products andservices to retail and corporate customers. 3,449 2.3
SJM HoldingsThe company offers amusement and recreation services. It operatescasinos, hotels and other tourism-related services in Macau. 2,690 1.8
Cheung Kong HoldingsThe company through its subsidiaries develops and invests in realestate. It also provides real estate agency and management services,operates hotels and invests in securities. 2,593 1.7
MALAYSIA Genting MalaysiaAn investment holding company, which through its subsidiariesprovides leisure and hospitality, gaming, and entertainment businesses.The company also operates plantations, develops and managesproperty, provides tours and travel related services, manufactures andtrades paper, explores oil & gas, and provides money lending services. 2,720 1.8
SOUTH KOREA Samsung ElectronicsThe company specialises in the provision of communication products. Itoperates its businesses through five business divisions: communication,semiconductor, digital media, liquid crystal display (LCD) and homeappliances. 8,957 6.0
Hyundai MobisThe company manufactures and markets automotive parts andequipment such as automotive service components, modules andsystems. It also contracts environmental projects including sewagetreatment plant and industrial waste water treatment plantconstruction. 3,238 2.2
LG Household and HealthcareThe company produces consumer goods such as household cleaningand personal care products. It also sells beauty care, dental care,laundry and cleaning products, through its household division andmarkets skin care and make-up products through its cosmetics division. 2,757 1.8

Page 8 Fidelity Asian Values PLC Half-Yearly Report 2011
Twenty Largest Investments as at 31 January 2011
Country Fair Value of Listing Holding £’000 %1
Hyundai Heavy IndustriesThe company builds ships for commercial and military purposes. It produces oil tankers, passenger and cargo vessels, and warships. The company also produces heavy industrial machinery, electricalcomponents for engines and power trains, and industrial vehicles, suchas cranes and bulldozers. 2,531 1.7
KIA MotorsThe company manufactures, sells and exports cars, mini buses, trucksand commercial vehicles. It also produces various auto parts. 2,488 1.7
Lock&LockThe company produces and sells plastic food storage and outdoorairtight containers. It also produces materials such as ceramic ware,pots, glass, and other kitchen items. 2,195 1.5
Seoul SemiconductorThe company manufactures parts of electronics products. Its productsinclude light emitting diode (LED), custom display, LED dot matrix,photo and transistors. 2,144 1.4
TAIWAN Hon Hai PrecisionThe company is principally engaged in the production and sale ofelectronic products, which are applied in computer, communication andconsumer electronics goods. 4,700 3.1
Advanced Semiconductor EngineeringA provider of semiconductor packaging and testing services. The company’s services include semiconductor packaging, design andproduction of interconnect materials, front-end engineering testing,wafer probing and final testing services. 3,392 2.2
Taiwan Semiconductor ManufacturingThe company manufactures and markets integrated circuits andprovides the following services: wafer manufacturing, wafer probing,assembly and testing, mask production and design services. Itsintegrated circuits are used in computers, communications, consumerelectronics, automotive and industrial equipment services. 2,240 1.5
Au OptronicsThe company designs develops, manufactures, assembles and marketsflat planel displays. Its principal products are thin film transistor-liquiddisplay (TFT-LCD). 2,115 1.4
Twenty largest investments 75,137 49.9
Other holdings 73,559 48.9
148,696 98.8
Cash and other net current assets 1,836 1.2
150,532 100.0
1 % of total assets less current liabilities, excluding loan liability
THIS PAGE HAS BEEN INTENTIONALLY LEFT BLANK
Fidelity Asian Values PLC Half-Yearly Report 2011 Page 9
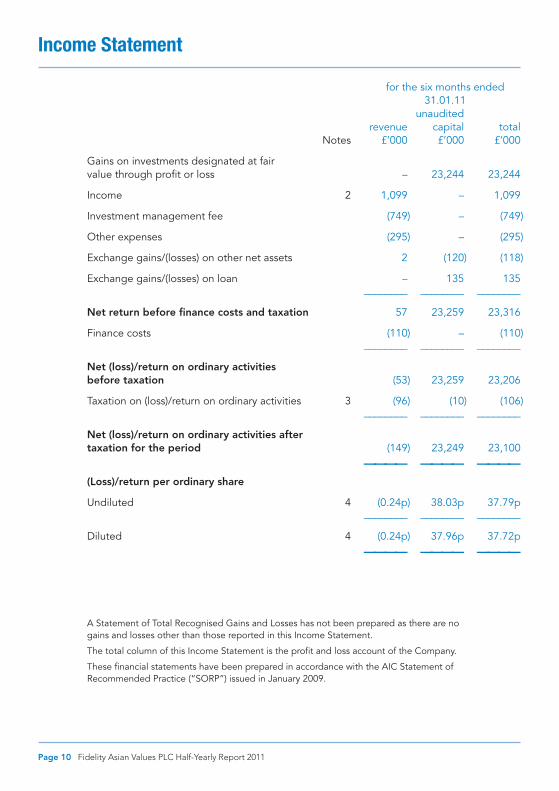
Income Statement
for the six months ended 31.01.11
unauditedrevenue capital total
Notes £’000 £’000 £’000
Gains on investments designated at fair value through profit or loss – 23,244 23,244
Income 2 1,099 – 1,099
Investment management fee (749) – (749)
Other expenses (295) – (295)
Exchange gains/(losses) on other net assets 2 (120) (118)
Exchange gains/(losses) on loan – 135 135________ ________ ________
Net return before finance costs and taxation 57 23,259 23,316
Finance costs (110) – (110)________ ________ ________
Net (loss)/return on ordinary activities before taxation (53) 23,259 23,206
Taxation on (loss)/return on ordinary activities 3 (96) (10) (106)________ ________ ________
Net (loss)/return on ordinary activities after taxation for the period (149) 23,249 23,100____ ____ ____(Loss)/return per ordinary share
Undiluted 4 (0.24p) 38.03p 37.79p________ ________ ________
Diluted 4 (0.24p) 37.96p 37.72p____ ____ ____
Page 10 Fidelity Asian Values PLC Half-Yearly Report 2011
A Statement of Total Recognised Gains and Losses has not been prepared as there are nogains and losses other than those reported in this Income Statement.
The total column of this Income Statement is the profit and loss account of the Company.
These financial statements have been prepared in accordance with the AIC Statement ofRecommended Practice (“SORP”) issued in January 2009.

Fidelity Asian Values PLC Half-Yearly Report 2011 Page 11
for the year ended for the six months ended31.07.10 31.01.10audited unaudited
revenue capital total revenue capital total£’000 £’000 £’000 £’000 £’000 £’000
– 25,432 25,432 – 13,310 13,310
2,446 – 2,446 978 – 978
(1,161) – (1,161) (543) – (543)
(799) – (799) (211) – (211)
9 181 190 2 233 235
– (178) (178) – (306) (306)________ ________ ________ ________ ________ ________
495 25,435 25,930 226 13,237 13,463
(131) – (131) (65) – (65)________ ________ ________ ________ ________ ________
364 25,435 25,799 161 13,237 13,398
(200) – (200) (65) – (65)________ ________ ________ ________ ________ ________
164 25,435 25,599 96 13,237 13,333____ ____ ____ ____ ____ ____
0.27p 41.73p 42.00p 0.16p 21.72p 21.88p________ ________ ________ ________ ________ ________
n/a n/a n/a n/a n/a n/a____ ____ ____ ____ ____ ____
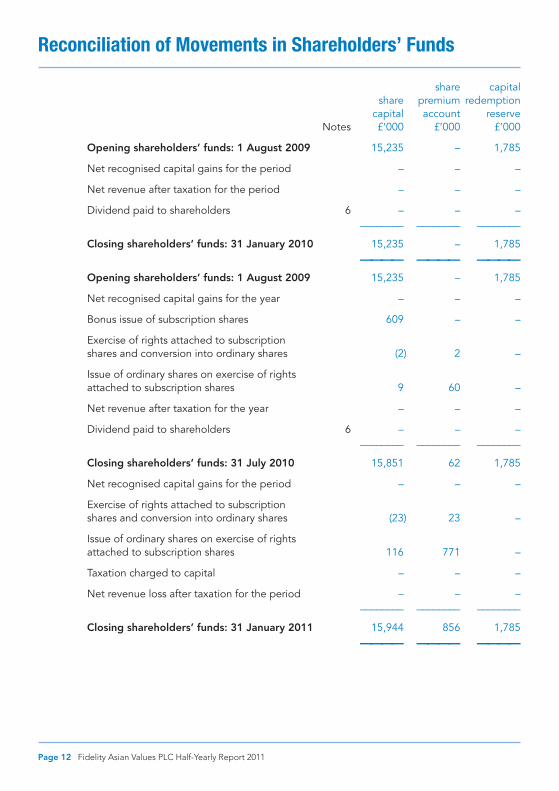
Reconciliation of Movements in Shareholders’ Funds
share capitalshare premium redemption
capital account reserveNotes £’000 £’000 £’000
Opening shareholders’ funds: 1 August 2009 15,235 – 1,785
Net recognised capital gains for the period – – –
Net revenue after taxation for the period – – –
Dividend paid to shareholders 6 – – –________ ________ ________
Closing shareholders’ funds: 31 January 2010 15,235 – 1,785____ ____ ____Opening shareholders’ funds: 1 August 2009 15,235 – 1,785
Net recognised capital gains for the year – – –
Bonus issue of subscription shares 609 – –
Exercise of rights attached to subscription shares and conversion into ordinary shares (2) 2 –
Issue of ordinary shares on exercise of rights attached to subscription shares 9 60 –
Net revenue after taxation for the year – – –
Dividend paid to shareholders 6 – – –________ ________ ________
Closing shareholders’ funds: 31 July 2010 15,851 62 1,785
Net recognised capital gains for the period – – –
Exercise of rights attached to subscription shares and conversion into ordinary shares (23) 23 –
Issue of ordinary shares on exercise of rights attached to subscription shares 116 771 –
Taxation charged to capital – – –
Net revenue loss after taxation for the period – – –________ ________ ________
Closing shareholders’ funds: 31 January 2011 15,944 856 1,785____ ____ ____
Page 12 Fidelity Asian Values PLC Half-Yearly Report 2011
Fidelity Asian Values PLC Half-Yearly Report 2011 Page 13
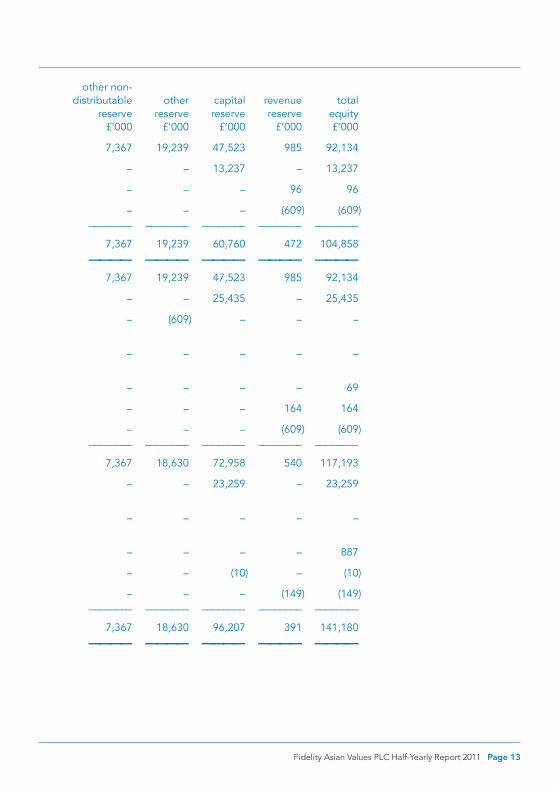
other non-distributable other capital revenue total
reserve reserve reserve reserve equity£’000 £’000 £’000 £’000 £’000
7,367 19,239 47,523 985 92,134
– – 13,237 – 13,237
– – – 96 96
– – – (609) (609)________ ________ ________ ________ ________
7,367 19,239 60,760 472 104,858____ ____ ____ ____ ____7,367 19,239 47,523 985 92,134
– – 25,435 – 25,435
– (609) – – –
– – – – –
– – – – 69
– – – 164 164
– – – (609) (609)________ ________ ________ ________ ________
7,367 18,630 72,958 540 117,193
– – 23,259 – 23,259
– – – – –
– – – – 887
– – (10) – (10)
– – – (149) (149)________ ________ ________ ________ ________
7,367 18,630 96,207 391 141,180____ ____ ____ ____ ____
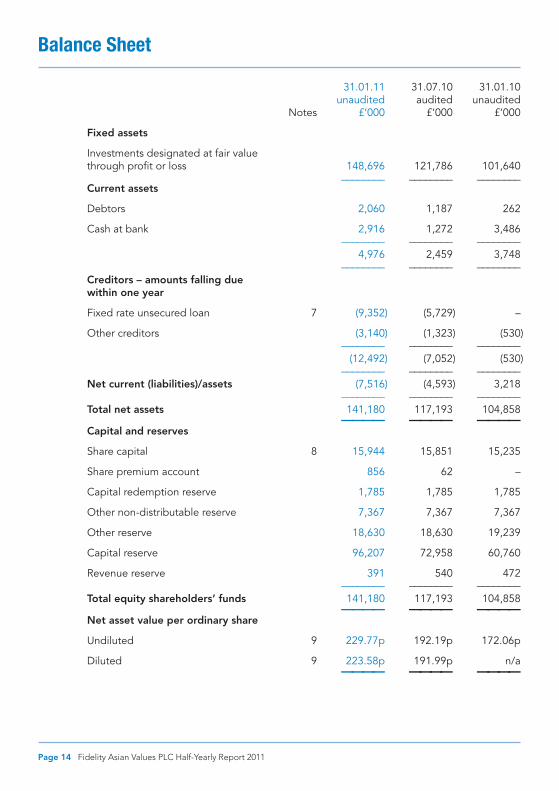
Balance Sheet
31.01.11 31.07.10 31.01.10unaudited audited unaudited
Notes £’000 £’000 £’000
Fixed assets
Investments designated at fair value through profit or loss 148,696 121,786 101,640
________ ________ ________Current assets
Debtors 2,060 1,187 262
Cash at bank 2,916 1,272 3,486________ ________ ________
4,976 2,459 3,748________ ________ ________
Creditors – amounts falling due within one year
Fixed rate unsecured loan 7 (9,352) (5,729) –
Other creditors (3,140) (1,323) (530)________ ________ ________
(12,492) (7,052) (530)________ ________ ________
Net current (liabilities)/assets (7,516) (4,593) 3,218________ ________ ________
Total net assets 141,180 117,193 104,858____ ____ ____Capital and reserves
Share capital 8 15,944 15,851 15,235
Share premium account 856 62 –
Capital redemption reserve 1,785 1,785 1,785
Other non-distributable reserve 7,367 7,367 7,367
Other reserve 18,630 18,630 19,239
Capital reserve 96,207 72,958 60,760
Revenue reserve 391 540 472________ ________ ________
Total equity shareholders’ funds 141,180 117,193 104,858____ ____ ____Net asset value per ordinary share
Undiluted 9 229.77p 192.19p 172.06p
Diluted 9 223.58p 191.99p n/a____ ____ ____
Page 14 Fidelity Asian Values PLC Half-Yearly Report 2011

31.01.11 31.07.10 31.01.10unaudited audited unaudited
£’000 £’000 £’000Operating activities
Investment income received 910 2,257 944
Investment management fee paid (349) (1,145) (261)
Directors’ fees paid (21) (93) (43)
Other cash payments (176) (720) (138)________ ________ ________
Net cash inflow from operating activities 364 299 502________ ________ ________
Servicing of finance
Interest paid (93) (215) (195)________ ________ ________
Net cash outflow from servicing of finance (93) (215) (195)________ ________ ________
Financial investment
Purchase of investments (76,371) (91,819) (36,787)
Disposal of investments 73,176 94,199 46,979________ ________ ________
Net cash (outflow)/inflow from financial investment (3,195) 2,380 10,192
________ ________ ________Dividend paid to shareholders – (609) (609)
________ ________ ________Net cash (outflow)/inflow before financing (2,924) 1,855 9,890
________ ________ ________Financing
Exercise of rights attached to subscription shares 887 52 –
2.24% fixed rate unsecured credit facility drawn down 3,758 – –
2.65% fixed rate unsecured credit facility drawn down – 5,857 –
5.60% fixed rate unsecured loan repaid – (6,890) (6,890)________ ________ ________
Net cash inflow/(outflow) from financing 4,645 (981) (6,890)________ ________ ________
Increase in cash 1,721 874 3,000____ ____ ____
Fidelity Asian Values PLC Half-Yearly Report 2011 Page 15
Cash Flow Statement
Page 16 Fidelity Asian Values PLC Half-Yearly Report 2011
Notes to the Financial Statements
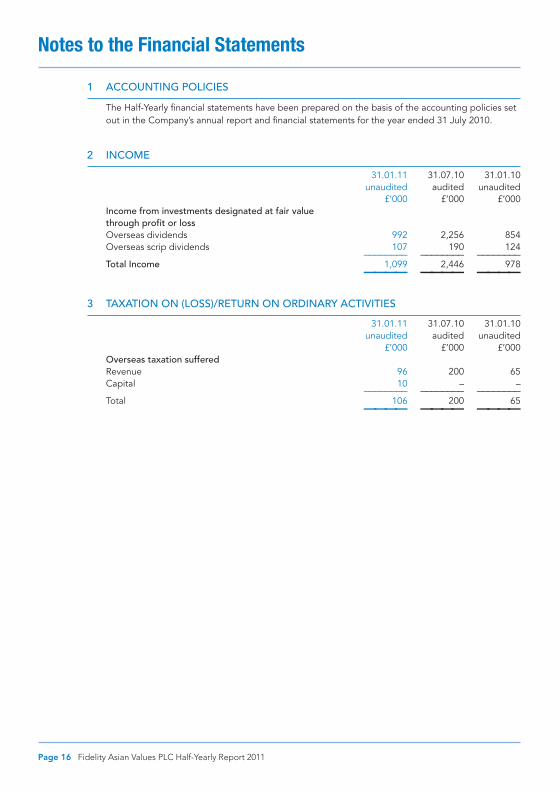
1 ACCOUNTING POLICIES
The Half-Yearly financial statements have been prepared on the basis of the accounting policies setout in the Company’s annual report and financial statements for the year ended 31 July 2010.
2 INCOME
31.01.11 31.07.10 31.01.10unaudited audited unaudited
£’000 £’000 £’000Income from investments designated at fair value through profit or lossOverseas dividends 992 2,256 854Overseas scrip dividends 107 190 124________ ________ ________Total Income 1,099 2,446 978____ ____ ____
3 TAXATION ON (LOSS)/RETURN ON ORDINARY ACTIVITIES
31.01.11 31.07.10 31.01.10unaudited audited unaudited
£’000 £’000 £’000Overseas taxation sufferedRevenue 96 200 65Capital 10 – –________ ________ ________Total 106 200 65____ ____ ____

4 (LOSS)/RETURN PER ORDINARY SHARE
31.01.11 31.07.10 31.01.10unaudited audited unaudited
UndilutedRevenue (0.24p) 0.27p 0.16pCapital 38.03p 41.73p 21.72p________ ________ ________Total 37.79p 42.00p 21.88p____ ____ ____The undiluted returns per ordinary share are based on net (loss)/return on ordinary activities after taxation in the period and the weighted average number of ordinary shares in issue. The revenue loss in the period was £149,000 (31.07.10: return £164,000; 31.01.10: return £96,000),the capital return in the period was £23,249,000 (31.07.10: £25,435,000; 31.01.10: £13,237,000)and the total return in the period was £23,100,000 (31.07.10: £25,599,000; 31.01.10: £13,333,000). The weighted average number of ordinary shares in issue during the period was 61,134,742(31.07.10: 60,945,935; 31.01.10: 60,942,501).
31.01.11 31.07.10 31.01.10unaudited audited unaudited
DilutedRevenue (0.24p) n/a n/aCapital 37.96p n/a n/a________ ________ ________Total 37.72p n/a n/a____ ____ ____The diluted returns per ordinary share represent the net (loss)/return on ordinary activities aftertaxation divided by the weighted average number of ordinary shares in issue during the period, asadjusted for the conversion of all outstanding subscription shares at the period end, into ordinaryshares. For this purpose, the excess in the number of ordinary shares that would have been issuedhad all the outstanding subscription shares been converted, over the number of ordinary shares thatcould have been purchased, at the average market price during the period, with the 191.00 penceper share proceeds of the conversion, are treated as an issue of ordinary shares for no considerationat the start of the period. The weighted average number of ordinary shares for the period on thisdiluted basis was 61,242,998.
There was no dilution in the period ended 31 January 2010 as there were no subscription shares inissue, and none in the year ended 31 July 2010 as the average market price of the ordinary shareswas below the exercise price of 191.00 pence.
Fidelity Asian Values PLC Half-Yearly Report 2011 Page 17
Notes to the Financial Statements

5 INVESTMENT TRANSACTION COSTS
Included in gains on investments designated at fair value through profit or loss are the followingcosts of investment transactions:
31.01.11 31.07.10 31.01.10unaudited audited unaudited
£’000 £’000 £’000Purchases expenses 44 187 73Sales expenses 40 312 163________ ________ ________
84 499 236____ ____ ____6 DIVIDENDS
No dividend has been declared in respect of the current period. The dividend payment of £609,000shown in the Reconciliation of Movements in Shareholders’ Funds for the year ended 31 July 2010and for the six months ended 31 January 2010, represents the final dividend of 1.00p declared forthe year ended 31 July 2009.
7 LOAN FACILITY
On 3 February 2010 the Company entered into a 364 day revolving credit facility for an amount upto US$15,000,000 with ING Bank N.V. On 12 April 2010 US$9,000,0000 of this facility was drawndown, at an interest rate of 2.65%, and on 19 November 2010 the remaining US$6,000,000 wasdrawn down, at an interest rate of 2.24%.
Both tranches of the facility were repaid on 3 February 2011 and a new 364 day revolving creditfacility of US$15,000,000 was entered into with ING Bank N.V. The full amount was drawn down onthe same day at an interest rate of 2.0605% with interest payable on 3 May 2011.
Page 18 Fidelity Asian Values PLC Half-Yearly Report 2011
Notes to the Financial Statements
Notes to the Financial Statements
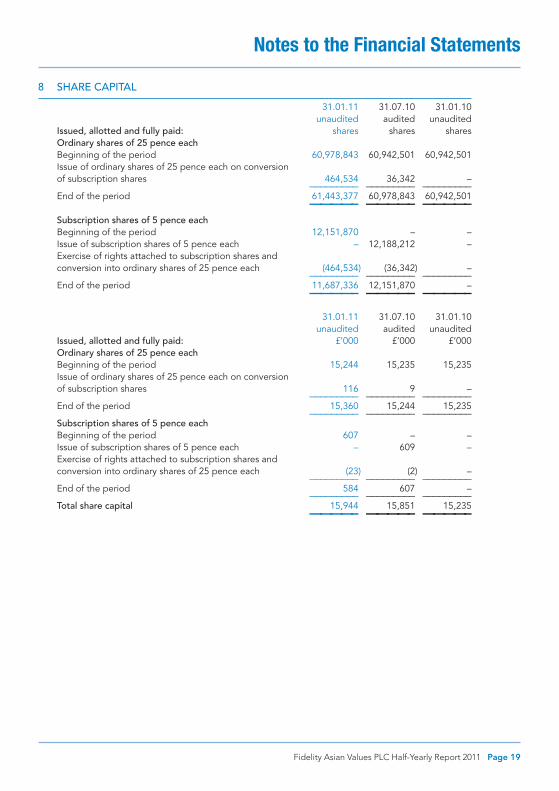
8 SHARE CAPITAL
31.01.11 31.07.10 31.01.10unaudited audited unaudited
Issued, allotted and fully paid: shares shares sharesOrdinary shares of 25 pence eachBeginning of the period 60,978,843 60,942,501 60,942,501Issue of ordinary shares of 25 pence each on conversion of subscription shares 464,534 36,342 –_________ _________ _________End of the period 61,443,377 60,978,843 60,942,501_____ _____ _____Subscription shares of 5 pence eachBeginning of the period 12,151,870 – –Issue of subscription shares of 5 pence each – 12,188,212 –Exercise of rights attached to subscription shares and conversion into ordinary shares of 25 pence each (464,534) (36,342) –_________ _________ _________End of the period 11,687,336 12,151,870 –_____ _____ _____
31.01.11 31.07.10 31.01.10unaudited audited unaudited
Issued, allotted and fully paid: £’000 £’000 £’000Ordinary shares of 25 pence eachBeginning of the period 15,244 15,235 15,235Issue of ordinary shares of 25 pence each on conversion of subscription shares 116 9 –_________ _________ _________End of the period 15,360 15,244 15,235_________ _________ _________Subscription shares of 5 pence eachBeginning of the period 607 – –Issue of subscription shares of 5 pence each – 609 –Exercise of rights attached to subscription shares and conversion into ordinary shares of 25 pence each (23) (2) –_________ _________ _________End of the period 584 607 –_________ _________ _________Total share capital 15,944 15,851 15,235_____ _____ _____
Fidelity Asian Values PLC Half-Yearly Report 2011 Page 19

Notes to the Financial Statements
9 NET ASSET VALUE PER ORDINARY SHARE
The undiluted net asset value per ordinary share is based on net assets of £141,180,000 (31.07.10:£117,193,000; 31.01.10: £104,858,000) and on 61,443,377 (31.07.10: 60,978,843; 31.01.10:60,942,501) ordinary shares, being the number of ordinary shares in issue at the period end.
The diluted net asset value per ordinary share has been calculated on the basis that the outstandingsubscription shares of 11,687,336 at 31 January 2011 (31.07.10: 12,151,870; 31.01.10: nil) wereexercised on that date. This basis of calculation is in accordance with guidelines laid down by theAssociation of Investment Companies and is provided to the London Stock Exchange on anongoing basis.
10 UNAUDITED FINANCIAL STATEMENTS
The results for the six months to 31 January 2011 and 31 January 2010, which are unaudited,constitute non-statutory accounts within the meaning of s435 of the Companies Act 2006. Thefigures and financial information for the year ended 31 July 2010 are extracted from the latestpublished financial statements. These financial statements, on which the Independent Auditor gave an unqualified report, have been delivered to the Registrar of Companies.
Page 20 Fidelity Asian Values PLC Half-Yearly Report 2011

Fidelity Asian Values PLC Half-Yearly Report 2011 Page 21
Investor Information
CONTACT INFORMATIONPrivate investors call free on:0800 41 41 10 9am to 6pm, Monday to Saturday.
Financial advisers call free on: 0800 41 41 81 Lines are open from 8am to 6pm, Monday to Fridaywww.fidelity.co.uk/its
Existing investors who have specific queriesregarding their holding or need to provideupdate information, for example a changeof address, should contact the appropriateadministrator:
Holders of ordinary shares:Capita Registrars (Registrars to FidelityAsian Values PLC), The Registry,34 Beckenham Road, Beckenham, Kent, BR3 4TU.Telephone: 0871 664 0300 (calls to this number cost 10p per minute plusnetwork extras) Lines are open from 8.30am to 5.30pm, Monday to Friday. If calling from overseas, telephone +44 208 639 3399Email: [email protected]
Share Plan investors:Fidelity Investment Trust Share PlanBNP Paribas Securities Services, Block CWestern House, Lynchwood Business Park,Peterborough PE2 6BP.Telephone: 0845 358 1107 (calls to thisnumber are charged at 4p per minute from a BT landline dependent on the tariff. Other telephone service providers’costs may vary.)
Fidelity ISA investors: Fidelity, using the freephone number given, or by writing to:UK Customer Service, Fidelity International, Oakhill House, 130 Tonbridge Road,Hildenborough, Tonbridge, Kent, TN11 9DZwww.fidelity.co.uk/its
Fidelity ShareNetwork:http://www.fidelity.co.uk/sharenetwork
General enquiries should be made toFidelity, the Investment Manager andSecretary, at the Company’s registeredoffice: FIL Investments International,Investment Trusts, Beech Gate, MillfieldLane, Lower Kingswood, Tadworth, Surrey KT20 6RP.Telephone: 01732 361144Fax: 01737 836892http://www.fidelity.co.uk/its
FINANCIAL CALENDAR 201031 January – Half-Yearly period end22 March – Announcement of Half-Yearly
results to 31 January1 April – Posting of Half-Yearly report31 July – Financial year endOctober – Publication of Annual ReportNovember – Annual General Meeting

Page 22 Fidelity Asian Values PLC Half-Yearly Report 2011
Directory
BOARD OF DIRECTORSHugh Bolland (Chairman)Kate Bolsover
(Audit Committee Chairman)William Knight
(Senior Independent Director)Kathryn MatthewsPhilip Smiley
MANAGER, SECRETARY ANDREGISTERED OFFICEFIL Investments InternationalBeech Gate, Millfield Lane,Lower Kingswood,Tadworth,Surrey, KT20 6RP
FINANCIAL ADVISERS ANDSTOCKBROKERSJ. P. Morgan Cazenove 20 Moorgate,London, EC2R 6DA
INDEPENDENT AUDITORGrant Thornton UK LLPChartered Accountantsand Registered Auditor,30 Finsbury Square,London, EC2P 2YU
BANKERS AND CUSTODIANJPMorgan Chase Bank (London Branch)125 London Wall,London, EC2Y 5AJ
REGISTRARSCapita RegistrarsThe Registry,34 Beckenham Road,Beckenham,Kent, BR3 4TU
LAWYERSSlaughter and MayOne Bunhill Row,London, EC1Y 8YY
Speechly Bircham LLP6 New Street Square,London, EC4A 3LX
The Fidelity Individual Savings Account (“ISA”) is offered and managed by Financial Administration ServicesLimited. The Fidelity Investment Trust Share Plan is managed by FIL Investments International. Bothcompanies are authorised and regulated by the Financial Services Authority. The Fidelity Investment TrustShare Plan is administered by BNP Paribas Securities Services and shares will be held in the name of PuddleDock Nominees Limited. The value of savings and eligibility to invest in an ISA will depend on individualcircumstances and all tax rules may change in the future. Fidelity investment trusts are managed by FILInvestments International. Fidelity only gives information about its own products and services and does notprovide investment advice based on individual circumstances. Should you wish to seek advice, please contacta Financial Adviser.
Please note that the value of investments and the income from them may fall as well as rise and the investormay not get back the amount originally invested. Past performance is not a guide to future returns. For fundsthat invest in overseas markets, changes in currency exchange rates may affect the value of your investment.Investing in small and emerging markets can be more volatile than other more developed markets.
Reference in this document to specific securities should not be construed as a recommendation to buy orsell these securities, but is included for the purposes of illustration only. Investors should also note that theviews expressed may no longer be current and may already have been acted upon by Fidelity.
The content of websites referenced in this document does not form part of this document.
Fidelity, Fidelity International and the Pyramid Logo are trademarks of FIL Limited.
Issued by Fidelity Asian Values PLC.

Fidelity Asian Values PLC Half-Yearly Report 2011 Page 23
WARNING TO SHAREHOLDERS – “BOILER ROOM” SCAMS
Over the year, many companies have become aware that their shareholders have receivedunsolicited phone calls or correspondence concerning investment matters. These aretypically from overseas based ‘brokers’ who target UK shareholders, offering to sell themwhat often turn out to be worthless or high risk shares in US or UK investments. Theseoperations are commonly known as ‘boiler rooms’. These ‘brokers’ can be very persistentand extremely persuasive, and a 2006 survey by the Financial Services Authority (“FSA”)reported that the average amount lost by investors is around £20,000. It is not just thenovice investor that has been duped in this way; many of the victims had been successfullyinvesting for several years. Shareholders are advised to be very wary of any unsolicitedadvice, offers to buy shares at a discount or offers of free company reports.
If you receive any unsolicited investment advice:• Make sure you get the correct name of the person and organisation• Check that they are properly authorised by the FSA before getting
involved by visiting www.fsa.gov.uk/register• Report the matter to the FSA either by calling 0845 606 1234
or visiting www.moneymadeclear.fsa.gov.uk• If the calls persist, hang up.
If you deal with an unauthorised firm, you will not be eligible to receive payment under theFinancial Services Compensation Scheme. The FSA can be contacted by completing anonline form at www.fsa.gov.uk/pages/doing/regulated/law/alerts/overseas.html
Details of any share dealing facilities that the Company endorses will be included inCompany mailings. More detailed information on this or similar activity can be found onthe FSA website www.moneymadeclear.fsa.gov.uk

Page 24 Fidelity Asian Values PLC Half-Yearly Report 2011


Printed on FSC certified paper.
100% of the inks used are vegetable oil based 95% of presschemicals are recycled for further use and on average 99% of anywaste associated with this production will be recycled.
The FSC logo identifies products which contain wood from wellmanaged forests certified in accordance with the rules of theForest Stewardship Council.
This document is printed on Cocoon Silk; a paper made using50% recycled fibre from genuine waste paper and 50% virgin fibre.
The unavoidable carbon emissions generated during themanufacture and delivery of this document, have been reduced tonet zero through a verified, carbon offsetting project.