fidelity bank plc bank plc...net gains/(losses) on fair value through ocl assets 0 0 0 - unrealised...
TRANSCRIPT

FIDELITY BANK PLC
CONDENSED UNAUDITED FIRST QUARTER FINANCIAL STATEMENTS
MARCH 2018
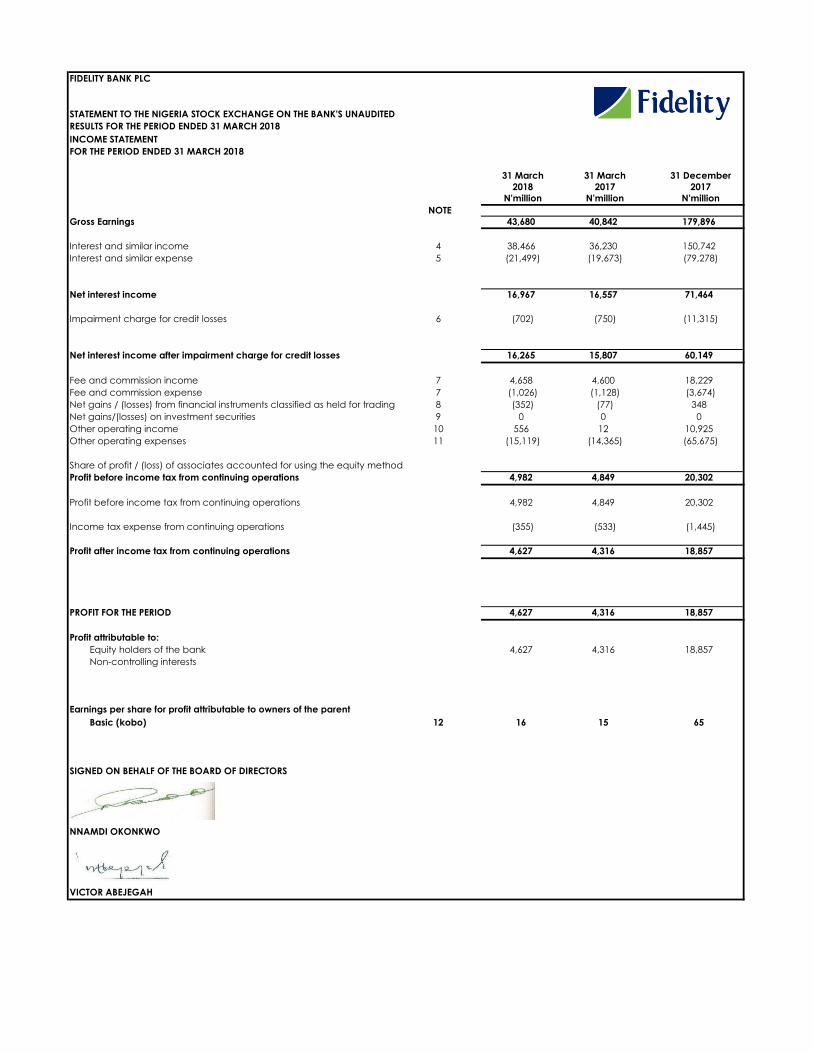
FIDELITY BANK PLC
STATEMENT TO THE NIGERIA STOCK EXCHANGE ON THE BANK'S UNAUDITED
RESULTS FOR THE PERIOD ENDED 31 MARCH 2018
INCOME STATEMENT
FOR THE PERIOD ENDED 31 MARCH 2018
31 March 31 March 31 December
2018 2017 2017
N'million N'million N'million
NOTE
Gross Earnings 43,680 40,842 179,896
Interest and similar income 4 38,466 36,230 150,742
Interest and similar expense 5 (21,499) (19,673) (79,278)
Net interest income 16,967 16,557 71,464
Impairment charge for credit losses 6 (702) (750) (11,315)
Net interest income after impairment charge for credit losses 16,265 15,807 60,149
Fee and commission income 7 4,658 4,600 18,229
Fee and commission expense 7 (1,026) (1,128) (3,674)
Net gains / (losses) from financial instruments classified as held for trading 8 (352) (77) 348
Net gains/(losses) on investment securities 9 0 0 0
Other operating income 10 556 12 10,925
Other operating expenses 11 (15,119) (14,365) (65,675)
Share of profit / (loss) of associates accounted for using the equity method
Profit before income tax from continuing operations 4,982 4,849 20,302
Profit before income tax from continuing operations 4,982 4,849 20,302
Income tax expense from continuing operations (355) (533) (1,445)
Profit after income tax from continuing operations 4,627 4,316 18,857
PROFIT FOR THE PERIOD 4,627 4,316 18,857
Profit attributable to:
Equity holders of the bank 4,627 4,316 18,857
Non-controlling interests
Earnings per share for profit attributable to owners of the parent
Basic (kobo) 12 16 15 65
SIGNED ON BEHALF OF THE BOARD OF DIRECTORS
NNAMDI OKONKWO
VICTOR ABEJEGAH
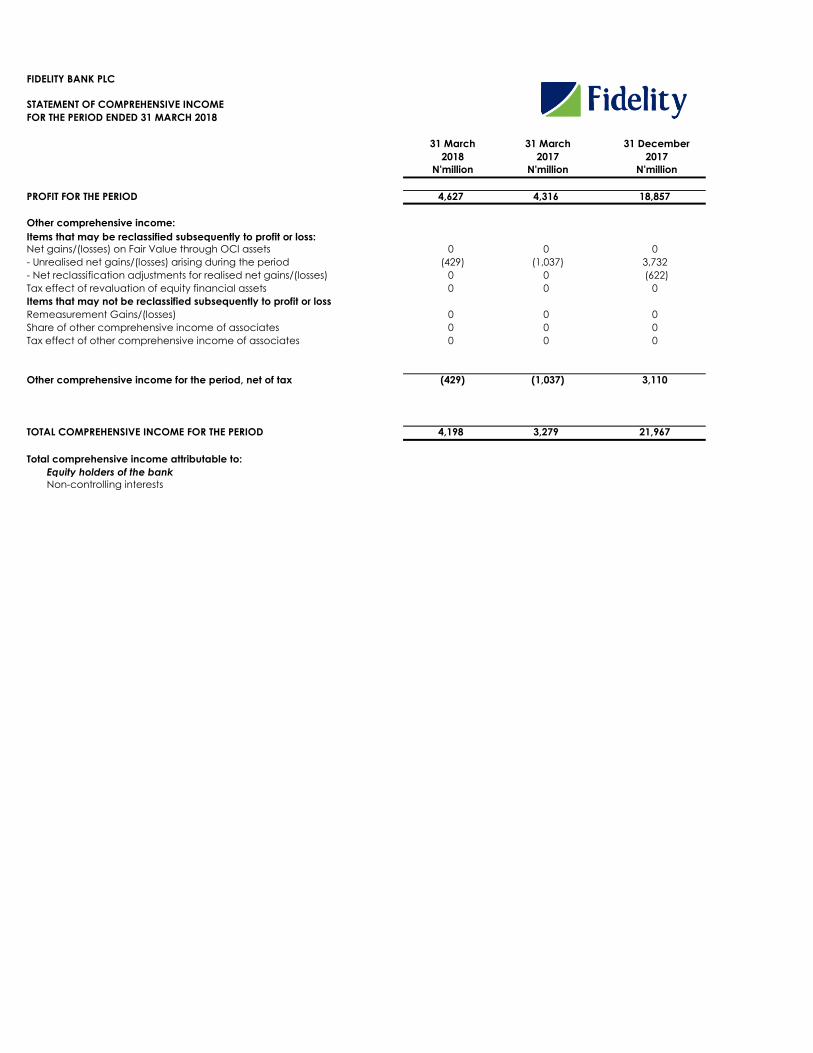
FIDELITY BANK PLC
STATEMENT OF COMPREHENSIVE INCOME
FOR THE PERIOD ENDED 31 MARCH 2018
31 March 31 March 31 December
2018 2017 2017
N'million N'million N'million
PROFIT FOR THE PERIOD 4,627 4,316 18,857
Other comprehensive income:
Items that may be reclassified subsequently to profit or loss:
Net gains/(losses) on Fair Value through OCl assets 0 0 0
- Unrealised net gains/(losses) arising during the period (429) (1,037) 3,732
- Net reclassification adjustments for realised net gains/(losses) 0 0 (622)
Tax effect of revaluation of equity financial assets 0 0 0
Items that may not be reclassified subsequently to profit or loss
Remeasurement Gains/(losses) 0 0 0
Share of other comprehensive income of associates 0 0 0
Tax effect of other comprehensive income of associates 0 0 0
Other comprehensive income for the period, net of tax (429) (1,037) 3,110
TOTAL COMPREHENSIVE INCOME FOR THE PERIOD 4,198 3,279 21,967
Total comprehensive income attributable to:
Equity holders of the bank
Non-controlling interests
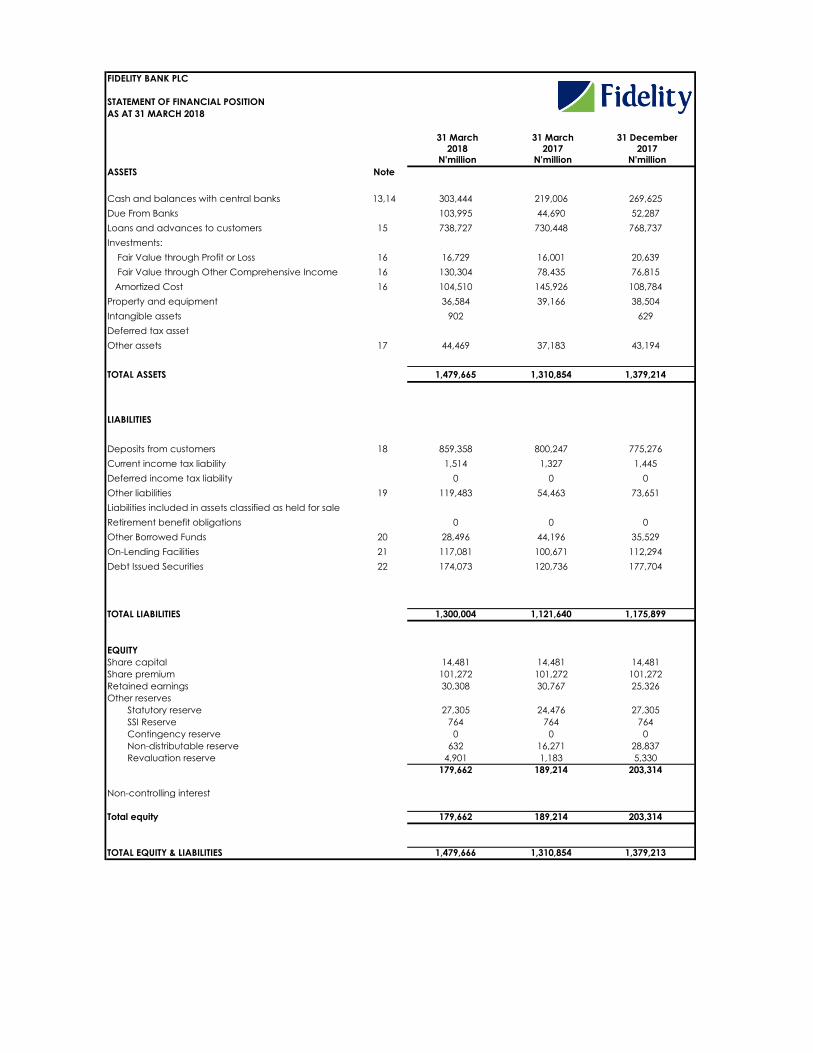
FIDELITY BANK PLC
STATEMENT OF FINANCIAL POSITION
AS AT 31 MARCH 2018
31 March 31 March 31 December
2018 2017 2017N'million N'million N'million
ASSETS Note
Cash and balances with central banks 13,14 303,444 219,006 269,625
Due From Banks 103,995 44,690 52,287
Loans and advances to customers 15 738,727 730,448 768,737
Investments:
Fair Value through Profit or Loss 16 16,729 16,001 20,639
Fair Value through Other Comprehensive Income 16 130,304 78,435 76,815
Amortized Cost 16 104,510 145,926 108,784
Property and equipment 36,584 39,166 38,504
Intangible assets 902 629
Deferred tax asset
Other assets 17 44,469 37,183 43,194
TOTAL ASSETS 1,479,665 1,310,854 1,379,214
LIABILITIES
Deposits from customers 18 859,358 800,247 775,276
Current income tax liability 1,514 1,327 1,445
Deferred income tax liability 0 0 0
Other liabilities 19 119,483 54,463 73,651
Liabilities included in assets classified as held for sale
Retirement benefit obligations 0 0 0
Other Borrowed Funds 20 28,496 44,196 35,529
On-Lending Facilities 21 117,081 100,671 112,294
Debt Issued Securities 22 174,073 120,736 177,704
TOTAL LIABILITIES 1,300,004 1,121,640 1,175,899
EQUITY
Share capital 14,481 14,481 14,481
Share premium 101,272 101,272 101,272
Retained earnings 30,308 30,767 25,326
Other reserves
Statutory reserve 27,305 24,476 27,305
SSI Reserve 764 764 764
Contingency reserve 0 0 0
Non-distributable reserve 632 16,271 28,837
Revaluation reserve 4,901 1,183 5,330
179,662 189,214 203,314
Non-controlling interest
Total equity 179,662 189,214 203,314
TOTAL EQUITY & LIABILITIES 1,479,666 1,310,854 1,379,213
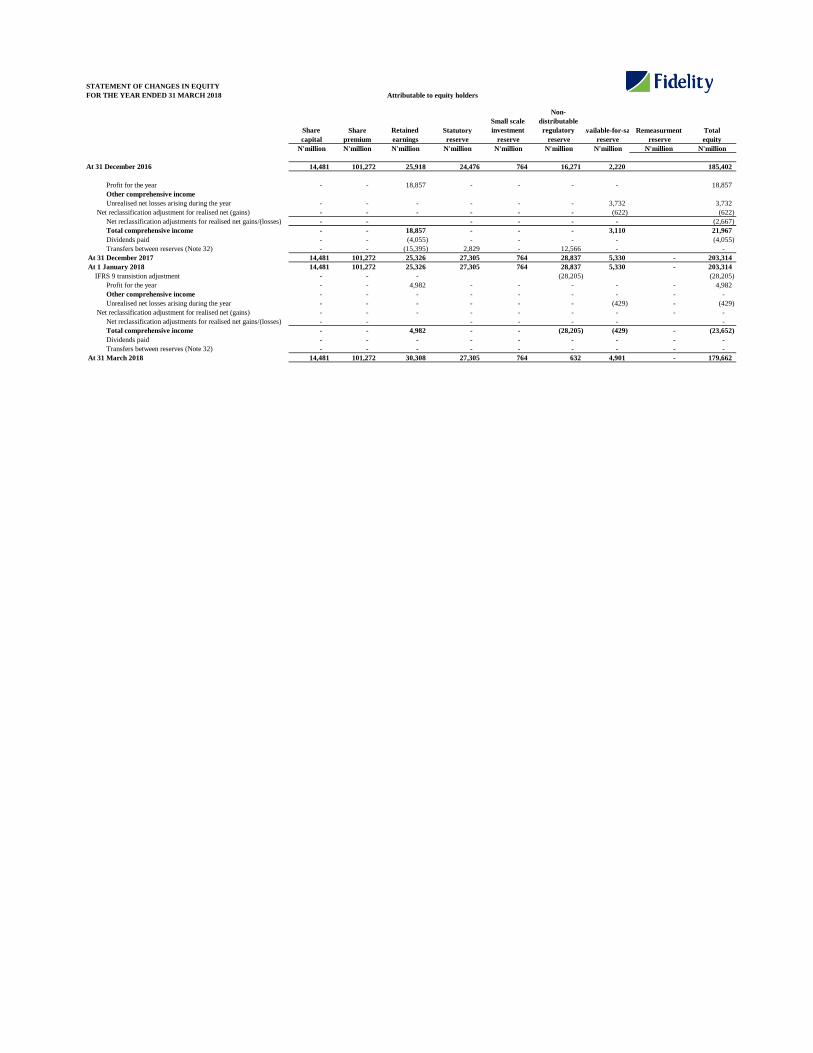
STATEMENT OF CHANGES IN EQUITY
FOR THE YEAR ENDED 31 MARCH 2018
Share Share Retained Statutory
Small scale
investment
Non-
distributable
regulatory Available-for-saleRemeasurment Total
capital premium earnings reserve reserve reserve reserve reserve equity
N'million N'million N'million N'million N'million N'million N'million N'million N'million
At 31 December 2016 14,481 101,272 25,918 24,476 764 16,271 2,220 185,402
Profit for the year - - 18,857 - - - - 18,857
Other comprehensive income
Unrealised net losses arising during the year - - - - - - 3,732 3,732
Net reclassification adjustment for realised net (gains) - - - - - - (622) (622)
Net reclassification adjustments for realised net gains/(losses) - - - - - - (2,667)
Total comprehensive income - - 18,857 - - - 3,110 21,967
Dividends paid - - (4,055) - - - - (4,055)
Transfers between reserves (Note 32) - - (15,395) 2,829 - 12,566 - -
At 31 December 2017 14,481 101,272 25,326 27,305 764 28,837 5,330 - 203,314
At 1 January 2018 14,481 101,272 25,326 27,305 764 28,837 5,330 - 203,314
IFRS 9 transistion adjustment - - - (28,205) (28,205)
Profit for the year - - 4,982 - - - - - 4,982
Other comprehensive income - - - - - - - - -
Unrealised net losses arising during the year - - - - - - (429) - (429)
Net reclassification adjustment for realised net (gains) - - - - - - - - -
Net reclassification adjustments for realised net gains/(losses) - - - - - - -
Total comprehensive income - - 4,982 - - (28,205) (429) - (23,652)
Dividends paid - - - - - - - - -
Transfers between reserves (Note 32) - - - - - - - - -
At 31 March 2018 14,481 101,272 30,308 27,305 764 632 4,901 - 179,662
Attributable to equity holders
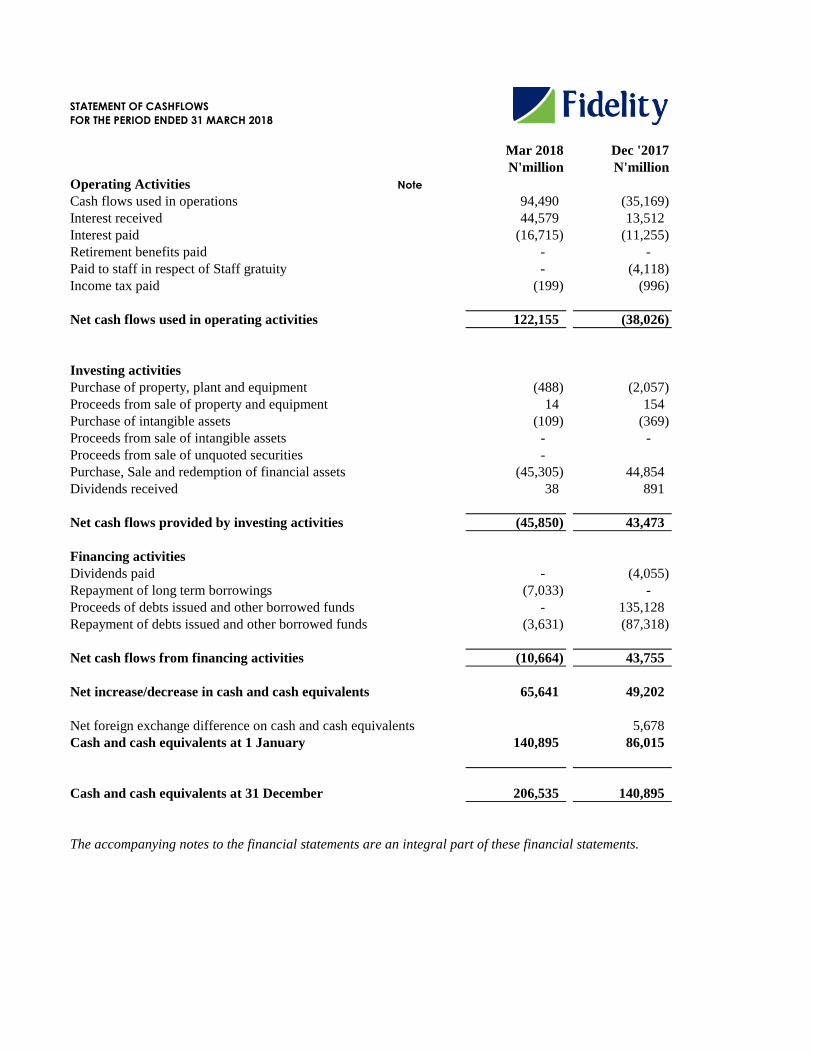
STATEMENT OF CASHFLOWS
FOR THE PERIOD ENDED 31 MARCH 2018
Mar 2018 Dec '2017
N'million N'million
Operating Activities Note
Cash flows used in operations 94,490 (35,169)
Interest received 44,579 13,512
Interest paid (16,715) (11,255)
Retirement benefits paid - -
Paid to staff in respect of Staff gratuity - (4,118)
Income tax paid (199) (996)
Net cash flows used in operating activities 122,155 (38,026)
Investing activities
Purchase of property, plant and equipment (488) (2,057)
Proceeds from sale of property and equipment 14 154
Purchase of intangible assets (109) (369)
Proceeds from sale of intangible assets - -
Proceeds from sale of unquoted securities -
Purchase, Sale and redemption of financial assets (45,305) 44,854
Dividends received 38 891
Net cash flows provided by investing activities (45,850) 43,473
Financing activities
Dividends paid - (4,055)
Repayment of long term borrowings (7,033) -
Proceeds of debts issued and other borrowed funds - 135,128
Repayment of debts issued and other borrowed funds (3,631) (87,318)
Net cash flows from financing activities (10,664) 43,755
Net increase/decrease in cash and cash equivalents 65,641 49,202
Net foreign exchange difference on cash and cash equivalents 5,678
Cash and cash equivalents at 1 January 140,895 86,015
Cash and cash equivalents at 31 December 206,535 140,895
The accompanying notes to the financial statements are an integral part of these financial statements.
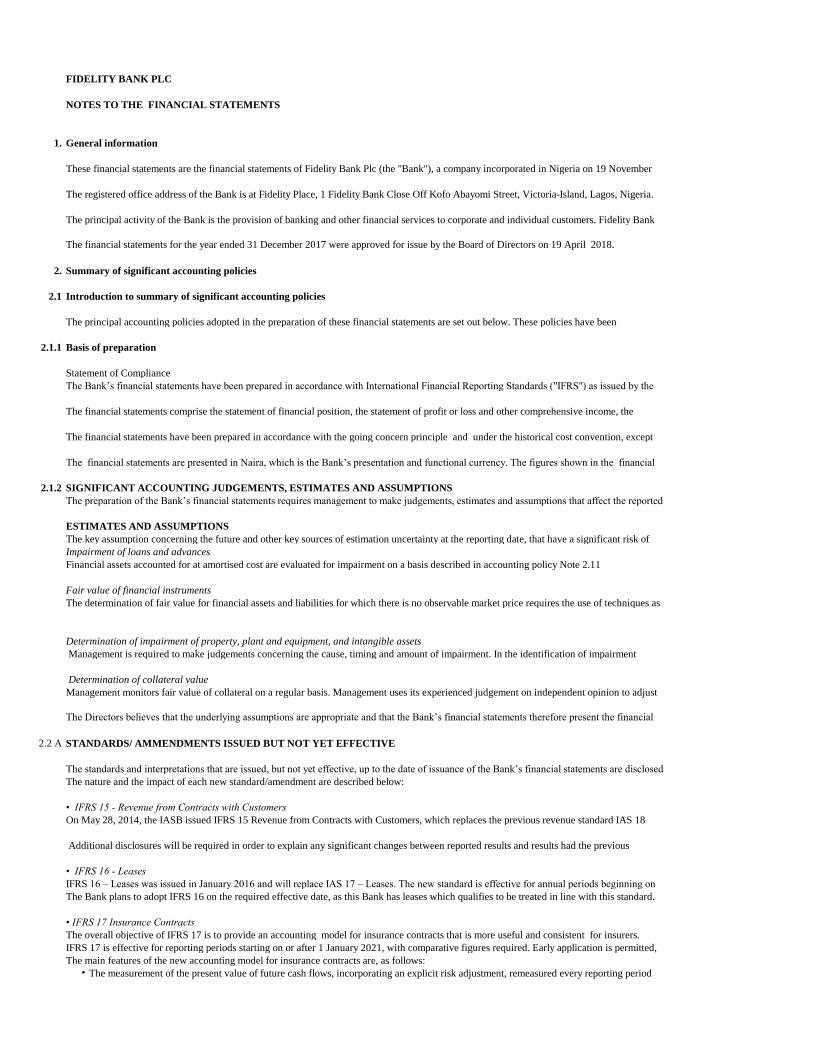
FIDELITY BANK PLC
NOTES TO THE FINANCIAL STATEMENTS
1. General information
2. Summary of significant accounting policies
2.1 Introduction to summary of significant accounting policies
2.1.1 Basis of preparation
2.1.2
2.2 A
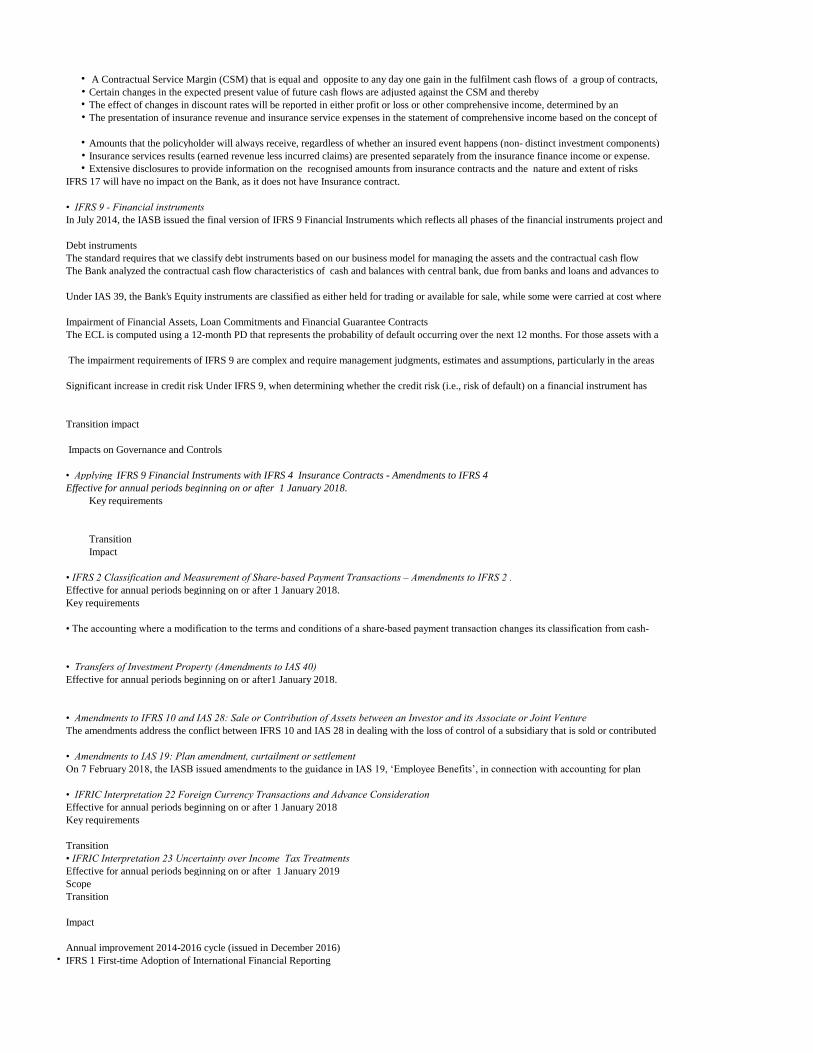
•
The overall objective of IFRS 17 is to provide an accounting model for insurance contracts that is more useful and consistent for insurers.
IFRS 17 is effective for reporting periods starting on or after 1 January 2021, with comparative figures required. Early application is permitted,
The main features of the new accounting model for insurance contracts are, as follows:
The measurement of the present value of future cash flows, incorporating an explicit risk adjustment, remeasured every reporting period
On May 28, 2014, the IASB issued IFRS 15 Revenue from Contracts with Customers, which replaces the previous revenue standard IAS 18
Additional disclosures will be required in order to explain any significant changes between reported results and results had the previous
• IFRS 16 - Leases
IFRS 16 – Leases was issued in January 2016 and will replace IAS 17 – Leases. The new standard is effective for annual periods beginning on
The Bank plans to adopt IFRS 16 on the required effective date, as this Bank has leases which qualifies to be treated in line with this standard.
• IFRS 17 Insurance Contracts
The Directors believes that the underlying assumptions are appropriate and that the Bank’s financial statements therefore present the financial
STANDARDS/ AMMENDMENTS ISSUED BUT NOT YET EFFECTIVE
The standards and interpretations that are issued, but not yet effective, up to the date of issuance of the Bank’s financial statements are disclosed
The nature and the impact of each new standard/amendment are described below:
• IFRS 15 - Revenue from Contracts with Customers
Fair value of financial instruments
The determination of fair value for financial assets and liabilities for which there is no observable market price requires the use of techniques as
Determination of impairment of property, plant and equipment, and intangible assets
Management is required to make judgements concerning the cause, timing and amount of impairment. In the identification of impairment
Determination of collateral value
Management monitors fair value of collateral on a regular basis. Management uses its experienced judgement on independent opinion to adjust
The key assumption concerning the future and other key sources of estimation uncertainty at the reporting date, that have a significant risk of
Impairment of loans and advances
Financial assets accounted for at amortised cost are evaluated for impairment on a basis described in accounting policy Note 2.11
The Bank’s financial statements have been prepared in accordance with International Financial Reporting Standards ("IFRS") as issued by the
The financial statements comprise the statement of financial position, the statement of profit or loss and other comprehensive income, the
The financial statements have been prepared in accordance with the going concern principle and under the historical cost convention, except
The financial statements are presented in Naira, which is the Bank’s presentation and functional currency. The figures shown in the financial
These financial statements are the financial statements of Fidelity Bank Plc (the "Bank"), a company incorporated in Nigeria on 19 November
The registered office address of the Bank is at Fidelity Place, 1 Fidelity Bank Close Off Kofo Abayomi Street, Victoria-Island, Lagos, Nigeria.
The principal activity of the Bank is the provision of banking and other financial services to corporate and individual customers. Fidelity Bank
The financial statements for the year ended 31 December 2017 were approved for issue by the Board of Directors on 19 April 2018.
The principal accounting policies adopted in the preparation of these financial statements are set out below. These policies have been
Statement of Compliance
SIGNIFICANT ACCOUNTING JUDGEMENTS, ESTIMATES AND ASSUMPTIONS
The preparation of the Bank’s financial statements requires management to make judgements, estimates and assumptions that affect the reported
ESTIMATES AND ASSUMPTIONS
•
•
•
•
•
•
•
•
Scope
Transition
Impact
Annual improvement 2014-2016 cycle (issued in December 2016)
IFRS 1 First-time Adoption of International Financial Reporting
• IFRIC Interpretation 22 Foreign Currency Transactions and Advance Consideration
Effective for annual periods beginning on or after 1 January 2018
Key requirements
Transition
• IFRIC Interpretation 23 Uncertainty over Income Tax Treatments
Effective for annual periods beginning on or after 1 January 2019
Effective for annual periods beginning on or after1 January 2018.
• Amendments to IFRS 10 and IAS 28: Sale or Contribution of Assets between an Investor and its Associate or Joint Venture
The amendments address the conflict between IFRS 10 and IAS 28 in dealing with the loss of control of a subsidiary that is sold or contributed
• Amendments to IAS 19: Plan amendment, curtailment or settlement
On 7 February 2018, the IASB issued amendments to the guidance in IAS 19, ‘Employee Benefits’, in connection with accounting for plan
Impact
• IFRS 2 Classification and Measurement of Share-based Payment Transactions – Amendments to IFRS 2 .
Effective for annual periods beginning on or after 1 January 2018.
Key requirements
• The accounting where a modification to the terms and conditions of a share-based payment transaction changes its classification from cash-
• Transfers of Investment Property (Amendments to IAS 40)
Impacts on Governance and Controls
• Applying IFRS 9 Financial Instruments with IFRS 4 Insurance Contracts - Amendments to IFRS 4
Effective for annual periods beginning on or after 1 January 2018.
Key requirements
Transition
Impairment of Financial Assets, Loan Commitments and Financial Guarantee Contracts
The ECL is computed using a 12-month PD that represents the probability of default occurring over the next 12 months. For those assets with a
The impairment requirements of IFRS 9 are complex and require management judgments, estimates and assumptions, particularly in the areas
Significant increase in credit risk Under IFRS 9, when determining whether the credit risk (i.e., risk of default) on a financial instrument has
Transition impact
• IFRS 9 - Financial instruments
In July 2014, the IASB issued the final version of IFRS 9 Financial Instruments which reflects all phases of the financial instruments project and
Debt instruments
The standard requires that we classify debt instruments based on our business model for managing the assets and the contractual cash flow
The Bank analyzed the contractual cash flow characteristics of cash and balances with central bank, due from banks and loans and advances to
Under IAS 39, the Bank's Equity instruments are classified as either held for trading or available for sale, while some were carried at cost where
The effect of changes in discount rates will be reported in either profit or loss or other comprehensive income, determined by an
The presentation of insurance revenue and insurance service expenses in the statement of comprehensive income based on the concept of
Amounts that the policyholder will always receive, regardless of whether an insured event happens (non- distinct investment components)
Insurance services results (earned revenue less incurred claims) are presented separately from the insurance finance income or expense.
Extensive disclosures to provide information on the recognised amounts from insurance contracts and the nature and extent of risks
IFRS 17 will have no impact on the Bank, as it does not have Insurance contract.
A Contractual Service Margin (CSM) that is equal and opposite to any day one gain in the fulfilment cash flows of a group of contracts,
Certain changes in the expected present value of future cash flows are adjusted against the CSM and thereby
•
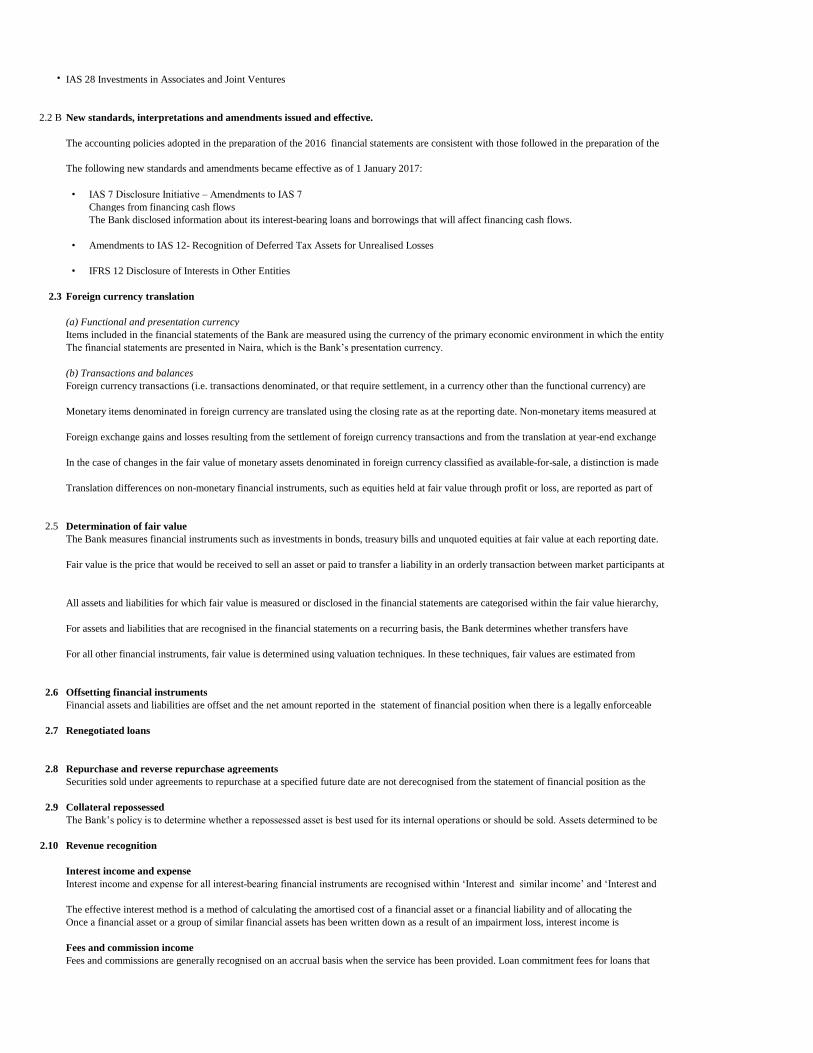
2.2 B
The following new standards and amendments became effective as of 1 January 2017:
•
•
•
2.3 Foreign currency translation
2.5
2.6
2.7
2.8
2.9
2.10
Interest income and expense for all interest-bearing financial instruments are recognised within ‘Interest and similar income’ and ‘Interest and
The effective interest method is a method of calculating the amortised cost of a financial asset or a financial liability and of allocating the
Once a financial asset or a group of similar financial assets has been written down as a result of an impairment loss, interest income is
Fees and commission income
Fees and commissions are generally recognised on an accrual basis when the service has been provided. Loan commitment fees for loans that
Securities sold under agreements to repurchase at a specified future date are not derecognised from the statement of financial position as the
Collateral repossessed
The Bank’s policy is to determine whether a repossessed asset is best used for its internal operations or should be sold. Assets determined to be
Revenue recognition
Interest income and expense
Offsetting financial instruments
Financial assets and liabilities are offset and the net amount reported in the statement of financial position when there is a legally enforceable
Renegotiated loans
Repurchase and reverse repurchase agreements
Determination of fair value
The Bank measures financial instruments such as investments in bonds, treasury bills and unquoted equities at fair value at each reporting date.
Fair value is the price that would be received to sell an asset or paid to transfer a liability in an orderly transaction between market participants at
All assets and liabilities for which fair value is measured or disclosed in the financial statements are categorised within the fair value hierarchy,
For assets and liabilities that are recognised in the financial statements on a recurring basis, the Bank determines whether transfers have
For all other financial instruments, fair value is determined using valuation techniques. In these techniques, fair values are estimated from
Foreign currency transactions (i.e. transactions denominated, or that require settlement, in a currency other than the functional currency) are
Monetary items denominated in foreign currency are translated using the closing rate as at the reporting date. Non-monetary items measured at
Foreign exchange gains and losses resulting from the settlement of foreign currency transactions and from the translation at year-end exchange
In the case of changes in the fair value of monetary assets denominated in foreign currency classified as available-for-sale, a distinction is made
Translation differences on non-monetary financial instruments, such as equities held at fair value through profit or loss, are reported as part of
Amendments to IAS 12- Recognition of Deferred Tax Assets for Unrealised Losses
IFRS 12 Disclosure of Interests in Other Entities
(a) Functional and presentation currency
Items included in the financial statements of the Bank are measured using the currency of the primary economic environment in which the entity
The financial statements are presented in Naira, which is the Bank’s presentation currency.
(b) Transactions and balances
New standards, interpretations and amendments issued and effective.
The accounting policies adopted in the preparation of the 2016 financial statements are consistent with those followed in the preparation of the
IAS 7 Disclosure Initiative – Amendments to IAS 7
Changes from financing cash flows
The Bank disclosed information about its interest-bearing loans and borrowings that will affect financing cash flows.
IAS 28 Investments in Associates and Joint Ventures
2.12
2.13
2.14
2.15
2.16
2.17
2.18
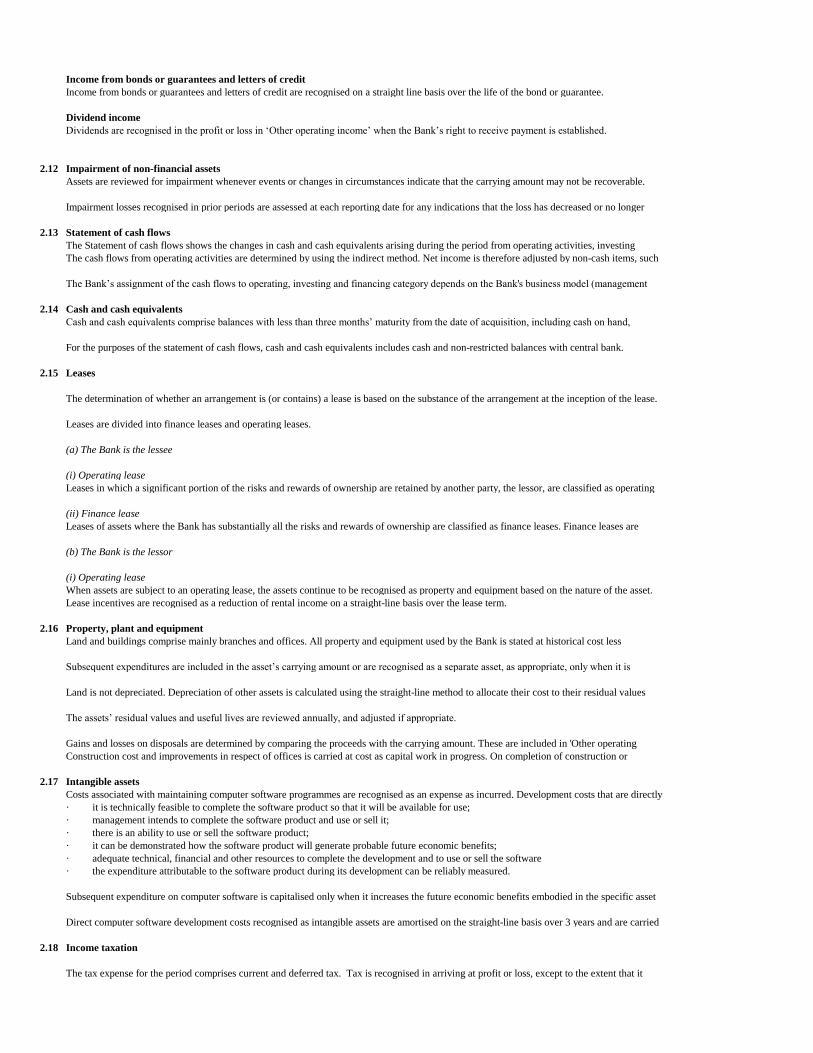
The tax expense for the period comprises current and deferred tax. Tax is recognised in arriving at profit or loss, except to the extent that it
· it can be demonstrated how the software product will generate probable future economic benefits;
· adequate technical, financial and other resources to complete the development and to use or sell the software
· the expenditure attributable to the software product during its development can be reliably measured.
Subsequent expenditure on computer software is capitalised only when it increases the future economic benefits embodied in the specific asset
Direct computer software development costs recognised as intangible assets are amortised on the straight-line basis over 3 years and are carried
Income taxation
Intangible assets
Costs associated with maintaining computer software programmes are recognised as an expense as incurred. Development costs that are directly
· it is technically feasible to complete the software product so that it will be available for use;
· management intends to complete the software product and use or sell it;
· there is an ability to use or sell the software product;
Land and buildings comprise mainly branches and offices. All property and equipment used by the Bank is stated at historical cost less
Subsequent expenditures are included in the asset’s carrying amount or are recognised as a separate asset, as appropriate, only when it is
Land is not depreciated. Depreciation of other assets is calculated using the straight-line method to allocate their cost to their residual values
The assets’ residual values and useful lives are reviewed annually, and adjusted if appropriate.
Gains and losses on disposals are determined by comparing the proceeds with the carrying amount. These are included in 'Other operating
Construction cost and improvements in respect of offices is carried at cost as capital work in progress. On completion of construction or
(i) Operating lease
When assets are subject to an operating lease, the assets continue to be recognised as property and equipment based on the nature of the asset.
Lease incentives are recognised as a reduction of rental income on a straight-line basis over the lease term.
Property, plant and equipment
(i) Operating lease
Leases in which a significant portion of the risks and rewards of ownership are retained by another party, the lessor, are classified as operating
(ii) Finance lease
Leases of assets where the Bank has substantially all the risks and rewards of ownership are classified as finance leases. Finance leases are
(b) The Bank is the lessor
For the purposes of the statement of cash flows, cash and cash equivalents includes cash and non-restricted balances with central bank.
Leases
The determination of whether an arrangement is (or contains) a lease is based on the substance of the arrangement at the inception of the lease.
Leases are divided into finance leases and operating leases.
(a) The Bank is the lessee
The cash flows from operating activities are determined by using the indirect method. Net income is therefore adjusted by non-cash items, such
The Bank’s assignment of the cash flows to operating, investing and financing category depends on the Bank's business model (management
Cash and cash equivalents
Cash and cash equivalents comprise balances with less than three months’ maturity from the date of acquisition, including cash on hand,
Impairment of non-financial assets
Assets are reviewed for impairment whenever events or changes in circumstances indicate that the carrying amount may not be recoverable.
Impairment losses recognised in prior periods are assessed at each reporting date for any indications that the loss has decreased or no longer
Statement of cash flows
The Statement of cash flows shows the changes in cash and cash equivalents arising during the period from operating activities, investing
Income from bonds or guarantees and letters of credit
Income from bonds or guarantees and letters of credit are recognised on a straight line basis over the life of the bond or guarantee.
Dividend income
Dividends are recognised in the profit or loss in ‘Other operating income’ when the Bank’s right to receive payment is established.
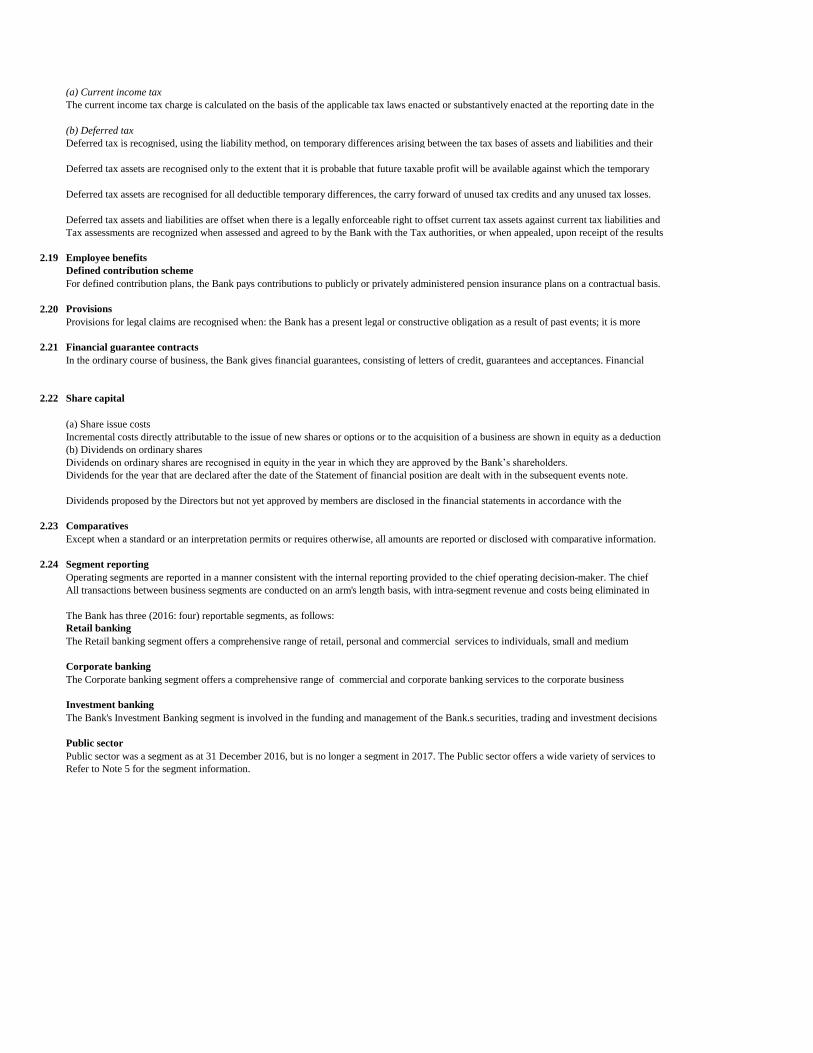
2.19 Employee benefits
Defined contribution scheme
2.20 Provisions
2.21 Financial guarantee contracts
2.22 Share capital
2.23 Comparatives
2.24 Segment reporting
Retail banking
Corporate banking
Investment banking
Public sector
Refer to Note 5 for the segment information.
The Bank's Investment Banking segment is involved in the funding and management of the Bank.s securities, trading and investment decisions
Public sector was a segment as at 31 December 2016, but is no longer a segment in 2017. The Public sector offers a wide variety of services to
Except when a standard or an interpretation permits or requires otherwise, all amounts are reported or disclosed with comparative information.
Operating segments are reported in a manner consistent with the internal reporting provided to the chief operating decision-maker. The chief
All transactions between business segments are conducted on an arm's length basis, with intra-segment revenue and costs being eliminated in
The Bank has three (2016: four) reportable segments, as follows:
The Retail banking segment offers a comprehensive range of retail, personal and commercial services to individuals, small and medium
The Corporate banking segment offers a comprehensive range of commercial and corporate banking services to the corporate business
(a) Share issue costs
Incremental costs directly attributable to the issue of new shares or options or to the acquisition of a business are shown in equity as a deduction
(b) Dividends on ordinary shares
Dividends on ordinary shares are recognised in equity in the year in which they are approved by the Bank’s shareholders.
Dividends for the year that are declared after the date of the Statement of financial position are dealt with in the subsequent events note.
Dividends proposed by the Directors but not yet approved by members are disclosed in the financial statements in accordance with the
Deferred tax assets are recognised for all deductible temporary differences, the carry forward of unused tax credits and any unused tax losses.
Deferred tax assets and liabilities are offset when there is a legally enforceable right to offset current tax assets against current tax liabilities and
Tax assessments are recognized when assessed and agreed to by the Bank with the Tax authorities, or when appealed, upon receipt of the results
For defined contribution plans, the Bank pays contributions to publicly or privately administered pension insurance plans on a contractual basis.
Provisions for legal claims are recognised when: the Bank has a present legal or constructive obligation as a result of past events; it is more
In the ordinary course of business, the Bank gives financial guarantees, consisting of letters of credit, guarantees and acceptances. Financial
(a) Current income tax
The current income tax charge is calculated on the basis of the applicable tax laws enacted or substantively enacted at the reporting date in the
(b) Deferred tax
Deferred tax is recognised, using the liability method, on temporary differences arising between the tax bases of assets and liabilities and their
Deferred tax assets are recognised only to the extent that it is probable that future taxable profit will be available against which the temporary
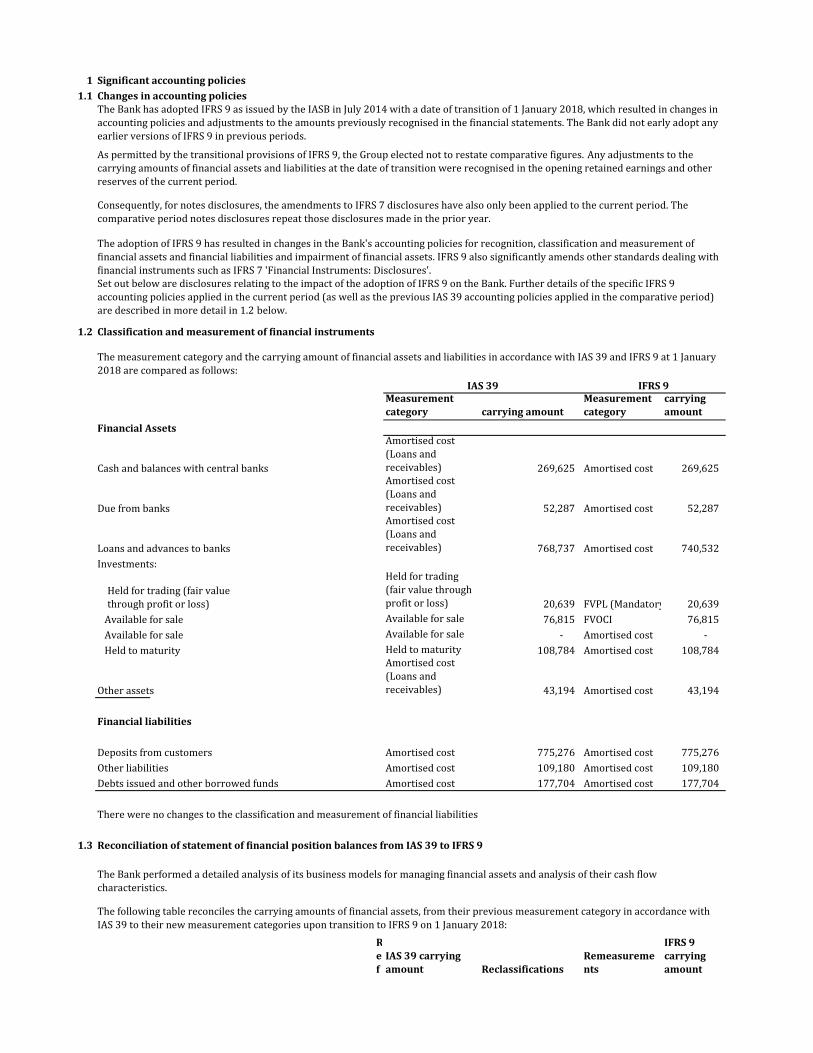
1 Significant accounting policies
1.1 Changes in accounting policies
1.2 Classification and measurement of financial instruments
Measurement
category carrying amount
Measurement
category
carrying
amount
Financial Assets
Cash and balances with central banks
Amortised cost
(Loans and
receivables) 269,625 Amortised cost 269,625
Due from banks
Amortised cost
(Loans and
receivables) 52,287 Amortised cost 52,287
Loans and advances to banks
Amortised cost
(Loans and
receivables) 768,737 Amortised cost 740,532
Investments:Held for trading
(fair value through
profit or loss) 20,639 FVPL (Mandatory) 20,639
Available for sale Available for sale 76,815 FVOCI 76,815
Available for sale Available for sale - Amortised cost -
Held to maturity Held to maturity 108,784 Amortised cost 108,784
Other assets
Amortised cost
(Loans and
receivables) 43,194 Amortised cost 43,194
Financial liabilities
Deposits from customers Amortised cost 775,276 Amortised cost 775,276
Other liabilities Amortised cost 109,180 Amortised cost 109,180
Debts issued and other borrowed funds Amortised cost 177,704 Amortised cost 177,704
1.3
R
e
f
IAS 39 carrying
amount Reclassifications
Remeasureme
nts
IFRS 9
carrying
amount
The Bank has adopted IFRS 9 as issued by the IASB in July 2014 with a date of transition of 1 January 2018, which resulted in changes in
accounting policies and adjustments to the amounts previously recognised in the financial statements. The Bank did not early adopt any
earlier versions of IFRS 9 in previous periods.
As permitted by the transitional provisions of IFRS 9, the Group elected not to restate comparative figures. Any adjustments to the
carrying amounts of financial assets and liabilities at the date of transition were recognised in the opening retained earnings and other
reserves of the current period.
Consequently, for notes disclosures, the amendments to IFRS 7 disclosures have also only been applied to the current period. The
comparative period notes disclosures repeat those disclosures made in the prior year.
The adoption of IFRS 9 has resulted in changes in the Bank's accounting policies for recognition, classification and measurement of
financial assets and financial liabilities and impairment of financial assets. IFRS 9 also significantly amends other standards dealing with
financial instruments such as IFRS 7 'Financial Instruments: Disclosures'.Set out below are disclosures relating to the impact of the adoption of IFRS 9 on the Bank. Further details of the specific IFRS 9
accounting policies applied in the current period (as well as the previous IAS 39 accounting policies applied in the comparative period)
are described in more detail in 1.2 below.
The measurement category and the carrying amount of financial assets and liabilities in accordance with IAS 39 and IFRS 9 at 1 January
2018 are compared as follows:
IAS 39 IFRS 9
Held for trading (fair value
through profit or loss)
There were no changes to the classification and measurement of financial liabilities
Reconciliation of statement of financial position balances from IAS 39 to IFRS 9
The Bank performed a detailed analysis of its business models for managing financial assets and analysis of their cash flow
characteristics.
The following table reconciles the carrying amounts of financial assets, from their previous measurement category in accordance with
IAS 39 to their new measurement categories upon transition to IFRS 9 on 1 January 2018:
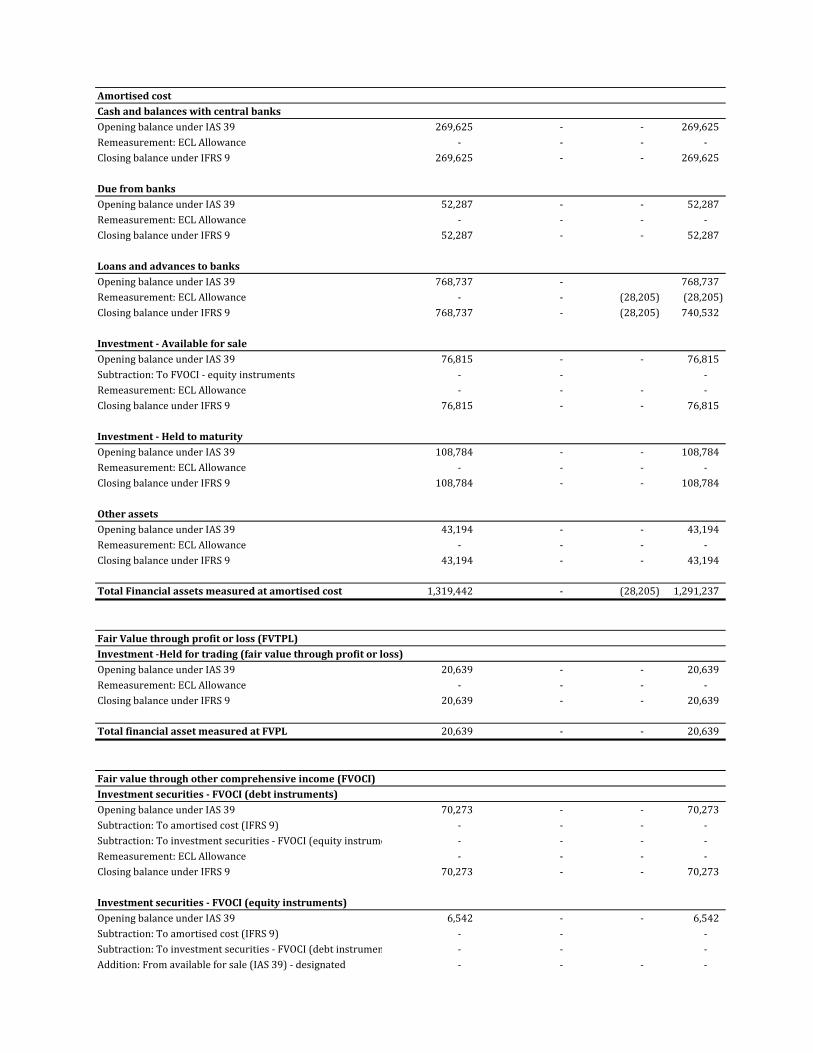
Cash and balances with central banks
269,625 - - 269,625
- - - -
269,625 - - 269,625
Due from banks
52,287 - - 52,287
- - - -
52,287 - - 52,287
Loans and advances to banks
768,737 - 768,737
- - (28,205) (28,205)
768,737 - (28,205) 740,532
76,815 - - 76,815
Subtraction: To FVOCI - equity instruments - - -
- - - -
76,815 - - 76,815
108,784 - - 108,784
- - - -
108,784 - - 108,784
43,194 - - 43,194
- - - -
43,194 - - 43,194
Total Financial assets measured at amortised cost 1,319,442 - (28,205) 1,291,237
Fair Value through profit or loss (FVTPL)
Investment -Held for trading (fair value through profit or loss)
20,639 - - 20,639
- - - -
20,639 - - 20,639
Total financial asset measured at FVPL 20,639 - - 20,639
Fair value through other comprehensive income (FVOCI)
Investment securities - FVOCI (debt instruments)
Opening balance under IAS 39 70,273 - - 70,273
Subtraction: To amortised cost (IFRS 9) - - - -
Subtraction: To investment securities - FVOCI (equity instruments) - - - -
- - - -
Closing balance under IFRS 9 70,273 - - 70,273
Investment securities - FVOCI (equity instruments)
Opening balance under IAS 39 6,542 - - 6,542
Subtraction: To amortised cost (IFRS 9) - - -
Subtraction: To investment securities - FVOCI (debt instruments) - - -
Addition: From available for sale (IAS 39) - designated - - - -
Remeasurement: ECL Allowance
Closing balance under IFRS 9
Amortised cost
Opening balance under IAS 39
Remeasurement: ECL Allowance
Closing balance under IFRS 9
Opening balance under IAS 39
Remeasurement: ECL Allowance
Closing balance under IFRS 9
Opening balance under IAS 39
Remeasurement: ECL Allowance
Opening balance under IAS 39
Remeasurement: ECL Allowance
Closing balance under IFRS 9
Other assets
Opening balance under IAS 39
Investment - Available for sale
Opening balance under IAS 39
Remeasurement: ECL Allowance
Closing balance under IFRS 9
Investment - Held to maturity
Opening balance under IAS 39
Remeasurement: ECL Allowance
Closing balance under IFRS 9
Remeasurement: ECL Allowance
Closing balance under IFRS 9

Closing balance under IFRS 9 6,542 - - 6,542
Total financial assets measured at FVOCI 76,815 - - 76,815
FIDELITY BANK PLC
NOTES TO THE ACCOUNTS
FOR THE PERIOD ENDED 31 MARCH 2018
31 March 31 March 31 December
2018 2017 2017
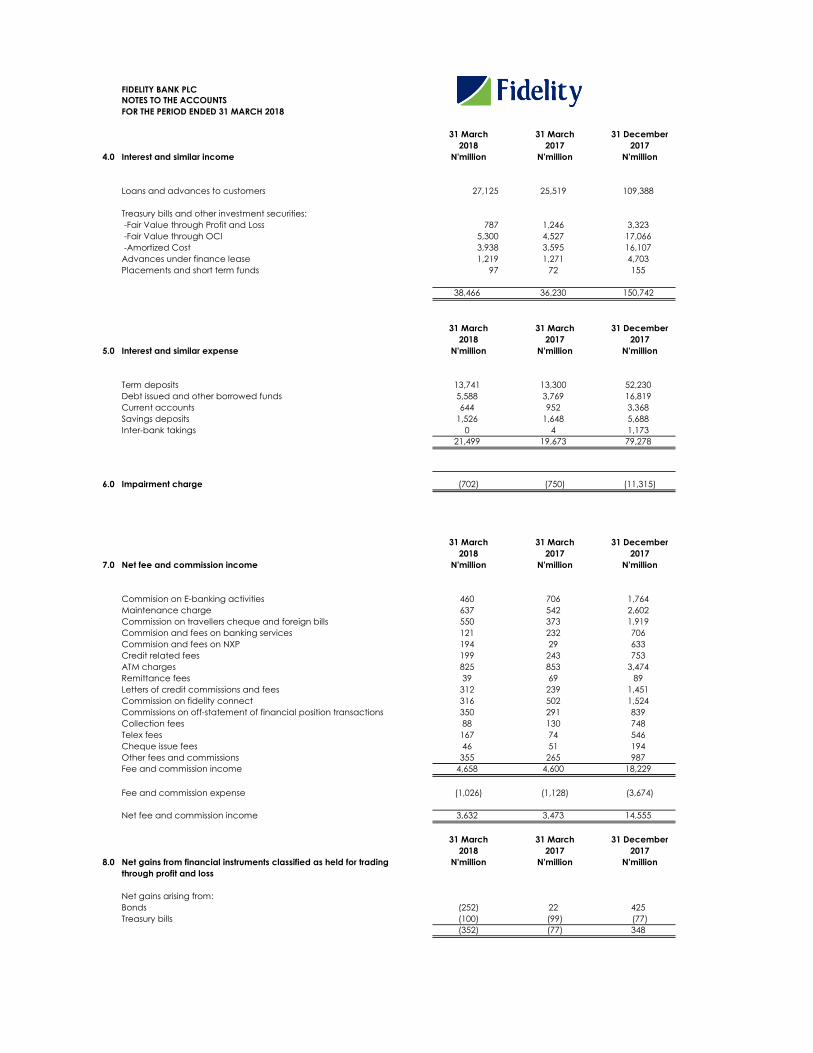
4.0 Interest and similar income N'million N'million N'million
Loans and advances to customers 27,125 25,519 109,388
Treasury bills and other investment securities:
-Fair Value through Profit and Loss 787 1,246 3,323
-Fair Value through OCI 5,300 4,527 17,066
-Amortized Cost 3,938 3,595 16,107
Advances under finance lease 1,219 1,271 4,703
Placements and short term funds 97 72 155
38,466 36,230 150,742
31 March 31 March 31 December
2018 2017 2017
5.0 Interest and similar expense N'million N'million N'million
Term deposits 13,741 13,300 52,230
Debt issued and other borrowed funds 5,588 3,769 16,819
Current accounts 644 952 3,368
Savings deposits 1,526 1,648 5,688
Inter-bank takings 0 4 1,173
21,499 19,673 79,278
6.0 Impairment charge (702) (750) (11,315)
31 March 31 March 31 December
2018 2017 2017
7.0 Net fee and commission income N'million N'million N'million
Commision on E-banking activities 460 706 1,764
Maintenance charge 637 542 2,602
Commission on travellers cheque and foreign bills 550 373 1,919
Commision and fees on banking services 121 232 706
Commision and fees on NXP 194 29 633
Credit related fees 199 243 753
ATM charges 825 853 3,474
Remittance fees 39 69 89
Letters of credit commissions and fees 312 239 1,451
Commission on fidelity connect 316 502 1,524
Commissions on off-statement of financial position transactions 350 291 839
Collection fees 88 130 748
Telex fees 167 74 546
Cheque issue fees 46 51 194
Other fees and commissions 355 265 987
Fee and commission income 4,658 4,600 18,229
Fee and commission expense (1,026) (1,128) (3,674)
Net fee and commission income 3,632 3,473 14,555
31 March 31 March 31 December
2018 2017 2017
8.0 Net gains from financial instruments classified as held for trading N'million N'million N'million
through profit and loss
Net gains arising from:
Bonds (252) 22 425
Treasury bills (100) (99) (77)
(352) (77) 348
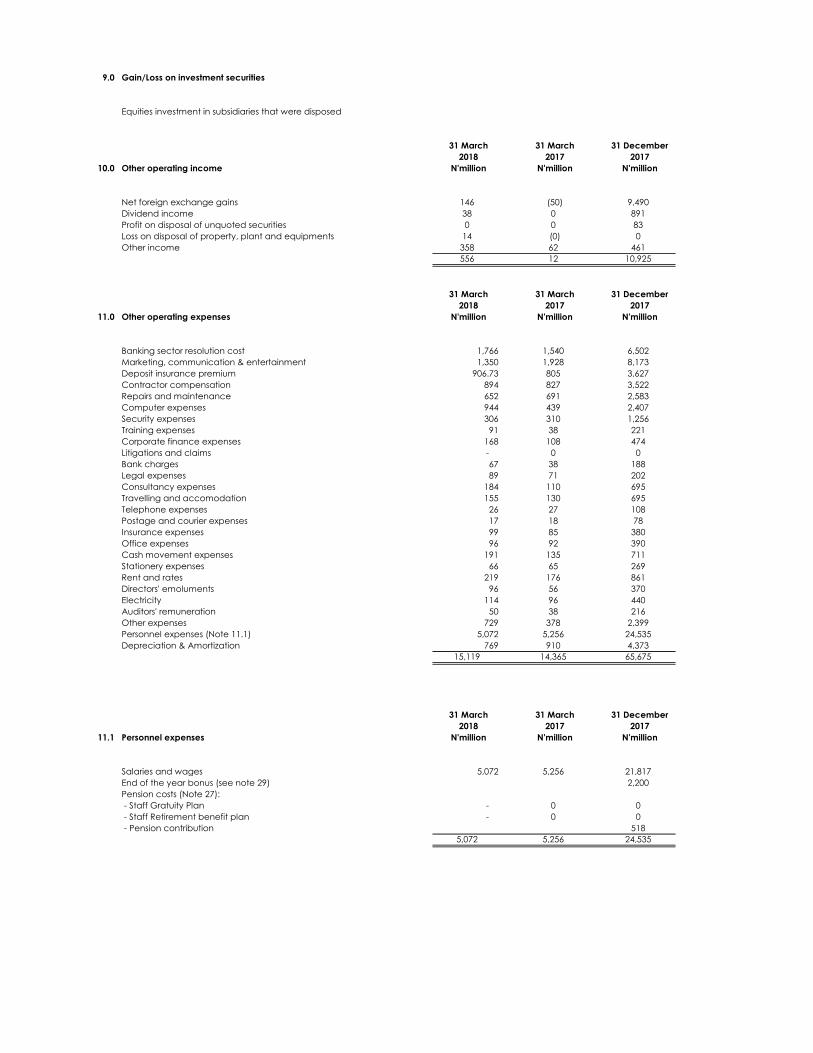
9.0 Gain/Loss on investment securities
Equities investment in subsidiaries that were disposed
31 March 31 March 31 December
2018 2017 2017
10.0 Other operating income N'million N'million N'million
Net foreign exchange gains 146 (50) 9,490
Dividend income 38 0 891
Profit on disposal of unquoted securities 0 0 83
Loss on disposal of property, plant and equipments 14 (0) 0
Other income 358 62 461
556 12 10,925
31 March 31 March 31 December
2018 2017 2017
11.0 Other operating expenses N'million N'million N'million
Banking sector resolution cost 1,766 1,540 6,502
Marketing, communication & entertainment 1,350 1,928 8,173
Deposit insurance premium 906.73 805 3,627
Contractor compensation 894 827 3,522
Repairs and maintenance 652 691 2,583
Computer expenses 944 439 2,407
Security expenses 306 310 1,256
Training expenses 91 38 221
Corporate finance expenses 168 108 474
Litigations and claims - 0 0
Bank charges 67 38 188
Legal expenses 89 71 202
Consultancy expenses 184 110 695
Travelling and accomodation 155 130 695
Telephone expenses 26 27 108
Postage and courier expenses 17 18 78
Insurance expenses 99 85 380
Office expenses 96 92 390
Cash movement expenses 191 135 711
Stationery expenses 66 65 269
Rent and rates 219 176 861
Directors' emoluments 96 56 370
Electricity 114 96 440
Auditors' remuneration 50 38 216
Other expenses 729 378 2,399
Personnel expenses (Note 11.1) 5,072 5,256 24,535
Depreciation & Amortization 769 910 4,373
15,119 14,365 65,675
31 March 31 March 31 December
2018 2017 2017
11.1 Personnel expenses N'million N'million N'million
Salaries and wages 5,072 5,256 21,817
End of the year bonus (see note 29) 2,200
Pension costs (Note 27):
- Staff Gratuity Plan - 0 0
- Staff Retirement benefit plan - 0 0
- Pension contribution 518
5,072 5,256 24,535
31 March 31 March 31 December
2018 2017 2017
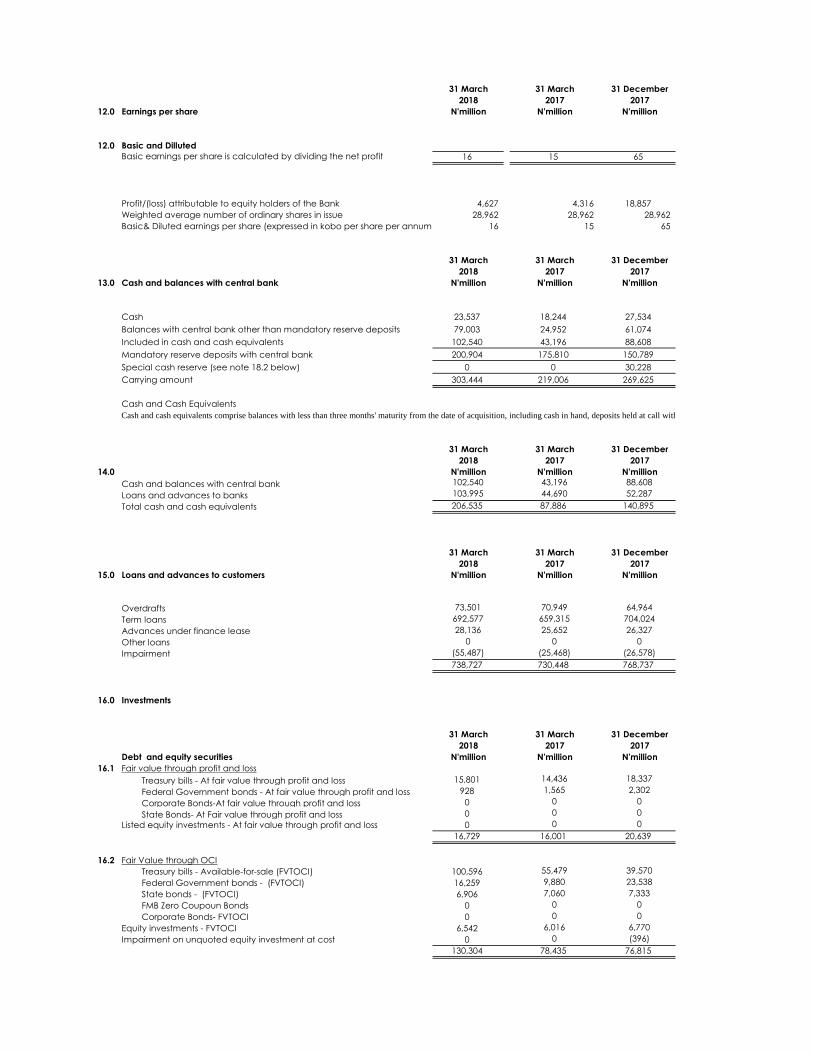
12.0 Earnings per share N'million N'million N'million
12.0 Basic and Dilluted
16 15 65
Profit/(loss) attributable to equity holders of the Bank 4,627 4,316 18,857
Weighted average number of ordinary shares in issue 28,962 28,962 28,962
Basic& Diluted earnings per share (expressed in kobo per share per annum) 16 15 65
31 March 31 March 31 December
2018 2017 2017
13.0 Cash and balances with central bank N'million N'million N'million
Cash 23,537 18,244 27,534
Balances with central bank other than mandatory reserve deposits 79,003 24,952 61,074
Included in cash and cash equivalents 102,540 43,196 88,608
Mandatory reserve deposits with central bank 200,904 175,810 150,789
Special cash reserve (see note 18.2 below) 0 0 30,228
Carrying amount 303,444 219,006 269,625
Cash and Cash Equivalents
31 March 31 March 31 December
2018 2017 2017
14.0 N'million N'million N'million
Cash and balances with central bank 102,540 43,196 88,608
Loans and advances to banks 103,995 44,690 52,287
Total cash and cash equivalents 206,535 87,886 140,895
31 March 31 March 31 December
2018 2017 2017
15.0 Loans and advances to customers N'million N'million N'million
Overdrafts 73,501 70,949 64,964
Term loans 692,577 659,315 704,024
Advances under finance lease 28,136 25,652 26,327
Other loans 0 0 0
Impairment (55,487) (25,468) (26,578)
738,727 730,448 768,737
16.0 Investments
31 March 31 March 31 December
2018 2017 2017
Debt and equity securities N'million N'million N'million
16.1 Fair value through profit and loss
Treasury bills - At fair value through profit and loss 15,801 14,436 18,337
Federal Government bonds - At fair value through profit and loss 928 1,565 2,302
Corporate Bonds-At fair value through profit and loss 0 0 0
State Bonds- At Fair value through profit and loss 0 0 0
Listed equity investments - At fair value through profit and loss 0 0 0
16,729 16,001 20,639
16.2 Fair Value through OCI
Treasury bills - Available-for-sale (FVTOCI) 100,596 55,479 39,570
Federal Government bonds - (FVTOCI) 16,259 9,880 23,538
State bonds - (FVTOCI) 6,906 7,060 7,333
FMB Zero Coupoun Bonds 0 0 0
Corporate Bonds- FVTOCI 0 0 0
Equity investments - FVTOCI 6,542 6,016 6,770
Impairment on unquoted equity investment at cost 0 0 (396)
130,304 78,435 76,815
Basic earnings per share is calculated by dividing the net profit
Cash and cash equivalents comprise balances with less than three months' maturity from the date of acquisition, including cash in hand, deposits held at call with other banks and other short-term highly liquid investments with original maturities less than three months.
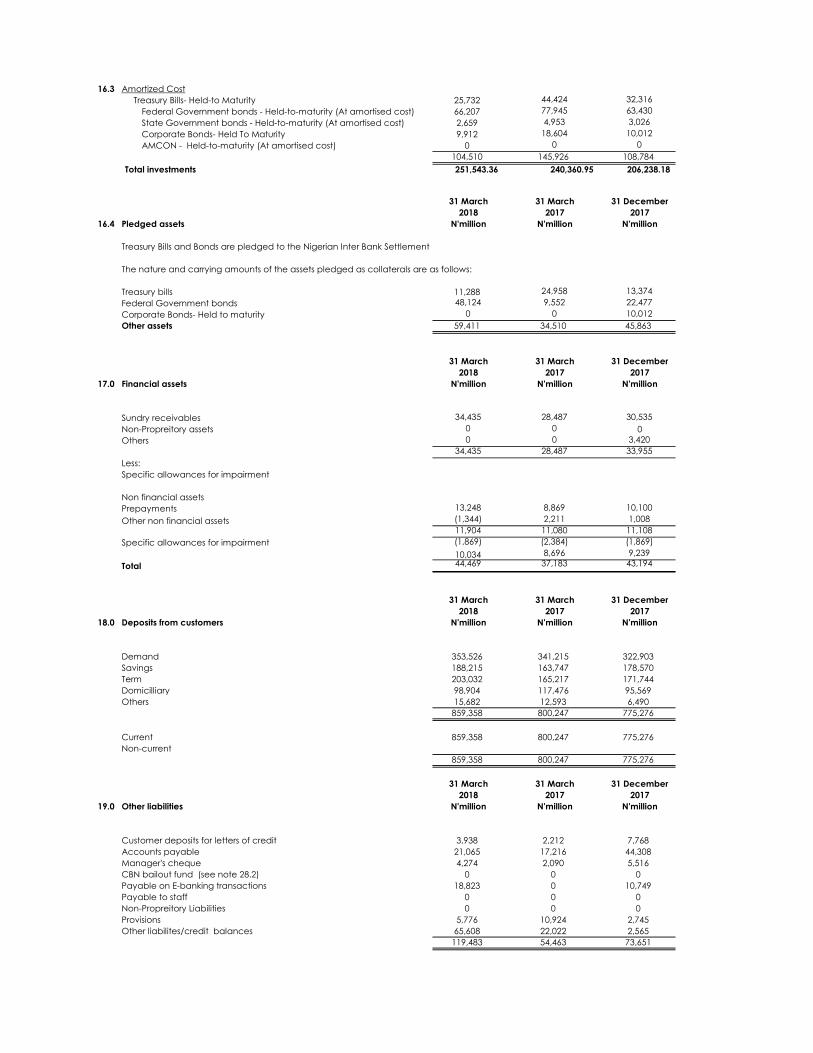
16.3 Amortized Cost
Treasury Bills- Held-to Maturity 25,732 44,424 32,316
Federal Government bonds - Held-to-maturity (At amortised cost) 66,207 77,945 63,430
State Government bonds - Held-to-maturity (At amortised cost) 2,659 4,953 3,026
Corporate Bonds- Held To Maturity 9,912 18,604 10,012
AMCON - Held-to-maturity (At amortised cost) 0 0 0
104,510 145,926 108,784
Total investments 251,543.36 240,360.95 206,238.18
31 March 31 March 31 December
2018 2017 2017
16.4 Pledged assets N'million N'million N'million
The nature and carrying amounts of the assets pledged as collaterals are as follows:
Treasury bills 11,288 24,958 13,374
Federal Government bonds 48,124 9,552 22,477
Corporate Bonds- Held to maturity 0 0 10,012
Other assets 59,411 34,510 45,863
31 March 31 March 31 December
2018 2017 2017
17.0 Financial assets N'million N'million N'million
Sundry receivables 34,435 28,487 30,535
Non-Propreitory assets 0 0 0
Others 0 0 3,420
34,435 28,487 33,955
Less:
Specific allowances for impairment
Non financial assets
Prepayments 13,248 8,869 10,100
Other non financial assets (1,344) 2,211 1,008
11,904 11,080 11,108
Specific allowances for impairment (1,869) (2,384) (1,869)
10,034 8,696 9,239
Total 44,469 37,183 43,194
31 March 31 March 31 December
2018 2017 2017
18.0 Deposits from customers N'million N'million N'million
Demand 353,526 341,215 322,903
Savings 188,215 163,747 178,570
Term 203,032 165,217 171,744
Domicilliary 98,904 117,476 95,569
Others 15,682 12,593 6,490
859,358 800,247 775,276
Current 859,358 800,247 775,276
Non-current
859,358 800,247 775,276
31 March 31 March 31 December
2018 2017 2017
19.0 Other liabilities N'million N'million N'million
Customer deposits for letters of credit 3,938 2,212 7,768
Accounts payable 21,065 17,216 44,308
Manager's cheque 4,274 2,090 5,516
CBN bailout fund (see note 28.2) 0 0 0
Payable on E-banking transactions 18,823 0 10,749
Payable to staff 0 0 0
Non-Propreitory Liabilities 0 0 0
Provisions 5,776 10,924 2,745
Other liabilites/credit balances 65,608 22,022 2,565
119,483 54,463 73,651
Treasury Bills and Bonds are pledged to the Nigerian Inter Bank Settlement
31 March 31 March 31 December
2018 2017 2017
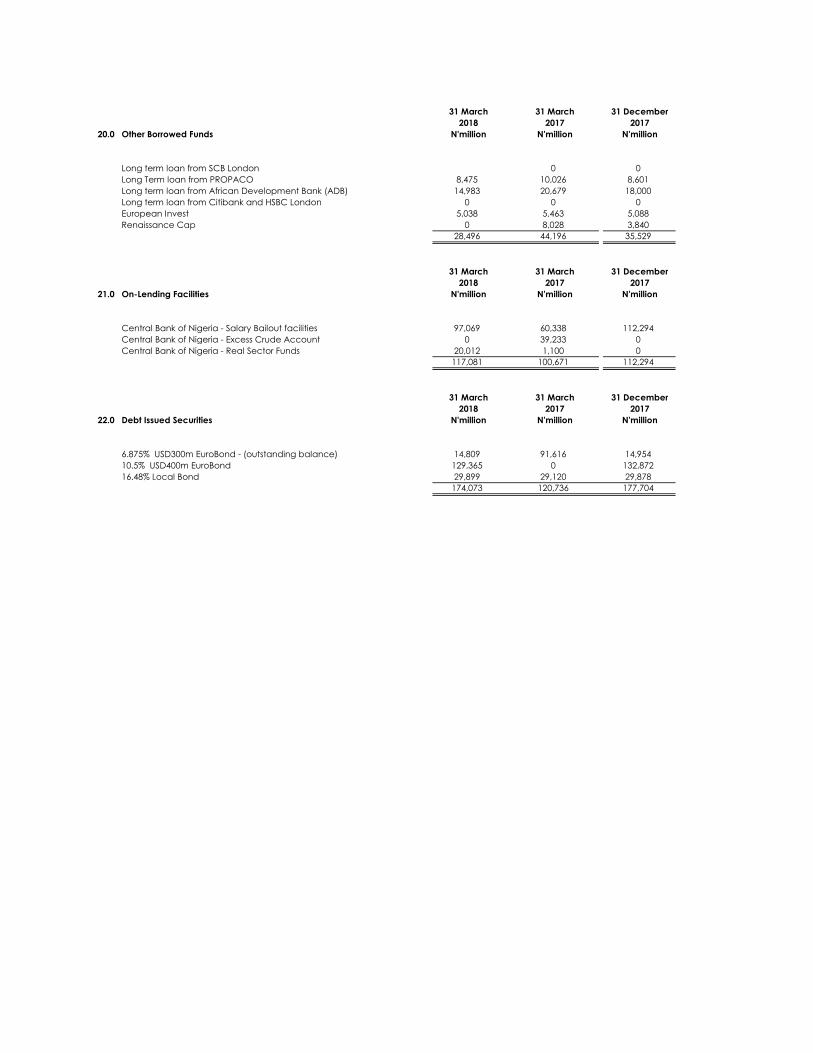
20.0 Other Borrowed Funds N'million N'million N'million
Long term loan from SCB London 0 0
Long Term loan from PROPACO 8,475 10,026 8,601
Long term loan from African Development Bank (ADB) 14,983 20,679 18,000
Long term loan from Citibank and HSBC London 0 0 0
European Invest 5,038 5,463 5,088
Renaissance Cap 0 8,028 3,840
28,496 44,196 35,529
31 March 31 March 31 December
2018 2017 2017
21.0 On-Lending Facilities N'million N'million N'million
Central Bank of Nigeria - Salary Bailout facilities 97,069 60,338 112,294
Central Bank of Nigeria - Excess Crude Account 0 39,233 0
Central Bank of Nigeria - Real Sector Funds 20,012 1,100 0
117,081 100,671 112,294
31 March 31 March 31 December
2018 2017 2017
22.0 Debt Issued Securities N'million N'million N'million
6.875% USD300m EuroBond - (outstanding balance) 14,809 91,616 14,954
10.5% USD400m EuroBond 129,365 0 132,872
16.48% Local Bond 29,899 29,120 29,878
174,073 120,736 177,704