fidelity japanese half-yearly report:layout 1… · the remaining emissions offset in a carbon...
TRANSCRIPT

The printing inks used for this report are made from vegetable based oils and 95% of cleaning solvents are recycled for further use. The electricity was all generated from renewable sources and on average 87% of any waste associated with thisproduction will be recycled. Printed using pureprint® environmental print technologyby a CarbonNeutral® company, registered to the Environmental Management System, ISO 14001 and EMAS, the Eco Management and Audit Scheme.
The FSC logo identifies products which contain wood from well managed forestscertified in accordance with the rules of the Forest Stewardship Council.
This document is printed on Revive 50:50, a paper containing 50% recovered fibre & 50% virgin fibre. Pulps used are elemental chlorine free, manufactured at a mill with the ISO 14001 Environmental Management System.
The carbon emissions from this publication have been assessed and reduced with the remaining emissions offset in a carbon reduction project.
Cert no. SGS-COC-0620
Managed by
Fidelity JapaneseValues PLC
Half-Yearly Report
For the 6 months ended 30 June 2008

Contents
Investment Objective & Performance Summary 1
Summary of Results 2
Half-Yearly Report 3
Directors’ Responsibility Statement 6
Top 20 Holdings 7
Financial Statements 8
Investor Information 16
Directory 17
Investment Objective
The investment objective of the Company is to achieve long term capital growth from an actively managed portfolio of securities primarilyof small and medium-sized Japanese companies listed or traded onJapanese stockmarkets.
Performance
6 months to30 June 2008 30 June 2008
Net asset value per share 61.80p -7.3%
Share price 54.25p -7.3%
Russell Nomura Mid/Small Cap Index1 1.600 -7.9%
1 Sterling adjusted
Standardised performance on a total return basis
30/06/03 30/06/04 30/06/05 30/06/06 30/06/07to to to to to
30/06/04 30/06/05 30/06/06 30/06/07 30/06/08
Net asset value per share +81.1% +0.6% +18.3% -23.0% -17.4%
Share price +99.3% -1.3% +20.1% -23.9% -19.0%
Sources: Fidelity and DatastreamPast performance is not a guide to future returns. The value of your investment can go down as well as up,and may be affected by exchange rate fluctuations
Fidelity Japanese Values PLC Half-Yearly Report 2008 Page 1

Half-Yearly Report
PERFORMANCEJapanese equities suffered a series of sharpdeclines during the first half of the reviewperiod, falling to their lowest level since mid2005. Investor confidence was undermined by a combination of weak economic indicatorsboth overseas and in Japan, turmoil in financialsectors precipitated by the sub-prime crisisand tightening credit markets, record high oilprices and dollar weakness. After bottoming in mid March, Japanese equities enjoyed abrief respite, but this was insufficient to erasethe losses generated earlier in the year. Inrelative terms, however, Japan continued tooutperform most other developed markets.This may be attributed to the fact that Japan’sbanks appeared to have emerged relativelyunscathed from the sub-prime crisis. It isnoteworthy that over both five and ten yearperiods the Topix index in USD terms has nowoutperformed the S&P500 index in the UnitedStates by a clear margin.
During the review period, large-cap stockscontinued to outperform their medium andsmall cap counterparts. This pattern is oftenobserved in a deteriorating economicenvironment as smaller companies tend to be more cyclically exposed and suffer more as liquidity is withdrawn from the market.Indeed, small companies’ earnings for fiscal2007 fell by 0.3%, a significant downgradefrom their initial target of double-digit growth.Commodity related stocks in the fishery,agriculture & forestry, mining and wholesalesectors achieved the most significant gains,helped by rising food, energy and metalprices. In contrast, apparel, precisioninstrument and real estate companies wereamong the worst performers. This contrastbetween global shortages in key commoditiesand hence rising prices and the deflationaryeffects of a slowdown in housing activity andthe broader economy was apparent in theJapanese market as it was in many otherglobal economies.
During the last six months, your Company’snet asset value declined by 7.3%, but itmarginally outperformed its benchmark theRussell Nomura Mid/Small Cap Index, whichfell by 7.9%. We are pleased to inform youthat your Company was the best performinginvestment trust within its peer group over the review period.
As a result of the decline in the value of thegross assets the gearing level has risencommensurately. In turn the gearing inevitably
Fidelity Japanese Values PLC Half-Yearly Report 2008 Page 3
Summary of Results
Page 2 Fidelity Japanese Values PLC Half-Yearly Report 2008
30 June 31 December2008 2007 % change
Assets
Total assets employed1 £74.11m £79.03m -6.2
Shareholders’ funds £59.06m £64.69m -8.7
Borrowings less cash as % of shareholders’ funds 24.8% 20.7%
Net asset value per share 61.80p 66.67p -7.3
Stockmarket Data
Russell Nomura Mid/Small Cap Index 1.600 1.738 -7.9
Yen/£ exchange rate 211.33 221.69 4.7
Share price period end 54.25p 58.50p -7.3
high 62.00p 83.00p
low 44.50p 55.50p
(Discount)/premium period end (12.2)% (12.3)%
low (19.0)% (17.5)%
high (7.1)% 1.4%
Returns for the six months to 30 June 2008 2007
Capital loss per ordinary share (5.08p) (4.68p)
Capital + revenue loss per ordinary share (5.15p) (4.87p)
1 Total assets less current liabilities, excluding fixed term loan liabilities
Sources: Fidelity and DatastreamPast performance is not a guide to future returns. The value of your investment can go down as well as up,and may be affected by exchange rate fluctuations
30Jun
2008
31Dec2007
31Jan
2008
29Feb2008
31Mar2008
30Apr
2008
31May2008
95
90
85
80
NAV Share price Russell Nomura
-7.9%-7.3%-7.3%
105
100
In sterling termsSources: Fidelity and DatastreamPlease note that past performance is not a guide to futurereturns. The value of your investment can go down as well as up, and may be affected by exchange rate fluctuations.
Half yearly report Net Asset Value @ 31 December 2007 66.67p
Impact of change in the Russell Nomura -7.85p Mid/Small Cap Index (in yen terms)
Impact of stock selection (in yen terms) 1.49p
Impact of currency 3.18p
Impact of gearing -1.41p
Impact of share repurchases 0.13p
Impact of other costs -0.41p
Net Asset Value @ 30 June 2008 61.80p
Performance for the six months to 30 June 2008

Half-Yearly Report
the future, the more developed European and US economies remain very important.
On the domestic front, the effects ofregulatory changes on the housing industryhave run their course and both regular wagesand labour’s share of GDP are showing signsof bottoming. However, the prospect of asustainable recovery in personal consumptionremains uncertain, as weaker employmentconditions, lacklustre bonus payments andcost-push inflation are likely to keep a lid onreal incomes. Meanwhile, corporate surveysconducted by the Ministry of Finance and theBank of Japan point towards a softening infixed investment as slowing demand andrising costs erode earnings.
While higher inflation could be seen asuniversally negative for most of the world’smajor economies, it may be beneficial forJapan. The economy has shown signs ofemerging from its deflationary past, and therecent bout of cost-push inflation may besufficient to start changing consumerbehaviour. It is this potential change ofmindset, should Japan emerge from an era of flat or falling prices, that remains the mostintriguing part of the development of theeconomy over the next two years. Thepotential for domestic growth, should thisoccur, remains substantial.
In addition to the fact that inflation may well be positive for the Japanese economy,Japan remains relatively well insulated fromsome of the other ills currently blowingthrough the international economy. Firstly,financial institutions’ subprime-related lossesare relatively small. According to Bloomberg,Japan’s asset write-downs and credit lossesamounted to just $14.9 billion or 3.8% of theglobal total. Secondly, Japan does not facethe problem of dealing with deflating propertymarkets that had supported privateconsumption growth.
On an absolute and relative valuation basis,the Japanese stockmarket is positioned toemerge from this downturn as a moreattractive place to invest. In the past, it hasbeen much more difficult to justify share pricevaluations, particularly compared to similarcompanies listed elsewhere in the world. Nowhowever, whether the focus is on PBR, PER or EV/EBITDA, Japanese valuations do notappear to be significantly different from otherdeveloped markets. It is also noticeable thatthe TSE first section dividend yield continuesto exceed the yield on ten year JapaneseGovernment Bonds, a situation that has actedas a solid support for the market in the past.
In this environment we remain relativelycautious and expect volatile market conditions to endure for the time being.Nonetheless, we believe that valuations aresupportive, the economy has avoided many of the asset market excesses that plague many western economies and any emerginginflation could be beneficial for the Japaneseeconomy. We will continue to seekopportunities to build positions in companiesthat are able to reap the benefit of a recoveryover the medium term.
PRINCIPAL RISKS ANDUNCERTAINTIESThe Board believes that the principal risks and uncertainties faced by theCompany continue to fall into two broadcategories. The first, external risks, beingstockmarket, share price and currency and the second, internal risks, beinginvestment management, governance/regulatory, financial and operationaladministration. Information on each of these is given in the Business Review section of the Annual Report for the year ended 31 December 2007.
By order of the BoardFIL Investments International28 July 2008
Fidelity Japanese Values PLC Half-Yearly Report 2008 Page 5
Half-Yearly Report
Page 4 Fidelity Japanese Values PLC Half-Yearly Report 2008
had a negative impact on the Company’sequity portfolio. The Board’s view is that overthe longer term the progress of the portfolioin which we are invested will result in highershare prices (more of which later) and thattherefore to reduce borrowings at a depressedlevel of the market is not in the long terminterests of shareholders.
Your Company’s outperformance relative tothe benchmark index and the peer group islargely attributable to successful stockselection in the wholesale, glass & ceramicsand information & communication sectors.The Manager continued to focus oncompanies whose earnings growth potential is underestimated by the stockmarket. In thewholesale sector, holdings in conglomerates,particularly Mitsubishi Corporation and Mitsui& Co, proved rewarding as their metal andenergy businesses benefited from highercommodity prices. In the glass & ceramicssector, a glass maker, Nippon Electric Glass(“NEG”), which produces glass substrate forLCD panels, outperformed. We determinedthat NEG would continue to benefit from thesecular growth trend in the LCD market, as theflat panel TV market is growing rapidly and theaverage size of a TV panel is increasing. In theinformation & communication sector, Dwangoaided performance. The firm provides internetcontents designed for mobile phone access.Expectations for a turnaround in its loss-making business unit boosted the share priceperformance during the first half of the reviewperiod. We sold the entire position and tookprofit in Dwango, as it achieved our targetprice. Other major contributors includedHisaka Works, a niche machinery maker that produces heat exchangers for LNG andnuclear power plants; Kakaku.Com, an on-lineprice comparison shopping engine, and MitsuiO.S.K. Lines, a shipping company.
On the other hand, holdings in the electricalmachinery and metal products detracted fromperformance relative to the benchmark. In the
electrical machinery sector, the largestdetractor was Nippon Dempa Kogyo, which makes quartz crystals products used for mobile phones. Slower sales growth andtougher price competition resulted in theweaker than expected earnings for fiscal 2007.In the metal products sector, the performanceof Sumco and Sumco Tech xiv wasdisappointing. Although the Manager sold off the entire positions in these semiconductormakers by the end of February, their shareprice declines during the first two months ofthe year partially offset the relative returns.
THE MARKET & OUTLOOKLooking ahead, renewed concerns about thecredit crisis, slowing global growth and recordresource and energy prices could exert furtherdownward pressure on global equity markets.It is this deterioration in the relationshipbetween growth and inflation – commonlyreferred to as stagflation – that creates adifficult backdrop for equities. However, it hasbecome increasingly clear this year that whilstJapan remains a cyclically exposed economy,it has been much less exposed to some of theexcesses that have dominated Westerneconomies and should therefore be moreprotected on the downside.
As the first quarter GDP data demonstrated,external demand remains a key driver for theJapanese economy. The outlook here remainsdecidedly mixed. Demand in the US hasslowed considerably and a tighter monetarypolicy in Europe suggests a tougherenvironment ahead. Moreover, it seems likelythat the unwinding of the excesses in manyoverseas asset markets could dampen privateconsumption – and hence export demandfrom Japan – for some time. Whilst GDP datashows that Japan’s reliance on Asia has grownsignificantly, it should be remembered that aproportion of this production is for re-exportand that many Asian economies still haveunderdeveloped private consumption. Thuswhile Asia represents a key area of growth in

Top 20 Holdings as at 30 June 2008
Market Value Holding £’000 %1
Daicel Chemical IndustriesChemical manufacturer 2,751 3.7 Nippon Electric Glass Manufactures and supplies high technology glass products 2,385 3.2 JSR Manufactures and sells synthetic rubber and resins 2,313 3.1 Mitsui & CoGeneral trading 2,294 3.1 Mitsubishi Corporation General trading 2,051 2.8 Mitsui O.S.K. Lines Supplies marine transportation, warehousing and cargo handling services 1,957 2.6 Asahi Glass Glass manufacturer 1,929 2.6 Kakaku.com Provides price comparison services and product information 1,760 2.4 Hitachi Chemical Chemical manufacturer 1,718 2.3 FP Manufactures polystyrene and synthetic resins 1,548 2.1 Stanley Electric Manufactures lighting equipment 1,531 2.1 Tamron Manufactures lenses for electrical equipment 1,451 2.0 Hisaka Works Manufactures industrial equipment 1,429 1.9 Konica Minolta Holdings Manufactures photo films for medical, office and general use 1,320 1.8 Mitsubishi Electric Develops, manufactures and markets electronic equipment 1,255 1.7 Nikon Manufactures and sells cameras, lenses and measuring instruments 1,211 1.6Sumitomo Electric Industries Manufactures electric wires, cables and related equipment 1,197 1.6 Kappa Create General food retailing 1,163 1.6 Ajinomoto General trading 1,159 1.6 Mizuho Financial Group General financing business 1,116 1.5 Top 20 holdings 33,538 45.3
1 % total assets less current liabilities excluding loan liabilities
Fidelity Japanese Values PLC Half-Yearly Report 2008 Page 7
Directors’ Responsibility Statement
Page 6 Fidelity Japanese Values PLC Half-Yearly Report 2008
The Directors confirm to the best of theirknowledge that:
a) the condensed set of financial statements contained within the half-yearly financial report has been preparedin accordance with the UK AccountingStandards Board’s Statement ‘Half YearlyFinancial Reports’;
b) the half-yearly report narrative on pages3, 4 and 5 (constituting the interimmanagement report) includes a fairreview of the information required byRule 4.2.7R of the FSA’s Disclosure andTransparency Rules and their impact onthe condensed set of financial statementsand a description of the principal risksand uncertainties for the remaining sixmonths of the financial year; and
c) in accordance with Disclosure andTransparency Rule 4.2.8R there havebeen no related parties transactionsduring the six months to 30 June 2008and therefore nothing to report on anymaterial effect by such a transaction onthe financial position or the performanceof the Company during that period; andthere have been no changes in thisposition since the last annual report thatcould have a material effect on thefinancial position or performance of theCompany in the first six months of thecurrent financial year.
The half-yearly financial report has not been audited or reviewed by theCompany’s auditors.
The half-yearly financial report wasapproved by the Board on 28 July 2008 and the above responsibility statement was signed on its behalf by WilliamThomson, Chairman.

for the six months ended 30.06.08 for the year ended 31.12.07 for the six months ended 30.06.07unaudited audited unaudited
revenue capital total revenue capital total revenue capital totalNotes £’000 £’000 £’000 £’000 £’000 £’000 £’000 £’000 £’000
Losses on investments – (4,478) (4,478) – (11,710) (11,710) – (5,279) (5,279)
Income 2 623 – 623 991 – 991 547 – 547
Investment management fee (363) – (363) (850) – (850) (440) – (440)
Other expenses (172) – (172) (354) – (354) (160) – (160)
Exchange (losses)/gains (1) 299 298 3 203 206 – (103) (103)
Exchange (losses)/gains on loans – (702) (702) – (708) (708) – 790 790________ ________ ________ ________ ________ ________ ________ ________ ________
Net return/(loss) before finance costs and taxation 87 (4,881) (4,794) (210) (12,215) (12,425) (53) (4,592) (4,645)
Interest payable (112) – (112) (202) – (202) (96) – (96)________ ________ ________ ________ ________ ________ ________ ________ ________
Net loss on ordinary activities before taxation (25) (4,881) (4,906) (412) (12,215) (12,627) (149) (4,592) (4,741)
Taxation on ordinary activities 3 (44) – (44) (69) – (69) (38) – (38)________ ________ ________ ________ ________ ________ ________ ________ ________
Net loss on ordinary activities after taxation for the period (69) (4,881) (4,950) (481) (12,215) (12,696) (187) (4,592) (4,779)____ ____ ____ ____ ____ ____ ____ ____ ____Loss per ordinary share 4 (0.07p) (5.08p) (5.15p) (0.49p) (12.52p) (13.01p) (0.19p) (4.68p) (4.87p)____ ____ ____ ____ ____ ____ ____ ____ ____
Fidelity Japanese Values PLC Half-Yearly Report 2008 Page 9
Income Statement
Page 8 Fidelity Japanese Values PLC Half-Yearly Report 2008
A Statement of Total Recognised Gains and Losses has not been prepared as there are no gains andlosses other than those reported in this Income Statement.
The total column of the Income Statement is the profit and loss account of the Company.
These financial statements have been prepared in accordance with the AIC Statement of RecommendedPractice (“SORP”) issued in January 2003 and revised in December 2005.

called up share capital capital capitalshare premium redemption other reserve reserve revenue total
capital account reserve reserve realised unrealised reserve equity£’000 £’000 £’000 £’000 £’000 £’000 £’000 £’000
Opening shareholders’ funds: 1 January 2007 24,551 44 1,780 60,369 17,497 (14,215) (11,860) 78,166
Net recognised (losses)/gains for the period – – – – (8,038) 3,446 – (4,592)
Repurchase of ordinary shares (257) – 257 – (681) – – (681)
Net revenue loss for the period – – – – – – (187) (187)________ ________ ________ ________ ________ ________ ________ ________
Closing shareholders’ funds: 30 June 2007 24,294 44 2,037 60,369 8,778 (10,769) (12,047) 72,706____ ____ ____ ____ ____ ____ ____ ____
Opening shareholders’ funds: 1 January 2007 24,551 44 1,780 60,369 17,497 (14,215) (11,860) 78,166
Net recognised (losses)/gains for the year – – – – (25,637) 13,422 – (12,215)
Repurchase of ordinary shares (295) – 295 (778) – – – (778)
Net revenue loss for the year – – – – – – (481) (481)________ ________ ________ ________ ________ ________ ________ ________
Closing shareholders’ funds: 31 December 2007 24,256 44 2,075 59,591 (8,140) (793) (12,341) 64,692
Transfer between reserves* – – – – (2,526) 2,526 – –
Net recognised losses for the year – – – – (4,159) (722) – (4,881)
Repurchase of ordinary shares (362) – 362 (679) – – – (679)
Net revenue loss for the period – – – – – – (69) (69)________ ________ ________ ________ ________ ________ ________ ________
Closing shareholders’ funds: 30 June 2008 23,894 44 2,437 58,912 (14,825) 1,011 (12,410) 59,063____ ____ ____ ____ ____ ____ ____ ____
Fidelity Japanese Values PLC Half-Yearly Report 2008 Page 11
Reconciliation of Movements in Shareholders’ Funds for the period ended 30 June 2008
Page 10 Fidelity Japanese Values PLC Half-Yearly Report 2008
* In accordance with TECH 02/07: Distributable Profits – with effect from 1 January 2008, changes in fair value of investments which are readily convertible to cash, without accepting adverse terms, at thebalance sheet date are included in realised, rather than unrealised, capital reserves. The balances on both reserves at 1 January 2008 have been amended by a reserve transfer to reflect this change.

Cash Flow Statement
Fidelity Japanese Values PLC Half-Yearly Report 2008 Page 13
Balance Sheet
Page 12 Fidelity Japanese Values PLC Half-Yearly Report 2008
30.06.08 31.12.07 30.06.07unaudited audited unaudited
Notes £’000 £’000 £’000
Fixed assets
Investments at fair value through profit or loss 73,305 78,122 82,578________ ________ ________
Current assets
Debtors 1,512 392 283
Cash at bank 395 937 3,520________ ________ ________
1,907 1,329 3,803________ ________ ________
Creditors – amounts falling due within one year
Other creditors (1,106) (419) (833)________ ________ ________
Net current assets 801 910 2,970________ ________ ________
Total assets less current liabilities 74,106 79,032 85,548________ ________ ________
Creditors – amounts falling due after more than one year
Fixed rate unsecured loans 6 (15,043) (14,340) (12,842)________ ________ ________
Total net assets 59,063 64,692 72,706____ ____ ____Capital and reserves
Called up share capital 23,894 24,256 24,294
Share premium account 44 44 44
Capital redemption reserve 2,437 2,075 2,037
Other reserve 58,912 59,591 60,369
Capital reserve - realised (14,825) (8,140) 8,778
Capital reserve - unrealised 1,011 (793) (10,769)
Revenue reserve (12,410) (12,341) (12,047)________ ________ ________
Total equity shareholders’ funds 59,063 64,692 72,706____ ____ ____Net asset value per ordinary share 7 61.80p 66.67p 74.82p____ ____ ____
30.06.08 31.12.07 30.06.07unaudited audited unaudited
£’000 £’000 £’000
Operating activities
Investment income received 563 925 512Interest received 2 4 2Investment management fee paid (339) (920) (505)Directors’ fees paid (39) (60) (40)Other cash payments (158) (347) (115)________ ________ ________Net cash inflow/(outflow) from operating activities 29 (398) (146)________ ________ ________Returns on investments and servicing of finance
Interest paid (111) (200) (97)________ ________ ________Net cash outflow from servicing of finance (111) (200) (97)________ ________ ________Financial investment
Purchase of investments (48,198) (115,268) (30,934)Disposal of investments 48,436 117,138 34,826________ ________ ________Net cash inflow from financial investment 238 1,870 3,892________ ________ ________Net cash inflow before financing 156 1,272 3,649________ ________ ________FinancingRepurchase of ordinary shares (679) (778) (493)________ ________ ________Net cash outflow from financing (679) (778) (493)________ ________ ________
(Decrease)/increase in cash (523) 494 3,156____ ____ ____
Notes to the Financial Statements
Fidelity Japanese Values PLC Half-Yearly Report 2008 Page 15
Notes to the Financial Statements
Page 14 Fidelity Japanese Values PLC Half-Yearly Report 2008
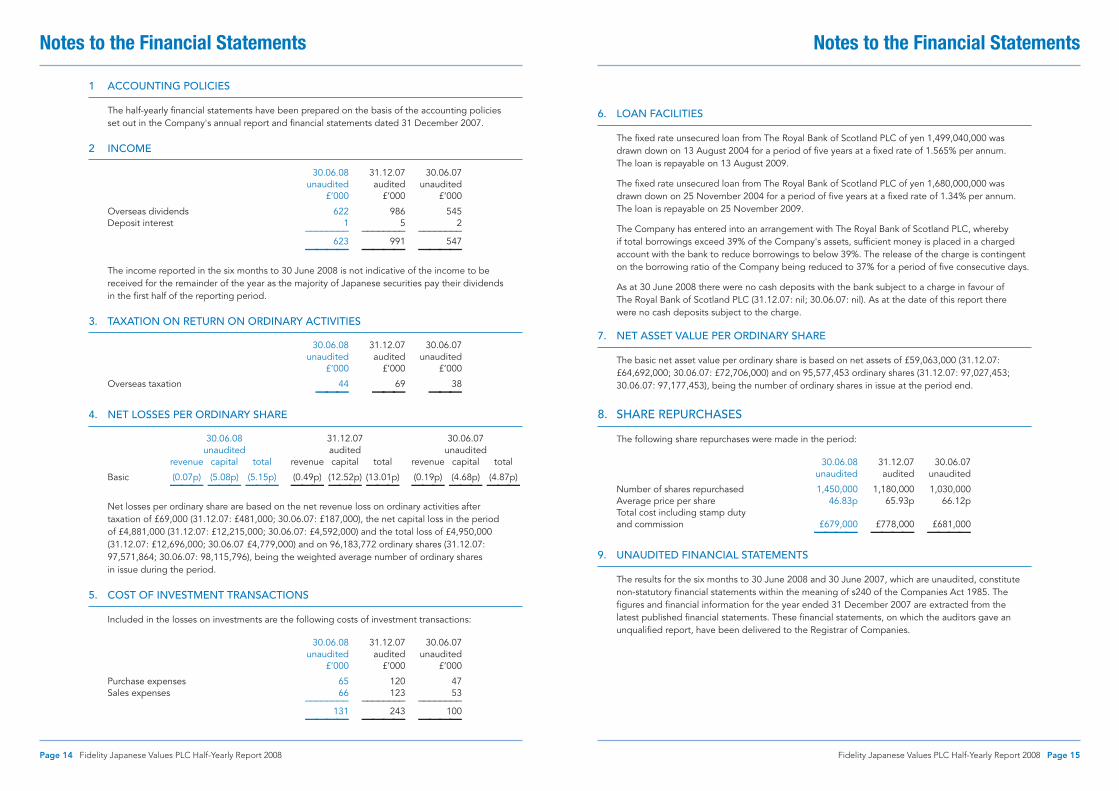
6. LOAN FACILITIES
The fixed rate unsecured loan from The Royal Bank of Scotland PLC of yen 1,499,040,000 wasdrawn down on 13 August 2004 for a period of five years at a fixed rate of 1.565% per annum. The loan is repayable on 13 August 2009.
The fixed rate unsecured loan from The Royal Bank of Scotland PLC of yen 1,680,000,000 wasdrawn down on 25 November 2004 for a period of five years at a fixed rate of 1.34% per annum.The loan is repayable on 25 November 2009.
The Company has entered into an arrangement with The Royal Bank of Scotland PLC, whereby if total borrowings exceed 39% of the Company's assets, sufficient money is placed in a chargedaccount with the bank to reduce borrowings to below 39%. The release of the charge is contingenton the borrowing ratio of the Company being reduced to 37% for a period of five consecutive days.
As at 30 June 2008 there were no cash deposits with the bank subject to a charge in favour of The Royal Bank of Scotland PLC (31.12.07: nil; 30.06.07: nil). As at the date of this report there were no cash deposits subject to the charge.
7. NET ASSET VALUE PER ORDINARY SHARE
The basic net asset value per ordinary share is based on net assets of £59,063,000 (31.12.07:£64,692,000; 30.06.07: £72,706,000) and on 95,577,453 ordinary shares (31.12.07: 97,027,453;30.06.07: 97,177,453), being the number of ordinary shares in issue at the period end.
8. SHARE REPURCHASES
The following share repurchases were made in the period:
30.06.08 31.12.07 30.06.07unaudited audited unaudited
Number of shares repurchased 1,450,000 1,180,000 1,030,000Average price per share 46.83p 65.93p 66.12pTotal cost including stamp duty and commission £679,000 £778,000 £681,000 ____ ____ ____
9. UNAUDITED FINANCIAL STATEMENTS
The results for the six months to 30 June 2008 and 30 June 2007, which are unaudited, constitutenon-statutory financial statements within the meaning of s240 of the Companies Act 1985. Thefigures and financial information for the year ended 31 December 2007 are extracted from the latest published financial statements. These financial statements, on which the auditors gave anunqualified report, have been delivered to the Registrar of Companies.
1 ACCOUNTING POLICIES
The half-yearly financial statements have been prepared on the basis of the accounting policies set out in the Company's annual report and financial statements dated 31 December 2007.
2 INCOME
30.06.08 31.12.07 30.06.07unaudited audited unaudited
£’000 £’000 £’000
Overseas dividends 622 986 545Deposit interest 1 5 2________ ________ ________
623 991 547____ ____ ____The income reported in the six months to 30 June 2008 is not indicative of the income to bereceived for the remainder of the year as the majority of Japanese securities pay their dividends in the first half of the reporting period.
3. TAXATION ON RETURN ON ORDINARY ACTIVITIES
30.06.08 31.12.07 30.06.07unaudited audited unaudited
£’000 £’000 £’000
Overseas taxation 44 69 38___ ___ ___4. NET LOSSES PER ORDINARY SHARE
30.06.08 31.12.07 30.06.07unaudited audited unaudited
revenue capital total revenue capital total revenue capital total
Basic (0.07p) (5.08p) (5.15p) (0.49p) (12.52p) (13.01p) (0.19p) (4.68p) (4.87p)___ ___ ___ ___ ___ ___ ___ ___ ___Net losses per ordinary share are based on the net revenue loss on ordinary activities after taxation of £69,000 (31.12.07: £481,000; 30.06.07: £187,000), the net capital loss in the period of £4,881,000 (31.12.07: £12,215,000; 30.06.07: £4,592,000) and the total loss of £4,950,000(31.12.07: £12,696,000; 30.06.07 £4,779,000) and on 96,183,772 ordinary shares (31.12.07:97,571,864; 30.06.07: 98,115,796), being the weighted average number of ordinary shares in issue during the period.
5. COST OF INVESTMENT TRANSACTIONS
Included in the losses on investments are the following costs of investment transactions:
30.06.08 31.12.07 30.06.07unaudited audited unaudited
£’000 £’000 £’000
Purchase expenses 65 120 47Sales expenses 66 123 53________ ________ ________
131 243 100____ ____ ____

Directory
BOARD OF DIRECTORSWilliam Thomson (Chairman)Nicholas Barber, CBE (Senior Independent Director)Simon FraserPhilip KayDavid Miller, OBE
MANAGER, SECRETARY ANDREGISTERED OFFICEFIL Investments InternationalBeech Gate, Millfield LaneLower KingswoodTadworthSurrey KT20 6RP
INDEPENDENT AUDITORSGrant Thornton UK LLPChartered Accountants and Registered Auditors30 Finsbury SquareLondon EC2P 2YU
Fidelity Japanese Values PLC Half-Yearly Report 2008 Page 17
BANKERS AND CUSTODIANJPMorgan Chase Bank (London Branch)125 London WallLondon EC2Y 5AJ
REGISTRARSCapita RegistrarsThe Registry34 Beckenham RoadBeckenhamKent BR3 4TU
LAWYERSSlaughter and MayOne Bunhill RowLondon EC1Y 8YY
The Fidelity Individual Savings Account (“ISA”) is offered and managed by Financial Administration ServicesLimited. The Fidelity Investment Trust Share Plan is managed by FIL Investments International. Both companiesare authorised and regulated by the Financial Services Authority. The Fidelity Investment Trust Share Plan isadministered by Equiniti Limited (formerly Lloyds TSB Registrars) and shares will be held in the name of Lloyds TSB Registrars Savings Nominees Limited. The value of savings and eligibility to invest in an ISA willdepend on individual circumstances and all tax rules may change in the future. Fidelity investment trusts aremanaged by FIL Investments International. Fidelity only gives information about its own products and servicesand does not provide investment advice based on individual circumstances. Should you wish to seek advice,please contact a Financial Adviser. Issued by FIL Investments International, authorised and regulated by theFinancial Services Authority. For the purposes of Sections 21 and 25 of the Financial Services and MarketsAct 2000, the content of this report has been approved by FIL Investments International. Issued by FILInvestments International.
Please note that the value of investments and the income from them may fall as well as rise and the investormay not get back the amount originally invested. Past performance is not a guide to future returns. For fundsthat invest in overseas markets, changes in currency exchange rates may affect the value of your investment.Investing in small and emerging markets can be more volatile than other more developed markets.
Reference in this document to specific securities should not be construed as a recommendation to buy orsell these securities, but is included for the purposes of illustration only. Investees should also note that theviews expressed may no longer be current and may have already been acted upon by Fidelity.
Fidelity, Fidelity International and the Pyramid Logo are trademarks of FIL Limited.
CB34380/NA
Investor Information
Page 16 Fidelity Japanese Values PLC Half-Yearly Report 2008
CONTACT INFORMATIONPrivate investors can call free on0800 41 41 10 9am to 6pm, seven days a week.
Financial advisers can call free on 0800 41 41 81 8am to 6pm, on any business day.
Existing shareholders who have specificqueries regarding their holding, forexample a change of address, shouldcontact the appropriate administrator:
Holders of ordinary sharesCapita Registrars, Registrars to FidelityJapanese Values PLC, The Registry, 34 Beckenham Road, Beckenham, Kent BR3 4TU.Telephone: 0871 664 0300 (calls cost 10p per minute plus network extras)email: [email protected] of individual shareholdings andother information can also be obtainedfrom the Registrars’ website:www.capitaregistrars.com
Fidelity Share Plan investorsFidelity Investment Trust Share Plan,Equiniti Limited, PO Box 4605, AspectHouse, Spencer Road, Lancing, WestSussex, BN99 6QY.Telephone: 0871 384 2781 (calls to thisnumber are charged at 8p per minute froma BT landline. Other telephony providers’costs may vary.)
Fidelity ISA/PEP investorsFidelity, using the freephone numbers givenopposite, or by writing to: UK CustomerService, Fidelity International, Oakhill House,130 Tonbridge Road, Hildenborough,Tonbridge, Kent TN11 9DZ.www.fidelity.co.uk/its
Fidelity ShareNetwork:www.fidelity.co.uk/sharenetwork
General enquiries should be made to FIL InvestmentsInternational, the Investment Manager and Secretary, at the Company’s registeredoffice: FIL Investments International,Investment Trusts, Beech Gate, MillfieldLane, Lower Kingswood, Tadworth, Surrey KT20 6RP.Telephone: 01732 36 11 44Fax: 01737 83 68 92www.fidelity.co.uk/its
FINANCIAL CALENDAR30 June 2008 – half yearly period end28 July 2008 – announcement of half-yearlyresults to 30 JuneMid August 2008 – publication of half-yearly report31 December 2008 – financial year endMarch 2009 – publication of annual reportMay 2009 – Annual General Meeting

The printing inks used for this report are made from vegetable based oils and 95% of cleaning solvents are recycled for further use. The electricity was all generated from renewable sources and on average 87% of any waste associated with thisproduction will be recycled. Printed using pureprint® environmental print technologyby a CarbonNeutral® company, registered to the Environmental Management System, ISO 14001 and EMAS, the Eco Management and Audit Scheme.
The FSC logo identifies products which contain wood from well managed forestscertified in accordance with the rules of the Forest Stewardship Council.
This document is printed on Revive 50:50, a paper containing 50% recovered fibre & 50% virgin fibre. Pulps used are elemental chlorine free, manufactured at a mill with the ISO 14001 Environmental Management System.
The carbon emissions from this publication have been assessed and reduced with the remaining emissions offset in a carbon reduction project.
Cert no. SGS-COC-0620
Managed by
Fidelity JapaneseValues PLC
Half-Yearly Report
For the 6 months ended 30 June 2008