field detection of drugs and explosives by spme-ims
TRANSCRIPT

The author(s) shown below used Federal funds provided by the U.S. Department of Justice and prepared the following final report:
Document Title: Field Detection of Drugs and Explosives by SPME-IMS
Author: Jose Almirall, Patty Diaz-Guerra, Howard Holness, Kenneth Furton
Document No.: 237837
Date Received: February 2012 Award Number: 2006-DN-BX-K027
This report has not been published by the U.S. Department of Justice. To provide better customer service, NCJRS has made this Federally-funded grant final report available electronically in addition to traditional paper copies.
Opinions or points of view expressed are those of the author(s) and do not necessarily reflect
the official position or policies of the U.S. Department of Justice.

1
Almirall, Diaz-Guerra, Holness and Furton Final Technical Report: 2006-DN-BX-K027
Field Detection of Drugs and Explosives by SPME-IMS
Award No: 2006‐DN‐BX‐K027
FINAL TECHNICAL REPORT
Jose Almirall, Patty Diaz-Guerra, Howard Holness and Kenneth Furton
Department of Chemistry and Biochemistry and International
Forensic Research Institute
Florida International University Contact: Jose Almirall, Professor and Director Department of Chemistry and Biochemistry and International Forensic Research Institute Florida International University 11200 SW 8th Street, OE116 Miami, FL 33199 (305) 348-3917 tel (305) 348-4485 fax [email protected]
This document is a research report submitted to the U.S. Department of Justice. This report has not been published by the Department. Opinions or points of view expressed are those of the author(s) and do not necessarily reflect the official position or policies of the U.S. Department of Justice.

2
Almirall, Diaz-Guerra, Holness and Furton Final Technical Report: 2006-DN-BX-K027
Abstract
The overall objective of this effort was to develop and validate the use of field portable
instrumentation for the rapid detection and identification of controlled substances and
explosives in a large volume such as a room or a container in a non-intrusive manner.
The project was divided into several tasks:
1. Continue to develop the analytical methodology for the isolation and identification of
the volatile target compounds that are characteristic of drugs of abuse through the use of
GC-MS.
2. Design, construct and evaluate a second-generation SPME interface to an Ion Mobility
Spectrometer (IMS) for the detection of volatile drug compounds in the headspace of a
sample and determine the utility of the SPME/IMS system for the detection of drugs in
the field.
3. Enhance the existing laboratory detection of these compounds with extraction and pre-
concentration using SPME as part of a comprehensive strategy for the sampling, pre-
concentration, and the analysis of these target compounds using SPME/IMS in the field.
A disk-based planar SPME geometry was used to improve the extraction process and the
coupling of the device to existing commercial off the shelf (COTS) IMS instruments.
4. Develop an inexpensive system for the calibration of the SPME-IMS instruments by
further evaluating permeation bags already used for canine training aids.
5. Evaluate the use of a commercial IMS coupled to a mass spectrometer to
unambiguiously identify the analytes of interest separated by the IMS.
The research groups led by the PIs (Almirall and Furton) have successfully described the
volatile and semi-volatile chemical compounds that are characteristic of several drugs of
abuse and chemical explosives in order to assist the design and application of canine
detection training aids. The PIs have successfully developed pre-concentration and
sampling devices based on Solid Phase Microextraction (SPME) for the capture of
extremely small quantities of the volatile compounds (on the order of ng) for subsequent
detection using IMS using an in-house developed interface (U.S. Patent Application
20090084201, Almirall, Perr and Guerra, 2009) and a company that distributes
explosives detection kits to first responders (Field Forensics Inc. in Clearwater, FL) has
This document is a research report submitted to the U.S. Department of Justice. This report has not been published by the Department. Opinions or points of view expressed are those of the author(s) and do not necessarily reflect the official position or policies of the U.S. Department of Justice.

3
Almirall, Diaz-Guerra, Holness and Furton Final Technical Report: 2006-DN-BX-K027
licensed the PSPME technology developed through this work and will begin to market
and sell a commercial version of the technology in late 2011.
The sampling and concentration of volatile signatures from a variety of drugs including
Cocaine, Cannabis and MDMA and explosives including military explosives and
smokeless powders (propellants) was reported in eleven (11) peer-reviewed publications
and presented in 33 oral presentations. In addition, a workshop for first responders is
planned for Sept. 2011 in Florida to raise awareness amongst the first responders on the
use of sampling and detection of drugs and explosives using PSPME-IMS in the field.
The existing large installed base of 15,000 IMS instruments make this technology viable
as a crime scene detection tool and the already proven use of detection canine teams also
makes this approach a viable alternative to other instrumental detectors. It is also now
possible to use miniaturized IMS instruments in the field or at the crime scene and hence
the knowledge gained from the proposed research can better assist future applications of
field-portable IMS systems for drugs and explosives detection. The product from the
completed research effort will advance the detection of drugs and explosives by both
instrumental and canine methods of detection.
________________________________________________________________________
This document is a research report submitted to the U.S. Department of Justice. This report has not been published by the Department. Opinions or points of view expressed are those of the author(s) and do not necessarily reflect the official position or policies of the U.S. Department of Justice.

4
Almirall, Diaz-Guerra, Holness and Furton Final Technical Report: 2006-DN-BX-K027
Table of Contents
CHAPTER PAGEAbstract ............................................................................................................................... 2 Executive Summary ........................................................................................................... 12 Chapter 1 STATEMENT OF THE PROBLEM .............................................................. 20
Security Concerns ......................................................................................................... 20
Explosives ....................................................................................................................... 2
Illicit Drugs ..................................................................................................................... 5
Research Approach in Response to Current Needs ...................................................... 6
Project Goals and Hypotheses ....................................................................................... 7
Chapter 2 EXPLOSIVES AND ILLICIT DRUGS ........................................................... 9
Chemistry of Explosives ................................................................................................. 9
Propellants .................................................................................................................... 10
Military Explosives ....................................................................................................... 12
Chemistry of Illicit Drugs ............................................................................................. 14
Cocaine ......................................................................................................................... 15
Marijuana ..................................................................................................................... 16
MDMA .......................................................................................................................... 18
Field Analysis of Explosives and Illicit Drugs ............................................................ 19
Biological Detection ..................................................................................................... 20
Chemical Detection ...................................................................................................... 21
Chapter 3 VOLATILE CHEMICAL SIGNATURES ..................................................... 23
Definition of Volatile Chemical Signatures ................................................................ 23
Volatile Chemical Signatures of Explosives ................................................................ 24
This document is a research report submitted to the U.S. Department of Justice. This report has not been published by the Department. Opinions or points of view expressed are those of the author(s) and do not necessarily reflect the official position or policies of the U.S. Department of Justice.

5
Almirall, Diaz-Guerra, Holness and Furton Final Technical Report: 2006-DN-BX-K027
Volatile Chemical Signatures of Drugs ....................................................................... 25
Delivery Methods for Volatile Chemical Signatures ................................................... 27
Chapter 4 SOLID PHASE MICROEXTRACTION ....................................................... 28
Theory of Solid Phase Microextraction ....................................................................... 28
Historical Aspects of SPME ......................................................................................... 28
Thermodynamics .......................................................................................................... 29
Kinetics .......................................................................................................................... 29
Practical Aspects of Sampling ..................................................................................... 32
Extraction Modes ......................................................................................................... 33
Microextraction ............................................................................................................ 35
Sorbent Chemistry ........................................................................................................ 35
Phase Chemistry ........................................................................................................... 37
Sol-gel Coating Technology ......................................................................................... 37
Chemical reactions in the sol-gel process ................................................................... 38
Sol-gel SPME Coatings ................................................................................................ 40
La (dihed) Phase Chemistry ......................................................................................... 42
Characterization of Sorbent Polymers ......................................................................... 45
Scanning Electron Microscopy .................................................................................. 45
1H Nuclear Magnetic Resonance Spectroscopy ........................................................ 47
Direct-Infusion Mass Spectrometry ........................................................................... 47
Infrared Spectroscopy ................................................................................................ 49
Chapter 5 ION MOBILITY SPECTROMETRY ............................................................ 50
Theory of Ion Mobility Spectrometry .......................................................................... 50
This document is a research report submitted to the U.S. Department of Justice. This report has not been published by the Department. Opinions or points of view expressed are those of the author(s) and do not necessarily reflect the official position or policies of the U.S. Department of Justice.

6
Almirall, Diaz-Guerra, Holness and Furton Final Technical Report: 2006-DN-BX-K027
Ion Chemistry ............................................................................................................... 52
IMS Response ............................................................................................................... 54
Forensic Applications of Ion Mobility Spectrometry .................................................. 54
IMS Modifications to Improve Contraband Detection ............................................... 55
Sampling Improvements ............................................................................................ 55
Operating Condition Optimization ............................................................................ 59
Chapter 6 METHODOLOGY AND LAB PREPARATION TECHNIQUES ................ 60
Development of Planar SPME (PSPME) Devices for Static Extractions .................. 60
Preparation of the Substrate ........................................................................................ 60
Coating Techniques ...................................................................................................... 61
Dip-Coating ............................................................................................................... 61
Spin-Coating .............................................................................................................. 62
Preparation of the Coating Solutions .......................................................................... 63
Sol-gel PDMS ............................................................................................................ 63
PDMS by a Chlorine-Terminated PDMS Route ....................................................... 64
Activated Charcoal/Sol-Gel PDMS ........................................................................... 64
La (dihed) .................................................................................................................. 65
Validation Experiments for Static PSPME ................................................................. 68
IMS Detection............................................................................................................ 68
Performance Comparison of the SPME Fiber, PDMS, and sol-gel PDMS PSPME
Devices Using TNT as the Target Analyte ................................................................ 69
Quantitation of TNT Using Response Curves ........................................................... 70
This document is a research report submitted to the U.S. Department of Justice. This report has not been published by the Department. Opinions or points of view expressed are those of the author(s) and do not necessarily reflect the official position or policies of the U.S. Department of Justice.

7
Almirall, Diaz-Guerra, Holness and Furton Final Technical Report: 2006-DN-BX-K027
Determination of Equilibrium Extraction Time and Recovery ................................. 70
Extraction Efficiency Experiments at Equilibrium ................................................... 70
Comparison of Sol-Gel PDMS PSPME and Fiber SPME for Sampling Piperonal .. 71
Gas Chromatography- Mass Spectrometry (GC/MS) ............................................... 71
IMS Operating Conditions ........................................................................................... 72
SPME-IMS Sampling ................................................................................................ 72
SPME-IMS Quantitation ........................................................................................... 73
SPME-IMS Limit of Detection (LOD) and Linear Dynamic Range (LDR)
Determinations........................................................................................................... 73
Piperonal IMS Response Curve ................................................................................. 73
Method Development for PSPME-IMS of Piperonal ................................................ 74
Performance of PSPME for Other Volatile Chemical Signatures ............................. 75
Performance of PSPME for the Smokeless Powder Volatile Chemical Signatures .. 75
Determination of Equilibrium Extraction Time ........................................................ 76
PSPME Static Sampling of TNT from a Large Volume Vessel................................ 76
Comparison of Planar La (dihed) SPME Devices with Control Planar Sol-gel and PDMS Devices for the Extraction of TNT and 2,4-DNT ........................................... 77
Aging Study ............................................................................................................... 77
Coating Study ............................................................................................................ 78
Development of Dynamic PSPME ............................................................................... 78
Preparation of Dynamic PSPME Devices ................................................................. 78
Coating Method Development................................................................................... 79
This document is a research report submitted to the U.S. Department of Justice. This report has not been published by the Department. Opinions or points of view expressed are those of the author(s) and do not necessarily reflect the official position or policies of the U.S. Department of Justice.

8
Almirall, Diaz-Guerra, Holness and Furton Final Technical Report: 2006-DN-BX-K027
Characterization of Final Dynamic PSPME Devices ................................................ 80
Dynamic Sampling ....................................................................................................... 80
Volatile Chemical Signature Standards for Dynamic PSPME Sampling .................. 82
Controlled Odor Mimic Permeation Systems (COMPS) .......................................... 83
Validation Experiments for Dynamic PSPME .......................................................... 84
Dynamic PSPME Retaining Capability Studied By Analyte Solution Spiking ........ 85
Dynamic PSPME Retaining Capability Studied By COMPS Vapor Source ............ 85
Dynamic PSPME LOD .............................................................................................. 86
Chapter 7 RESULTS AND DISCUSSION ..................................................................... 87
Development of PSPME Devices for Static Extractions ............................................. 87
Sol-gel PDMS ............................................................................................................... 88
PDMS PSPME Via a Chlorine-terminated PDMS Route ......................................... 92
Activated Charcoal in PDMS Formulations .............................................................. 94
La (dihed) .................................................................................................................. 96
Structure Determination ......................................................................................... 96
La (dihed) SPME Coatings .................................................................................. 106
Summary of PSPME Devices Developed ............................................................... 114
Validation Experiments for Static PSPME ............................................................... 114
Performance Comparison of the SPME Fiber, PDMS, and Sol-gel PDMS PSPME
Devices Using TNT as the Target Analyte .............................................................. 115
Quantitation of TNT Using Response Curves ..................................................... 115
Determination of Equilibrium Extraction Time and Recovery ............................ 115
This document is a research report submitted to the U.S. Department of Justice. This report has not been published by the Department. Opinions or points of view expressed are those of the author(s) and do not necessarily reflect the official position or policies of the U.S. Department of Justice.

9
Almirall, Diaz-Guerra, Holness and Furton Final Technical Report: 2006-DN-BX-K027
Extraction Efficiency Experiments at Equilibrium .............................................. 119
Study of TNT Adsorption to Vessel Walls .......................................................... 120
Comparison of Sol-Gel PDMS PSPME and Fiber SPME for Sampling Piperonal 121
SPME-IMS Sampling .......................................................................................... 122
SPME-IMS Quantitation ...................................................................................... 124
SPME-IMS Limit of Detection (LOD) and Linear Dynamic Range (LDR)
Determinations ..................................................................................................... 126
Method Development for PSPME-IMS of Piperonal .......................................... 128
Sampling Real MDMA Cases at a Local Crime Laboratory ............................... 134
Performance of PSPME for Other Volatile Chemical Signatures ........................... 139
Performance of PSPME for the Smokeless Powder Volatile Chemical Signatures 142
Smokeless Powder Volatile Chemical Signature IMS Response Curves ............ 142
Determination of Equilibrium Extraction Time ...................................................... 145
Sampling of Unburned Smokeless Powders ........................................................ 146
PSPME Static Sampling of TNT from a Large Volume Vessel.............................. 148
Comparison of Planar La (dihed) SPME Devices with Control Planar Sol-gel and
PDMS Devices for the Extraction of TNT and 2,4-DNT ........................................ 149
Aging Study ......................................................................................................... 149
Coating Study....................................................................................................... 150
Development of Dynamic PSPME ............................................................................. 154
Coating Method Development................................................................................. 155
Characterization of Final Dynamic PSPME Devices .............................................. 163
Volatile Chemical Signature Standards for Dynamic PSPME Sampling ................ 165
This document is a research report submitted to the U.S. Department of Justice. This report has not been published by the Department. Opinions or points of view expressed are those of the author(s) and do not necessarily reflect the official position or policies of the U.S. Department of Justice.

10
Almirall, Diaz-Guerra, Holness and Furton Final Technical Report: 2006-DN-BX-K027
Spike on Manufacturer Provided Filters .............................................................. 165
Controlled Odor Mimic Permeation Systems (COMPS) ..................................... 168
Validation Experiments for Dynamic PSPME .......................................................... 170
Dynamic PSPME Retaining Capability Studied by Analyte Solution Spiking ....... 170
Dynamic PSPME Retaining Capability Studied by COMPS Vapor Source ........... 175
Dynamic PSPME LOD ............................................................................................ 180
Application of Dynamic PSPME- IMS for Screening of Illicit Compounds .......... 181
Chapter 8 Controlled odor mimic permeation system (COMPS) ................................. 186
Polymers ...................................................................................................................... 186
Polyethylene ............................................................................................................ 186
Polypropylene .......................................................................................................... 188
Creation of Controlled Odor Mimic Permeation System (COMPS) devices ............ 189
Permeation of Odor Compounds ............................................................................... 190
COMPS Odor Delivery of Narcotics .......................................................................... 190
Field Trials and Validation of COMPS for Narcotics .............................................. 199
COMPS Odor Delivery of Explosive .......................................................................... 204
Field Trials and Validation of COMPS for Explosives ............................................ 214
Chapter 9 CONCLUSIONS .......................................................................................... 219
Static PSPME ............................................................................................................. 219
Dynamic PSPME ........................................................................................................ 221
PSPME Terminology ................................................................................................. 222
Implications of PSPME-IMS for Security ................................................................ 223
This document is a research report submitted to the U.S. Department of Justice. This report has not been published by the Department. Opinions or points of view expressed are those of the author(s) and do not necessarily reflect the official position or policies of the U.S. Department of Justice.

11
Almirall, Diaz-Guerra, Holness and Furton Final Technical Report: 2006-DN-BX-K027
Future Directions ....................................................................................................... 224
Controlled Odor Mimic Permeation System .............................................................. 225
REFERENCES ............................................................................................................... 227 ANNEX A STATIC PSPME PREPARATION ........................................................... 238 ANNEX B DYNAMIC PSPME PREPARATION....................................................... 240 Dissemination of Research Findings. ............................................................................. 241
Appendix A – Peer-reviewed publications derived from this work. ..................... 241
Appendix B – Peer-reviewed presentations derived from this work .................... 242
Appendix C – Copies of publications listed in Appendix A ................................... 245
This document is a research report submitted to the U.S. Department of Justice. This report has not been published by the Department. Opinions or points of view expressed are those of the author(s) and do not necessarily reflect the official position or policies of the U.S. Department of Justice.

12
Almirall, Diaz-Guerra, Holness and Furton Final Technical Report: 2006-DN-BX-K027
Executive Summary
The overall objective of this effort was to develop and validate the use of field portable
instrumentation for the rapid detection and identification of controlled substances and
explosives in a large volume such as a room or a container in a non-intrusive manner.
The project’s aims were to continue to develop the analytical methodology for the
isolation and identification of the volatile target compounds that are characteristic of
drugs of abuse through the use of GC-MS. The work also incuded the design,
construction and evaluation a second-generation SPME interface to an Ion Mobility
Spectrometer (IMS) for the detection of volatile drug compounds in the headspace of a
sample and determine the utility of the SPME/IMS system for the detection of drugs in
the field. The work also resulted in enhancing the existing laboratory detection of these
compounds with extraction and pre-concentration using SPME as part of a
comprehensive strategy for the sampling, pre-concentration, and the analysis of these
target compounds using SPME/IMS in the field. A disk-based planar SPME geometry
was used to improve the extraction process and the coupling of the device to existing
COTS IMS instruments. We also report the development of an inexpensive system for the
calibration of the SPME-IMS instruments by further evaluating permeation bags already
used for canine training aids. Finally, we report the evaluation of the use of a commercial
IMS coupled to a mass spectrometer to unambiguiously identify the analytes of interest
separated by the IMS.
This study has shown that by altering the widely-used SPME fiber type to a planar
geometry SPME device, the surface area is greatly increased by a factor of 50 to 100
times. As a result, the capacity is also increased because the volume of the SPME phase
is increased by a factor of at least 16 times over the fiber geometry. The use of PSPME
for static sampling from closed systems enhanced analyte recovery at least 10 times when
extracting even trace amounts. Another advantage is the decrease in equilibrium time
required for extraction of TNT, from more than 10 hr down to 40 min, for example.
Although sampling at equilibrium results in the highest signal, it has been shown that
sampling at pre-equilibrium (on the order of min), does result in detectable signals.
This document is a research report submitted to the U.S. Department of Justice. This report has not been published by the Department. Opinions or points of view expressed are those of the author(s) and do not necessarily reflect the official position or policies of the U.S. Department of Justice.

13
Almirall, Diaz-Guerra, Holness and Furton Final Technical Report: 2006-DN-BX-K027
Because of the reduction in equilibrium time, faster on-site analyses can be conducted
with this geometry when compared to fiber SPME.
When comparing two PSPME devices for the extraction of TNT, sol-gel PDMS takes
longer to reach equilibrium than PDMS due to its increased capacity over PDMS
PSPME, yet for shorter extraction times, PDMS produces a consistently higher signal.
The PDMS PSPME device affords higher throughput with increased sensitivity at shorter
extraction times, while sol-gel PDMS PSPME is designed for applications that can
accommodate longer sampling times and require even higher sensitivity. PSPME
sorbents containing a La (dihed) coating, showed improve retention of 2,4-DNT and TNT
which were lost completely from the plain sol-gel PDMS and PDMS PSPME devices
after only 30 min of aging.
Extraction of more volatile compounds such as taggants (4-NT) and volatile signatures
from their parent compounds (cyclohexanone from RDX, 2,4-DNT, etc.) has been shown
to be practical and effective when coupled with fast detection by IMS. In particular, the
PSPME-IMS method was applied to the analysis of odor compounds from drugs at a
local crime laboratory, where in a blind study of suspected MDMA tablets, 100 % correct
detection of the target analytes was achieved in short sampling times (15 min). The
SPME fiber-IMS method, although sensitive for the detection of piperonal, produced a
false negative for one blind case that in fact had a minute concentration of MDMA. The
extraction of piperonal with PSPME was enhanced over 600 times due to the capacity of
PSPME that enabled quantitation of a dimer product ion peak seen at high concentration
of piperonal. This peak was not seen in significant intensities when extracting by fiber
SPME because capacity had been reached. The volatile chemical signatures of smokeless
powders were also successfully extracted and detected using PSPME-IMS, where
sampling of the standards proved difficult.
Alternate phase chemistries for static PSPME were also tested. Besides sol-gel PDMS,
which demonstrated enhanced surface area and capacity from the presence of sol-gel
nanoparticles, and PDMS that has fast absorption/desorption kinetics, selective coatings
based on La (dihed) proved to enhance the extraction efficiency and retention of two
important volatile chemical signatures, TNT and 2,4-DNT over sol-gel PDMS and PDMS
This document is a research report submitted to the U.S. Department of Justice. This report has not been published by the Department. Opinions or points of view expressed are those of the author(s) and do not necessarily reflect the official position or policies of the U.S. Department of Justice.

14
Almirall, Diaz-Guerra, Holness and Furton Final Technical Report: 2006-DN-BX-K027
PSPME devices. The results obtained provide motivation for continued work to further
improve the thermal stability and reduce the hygroscopicity of the La (dihed) component
by incorporation into a sol-gel network.
With PSPME, it is no longer necessary to fabricate an interface between SPME and each
particular IMS instrument model since with the planar geometry of PSPME is readily
compatible with the already large installed base of IMS instruments. As a result, no
significant modification of the security infrastructure should be necessary for
implementation of PSPME for screening purposes.
The static PSPME pre-concentration device was improved by development of dynamic
PSPME that enables rapid open air sampling of the volatile chemical signatures of drugs
and explosives for direct introduction into existing IMS instruments. Dynamic PSPME is
accomplished by use of a planar device that allows sampling of a large volume of air and
has a high surface area for the capture and strong retention of these compounds from air.
These attributes suggest dynamic PSPME as an exhaustive sampler, as opposed to the
other SPME configurations that are generally considered as non-exhaustive, equilibrium-
based sampling devices. This is advantageous when extracting trace amounts of volatile
chemical signatures diluted in a large volume of air, as is the case when sampling in the
field. Dynamic PSPME affords improved desorption profiles over static PSPME. This
device was developed and optimized in a manner applicable to field sampling using an
accessory, the handheld vacuum, as a portable, easy-to-use pump, that is already
available and in use for the collection of particles.
The results obtained for the novel device demonstrate that even with a minimal amount of
emitting source present, the dynamic PSPME-IMS method performs well as a rapid and
sensitive screening tool applicable for field analysis.
Dynamic PSPME represents a significant improvement in detection of drugs and
explosives via their volatile chemical signatures since it more closely resembles sampling
by trained canines. Dynamic PSPME was tested on the same Controlled Odor Mimic
Permeation Systems (COMPS) devices used to determine and calibrate canine sensitivity.
This biological detector uses a dynamic sampling process to allow for rapid detection
over a large search area. By coupling a sensitive, portable, and rapid dynamic sampling
device (effective preconcentration of analytes present in air at the ppt level) with a
This document is a research report submitted to the U.S. Department of Justice. This report has not been published by the Department. Opinions or points of view expressed are those of the author(s) and do not necessarily reflect the official position or policies of the U.S. Department of Justice.

15
Almirall, Diaz-Guerra, Holness and Furton Final Technical Report: 2006-DN-BX-K027
sensitive (ng-pg detection limits) and rapid (millisecond response) detector, PSPME-IMS
is one step closer to the gold standard in explosives and drug detection.
The advent of PSPME provides a much-needed rapid, sensitive and cost-effective pre-
concentration and sampling device for security applications. First, this research has
demonstrated that PSPME in both sampling configurations is effective at detecting drugs
and explosives from large volume spaces. The PSPME device is operationally feasible
since it is low cost, easy to use, reusable, and easily couples to existing IMS detectors. It
is envisioned that the static PSPME devices can be placed inside cargo containers before
transport in order to take advantage of the long dwell times during shipment, which can
be up to 2 weeks. Then, upon arrival at port, IMS detectors, already in place, can be use
to analyze the absorbed compounds on the devices. This would be a simple, non-intrusive
and inexpensive way of helping to meet the screening of 100 % of cargo containers that
could be implemented rapidly. A similar methodology could be extended to help meet the
100 % air cargo screening demand instead by using the dynamic PSPME method
sampling near baggage much the same as canines are used. Additional applications of
PSPME include medical screening for diseases from breath analysis and have yet to be
explored.
Air sampling and detection of plastic explosive vapors has always been a challenge due
to the low vapor pressures of the energetic materials, RDX and PETN, that commercial
IMS instruments are currently programmed to detect. This research study has also
demonstrated an approach that targets the more volatile, non-energetic compounds, such
as taggants, decomposition products and/or impurities, rather than the explosives
themselves. Successful vapor detection of plastic explosives was proven possible using
IMS with operating conditions optimized to detect the volatile signatures of the
explosives Detasheet (n-butyl acetate and DMNB), Semtex H (DMNB), and C-4 (DMNB
and cyclohexanone). A SPME device was used to extract and pre-concentrate the target
volatile markers with sampling times in seconds to minutes as sufficient to extract and
detect ~20 ng of the target analyte(s), which is 10 times the amount required for a reliable
IMS response. SPME-IMS can greatly simplify the field sampling and detection process
because SPME allows for remote air sampling without the need for additional
cumbersome equipment and IMS provides rapid analysis at atmospheric pressure.
This document is a research report submitted to the U.S. Department of Justice. This report has not been published by the Department. Opinions or points of view expressed are those of the author(s) and do not necessarily reflect the official position or policies of the U.S. Department of Justice.

16
Almirall, Diaz-Guerra, Holness and Furton Final Technical Report: 2006-DN-BX-K027
Therefore, SPME-IMS has great potential to be a non-invasive, non-surface contact
method for screening of low vapor pressure hidden explosives. Commercial dual-tube
IMS analyzers can be set to have one drift tube operating at optimal conditions to detect
the energetic explosives while the other drift tube can operate at optimal conditions to
detect the non-energetic volatiles.
A headspace air sampling approach utilizing a SPME device to extract and pre-
concentrate targeted volatile markers for the successful detection of real drug samples by
IMS was demonstrated for the first time. Detection of cocaine, MDMA, and marijuana
via their targeted volatile markers was achieved within minutes of SPME sampling time,
recovering low nanogram levels of the targeted analytes methyl benzoate, piperonal, and
terpenes, respectively. Minimal peak interferences were observed in 3 separate
interference studies. However, interferences from commonly encountered goods may
pose some challenges for field detection, particularly when small quantities of drugs are
sampled. Hence, improvement in the SPME selectivity is necessary in order to minimize
the introduction of non-target analytes into the IMS.
Although the computer models used in this work incorporated several estimations and
assumptions, SIMION/SDS simulations accurately predicted the resolution between two
ion species when air was used for both the carrier and drift gas. The high quality of this
result is because the parameters used for this simulation closely matched the experimental
conditions. While SDS does have the limitation of only being able to accommodate one
collision gas, the SIMION/SDS simulations did track the trends observed in the
experiments for gas flow rates, drift gas composition, and gate width variations. The
results of this first utilization of SIMION/SDS to simulate a complete IMS instrument are
encouraging and future efforts should be able to take advantage of more advanced
features in SIMION to overcome some of the identified modeling issues to produce more
robust and flexible virtual IMS instruments. These results show that SIMION/SDS is a
valuable tool for the development of IMS instruments and IMS-MS interfaces.
This project also resulted in the construction of an in-house IMS that allowed for some
flexibility in changing the experimental conditions and to test new designs or
fundamental concepts. The FIU IMS is one of the first few in-house built IMS
This document is a research report submitted to the U.S. Department of Justice. This report has not been published by the Department. Opinions or points of view expressed are those of the author(s) and do not necessarily reflect the official position or policies of the U.S. Department of Justice.

17
Almirall, Diaz-Guerra, Holness and Furton Final Technical Report: 2006-DN-BX-K027
instruments with full computer control of the hardware and operating conditions. Each of
the components fabricated for the first generation FIU IMS were based on conventional
designs that are well-documented in literature. Therefore, the FIU IMS performance is, as
expected, comparable to other conventional designs. Similar to any other in-house IMS
instruments, the FIU IMS provides the basic research platform for further research to be
conducted, and is not meant to be compared to commercial instruments in all aspects
unless new designs are to be created in the future.
The electrospray ion mobility mass spectrometer procured for this study was used to
characterize the explosive compounds being formed under atmospheric chemical
ionization processes. This unit provded unambiguous identification of several explosives
compounds, namely, DNT, TNT, RDX and DPA. More importantly it revealed the
different types of ionic species formed as a result of differing contaminants/additives in
various explosive mixtures. These preliminary data are currently being used to taylor
IMS detection methods of complicated mixtures that are commonly found in the field.
The inability of TNT and DNT to be ionized and detected in the presence of ammonium
nitrate is one such observation that is currently being investigated.
The smokeless powders study was initiated to determine the applicability of solid phase
microextraction in combination with GC-MS and IMS for the detection of organic
volatiles present in the headspace of smokeless powders. The results have demonstrated
that SPME can be used to extract multiple volatile and semi-volatile compounds from the
headspace of the smokeless powders. Several of these compounds can be detected by a
combination of detection methods.
A number of compounds that are thermally stable and do not degrade in the injector of a
GC were detected with both the GC-MS and the SPME-IMS interface built for this
project. Combining the results obtained both by the locally purchased powders and those
obtained from the FBI Laboratory, the detected volatile chemical components of
smokeless powder are diphenylamine, ethyl centralite, methyl centralite, diethyl and
dibutyl phthalate, 2-nitrodiphenylamine, 4-nitrodiphenylamine, ethylphenylamine, 2, 4-
dinitrotoluene and nitroglycerin. It was found that the most common additive across all
powders was diphenylamine and 2,4-DNT was also found in several of the powders
although it was not exclusive to the single-based powders and was found in double-based
This document is a research report submitted to the U.S. Department of Justice. This report has not been published by the Department. Opinions or points of view expressed are those of the author(s) and do not necessarily reflect the official position or policies of the U.S. Department of Justice.

18
Almirall, Diaz-Guerra, Holness and Furton Final Technical Report: 2006-DN-BX-K027
powders in combination with other additives. Ethyl centralite was present in many of the
powders but was usually extracted in smaller quantities from the headspace as compared
to the other analytes. Based on the extraction time profiles for the GC-MS it was also
observed that ethyl centralite required more extraction time than other analytes to be
absorbed onto the fiber.
On applying the results from the GC-MS and GC-µ-ECD to the IMS, it was found that
the IMS is also capable of detecting several of these analytes successfully. The only
analytes not detected on the IMS that were detected by the chromatography methods
were the two nitrated diphenylamines. The mass extracted from the headspace was
determined to be lower that the detection limits of the IMS. Nitroglycerin and 2,4-DNT
are detected in the negative mode of the IMS while the rest of the analytes are detected in
the positive mode. A combination of the results obtained by the two modes, demonstrated
at that extraction times practical for field applications, more than one volatile component
can be detected from the headspace of the powders and can be used for screening and
identification of smokeless powders.
The smokeless powders study resulted in the generation of essential information from
both laboratory and field portable analytical techniques that can be used in a variety of
ways. This work supplements the available bulk composition data available for smokeless
powders and demonstrates that reliable information about smokeless powders can be
obtained by using a fast analytical method such as ion mobility spectrometry with less
intensive sampling steps. The differences and similarities in the compounds detected
between the techniques can be applied to further improve both sampling and detection by
IMS.
It is important to note that the study was limited to static closed system sampling. Based
on the results observed in this study, it would be beneficial to conduct large volume
sampling to mimic real life situations. It is anticipated that better extraction efficiencies
would be obtained with a larger more efficient extraction phase. Conducting sampling of
fully enclosed explosive devices to determine the amount of volatiles dissipated in such
cases would help in improving the SPME sampling method.
Of significance to the sampling and detection of the smokeless powder additives in the
field is the presence of interferences. Some of these additives are used in other industries
This document is a research report submitted to the U.S. Department of Justice. This report has not been published by the Department. Opinions or points of view expressed are those of the author(s) and do not necessarily reflect the official position or policies of the U.S. Department of Justice.

19
Almirall, Diaz-Guerra, Holness and Furton Final Technical Report: 2006-DN-BX-K027
as well and may be present in other commercial products that might produce false
positive alarms. A large-scale study to determine possible interferences for all the
analytes and the effects on the reliable detection of smokeless powders is necessary to
present a comprehensive picture of the detection of the additives indicative of the
presence of smokeless powders.
The overall aim of this part of the study was to generate a database that can be used by
those interested in improving detection and sampling methods. The results obtained from
the smokeless powders study indicates that there are variety of target analytes available in
the headspace that can be applied to various organic analysis methods. The sample set of
seventy smokeless powders studied is representative of the all the smokeless powder
compositions manufactured over the years by different manufacturers. The study
therefore includes all possible smokeless powder additives of significance but due to the
constant changes to composition of the powders by the manufacturers, the profile for a
powder may change over the years. Therefore, the profiles and headspace compositions
described here are meant only to serve as indicators of volatile components and their
variations among the different smokeless powders but not to identify a smokeless
powder.
The research groups led by the PIs (Almirall and Furton) have successfully described the
volatile and semi-volatile chemical compounds that are characteristic of several drugs of
abuse and chemical explosives in order to assist the design and application of canine
detection training aids. The PIs have successfully developed pre-concentration and
sampling devices based on Solid Phase Microextraction (SPME) for the capture of
extremely small quantities of the volatile compounds (on the order of ng) for subsequent
detection using IMS using an in-house developed interface (U.S. Patent Application
20090084201, Almirall, Perr and Guerra, 2009) and a company that distributes
explosives detection kits to first responders (Field Forensics Inc. in Clearwater, FL) has
licensed the PSPME technology developed through this work and will begin to market
and sell a commercial version of the technology in late 2011.
The sampling and concentration of volatile signatures from a variety of drugs including
Cocaine, Cannabis and MDMA and explosives including military explosives and
smokeless powders (propellants) was reported in eleven (11) peer-reviewed publications
This document is a research report submitted to the U.S. Department of Justice. This report has not been published by the Department. Opinions or points of view expressed are those of the author(s) and do not necessarily reflect the official position or policies of the U.S. Department of Justice.
20
Almirall, Diaz-Guerra, Holness and Furton Final Technical Report: 2006-DN-BX-K027
and presented in 33 oral presentations. In addition, a workshop for first responders is
planned for Sept. 2011 in Florida to raise awareness amongst the first responders on the
use of sampling and detection of drugs and explosives using PSPME-IMS in the field.
The existing large installed base of 15,000 IMS instruments make this technology viable
as a crime scene detection tool and the already proven use of detection canine teams also
makes this approach a viable alternative to other instrumental detectors. It is also now
possible to use miniaturized IMS instruments in the field or at the crime scene and hence
the knowledge gained from the proposed research can better assist future applications of
field-portable IMS systems for drugs and explosives detection. The product from the
completed research effort will advance the detection of drugs and explosives by both
instrumental and canine methods of detection.
Chapter 1 STATEMENT OF THE PROBLEM Security Concerns The United States Government is tasked with protecting its citizens and the homeland
from terrorist attacks. Following the 1995 bombing of the Murrah Federal Building in
Oklahoma City, OK, the Anti-Terrorism and Effective Death Penalty Act
[1]
was enacted. This law requires the tagging of all explosives in order to facilitate
discovery of an explosive device before detonation, and banned the sale of un-tagged
explosives. A volatile taggant is a solid or liquid substance that produces a vapor that,
when added into the explosive, makes the explosive easily detectable by instruments and
trained canines. Requirements for a taggant are that it must be inexpensive and have a
sufficiently long half-life while not affecting the detonation or deflagration properties of
the explosive. The taggant currently used in the U.S. is 2,3-dimethyl-2,3-dinitrobutane
(DMNB) [2]. Although the explosive used in the 1995 bombing, an improvised mixture
of ammonium nitrate (fertilizer) and fuel oil, would not have been tagged if this law were
in place earlier because the single components are not considered explosive, the
This document is a research report submitted to the U.S. Department of Justice. This report has not been published by the Department. Opinions or points of view expressed are those of the author(s) and do not necessarily reflect the official position or policies of the U.S. Department of Justice.

2
Almirall, Diaz-Guerra, Holness and Furton Final Technical Report: 2006-DN-BX-K027
requirement serves as a much needed preventative measure and likely helped ease public
concerns.
Explosives The dangers of explosives in the hands of terrorists are well known and this prompted the
creation of the tagging system currently in place. Smokeless powders, propellants not
considered explosives for tagging purposes, are important to national security since they
can be tempting to use as the filler in improvised explosive devices such as pipe bombs
(IEDs) by individuals with ill-will. This is because smokeless powders, along with black
powders (another propellant), are readily accessible in gun shops and sporting clubs. It is
reported that around 3.5 million individuals use these substances in the United States [3]
who either prefer to load their own ammunition by hand and/or operate muzzle loading
handguns for hunting or reenactments [4]. In general, a pipe bomb consists of a few
simple components: the propellant, a container for the propellant, and an initiation system
to start the burning of the propellant within the container. When sufficient pressure builds
up within the container, the device explodes. Nails or tacks could be added to worsen the
effects of the shrapnel ejected upon explosion. The most notable incidents of the use of
pipe bombs in terrorist attacks have been the Centennial Park bombing at the 1996
Olympics in Atlanta, GA and the devices mailed by the Unabomber. The Bureau of
Alcohol, Tobacco and Firearms reported that there were 448 total significant incidents in
the U.S. involving smokeless powder and black powder IED explosions from 1992 to
1994, killing 27 people and injuring 199 others [4]. Improvements in the preemptive
detection of smokeless powder pipe bombs are necessary to deter possible terrorists from
using this easily attainable explosive material and to help in the pre-blast discovery of
these explosives.
This document is a research report submitted to the U.S. Department of Justice. This report has not been published by the Department. Opinions or points of view expressed are those of the author(s) and do not necessarily reflect the official position or policies of the U.S. Department of Justice.

3
Almirall, Diaz-Guerra, Holness and Furton Final Technical Report: 2006-DN-BX-K027
The terrorist attacks of September 11, 2001 heightened national concerns about threats
posed to the homeland by weapons of mass destruction (WMD). The 9/11 Commission
was gathered to determine the intelligence gaps that enabled these attacks and to identify
ways to improve security for the prevention of future terrorism incidents. In 2007, a bill,
known as the 9/11 Act was approved by Congress and signed into law in order to meet
the recommendations given by the 9/11 Commission in 2004 [5].
The law mandated that 50 % of domestic and in-bound air passenger cargo be screened
by February 2009, a milestone that has been reached [6]. The Transportation Security
Administration (TSA) has been able to meet this deadline largely because there are 85
canine teams specifically assigned to screening of air cargo at airports in the US with the
highest cargo volume and 460 additional canine teams that each spend at least 25 % of
their work day in the cargo environment [6].
The next step is to meet the goal of screening 100 % of air cargo by March 2010.
Recently, Ed Kelley, director of the TSA, the agency with the authority to enforce the
regulation, testified to Congress that he did not expect the mandate could be met for in
bond air cargo. He provided the following written statement as to why this was not
feasible [7].
"One of the challenges we face is the limitations of the currently available technology --
specifically, the effectiveness of existing technology for detecting explosives in cargo, its
operational feasibility, and its general availability for deployment to the industry to meet
the mandate of the 9/11 Act.”
This document is a research report submitted to the U.S. Department of Justice. This report has not been published by the Department. Opinions or points of view expressed are those of the author(s) and do not necessarily reflect the official position or policies of the U.S. Department of Justice.

4
Almirall, Diaz-Guerra, Holness and Furton Final Technical Report: 2006-DN-BX-K027
Requiring domestic and international airlines to meet the demand for 100 % screening
would severely impede the flow of commerce without the proper technology available for
this purpose.
In another facet of transportation-related mandates included in the 9/11 Act, the director
of the Department of Homeland Security (DHS), Janet Napolitano informed lawmakers
on December 2, 2009, that her department would not be meeting the 2012 deadline for
100 % screening of the 10 million shipping containers that enter the U.S. annually. She
explained that in order to implement the 100 percent scanning requirement by the 2012
deadline, technologies would be needed that do not currently exist and many ports would
have to be redesigned. If screening was expanded with available technology [8] that
involves large and expensive X-ray or gamma ray scanners to generate an image of the
contents of the container and that the screener reviews for anomalies, cargo flow would
be significantly reduced driving up consumer costs without in her opinion, bringing
additional security benefits [9]. In reality, it was reported in May 2002, that the costs
associated with U.S. port closures resulting from a detonated explosive or WMD could
amount to $1 trillion, assuming economic fallout due to the changes it would cause in the
ability of the U.S. to trade [8].
The strategy in place designed to meet this daunting task is outlined in the Container
Security Initiative, implemented by U.S. Customs and Border Protection (CBP) which
began shortly after the 9/11 attacks. This plan has deployed equipment at 58 ports around
the world to help scan incoming cargo for contraband weapons. The Secure Freight
Initiative further compartmentalizes the task by scanning cargo at the five ports that have
the highest potential for the smuggling nuclear-weapon materials [10]. Despite the efforts
This document is a research report submitted to the U.S. Department of Justice. This report has not been published by the Department. Opinions or points of view expressed are those of the author(s) and do not necessarily reflect the official position or policies of the U.S. Department of Justice.

5
Almirall, Diaz-Guerra, Holness and Furton Final Technical Report: 2006-DN-BX-K027
in place, approximately only 5 % of cargo entering the U.S. from the largest ports is
thoroughly screened [11].
Illicit Drugs The drug trade also poses a threat to U.S. national security. The Coast Guard is the lead
federal agency for maritime law enforcement and drug interdiction [12], accounting for
52% of all U.S. government seizures each year [13]. The Coast Guard Drug Removal
Statistics reveal that for the 2010 fiscal year alone, 9,454 lbs. of marijuana and a
staggering 24,590.3 lbs. of cocaine were seized and removed [14]. From the fiscal year
1997 to present 806, 469 lbs. of cocaine and 333, 285 lbs. of marijuana have been seized
by the Coast Guard [13].
The previous statistics that reveal information about only one segment of the drug war,
demonstrate the enormity of the problem the U.S. faces. But the problem of drug
addiction although individual to the addicted person also has large scale implications.
The illicit drug, 3,4-methylenedioxymethamphetamine, MDMA, is both a stimulant and
psychedelic that causes an energizing effect, distorts time and perception, and enhances
enjoyment from tactile experiences. As such, this drug is more commonly known to users
as ‘ecstacy.’ The use of MDMA affects the brain adversely, with the worst effect being
the loss of nerve endings that contain serotonin observed in as little as two weeks of
abuse. In a recent survey, 11 million people over the age of 12, report to have used
MDMA in their lifetimes [15]. Currently, this drug can be presumptively identified using
the Marquis color test. A purple-blue color is obtained for MDMA but it may be confused
with the indigo color obtained for the opiates by the same test. Thin layer
chromatography is also used but the results can be confused with other amphetamines
This document is a research report submitted to the U.S. Department of Justice. This report has not been published by the Department. Opinions or points of view expressed are those of the author(s) and do not necessarily reflect the official position or policies of the U.S. Department of Justice.

6
Almirall, Diaz-Guerra, Holness and Furton Final Technical Report: 2006-DN-BX-K027
[16]. A rapid sensitive screening technique for MDMA is necessary that will minimize
incorrect detections and false negatives.
Research Approach in Response to Current Needs The U.S. Government has identified certain deficiencies with regards to the detection of
explosives/WMD and drugs. These can be summarized into three recommendations for
technology aimed at detecting contraband items:
1) The technology must be effective at detecting explosives and drugs in cargo.
2) The technology must be operationally feasible. This means it must have a low
total cost to implement (technology, maintenance, consumable products, and
change in security infrastructure). The analysis must be fast so as not to slow
down the flow of commerce.
3) The technology must be available for deployment to the security industry.
In regards to the first recommendation, the trace detection problem for national security
in reality has little to do with the detectors available to detect drugs and explosives. The
main detector used in this work in fact has extremely low detection limits, on the order of
picograms (pg) [17].The central issue, rather, is the problem of sample collection. Air
cargo holds and shipping containers have a large volume and attempting to sample this
amount for trace particles is analogous to looking for a needle in a haystack. It is
proposed that the sampling methodology utilize vapors emitted from the contraband, like
trained canine teams do, to increase detection probabilities. Furthermore, because of the
large volume of air in containers, vapors likely will not build up sufficient vapor pressure
over extended periods of time [18], whereby and efficient pre-concentration and
sampling device becomes necessary.
This document is a research report submitted to the U.S. Department of Justice. This report has not been published by the Department. Opinions or points of view expressed are those of the author(s) and do not necessarily reflect the official position or policies of the U.S. Department of Justice.

7
Almirall, Diaz-Guerra, Holness and Furton Final Technical Report: 2006-DN-BX-K027
The latter two requirements can be easily met by the research described herein which
aims to provide an efficient, rapid sampling and pre-concentration device that is easily
adaptable to existing detectors deployed in the security field.
Project Goals and Hypotheses The first project goal is to alter the cylindrical geometry of the solid phase
microextraction fiber into a planar geometry. The SPME fiber, in the static sampling
mode, has previously been shown to improve the detection limits of IMS alone by
allowing vapor sampling as opposed to particle sampling [19].
The first hypothesis is that changing the geometry of SPME: 1) increases the surface area
and capacity for the pre-concentration and sampling (extraction) of previously identified
volatile chemical signatures of drugs and explosives.
2) allows direct introduction of the sampling device into existing desorbers of ion
mobility spectrometry instruments (IMS) which are accepted and widely used detectors
for explosives, drugs and their volatile chemical signatures, thus eliminating the need for
fabricating interfaces for each instrument model.
The second project goal is to alter the planar geometry of SPME such that it enables flow
of the air of a suspect area through the sampling media. This would allow mass transfer
by fluid flow and decrease the boundary layer associated with static sampling thereby
allowing sampling of large volumes of air in a short time.
The second hypothesis is that developing a dynamic SPME sampling device:
1) will enable open air dynamic sampling of trace amount of volatile chemical signatures
emitted from drugs and explosives in short sampling times.
This document is a research report submitted to the U.S. Department of Justice. This report has not been published by the Department. Opinions or points of view expressed are those of the author(s) and do not necessarily reflect the official position or policies of the U.S. Department of Justice.

8
Almirall, Diaz-Guerra, Holness and Furton Final Technical Report: 2006-DN-BX-K027
2) would allow canine detection to be simulated more closely when the device is coupled
to fast detection (s) by IMS. This hypothesis will be tested by dynamically sampling the
same permeation sources used to calibrate the trained canines, with planar SPME.
The third project goal is to alter the conventional extraction phase (coating) of the SPME
device. As such, the final hypothesis is that additional benefits beyond those achieved by
changing the geometry of the SPME fiber can be observed by implementing and
developing coatings for planar SPME that will afford higher capacity and affinity for the
targeted volatile chemical signatures.
This document is a research report submitted to the U.S. Department of Justice. This report has not been published by the Department. Opinions or points of view expressed are those of the author(s) and do not necessarily reflect the official position or policies of the U.S. Department of Justice.

9
Almirall, Diaz-Guerra, Holness and Furton Final Technical Report: 2006-DN-BX-K027
Chapter 2 EXPLOSIVES AND ILLICIT DRUGS
Chemistry of Explosives Simply defined, an explosion is an event in which a large amount of energy is suddenly
released. This occurs in order to relieve accumulated pressure and return the surrounding
medium to atmospheric pressure.
There are three types of explosions: mechanical, chemical, and nuclear. A mechanical
explosion occurs when gas builds up in a container to the point where the container
bursts. For example, the explosion of a steam boiler is considered mechanical. A
chemical explosion is the result of a rapid release of gas from a chemical reaction. This
reaction occurs when a composition (the explosive) in a metastable state, undergoes an
almost instantaneous (one-hundredth of a second) exothermic transformation or
decomposition without the participation of external reactants, such as atmospheric
oxygen, since a chemical explosive contains both an oxidizer and a fuel. The fuel is
carbon and hydrogen while the oxidizer is typically nitrogen and oxygen bonded in
groups such as NO, NO2, and NO3. The reaction occurs when nitrogen and oxygen
separate and recombine with the fuel releasing large amounts of hot gases. Sensitizers can
also be included in the explosive composition to enhance the ease of initiation. A
chemical explosive must be packed but does not necessarily require confinement. Lastly,
a nuclear explosion is produced from the energy released following the splitting of an
atom or the fusion of atoms. The energy produced from this type of explosion is a billion
times greater than that of a chemical explosion [20]. In this section, the characteristics of
chemical explosives will be described with special focus on propellants and military
explosives.
This document is a research report submitted to the U.S. Department of Justice. This report has not been published by the Department. Opinions or points of view expressed are those of the author(s) and do not necessarily reflect the official position or policies of the U.S. Department of Justice.

10
Almirall, Diaz-Guerra, Holness and Furton Final Technical Report: 2006-DN-BX-K027
The reactions produced by chemical explosions can be high or low order. Propellants are
low explosives that deflagrate, meaning they burn particle to particle at sub-sonic speeds
in the material. The direction of flow of the reaction products in a low order explosion is
opposite to the propagation of the disturbance. While low explosives are initiated by
ignition, high explosives such as military explosives are initiated by shock and detonate.
In a detonation the energy that initiates and sustains the reaction is transmitted to the
material that has yet to react, as a shock wave moving at speeds greater than the speed of
sound with respect to the undisturbed material. As a result of the much greater speed,
temperature, and pressure, of the reaction [21], a detonation causes destruction on a much
larger scale than a deflagration.
Propellants Propellants are used to accelerate the projectile in a weapon to its full velocity as it exits
the barrel. Smokeless powders are the propellants of most relevance to this study.
Smokeless powders were developed to replace black powder, another propellant that was
subject to accidental initiations [22]. The ingredients in black powders are sulfur,
charcoal and potassium nitrate, the reaction produces solid product which can be as much
as 60% residue of KNO3 and other salts. Smokeless powders greatly reduced the black
smoke produced after the firing of a weapon that utilized black powders.
The nitration reaction of cellulose to produce nitrocellulose (NC) enabled the production
of smokeless powders. This is known as a single base smokeless powder since the only
energetic compound is NC. The double base smokeless powder was invented by Alfred
Nobel in 1888 consisting of nitroglycerine (NG), produced by the nitration of glycerin,
added as a reactive solvent to NC, creating a gel. Triple base powders contained NC and
NG with added nitroguanidine, to reduce muzzle flash, and are used almost exclusively in
This document is a research report submitted to the U.S. Department of Justice. This report has not been published by the Department. Opinions or points of view expressed are those of the author(s) and do not necessarily reflect the official position or policies of the U.S. Department of Justice.

11
Almirall, Diaz-Guerra, Holness and Furton Final Technical Report: 2006-DN-BX-K027
high caliber weapons. Figure 1 shows the structures of the energetic compounds in
smokeless powders.
Figure 1. Energetic Compounds in Smokeless Powders
Smokeless powders contain the following additives in their formulation: stabilizers, flash
suppressants and plasticizers. Stabilizers prevent the nitrocellulose and nitroglycerine
from decomposing by neutralizing nitric and nitrous acids that can catalyze further
decomposition of the energetic compound. Diphenylamine (DPA), methyl centralite, and
ethyl centralite (EC) are common stabilizers. Plasticizers reduce the need for volatile
solvents necessary to colloid nitrocellulose; they soften the propellant, and reduce
hygroscopicity. Some plasticizers include NC, dibutyl phthalate, 2,4-dinitrotoluene (2,4-
DNT), ethyl centralite, and triacetin. The plasticizer 2,4-DNT is produced by the nitration
of toluene. The exterior of the smokeless powder granules are coated with deterrents that
improve burn characteristics of the powder by reducing ignitability and initial flame
temperature, as well reducing the initial burn rate on the granule surface. Both 2,4-DNT
and EC are also considered deterrents. Burn characteristics can also be controlled by
altering the shape of the particle. Dyes can also be added to the formulation to help in
OH
HO
OH
N+O
O-
nitroglycerine
NH
NH2
NH
N+
O
-O
nitroguanidine
This document is a research report submitted to the U.S. Department of Justice. This report has not been published by the Department. Opinions or points of view expressed are those of the author(s) and do not necessarily reflect the official position or policies of the U.S. Department of Justice.

12
Almirall, Diaz-Guerra, Holness and Furton Final Technical Report: 2006-DN-BX-K027
identification of smokeless powders [23], of which the best example is Red Dot, a brand
that contains a small concentration of discrete red granules mixed in with black granules.
The morphology of the particles is also helpful in the preliminary identification of
smokeless powders. The various geometries include: balls, discs, perforated discs, tubes,
rods and lamels and result from the various manufacturing processes of the powders.
Figure 2 shows an image of various morphologies of the powders used in this research.
Figure 2. Smokeless Powder Morphology: A) Ball, B) Tube, C) Rod, D) Disc
In general, most tube and cylindrical powders are single-base while disc, ball, and
aggregate powders are double-base [21].
Military Explosives Most military explosives are organic high explosives. They can be separated into groups
by their compound class, either aromatic nitro (C-NO2), nitrate esters (C-O-NO2), or
nitramines (C-N-NO2) [24]. Several military explosives are included in figure 3 along
with their vapor pressures at 25°C.
This document is a research report submitted to the U.S. Department of Justice. This report has not been published by the Department. Opinions or points of view expressed are those of the author(s) and do not necessarily reflect the official position or policies of the U.S. Department of Justice.

13
Almirall, Diaz-Guerra, Holness and Furton Final Technical Report: 2006-DN-BX-K027
Figure 3. Common Military Explosives and Their Vapor Pressures at 25°C [25,26]
Table 1. Common Military and Commercial Explosive Compositions [27]
N+ O
-O
N+ O
-O
N+
O
-O
2,4,6-Trinitrotoluene
HN
N+
O
-O
N+
O-O
N+
O
O-N+
O
-O
2,4,6-Trinitrophenylmethylnitramine
N+
O
O-O
N+ O
O
-O
N+
O
O O-
N+O
O
O-
pentaerythritol tetranitrate
N+
O
O-
N+
O
O-
N+
O
-O
HO
2,4,6-trinitrophenol
N
HNN
NH
N+
O O-
N+
O
O-
N+O O-
N+
O
-O
octahydro-1,3,5,7-tetranitro-tetrazocine
N
N
N
N+
O
O-
N+
O
-O
N+ O
-O1,3,5,-trinitro-hexahydro-S-triazine
TNT 4.5 × 10
-6torr
PETN 3.8×10
-10torr
Picric Acid, N/A
RDX 1.1×10
-9torr
HMX 1.6×10
-13torr
Tetryl 5.7 × 10
-9torr
This document is a research report submitted to the U.S. Department of Justice. This report has not been published by the Department. Opinions or points of view expressed are those of the author(s) and do not necessarily reflect the official position or policies of the U.S. Department of Justice.

14
Almirall, Diaz-Guerra, Holness and Furton Final Technical Report: 2006-DN-BX-K027
The aromatic nitro explosives include picric acid and 2,4,6-trinitrotoluene (TNT). Picric
acid was the most popular choice of shell fill by military forces during the 1900s. It was
later replaced by TNT since this explosive was easier to cast in the necessary shape as
compared to picric acid. The explosive, pentaerythritol tetranitrate (PETN) is a nitrate
ester used in detonating cords and blasting caps. It is a white crystalline solid that can be
made into sheets or any desired shape by combining it with plasticizers. It can also be
mixed with TNT to make the commercial explosive Pentolite [28]. Tetryl (2,4,6-
trinitrophenylmethylnitramine) falls under the category of nitramine explosives. Tetryl
can be mixed with TNT, allowing the casting of Tetryl into munitions rather than
pressing. The explosives, RDX, (1,3,5- trinitro-hexahydro-S-triazine) and HMX
(octahydro-1,3,5,7-tetranitrotetrazocine) are also nitramine explosives, and have replaced
Tetryl for military operations. Lastly, polymer bonded explosives are mixtures/
combinations of the organic military explosives blended with binders, plasticizers, and/
or aluminum. They afford high mechanical strength, insensitivity to shock and
temperature, high detonation velocities, etc [22]. Table 1 contains some common
explosive compositions that are relevant to this discussion.
Chemistry of Illicit Drugs In the United States, the Drug Enforcement Administration is tasked with enforcing the
Controlled Substances Act (CSA) [29]. This law was enacted in 1970 in order to regulate
the manufacture, importation, possession, distribution and use of specific chemical
substances [30]. The CSA regulates five classes of drugs: narcotics, depressants,
stimulants, hallucinogens, and anabolic steroids. There are five schedules (I-V) of
controlled substances based on potential for abuse, level of physical and psychological
dependence, and medical acceptance [31].
This document is a research report submitted to the U.S. Department of Justice. This report has not been published by the Department. Opinions or points of view expressed are those of the author(s) and do not necessarily reflect the official position or policies of the U.S. Department of Justice.

15
Almirall, Diaz-Guerra, Holness and Furton Final Technical Report: 2006-DN-BX-K027
The following section is intended to provide a brief overview of the chemistry and
analysis of cocaine and marijuana, illicit drugs that were identified in Chapter 1 as being
smuggled on a large scale into the United States. Information about the most heavily
abused club drug [31], 3,4-methylenedioxymethamphetamine (MDMA), is also included
since it was the subject of several experiments in this dissertation research.
Cocaine Cocaine is a Schedule II drug since it has a high potential for abuse that may lead to
severe psychological or physical dependence, but has a currently accepted medical use
under severe restrictions.
Cocaine (figure 4A) is derived from the coca leaf Erythroxylum sp. which grows in the
Andean Highland region of South America. More specifically, it is produced from
alkaloids extracted from the plant Erythroxylum coca. The leaf itself can be chewed or
coca paste can be made from which cocaine is subsequently produced.
One way coca paste is made is by wetting coca leaves in dilute sulfuric acid and crushing
them. The water-soluble sulfate salts of the alkaloids are then extracted with kerosene.
The aqueous layer is basified with ammonia, lime or sodium carbonate, thereby
precipitating the alkaloids. Another route involves basifying the leaves with sodium or
potassium carbonate and crushing them. The alkaloids are extracted with kerosene and
dilute aqueous sulfuric acid is used to collect the alkaloids as the sulfate salts. The
aqueous layer is basified and the alkaloids are precipitated [16]. Hydrochloric acid is
added to the precipitate to produce cocaine hydrochloride. The cocaine is 75-85% pure, is
scraped into a powder once dried and is compressed into one-kilogram bricks and
packaged for distribution [31].
This document is a research report submitted to the U.S. Department of Justice. This report has not been published by the Department. Opinions or points of view expressed are those of the author(s) and do not necessarily reflect the official position or policies of the U.S. Department of Justice.

16
Almirall, Diaz-Guerra, Holness and Furton Final Technical Report: 2006-DN-BX-K027
Figure 4. Chemical Structures of: A) Cocaine and B) Methyl Benzoate
Studies have shown that exposure of cocaine hydrochloride to normal ambient conditions
will produce methyl benzoate (figure 4B) as a degradation product. Specifically,
dissipation rate of 1.89 ng min-1 of methyl benzoate at room temperature with 0 %
relative humidity was observed after one hour. A dissipation rate of 62 ng min-1at 40 °C
with 80 % relative humidity, was observed upon agitation by additional airflow [32].
This signifies that methyl benzoate, which has a very high vapor pressure, 0.38 Torr at 25
°C [33], is expected to be available for sampling from typical cargo containers, which are
exposed to humid conditions and fluctuating temperatures during loading and transport.
Marijuana Marijuana, or Cannabis sativa L. is classified as a Schedule I drugs since it has a high
potential for abuse, no acceptable medical use, and can cause severe physical and
psychological dependence.
Cannabis sativa L. is one of the oldest cultivated plants because of its many uses. Oil can
be produced from the seeds, while the stalk can be used to make ropes and fabric known
as hemp. The psychoactive effects due to the compound ∆9-tetrahydrocannaninol (THC),
present in marijuana resin, are also a reason for continued cultivation. This compound
N
O O
OO
cocaineO
O
methyl benzoate
A B
This document is a research report submitted to the U.S. Department of Justice. This report has not been published by the Department. Opinions or points of view expressed are those of the author(s) and do not necessarily reflect the official position or policies of the U.S. Department of Justice.

17
Almirall, Diaz-Guerra, Holness and Furton Final Technical Report: 2006-DN-BX-K027
(figure 5), a cannabinoid, is formed in surface features known as the glandular trichomes.
A flowering female plant contains visibly larger number of these glandular trichomes and
as such, a greater concentration of THC [16].
The leaf material of marijuana contains about 1 wt% THC while the flowering material
contains about 3.5 wt% [34]. Resin obtained by rubbing the plants against another
surface 2-10% while the highest concentration of THC (10-30 wt%) can be found in hash
oil, which is producing by extracting the cannabinoids from the plant material using an
organic solvent, by refluxing. The solvent is evaporated, leaving behind the concentrated
oil [16].
The most popular and most efficient method of ingestion is by smoking the cannabis
product since heating it above 100 ºC causes ∆9-tetrahydrocannabinolic acid (figure 5) to
thermally decarboxylate to THC, thus increasing the total concentration of the
psychoactive component, producing a stronger “high”[35].
Figure 5. The Decarboxylation of ∆9-tetrahydrocannabinolic Acid to THC
∆9-tetrahydrocannabinolic acid ∆
9-tetrahydrocannabinol
This document is a research report submitted to the U.S. Department of Justice. This report has not been published by the Department. Opinions or points of view expressed are those of the author(s) and do not necessarily reflect the official position or policies of the U.S. Department of Justice.

18
Almirall, Diaz-Guerra, Holness and Furton Final Technical Report: 2006-DN-BX-K027
MDMA The club drug, MDMA, also known as ecstacy, belongs to the drug class of
amphetamines (shown in figure 6A). It is a Schedule I drug since it has a high potential
for abuse, no acceptable medical use, and can cause severe physically and psychological
dependence. MDMA is normally found in tablet form [36] with typical dose in the range
of 75- 125 mg [16].
Figure 6. Structures of the: A) Amphetamine Drugs and B) MDMA Precursors
Numerous syntheses of MDMA have been reported in the literature [37, 38, 39, 40], but
all routes start with one of three compounds, safrole, isosafrole, or piperonal [36] shown
NH
methamphetamine
NH2
amphetamine
HN
O
O
3,4-methylenedioxymethamphetamine
NH2
O
O
3,4-methylenedioxyamphetamine
HN
O
O
3,4-methylenedioxyethylamphetamine
O
O
safrole
O
O
isosafrole
O
O
O
piperonal
A B
This document is a research report submitted to the U.S. Department of Justice. This report has not been published by the Department. Opinions or points of view expressed are those of the author(s) and do not necessarily reflect the official position or policies of the U.S. Department of Justice.

19
Almirall, Diaz-Guerra, Holness and Furton Final Technical Report: 2006-DN-BX-K027
in figure 6B. The precursors safrole, and isosafrole share the methylenedioxy moiety
whereas piperonal is the derived aldehyde.
Field Analysis of Explosives and Illicit Drugs Trace detection involves the determination of a very small chemical signal produced by
as little as a few molecules. There are two scenarios that require a trace detection
approach. First, residues of the main explosive or the parent drug can remain on surfaces
as a result of a primary transfer from the hands of people preparing an explosive device
or packaging illegal drugs for transport/ shipment. An even smaller amount would remain
following a secondary transfer. For example, a third party coming into contact with the
handler(s) of contraband may have traces transferred onto his/her person or belongings.
An alternate scenario, would be a hidden explosive device or drugs concealed in
extensive packaging. Although there may be a bulk amount of the contraband contained,
a trace amount may remain on the outside or may cross the barrier in which it is
concealed. There is a large body of research that details the structure of the compounds
that are emitted by (in the gas phase), and are characteristic of the energetic material or
the illicit drug. When attempting to screen, locate and identify (definitively or
presumptively) these trace particulates or vapors, extremely sensitive detection devices
are required.
The varieties of detectors available for this purpose employ optical, biological, and
chemical means. Some examples of optical detectors are portable Raman spectroscopy
for drug detection [41, 42], other various forms of Raman spectroscopy for explosives
detection [43, 44], and optical fluorescence, a technique that employs UV radiation to
decompose the explosive producing fragments that fluoresce [45]. This technique
This document is a research report submitted to the U.S. Department of Justice. This report has not been published by the Department. Opinions or points of view expressed are those of the author(s) and do not necessarily reflect the official position or policies of the U.S. Department of Justice.

20
Almirall, Diaz-Guerra, Holness and Furton Final Technical Report: 2006-DN-BX-K027
provides remote detection (2.5 m) of TNT. Optical techniques generally suffer from the
high cost and fragility of the instrumentation, a relatively large sample size required as
compared to other trace detection techniques, and long analysis times to obtain high
signal to noise ratios. The focus in the following sections is placed on biological and
chemical trace detectors.
Biological Detection There are many sensitive biological detectors for the trace detection of drug and
explosive contraband. Some of these include trained canines [24, 27, 36], honey bees
[46] and plants [47]. Detection by trained canines is largely based on their exemplar
olfaction capabilities. Olfaction is the detection of a chemical signal (an odor/scent) in the
environment that produces a response in the nervous system [48].
Canines are ultra-mobile sampling and detection devices that can locate explosive and
drug odors because of the unique flow system of their nose. In the process of sniffing, air
jets are created that prevent disturbance of the scent source, agitate surrounding particles
that can then be inspired and sensed, and entrains the surrounding air to the air current
surrounding the nose, further aiding in olfaction. An extensive review of canine olfaction
and their unique flow system can be found elsewhere [48]. Canines have excellent
detection limits that depend on the target compound and have been reported as 500 ppt
(part per trillion) for 2,4-DNT and 2,3-dimethyl-2,3-dinitrobenzene (DMNB), a taggant.
The detection limits are in the 10 ppb (part per billion) range for NG and methyl
benzoate, a degradation product of cocaine [49].
Detector dogs require constant training on the substances they routinely detect and
recertification for quality assurance; they have an operational time of 20 min with 40 min
This document is a research report submitted to the U.S. Department of Justice. This report has not been published by the Department. Opinions or points of view expressed are those of the author(s) and do not necessarily reflect the official position or policies of the U.S. Department of Justice.

21
Almirall, Diaz-Guerra, Holness and Furton Final Technical Report: 2006-DN-BX-K027
breaks depending on conditions, for a whole 8 h day [24]. They also can have varied
responses for the same compound since individual detector dog teams are trained on
differing amounts of target compound, but this can likely be remedied by implementing
uniform training aids [50].
The latter two biological detectors, honey bees and plants are not as widely used in the
detection of drugs and explosives as are detector dog teams. The honey bees collect TNT
and other chemical contaminants in the environment while pollinating plants. They carry
these substances back to the hive and the honey and honeycombs are analyzed for the
presence of these substances. The disadvantages of this method include the large expense
in training the bees and relatively short lifetime of the hives [46]. The role of plants as
detectors is limited to the TNT explosive. They have been mutated to contain a receptor
gene that makes them fluoresce in the presence of TNT in the soil. They can help in the
remediation of soils contaminated with chemical munitions. The detection limits of this
detector are not yet known and since it only works in the presence of TNT, it fails to
detect the multitude of explosives available for illicit purposes.
Chemical Detection The premier chemical detector for the field analysis of drugs and explosives is the ion
mobility spectrometer (IMS), since it is fast (analysis in s), can detect both drugs and
explosives at atmospheric pressure, is portable, easy to use, has extremely low detection
limits (picogram levels [17]) and is affordable (~$40,000). Other chemical detectors
include electronic noses that mimic canine olfaction [51]. They accomplish this through a
system of chemical sensing and pattern recognition. Targeted chemicals are presented to
the sensing system producing a signature or fingerprint for each chemical. A database is
This document is a research report submitted to the U.S. Department of Justice. This report has not been published by the Department. Opinions or points of view expressed are those of the author(s) and do not necessarily reflect the official position or policies of the U.S. Department of Justice.

22
Almirall, Diaz-Guerra, Holness and Furton Final Technical Report: 2006-DN-BX-K027
created of all the signatures, and then the pattern recognition system is used to detect the
chemicals after analysis. Gas chromatography (GC), mass spectrometry (MS), and IMS
are also considered electronic noses provided they are portable, lightweight, and sensitive
to the target chemicals [52]. IMS coupled to mas sspectrometry was also used in this
study to characterize the structures of explosive compounds. This technique proved
reliable in providing unambiguous identification of the ionic species being detected under
atmospheric chemical ionization (APCI) that occurs in the IMS.
Chapter 3
The above figures reveal that proton abstracted ions are formed for both DNT and TNT under chemical ionization conditions in the IMS. While other compounds such as RDX do not form stable proton abstracted ions but instead forms adducted molecules.
Figure 2 Characterization of DNT with Ion Mobility Mass Spectrometry
Figure 1: Characterization of TNT with Ion Mobility Mass Spectrometry
Figure 4: Mass Spectrum of RDX molecule in ammoniun nitrate solution
Figure 3: SIM of 284 Ion from RDX in ammonium nitrate solution
This document is a research report submitted to the U.S. Department of Justice. This report has not been published by the Department. Opinions or points of view expressed are those of the author(s) and do not necessarily reflect the official position or policies of the U.S. Department of Justice.

23
Almirall, Diaz-Guerra, Holness and Furton Final Technical Report: 2006-DN-BX-K027
VOLATILE CHEMICAL SIGNATURES Trained canines are accepted by the general public as the ultimate detection and locating
device for contraband substances, such as drugs and explosives, human cadavers, missing
persons, etc. This is because of their acute sense of smell, or olfaction. Olfaction is
defined as the sensory detection of an odor [48], or a chemical mixture of volatile
compounds that stimulates the olfactory neurons [53]. For olfaction to occur, the source
of this volatile chemical mixture need not be present [48]. This has major implications
since it means that the parent compound, such as the specific drug or explosive is not
necessarily what is being detected by trained canines. In fact, research described in this
chapter shows that canine detection mainly involves the sensing of vapor substances, or
molecules in the gas phase.
Definition of Volatile Chemical Signatures For a substance to be in the gas phase it must possess sufficient vapor pressure. Table 2
shows the classification of substances based on their vapor pressures as volatile, semi-
volatile, or non-volatile (particles).
Table 2. Classification of Compounds Based on Volatility
Relatively volatile explosives such as EGDN (ethylene glycol dinitrate), NG, or TNT
have vapor pressures at 25°C of 4.8 × 10⁻² torr, 2.3 × 10⁻⁴ torr and 4.5 ×10⁻⁶ torr,
respectively, making them available in air for direct detection by a chemical and
This document is a research report submitted to the U.S. Department of Justice. This report has not been published by the Department. Opinions or points of view expressed are those of the author(s) and do not necessarily reflect the official position or policies of the U.S. Department of Justice.
24
Almirall, Diaz-Guerra, Holness and Furton Final Technical Report: 2006-DN-BX-K027
biological detector. Other organic explosives of security interest such as RDX, HMX, and
PETN have very low vapor pressures, 1.1×10⁻⁹ torr, 1.6 × 10⁻¹³ torr, 3.8×10⁻¹⁰ torr,
respectively, and are not available in the headspace. This essentially makes vapor
sampling impossible, yet trained dogs can easily detect these explosives because they
utilize volatile chemical signatures of explosive mixtures to reliably located them under
difficult field conditions [27].
A volatile chemical signature is being defined for this research as a compound, or a
mixture of compounds that has been demonstrated to produce an olfactory response by a
trained canine, and/or has been detected in the headspace above its respective parent
compound by an instrumental technique, and persists for a period of time in order to
allow its detection.
Volatile Chemical Signatures of Explosives Canine trials have elucidated several odor volatile chemical signatures of explosives. For
example, TNT and cast explosives share 2,4-dinitrotoluene (2,4- DNT) as a volatile
chemical signature [27]. For the polymer-bonded explosives such as Composition C-4, 2-
ethyl-1-hexanol elicited canine response, while the primary explosive RDX produced
none.
The low explosives, smokeless powders, contain stabilizers such as diphenylamine
(DPA), ethyl centralite (N,N-diethyl diphenyl urea), methyl centralite and deterrents such
as butyl phthalate, 2,4-DNT. These additives are useful in the characterization and
identification of the source of these explosives [54] and have even been detected in
gunshot and post-blast residues [55,56,57]. Despite confirmation of the presence of these
This document is a research report submitted to the U.S. Department of Justice. This report has not been published by the Department. Opinions or points of view expressed are those of the author(s) and do not necessarily reflect the official position or policies of the U.S. Department of Justice.

25
Almirall, Diaz-Guerra, Holness and Furton Final Technical Report: 2006-DN-BX-K027
volatile chemical signatures in the headspace of smokeless powders and residues, dogs
showed little or no interest in these compounds during dog trials [58].
Headspace sampling using solid phase microextraction (SPME, described in Chapter 4)
has helped to identify many explosive volatile chemical signatures. The presence of
cyclohexanone [3] and 2-ethyl-1-hexanol [24,59], in the headspace of plastic cast
explosives has been confirmed.
The successful extraction of the volatile chemical signatures of TNT from simulated
buried mines has been reported by using SPME [60]. The explosive, TNT was detectable
from various soils and at different temperatures all at or below 23°C by sampling of the
headspace above the soil. The compounds 2,4-DNT, 1,3-dinitrobenzene (1,3-DNB), and
TNT were detected and although99% of the explosive composition of the mines was
TNT, the analytes 2,4-DNT and 1,3-DNB predominated in the headspace. This further
demonstrates that targeting volatile chemical signatures as a means of identifying the
presence of explosives is feasible. Baez et al. sampled vapors emitted from TNT crystals
buried in soil and found that TNT and 2,4-DNT predominated in the headspace [61].
Volatile Chemical Signatures of Drugs The detection of drugs by seeking the parent compounds is also problematic for the same
reason, but canine detection of these illicit drugs is based upon volatile chemical
signatures [36, 62, 63]. For example, cocaine detection by canine olfaction is
accomplished by targeting methyl benzoate, a decomposition product, not cocaine itself
[36, 63].
In the case of MDMA, its high polarity and low vapor pressure make SPME extraction of
the tablets ineffective. Fortunately, the high vapor pressure of one of the starting
This document is a research report submitted to the U.S. Department of Justice. This report has not been published by the Department. Opinions or points of view expressed are those of the author(s) and do not necessarily reflect the official position or policies of the U.S. Department of Justice.

26
Almirall, Diaz-Guerra, Holness and Furton Final Technical Report: 2006-DN-BX-K027
materials in the synthesis of this drug, piperonal (1.0 mmHg at 87 ºC), enables headspace
SPME sampling. Through canine trials as well as SPME-GC/MS analysis, the volatile
chemical signatures of MDMA have been identified as piperonal and 3,4-
methylenedioxy-phenyl-2-propanone (MD-P2P) [36, 62]. Instrumental analysis of SPME
extracts of another drug, marijuana, revealed α-pinene & β-pinene, limonene, as volatile
chemical signatures [64].
Figure 7 includes the structures and vapor pressures of the volatile chemical signatures of
importance to this research.
Figure 7. Volatile Chemical Signatures of the Appropriate Parent Compounds and
Vapor Pressures. The values listed are at 25 °C unless otherwise stated [59, 26, 65].
4.5 × 10⁻⁶
Torr 1.1 × 10⁻⁴
Torr
1.0 Torr @ 87°C
0.136 Torr
4.35 Torr
6.39 × 10⁻⁴
Torr
N/A
TNT and Smokeless Powders MDMA
Smokeless Powders
Polymer-bonded
explosives
TNT
N+
O
-ON+
O
O-
2,4-dinitrotoluene
O
O
O
Piperonal
NH
Diphenylamine
HO2-ethyl-1-hexanol
O
Cyclohexanone
N+ O
-O
N+ O
-O
N+
O
-O
2,4,6-trinitrotoluene
N
O
N
N,N-diethyl diphenyl urea
This document is a research report submitted to the U.S. Department of Justice. This report has not been published by the Department. Opinions or points of view expressed are those of the author(s) and do not necessarily reflect the official position or policies of the U.S. Department of Justice.

27
Almirall, Diaz-Guerra, Holness and Furton Final Technical Report: 2006-DN-BX-K027
Delivery Methods for Volatile Chemical Signatures With the body of knowledge gained from canine and headspace analysis of illicit drugs
and explosives, the next stage was to create calibration standards for certification of
detector dogs. Controlled Odor Mimic Permeation Systems (COMPS) [27, 50,66] were
developed for this purpose, and enable quantitation of the maximal mass of the volatile
chemical signatures in air available for sampling by a trained canine or an instrumental
technique. These COMPS devices differ from currently available gas generating systems
[67,68] in portability since they are lightweight, do not require any power to operate, are
very inexpensive, and as opposed to a type of finite gas generating system[69], they
provide a continuous vapor source. Piperonal COMPS devices have recently been
reported as a vapor source for the determination of canine detection sensitivity in the
detection of MDMA [50].
This document is a research report submitted to the U.S. Department of Justice. This report has not been published by the Department. Opinions or points of view expressed are those of the author(s) and do not necessarily reflect the official position or policies of the U.S. Department of Justice.

28
Almirall, Diaz-Guerra, Holness and Furton Final Technical Report: 2006-DN-BX-K027
Chapter 4 SOLID PHASE MICROEXTRACTION
Theory of Solid Phase Microextraction Solid Phase Microextraction (SPME) is a solvent-free, sampling, extraction, pre-
concentration, and sample introduction technique that absorbs or adsorbs analytes onto a
small volume of non-volatile polymeric coating or solid sorbent phase spread on a solid
support. The technique is referred to as “microextraction” as only a small portion of the
sample is extracted at any one time. Mass transfer of the analytes occurs the moment the
coated fiber comes into contact with the sample [70], and is influenced by the attraction
of the analytes to the phase based on the principle of “like dissolves like.” The current
work utilizes these principles and improves upon them through the advent of planar-
SPME (PSPME) where both sorbent phase and overall sorbent volume have been varied.
Historical Aspects of SPME The inception of solid phase microextraction dates back to 1987 [71]. At this time, the
Pawliszyn group was conducting work on laser desorption/fast gas chromatography
(GC), which was inhibited by the long sample preparation times relative to the separation
and analyses times. Optical fibers were already being used to transmit laser light energy
to the GC, so as a clever sample preparation technique, sections of the fibers were dipped
in the solution containing the analytes, the solvent was evaporated and the fiber was
introduced into the GC with analyte desorption via a laser pulse. A subsequent study [72]
focused mainly on confirming the usefulness of this sampling approach and showed that
both polar and non-polar analytes were extracted from aqueous samples. The only issue
was the loss of head pressure at the column, since for introduction of the fiber, opening of
the injector was required. This problem was corrected by incorporating the coated fibers
into a Hamilton 7000 series microsyringe resulting in the first SPME device, as the
This document is a research report submitted to the U.S. Department of Justice. This report has not been published by the Department. Opinions or points of view expressed are those of the author(s) and do not necessarily reflect the official position or policies of the U.S. Department of Justice.

29
Almirall, Diaz-Guerra, Holness and Furton Final Technical Report: 2006-DN-BX-K027
analytical community knows it [73]. Since then, SPME has become a widely used sample
preparation technique, employed for a wide range of applications and has even been the
subject of several recent reviews [74, 75, 76].
Thermodynamics The mass extracted onto the coating (n) is mediated by several parameters including the
equilibrium constants described by equation 1, temperature, coating chemistry, sample
volume and coating volume and the initial concentration in the headspace available for
sampling.
0
sfs
sf
VVKCVVK
nf
fs
+=
(Equation 1)
The fiber/coating matrix distribution constant is Kfs, Vf is the volume of the coating, Vs is
the sample volume, and C0 is the initial concentration of the analyte of interest in the
sample. When the sample volume is large (Vs>>KfsVf) then equation 1 can be simplified
to equation 2, providing a direct quantitative relationship between the amount extracted
and the initial concentration of the analyte in the matrix:
0CVKn ffs= (Equation 2)
The utility of SPME for field sampling is evident because based on equation 2, the
amount of extracted drug, explosive or volatile chemical signature will correspond
directly to the initial concentration of the analyte in the matrix without dependency on the
volume of the sample [70].
Kinetics Studying kinetics can help the analyst optimize extraction conditions by elucidating ways
to increase the speed of extraction. Agitation is the main route to accomplish this and in
an ideal scenario the molecules in the sample phase, be it the headspace or the actual
This document is a research report submitted to the U.S. Department of Justice. This report has not been published by the Department. Opinions or points of view expressed are those of the author(s) and do not necessarily reflect the official position or policies of the U.S. Department of Justice.

30
Almirall, Diaz-Guerra, Holness and Furton Final Technical Report: 2006-DN-BX-K027
sample matrix as in direct immersion, move very rapidly with respect to the SPME phase.
In this manner, the analytes in the sample all have equal access to the SPME coating.
With these perfect agitation conditions, the equilibrium time (equation 3) is the time it
takes for 95% of the equilibrium amount of a given analyte in a sample to be extracted by
the coating,
te = t95% =2(b − a)2
Df (Equation 3)
where b is the fiber coating outer radius, a is the fiber coating inner radius, and Df is the
analyte diffusion coefficient in the fiber coating. The equation can be used in the method
development process to estimate the minimum amount of time it will take to reach
equilibrium. In reality, the fluid in contact with the fiber surface is always stationary
regardless of how well the analyst agitates the sample. Like a gradient, the further away
from the fiber surface, the greater the fluid motion until bulk flow in the sample is
reached. To model this behavior, the space closest to the fiber surface is considered a
zone of defined thickness where no convection of molecules occurs. On the other hand,
perfect agitation occurs beyond this depletion zone. Figure 8, illustrates this boundary
layer model, while equation 4 represents a correction for determining equilibrium time
under less than perfect agitations conditions.
This document is a research report submitted to the U.S. Department of Justice. This report has not been published by the Department. Opinions or points of view expressed are those of the author(s) and do not necessarily reflect the official position or policies of the U.S. Department of Justice.

31
Almirall, Diaz-Guerra, Holness and Furton Final Technical Report: 2006-DN-BX-K027
Figure 8. Boundary Layer Model
te = t95% = 3δK fs(b − a)
Ds (Equation 4)
This equation factors in both the analyte’s diffusion coefficient, Ds, in the sample fluid as
well as Kfs rather than simply considering Df . The thickness of the boundary layer (δ) is
also accounted for, and is determined by agitation conditions and fluid viscosity [77]. By
minimizing this zone, extraction rates can be increased.
Distance
Concentration
Solid support
SPME Coating
Sample Boundary
Layer
δ
This document is a research report submitted to the U.S. Department of Justice. This report has not been published by the Department. Opinions or points of view expressed are those of the author(s) and do not necessarily reflect the official position or policies of the U.S. Department of Justice.

32
Almirall, Diaz-Guerra, Holness and Furton Final Technical Report: 2006-DN-BX-K027
Practical Aspects of Sampling This small volume of sorbent is generally coated onto fused silica or metal fibers. These
delicate coated fibers are housed in a syringe in the commercial configuration available
from Supelco. A schematic of the complete sampling system is shown in figure 9.
Figure 9. Commercial SPME Fiber Sampler from Supleco
There are several theoretical SPME configurations besides the fiber including: stir-bar,
disk/membrane, particles suspended in the sampling media, in-tube SPME with sampling
media flowing through (similar to GC and HPLC stationary phases), and vessel walls
[77]. One of the main advantages of SPME is the ability to develop/ select the appropriate
geometry depending on the sample considerations for the particular matrix in which the
desired analyte resides. Examples of effective varied geometries are stir-bar sorptive
extraction [78] that is useful for the analysis of biological matrices [79], and thin-film
microextraction [80].These have been developed to increase capacity for absorption by
increasing the surface area of the extraction phase.
This document is a research report submitted to the U.S. Department of Justice. This report has not been published by the Department. Opinions or points of view expressed are those of the author(s) and do not necessarily reflect the official position or policies of the U.S. Department of Justice.

33
Almirall, Diaz-Guerra, Holness and Furton Final Technical Report: 2006-DN-BX-K027
The complete SPME process requires extraction, transfer, and desorption [81]. Extraction
begins when the SPME device is exposed to the sample. The analyte mass accumulates
over time until equilibrium conditions are reached whereby extraction for longer time
does not afford additional extract.
Extraction Modes There are three extraction modes: direct immersion, headspace, and membrane-protected
extractions, and are illustrated below (see figure 10).
Figure 10. Extraction modes of SPME (H.S. - sample headspace): A) direct
immersion, B) headspace and C) membrane-protected [77]
For direct immersion, shown in figure 10A, the SPME fiber is directly inserted into the
sample and the analytes are immediately transported to the coating. Agitation such as
stirring or movement of the sample vial can be used to further expedite the absorption/
adsorption of molecules by moving them near the SPME phase thus preventing depletion
of the boundary layer. Agitation techniques are generally not required for gaseous
samples since air convection is considered sufficient.
This document is a research report submitted to the U.S. Department of Justice. This report has not been published by the Department. Opinions or points of view expressed are those of the author(s) and do not necessarily reflect the official position or policies of the U.S. Department of Justice.

34
Almirall, Diaz-Guerra, Holness and Furton Final Technical Report: 2006-DN-BX-K027
When conducting headspace sampling, shown in figure 10B, the analytes are removed
from the headspace by the fiber, with further extraction originating from the sample
matrix. The rate-determining step is the speed with which the sample matrix replenishes
the headspace concentration. This process is fastest for volatile compounds but can be
aided by agitation and/or increasing the temperature of extraction for the determination of
semi-volatile analytes. This process continues until multi-phase equilibrium is reached
between the sample and the fiber, the sample and the headspace, and the fiber and the
headspace. For volatiles, if the headspace is allowed to reach equilibrium with the
sampling matrix prior to sampling with the fiber, the overall extraction times can be
shorter for the headspace technique compared to direct immersion [77]. Headspace
sampling is also advantageous since the fiber is protected from non-volatile interferences
in the matrix, modifications of the matrix like pH changes that are used to increase
extraction rates [77] or organic solvents that can swell the phase and cause stripping
when the fiber is withdrawn into the protective needle.
The membrane-protected technique, shown in figure 10C, was created to build upon
strategies for protecting the delicate SPME fiber from very dirty matrices. The technique
is in-line with utilizing headspace sampling for volatile compounds instead of direct
immersion, but is aimed at providing analysts with a technique for the determination of
analytes with insufficient volatility to use the headspace technique. Obviously, the
extraction rates are slower since the analytes must diffuse through the membrane prior
reaching the SPME fiber, but the use of agitation techniques and extremely thin
membranes help alleviate this slight disadvantage [77].
This document is a research report submitted to the U.S. Department of Justice. This report has not been published by the Department. Opinions or points of view expressed are those of the author(s) and do not necessarily reflect the official position or policies of the U.S. Department of Justice.

35
Almirall, Diaz-Guerra, Holness and Furton Final Technical Report: 2006-DN-BX-K027
Under any extraction mode, after the analytes have been collected, they are desorbed
from the coated fiber into the analytical instrumentation by thermal desorption into the
high temperature injection liner of a GC or by a solvent for HPLC [82].
Microextraction Sorbent Chemistry There are several steps involved when developing a SPME method. The first step is
selecting the fiber coating. The others are described elsewhere, with some more important
than others [77]. There is a wide range of commercially available fibers for the purposes
of method development that exhibit various polarities, coating thicknesses, and coating
types. These are listed in Table 3.
Table 3. Commercially Available SPME Fiber Coatings [20]
Based on the principle of “like dissolves like,” the polarity of the coating is chosen to be
closest to the analytes targeted for extraction from the sample matrix. The coating
thickness is chosen to be the thinnest amount that enables equilibrium to be reached the
fastest, and desorption to be complete, while still retaining sensitivity. The thicker a
This document is a research report submitted to the U.S. Department of Justice. This report has not been published by the Department. Opinions or points of view expressed are those of the author(s) and do not necessarily reflect the official position or policies of the U.S. Department of Justice.
36
Almirall, Diaz-Guerra, Holness and Furton Final Technical Report: 2006-DN-BX-K027
SPME coating is, the more capacity for extraction/retention, but the drawbacks include
longer sampling times and higher desorption temperatures required. The coating type
determines the method of extraction as absorption or adsorption. Absorptive coatings
extract by partitioning of the sample into and out of a liquid polymeric coating until
equilibrium is reached. This process has been compared to how a sponge absorbs liquid
[83]. Since absorbent materials are films, there are no active sites that molecules compete
for to occupy. The retention of analytes on an absorbent coating is mostly determined by
the film thickness. The size of the analyte and polarity also affect retention, but not as
much as the film thickness.
Adsorptive coatings, sometimes referred to as solid coatings, are designed for the
extraction of very small and volatile molecules. These coatings extract by physically
interacting with the molecules; they have pores of varying sizes (micropores and
mesopores) that trap the analytes and retain them until high temperature or a solvent is
used to remove them from the coating and also provide a large surface area for extraction.
Medium sized molecules can also be retained if the coating has large pores (mesopores).
The solid coating can be dispersed in a polymeric medium as is the case with Carboxen-
PDMS Stableflex. This PDMS polymer coating helps to attach the solid particles to the
fiber core as well as enhances selectivity based on its polarity [88].With the presence of
the pores that enable physical interaction with the sample molecules and trapping,
competition is observed for the available active sites at capacity. A diligent analyst will
monitor effects of displacement over time to determine the optimal extraction conditions
for the desired analyte(s).
This document is a research report submitted to the U.S. Department of Justice. This report has not been published by the Department. Opinions or points of view expressed are those of the author(s) and do not necessarily reflect the official position or policies of the U.S. Department of Justice.

37
Almirall, Diaz-Guerra, Holness and Furton Final Technical Report: 2006-DN-BX-K027
Phase Chemistry Much effort has been devoted to altering and developing new SPME coatings [84]. This
is because phase chemistry affects extraction outcomes (mass uptake rate, percent
recovery, etc.) for a desired analyte. In this section, a coating technique using sol-gel
technology will be described thoroughly. A polymer coating based on rare earth ß-
diketonate complexes recently employed for SPME in the determination of TNT [85] will
also be described, as it is potentially a viable alternative extraction phase for this
research.
Sol-gel Coating Technology The sol-gel process first involves the formation of a suspension of colloidal particles
known as the sol. A sol is defined as a colloid (a mechanical mixture where one
substance is dispersed evenly throughout another) [86], consisting of solid particles
dispersed in a liquid medium. The sol is then converted to a gel, whereby the solid
particles become connected by chemical treatment. The gel is then dried and sintered to
form a ceramic product [87], for example.
Utilization of the sol-gel process to create inorganic and hybrid organic-inorganic
polymers affords many advantages [88]. The sol-gel technique allows these polymers of
tailored chemistry to be synthesized in various forms depending on the desired end-use.
Dense thin films, fibers, powders, dense ceramics, monoliths and uniformly sized
particles, can be produced by various processing and drying techniques (coating,
extruding, conventional drying, supercritical drying, grinding, sintering, etc.) [89]. These
customized materials, are formed under very mild conditions, such as lower temperatures
of preparation, and can even be made in-situ or in “one pot.” This stems from the
compatibility of the ingredients that facilitate thorough mixing. Since these products
This document is a research report submitted to the U.S. Department of Justice. This report has not been published by the Department. Opinions or points of view expressed are those of the author(s) and do not necessarily reflect the official position or policies of the U.S. Department of Justice.

38
Almirall, Diaz-Guerra, Holness and Furton Final Technical Report: 2006-DN-BX-K027
originate from raw materials of known origin, the final product has better purity and
homogeneity than glass and ceramics produced traditionally. By enabling the creation of
hybrid organic-inorganic polymers, selectivity, stationary phase stability, and overall
performance of chromatographic separations can be improved. Improvements in
chromatographic stationary phase stability are due to high thermal resistance the sol-gel
polymer, thereby reducing column bleed when conducting separations at extremely high
temperatures, and high pH stability when exposed to mobile phases ranging from the
most acidic to the most basic. The siloxane bond (Si-O-Si) at the surface of traditional
stationary phases hydrolyzes at pH values greater than 8 and this reaction is expedited
further at high temperatures [90]. Lastly, and what is likely the largest contributor to the
ever increasing popularity of the sol-gel process as a method for creating new materials
aimed at a wide range of scientific and engineering applications, is that the structure and
properties of the polymers synthesized can be designed by keenly selecting the precursors
and building blocks for the sol-gel reactions [93].
Chemical reactions in the sol-gel process There are generally 2 main steps in the sol-gel process. First, simple, sol-gel active
precursors are converted into the sol, or an intermediate colloidal state consisting of solid
nanometer sized particles in a liquid medium. Next, the sol solution is converted, through
another set of reactions into a three-dimensional polymeric network with solvent filled
pores. This is called the gel.
For a sol-gel reaction to proceed, there are several building blocks that are required. One
or more precursors are necessary and are typically metal alkoxides M(OR)x. One or more
sol-gel active polymers act as the stationary phase. Another sol-gel active polymer
This document is a research report submitted to the U.S. Department of Justice. This report has not been published by the Department. Opinions or points of view expressed are those of the author(s) and do not necessarily reflect the official position or policies of the U.S. Department of Justice.

39
Almirall, Diaz-Guerra, Holness and Furton Final Technical Report: 2006-DN-BX-K027
known as the deactivating reagent is used to encap (derivatize) residual silanol groups.
The deactivating reagent should have a similar structure to the stationary phase so as not
to alter the overall absorptive properties [91]. A solvent such as methylene chloride is
required to disperse the ingredients. An acid or base catalyst, and water, the hydrolysis
reagent are also necessary [93].
The chemical reactions that take place in a sol-gel process are first, the precursor(s) are
hydrolyzed, then polycondensation of the hydrolyzed products occurs. The condensation
and hydrolysis products react with the sol-gel active species that include the deactivation
reagent and the stationary phase. As the condensation reactions are occurring the
viscosity of the solution gradually increases and the nanometer sized particles that have
been created agglomerate in a rigid three-dimensional network. Lastly, the sol-gel
polymer product reacts with the activated silica surface of the glass or a metal activated
surface such as titanium [93].
The choice of catalyst can affect the final structure of the sol-gel product formed. When
base is used as a catalyst, electron donating –OR groups are removed. The monomers are
almost completely hydrolyzed so cross-linking begins at an early stage even though
original precursor remains. The resulting condensed particulate matter makes up the
porous sol-gel polymer structure since the condensation reactions occur faster than the
relatively slow hydrolysis step [92]. Under acidic conditions, the precursors are
converted into the silanol hydrolysis product very rapidly leading to highly branched
linear polymers by virtue that the hydrolysis of the precursors occurs much faster than the
condensation reactions [93]. Protonation of silanol species is less favorable since one
electron donating alkoxy group has already been removed, making the second hydrolysis
This document is a research report submitted to the U.S. Department of Justice. This report has not been published by the Department. Opinions or points of view expressed are those of the author(s) and do not necessarily reflect the official position or policies of the U.S. Department of Justice.

40
Almirall, Diaz-Guerra, Holness and Furton Final Technical Report: 2006-DN-BX-K027
step is much slower. As a result, polycondensation reactions occurs between Si-OH and
Si-OR groups of partially or non-hydrolyzed products. The terminal Si-OR groups that
result are more reactive both inductively and stearically, thus long linear polymers are
formed. These linear polymers can become entangled, or crosslinked after hydrolysis of
the Si-OR moieties [93] affording added stability under conditions of extreme heat or pH.
The precursor, if chosen carefully, can minimize the undesirable effects of cracking from
stress and shrinkage that occur during the drying step. Shrinkage and cracking is
observed when the gel applied to the substrate results in a thick (greater than 0.5 μm) film
[94]. The coherent force within a thick film causes drying of the film in a direction
parallel to the substrate surface rather than perpendicular to the surface as seen in thin
films [95].
Since coating thicknesses beyond 0.5 μm can be required for a particular application, a
way to minimize these structural defects was necessary. Rather than using the popular
precursor TMOS, tetramethoxysilane, alkyl derivatives of TMOS can be used [96,97]
since they ultimately lead to a more open bed structure of the sol-gel and thus the stress is
minimized during the drying step [102]when compared to using TMOS. The alkyl
derivative, methyl trimethoxysilane (MTMOS) satisfies these requirements and was first
used by Chong, et.al. [101]as the precursor in their sol-gel process.
Sol-gel SPME Coatings Sol-gel coating technology was used for the first time in the preparation of solid phase
microextraction fibers [101].The use of sol-gel SPME extraction phases is fueled by a
number of disadvantages traditional commercially available SPME fibers possess [93].
The SPME fibers normally have low operating temperature limits (240 °C -280 °C).
This document is a research report submitted to the U.S. Department of Justice. This report has not been published by the Department. Opinions or points of view expressed are those of the author(s) and do not necessarily reflect the official position or policies of the U.S. Department of Justice.

41
Almirall, Diaz-Guerra, Holness and Furton Final Technical Report: 2006-DN-BX-K027
Desorption of strongly attracted analytes off the SPME fiber extraction device may
require higher temperatures than the particular operating limit. In these cases, increasing
the temperature despite the reported limits would result in damage to the fiber,
decomposition of the SPME phase with possible contamination of the analytical
instrument, and at best, reduce overall lifetimes of the fiber. Also, the fiber is extremely
fragile and can easily break, the coating may inadvertently be stripped off, and the phase
can easily swell in organic solvents, and degrade when exposed to extreme pH
conditions. These problems originate from the SPME extraction phase not being
covalently bonded to the substrate, which is typically the fused silica fiber or titanium
rod. The sol-gel process affords high temperature (300 °C- 450°C) [98], solvent and pH
stability [99], and can provide very thin coatings that facilitate desorption. The phase
chemistry can be tailored to extract specific analytes, increasing selectivity of the
analytical process. Furthermore, an extraction phase consisting of nano-sized particles
created during the sol-gel process, affords additional surface area and capacity when
compared to a glassy film of PDMS.
Many novel SPME coatings based on sol-gel technology have been developed since it
first was introduced as a way of coating fibers [101] and thus the topic is the subject of a
recent review [93]. An o-poly(butyl methacrylate/OH-TSO) (BMA/OH-TSO) coating has
been developed that enabled the extraction of mustard gas, 2-chloroethyl ethyl sulfide, a
chemical warfare agent from the soil with low detection limits (ng g-1) and good
reproducibility (2.2%) [100]. Another study produced three different forms of vinyl
crown ether phases to preferentially extract organophosporus pesticides from foods
[101]. These workers used vinyl crown ethers with different cavity sizes and benzyl
This document is a research report submitted to the U.S. Department of Justice. This report has not been published by the Department. Opinions or points of view expressed are those of the author(s) and do not necessarily reflect the official position or policies of the U.S. Department of Justice.

42
Almirall, Diaz-Guerra, Holness and Furton Final Technical Report: 2006-DN-BX-K027
substitutions to determine which was best for this target analyte, while strongly attaching
this coating to the substrate via a sol-gel process. Vinyl crown ether coatings exhibit
medium polarity because of the cavity structure and strong electronegative effect of
heteroatoms on the ring. This provides unique selectivity for polar compounds such as
the pesticides in question. They concluded that the benzo-15-crown-5 coating exhibited
the greatest extraction efficiency since there is one benzyl group on its crown ether ring
and its electron distribution not symmetrical. This is because of the P/ π conjugation
between the benzyl group and the oxygen atoms connected to the benzyl group, which
result in a bigger dipole moment. This made it the most polar of all the phases studied.
Other SPME phases developed based on sol–gel include polyethylene glycol (PEG) [102]
and hydroxyfullerene [103] fibers for extraction of polar and non-polar compounds. It is
evident just from these few examples that any strongly attached coating with desired
extraction capabilites and high operating temperature limits can be developed for SPME
sampling just by using sol-gel technology and the appropriate precursors that will result
in a coating chemistry containing moieties chosen to preferentially extract the desired
compounds.
La (dihed) Phase Chemistry Since before 1967, it has been accepted that the rare earth chelates of ß-diketones,
especially the tris complexes, showed promise as stationary phases for gas
chromatography [104]. There was the issue of hydration in compounds that affected the
thermal stability of some of the complexes [105], but this was successfully addressed by
using a sterically hindered ligand [106]. Furthermore, by employing highly
electronegative fluorinated ligands, a water molecule may be hydrogen bonded to an
This document is a research report submitted to the U.S. Department of Justice. This report has not been published by the Department. Opinions or points of view expressed are those of the author(s) and do not necessarily reflect the official position or policies of the U.S. Department of Justice.
43
Almirall, Diaz-Guerra, Holness and Furton Final Technical Report: 2006-DN-BX-K027
electronegative site on the ligand shell instead of being coordinated with the metal center
[107, 108]. As a result, thermal stability is increased, since the possibility of hydrolysis
of the complex is decreased [109].
With these potential setbacks resolved, the use of ß-diketonate chelates of the lanthanide
mixed with liquid stationary phases was further explored [109, 110]. Later, pre-analytical
columns were prepared containing a sorbent based on a lanthanide complex, specifically
europium (III). The motivation was that the chelates would accept additional donor atoms
in the coordination sphere of the lanthanide, forming strong complexes with oxygen
containing compounds. In other words, nucleophilic species could be separated from non-
nucleophilic species by formation of a complex. The non-nucleophilic compounds would
be eluted normally, while the fraction containing nucleophilic compounds like aldehydes,
ketones, alcohols, etc., complexed with the metal chelate, could be thermally dissociated
and that fraction kept for subsequent analysis. This novel sorbent allowed analysis of
specific classes of compounds and simplified what would otherwise have been very
complex chromatograms. The last recommendation by these workers was the
replacement of the costly lanthanide metal, europium, with lanthanum, based on
experiments where the smaller lanthanide, lutetium, yielded identical results as with
europium [111].
The La (III) complex with the p-di(4,4,5,5,6,6,6-heptafluoro-1,3-hexanedionyl)benzene,
(H2dihed) fluorinated ligand [112] was later produced as previously suggested [116], as
were many other metal complexes in order to produce stationary phases with varying
retention properties [117].
This document is a research report submitted to the U.S. Department of Justice. This report has not been published by the Department. Opinions or points of view expressed are those of the author(s) and do not necessarily reflect the official position or policies of the U.S. Department of Justice.

44
Almirall, Diaz-Guerra, Holness and Furton Final Technical Report: 2006-DN-BX-K027
More recently, work on these stationary phases was resurrected in order to apply them to
the separation of a variety of explosive samples. These included TNT, 2,6-DNT, DMNB,
TATP, and the nitrated esters, all of importance to this research. The idea was that these
explosives, Lewis base analytes, would be strongly attracted to the Lewis acid polymer,
the metal ß-diketonate stationary phase. The best retention was obtained with the La
(dihed) chemistry, but some of the explosives were so strongly retained that they could
not be eluted from the packed column. This was a consequence of using the fluorinated
H2 (dihed) ligand since its electron withdrawing inductive effects increase the metal
center acidity, enhancing interaction with the weak Lewis base explosives [113].
Since most of the retained species could be thermally desorbed from the metal ß-
diketonate stationary phase, it was only logical to use this sorbent as a SPME phase. In
simple terms, SPME in the fiber form, can be considered an inside-out chromatographic
column and what likely further encouraged these researchers to pursue this application
was the performance of La (dihed) in the packed form at retaining the volatile and semi-
volatile explosives, volatile chemical signatures, and taggants that previous researchers
have found success with while conducting SPME sampling (see Section 4.4.1). The La
(dihed) SPME fibers produced, by dipping in a solution of the polymer in methanol or
directly pasting it to the fiber with an epoxy, showed a 20 times enhancement in the
detected amount of 2,4-DNT and 17 times enhancement in the detected amount of TNT
following sampling/extraction from a large volume vessel (an explosives bunker), over
the control PDMS fiber [90]. Demonstration of enhanced capture by this SPME fiber type
is significant for two reasons: it improves the probability of extracting dilute amounts of
these airborne compounds from large volume vessels, and may later prove, since it
This document is a research report submitted to the U.S. Department of Justice. This report has not been published by the Department. Opinions or points of view expressed are those of the author(s) and do not necessarily reflect the official position or policies of the U.S. Department of Justice.

45
Almirall, Diaz-Guerra, Holness and Furton Final Technical Report: 2006-DN-BX-K027
selectively extracts Lewis base analytes, to reduce or eliminate interferences from
extraneous compounds in air.
Despite the promising data shown by the La (dihed) SPME fibers for improving
explosives sampling, it is clear that this SPME phase does have room for improvement.
First, the La (dihed) complex is hygroscopic and ligand hydrolysis is observed as artifacts
of various hydrolysis products following desorption into the GC/MS instrument. It has a
low operating temperature (175 ˚C) and lower reusability than conventional SPME fibers
(20 times versus 100 times). The ligand hydrolysis was a result of adsorbed water on the
fiber reacting with the heat of the injection port and was likely exacerbated by the fact
sampling was done on a rainy day [90]. This is an operational challenge since for a field
sampling technique to be useful it must not be adversely affected by humidity or
environmental conditions. The remaining issues seem to be largely caused by the La
(dihed) coating not being covalently bound to the fiber substrate. The authors offer some
possibilities for improving the attachment of the phase to the fiber [90], like using sol-gel
technology, but considering the structure of the complex this seems difficult at best.
Characterization of Sorbent Polymers
Scanning Electron Microscopy In scanning electron microscopy (SEM) a beam of energetic electrons is used to scan the
surface of a solid in a raster pattern. As a result, several signals are produced that include:
backscattered and secondary electrons, as well as other photons of varying energies. The
backscattered and secondary electrons are the most commonly used signals in SEM
surface analysis. When beam of electrons interacts with a solid sample, either elastic or
inelastic scattering occurs [114].
This document is a research report submitted to the U.S. Department of Justice. This report has not been published by the Department. Opinions or points of view expressed are those of the author(s) and do not necessarily reflect the official position or policies of the U.S. Department of Justice.

46
Almirall, Diaz-Guerra, Holness and Furton Final Technical Report: 2006-DN-BX-K027
Elastic interactions affect the trajectory of the beam after surface interaction without
significant reduction (<1 eV) in the energy of the electron beam. These interactions occur
between the negative electron and the positive nucleus. Some of the electrons eventually
lose energy by inelastic collisions and remain in the solid. Most electrons undergo
numerous collisions but still exit from the surface as backscattered electrons [115]. The
exiting beam of backscattered electrons is much wider than the incident beam, reducing
resolution in the image.
Inelastic scattering on the other hand, occurs when part or all of the energy of the electron
beam is transferred to the solid sample, producing secondary electrons, from interactions
between energetic beam electrons and valence electrons or weakly bonded conduction-
band electrons in metals. Secondary electrons are emitted from the specimen with an
energy of less than 50 eV [116].
These signals are collected by a detector, converted to a voltage, which is then amplified.
This amplified voltage hits a grid causing changes in the intensity of the spot of light.
Thousands of these spots of different intensities create an image that corresponds to the
sample topography. The image produced by backscattered signals provides information
about topographical irregularities and changes in chemical composition, while secondary
electrons provide information about surface characteristics [117]. For this research, SEM
has been used to study the surface morphology of the polymer products developed, study
their cross-sections for porous characteristics, and to determine their respective coating
thicknesses. The surface characteristics of the PSPME devices created, and coating
thickness determinations were made using scanning electron microscopy (SEM). A
Philips XL30 scanning SEM (FEI, Hillsboro, OR) was used at high vacuum. Both
This document is a research report submitted to the U.S. Department of Justice. This report has not been published by the Department. Opinions or points of view expressed are those of the author(s) and do not necessarily reflect the official position or policies of the U.S. Department of Justice.

47
Almirall, Diaz-Guerra, Holness and Furton Final Technical Report: 2006-DN-BX-K027
secondary electron and backscatter detection was used depending on the information that
was desired. The sample preparation included gold coating the samples using a Hummer
10.2 Sputtering System (Anatech, LTD., Union City, CA).
1H Nuclear Magnetic Resonance Spectroscopy 1H Nuclear Magnetic Resonance (1H NMR) Spectroscopy is a method of measuring the
absorption of radiofrequency radiation by hydrogen nuclei when these are subjected to an
intense magnetic field. The spectra produced provide important information for analysts
conducting structure determination experiments since they can help elucidate the number
and the environment of hydrogens attached to each carbon [118].1H nuclear magnetic
resonance (1H NMR) spectroscopy using a 400 MHx NMR (Bruker Spectroscopy,
Madison, WI) was employed for the structure determination of both the ligand and the
metal complex. The solvent used for the ligand was deuterated chloroform and for the
metal complex the solvent was deuterated methanol- both from Cambridge Isotope
Laboratories, Inc. (Andover, MA). The default number of scans, 16, was used for the
analysis of both compounds but 160 scans were also taken of the metal complex. The
experiments were done at room temperature for both compounds, but for the metal
complex, an experiment at 50 °C was also conducted.
Direct-Infusion Mass Spectrometry Direct-Infusion mass spectrometry (DI-MS) enables the determination of the molecular
weight of synthetic polymers and inorganic species [119].Since the La (dihed) complex
synthesized for the present work is both an inorganic compound as well as a synthetic
polymer, DI-MS was used as one of several structure determination techniques. The DI-
This document is a research report submitted to the U.S. Department of Justice. This report has not been published by the Department. Opinions or points of view expressed are those of the author(s) and do not necessarily reflect the official position or policies of the U.S. Department of Justice.
48
Almirall, Diaz-Guerra, Holness and Furton Final Technical Report: 2006-DN-BX-K027
MS technique utilizes the atmospheric pressure ionization technique known as
electrospray. The sample solution is pumped through a stainless steel capillary needle
with a given flow rate (μL min-1) maintained at several kV with respect to the cylindrical
electrode surrounding the needle. The charged spray of droplets that results passes
through a desolvating capillary. This is where the solvent is evaporated and charge is
attached to the molecule. With further solvent evaporation, the droplets become smaller
and their charge density greatly increases. Desorption of the ions into the ambient gas
occurs [119].
Electrospray is a soft-ionization technique such that large fragmentation does not occur.
This is partly because other ionization techniques use volatilization, followed by an
ionizing agent acting on the gaseous sample. These hard ionization techniques can
damage thermally labile analytes or are irrelevant to the analysis of non-volatile
substances. Electrospray is unlike these methods since it is a desorption technique
whereby energy is introduced into the liquid sample so as to cause direct formation of gas
phase ions. As a result, the spectra are simplified. This is especially desirable when
attempting to see the molecular ion alone and confirm the mass of the synthesized
compound. Additionally, since multiply charged ions can also result, molecules with very
large mass such as biomolecules, peptides, or large-chained polymers can be analyzed
with a quadrupole mass spectrometer of limited mass range (1500-2000 a.m.u.) [119].
The determination of the molecular weights of both the ligand and the metal complex was
conducted using direct infusion-mass spectrometry (DI-MS) with a Finnigan LCQ Deca
XP Max instrument (Thermo Scientific, Waltham, MA). Solutions of the ligand and the
metal complex with concentrations of 5 µg mL-1 were prepared in methanol. The
This document is a research report submitted to the U.S. Department of Justice. This report has not been published by the Department. Opinions or points of view expressed are those of the author(s) and do not necessarily reflect the official position or policies of the U.S. Department of Justice.

49
Almirall, Diaz-Guerra, Holness and Furton Final Technical Report: 2006-DN-BX-K027
solutions were filtered using a 0.45 µm pore size PTFE filter (Whatman, Inc. Clifton, NJ)
before sample introduction. The operating conditions were as follows: positive and
negative ionization, capillary voltage of 5 kV, 10 µL sample injection, 10:90 (water:
acetonitrile) mobile phase with a flow rate of 0.5 mL min-1, nitrogen sheath gas (30 unit
flow), and an analysis temperature of 150 °C.
Infrared Spectroscopy Infrared (IR) spectroscopy, especially of the mid-IR spectral region from 4000 to 200
cm-1, is used for organic analysis and structure determination of molecules that exhibit
small differences in energy between several rotational and vibrational states. For
absorption of infrared radiation, the molecule must undergo a net change in dipole
moment as a consequence of its rotational and vibrational motion. Then, the electrical
field of the infrared radiation can interact with the species and cause changes in the
amplitude (or produce characteristic bands in the spectrum) of one of its vibrational or
rotational motions [119]. In this study, infrared spectroscopy is used to aid in the
structure determination of both the H2dihed ligand and the La (dihed) complex following
synthesis of these compounds. Fourier Transform- Infrared (FT-IR) Spectroscopy was
used in the structure determination of the ligand and metal complex. The samples were
prepared as follows: 2mg of the solid compound was mixed with 200mg of potassium
bromide, ground together in a mortar and pestle, and pressed into a pellet by applying a
force of 6 ton m-1for 5min.A Perkin Elmer Spectrum 2000 FT-IR Spectrometer
(Waltham, MA) with an Nd-YAG 1064 nm laser was used for the analysis of the ligand
and metal complex in the mid-infrared range (400- 4000 cm-1) for 16 scans.
This document is a research report submitted to the U.S. Department of Justice. This report has not been published by the Department. Opinions or points of view expressed are those of the author(s) and do not necessarily reflect the official position or policies of the U.S. Department of Justice.

50
Almirall, Diaz-Guerra, Holness and Furton Final Technical Report: 2006-DN-BX-K027
Chapter 5 ION MOBILITY SPECTROMETRY
Theory of Ion Mobility Spectrometry The differential velocities of gas phase ions in an electric field can be used to characterize
chemical substances [17]. This is the basis of ion mobility spectrometry (IMS), the main
analytical technique used in this research. Figure 11 shows a schematic of processes in
IMS. In stand-alone IMS, sampling at security checkpoints involves standard operating
procedures that include swiping the suspect area with a filter paper or a nylon cloth
(among many other collection media) or vacuuming particles onto a Teflon membrane
[120] to entrap the analytes of interest, but there are other methods of sample
introduction.
Figure 11. Schematic of Processes in an Ion Mobility Spectrometer [17].
In figure 11, the sample (on the collection medium), is introduced into the spectrometer
as a vapor produced by thermal desorption from within a heated inlet at the head of the
analyzer. Dried, filtered air sweeps the sample vapor into the reaction region where
This document is a research report submitted to the U.S. Department of Justice. This report has not been published by the Department. Opinions or points of view expressed are those of the author(s) and do not necessarily reflect the official position or policies of the U.S. Department of Justice.
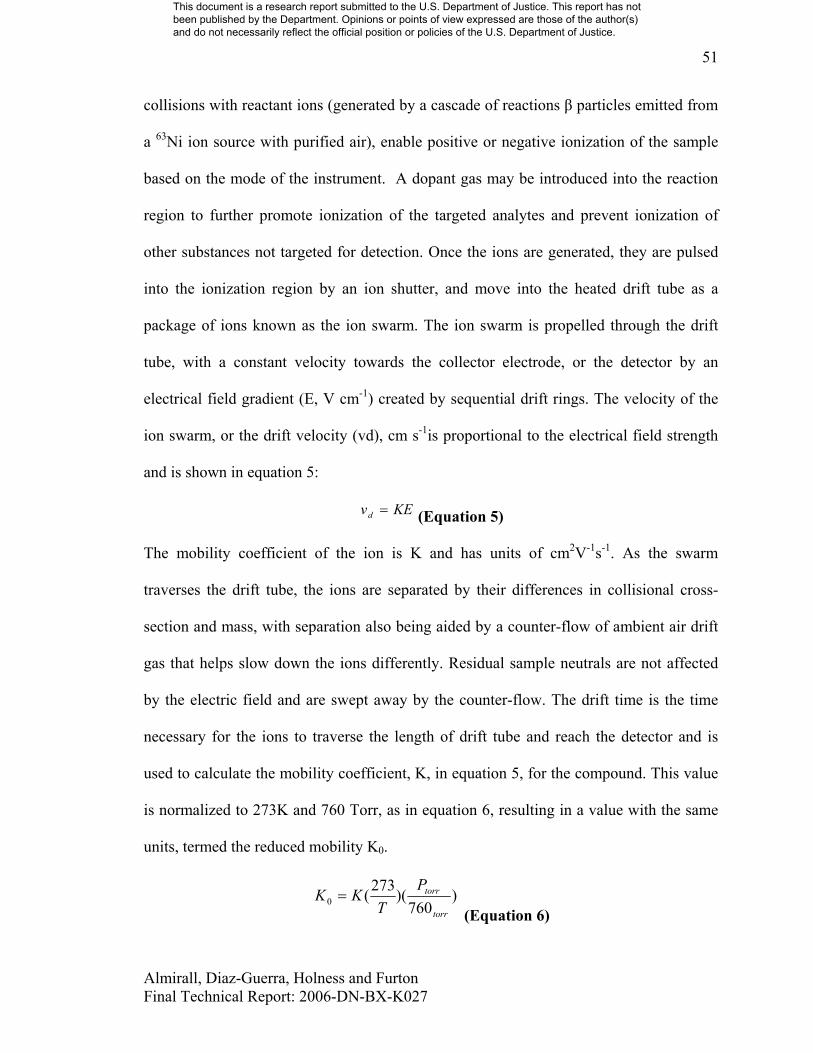
51
Almirall, Diaz-Guerra, Holness and Furton Final Technical Report: 2006-DN-BX-K027
collisions with reactant ions (generated by a cascade of reactions β particles emitted from
a 63Ni ion source with purified air), enable positive or negative ionization of the sample
based on the mode of the instrument. A dopant gas may be introduced into the reaction
region to further promote ionization of the targeted analytes and prevent ionization of
other substances not targeted for detection. Once the ions are generated, they are pulsed
into the ionization region by an ion shutter, and move into the heated drift tube as a
package of ions known as the ion swarm. The ion swarm is propelled through the drift
tube, with a constant velocity towards the collector electrode, or the detector by an
electrical field gradient (E, V cm-1) created by sequential drift rings. The velocity of the
ion swarm, or the drift velocity (vd), cm s-1is proportional to the electrical field strength
and is shown in equation 5:
KEvd = (Equation 5)
The mobility coefficient of the ion is K and has units of cm2V-1s-1. As the swarm
traverses the drift tube, the ions are separated by their differences in collisional cross-
section and mass, with separation also being aided by a counter-flow of ambient air drift
gas that helps slow down the ions differently. Residual sample neutrals are not affected
by the electric field and are swept away by the counter-flow. The drift time is the time
necessary for the ions to traverse the length of drift tube and reach the detector and is
used to calculate the mobility coefficient, K, in equation 5, for the compound. This value
is normalized to 273K and 760 Torr, as in equation 6, resulting in a value with the same
units, termed the reduced mobility K0.
)760
)(273(0torr
torrPT
KK = (Equation 6)
This document is a research report submitted to the U.S. Department of Justice. This report has not been published by the Department. Opinions or points of view expressed are those of the author(s) and do not necessarily reflect the official position or policies of the U.S. Department of Justice.

52
Almirall, Diaz-Guerra, Holness and Furton Final Technical Report: 2006-DN-BX-K027
Based onK0, compounds can be presumptively identified. When the ions collide with the
detector they are neutralized, causing a current flow that is amplified and converted to a
voltage (peak signal). The mobility spectrum, or plasmagram, displays the detected
peaks, in a plot of the detector response (V, or another arbitrary unit) vs. drift time (ms)
[17].
Ion Chemistry In IMS, the molecules of a sample chemically react with a pool of ions known as reactant
ions to create product ions at atmospheric pressure that are subsequently detected. This
reaction is observed in the mobility spectrum, by the decrease in intensity of the reaction
ion peak with corresponding increase in the product ion peak. These product ions are
characteristic of the compound(s) in the sample and have a reduced mobility, as do the
reactant ion peak(s).
The reservoir of reactant ions are formed through series of ion-molecule reactions with
nitrogen, oxygen, and water vapor in purified air to generate H+(H2O)n in the positive
mode and O2-(H2O)n in the negative mode.
In the positive polarity, proton transfer is the dominant reaction for the formation of
product ions. The sample molecules M are ionized by colliding with the reactant ions
(H+(H2O)n) producing product ions that are stabilized by the displacement of water
molecules as follows [17] in equation 7.
M + H+(H2O)n→ MH+(H2O)n→MH+(H2O)n-x + xH2O (Equation 7)
Sample + Positive reactant ion→ Cluster ion→ Product ion + Water
If the vapor concentration of a sample increases sufficiently, another sample molecule
can attach to the product ion, also known as the protonated monomer, forming a proton-
This document is a research report submitted to the U.S. Department of Justice. This report has not been published by the Department. Opinions or points of view expressed are those of the author(s) and do not necessarily reflect the official position or policies of the U.S. Department of Justice.

53
Almirall, Diaz-Guerra, Holness and Furton Final Technical Report: 2006-DN-BX-K027
bound dimer, M2H+(H2O)n-x. When a proton bound dimer signal is observed in IMS, both
the reactant peak and the protonated monomer peak intensities are reduced.
Product ions in the negative mode, are also formed by collision with the reactant ion, O2-
(H2O)n to form an adduct ion between the sample and hydrated O2- that is stabilized by
collision with a third body, Z (shown in equation 8):
M + O2-(H2O)n↔ [MO2
-(H2O)n]* + Z ↔ MO2-(H2O)n-1 + H2O + Z (Equation 8)
Charge transfer (equation 9) and proton abstraction (equation 10) are additional pathways
for product ion formation in the negative mode:
M + O2-(H2O)n↔ [MO2
-(H2O)n]* + Z ↔ M-(H2O)n + O2 + Z (Equation 9)
M + O2-(H2O)n↔ [MO2
-(H2O)n]* + Z ↔ (M-1)-(H2O)n + HO2 + Z (Equation 10)
The path to formation of product ions is dictated by the acidity of the protons. Adducts
are more stable when the oxygen-hydrogen bond is comparatively strong (low acidity).
An acidic proton will instead undergo proton abstraction since the O-H is weaker because
of the increased bond length [17].
Selectivity in IMS and formation of product ions can be promoted by the addition of a
dopant gas in the reaction region (figure 11). In the negative mode, a chloride dopant is
added to form long-lived chlorine adducts [121] and enhance the ionization of explosive
compounds by simplification of the ionization route. That is because chloride is a single
reactant ion as opposed to complicated reaction ion mixtures that are observed in air. As
an example, the detection limits of EGDN were improved by using chloride dopant;
reduced from 500 pg down for the EGDN*NO3- to only 30 pg for the EGDN*Cl- adduct
[122]. In the positive mode, ionization of sample molecules can be controlled/ enhanced
This document is a research report submitted to the U.S. Department of Justice. This report has not been published by the Department. Opinions or points of view expressed are those of the author(s) and do not necessarily reflect the official position or policies of the U.S. Department of Justice.

54
Almirall, Diaz-Guerra, Holness and Furton Final Technical Report: 2006-DN-BX-K027
by careful selection of a dopant gas possessing the appropriate proton affinity for proton
transfer to proceed [17, 123].
IMS Response The response seen in IMS for product ions produced is dictated primarily by the strength
of the ionization source. For instance, the maximum charge available for the creation of
product ions in typical 63Ni sources is an ion density of 109 to 1010 ions per cm3s-1 [17].
This value is thought to be fixed temporally due to the comparatively slow kinetics for
reactant ion formation as compared to the fast reactions of reactant ion consumption
[124].Once the reactant ion pool is consumed no additional product ion peak can be
obtained. Care must be taken to prevent this scenario because once the reactant ion peak
has been depleted, the calibrations conducted for the particular experiment are nullified.
For these reasons, the linear dynamic range is limited in IMS, and it represents one of the
disadvantages of this analytical technique.
Forensic Applications of Ion Mobility Spectrometry Ion mobility spectrometry is the most prominent and successful technology for the
detection of nitro-organic explosives in trace amounts from the surface of baggage in
airports [125]. This success is attributed to the ability of the explosives to form stable
negative product ions from the atmospheric pressure chemical ionization (APCI)
reactions described in Section 5.1.1. This technology has also found its niche in the law
enforcement community since it is routinely used by customs, police, and drug
enforcement agencies to rapidly analyze trace amounts of illicit drugs. This popularity is
due to the favorable response of the analyzers towards important nitrogen containing
compounds of interest, such as cocaine and heroin, even in the presence of interferents
This document is a research report submitted to the U.S. Department of Justice. This report has not been published by the Department. Opinions or points of view expressed are those of the author(s) and do not necessarily reflect the official position or policies of the U.S. Department of Justice.

55
Almirall, Diaz-Guerra, Holness and Furton Final Technical Report: 2006-DN-BX-K027
[126]. Other reasons for the success of IMS for the detection of illicit contraband include:
low detection limits (ppb to ppt range), detection under atmospheric conditions, rapid
analysis on the order of seconds, low false positive rates, and ease-of use. Since
ionization is conducted at atmospheric pressure, the need for complicated and bulky
vacuum systems and purified gas tanks are eliminated, reducing the operational cost of
IMS, as well as allowing ultra- portability. The use of IMS for security applications is
staggering with over 15,000 instruments conducting over a million analyses per year [17].
IMS Modifications to Improve Contraband Detection The following is a summary of the research that has been conducted to improve the IMS
detection of illicit drugs and explosives by improving the sample collection and detection
probabilities.
Sampling Improvements Improvements to the front-end of the IMS analyzer for efficient collection of illicit drugs
and explosives was the focus of the most recent Gordon Research Conference [127]. This
is because reaching the full potential of field-portable IMS for effectively detecting
explosives and illicit drugs at trace levels is hindered since the sampling technique relies
on contact with particles. A tiny explosive or drug particle, either on a surface or in the
air of a suspected area, may be missed while sampling or may not adhere to the collection
surface [128]. Moreover, extraneous particles may overwhelm the detector’s analytical
response or may contaminate it through dusting. The commercial IMS instrument,
General Electric Itemiser, employs a semi-permeable membrane [129] that allows sample
vapors of drugs or explosives, obtained after thermal desorption of a sample swab, to
enter the reaction region, but prevents the passage of inorganic material and water vapor
into the instrument. This membrane is designed to help protect the instrument from dirty
This document is a research report submitted to the U.S. Department of Justice. This report has not been published by the Department. Opinions or points of view expressed are those of the author(s) and do not necessarily reflect the official position or policies of the U.S. Department of Justice.
56
Almirall, Diaz-Guerra, Holness and Furton Final Technical Report: 2006-DN-BX-K027
samples and field environments, and is not meant for preconcentration or actual sample
collection.
The existing sample swabs provided by IMS manufacturers for particle swiping have
been evaluated for their performance at trapping and effectively desorbing explosive
particles into the instrument for analysis [130]. Recently, a patent application [131] has
been submitted for a new type of surface swab, consisting of a bundle of fibers or strip of
loop fasteners that enable the transfer of substances from the suspect surface. The
particles become embedded in the gaps between the fibers or loops for and can be
subsequently desorbed as usual. Even though continued efforts are directed at validating
and developing new sampling surfaces for collection of particulate matter, existing swabs
have performed suitably for this purposes, although some better than others [148]. What
is truly necessary is development and implementation of an effective sampling and
preconcentration device that enables the collection of volatile chemical signatures for
simplified introduction into the IMS analyzer.
Researchers have also attempted a sampling method for use in cargo containers that
draws large volumes of air through treated filters, entrapping particles that are analyzed
by a Gas Chromatography (GC)-IMS system following direct thermal desorption [132].
This is a cumbersome technique that requires significant modification of IMS
instruments. It relies on the non-specific capture of particles, including dirt, dust and
interferences in the hopes of trapping a tiny drug or explosive particle.
Vapor introduction is also possible by IMS by pumping air directly into the analyzer, but
the volume of air it can accept is on the order of hundreds of mL [48]. However, this
volume is mostly insufficient to representatively sample a suspected area for trace vapor
This document is a research report submitted to the U.S. Department of Justice. This report has not been published by the Department. Opinions or points of view expressed are those of the author(s) and do not necessarily reflect the official position or policies of the U.S. Department of Justice.

57
Almirall, Diaz-Guerra, Holness and Furton Final Technical Report: 2006-DN-BX-K027
concentrations without a much needed efficient, inexpensive, and an efficient and
selective pre-concentration step becomes much needed. A stainless steel mesh
preconcentrator [133] designed by Sandia laboratories, was fitted to these portable IMS
analyzer in order to capture explosive particles and allow the remaining air to exit. The
mesh is then flash heated to desorb the particles in seconds that were collected on the
mesh and converts them to a vapor for IMS analysis. Sampling occurred for 5 to 30 s
with times greater than 30 s causing what the researchers termed, “wash out” of the
explosives from the mesh. There have been enhancements in the preconcentration of
particles of explosives, namely RDX, and drugs [134], but again, the major drawback of
this preconcentrator is that it relies on collecting particles and not the more prevalent
volatile chemical signatures emitted from drugs and explosives. Furthermore, despite
being named a preconcentrator, the device does not accumulate analytes over sampling
times as little as 30 s.
The conversion of IMS instruments from particle samplers into vapor samplers is
advantageous because sampling for the volatile chemical markers emanating from the
parent explosives and drug compounds rather than sampling for particles themselves, can
increase the probability of the detecting hidden drugs and explosives.
Considering the numerous benefits that SPME affords for the sampling of concealed
drugs and hidden explosives, especially noting the enhancements in extraction
efficiencies and consequences for increased detection capabilities of sampling for the
associated volatile chemical markers, it is a reasonable tool for coupling to the front-end
of IMS. The first SPME-IMS interface (patent pending) reported [19] was developed to
allow the analysis of vapors rather than particles thereby improving the detection of illicit
This document is a research report submitted to the U.S. Department of Justice. This report has not been published by the Department. Opinions or points of view expressed are those of the author(s) and do not necessarily reflect the official position or policies of the U.S. Department of Justice.

58
Almirall, Diaz-Guerra, Holness and Furton Final Technical Report: 2006-DN-BX-K027
drugs, hidden explosives and taggants. The SPME-IMS method yielded limits of
detection of the volatile chemical signatures 1-2 orders of magnitude lower than those of
SPME-GC-MS [19, 135, 136]. Odor signatures of the illicit compounds of interest
previously identified by canine trials and headspace analysis by SPME-GC-MS [24, 27,
36, 63 ,64, 66] have been successfully extracted from standards and real samples using
SPME-IMS [19, 59, 153, 154, 137, 138]. The detection limits of instrumentation have
been shown to reach sub-nanogram levels (e.g. 0.45 ng of piperonal using SPME-IMS)
[156].
This interface is designed as an add-on accessory for IMS and operates on the principle
of a GC injection port, which enables efficient thermal desorption from a SPME fiber
without damaging the fiber unlike previous attempts of placing the fiber directly into the
desorber [139]. In this interface, an aluminum tube was machined to form a heated inlet
with a septum and liner similar to that of a GC. Analytes desorb off the SPME fiber with
ultra high purity helium carrier gas and the heat generated by a resistor. A Swagelok 1/8
inch union “t” is fitted onto the sample thermal desorption inlet of the IMS. This design is
encouraging for the rapid implementation of this interface to the already large installed
base of IMS analyzers at ports of entry, airport screening checkpoints, etc. A thorough
description of the SPME fiber interface is reported elsewhere [19, 153, 154].
A SPME-IMS coupling has been devised that is based on the same transfer line/desorber
concept as the one constructed by the Almirall group, but is used with a handheld IMS
[140]. This system has the advantage of ultra-portability but does not yet address the
need for sampling of large volumes.
This document is a research report submitted to the U.S. Department of Justice. This report has not been published by the Department. Opinions or points of view expressed are those of the author(s) and do not necessarily reflect the official position or policies of the U.S. Department of Justice.

59
Almirall, Diaz-Guerra, Holness and Furton Final Technical Report: 2006-DN-BX-K027
Although these novel SPME-IMS interfaces improve upon conventional IMS analysis of
drugs and explosives, they are limited by relying on modified-syringe geometry for
sample introduction. Also, a recent review of numerous IMS sample introduction systems
concluded that “SPME–IMS coupling cannot be deemed a robust system,” [141] since
the various fiber introduction interfaces may yield different analytical results.
A planar geometry for uniform SPME sample introduction in IMS can be explored since
because unlike with GC-IMS does not suffer from restrictions of the volume of liquid
sample injected, capillary column inner diameter, and stationary phase thickness that
make a syringe injection system necessary.
Lastly, a microfabricated vapor concentrator [142] has been developed and shows
preconcentration of TNT vapors and increases in sensitivities of one order of magnitude
compared IMS analysis without the device. The materials used for fabrication of this
preconcentrator, such as platinum, would make the device prohibitively expensive. The
device also requires its own electrical power to operate so adapting it to existing IMS
instruments would be cumbersome.
In summary, the development of a SPME extraction device of planar geometry, by
exploiting the flexibility of various SPME configurations [77], would allow direct
desorption/ introduction of sample into the numerous commercial embodiments of IMS,
while maintaining with low production and operational costs.
Operating Condition Optimization Several of the volatile chemical signatures identified cannot be detected by IMS under
default operating conditions. Lai, et al. systematically optimized IMS variables such as
drift tube temperature, drift gas flow rate, sample gas flow rate, and dopant gas
composition in both the positive and negative operating modes, using a Genetic
This document is a research report submitted to the U.S. Department of Justice. This report has not been published by the Department. Opinions or points of view expressed are those of the author(s) and do not necessarily reflect the official position or policies of the U.S. Department of Justice.

60
Almirall, Diaz-Guerra, Holness and Furton Final Technical Report: 2006-DN-BX-K027
Algorithm (GA) approach. Details on GA and its advantages over search approaches
have been previously reported [156].
Using the optimized operating conditions resulted in detection limits for methyl benzoate
of only 0.23 ng by SPME-IMS, a compound that was previously impossible to detect
using the installed manufacturer settings [160].
Chapter 6 METHODOLOGY AND LAB PREPARATION
TECHNIQUES Development of Planar SPME (PSPME) Devices for Static Extractions The geometrical configuration of SPME was changed from cylindrical to planar in order
to be easily adaptable to existing IMS desorbers and to increase the surface area and
capacity for extraction of the targeted analytes. This change in geometry was achieved for
static sampling by using microscope glass slides cut to the appropriate size as substrates
for the subsequent absorptive/ adsorptive phase chemistries that would be attempted in
the development of PSPME.
The phase chemistries used were chosen to resemble currently commercially available
fiber types for comparison purposes between the planar and fiber geometries. Others
were attempted to further improve upon commercial fiber chemistries in terms of
durability, thermal resistance, capacity, and affinity for the targeted compounds.
Preparation of the Substrate Prior to coating, 1 mm thick, pre-cleaned microscope slides (Chase Scientific Glass,
Vineland, NJ), were cut into 3.81 cm × 2.54 cm pieces. The glass substrates were dipped
individually into a 2:1 mixture of concentrated sulfuric acid (Fisher Scientific, Fair Lawn,
NJ) and 30% hydrogen peroxide (Fisher Scientific, Fair Lawn, NJ) and placed in an oven
at 90°C for 20 min. The solution was decanted and the substrates were rinsed thoroughly
with 18 mΩ deionized water. Each substrate was dipped in 1M NaOH for 1 hr to expose
This document is a research report submitted to the U.S. Department of Justice. This report has not been published by the Department. Opinions or points of view expressed are those of the author(s) and do not necessarily reflect the official position or policies of the U.S. Department of Justice.

61
Almirall, Diaz-Guerra, Holness and Furton Final Technical Report: 2006-DN-BX-K027
the silanols on the glass surface. This was followed by thorough rinsing with deionized
water to ensure wettability (no beading of water on the glass surface). The substrates
were placed in an oven at 120°C for 12 hr to dry.
Coating Techniques The following section describes the two coating methodologies that were employed in
these studies.
Dip-Coating The dip coating process consists of 1) dipping (residence time), 2) withdrawal, and
3) solvent evaporation. The prepared substrates were immersed in the appropriate coating
solution (~25 mL), contained in a 50 mL polypropylene disposable centrifuge tube
(Fisherbrand, Fairlawn, NJ), and sealed tightly for a given amount of time. The substrate
was withdrawn from the solution following the coating time period place in a 50 mL
glass vial, 29 × 94 mm, 12 DR (Fisherbrand, Fairlawn, NJ). A schematic of the dip
coating process is shown in figure 12.
The tight seal caps that are included with the glass vials were punctured in the center.
These modified caps were used to seal the glass vials containing the newly coated
substrates (including spin-coating, discussed in Section 6.1.1.2). The glass vials were
then placed in the dessicator overnight (at least 12 hr). The subsequent treatments (if
applicable) are described in later sections for each specific coating.
This document is a research report submitted to the U.S. Department of Justice. This report has not been published by the Department. Opinions or points of view expressed are those of the author(s) and do not necessarily reflect the official position or policies of the U.S. Department of Justice.

62
Almirall, Diaz-Guerra, Holness and Furton Final Technical Report: 2006-DN-BX-K027
Figure 12. The Dip-Coating Process. Adapted from [143]
Spin-Coating The spin-coating process figure 13 involves depositing an amount of coating solution on
the prepared substrate. The substrate is accelerated to a certain velocity while the coating
solution is spun-off leaving a thin film on the surface of the substrate. The spin-coater
used in the development of PSPME is a model WS-400B-6NPP-LITE (Laurell
Technologies Co., North Wales, PA) shown in figure 14.
The prepared substrate is placed on the vacuum chuck (with adapter if necessary). The
vacuum is activated to hold the substrate in place. The coating solution is delivered to the
substrate and the appropriate spin program is activated.
The stages of spin coating are as follows [144] and is illustrated in figure 13: 1) The
polymer is applied in the form of a solution in the desired volatile solvent, then 2) a small
quantity of the coating solution is dispensed onto an activated substrate that spreads out
to form a puddle. 3) The substrate is rotationally accelerated to a high speed causing
~90% of the solution to be ejected from the substrate immediately. 4) The thin film that
remains flows slowly outward from the center of the substrate under centrifugal forces
and 5) the solvent evaporates as the film is thinned. The viscosity of the solution greatly
Sampl
Sampl
Heat
This document is a research report submitted to the U.S. Department of Justice. This report has not been published by the Department. Opinions or points of view expressed are those of the author(s) and do not necessarily reflect the official position or policies of the U.S. Department of Justice.

63
Almirall, Diaz-Guerra, Holness and Furton Final Technical Report: 2006-DN-BX-K027
increases in a way that relative motion stops. 5) The spin program ends, and the coating
process is completed by removing the residual solvent by heat [162].
Figure 14. Image of the Spin Coater Used with the Glass Substrate in Place on the Chuck
Preparation of the Coating Solutions The following are the protocols of the coating solutions that were prepared for the various
PSPME devices developed in this research.
Sol-gel PDMS One of the PSPME preparations consisted of using sol-gel technology to create a
physically incorporated PDMS extraction phase as was first described by Liu, et. al for
the preparation of SPME fibers [105]. The sol solution was modified for a planar
geometry and prepared as follows: 6.40 g vinyl-terminated polydimethylsiloxane (vt-
PDMS) (Gelest, Inc., Morrisville, PA) was dissolved in 8 mL of dichloromethane
(DCM,Acros, New Jersey, USA); then 3.42 mL of methyltrimethoxysilane (MTMOS, >
98%) (Fluka, Steinheim, Germany) and 1.67 g poly(methylhydrosiloxane) (PMHS)
(Sigma-Aldrich, Inc., St. Louis, MO) were added, followed by 2.73 mL of trifluoroacetic
acid (TFA, 99 %, Acros, New Jersey, USA), (5% water, v/v). The solution was vortexed
This document is a research report submitted to the U.S. Department of Justice. This report has not been published by the Department. Opinions or points of view expressed are those of the author(s) and do not necessarily reflect the official position or policies of the U.S. Department of Justice.

64
Almirall, Diaz-Guerra, Holness and Furton Final Technical Report: 2006-DN-BX-K027
and allowed a 30 min stay. The prepared substrate was dipped in the solution for 1 h. The
planar sol-gel PDMS SPME device was placed in the dessicator for 12 hr, followed by a
6 hr dip in dichloromethane. Gelation of the sol-gel PDMS PSPME device occurred by
placing the device in a GC oven at 40 °C for 12 h. Conditioning of the sol-gel PDMS
PSPME was as follows: the device was placed in a GC oven under nitrogen atmosphere
at 120°C for 1 hr, 240°C for 1 hr, and 300°C for 3 hr. Following conditioning, the device
was slowly cooled to room temperature to prevent cracking of the phase, a parameter
[100] that is especially important to prevent when preparing sol-gel PDMS.
PDMS by a Chlorine-Terminated PDMS Route A coating of PDMS was made on the prepared substrate by the chlorine-terminated
PDMS route. This method consisted of spin-coating a prepared glass substrate with a 3:1
mixture of chlorine-terminated polydimethylsiloxane (Cl-PDMS) (Sigma-Aldrich, Inc.,
St. Louis, MO) and DCM. One mL of the coating solution was deposited on the substrate
and the spin program, 1000 rpm for 60s, was activated. The PDMS planar SPME device
was placed in a dessicator at room temperature for 12 hr followed by dipping in 18 mΩ
deionized water to remove any excess hydrochloric acid that could result from the
reaction. The PDMS PSPME device was placed in a GC oven at 40°C following the rinse
with deionized water and was conditioned in the same manner as the sol-gel PDMS
(Section 6.1.3.1).
Activated Charcoal/Sol-Gel PDMS For the formulation of AC/sol-gel PDMS, 5.15 g vt-PDMS was dissolved in 6.3 mL
DCM. Volumes of 2.7 mL MTMOS and 1.3 mL PMHS were added to the mixture. A
mass of 1.02 g AC was blended into the solution and the sol gel reaction was catalyzed
This document is a research report submitted to the U.S. Department of Justice. This report has not been published by the Department. Opinions or points of view expressed are those of the author(s) and do not necessarily reflect the official position or policies of the U.S. Department of Justice.
65
Almirall, Diaz-Guerra, Holness and Furton Final Technical Report: 2006-DN-BX-K027
by the addition of 2.1 mL TFA (5 % water, v/v). The solution was vortexed and allowed a
30 min stay. The solution was vortexed again after the 30 min stay and the prepared glass
substrate was dipped for 30 min. The coating was treated as usual (Section 6.1.3.1) for
the remaining steps.
La (dihed) The synthesis of the H2 dihed ligand, p-di(4,4,5,5,6,6,6-heptafluoro-1,3-hexanedionyl)
benzene, has been described previously [145], but the reaction was scaled down as
follows. A 500 mL 3-neck round bottom flask (RBF) was dried and flushed with nitrogen
and fitted with a reflux condenser a rubber stopper and a glass stopper. A magnetic stirrer
was added to the (RBF). A mass of 6.676 g of sodium methoxide, pure, anhydrous
powder (Acros Organics, New Jersey) was added to the RBF by opening the glass
stopper. Diethyl ether, anhydrous, 99.7%+ (Sigma Aldrich St. Louis, MO) was added
slowly through the rubber stopper while the RBF was in an ice bath and stirring, for a
total diethyl ether volume of 120 mL. The ice bath was removed and 10.7 mL of ethyl
heptafluorobutyrate, 97% (Acros Organics, New Jersey) was added to the RBF while still
stirring. A mass of 5 g of p-diacetylbenzene, 99% (Sigma Aldrich St. Louis, MO) was
mixed with ~100 mL diethyl ether and this slurry was added to the RBF over the course
of 45 min. Stirring was continued for over 1 hr. A 50:50 solution of HCl and 18 mΩ
deionized water (total volume of 40 mL) was added to the solution in the RBF. The pH
was checked (pH=2) and 60 mL deionized water was added. The solution was transferred
to a separatory funnel, the ether layer was removed and evaporated using a Rotavap. The
crude orange-yellow product was recrystallized three times from methanol. The crude
product was dried overnight.
This document is a research report submitted to the U.S. Department of Justice. This report has not been published by the Department. Opinions or points of view expressed are those of the author(s) and do not necessarily reflect the official position or policies of the U.S. Department of Justice.

66
Almirall, Diaz-Guerra, Holness and Furton Final Technical Report: 2006-DN-BX-K027
The synthesis of the La (dihed) complex was accomplished by following the procedure
previously described [117]. A volume of 50 mL methanol, GC Resolv 99% (Fisher
Scientific, Fairlawn, NJ), was heated in an Erlenmeyer flask containing boiling chips. A
mass of 1.5 g of the H2 (dihed) ligand was placed in a RBF with a magnetic stirrer inside.
The hot methanol was pipetted into the RBF until the ligand dissolved, and while
maintaining a 40 °C temperature from a water bath. A 1 mL 4M sodium hydroxide
solution was added dropwise to the RBF. This neutralized solution was then added
dropwise over 30 min to a solution of a mass of 0.825 g lanthanum (III) nitrate
hexahydrate, 99.999 %, (Acros Organics, New Jersey) dissolved in 50 mL methanol. This
solution was transferred to a 500 mL separatory funnel and added dropwise for 1 hr to
500 mL of vigorously stirred deionized water. Then, the solution was placed in an ice
bath with continued stirring. Suction filtration was not effective to collect the solid
product; therefore the solution was heated for ~3hr and left on the bench overnight. The
next day, the solid product was collected by suction filtration and dried in vacuo over
P4O10.
The La (dihed) complex synthesized was coated on the surface of prepared glass, and
PDMS and sol-gel PDMS PSME devices. A mass of 236 mg La (dihed) was dissolved in
50 mL methanol. This solution was poured into a glass thin layer chromatography (TLC)
developing chamber with eight slots. The prepared glass (control), and PDMS and sol-gel
PDMS PSME devices were dipped in the solution for 1 hr. Sol-gel PDMS and PDMS
devices uncoated with La (dihed) were used for comparison purposes in subsequent
experiments.
This document is a research report submitted to the U.S. Department of Justice. This report has not been published by the Department. Opinions or points of view expressed are those of the author(s) and do not necessarily reflect the official position or policies of the U.S. Department of Justice.

67
Almirall, Diaz-Guerra, Holness and Furton Final Technical Report: 2006-DN-BX-K027
Temperature effects on the integrity of the La (dihed) layer on the coated devices were
studied. The devices were each subjected to 10 minute exposures at 180, 225 and 300 °C
temperatures and their surface characteristics were studied by scanning electron
microscopy.
Concentration of the La (dihed) and coating time effects on the extraction capabilities of
La (dihed) PSPME devices were studied as well; this required the preparation of the
appropriate PSPME devices. The concentration studies involved dipping of the particular
substrate for 1 hr. in 100, 200, and 300 mg La (dihed) in 50 mL methanol solutions. The
236 mg La (dihed) in 50 mL methanol was reused and served as a coating solution in the
comparison. Sol-gel PDMS and PDMS SPME devices were each dipped in the various
concentrations. The controls were 1) uncoated sol-gel PDMS and PDMS PSPME devices
and 2) uncoated sol-gel PDMS and PDMS PSPME devices dipped in methanol for 1 hr.
The time studies were done by dipping the various substrates in a 200 mg La (dihed) in
50 mL methanol solution, for 30 min, 2hr, 1 hr, and 3 hr. Spin coating 1 mL of the
coating solution at 1000 rpm for 1 min was also done and considered as t=0 min. The
controls included dipping the sol-gel PDMS and PDMS PSPME devices in methanol for
the longest time period in the study- 3 hr.
An alternative coating was made that physically incorporated La (dihed) into the sol-gel
PDMS network. A mass of 0.0995 g of La (dihed) was dissolved in 1mL of methanol.
Separately, 0.3085 g vt-PDMS was dissolved in 0.374 mL DCM. The La (dihed) solution
was added to the vt-PDMS solution. Volumes of 0.164 mL and 80 µL of PMHS were
delivered to the solution, followed by vortex mixing. A 5% TFA solution (0.138 mL) was
added to the mixture followed by vortex mixing. The solution was left to stand 30 min.
This document is a research report submitted to the U.S. Department of Justice. This report has not been published by the Department. Opinions or points of view expressed are those of the author(s) and do not necessarily reflect the official position or policies of the U.S. Department of Justice.

68
Almirall, Diaz-Guerra, Holness and Furton Final Technical Report: 2006-DN-BX-K027
One 1 mL was deposited onto a prepared glass substrate and allowed to interact with the
surface for 30 s. The spin program (200 rpm for 1 min.) was activated. The sol-gel/
La(dihed) PSPME device was placed in the dessicator for 12 hr, followed by a dip in
DCM for 45 min. Gelation occurred as usual for sol-gel PDMS, 40 °C for 12 hr. Curing
occurred in the GC oven at 120 °C under nitrogen atmosphere for 3 hr. The device was
then placed in the dessicator for continued curing at room temperature for 48 hr.
A control sol-gel PDMS device was prepared by spin coating the sol solution without the
addition of La (dihed) at 200 rpm for 1 min.
Validation Experiments for Static PSPME The following experiments were conducted for testing of the preconcentration
capabilities of the various PSPME devices that were developed in the static extraction
sampling mode.
IMS Detection In this study, two ion mobility spectrometers were used for the detection of the
compounds of interest: a Smiths Detection IonScan 400B (Smiths Detection,
Mississauga, ON, Canada) and a General Electric Ion Track Itemiser 2 (Wilmington,
MA). For SPME fiber comparisons, the front end of the GE Itemiser 2 was coupled with
a SPME interface designed by Perr, et al. [19]. The operating conditions for both
standalone IMS instruments and the SPME-IMS interface are listed in Table 4.
This document is a research report submitted to the U.S. Department of Justice. This report has not been published by the Department. Opinions or points of view expressed are those of the author(s) and do not necessarily reflect the official position or policies of the U.S. Department of Justice.

69
Almirall, Diaz-Guerra, Holness and Furton Final Technical Report: 2006-DN-BX-K027
Table 4. Operating Conditions of IMS Instruments and SPME-IMS Interface
Smiths IonScan 400B IMS Experimental Conditions
Detection Mode Explosives, taggants, and volatile chemical signatures, negative ion mode (-); volatile chemical signatures, positive ion mode (+)
Desorber Temperature (°C) 225 (-); 285 (+) Drift Tube Temperature (°C) 115 (-); 235 (+) Analysis Time (s) 10 (-); 8 (+) Sample Flow (mL min-1) 300 (-); 200 (+) Detector Flow (mL min-1) 351 (-); 300 (+) Reagent Gas (Dopant) hexachloroethane (-); nicotinamide (+)
GE Iontrack Itemiser 2 IMS Experimental Conditions
Detection Mode Explosives, taggants, and volatile chemical markers, negative ion mode (-)
Desorber Temperature (°C) 215 Drift Tube Temperature (°C) 180 Analysis Time (s) 7 Sample Flow (mL min-1) 1000 Detector Flow (mL min-1) 200 Reagent Gas dichloromethane
SPME-IMS Experimental Conditions Interface Temperature (°C) 260 ± 1 Warm up time (hr) 1
Performance Comparison of the SPME Fiber, PDMS, and sol-gel PDMS PSPME
Devices Using TNT as the Target Analyte
For static PSPME sampling, the device was suspended above the headspace of gallon or
quart-sized cans (All American Containers, Miami, FL) depending on the specific
experiment. The target analyte in a solution of known concentration was spiked into the
can. The lid was immediately sealed with a rubber mallet. These cans were previously
conditioned in an oven at 150 °C for over 24 hr to remove any volatiles from the cans
themselves that may interfere with the extraction and analysis. Alternatively, sampling by
the SPME fiber (100 µm PDMS, Supelco, Bellefonte, PA)was achieved by creating a
This document is a research report submitted to the U.S. Department of Justice. This report has not been published by the Department. Opinions or points of view expressed are those of the author(s) and do not necessarily reflect the official position or policies of the U.S. Department of Justice.

70
Almirall, Diaz-Guerra, Holness and Furton Final Technical Report: 2006-DN-BX-K027
hole in the lid of the can where an 11 mm stopper sleeve (Wheaton, Millville, NJ) could
fit snuggly and through which the fiber SPME was inserted and exposed for sampling
immediately after the sample had been spiked and the can was sealed.
Quantitation of TNT Using Response Curves Standard solutions of 2,4,6-trinitrotoluene (TNT) (Cerilliant, Round Rock, TX) were
prepared from a 1000 µg mL-1 stock solution in concentrations of 0.1, 0.2, 0.5, 0.8, 1.0,
2.5, 5.0, 10.0, and 240 µg mL-1 for the experiments with acetonitrile as the solvent
(Fisher Scientific, Fair Lawn, NJ).Response curves for each IMS instrument were
generated for TNT by spiking amounts of known concentration onto manufacturer
provided filters (Smiths Detection, Mississauga, ON, Canada) and introducing them into
the IMS in triplicate.
Determination of Equilibrium Extraction Time and Recovery The determination of equilibrium time for the planar PDMS, planar sol-gel PDMS, and
the PDMS fiber was determined as follows: 10 µL of 240 µg mL-1 TNT was spiked into
quart cans and sampling at different time intervals was conducted with desorption into
each IMS instrument. For the SPME fiber sampling, only analysis by the GE Itemiser 2
was possible since there is no currently machined SPME-IMS interface for the Smiths
400B. For calculating recovery, different concentrations of TNT were spiked and
sampled at the equilibrium time for each SPME device. All extractions were conducted in
triplicate.
Extraction Efficiency Experiments at Equilibrium For comparison of extraction efficiency of the fiber and planar SPME devices, different
volumes of a 5 µg mL-1 TNT solution were spiked into quart cans and sampled at the
This document is a research report submitted to the U.S. Department of Justice. This report has not been published by the Department. Opinions or points of view expressed are those of the author(s) and do not necessarily reflect the official position or policies of the U.S. Department of Justice.

71
Almirall, Diaz-Guerra, Holness and Furton Final Technical Report: 2006-DN-BX-K027
appropriate equilibrium times with detection by the GE Itemiser 2. All extractions were
conducted in triplicate.
Comparison of Sol-Gel PDMS PSPME and Fiber SPME for Sampling Piperonal The following experiments were conducted on the volatile chemical signature of MDMA,
piperonal, in order to determine and compare the extraction capabilities of both the fiber
and planar SPME devices. The method development for the field sampling and detection
of actual MDMA drug cases by PSPME-IMS is also described.
Gas Chromatography- Mass Spectrometry (GC/MS) A Varian 3400cx gas chromatograph Saturn 2000 ion trap mass spectrometer (Walnut
Creek, CA) was used for quantitation of the mass detected following a SPME fiber
extraction. The conditions were as follows for both SPME and liquid injection: injection
temperature of 280 °C, 1 mL injection volume for liquids, sample split of 20:1, and the
column flow of 1.0 mL min-1 of helium. A Varian WCOT CP Sil 8 CB column was used
with the following specifications: 50 m length, 95% PDMS, 5% diphenyl stationary
phase and a 0.25 mm inner diameter. The temperature program was as follows: begin at
40 °C, hold1 min, ramp to 110 °C at a rate of 10 °C min-1, hold 0.4 min, then ramp to 250
°C at a rate of 25 °C min-1 and hold for 2 min. The ionization was turned off from 0 min
to 6 min (to eliminate thesolvent peak), then from 15 min to16 min to eliminate peaks
due tocolumn bleed since the peak of interest elutes at 13.762 min.
Electrospray Ion Mobility Mass Spectrometry At the latter part of this study an electrospray ion mobility spectrometer equipped with a
quadrupole mass spectrimeter was procured. This in an attempt to characterize the ionic
species being formed under atmoshperic chemical ionization conditions. The unit was
designed and built by Excellims Corportion, Acton Massachusetts and is equipped with a
10 centimeter drift tube with the ability to vary the electric field strength to a maximum
This document is a research report submitted to the U.S. Department of Justice. This report has not been published by the Department. Opinions or points of view expressed are those of the author(s) and do not necessarily reflect the official position or policies of the U.S. Department of Justice.

72
Almirall, Diaz-Guerra, Holness and Furton Final Technical Report: 2006-DN-BX-K027
of 10,000 volts (100v/cm). The unit is also equipped with a proprietary drift gate, that
provides very high resolving power (~80 rp), approximately twice the resolving power of
either COTS unit also used in this study. As a result of the late delivery of this
equipment, only a portion of the explosive molecules targetted in this study were
characterized. Samples were diluted in a Methanol:Water mixture (80:20) and sprayed
into the electrospray source at a flow rate of 3 microliters per minute. The source was
maintained at a floating voltage of 3kilovolts (KV) above the drift tube which was
maintained at 10 KV. The drift gas used was ultra high purity air flowing at 2 liters per
minute. Mass spectrum were collected in both full scan from 40 to 500 amu and select
ion monitoring mode.
IMS Operating Conditions For the IMS detection of piperonal, it was necessary to change the manufacturer
operating parameters for the Itemiser 2 instrument as described in the literature [156]
from those shown in Table 4. The optimized operating conditions are as follows:
1) positive ion mode 2) nicotinamide reagent (dopant) gas, 3) drift tube temperature of 80
°C, 4) sample flow of 500 mL min-1, and 5) detector flow of 350 mL min-1.
SPME-IMS Sampling A volume of 10 µL of a 1000 µg mL-1 solution of piperonal, 99 %(Sigma-Aldrich, St.
Louis, MO) was spiked into a 15 mL glass vial (Supelco, Bellefonte, PA) fitted with an
18 mm polypropylene hole cap with PTFE/silicone septa. The vial was closed tightly and
sealed with parafilm. The headspace in the vial was allowed to equilibrate for 24 hr prior
to static SPME fiber sampling for subsequent introduction into the GC-MS and the IMS
(via the SPME-IMS interface). The SPME fiber used in this study was a 100 µm PDMS
fiber (Supelco, Bellefonte, PA).
This document is a research report submitted to the U.S. Department of Justice. This report has not been published by the Department. Opinions or points of view expressed are those of the author(s) and do not necessarily reflect the official position or policies of the U.S. Department of Justice.

73
Almirall, Diaz-Guerra, Holness and Furton Final Technical Report: 2006-DN-BX-K027
For determining the equilibrium extraction time for the PDMS fiber in this static
sampling scenario the vial was sampled for various times with the PDMS fiber and
introduced into the IMS instrument.
Then, in order to determine the amount of time it takes to actually reach equilibrium in a
vial, the same amount of piperonal was spiked in the vial and sampled at different times
after sealing, for the amount the previously determined equilibrium extraction time.
SPME-IMS Quantitation A response curve was generated for piperonal by GC-MS by using solutions prepared in a
concentration range of 1-50 µg mL-1 from a stock solution of 1000 µg mL-1. The equation
of the best-fit line from this analysis was used to correlate the mass of piperonal
introduced to the GC-MS with the signal output.
The mass loadings of piperonal on the PDMS fiber were calculated by statically sampling
a vial at equilibrium as was done in Section 6.2.3.3. The same time intervals were used to
sample the vial followed by desorption of piperonal from the fiber by injection into the
GC/MS.
SPME-IMS Limit of Detection (LOD) and Linear Dynamic Range (LDR) Determinations
The method LOD was determined as the minimum amount of piperonal that would
produce a signal at least the average of the blank plus three times its standard deviation.
The LDR was determined by identifying the largest range of points on the response curve
where a linear correlation existed between the mass of piperonal introduced and the IMS
response.
Piperonal IMS Response Curve The piperonal standard solutions were made from a stock solution of 1000 µg mL-1
piperonal in DCM. A volume of 2 µL each of 1, 2, 5, 8, and 10 µg mL-1 concentrations of
This document is a research report submitted to the U.S. Department of Justice. This report has not been published by the Department. Opinions or points of view expressed are those of the author(s) and do not necessarily reflect the official position or policies of the U.S. Department of Justice.

74
Almirall, Diaz-Guerra, Holness and Furton Final Technical Report: 2006-DN-BX-K027
piperonal were spiked onto filters (Smiths Detection, Mississauga, ON, Canada) and
analyzed by the Itemiser 2 IMS for analysis of the piperonal monomer. Since piperonal
has been reported to produce a proton-bound dimer at high concentrations [156] a second
response curve was generated for this ion species, with the lowest concentration being the
first observance of dimer formation. A volume of 2 µL each of 30, 40, 50, 100, 130 and
150 µg mL-1of piperonal, diluted from the 1000 µg mL-1 stock, was also spiked onto
filters and analyzed by IMS. Triplicate analyses of each concentration were conducted
and a response curve was generated by plotting mass (typically in the ng range) versus
the cumulative signal output. From the equation of the best-fit line, the mass detected by
IMS following sampling using the fiber SPME and the PSPMEwas calculated.
Method Development for PSPME-IMS of Piperonal The determination of equilibrium extraction times for the sol-gel PDMS PSPME device
and SPMEPDMS fiber was as follows: 100 µL of 100 µg mL-1 piperonal solution was
spiked into gallon cans and sampled at different time intervals from 3 to 10 min. Once
each sampling was complete, the PSPME device was removed and introduced into the
Itemiser 2 IMS via the sample desorber. The PSPME device was conditioned in a GC
oven at 150 °C and a blank of the PSPME device was obtained prior to each sampling.
After sampling with the fiber, it was removed and the analytes introduced into the IMS
by thermal desorption via the SPME-IMS interface.The fiber was conditioned in the
injection port of the GC at 250 °C and a blank of the fiber was obtained prior to each
sampling.
A comparison of the extraction efficiency of piperonal by both SPME types was
conducted under strict experimental conditions by sampling for only 6 min at a sampling
This document is a research report submitted to the U.S. Department of Justice. This report has not been published by the Department. Opinions or points of view expressed are those of the author(s) and do not necessarily reflect the official position or policies of the U.S. Department of Justice.

75
Almirall, Diaz-Guerra, Holness and Furton Final Technical Report: 2006-DN-BX-K027
distance of 20 cm from the emitting source, 2 and 5 µg spikes (100 µL spikes each of 20
and 50 µg mL-1 piperonal, respectively, in DCM).
Performance of PSPME for Other Volatile Chemical Signatures A qualitative, proof of concept, experiment was conducted to evaluate the extraction
capabilities of sol-gel PDMS PSPME for other volatile chemical signatures. This was
tested by extracting the compound of interest diluted in acetonitrile, from a quart can with
the sol-gel PDMS SPME device for a given sampling time. The compounds studied were:
2,4-DNT, 4-nitrotoluene (4-NT), a taggant, and cyclohexanone (Fisher Scientific, Fair
Lawn, NJ). The 2,4-DNT and 4-NT were obtained in small amounts from a local law
enforcement agency and diluted to the appropriate concentrations. Extraction of these
compounds preceded analysis by the IonScan 400B IMS according to the operating
conditions in Table 1, in the negative mode, except cyclohexanone which was detected in
the positive ion mode.
Performance of PSPME for the Smokeless Powder Volatile Chemical Signatures Quantitative studies of the smokeless powder volatile chemical signatures, 2,4-DNT (in
the negative polarity), and DPA and EC (in the positive polarity) were conducted using
the Smiths 400 B IMS.
6.2.5.1 Smokeless Powder Volatile Chemical Signature IMS Response Curves
Standard solutions of the solid smokeless powder odor signatures, 2,4-DNT, EC, and
DPA (Aldrich, St. Louis, MO) were prepared in acetonitrile, or hexane for 2,4-DNT. The
2,4-DNT calibration solutions originated from a 1000 ug mL-1 stock and consisted of the
following concentrations: 5.0, 8.0, 10.0, 25.0, 50.0, 100, 250, 500, and 750 ug mL-1 in
hexanes. The EC solutions were prepared from a 5 µg mL-1 stock solution in
concentrations of 0.1, 0.5, 0.9, and 1.0 ug mL-1. Solutions of DPA were diluted from a
This document is a research report submitted to the U.S. Department of Justice. This report has not been published by the Department. Opinions or points of view expressed are those of the author(s) and do not necessarily reflect the official position or policies of the U.S. Department of Justice.

76
Almirall, Diaz-Guerra, Holness and Furton Final Technical Report: 2006-DN-BX-K027
500 ug mL-1 stock solution to concentrations of 1.0, 5.0, 10.0, 25.0, 40.0, 50.0 ug mL-1. A
volume of 1 µL each of the listed concentrations was spiked onto manufacturer provided
filters (Smiths Detection, Mississauga, ON, Canada) and analyzed by the IonScan 400B
IMS with the operating conditions listed in Table 4 except that the desorption
temperature in the negative ion mode was raised to 300 °C for improved desorption of
2,4-DNT.
Determination of Equilibrium Extraction Time The determination of equilibrium time for the planar sol-gel PDMS PSPME device was
determined as follows: 10 µL of 100 µg mL-1 2,4-DNT in hexane, 10 µL of 100 µg mL-1
DPA in acetonitrile, and 10 µL of 25 µg mL-1 EC were each spiked into individual quart
cans and sampled at different time intervals followed by desorption of the PSPME into
the IonScan 400B IMS instrument.
6.2.5.4 Sampling of Unburned Smokeless Powders
Four unburned commercial smokeless powders were used in this study: H322 (Hogdon,
Shawnee Mission, KS), 4198 (IMR, Shawnee Mission, KS), Red Dot (Alliant Powder,
Radford, VA), and Unique (Alliant Powder, Radford, VA).The sol-gel PDMS PSPME
device was suspended above the headspace of a quart can. A mass of 100 mg of
smokeless powder was placed in the can. The lid was immediately sealed with a rubber
mallet and static sampling occurred for 1 hr. followed by desorption of the device into the
IonScan 400 B IMS. Sampling was done both in the positive ion mode, targeting DPA
and EC, and in the negative ion mode targeting 2,4-DNT.
PSPME Static Sampling of TNT from a Large Volume Vessel A particle free hood (Labconco, Kansas City, MO) with the following dimensions: 18.75
in. depth, 30.5 in. height, and 49 in. depth, was used as the sampling area (see Figure 15).
This document is a research report submitted to the U.S. Department of Justice. This report has not been published by the Department. Opinions or points of view expressed are those of the author(s) and do not necessarily reflect the official position or policies of the U.S. Department of Justice.

77
Almirall, Diaz-Guerra, Holness and Furton Final Technical Report: 2006-DN-BX-K027
A mass of 2.0350 g of Pentolite (50:50 PETN:TNT) was placed in a plastic petri dish
(Fisher Scientific, Fair Lawn, NJ) on one side of the hood. The sol-gel PDMS PSPME
device was placed on the opposite side of the hood. The hood was enclosed with a sheet
of plastic and sampling took place for 24 hr. The next day, the PSPME device was
desorbed into the IonScan 400 B IMS for analysis.
Figure 15. Large Volume Static Sampling for TNT from Pentolite
Comparison of Planar La (dihed) SPME Devices with Control Planar Sol-gel and PDMS Devices for the Extraction of TNT and 2,4-DNT
Aging Study
The PSPME devices made by dipping PDMS, sol-gel PDMS and prepared glass in 236
mg of La (dihed) dissolved in methanol were tested in comparison to uncoated PDMS
and sol-gel PDMS PSME devices in terms of extraction and aging capabilities.
A 10 µL spike of 240 µg mL-1 TNT in acetonitrile into a quart can was sampled at room
temperature under static, closed system conditions for 30 min by the PSPME device.
This document is a research report submitted to the U.S. Department of Justice. This report has not been published by the Department. Opinions or points of view expressed are those of the author(s) and do not necessarily reflect the official position or policies of the U.S. Department of Justice.

78
Almirall, Diaz-Guerra, Holness and Furton Final Technical Report: 2006-DN-BX-K027
Immediate IMS analysis of the PSPME device followed sampling. The same was done
for 2,4-DNT (10 µL, 240 µg mL-1) in hexane. The IMS conditions for all the La (dihed)
PSPME devices developed were the same as those listed in Table 4 for the IonScan 400 B
in the negative ion mode except that the desorption temperature was reduced to 180 ºC.
The same experiments were repeated but instead of immediate analysis, the PSPME
devices were removed from the quart cans and left outside in ambient laboratory
conditions to study the effect aging has on trapping. The PSPME devices were analyzed
by IMS after 30 min of being outside of the sampling vessel.
Coating Study The various La (dihed) devices were prepared as described in previous sections, for
studying the effects of concentration of the metal complex and coating time were tested
for their extraction capabilities. The targeted analytes were 2,4-DNT and TNT followed
by immediate IMS analysis.
Development of Dynamic PSPME In the process of developing dynamic planar SPME, substrate candidates were subjected
to the typical surface preparation techniques, solvents, and temperatures that would be
encountered by the final dynamic PSPME device. These substrates included: a fiberglass
screen (Phifer, USA), the fiberglass manufacturer provided explosives filter (Smiths
Detection, Mississauga, ON), and glass fiber filter circles (G6, Fisherbrand, Pittsburgh,
PA).
Preparation of Dynamic PSPME Devices Prior to coating, glass fiber filter circles (G6, Fisherbrand, Pittsburgh, PA) were cut down
to 3.1 cm in diameter. The surface of the glass fiber filter circles was activated for coating
as described in Section 6.1.1. A sol-gel PDMS solution was prepared in the following
quantities: 2.060 g vt-PDMS was dissolved in 8 mL of DCM; then 1.10 mL of MTMOS
This document is a research report submitted to the U.S. Department of Justice. This report has not been published by the Department. Opinions or points of view expressed are those of the author(s) and do not necessarily reflect the official position or policies of the U.S. Department of Justice.

79
Almirall, Diaz-Guerra, Holness and Furton Final Technical Report: 2006-DN-BX-K027
and 0.5351 g PMHS were added, followed by 0.875 mL of TFA (Acros) (5% water v/v).
The solution was vortexed and allowed a 30 min stay. The prepared glass fiber filter
circle was placed atop a cut glass slide held by vacuum on the chuck of a model WS-
400B- 6NPP-LITE spin-coater (Laurell Technologies, North Wales, PA). One mL of the
coating solution was deposited on the glass fiber filter circle and the spin program, 1000
rpm for 60 s, was activated. The newly coated substrate was placed in the dessicator for
12 h, dipped for 1.5 hr in DCM and gelated for 12 hr in an oven at 40 °C. The dynamic
PSPME device was then placed in a GC oven in a nitrogen atmosphere at 120 °C for 1 hr,
240 °C for 1 hr, and 300 °C for 3 hr, for conditioning and to complete the curing process.
Coating Method Development The following is a description of the optimization methodology used to arrive at the final
coating procedure described in Section 6.3.1. First, following each step that involved
deionized water washing, the glass fiber filter surface was tested for neutral pH using the
appropriate litmus paper, blue or red (Fisher Scientific, Fair Lawn, NJ). The spin coating
program was varied as follows: 0 (dip-coated), 200, 1000 and 2000 rpm for 1 min. For
the 0 rpm data point, the prepared substrate was dipped in the sol solution and removed
instantly. Then, the various products (for each spin program) were subjected to the
dynamic PSPME sampling of 2,4-DNT from the headspace of the Hogdon 322 smokeless
powder. A mass of 100 mg of smokeless powder was placed in a quart can and sealed for
2 hr. The can was opened and sampled dynamically with a PSPME device (described in
Section 6.3.3) for 1 min. The dynamic PSPME devices were desorbed into the IonScan
400 B IMS for analysis. To study the extraction of TNT, a volume of 10 μL 240 ug mL-1
TNT in acetonitrile was spiked into a quart can, sealed overnight, and sampled by the
This document is a research report submitted to the U.S. Department of Justice. This report has not been published by the Department. Opinions or points of view expressed are those of the author(s) and do not necessarily reflect the official position or policies of the U.S. Department of Justice.

80
Almirall, Diaz-Guerra, Holness and Furton Final Technical Report: 2006-DN-BX-K027
dynamic PSPME devices for 1 min. Following sampling, the devices were analyzed by
IMS.
Characterization of Final Dynamic PSPME Devices Blanks of the final dynamic PSPME were taken by IMS (conditions listed in Table 2) to
determine if the background was suitable prior to any extraction.
The surface characteristics of the dynamic PSPME devices created, and coating thickness
determinations were made using a Philips XL30 scanning SEM (FEI, Hillsboro, OR) at
high vacuum. Both secondary electron and backscatter detection were used depending on
the information that was desired. The sample preparation included gold coating the
samples using a Hummer 10.2 Sputtering System (Anatech, LTD., Union City, CA). For
the SEM characterization of the samples spun at different speeds a reference Al stub was
covered in a drop of sol solution and cured. The stub was also gold coated prior to SEM
analysis.
Dynamic Sampling A handheld vacuum (Remote DC Sampler, Smiths Detection, Smiths Detection,
Missausaga, ON) was the device used to pump sample air through the dynamic PSPME
device and the manufacturer provided filters (Smiths Detection, Missausaga, ON). A
schematic of the handheld vacuum showing introduction of the sampling media is shown
in figure 16.
To determine the flow rate of air that is pumped while sampling, the dynamic PSPME
device is placed in the slot of the handheld vacuum as shown in figure 16 and the pump
was turned on. The air speed at the head of the nozzle was measured with an EA-3010U
handheld anemometer (La Crosse Technology, La Crosse, WI). The same was done for
the manufacturer provided filter. The sampling of the appropriate emitting source
This document is a research report submitted to the U.S. Department of Justice. This report has not been published by the Department. Opinions or points of view expressed are those of the author(s) and do not necessarily reflect the official position or policies of the U.S. Department of Justice.

81
Almirall, Diaz-Guerra, Holness and Furton Final Technical Report: 2006-DN-BX-K027
(described in Sections 6.3.5.2 and 6.4.5) is accomplished as shown in Figure 17 with both
the dynamic PSPME devices and the manufacturer provided filters.
Figure 16. Dynamic Sampling by Dynamic PSPME and Manufacturer Provided
Filters: a)the sampling medium, b) slot for sampling medium, c) nozzle length, d)
nozzle width, e) release knob (keeps collection media in place during sampling), f)
added funnel accessory prevent air flow from disturbing the sample, g) pump [146]
This document is a research report submitted to the U.S. Department of Justice. This report has not been published by the Department. Opinions or points of view expressed are those of the author(s) and do not necessarily reflect the official position or policies of the U.S. Department of Justice.

82
Almirall, Diaz-Guerra, Holness and Furton Final Technical Report: 2006-DN-BX-K027
Figure 17. Dynamic sampling at distance (h (cm)) above an emitting source (i) [165]
Volatile Chemical Signature Standards for Dynamic PSPME Sampling The following section lists the standards that were used to quantitate the mass detected by
IMS following dynamic PSPME sampling.
6.3.5.1 Spike on Manufacturer Provided Filters
Standard solutions of TNT were diluted from a 1000 ug mL-1 certified standard solution
(Cerilliant, Round Rock, TX) to concentrations of 0.1, 0.2, 0.5, 0.8, 1.0, 2.5, 5.0, and 10.0
ug mL-1 in ACN, while 2,4-DNT calibration solutions originated from a 1000 ug mL-1
stock and consisted of the following concentrations: 5.0, 8.0, 10.0, 25.0, 50.0, 100, 250,
500, and 750 ug mL-1 in hexanes. The EC solutions were prepared from a 5 µg mL-1
stock solution in concentrations of 0.1, 0.5, 0.9, and 1.0 ug mL-1. Solutions of DPA were
diluted from a 500 ug mL-1 stock solution to concentrations of 1.0, 5.0, 10.0, 25.0, 40.0,
50.0 ug mL-1. A volume of 1 µL each of the listed concentrations was spiked onto
manufacturer provided filters and analyzed by the IonScan 400B IMS.
This document is a research report submitted to the U.S. Department of Justice. This report has not been published by the Department. Opinions or points of view expressed are those of the author(s) and do not necessarily reflect the official position or policies of the U.S. Department of Justice.

83
Almirall, Diaz-Guerra, Holness and Furton Final Technical Report: 2006-DN-BX-K027
The piperonal standard solutions were made from a stock solution of 1000 µg mL-1
piperonal in DCM. A volume of 2 µL each of 1, 2, 5, 8, and 10 µg mL-1 concentrations of
piperonal were spiked onto Teflon filters and analyzed by the Itemiser 2 IMS for analysis
of the piperonal monomer. Triplicate analyses of each concentration for the suite of
compounds were conducted and response curves were generated by plotting mass (ng)
versus the cumulative signal. From the equation of the best-fit line, the mass detected by
IMS for each compound following dynamic sampling, with the novel PSPME device and
the manufacturer provided filter, was calculated in the ng range.
Blanks of the manufacturer provided filters were taken by IMS prior to spiking and
before all subsequent experiments. The filters were only used one-time and they were
stored/ sealed in metal cans supplied by the manufacturer until use.
Controlled Odor Mimic Permeation Systems (COMPS) The COMPS standards were created as previously reported in the literature[50]using
piperonal (100 mg), and they were for the first time created for the compounds, Pentolite
(3 g), 2,4-DNT (3 g), DPA (100 mg), and EC (100 mg). The 0.076 m x 0.076 m 2 mil
low-density polyethylene (LDPE) bags used were from Uline (Waukegan, IL). The
compound was placed in the bag and distributed evenly. As much air as possible, was
removed from the bag and then it was heat-sealed.
For each compound studied, COMPS standards were prepared in triplicate for statistical
purposes and were allowed to stand under ambient conditions. The mass of the bags was
recorded for up to 28 consecutive days. The average value and standard deviation for
each triplicate set was determined. The average value (grams) was plotted vs. time (days)
to determine the rate of mass lost each day, derived from the best-fit lines for the linear
This document is a research report submitted to the U.S. Department of Justice. This report has not been published by the Department. Opinions or points of view expressed are those of the author(s) and do not necessarily reflect the official position or policies of the U.S. Department of Justice.

84
Almirall, Diaz-Guerra, Holness and Furton Final Technical Report: 2006-DN-BX-K027
and exponential form (for piperonal only), respectively. From this data, the dissipation
rate of the compound through the LDPE bag per second was determined and thus the
maximal mass available for dynamic sampling by the PSPME device and manufacturer
provided filter is known for a given sampling time.
Validation Experiments for Dynamic PSPME Table 5 shows the operating conditions of the IMS instruments used for the dynamic
PSPME validation experiments. Also, related information about each particular volatile
chemical signature is included in this table.
Table 5. Detection of Volatile Chemical Signatures from Real Case Samples Using
Dynamic PSPME–IMS [165]
IMS Operating conditions IonScan 400B (#1) Itemiser 2 (#2)
Polarity Positive (+) Negative (-) Positive (+)
Desorber Temperature (°C) 250 300 215
Drift Tube Temperature (°C) 235 115 80
Sample Flow (mL min-1) 200 300 500
Drift Flow (mL min-1) 351 351 350
Reagent Gas Nicotinamide Hexachloroethane Nicotinamide
Analyte Piperonal 2,4-DNT DPA TNT EC
IMS Instrument/
polarity #2 / (+) #1 / (-) #1 / (+) #1 / (-) #1 / (+)
K0 (cm2/V × s) 1.51 1.57 1.61 1.45 1.24
Drift time (ms) 8.3 11.8 11.0 12.8 14.4
Vapor pressure
(Torr)
1.0 @
87 °C
1.1 x10⁻⁴ @
25 °C
6.4x10⁻⁴ @
25 °C
4.5 x10⁻⁶ @
25 °C N/A
This document is a research report submitted to the U.S. Department of Justice. This report has not been published by the Department. Opinions or points of view expressed are those of the author(s) and do not necessarily reflect the official position or policies of the U.S. Department of Justice.
85
Almirall, Diaz-Guerra, Holness and Furton Final Technical Report: 2006-DN-BX-K027
Dynamic PSPME Retaining Capability Studied By Analyte Solution Spiking The dynamic PSPME device was spiked with 2 µL of standard solution, with a
concentration resulting in a mass within the response curve linear range of each
compound, and was placed in the handheld vacuum. The concentrations were 0.25, 1, 5,
15 and 20 ug mL-1 for piperonal, 2,4-DNT, DPA, TNT, and EC, respectively. The pump
was turned on for various times (s) to determine at what point, if any, the IMS signal
would diminish following desorption of the dynamic PSPME device. The same was done
using the manufacturer provided filters for comparison purposes. The measurements for
each analyte were performed in triplicates. Controls with consisted of spike the analyte
solution on the surface of the sampling media and aged (no pumping applied) for 60-
70s.IMS blanks of both the manufacturer provided filters and dynamic PSPME devices
were taken before sampling.
Dynamic PSPME Retaining Capability Studied By COMPS Vapor Source Each COMPS device was placed in a particle-free hood (Labconco, Kansas City, MO)
and sampled for 30 s at different heights by turning on the vacuum with the dynamic
PSPME device in place (figure 17). Once the optimum sampling height was determined,
the COMPS devices were then sampled at that height for different times. Following each
sampling, the dynamic PSPME device was analyzed in the appropriate IMS instrument.
The manufacturer provided filter was also used at the same sampling conditions for
comparison. The COMPS devices were allowed a 30 minute stay in between each
sampling. All the optimization measurements were performed in triplicates and with the
appropriate blanks prior to sampling.
This document is a research report submitted to the U.S. Department of Justice. This report has not been published by the Department. Opinions or points of view expressed are those of the author(s) and do not necessarily reflect the official position or policies of the U.S. Department of Justice.

86
Almirall, Diaz-Guerra, Holness and Furton Final Technical Report: 2006-DN-BX-K027
Dynamic PSPME LOD The detection limits for the targeted compounds using the complete dynamic PSPME-
IMS method were estimated. The method is considered as three consecutive steps:
dynamic sampling, desorption and detection. Accumulative extraction of the total mass of
analyte onto the absorbent phase of the novel device that is above the IMS analysis LOD,
is expected to alarm. The sensitivity of the PSPME-IMS method was estimated for each
of the tested volatile chemical signatures in this study, considering a 10 s sampling time
(total air volume of 3.5 L) as applicable to real case scenarios, 100% efficient absorption
on the substrate and complete IMS desorption.
This document is a research report submitted to the U.S. Department of Justice. This report has not been published by the Department. Opinions or points of view expressed are those of the author(s) and do not necessarily reflect the official position or policies of the U.S. Department of Justice.

87
Almirall, Diaz-Guerra, Holness and Furton Final Technical Report: 2006-DN-BX-K027
Chapter 7 RESULTS AND DISCUSSION
Development of PSPME Devices for Static Extractions Modification of the fiber SPME geometry to a planar geometry greatly increased the
surface area for extraction as is depicted in figure 18.
Figure 18. Fiber to Planar SPME
The thinnest SPME coating available for a cylindrical fiber is 7 µm while the thickest is
100 µm. This equates to a surface area of the fiber from 0.45 mm2 to 10.47 mm2. The
planar SPME (PSPME) surface area ranges from 500 mm2 to 1000 mm2. The ideal
surface area for the commercial embodiment of the PSPME device will be 792 mm2 for a
disk that is 32 mm in diameter.
As a result of this increase in surface area, the capacity is also further increased because
the volume of the phase is greater. The thickest commercially available SPME fiber has a
volume of only 1.03 mm3 while the planar sol-gel PDMS discussed has a volume of 165
mm3. The change in SPME to a planar geometry thus greatly increases the possibility of
absorbing volatile chemical signatures even in difficult field sampling scenarios.
This document is a research report submitted to the U.S. Department of Justice. This report has not been published by the Department. Opinions or points of view expressed are those of the author(s) and do not necessarily reflect the official position or policies of the U.S. Department of Justice.

88
Almirall, Diaz-Guerra, Holness and Furton Final Technical Report: 2006-DN-BX-K027
Another consequence of the change in geometry is that the PSPME device can be directly
introduced into the sample desorbers of commercial IMS instruments already designed
for the introduction of “planar” sample collection filters. Sampling with SPME fibers
requires interfacing to the IMS detector. The first SPME-IMS interface was designed to
attach via the protruding sample nozzle of the GE Iontrack Itemiser 2 instrument [19].
Not all IMS systems have this feature, yet they do share planar sample introduction. With
PSPME, uniform sampling can be achieved while being easily adapted to the wide
variety of commercial instruments that are available.
Sol-gel PDMS Sol-gel PDMS has been previously used to coat SPME fibers [105] because of the high
thermal stability and strong bonding of the phase to the surface for longer lifetime of the
extraction device. This same chemistry has been used as the extraction phase of the
planar SPME device but has been modified for the difference in geometry. Sol-gel is
defined as a colloidal suspension that is gelled to form a solid. The sol-gel process starts
with hydrolysis of the precursor, MTMOS, which is catalyzed by TFA, and its
polycondensation. This creates a polymeric network that is anchored to the glass surface
since the silanol groups on the glass surface also participate in the condensation reactions.
The last step is the cross-linking of the vinyl group of the PDMS during curing [105].
For creation of the sol-gel PDMS PSPME devices, dip-coating was determined to be the
best route when compared to spin coating. In dip coating, the activated substrate is
immersed in a homogeneous polymer solution, at room temperature. While dipping, there
is a residence time whereby the compounds that would eventually form the coating
interact with the activated surface. Specifically for sol-gel processes, during withdrawal
of the substrate from the polymeric solution, the liquid film on the substrate becomes a
This document is a research report submitted to the U.S. Department of Justice. This report has not been published by the Department. Opinions or points of view expressed are those of the author(s) and do not necessarily reflect the official position or policies of the U.S. Department of Justice.

89
Almirall, Diaz-Guerra, Holness and Furton Final Technical Report: 2006-DN-BX-K027
gelatinous coating upon coming into contact with the ambient atmosphere above the
coating solution. There are many simultaneous processes, as illustrated in figure 19
taking place including: gelation (or connection of the particles that have condensed) and
aggregation of these particles in preparation for gel formation. Meanwhile, solvent
evaporation, gravitational draining, and continued condensation reactions are occurring.
It is also important to note that the sol becomes dilute upon withdrawal of the substrate,
and as a result, sol solutions as coatings can only be used once.
Figure 19. Sol-gel: Dip-coating Processes. Adapted from [99]
These processes help determine the final sol-gel film thickness. Other parameters that
affect the film thickness are viscosity, withdrawal speed, oxide concentration of the
solution and heating temperature and time. Increased viscosity, withdrawal speeds and/or
oxide concentration in the sol solution yield large film thickness. Inversely, since gels are
porous they are sintered with heating; high heat and prolonged temperatures result in
thinner films. Solvent evaporation occurs over time once the coated substrate is removed
completely from the coating solution and can be aided by heat, which in turn also helps
cross-link (chemically bond) the substrate and the polymer. Additionally, -M-O-M’-
bonds may be formed as a result of dehydration (see figure 20), while subsequent heating
This document is a research report submitted to the U.S. Department of Justice. This report has not been published by the Department. Opinions or points of view expressed are those of the author(s) and do not necessarily reflect the official position or policies of the U.S. Department of Justice.
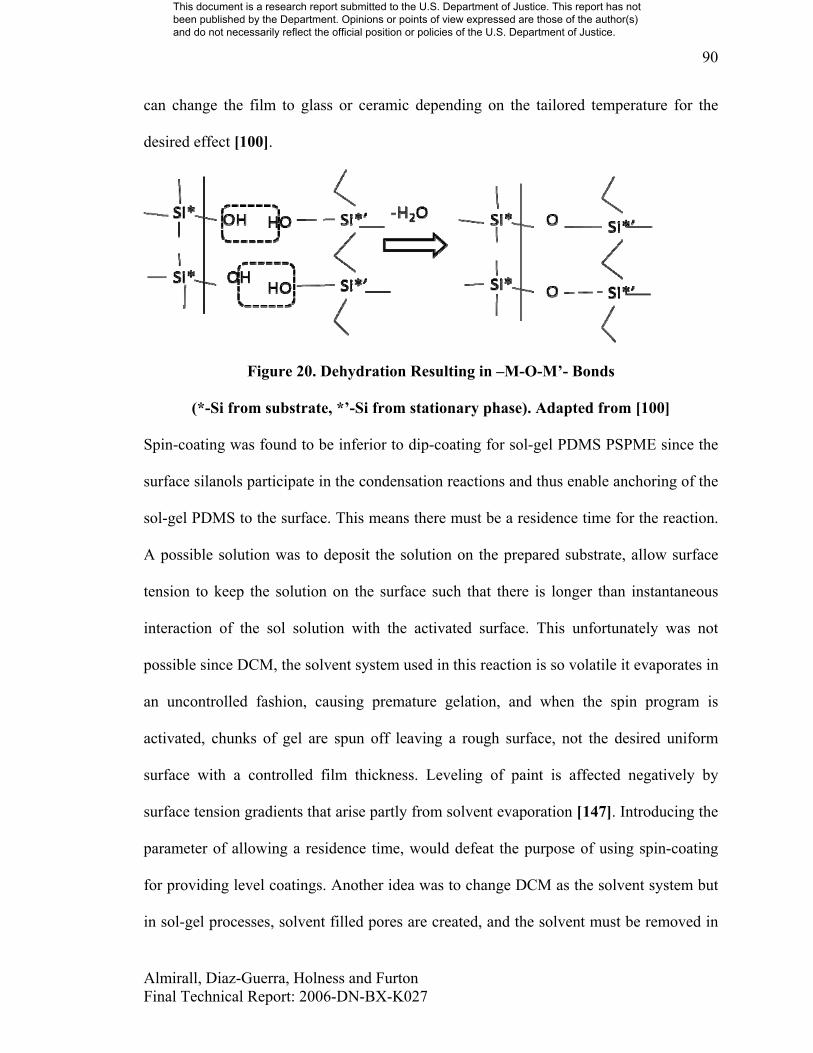
90
Almirall, Diaz-Guerra, Holness and Furton Final Technical Report: 2006-DN-BX-K027
can change the film to glass or ceramic depending on the tailored temperature for the
desired effect [100].
Figure 20. Dehydration Resulting in –M-O-M’- Bonds
(*-Si from substrate, *’-Si from stationary phase). Adapted from [100]
Spin-coating was found to be inferior to dip-coating for sol-gel PDMS PSPME since the
surface silanols participate in the condensation reactions and thus enable anchoring of the
sol-gel PDMS to the surface. This means there must be a residence time for the reaction.
A possible solution was to deposit the solution on the prepared substrate, allow surface
tension to keep the solution on the surface such that there is longer than instantaneous
interaction of the sol solution with the activated surface. This unfortunately was not
possible since DCM, the solvent system used in this reaction is so volatile it evaporates in
an uncontrolled fashion, causing premature gelation, and when the spin program is
activated, chunks of gel are spun off leaving a rough surface, not the desired uniform
surface with a controlled film thickness. Leveling of paint is affected negatively by
surface tension gradients that arise partly from solvent evaporation [147]. Introducing the
parameter of allowing a residence time, would defeat the purpose of using spin-coating
for providing level coatings. Another idea was to change DCM as the solvent system but
in sol-gel processes, solvent filled pores are created, and the solvent must be removed in
This document is a research report submitted to the U.S. Department of Justice. This report has not been published by the Department. Opinions or points of view expressed are those of the author(s) and do not necessarily reflect the official position or policies of the U.S. Department of Justice.
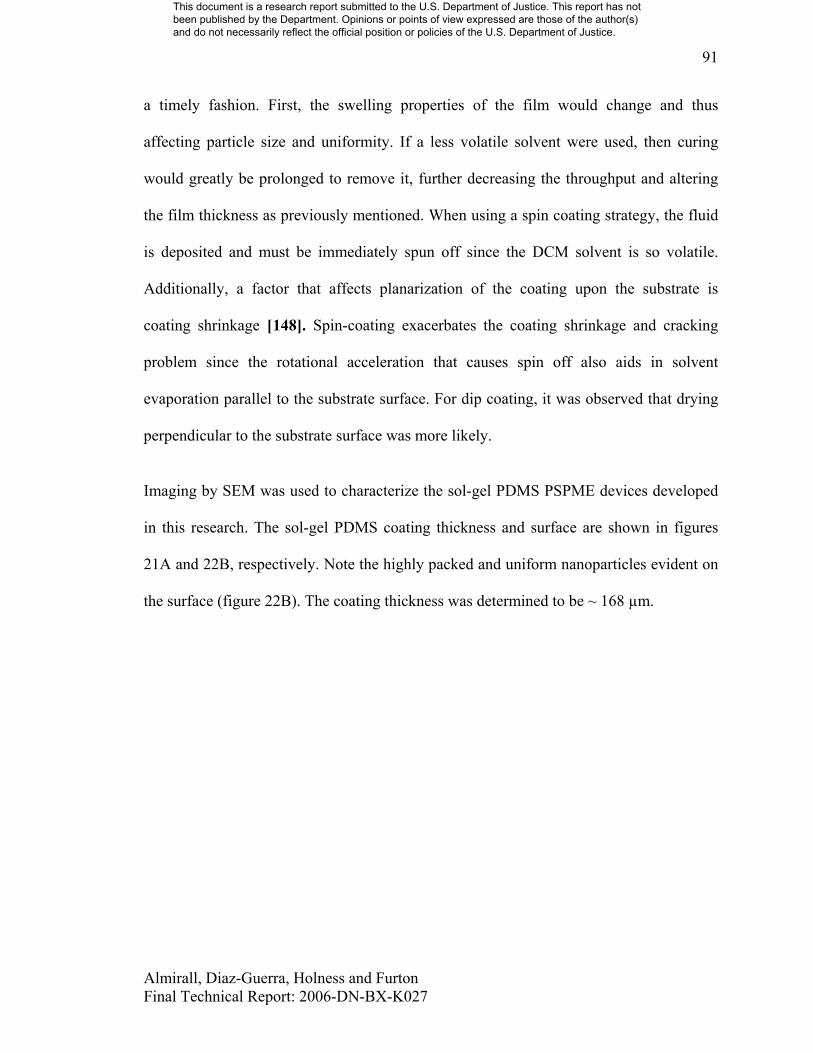
91
Almirall, Diaz-Guerra, Holness and Furton Final Technical Report: 2006-DN-BX-K027
a timely fashion. First, the swelling properties of the film would change and thus
affecting particle size and uniformity. If a less volatile solvent were used, then curing
would greatly be prolonged to remove it, further decreasing the throughput and altering
the film thickness as previously mentioned. When using a spin coating strategy, the fluid
is deposited and must be immediately spun off since the DCM solvent is so volatile.
Additionally, a factor that affects planarization of the coating upon the substrate is
coating shrinkage [148]. Spin-coating exacerbates the coating shrinkage and cracking
problem since the rotational acceleration that causes spin off also aids in solvent
evaporation parallel to the substrate surface. For dip coating, it was observed that drying
perpendicular to the substrate surface was more likely.
Imaging by SEM was used to characterize the sol-gel PDMS PSPME devices developed
in this research. The sol-gel PDMS coating thickness and surface are shown in figures
21A and 22B, respectively. Note the highly packed and uniform nanoparticles evident on
the surface (figure 22B). The coating thickness was determined to be ~ 168 µm.
This document is a research report submitted to the U.S. Department of Justice. This report has not been published by the Department. Opinions or points of view expressed are those of the author(s) and do not necessarily reflect the official position or policies of the U.S. Department of Justice.

92
Almirall, Diaz-Guerra, Holness and Furton Final Technical Report: 2006-DN-BX-K027
Figure 21. The Sol-gel PDMS PSPME Device A) coating thickness B) surface
characteristics [149]
PDMS PSPME Via a Chlorine-terminated PDMS Route Coating of the planar PDMS PSPME device was achieved by spin-coating chlorine-
terminated PDMS onto a glass substrate with exposed silanol groups on the surface (from
the surface activation procedure). A bimolecular nucleophilic substitution reaction (SN2)
occurs where the exposed silanol group reacts with the chlorine moiety of the PDMS,
liberating HCl and covalently binding PDMS to the glass.
This document is a research report submitted to the U.S. Department of Justice. This report has not been published by the Department. Opinions or points of view expressed are those of the author(s) and do not necessarily reflect the official position or policies of the U.S. Department of Justice.

93
Almirall, Diaz-Guerra, Holness and Furton Final Technical Report: 2006-DN-BX-K027
Spin coating was much more desirable as a coating strategy for several reasons. First,
with spin coating, only 1 mL of coating solution is required for creating a thin film upon
the chosen substrate. Compared to the 25 mL of coating solution required per sol-gel
PDMS PSPME device, using only 1 mL of raw materials is much more economical,
especially in the development stages when a raw material is limited, as is the case with
the La (dihed) powder that has been synthesized in this research (Section 7.1.5).
Secondly, the spin coating process is much faster, 1 min compared to 1 hr in the case of
sol-gel PDMS. During spinning, flow of the coating solution and drying of the solvent
occurs simultaneously [162]. For these reasons there is higher throughput with spin
coating for creating the extraction devices than with dip coating. Thirdly and most
important, with spin coating there is higher reproducibility in final film thickness and
uniformity. This is largely the result of the elimination of human error since in dip
coating the withdrawal rate can affect the final film thickness. The greater the speed of
withdrawal, the greater the film thickness produced [100]. By using the Laurell spin
coater (in these experiments), the solution is spun off with both consistent and accurate
acceleration and spin (accuracy better than 1 rpm [150]) for an given time span.
Specifically, since solvent evaporation is such an important parameter, a hole on the lid
of the spin coater used in this work was covered while the spin program is activated.
This document is a research report submitted to the U.S. Department of Justice. This report has not been published by the Department. Opinions or points of view expressed are those of the author(s) and do not necessarily reflect the official position or policies of the U.S. Department of Justice.

94
Almirall, Diaz-Guerra, Holness and Furton Final Technical Report: 2006-DN-BX-K027
Figure 22. Surface and Coating Thickness of the PDMS PSPME Device [168]
An SEM image of the PDMS surface is shown in figure 22. The coating thickness was
determined to be ~ 67µm.
Activated Charcoal in PDMS Formulations A modified carboxen/ sol-gel PDMS coating was attempted by substituting activated
charcoal for the carboxen particles. A commercial carboxen (CAR)/ PDMS fiber was
imaged using SEM (figure 25) in order to determine the particle size of the carboxen.
Figure 25. SEM Image (Low Vacuum) of CAR/ PDMS Fiber
Backscatter detection in low vacuum (LV), with no conductive coating, was used to see
differences in composition. The lighter spots on the image represent the carboxen
particles. The average size of these particles was determined to be 14.1 um. The activated
This document is a research report submitted to the U.S. Department of Justice. This report has not been published by the Department. Opinions or points of view expressed are those of the author(s) and do not necessarily reflect the official position or policies of the U.S. Department of Justice.

95
Almirall, Diaz-Guerra, Holness and Furton Final Technical Report: 2006-DN-BX-K027
charcoal that would be used in the activated charcoal/ PDMS coatings was also imaged,
revealing irregularly shaped particles that also varied significantly in size (see figure 26).
Figure 26. SEM Image (LV) of Activated Charcoal Particles
The activated charcoal particles were embedded in two PDMS formulations, sol-gel
PDMS and Sylgard 184® PDMS, and were used to dip coat the activated glass slides.
Figure 27.
Activated Charcoal/ PDMS PSPME Devices. A) AC/ Sylgard® 184 PDMS B) AC/
sol-gel PDMS
Since commercial CAR/PDMS fibers require high desorption temperatures (up to 310 ºC)
[151] to remove adsorbed analytes, it was thought that by incorporating the activated
carbon particles with sol-gel PDMS would afford added thermal stability enabling IMS
desorption at 300 ºC. The AC/ Sylgard PDMS served as a control for determining the
appropriate coating parameters when activated charcoal is used, but this device was not
intended for eventual use with IMS due to its low maximum operating temperature.
This document is a research report submitted to the U.S. Department of Justice. This report has not been published by the Department. Opinions or points of view expressed are those of the author(s) and do not necessarily reflect the official position or policies of the U.S. Department of Justice.
96
Almirall, Diaz-Guerra, Holness and Furton Final Technical Report: 2006-DN-BX-K027
The surfaces of the final PSPME devices are pictured in figures 27A and 27B. There is
appreciable surface roughness on both devices, and in figure 27B, the cloudy surface
characteristic of a sol-gel PDMS device indicates proper physical incorporation of the
activated charcoal particles. Preliminary extractions with TNT resulted in minute
amounts of TNT detected and unsuitable desorption profiles even at 300 ºC desorption.
Therefore, further experimentation with these coatings was abandoned.
La (dihed) Structure Determination
First, the ligand, p-di (44,5,5,6,6,6-heptafluoro-1,3-hexanedionyl)benzene, H2 dihed, was
synthesized. The structure of the ligand is shown in figure 28 showing both the enol and
keto tautomers of this ß-diketonate.
Figure 28. Ligand Structure Showing Enol and Keto Tautomers of H2 (dihed): p-di(4,4,5,5,6,6,6-heptafluoro-1,3-hexanedionyl)benzene (C18H8O4F14)
Following synthesis of the ligand, analysis by 1H NMR was done in order to elucidate its
structure. Figure 29 is the spectrum of the ligand in deuterated chloroform.
CF3
F F
FF
OOHCF3
FF
F F
O OHO
CF3
O
O O
F F
FF
F F
CF3
F F
This document is a research report submitted to the U.S. Department of Justice. This report has not been published by the Department. Opinions or points of view expressed are those of the author(s) and do not necessarily reflect the official position or policies of the U.S. Department of Justice.

97
Almirall, Diaz-Guerra, Holness and Furton Final Technical Report: 2006-DN-BX-K027
Figure 29. 1H NMR Spectrum of the H2 (dihed) ligand
The peak at 1.6 ppm represents traces of H2O in the deuterated chloroform. The two vinyl
hydrogens are represented at 6.7 ppm with a peak area of 2. The peak at 7.2 ppm is from
the solvent. The peak at 8.1 represents the four aryl hydrogens with a peak area of 4,
which is as expected- double the peak area of the vinyl hydrogens.
In non-polar solvents it is generally accepted that the enolic form is favored, and that
simultaneous conjugation and chelation through hydrogen bonding is responsible for the
stability of the enol tautomers. Enolization is also known to increase when the ligands are
fluorinated or contain an aromatic ring [152], as is the case with the H2 (dihed) ligand.
Following the successful synthesis of the ligand, the metal complex La (dihed) was
synthesized. The proposed structure for the La (III) complex with dihed is as pictured in
figure 30. This is according to the reported chemical formula for this complex [117] from
elemental analysis data.
This document is a research report submitted to the U.S. Department of Justice. This report has not been published by the Department. Opinions or points of view expressed are those of the author(s) and do not necessarily reflect the official position or policies of the U.S. Department of Justice.

98
Almirall, Diaz-Guerra, Holness and Furton Final Technical Report: 2006-DN-BX-K027
LaO O O O
LaOOO O
O O O O
CF3 CF3
CF3
CF3CF3
CF3CF2
CF2 CF2 CF2CF2
CF2
CF2 CF2
CF2CF2
CF2CF2
Figure 30. [La2 Dihed3·4H2O]n, [La2 (C18H6O4F14)3·4H2O]n Structure
The elemental analysis was consistent with a ratio of two lanthanum ions to three ligands
as is shown in figure 30. This is because the metal ions in the ß-diketonate polymers are
coordinatively unsaturated and will bond to suitable electron pair donors [117], in this
case the carbonyl oxygens.
Following this synthesis, classical methods of structure determination were used for the
ligand and the complex. The melting point of the ligand was found to be 144-146 °C
which is close to the literature value of 146-147 °C [164]. In the melting point
determination of La (dihed), at 300 °C there was no melting but the compound turned a
brownish color. This is consistent with the literature, which reports that at 300 °C there
was slight discoloration with no melting [117]. Solubility tests were also conducted
whereby the ligand was soluble in non-polar solvents like chloroform and DCM and the
complex was soluble in polar solvents such as methanol. Lastly, TLC was done of both
the ligand and the complex in a (hexane: acetone 90:10) mobile phase. The Rf values
were 0.68 and 0.51 for the ligand and the complex respectively. There was only one spot
per lane suggesting single products.
This document is a research report submitted to the U.S. Department of Justice. This report has not been published by the Department. Opinions or points of view expressed are those of the author(s) and do not necessarily reflect the official position or policies of the U.S. Department of Justice.

99
Almirall, Diaz-Guerra, Holness and Furton Final Technical Report: 2006-DN-BX-K027
The next step taken in the structure determination of these synthesized compounds was to
use the molecular absorption technique FT-IR. Figure 31 is an overlay spectrum of the
ligand and metal complex.
Figure 31. Overlaid IR Spectra of H2 (dihed) and the La (dihed) Complex
The differences in the two spectra and regions of interest are highlighted in figure 32 with
the corresponding interpretations listed in table 6.
Table 6. IR Band Interpretation
Si*
Si*
OH
This document is a research report submitted to the U.S. Department of Justice. This report has not been published by the Department. Opinions or points of view expressed are those of the author(s) and do not necessarily reflect the official position or policies of the U.S. Department of Justice.

100
Almirall, Diaz-Guerra, Holness and Furton Final Technical Report: 2006-DN-BX-K027
The band assignments listed on table 6 support the proposed structures of the ligand
(figure 29) and the metal complex (figure 31).
Direct infusion-mass spectrometry was used to confirm the molecular weights of the
ligand and the complex. Figure 32 is the negative ion mass spectrum of the ligand.
Ref. Wavenumber (cm-1)
Group Ligand Complex
[153] 800-900 1,4 di-substituted aromatic benzene
793, 865, 881
784,867,893
[170, 153F
154] 1050-1250 CF2 1056, 1123 1055,1119
1350 CF3 1352 1346 [170] 1580-1640 Broad band due to intra-
molecular hydrogen bonding stabilized by
resonance. This is characteristic of the enol-
keto tautomers
1600-1630
[171] Shift of C=O due to
halogen substitution
Fluorines linked α/β to carbonyl group
1815
[169] 1425-1489 C=O stretching associated with C-H bending
- 1495
[169] 1520, 1580 CC, CO symmetrical, unsymmetrical stretching in the six member chelate
ring
- 1523, 1563
[171, 154F
155] 3100-3600 O-H stretching vibration at
water of crystallization - 3446
This document is a research report submitted to the U.S. Department of Justice. This report has not been published by the Department. Opinions or points of view expressed are those of the author(s) and do not necessarily reflect the official position or policies of the U.S. Department of Justice.

101
Almirall, Diaz-Guerra, Holness and Furton Final Technical Report: 2006-DN-BX-K027
\\Castic\amsf data\08-092009\7514 9/9/2009 3:02:53 PM dxathk1 inmeoh
7514 #152 RT: 2.10 AV: 1 NL: 9.34E5T: - c ESI Full ms [ 150.00-620.00]
150 200 250 300 350 400 450 500 550 600m/z
0
5
10
15
20
25
30
35
40
45
50
55
60
65
70
75
80
85
90
95
100
Rel
ativ
e A
bund
ance
553.0
554.0
276.2575.0 583.9416.5
585.9383.1213.1595.5440.0415.4265.3 289.1 479.0 495.2209.2 325.4 357.0214.1166.2 534.0
Figure 32. Negative Ion Mass Spectrum of H2 (dihed) Ligand
The base peak (relative intensity 100 %, y-axis) is at 553 m/z (x-axis). This is the [M-H]-
molecular ion of the ligand, which has a molecular weight of 554 a.m.u. The
determination of the molecular weight of the complex was not so straightforward. Figure
33 is the negative ion mass spectrum of the complex.
The fragment of 553 m/z, is the peak with the second highest intensity and is likely the
result of the [Ligand-H]-. The peak with greatest intensity is likely the ligand with an
attached sodium ion. At the higher mass range there are many peaks, but no fragment
stands out. A zoom of this spectrum is shown in figure 34. There is no definitive peak in
this mass range either. This may be so because the complex is a polymer with each
monomer having a molecular weight of 1934 a.m.u. (without counting the coordinated
water molecules) and 2006 a.m.u. counting these. The mass range of the mass
This document is a research report submitted to the U.S. Department of Justice. This report has not been published by the Department. Opinions or points of view expressed are those of the author(s) and do not necessarily reflect the official position or policies of the U.S. Department of Justice.

102
Almirall, Diaz-Guerra, Holness and Furton Final Technical Report: 2006-DN-BX-K027
spectrometer is only 2000 a.m.u. If the presence of doubly charged ions is considered
there are still no characteristic fragments other that the [Ligand-H]- ion seen in figure 33.
\\Castic\amsf data\08-092009\7515 9/9/2009 3:22:06 PM ligard
7515 #202 RT: 1.94 AV: 1 NL: 8.96E4T: - c ESI Full ms [ 200.00-2000.00]
200 400 600 800 1000 1200 1400 1600 1800 2000m/z
0
5
10
15
20
25
30
35
40
45
50
55
60
65
70
75
80
85
90
95
100
Rel
ativ
e A
bund
ance
575.1
553.1
213.1
1520.71531.3383.1
576.2 1865.01551.0 1756.71172.9 1259.2 1406.0416.2276.1 1127.9868.7584.9 806.9
Figure 33. Negative Mass Spectrum of the La (dihed) Complex
The final steps used to characterize the La (dihed) complex involved the use of 1H NMR.
It is generally accepted that 1H NMR of compounds containing paramagnetic metals such
as La, is impossible [156]. This is because paramagnetic compounds have disordered,
permanent magnetic moments even in the presence of an applied field from, for example,
an NMR magnet. Despite this, the NMR experiment was conducted to see if there could
be any useful information gained, as there are a growing number of researchers
attempting to obtain useful NMR spectra from paramagnetic complexes [176].
This document is a research report submitted to the U.S. Department of Justice. This report has not been published by the Department. Opinions or points of view expressed are those of the author(s) and do not necessarily reflect the official position or policies of the U.S. Department of Justice.

103
Almirall, Diaz-Guerra, Holness and Furton Final Technical Report: 2006-DN-BX-K027
\\Castic\amsf data\08-092009\7516 9/11/2009 1:36:33 PM ligard
7516 #95 RT: 1.90 AV: 1 NL: 2.05E5T: + c ESI Full ms [ 1900.00-2000.00]
1900 1910 1920 1930 1940 1950 1960 1970 1980 1990 2000m/z
0
5
10
15
20
25
30
35
40
45
50
55
60
65
70
75
80
85
90
95
100
Rel
ativ
e A
bund
ance
1961.41915.91903.5
1922.71958.51907.7
1973.01963.7 1997.21990.31942.4 1952.51925.7 1932.1
1938.5 1977.71970.1
1985.2
1983.1
Figure 34. Negative Mass Spectrum of the La (dihed) Complex from 1900-2000 m/z
Figure 35 is the 1H NMR spectrum of the La (dihed) complex in deuterated MeOH. This
spectrum was taken using 160 scans in order to improve the signal-to-noise ratio. It is
obvious that the spectrum is much different than that of the ligand. What is encouraging
is the presence of line broadening since this likely due to the presence of a paramagnetic
metal. The three areas that have broad peaks indicate they are connected to a compound
bound to a paramagnetic metal. The fact that some not all peaks are broad, is a good
indication that the metal is bonded and not a free species. The sharp peaks with chemical
shifts at 1.3, 2, and 2.5 ppm are likely interferences resulting from the synthesis, since
these peaks are sharp. The broad peak at 2.6-2.8 ppm can be due to coordinated water.
The peaks at 3.3-3.5 ppm and 2.8-5.0 ppm are from the solvent, deuterated methanol, as
indicated by the large peak areas (48 for each). The broad peak at 6.2-6.4 ppm may be the
This document is a research report submitted to the U.S. Department of Justice. This report has not been published by the Department. Opinions or points of view expressed are those of the author(s) and do not necessarily reflect the official position or policies of the U.S. Department of Justice.

104
Almirall, Diaz-Guerra, Holness and Furton Final Technical Report: 2006-DN-BX-K027
hydrogen in the chelate aromatic ring. Lastly, the peaks at 7.7-8.2 ppm may be aryl
protons and/or indicate possible residues of the ligand plus two mixed complexes or an
unsymmetrical complex.
Figure 35. 1H NMR (160 scans) of the La (dihed) Complex
The peaks at 7.7-8.2 ppm warranted further exploration since they could be 2 or 3
unresolved peaks due to the line broadening effect. This was studied by conducting a
high temperature (50 ºC) 1H NMR experiment since raising the temperature might help
better arrange the disordered magnetic moments that causes the line broadening and
because there is a known temperature dependence of paramagnetic shifts [176]. The
intent was to raise the temperature just below the boiling point of methanol, but the
instrument only allowed analysis up to 50 ºC. The resulting spectrum is shown in figure
36. It is evident that the overall noise was reduced and that there are 2 true peaks at 7.7-
This document is a research report submitted to the U.S. Department of Justice. This report has not been published by the Department. Opinions or points of view expressed are those of the author(s) and do not necessarily reflect the official position or policies of the U.S. Department of Justice.

105
Almirall, Diaz-Guerra, Holness and Furton Final Technical Report: 2006-DN-BX-K027
8.2 ppm. This means that the third sharp peak in this region was just noise and not
indicative of free ligand.
Figure 36. 1H NMR of the La (dihed) Complex at 50 ºC
The broad peak at 6.2-6.4 ppm disappeared in the high temperature spectrum and did not
return when the room temperature spectrum was taken following the experiment. At this
point this behavior is not clear and further supports the idea that 1H NMR, at least one-
dimensional 1H NMR is not suitable for the analysis of paramagnetic complexes, other
than to indicate the presence of a paramagnetic metal from observed line broadening.
Furthermore, lanthanide ß-diketonate complexes are used as shift reagents in NMR
because they induce changes in the chemical shifts of protons close to an electronegative
substituent with a lone pair [157], like carbonyls and alcohols. This further complicates
the analysis since it is not known if the peaks observed are shifted from the accepted
chemical shifts in the literature.
This document is a research report submitted to the U.S. Department of Justice. This report has not been published by the Department. Opinions or points of view expressed are those of the author(s) and do not necessarily reflect the official position or policies of the U.S. Department of Justice.

106
Almirall, Diaz-Guerra, Holness and Furton Final Technical Report: 2006-DN-BX-K027
The structure of the ligand was confirmed by 1H NMR, DI-MS, FT-IR and other classical
methods. Although the molecular weight of the La (dihed) polymer could not be
confirmed by DI-MS there were differences in the spectrum such as more peaks at higher
mass range and a base peak that differed by 22 a.m.u. with the 553 a.m.u. peak that is
likely the fragment [Ligand-H]-. Furthermore, the IR band assignments strongly suggest
the structure. In Table 6, the last three band assignments indicate the presence of the six-
member chelate ring and coordinated water along with the other band assignments that
confirm the presence of the ligand in the complex. Lastly, from the 1H NMR data, the
presence of a bonded paramagnetic metal is confirmed. Including the results of the
classical methods of structure determination such as melting point, solubilities and
differing Rf values, adds confidence that the products were synthesized successfully.
La (dihed) SPME Coatings Following the synthesis of the complex, experiments were conducted to coat the surfaces
of activated glass, PDMS (made by the chlorine-terminated PDMS route), and sol-gel
PDMS. This was achieved by dipping the substrates in a solution of 236 mg of complex
in 50 mL of methanol for 1 hr. The procedure published previously for the coating of
SPME fibers called for instantaneous dipping and withdrawal of the fiber into 236 mg of
complex dissolved in 1 mL of methanol [90]. This extraordinarily large concentration did
not seem feasible so the concentration was reduced and the dipping time was extended in
order to promote adhesion of the La (dihed) complex to the various surfaces. Despite the
dilution the solution was still a bright yellow color. The drying and conditioning
procedures for the devices were followed as reported.
This document is a research report submitted to the U.S. Department of Justice. This report has not been published by the Department. Opinions or points of view expressed are those of the author(s) and do not necessarily reflect the official position or policies of the U.S. Department of Justice.

107
Almirall, Diaz-Guerra, Holness and Furton Final Technical Report: 2006-DN-BX-K027
Since the low operating temperature of La (dihed) coatings is known [90] an experiment
was conducted to monitor the effects of temperature on the La (dihed) coated devices by
SEM imaging. The various devices were exposed to 10 min of 180, 225, and 300 °C
temperatures. The devices withstood the 10 min exposure to 180 °C without any visually
apparent defects on the surface. Following exposure to 225 °C for 10 min, there was
some yellow powder left on the container meaning the La (dihed) coating, at least
partially, was removed from the surface. Lastly, only 10 min of 300 °C caused significant
charring of the device, turning it into a brownish color consistent with the results of the
melting point determination.
Following the temperature experiments, the samples of the various La (dihed) PSPME
devices were prepared and analyzed by SEM. Figure 37 includes the SEM images
obtained for the control, La (dihed) coated on activated glass. It is evident that the
superficial features, the spots with holes in the center and the more subtle bubbles that
range in size from 2-4 µm are reduced with increasing temperature. The presence of these
features may be crucial to the extraction enhancements observed when using La (dihed)
over PDMS fibers. Next, figure 38 includes the SEM images for the La (dihed) coated
over PDMS. The SEM images reveal a viscous film when the La (dihed) coats the
PDMS phase. This is consistent with the “glassy” film reported for the SEM images of
the La (dihed) coated over a commercial PDMS fiber [90]. Again, it is clear in these
images that the features originating from La (dihed) are diminished with increasing
temperatures.
This document is a research report submitted to the U.S. Department of Justice. This report has not been published by the Department. Opinions or points of view expressed are those of the author(s) and do not necessarily reflect the official position or policies of the U.S. Department of Justice.

108
Almirall, Diaz-Guerra, Holness and Furton Final Technical Report: 2006-DN-BX-K027
Figure 37. Temperature Effects on Control La (dihed) PSPME Devices
Figure 39 includes the SEM images of the devices that were coated with La (dihed) over
a sol-gel PDMS base. The La (dihed) solution coats the sol-gel PDMS particles
efficiently. This is observed when comparing the SEM image of a sol-gel PDMS devices
and the La (dihed) coated device. After exposure at 225 °C for 10 min, pores begin to
appear in the La (dihed) coated sol-gel PDMS device. This may have implications for
greater surface area & trapping by exposing the SG particles underneath the La (dihed)
coating. At 300 °C,the La (dihed) was removed completely from the surface leaving
behind only the original sol-gel PDMS particles. These results reveal that La (dihed)
OH
Si*’
OH
This document is a research report submitted to the U.S. Department of Justice. This report has not been published by the Department. Opinions or points of view expressed are those of the author(s) and do not necessarily reflect the official position or policies of the U.S. Department of Justice.

109
Almirall, Diaz-Guerra, Holness and Furton Final Technical Report: 2006-DN-BX-K027
surface coatings are extremely susceptible to heat. This is an issue for efficient IMS
desorption and thus builds a case for enhancing the thermal stability of these coatings.
Figure 38. Temperature Effects on La (dihed) Coated PDMS PSPME Devices
Si*’ OH
This document is a research report submitted to the U.S. Department of Justice. This report has not been published by the Department. Opinions or points of view expressed are those of the author(s) and do not necessarily reflect the official position or policies of the U.S. Department of Justice.

110
Almirall, Diaz-Guerra, Holness and Furton Final Technical Report: 2006-DN-BX-K027
Figure 39. Temperature Effects on La (dihed) Coated Sol-gel PDMS Devices
Figure 40. Coating Thickness of La (dihed)
During the SEM imaging experiments, a crack was located on one of the devices (La
(dihed) coated over sol-gel PDMS) that was exposed to 10 min at 225 °C. This crack
revealed a layer of La (dihed) with an average thickness of 30 µm. Underneath, the sol-
gel coating is evident from the particle presence (see figure 40). This indicates that the
coating procedure produces a suitable coating thickness of at least 30 µm.
Given the negative effects of temperature, evident from the SEM analysis and humidity
[90] on La (dihed) coatings, incorporation of the La (dihed) into a sol-gel network,
known to be extremely thermally resistant, was pursued. Since the complex (figure 31)
has no available sites such an exposed –OH group with which to bond to a sol-gel active
stationary phase, a La (dihed) sol-gel reaction aimed at chemically binding the polymer to
the substrate, is not feasible. Instead, it was thought that by introducing a solution of the
La (dihed) complex at the appropriate step in the sol-gel PDMS reaction, the La (dihed)
component of the phase would be protected from heat and humidity while maintaining its
absorptive capabilities. In an ideal planar SPME phase, the analytes would absorb into
This document is a research report submitted to the U.S. Department of Justice. This report has not been published by the Department. Opinions or points of view expressed are those of the author(s) and do not necessarily reflect the official position or policies of the U.S. Department of Justice.

111
Almirall, Diaz-Guerra, Holness and Furton Final Technical Report: 2006-DN-BX-K027
the sol-gel PDMS coating and be strongly retained due to the additional host-guest
interactions the La (dihed) component would afford.
The La (dihed) component in 1 mL of methanol was added prior to catalysis of the sol-
gel reaction. There were problems encountered since even 100 mg of complex in
methanol was difficult to dissolve. Initially, it was intended to dissolve the La (dihed) in
only 100 µl of methanol since the solvent system for this particular sol-gel reaction is
DCM. Once the solution was added to the sol-gel components prior to catalysis there
were visible particles of un-dissolved La (dihed) powder. The mixture was heated in a
water bath at 40 °C to homogenize the solution. The sol-gel reaction was conducted as
normal. During the 30 min stay, two phases were observed from the mixture of DCM and
methanol. The solution was vortexed and then deposited on the activated substrate. Since
sol-gel has been shown to require dip-coating, it was intended to deposit the sol solution
and allow interaction with the surface for some time prior to spin off. Immediately upon
deposition though, the solution started to gelate/ cure so within 30 s the solution was spun
off using a slower 200 rpm program for 1 min. A control sol-gel device was prepared in
the same manner without addition of La (dihed) powder. The devices were cured at lower
than normal temperatures as described in Chapter 6. Figure 41 shows pictures of the sol-
gel PDMS device (A) and the La (dihed)/ sol-gel PDMS device (B) that were created by
this process. Granted, both surfaces hardly look uniform but these were not coated under
optimal conditions of dip-coating. This was not done since dip coating would have
required a much greater mass of La (dihed) powder than was available for testing and
development purposes. What is encouraging is that the coating of the La (dihed) even
seems more uniform than that of the sol-gel PDMS that experienced significant coating
This document is a research report submitted to the U.S. Department of Justice. This report has not been published by the Department. Opinions or points of view expressed are those of the author(s) and do not necessarily reflect the official position or policies of the U.S. Department of Justice.

112
Almirall, Diaz-Guerra, Holness and Furton Final Technical Report: 2006-DN-BX-K027
shrinkage and cracking. There is build up of coating solution evident on the four corners
of the substrate meaning if spin-coating were continued to be used, a much faster spin
speed would be necessary to reduce this effect.
Figure 41. Images of the Sol-gel PDMS PSPME Device (A) and La (dihed)/ PDMS
PSPME Device (B). Spin coating: 200 rpm for 1 min.
The next step was to determine if these devices, although not uniformly coated, were
suitable for subsequent extractions. The devices were desorbed into the Ionscan IMS and
the background produced was analyzed. Figure 42 shows the IMS plasmagram of the
blank La (dihed)/ sol-gel PDMS device.
This document is a research report submitted to the U.S. Department of Justice. This report has not been published by the Department. Opinions or points of view expressed are those of the author(s) and do not necessarily reflect the official position or policies of the U.S. Department of Justice.

113
Almirall, Diaz-Guerra, Holness and Furton Final Technical Report: 2006-DN-BX-K027
Figure 42. Plasmagrams of the Blank La (dihed)/ Sol-gel PDMS PSPME Device
The large peak at 12 ms is problematic since it interferes with the position of the 2,4-
DNT peak and depletes the pool of reactant ions available for the formation of product
ions. The peak at 12 ms is often seen when the substrate was not washed sufficiently well
with deionized water in the surface activation stages although this is not likely in this
particular case. It could also be attributed to trapped solvent or many other factors during
the coating process. The device may not have been properly cured since the conditioning
program was 150 ºC for only 2 hr, followed by room temperature curing for 48 hr.
Further curing was done about after 1 month of the device being in the dessicator since a
reanalysis of the background still showed the peak as in figure 43. The device was then
heated for another 2 hr at 150 ºC and no La (dihed) powder was observed on the vial
containing the device meaning that temperature for that time did not affect the integrity of
the coating. The IMS background still showed these peaks without any reduction in
intensity. The next steps were heating at 180 ºC for 2 hr, which left then corners of the
device a brownish tinge. Reanalysis still showed the same background. Heating for an
additional 6 hrs at 150 ºC did not reduce the background either. It is thought that because
the La (dihed) was added before catalysis of the sol-gel reaction, the solvent filled pores
that were created were likely blocked by the presence of the La (dihed) and this did not
allow the solvent to be released during drying. This is further complicated since methanol
was used and has a relatively higher boiling point than DCM. Further experimentation is
suggested that involves optimizing a sol-gel reaction with ethyl acetate as the solvent
system, then adding the La (dihed) after the TFA has been added into the mixture.
Despite these seemingly negative results, the positive outcomes are that prolonged curing
This document is a research report submitted to the U.S. Department of Justice. This report has not been published by the Department. Opinions or points of view expressed are those of the author(s) and do not necessarily reflect the official position or policies of the U.S. Department of Justice.

114
Almirall, Diaz-Guerra, Holness and Furton Final Technical Report: 2006-DN-BX-K027
at 150 ºC does not seem to affect the integrity of the coating. Furthermore, the peak at 12
ms can be removed through diligent coating method optimization, as has been done
before. This of course does mean additional La (dihed) must be synthesized. Lastly, a
recent publication has detailed the impregnation of La (dihed) into glass filter for use
with IMS [118]. This product produced a large, unidentified peak (above 1000 d.u. for just
one scan) at 16 ms. These workers made no attempt to increase the thermal stability and
decrease the hygroscopicity of the La (dihed) as this research has attempted to do.
Summary of PSPME Devices Developed In summary, the PSPME devices that were developed successfully were: PDMS (via a
chlorine-terminated route), sol-gel PDMS, and the activated glass, PDMS, and sol-gel
PDMS coated with La (dihed). The explosives standards were also considered a success
although they were not intended for extractions. The activated charcoal substitute for
carboxen was considered a success in terms of incorporating the activated charcoal into
the sol-gel PDMS and Sylgard 184 PDMS polymers, but did not enhance the detection
outcomes for the model compound TNT. Lastly, incorporation of La (dihed) into a sol-
gel network warrants continued efforts since it has implications for improving the
stability of such as successful absorbent in the extraction of 2,4-DNT and TNT, two
compounds of great interest for security applications.
Validation Experiments for Static PSPME The following are results and discussion of the experiments that were conducted to test
the capabilities of PSPME-IMS for the enhanced extraction of volatile chemical
signatures and detection as compared to fiber SPME-IMS.
This document is a research report submitted to the U.S. Department of Justice. This report has not been published by the Department. Opinions or points of view expressed are those of the author(s) and do not necessarily reflect the official position or policies of the U.S. Department of Justice.

115
Almirall, Diaz-Guerra, Holness and Furton Final Technical Report: 2006-DN-BX-K027
Performance Comparison of the SPME Fiber, PDMS, and Sol-gel PDMS PSPME Devices Using TNT as the Target Analyte
Quantitation of TNT Using Response Curves Response curves of TNT for each IMS instrument were generated and the equations of
the linear regression lines for the Ionscan 400B (equation 11) and the Itemiser 2 (equation
12) are shown below:
29.3909.1769 += xy , r2=0.9678 (Equation 11)
5.25172.1131 += xy , r2=0.9944 (Equation 12)
From the equation for the best-fit line, the amount extracted by each SPME device can be
calculated in the nanogram range.
Determination of Equilibrium Extraction Time and Recovery Since SPME is an equilibrium technique, experiments were conducted to determine the
minimum sampling time required to obtain the highest IMS signal for each SPME device.
A 10 µL spike of a 240 µg mL-1 solution of TNT was introduced into a quart-sized can
and sampled for different time intervals by each SPME device and subsequently desorbed
into the IonScan 400B IMS (for the planar geometry) or the Itemiser 2 IMS (for the fiber
geometry) to determine the equilibrium time. All sampling time increments were repeated
in triplicate, each with fresh spikes into new quart cans each time. The resulting
equilibrium curves are shown in figure 43. In figure 43A, it is evident that equilibrium is
reached in approximately two hours for the sol-gel PDMS PSPME device. The
equilibrium time for the PDMS PSPME device was reached by 40 min (figure 43B). The
PSPME devices both performed better than the fiber PDMS SPME, which required over
10 hr of sampling time to reach equilibrium as shown in figure 43C. Since 10 hr of
sampling is not practical and in order to compare the three types of SPME devices for
extraction efficiency and speed of analysis, the sampling time for the PDMS fiber was
This document is a research report submitted to the U.S. Department of Justice. This report has not been published by the Department. Opinions or points of view expressed are those of the author(s) and do not necessarily reflect the official position or policies of the U.S. Department of Justice.

116
Almirall, Diaz-Guerra, Holness and Furton Final Technical Report: 2006-DN-BX-K027
thus conservatively set at 3 hr. The speed with which the planar PDMS reached
equilibrium with the sample when compared to sol-gel PDMS PSPME can be due to the
difference in coating thickness and the sol-gel network. Sol-gel PDMS and PDMS
PSPME devices reached equilibrium with TNT in the headspace faster than the fiber
because of the increased surface area of the planar geometry. Longer sampling times are
better suited for sampling cargo containers during transport. For applications that require
short sampling times, it is important to note that sufficient sampling can be achieved at
pre-equilibrium conditions and still obtain an appreciable signal by IMS. For the
minimum sampling times in figures 43A and 43B for the sol-gel PDMS and PDMS
PSPME devices respectively, the signals for TNT obtained are above the detection limits
when solving for equation 11. Additionally, when comparing the results displayed in
figures 43A and 43B, PDMS PSPME is more efficient than sol-gel PDMS PSPME at
extracting in shorter times, yet for sol-gel PDMS PSPME, the signal is greater (13,000
d.u. versus 8,000 d.u. at their respective equilibrium times) under the same experimental
conditions. As such, PDMS PSPME would be more useful for applications that require
higher throughput while the sol-gel PDMS PSPME device is recommended for
applications that can accommodate longer sampling times.
Table 7 shows the instrumental detection for TNT if introduced into the IMS instruments
following a liquid spike with a known concentration. The Ionscan 400B instrument can
detect 30 pg and the Itemiser 2 can detect 1 ng, which is consistent with the manufacturer
specifications. The amount required for instrumental detection is much higher for the
Itemiser 2 because the desorber is a heated slot that is open to the surroundings when
compared to the desorber in the Ionscan 400B sample desorber, which is an enclosed
This document is a research report submitted to the U.S. Department of Justice. This report has not been published by the Department. Opinions or points of view expressed are those of the author(s) and do not necessarily reflect the official position or policies of the U.S. Department of Justice.

117
Almirall, Diaz-Guerra, Holness and Furton Final Technical Report: 2006-DN-BX-K027
heated port resulting in more efficient transfer. Table 7 also shows the minimum amounts
of TNT that can be spiked in a quart can (with the associated uncertainty), sampled at
equilibrium, and detected by each IMS instrument used in this study. These values are
recoveries calculated from the appropriate response curve equations (11 and 12).
Figure 43. Equilibrium Extraction Time Curves for A) Sol-gel PDMS PSPME B)
PDMS PSPME and C) PDMS SPME fiber [168]
B
A
C
This document is a research report submitted to the U.S. Department of Justice. This report has not been published by the Department. Opinions or points of view expressed are those of the author(s) and do not necessarily reflect the official position or policies of the U.S. Department of Justice.
118
Almirall, Diaz-Guerra, Holness and Furton Final Technical Report: 2006-DN-BX-K027
For those samples that contain mass loadings that are close to the instrumental limit of
detection, a large uncertainty in the amount of mass recovered is expected. The sol-gel
PDMS PSPME has a higher calculated recovery of TNT for both instruments than the
PDMS PSPME with respect to the amount initially spiked.
Since a SPME-IMS interface is available for the Itemiser 2 instrument, the minimum
amount of sample that must be spiked in a quart can in order to be detected is 25 ng.
Table 7 shows that both the fiber geometry SPME and the PDMS PSPME require a 25 ng
TNT spike in a can, yet an alert for TNT from the Itemiser 2 instrument was obtained
following the headspace extraction of only a 10 ng TNT spike in a quart can using the
planar PDMS SPME. Since the signal obtained was less than the y-intercept in the
equation from the Itemiser 2 response curve for the PDMS PSPME (equation 12), an
actual recovery could not be calculated for the spiked amount. For this same reason, in
order for the recovery of TNT by the sol-gel PDMS PSPME device using the Ionscan
400B to be reported, a spike greater than 2 ng in a can is required. Despite this, the
instrument still reports an alert for an extraction of a 2 ng spike. Interestingly, when the
same low mass (25 ng) of TNT is spiked into the quart cans for sampling with both fiber
and the planar PDMS for comparison, the recovery by the planar PDMS is enhanced by
almost a factor of 10 over the SPME fiber. In fact, both planar SPME devices afford the
user greater recoveries than fiber SPME-IMS (a consequence of the improved extraction
efficiency), an improvement since the advent of SPME-IMS, a technique that has itself
greatly improved the detection limits as compared to particle analysis [19].
This document is a research report submitted to the U.S. Department of Justice. This report has not been published by the Department. Opinions or points of view expressed are those of the author(s) and do not necessarily reflect the official position or policies of the U.S. Department of Justice.

119
Almirall, Diaz-Guerra, Holness and Furton Final Technical Report: 2006-DN-BX-K027
Table 7. Recovery of TNT Calculated from Response Curves [168]
Extraction Efficiency Experiments at Equilibrium A comparison of the extraction efficiency of all three SPME devices at their respective
equilibrium times, with detection by the Itemiser 2 instrument, was conducted and the
results are shown in figure 44. The x-axis displays the different amounts of TNT spiked
into a quart can for each extraction and the y-axis shows the amount detected by the IMS
after desorption of the particular SPME device. The range of mass of TNT spiked was
between 25 and 500 ng. In all cases, the planar sol-gel PDMS extracted more mass of the
initially spiked sample. This can be due to the greater coating thickness and the porous
sol-gel network. The PDMS PSPME-IMS response for TNT was greater than the PDMS
SPME fiber response except at the 25 ng spike. This can be attributed to the closed nature
of the sample introduction for the SPME-IMS interface as compared to the Itemiser 2
desorber that is used for the PSPME devices which is open and can lead to some loss.
The PDMS PSPME device is 1.3 times more efficient than the PDMS SPME fiber and
the sol-gel PDMS PSPME device is 3.8 times more efficient than the PDMS fiber when
just averaging the extraction efficiencies of each respective planar SPME device over the
fiber PDMS SPME for the small masses of TNT (25 ng-500 ng) spiked in the cans. There
This document is a research report submitted to the U.S. Department of Justice. This report has not been published by the Department. Opinions or points of view expressed are those of the author(s) and do not necessarily reflect the official position or policies of the U.S. Department of Justice.

120
Almirall, Diaz-Guerra, Holness and Furton Final Technical Report: 2006-DN-BX-K027
is an obvious trend for increasing extraction efficiencies for both planar devices over the
fiber geometry when more mass is available for sampling. That is a result of the 50 to 100
times surface area increase and the at least 16 times capacity increase of the planar
geometry over the fiber geometry. Thus, when sampling in real case scenarios where
much more mass is available in the headspace, the improvements over fiber SPME are
expected to be even more significant.
Figure 44. Extraction Efficiencies of the Three SPME Devices Tested for TNT [168]
Study of TNT Adsorption to Vessel Walls Since the TNT used in the previous studies was spiked directly to the metal cans, both
quart and gallon-sized cans were studied to test the effects of possible TNT adsorption to
the surface of the sampling vessels used in these studies. If there were appreciable
adsorption to the walls the effects would be noticeable from the results of extractions
from the gallon can because of its higher surface area compared to the quart can.
According to SPME theory, once equilibrium conditions are reached, the mass extracted
This document is a research report submitted to the U.S. Department of Justice. This report has not been published by the Department. Opinions or points of view expressed are those of the author(s) and do not necessarily reflect the official position or policies of the U.S. Department of Justice.

121
Almirall, Diaz-Guerra, Holness and Furton Final Technical Report: 2006-DN-BX-K027
by a SPME device would be the same regardless of the sample vessel volume. In figure
45, the results of these tests are shown. Although the vessel with smaller volume, the
quart can, does reach equilibrium faster than the gallon can, the signals obtained at
equilibrium, 2 hr versus 3 hr, are not significantly different. This means that adsorption of
TNT to the sample walls is negligible.
Figure 45. Effects of Adsorption of TNT to Vessel Walls. Conditions: 2.4 µg TNT
spike into the cans, extraction with sol-gel PDMS PSPME at room temperature until
equilibrium is reached.
Comparison of Sol-Gel PDMS PSPME and Fiber SPME for Sampling Piperonal The following are results and discussion of experiments that were conducted on the
volatile chemical signature of MDMA, piperonal, in order to determine and compare the
extraction capabilities of both the fiber and planar SPME devices. The results of the
method development for the field sampling and detection of actual MDMA drug cases by
PSPME-IMS are also discussed.
This document is a research report submitted to the U.S. Department of Justice. This report has not been published by the Department. Opinions or points of view expressed are those of the author(s) and do not necessarily reflect the official position or policies of the U.S. Department of Justice.

122
Almirall, Diaz-Guerra, Holness and Furton Final Technical Report: 2006-DN-BX-K027
SPME-IMS Sampling A vial containing a saturated headspace of piperonal was sampled in a static
configuration for various time intervals to determine what the minimum SPME sampling
time is under these conditions. Figure 46 is a plot of IMS maximum signal intensity (mV)
versus the extraction time interval. It is evident that after 30 s of sampling with the SPME
fiber there is no additional gain of signal. Furthermore, the equilibrium has been reached
between the sample (the spike of piperonal), the SPME fiber, and the headspace in the
vial. The speed at which equilibrium is reached is attributed to the high vapor pressure of
piperonal, the limited capacity of the fiber, and the linear dynamic range of the IMS
detector. The additional data point at 300 s, or 5 min, is added to further demonstrate that
when sampling beyond 30 s the analyst still obtains the maximal signal. Since the
sampling occurs in a tightly sealed system this also shows that no analyte is lost even
when sampling for extended periods of time, or in other words, the equilibrium extraction
time stays the same. It is advantageous that only 30 s of sampling is necessary for this
compound and we show by the coupling of SPME to bench-top IMS (7 s analysis time),
that this method is promising for field applications much like canine detection in terms of
total sampling and analysis time, although it is important to reiterate the sampling mode
differs between canines and SPME; canines sample the air dynamically while SPME, in
this setup was done statically in a sealed vial.
This document is a research report submitted to the U.S. Department of Justice. This report has not been published by the Department. Opinions or points of view expressed are those of the author(s) and do not necessarily reflect the official position or policies of the U.S. Department of Justice.

123
Almirall, Diaz-Guerra, Holness and Furton Final Technical Report: 2006-DN-BX-K027
Figure 46. Piperonal Extraction Time Curve [50]
The time necessary for piperonal to reach equilibrium, meaning a saturated headspace,
within the vial under these closed and static experimental conditions, was determined by
sampling at various time increments (10 s, 60 s, 480 s, and 1260 s), for the equilibrium
extraction time which was determined to be 30 s. The time for equilibrium in the vial to
be established was determined to be essentially instantaneous (figure 28). This is not
surprising considering the volatility of piperonal. Piperonal has a high vapor pressure of
1.0 mmHg at 87 ºC. To ensure this equilibrium remained constant, results for long time
increments (21 min) in relation to the time necessary to reach equilibrium were recorded
(figure 47).
This document is a research report submitted to the U.S. Department of Justice. This report has not been published by the Department. Opinions or points of view expressed are those of the author(s) and do not necessarily reflect the official position or policies of the U.S. Department of Justice.

124
Almirall, Diaz-Guerra, Holness and Furton Final Technical Report: 2006-DN-BX-K027
Figure 47. Equilibrium Time Curve for Piperonal
SPME-IMS Quantitation In order to quantitate the mass loading of piperonal on the PDMS fiber, the same static
sampling conducted for subsequent analysis by SPME-IMS is also done for analysis by
SPME-GC-MS. First a calibration curve was generated, by introducing increasing
concentrations of piperonal by liquid injection into the GC/MS then plotting the peak
area (counts) versus the mass of piperonal (ng) introduced after taking into account the
appropriate split.
The equation of the best-fit line produced (equation 13), is used for determining the mass
corresponding to a peak area obtained following any other GC-MS analysis conducted
including SPME-GC-MS.
y=285450x -34811, r2=0.9911 (Equation 13)
This document is a research report submitted to the U.S. Department of Justice. This report has not been published by the Department. Opinions or points of view expressed are those of the author(s) and do not necessarily reflect the official position or policies of the U.S. Department of Justice.

125
Almirall, Diaz-Guerra, Holness and Furton Final Technical Report: 2006-DN-BX-K027
Figure 48. A) GC-MS Response Used for B) SPME-IMS Quantitation [50]
Figure 48A is a plot showing the response by SPME-GC/MS for piperonal at each
respective sampling time with equilibrium conditions in the vial. This information is used
to calculate and plot the mass introduced into the IMS by the same sampling scheme
(Figure 48B).
This document is a research report submitted to the U.S. Department of Justice. This report has not been published by the Department. Opinions or points of view expressed are those of the author(s) and do not necessarily reflect the official position or policies of the U.S. Department of Justice.

126
Almirall, Diaz-Guerra, Holness and Furton Final Technical Report: 2006-DN-BX-K027
SPME-IMS Limit of Detection (LOD) and Linear Dynamic Range (LDR) Determinations
The method LOD was determined as the minimum amount of piperonal that produces a
signal at least the average of the blank plus three times its standard deviation. This
resulted in 2.1 ng of piperonal as the SPME-IMS LOD. The line of best fit in Figure 48B
relates to the LDR of IMS for piperonal, determined to be 2.1- 11 ng since this is the
largest range of points on the response curve (Figure 48B) where a linear correlation,
r2=0.9727, exists between mass of piperonal and SPME-IMS response.
7.2.2.4 Piperonal IMS Response Curve
Quantification of piperonal detected by IMS following absorption on each device matrix,
SPME fibers and PSPME, was enabled by the use of response curves obtained by adding
freshly prepared standard solutions onto manufacturer provided filters followed by IMS
analysis. In this study two separate complementary response curves, each for a different
product ion, monomer and dimer, served for quantitation of the detected piperonal under
the same IMS operating conditions. As the vapor concentration of the analyte increases in
the IMS ion source, a protonated monomer product ion first appears, with a
corresponding loss in the reactant ion intensity. With further increase in the analyte
concentration, a second product ion (protonated dimer) appears through a stepwise
clustering phenomenon at the expense of both the reactant ions and the monomer product
ions [17].
The monomer response curve (Figure 49A) exhibited linear regression in the range of 2-
20 ng for piperonal with a limit of detection (LOD) of 2 ng mainly due to high
background level. In positive mode and in low temperature IMS operation, the ionization
This document is a research report submitted to the U.S. Department of Justice. This report has not been published by the Department. Opinions or points of view expressed are those of the author(s) and do not necessarily reflect the official position or policies of the U.S. Department of Justice.

127
Almirall, Diaz-Guerra, Holness and Furton Final Technical Report: 2006-DN-BX-K027
of gaseous molecules is facilitated. The precision of the monomer analysis method varied
from 50% for close to the LOD concentrations to 2% for the highest concentration in this
dynamic range.
Figure 49. IMS Response Curves for the Piperonal A) Monomer and B) Dimer
Product Ions [158]
The response curve for the dimer product ions was also determined for use in the
quantification of the total detected piperonal amounts emitted from the MDMA tablets.
The response curve obtained for the dimer exhibited a logarithmic regression curve in the
range of 60-300 ng for piperonal (Figure 49B). The intensity response is expressed in
This document is a research report submitted to the U.S. Department of Justice. This report has not been published by the Department. Opinions or points of view expressed are those of the author(s) and do not necessarily reflect the official position or policies of the U.S. Department of Justice.

128
Almirall, Diaz-Guerra, Holness and Furton Final Technical Report: 2006-DN-BX-K027
logarithmic format and was previously demonstrated by Eiceman et al. for better
categorization of different molecule classes, mainly at low temperature drift tube analyses
[159].
141BMethod Development for PSPME-IMS of Piperonal Both devices, PSPME and SPME fiber, were introduced into gallon-sized cans, spiked
with 100 μL of a high concentration piperonal solution, 1000 μg ml-1 (100 μg piperonal),
for a 10 min extraction time, and analyzed immediately by IMS. The plasmagrams shown
in Figure 50 demonstrate the results obtained from headspace sampling using both
devices. The ion peak for piperonal is found at a drift time of 8.3 ms and the reduced
mobility valueof the product ion is K0=1.51 cm2V-1s-1 [156]. A significantly higher
cumulative intensity is observed for all the scans of the piperonal peak as well as for the
highest signal peak when sampling the headspace using PSPME in comparison to the
SPME fiber. At higher concentrations, the observed decrease in peak intensity for the
monomer shown for PSPME corresponds with the formation of a proton-bound dimer
ion. Both the higher monomer response as well as the formation of a dimer measured by
the PSPME device confirms the higher piperonal extraction efficiency over the SPME
fiber.
This document is a research report submitted to the U.S. Department of Justice. This report has not been published by the Department. Opinions or points of view expressed are those of the author(s) and do not necessarily reflect the official position or policies of the U.S. Department of Justice.

129
Almirall, Diaz-Guerra, Holness and Furton Final Technical Report: 2006-DN-BX-K027
Figure 50. Piperonal Detected Following Extraction with A) the PSPME Device and
B) the SPME Fiber [178]
Ideally, spiking a known mass of analyte dissolved in a volatile solvent inside a closed
container can produce a headspace with the maximum concentration being the mass of
the spiked compound divided by volume of the headspace but in practice, lower
concentrations should be expected. Uncontrolled processes of unspecific
adsorption/absorption to surfaces are expected to decrease the available amount of the
spike. The experimental parameters can influence the distribution coefficient of the
analyte fraction absorbed or remaining in the vapor. Sampling of the headspace created
by spiking standard mixtures (including a solvent) with SPME likely resulted in solvent
molecules adsorbing/absorbing into the fiber. The volatility of thetarget compound and
solvent, the sampling time and/or the sampling temperature may also result in some
This document is a research report submitted to the U.S. Department of Justice. This report has not been published by the Department. Opinions or points of view expressed are those of the author(s) and do not necessarily reflect the official position or policies of the U.S. Department of Justice.
130
Almirall, Diaz-Guerra, Holness and Furton Final Technical Report: 2006-DN-BX-K027
displacement of the target compounds by solvent molecules thus decreasing the
extraction efficiency of a specific target analyte. When considering the capacity of the
specific SPME device, greater solvent effects are encountered when sampling with the
fiber compared to the PSPME device. In the case of sampling MDMA tablets from an
actual case with the PSPME device, solvent effects can be minimized when compared to
sampling dilute standard solutions of piperonal, but may be replaced by other
overwhelming volatile components emitted from the MDMA tablets depending on
manufacturing procedures for the illicit drug.
The mass detected by IMS versus extraction time was tested and evaluated by sampling
lower concentrations of piperonal, 100 μL of a 100 μg mL-1 solution (10 μg piperonal),
using both devices. The devices were allowed to sample the vapors for different
extraction times immediately following the spike of piperonal into the can that ranged
from 3 to 10 min. The results obtained are demonstrated in Figure 51 and represent the
equilibrium curve for piperonal. Overall, a consistent increase in the intensity response
was measured with both devices along the complete time range tested for extraction. The
increasing trend in responses with time can be explained either by built-up vapor
concentration inside the cans and/or gradual vapor absorption onto the devices. However,
at all times tested, the PSPME device resulted in higher cumulative response intensity in
comparison to the SPME fibers. Using the experimental conditions described above, in
the shortest extraction time (3-4 min), the detection of piperonal was only achieved when
the PSPME device was used. Identical measurements with a SPME fiber yielded no
response, indicating lower extraction capability of the SPME fiber. The signal measured
on PSPME at extraction times longer than 10 min was outside the linear dynamic range
This document is a research report submitted to the U.S. Department of Justice. This report has not been published by the Department. Opinions or points of view expressed are those of the author(s) and do not necessarily reflect the official position or policies of the U.S. Department of Justice.

131
Almirall, Diaz-Guerra, Holness and Furton Final Technical Report: 2006-DN-BX-K027
for the monomer product ion. The decrease in the response peak at 12 min extraction time
was accompanied by the formation of the dimer product ion peak. The increase in the
response intensity using both devices showed similar slope at the extraction time range
of4 min to 10 min. These results suggest similar profile absorption kinetics on both
devices under these experimental conditions. The overall amounts of piperonal detected
were very low with maximum recovery of 0.3% of the original mass spiked for a 10 min
PSPME extraction. Considering an equilibrium process with SPME and the volatility of
piperonal, this outcome is not surprising and could be attributed also to one or more of
the following: (a) high affinity of the piperonal molecules to the PSPME coating
followed by an inefficient desorption stage at the IMS inlet (b) displacement of the
piperonal molecules from the coating by solvent molecules (c) non-specific adsorption of
piperonal onto the container surface; (d) preference of piperonal molecules to remain in
the headspace rather than partition into the coating or in other words, piperonal may have
a small Kfh (partition coefficient between the SPME phase and the headspace phase) in
this experimental setup. In regards to assumption (a), it has been experienced that
piperonal samples extracted by the PSPME device produce a signal even at the second
thermal desorption, although smaller than the first, while the piperonal on the fiber is
completely desorbed after the first introduction into the IMS inlet. This is attributed to
the higher mass loadings on the PSPME device as compared to the fiber SPME. The
amounts of piperonal detected for the second desorption are not demonstrated in Figure
51 since the evaluation of PSPME device as a PSPME-IMS coupled method was planned
to follow the recommended operating procedure of the instrument with one desorption
only.
This document is a research report submitted to the U.S. Department of Justice. This report has not been published by the Department. Opinions or points of view expressed are those of the author(s) and do not necessarily reflect the official position or policies of the U.S. Department of Justice.

132
Almirall, Diaz-Guerra, Holness and Furton Final Technical Report: 2006-DN-BX-K027
Figure 51. Equilibrium Extraction Curves for Piperonal by the PSPME Device and
the SPME Fiber [178]
Table 8 lists the mass detected by IMS after extraction using both devices when sampling
very low concentrations of piperonal close to IMS detection limits. A volume of 100 μL
of 50 μg mL-1 and 20 μg mL-1 of piperonal solution (5 μg and 2 μg piperonal) were
spiked into gallon-sized cans for 6 min of extraction time. Under these conditions, no
piperonal alert could be achieved using the SPME fibers for sampling for either
concentration tested. In contrast, using PSPME devices recorded positive piperonal alerts
for all measurements. An average amount of 4 ng piperonal was detected following
absorption onto the PSPME phase in a 6 min extraction for a 5 μg spike of the compound
of interest. The absorbed average amount (n=3) was found to be twice the amount of the
method LOD's. This result is also correlated to the absorbed average amount, 4.7 ng,
measured for 10 μg piperonal in a 3 min extraction, as presented in Figure 51. Similar
average amounts measured in both experiments demonstrates that the equilibrium
concentration had been reached in less than 3 min, leaving the extraction time as the
dominant parameter for increased recovery.
This document is a research report submitted to the U.S. Department of Justice. This report has not been published by the Department. Opinions or points of view expressed are those of the author(s) and do not necessarily reflect the official position or policies of the U.S. Department of Justice.

133
Almirall, Diaz-Guerra, Holness and Furton Final Technical Report: 2006-DN-BX-K027
Table 8. Extraction Efficiencies Measured by PSPME Device and SPME Fiber Inside Gallon-Sized Cans Containing 2 μg and 5 μg of Piperonal [178]
PSPME device SPME fiber Mass of piperonal spiked (µg) 2 5 2 5
Mass of piperonal detected (ng) 1.5±1.1 4±0.4 ND* ND* *ND- Not Detectable
The amount detected under the same conditions, following absorption from a 2 μg spike
of piperonal, was slightly below the LOD analysis method. Extrapolated quantification at
this concentration range yielded an average sampled amount of only 1.5 ng piperonal on
the PSPME phase. Nevertheless, this amount generated a signal significantly greater than
the PSPME blank samples, mainly the result of lower background levels attained for the
PSPME device than for IMS filters which were used for piperonal response curves. The
repeatability between the 3 replicate experiments was found to be low as expected in
correlation with the measured deviation determined for the LOD concentration of the
IMS analysis method.
Theoretically, from the complete evaporation of a spike without any kind of unspecific
adsorption processes, the maximum piperonal concentration inside of a gallon-volume
container can be calculated. Practically, the vapor concentration is expected to be much
lower. Applying this conservative calculation, the LOD's for PSPME-IMS and SPME-
IMS could both be estimated from the minimal theoretical concentration, which was
possible to be measured by each device. A calculated LOD of 2.5 μg L-1 obtained for the
SPME-IMS complete method, while a significantly lower LOD of 0.5 μg L-1 was
obtained for the PSPME-IMS novel method. Both LOD's were determined by the 6 min
extraction time measurements.
This document is a research report submitted to the U.S. Department of Justice. This report has not been published by the Department. Opinions or points of view expressed are those of the author(s) and do not necessarily reflect the official position or policies of the U.S. Department of Justice.

134
Almirall, Diaz-Guerra, Holness and Furton Final Technical Report: 2006-DN-BX-K027
This section summarized a stepwise evaluation of the PSPME-IMS method performance
for the detection of piperonal vapors emitted from standard solutions. At all stages, the
PSPME-IMS technique showed a strong advantage over SPME-IMS in terms of
enhanced capacity and higher sensitivity.
Sampling Real MDMA Cases at a Local Crime Laboratory The PSPME-IMS method was used to presumptively identify MDMA tablets from real
cases using piperonal as the target odor signature for detection. In the headspace above
MDMA tablets, although no additional solvents were used in the dilution, other possible
volatile interferences, as well as trace amounts of processing solvents may still be present
following synthesis. In contrast to the finite source of piperonal vapors generated from
dilute solutions of the analyte in a volatile solvent, MDMA tablets can be considered as
continuous vapor source of piperonal during timed experimental measurements.
A preliminary experiment with MDMA tablets aimed to determine the equilibrium time,
the minimum extraction time that is required to obtain the highest extraction efficiency,
was done. This experiment was conducted by introducing five MDMA tablets originating
from the same case, of 1.5 g total average weight, to each quart can for 48 h to
equilibrate. The results are demonstrated in Figure 52. The x-axis displays the extraction
times, from 30 seconds up to 15 min, and the y-axis demonstrates the cumulative amount
detected by the IMS. Two peaks had been analyzed for piperonal at these experiment
conditions at all extraction times. The earlier peak, at 8.3 seconds drift time, is
determined to be the monomer product ions and the delayed peak, at 9.8 seconds drift
time, represents the dimer product ion. Consistent detection of the dimer product ions at
all extraction time points signaled high extraction efficiency for these conditions. The
This document is a research report submitted to the U.S. Department of Justice. This report has not been published by the Department. Opinions or points of view expressed are those of the author(s) and do not necessarily reflect the official position or policies of the U.S. Department of Justice.

135
Almirall, Diaz-Guerra, Holness and Furton Final Technical Report: 2006-DN-BX-K027
steep short increase from 30 seconds to 1 min stabilized at a constant response for the
monomer product ions for all extraction time measurements, from 1 min up to 12 min,
indicating its saturated detection level. At 15 min extraction time a small decrease in
efficiency was measured. However, the initial small dimer product ions detected already
for the minimal extraction time of 30 seconds, was followed by consistent increments
with the lengthening of the extraction times, yielding for 15 min the highest response. It
could be assumed that extraction times longer than 15 min will yield higher extraction
efficiencies. Despite this, an extraction time of 15 min was chosen as the extraction time
for all MDMA tablets experiments ahead, in order to enable large-scale measurements in
a reasonable time duration.
The extraction efficiency of the PSPME device was evaluated versus tablets quantity.
Different quantities of MDMA tablets 10, 5, 3 and 1 tablet, all originating from the same
case, were added to the quart cans and sealed for 24 h to equilibrate. The headspace
generated inside was sampled by suspending the PSPME devices, and for comparison the
SPME fibers, for 15 minute extraction times. The results are illustrated in Figure 53.
This document is a research report submitted to the U.S. Department of Justice. This report has not been published by the Department. Opinions or points of view expressed are those of the author(s) and do not necessarily reflect the official position or policies of the U.S. Department of Justice.

136
Almirall, Diaz-Guerra, Holness and Furton Final Technical Report: 2006-DN-BX-K027
Figure 52. Extraction Time Curves Generated Using Confirmed MDMA Tablets
[178]
Figure 53. Response v. Number of MDMA Tablets Sampled [178]
Detectable levels of piperonal from the headspace generated by only 1 tablet were
achieved by extracting with either device, with higher amounts detected from higher
quantities of tablets. Extraction by either device yielded dimer product ions accompanied
This document is a research report submitted to the U.S. Department of Justice. This report has not been published by the Department. Opinions or points of view expressed are those of the author(s) and do not necessarily reflect the official position or policies of the U.S. Department of Justice.
137
Almirall, Diaz-Guerra, Holness and Furton Final Technical Report: 2006-DN-BX-K027
by monomer product ions. However, overall consistently higher extraction efficiencies
were measured with the PSPME device than for the SPME fibers under all experimental
conditions, both for the monomer and dimer product ions. Saturated levels of monomer
productions were analyzed following absorption by PSPME device by sampling the
headspace generated from only 1 tablet, while with SPME fibers, saturated monomer
product ion levels were observed with five MDMA tablets under the same experimental
conditions. Despite the steep increase in the dimer product ions detected by sampling
with the PSPME device from 1 and 3 tablets, the response continued to increase
moderately when sampling 5 and 10 tablets, demonstrating the high capacity of the
PSPME device. Under the same conditions for the SPME fibers, the increased response
detected for the dimer product ions from 1 to 5 tablets was followed by a significant
decrease in signal when sampling the headspace generated from 10 tablets. Despite the
high concentrations of piperonal measured for 1 and 3 tablets, it was determined that for
further experiments 5 tablets would be used in each can just in case the emitting source
(the seized tablets) would contain lower amounts of MDMA or in case un-fresh samples
were encountered.
The PSPME-IMS method was tested for analysis of suspected MDMA tablets, with
evidence seized from six different real cases scenarios, at a local crime laboratory. The
results obtained by both devices for each suspected case are demonstrated in Figure 54.
Sampling and IMS analysis of the headspace generated inside the cans, each from a
different suspected case, using PSPME and SPME fibers, both indicated positive for
MDMA tablets for cases 3, 4, 5 and 6. Even though high responses of monomer and
dimer product ions were detected by both devices for these cases, even higher response
This document is a research report submitted to the U.S. Department of Justice. This report has not been published by the Department. Opinions or points of view expressed are those of the author(s) and do not necessarily reflect the official position or policies of the U.S. Department of Justice.

138
Almirall, Diaz-Guerra, Holness and Furton Final Technical Report: 2006-DN-BX-K027
for the dimer product ions were obtained with the PSPME devices over the fibers,
demonstrating its higher extraction capacity. Moreover, higher repeatability between
replicate measurements obtained with PSPME devices for all cases than with the
commercial SPME fibers.
Figure 54. Blind Case Study Results for A) Monomer and B) Dimer Product Ions
[178]
No piperonal vapors were detected in the headspace generated from case 2, using either
device for sampling. The forensic examiner later confirmed from GC/MS data that case 2
was negative for MDMA. No piperonal vapors were extracted from the headspace
generated by case 1 tablets when only using SPME fibers as the sampling device.
This document is a research report submitted to the U.S. Department of Justice. This report has not been published by the Department. Opinions or points of view expressed are those of the author(s) and do not necessarily reflect the official position or policies of the U.S. Department of Justice.

139
Almirall, Diaz-Guerra, Holness and Furton Final Technical Report: 2006-DN-BX-K027
Following these SPME fiber results, the suspected tablets of case 1 could be considered
as a negative MDMA case. Alternatively, sampling case 1 under the same conditions as
the fiber, by using the novel PSPME device, enabled clear detection of piperonal vapors.
Even though lower amounts were detected for this case compared to the four other
positive cases, consistent undeniable IMS peaks of the monomer product ions were
obtained, confirming these tablets as a case positive for MDMA. Detection using the
PSPME-IMS method for all tested cases corresponded with the crime laboratory’s GC-
MS data in this blind study test. Sample preparation followed by GC-MS analysis
according to protocols performed by the crime laboratory confirmed the suspected tablets
from all the cases, excluding case 2, were positive for MDMA. Case 2 was the only case
confirmed as negative for MDMA by crime laboratory. Case 1 according to GC-MS
analysis had a significantly lower concentrations of MDMA in the tablets analyzed
compared to tablets from the positive cases 3 to 6. This is significant because, although
SPME-IMS is a proven sensitive method for the detection of piperonal, if sampling had
only been done with the SPME fiber, then case 1 would have been incorrectly deemed
negative. This highlights the capabilities of the PSPME device in even the most difficult
of cases.
Performance of PSPME for Other Volatile Chemical Signatures Other volatile chemical signatures that have been identified as emanating from explosives
were also sampled by sol-gel PDMS PSPME. Of the compounds studied, only
cyclohexanone, an odor signature of RDX, was analyzed in the positive mode. The rest of
the compounds: 2,4-DNT (an odor signature of TNT and cast explosives) and 4-NT (a
taggant) were analyzed in the negative polarity. Figure 55 displays plasmagrams that
This document is a research report submitted to the U.S. Department of Justice. This report has not been published by the Department. Opinions or points of view expressed are those of the author(s) and do not necessarily reflect the official position or policies of the U.S. Department of Justice.

140
Almirall, Diaz-Guerra, Holness and Furton Final Technical Report: 2006-DN-BX-K027
show that the PSPME device is capable of absorbing a sufficient amount of the analytes
of interest for detection by IMS (2,4-DNT, 4-NT, and cyclohexanone, respectively).
These plasmagrams represent the segment in the analysis with the highest signal for the
target analytes. For figures 55 (A and B), the peak at 11.3 ms is the calibrant, 4-
nitrobenzonitrile (K0= 1.7 cm2V-1s-1). The peaks from the reactant hexachloroethane are
at 7.1 ms and 8.1 ms (K0= 2.6 cm2V-1s-1and K0= 2.3 cm2V-1s-1, respectively) and the
oxide ion peak is at 8.4 ms (K0= 2.2 cm2V-1s-1). The peaks to the left of the calibrant peak
are present before IMS analysis begins, but are depleted during the analysis and peak
formation. In figure 55A, the 2,4-DNT signal (K0= 1.6 cm2V-1s-1) has a drift time of 11.8
ms. Figure 55B shows the plasmagram for the extraction of 4-NT, with a peak differing
from the blank at 12.8 ms. In figure 55C, the peak at 9.6 ms in the positive polarity is the
reactant ion peak nicotinamide (K0= 1.9 cm2V-1s-1). It is also interesting to note that for
just a 1 hr extraction of such a highly volatile compound as cyclohexanone (4.35 Torr @
25 °C, (K0= 1.5 cm2V-1s-1 )) for which the smallest amount (10 µg) in a can is sampled, a
detectable peak is found at 11.7 ms (figure 55C).
This document is a research report submitted to the U.S. Department of Justice. This report has not been published by the Department. Opinions or points of view expressed are those of the author(s) and do not necessarily reflect the official position or policies of the U.S. Department of Justice.
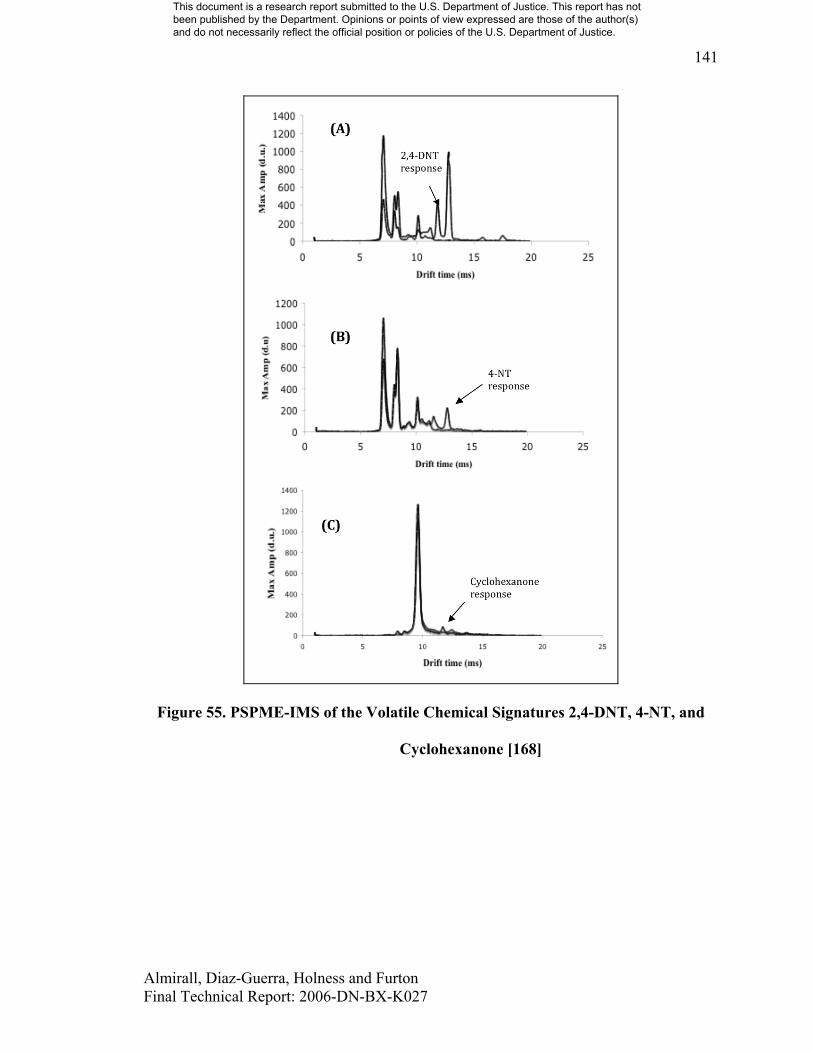
141
Almirall, Diaz-Guerra, Holness and Furton Final Technical Report: 2006-DN-BX-K027
Figure 55. PSPME-IMS of the Volatile Chemical Signatures 2,4-DNT, 4-NT, and
Cyclohexanone [168]
This document is a research report submitted to the U.S. Department of Justice. This report has not been published by the Department. Opinions or points of view expressed are those of the author(s) and do not necessarily reflect the official position or policies of the U.S. Department of Justice.

142
Almirall, Diaz-Guerra, Holness and Furton Final Technical Report: 2006-DN-BX-K027
Performance of PSPME for the Smokeless Powder Volatile Chemical Signatures Smokeless Powder Volatile Chemical Signature IMS Response Curves
Response curves of the smokeless powder odor signatures, DPA, 2,4-DNT, and EC were
generated for quantitation following PSPME-IMS analysis. The response curve for DPA
is shown in figure 56.
Figure 56. DPA Response Curve
Generation of the response curves for 2,4-DNT (figure 57) and EC (figure 59) proved to
be more complicated. The only way to produce a response curve for 2,4-DNT was by
using hexane, a solvent that is much more volatile than acetonitrile and is thus more
compatible with the volatility of 2,4-DNT. In this manner, both hexane and 2,4-DNT are
vaporized nearly at the same time rather than the 2,4-DNT being volatilized prior to the
solvent in which case less and inconsistent amounts of 2,4-DNT arrive at the detector.
This is a result of the 2,4-DNT desorbing only until later scans such that the full amount
of 2,4-DNT was not detected before analysis was complete.
This document is a research report submitted to the U.S. Department of Justice. This report has not been published by the Department. Opinions or points of view expressed are those of the author(s) and do not necessarily reflect the official position or policies of the U.S. Department of Justice.

143
Almirall, Diaz-Guerra, Holness and Furton Final Technical Report: 2006-DN-BX-K027
Figure 57. 2,4-DNT Response Curve
Since it was determined that solvent affected 2,4-DNT IMS analysis, a study was
conducted on three likely IMS compatible solvents that ranged in boiling point and
polarity. The results of the maximum and cumulative amplitudes for two mass loadings
of 2,4-DNT in different solvents on a manufacturer provided filter is shown in figure 58.
The highest maximum amplitude is indicative of the best desorption profiles, since it is
amplitude of the scan with highest signal that alerted for 2,4-DNT out of all the other
scans. The cumulative amplitude is the sum of all the scans in which the compound
alerted during IMS analysis and indicates the highest total mass of the compound being
detected. It is clear in figure 58, that analysis of 2,4-DNT in hexane provides the highest
and most reproducible maximum and cumulative signals at both concentrations.
This document is a research report submitted to the U.S. Department of Justice. This report has not been published by the Department. Opinions or points of view expressed are those of the author(s) and do not necessarily reflect the official position or policies of the U.S. Department of Justice.

144
Almirall, Diaz-Guerra, Holness and Furton Final Technical Report: 2006-DN-BX-K027
Figure 58. IMS Analysis: 1 µl of 42 and 250 ppm 2,4-DNT (n=5) in Different
Solvents Spiked on Manufacturer Provided Filters
The response curve of EC (figure 59) was also problematic due to the small linear
dynamic range for detection of this compound by IMS, between 0.5- 1 ng.
Figure 59. EC Response Curve
This document is a research report submitted to the U.S. Department of Justice. This report has not been published by the Department. Opinions or points of view expressed are those of the author(s) and do not necessarily reflect the official position or policies of the U.S. Department of Justice.

145
Almirall, Diaz-Guerra, Holness and Furton Final Technical Report: 2006-DN-BX-K027
Determination of Equilibrium Extraction Time The determination of equilibrium extraction times for the smokeless powder volatile
chemical signatures was done by sampling spikes of 10 µL of 100 µg mL-1 DPA in
acetonitrile, and spikes of 10 µL of 25 µg mL-1 EC in their respective quart cans using
PSPME as the extraction media for different time intervals. The equilibrium extraction
curve was impossible to generate for 2,4-DNT using PSPME since is absorbed so
strongly to the SPME phase that more than 6 desorptions into IMS were required in order
to obtain a blank. The sum of these desorptions did not seem a valid method of
quantitation since additional loss to the surrounding environment was likely in between
desorptions. This was exacerbated by the fact that the slide remained hot in between each
thermal desorption and uncontrolled loss of analyte could be assumed. Therefore, the
equilibrium curves for only EC and DPA are shown in figure 60. After 30 min of
sampling, equilibrium is reached for EC while DPA requires about 1 hr.
This document is a research report submitted to the U.S. Department of Justice. This report has not been published by the Department. Opinions or points of view expressed are those of the author(s) and do not necessarily reflect the official position or policies of the U.S. Department of Justice.

146
Almirall, Diaz-Guerra, Holness and Furton Final Technical Report: 2006-DN-BX-K027
Figure 60. Equilibrium Curves for EC and DPA
Sampling of Unburned Smokeless Powders Four brands of smokeless powders were sampled statically in a closed system at room
temperature with the PSPME in order to target the volatile chemical signature DPA. The
results of the mass of DPA detected from the headspace of the smokeless powders by
PSPME-IMS are shown in figure 61. They were calculated according to the response
curve shown in figure 56. Static sampling occurred for only 1 hr from the headspace
generated from 100 mg during that time in a quart can. The only powder that did not alert
to DPA was IMR 4198 although it has been reported that this powder contains DPA from
SPME fiber-GC-MS data [59]. These experiments were done of 100 mg of the powders
in a 15 mL vial as opposed to a quart-sized can, allowed to equilibrate then sampling took
place. These experiments described herein were intended for the rapid extraction and
This document is a research report submitted to the U.S. Department of Justice. This report has not been published by the Department. Opinions or points of view expressed are those of the author(s) and do not necessarily reflect the official position or policies of the U.S. Department of Justice.

147
Almirall, Diaz-Guerra, Holness and Furton Final Technical Report: 2006-DN-BX-K027
detection of volatile chemical signatures from larger volumes. Had a comparable
experiment been done, it is likely that IMR 4198 would have alerted resulting in even
higher mass detected compared to SPME-IMS, by virtue of the higher capacity of the
PSPME device.
Figure 61. Mass Detected of DPA from Smokeless Powders Using PSPME-IMS
Figure 62. IMS Plasmagram Following PSPME Sampling of Red Dot
This document is a research report submitted to the U.S. Department of Justice. This report has not been published by the Department. Opinions or points of view expressed are those of the author(s) and do not necessarily reflect the official position or policies of the U.S. Department of Justice.

148
Almirall, Diaz-Guerra, Holness and Furton Final Technical Report: 2006-DN-BX-K027
Smokeless Powder
In figure 62, the peak at 9.6 ms in the positive polarity is the reactant ion peak
nicotinamide (K0= 1.9 cm2/Vs). This plasmagram shows the detection of two compounds,
DPA and EC, from Red Dot smokeless powder. This is only powder of the four that were
studied that has been reported to contain both these compounds by GC-MS data [59]. The
fact that both peaks were seen in IMS, with considerable signals, has implications for the
multi-channel detection of smokeless powders by PSPME-IMS.
PSPME Static Sampling of TNT from a Large Volume Vessel Figure 63 shows the 3-D plasmagram of the extraction of TNT from (~2 g) Pentolite in a
large volume area, a sealed hood, at room temperature. Pentolite contains 50:50 PETN:
TNT, therefore the maximum amount of TNT available for extraction was 1 g. The
introduction of the PSPME sampling device and the explosive took place at the same
time so there was no headspace built up prior to PSPME sampling. The sampling took
place for 24 hr and 2.96 ng of TNT were detected by IMS. The circled portion in figure
63 represents all the scans that contained peaks for TNT. The cumulative amplitude was
converted to this mass of TNT detected by the response curve listed in equation 11.
Figure 63. 3-D IMS Plasmagram for the Static Large Volume Sampling of TNT
This document is a research report submitted to the U.S. Department of Justice. This report has not been published by the Department. Opinions or points of view expressed are those of the author(s) and do not necessarily reflect the official position or policies of the U.S. Department of Justice.

149
Almirall, Diaz-Guerra, Holness and Furton Final Technical Report: 2006-DN-BX-K027
The results of these experiments provide motivation for the development of a PSPME
device that allows dynamic sampling. In this manner, the explosive would be detected in
shorter sampling times since mass transfer would be aided by fluid flow, making the
sampling of large volume containers for contraband by sampling volatile chemical
signatures feasible.
Comparison of Planar La (dihed) SPME Devices with Control Planar Sol-gel and PDMS Devices for the Extraction of TNT and 2,4-DNT
The following includes results and discussion of experiments using La (dihed) coated
PSPME devices aimed at comparing the extraction and aging capabilities resulting from
the added coating.
Aging Study Since the ability of a sampling device to retain absorbed analyte until it is analyzed is
especially important for field applications, experiments were conducted to test all the
available PSPME devices. These results are shown in figure 64.
For the detection of TNT, the control + La (dihed) PSPME showed the best desorption
characteristics since it produced the highest maximum amplitude (data not shown). This
is not surprising since the analyte only has to be desorbed from the La (dihed) layer not
an additional sorbent. Furthermore, in figure 44, the La (dihed) + sol-gel PDMS PSPME
device retained 32% of the TNT after 30 min aging. For 2,4-DNT, La (dihed) + sol-gel
PDMS retained 23% after 30 min aging. It is interesting to note that, without the La
(dihed) coating, the absorbed 2,4-DNT and TNT were lost completely from the plain sol-
gel PDMS and PDMS PSPME devices after only 30 min of aging. This makes the case
for using La (dihed) as a coating to improve retention by PSPME.
This document is a research report submitted to the U.S. Department of Justice. This report has not been published by the Department. Opinions or points of view expressed are those of the author(s) and do not necessarily reflect the official position or policies of the U.S. Department of Justice.

150
Almirall, Diaz-Guerra, Holness and Furton Final Technical Report: 2006-DN-BX-K027
Figure 64. Results for the Aging of 2,4-DNT and TNT
Coating Study The next study was conducted to determine the best coating parameters for La (dihed) on
sol-gel PDMS and PDMS PSPME devices. The results of the extraction and immediate
This document is a research report submitted to the U.S. Department of Justice. This report has not been published by the Department. Opinions or points of view expressed are those of the author(s) and do not necessarily reflect the official position or policies of the U.S. Department of Justice.

151
Almirall, Diaz-Guerra, Holness and Furton Final Technical Report: 2006-DN-BX-K027
analysis of 2,4-DNT and TNT by sol-gel PDMS coated with La (dihed) with varying
conditions of concentration and dipping time are shown in figure 65. The results for the
same coating parameters of La (dihed) on PDMS are shown in figure 66.
For the concentration effect of La (dihed) on sol-gel PDMS, the highest concentration
300 mg provided the best response for both analytes. In conducting these experiments, a
curious result occurred. By dipping the control sol-gel PDMS PSPME device in MeOH
for 1 hr, there is an even greater extraction efficiency obtained than by using La (dihed).
This benefit is lost when dipping in methanol for 3 hr. For the coating time effect, by
dipping for 1hr and patting the slide with a tissue, the highest response for 2,4-DNT, even
considering the concentration effect and the effect of dipping in methanol, was obtained.
This could be since by patting the slide, the LA (dihed) particles were adhered better to
the sol-gel coating below and makes the case for incorporating sol-gel and La (dihed) in
situ.
For TNT the spin coated results are missing since this slide broke. The results do not
demonstrate enough justification for coating La (dihed) onto PDMS for immediate
analysis since the control PDMS provides even greater response for 2,4-DNT, or nearly
equal in the case of TNT. For both substrates, sol-gel PDMS and PDMS, and the analytes
2,4-DNT and TNT, shorter dipping time increased extraction efficiency.
This document is a research report submitted to the U.S. Department of Justice. This report has not been published by the Department. Opinions or points of view expressed are those of the author(s) and do not necessarily reflect the official position or policies of the U.S. Department of Justice.

152
Almirall, Diaz-Guerra, Holness and Furton Final Technical Report: 2006-DN-BX-K027
Figure 65. La (dihed) on Sol-gel PDMS Coating Parameter Effects on the Extraction
and Detection of 2,4-DNT and TNT
This document is a research report submitted to the U.S. Department of Justice. This report has not been published by the Department. Opinions or points of view expressed are those of the author(s) and do not necessarily reflect the official position or policies of the U.S. Department of Justice.

153
Almirall, Diaz-Guerra, Holness and Furton Final Technical Report: 2006-DN-BX-K027
Figure 66. La (dihed) on PDMS Coating Parameter Effects on the Extraction and
Detection of 2,4-DNT and TNT
It also seems in both La (dihed) coated sol-gel PDMS and PDMS, for the extraction of
both analytes, higher La (dihed) concentration increases affinity. It is difficult to conclude
if reusing the La (dihed) solution for dipping is acceptable. This parameter was tested
This document is a research report submitted to the U.S. Department of Justice. This report has not been published by the Department. Opinions or points of view expressed are those of the author(s) and do not necessarily reflect the official position or policies of the U.S. Department of Justice.

154
Almirall, Diaz-Guerra, Holness and Furton Final Technical Report: 2006-DN-BX-K027
since it would be beneficial, but it is known that sol solutions cannot be reused. Dipping
the PDMS in methanol for 1 hr did not damage the slide’s absorptive properties, but a
loss in extraction efficiency after dipping for 3 hr in methanol is evident. Spin coating of
a 1 ml solution of La (dihed) over the PDMS PSPME device provided enhancement in
the extraction of 2,4-DNT and TNT, but the same was not true for the La (dihed) spin
coated on the sol-gel PDMS PSPME device. From all of these results the
recommendations for coatings with La (dihed) are as follows: La (dihed) solution should
be used in higher concentrations, dipping times should be shorter and spin coating is a
feasible option for coating La (dihed) on sol-gel PDMS PSPME devices.
Under these conditions in which single component standard solutions of the targeted
analyte were sampled, a large enhancement in recovery is not observed when using La
(dihed) coated sol-gel PDMS PSPME devices as compared to uncoated sol-gel PDMS
PSPME. Despite this, it is expected that in real case scenarios and in future experiments
where interferences will be present, recovery and detection capabilities will be enhanced
when using the selective coating La (dihed) as it will attract Lewis base analytes (our
targeted compounds 2,4-DNT and TNT for example) preferentially.
Development of Dynamic PSPME The development of dynamic PSPME was enabled mainly by the selection of glass fiber
filters (G6, Fisherbrand, Pittsburgh, PA) as the substrates, as opposed to the glass slides
used in the static PSPME devices. These glass fiber filters have a reported temperature
limit of 500 °C by the manufacturer, which is well above the maximal IMS desorption
temperatures of 300 °C. The substrate surface withstood the corrosive activation
procedure, unlike other candidate substrates like the fiberglass screen in figure 67, and
This document is a research report submitted to the U.S. Department of Justice. This report has not been published by the Department. Opinions or points of view expressed are those of the author(s) and do not necessarily reflect the official position or policies of the U.S. Department of Justice.

155
Almirall, Diaz-Guerra, Holness and Furton Final Technical Report: 2006-DN-BX-K027
was covalently bound to a sol-gel PDMS solution. By spin-coating the glass fiber filters,
not only was the coating solution spread by centrifugal forces, but it was also absorbed
throughout the thickness of the glass fiber filter. This sol–gel PDMS coating was
previously used as the extraction phase of static PSPME because of its high thermal
stability and strong bonding of the polymer to the surface resulting in a longer lifetime of
the extraction device. Additionally, the sol-gel nanoparticles afforded additional surface
area beyond simply changing the geometry from a fiber to a planar configuration.
Figure 67. Fiberglass Screen Exposed to Various Corrosive Procedures
Coating Method Development The spin program in the coating procedure was optimized to be 1 mL of sol-gel PDMS
solution statically deposited onto the prepared substrate and spinning at 1000 r.p.m. for 1
min. The tested spin speeds were 2000 rpm, 1000 rpm, and 200 rpm.
The final PSPME devices weighed 0.1472 g, 0.1594g, and 0.2205 g, respectively. This is
as expected because with a slower spin speed more of the coating solution remains on the
This document is a research report submitted to the U.S. Department of Justice. This report has not been published by the Department. Opinions or points of view expressed are those of the author(s) and do not necessarily reflect the official position or policies of the U.S. Department of Justice.

156
Almirall, Diaz-Guerra, Holness and Furton Final Technical Report: 2006-DN-BX-K027
substrate due to the lessening of centrifugal forces. The SEM images confirmed an
increased amount of sol-gel nanoparticles on the product resulting from slower spin
speeds. Figure 68 show SEM images of a control experiment for this question. Sol-gel
PDMS was deposited into an Al stub and the glass filter was dipped in the sol solution.
These represent a spin= 0 rpm data point. The results show a high concentration of
micron-sized particles on both substrates.
Figure 68. SEM Images of Sol-gel PDMS on Different Substrates: a) 10 uL sol
solution deposited on Al stub b) prepared glass fiber filter substrate dipped in sol-
solution 1 min.
Figure 69 includes the SEM images of prepared glass fiber filters coated under the
various spin programs. It is clear that with increasing spin speed there is a loss of the
nanoparticles and there is even a reduction in their size.
This document is a research report submitted to the U.S. Department of Justice. This report has not been published by the Department. Opinions or points of view expressed are those of the author(s) and do not necessarily reflect the official position or policies of the U.S. Department of Justice.
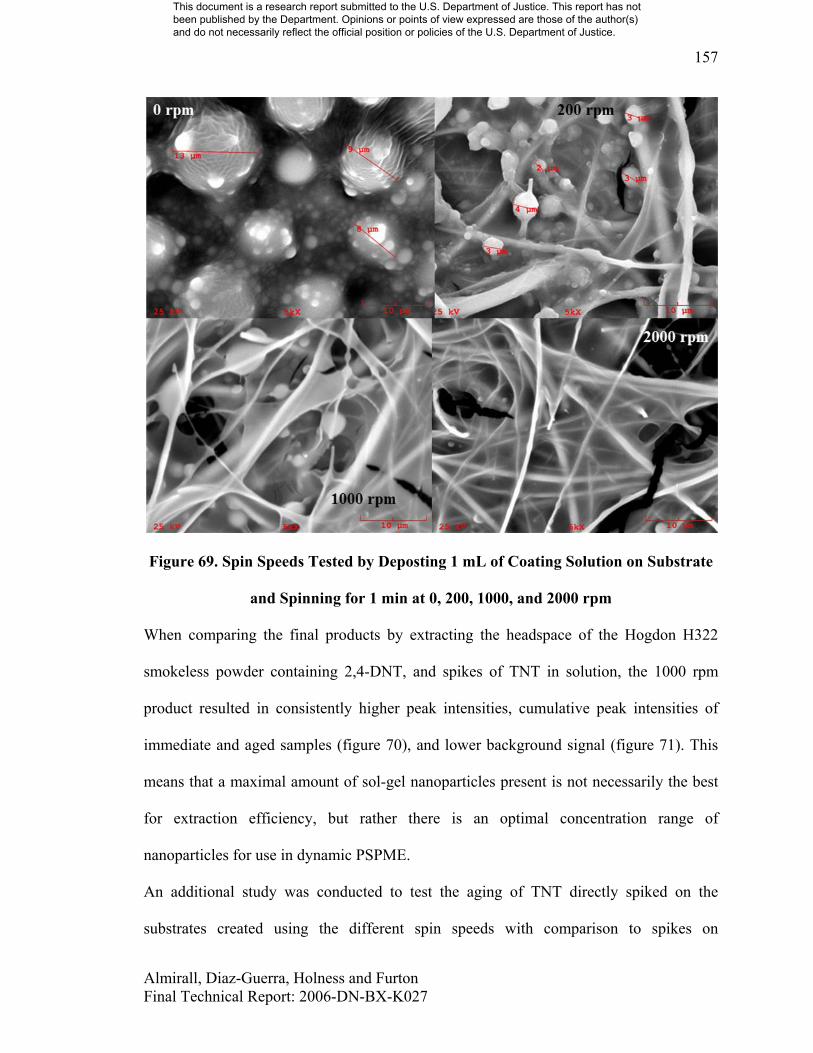
157
Almirall, Diaz-Guerra, Holness and Furton Final Technical Report: 2006-DN-BX-K027
Figure 69. Spin Speeds Tested by Deposting 1 mL of Coating Solution on Substrate
and Spinning for 1 min at 0, 200, 1000, and 2000 rpm
When comparing the final products by extracting the headspace of the Hogdon H322
smokeless powder containing 2,4-DNT, and spikes of TNT in solution, the 1000 rpm
product resulted in consistently higher peak intensities, cumulative peak intensities of
immediate and aged samples (figure 70), and lower background signal (figure 71). This
means that a maximal amount of sol-gel nanoparticles present is not necessarily the best
for extraction efficiency, but rather there is an optimal concentration range of
nanoparticles for use in dynamic PSPME.
An additional study was conducted to test the aging of TNT directly spiked on the
substrates created using the different spin speeds with comparison to spikes on
This document is a research report submitted to the U.S. Department of Justice. This report has not been published by the Department. Opinions or points of view expressed are those of the author(s) and do not necessarily reflect the official position or policies of the U.S. Department of Justice.

158
Almirall, Diaz-Guerra, Holness and Furton Final Technical Report: 2006-DN-BX-K027
manufacturer provided filters (figure 72). As expected the 200 rpm dynamic PSPME
retained TNT the best because of the greater presence of sol-gel nanoparticles, but the
1000 rpm still performed suitably, still retaining a portion of the TNT after 30 min of
aging.
Figure 70. 100 mg of Hogdon H322 Smokeless Powder- Immediate or Aged: Qt. can,
30 minute stay, extraction for 30 min at room temperature, IMS analysis either t=0
or t=30 min after extraction
This document is a research report submitted to the U.S. Department of Justice. This report has not been published by the Department. Opinions or points of view expressed are those of the author(s) and do not necessarily reflect the official position or policies of the U.S. Department of Justice.

159
Almirall, Diaz-Guerra, Holness and Furton Final Technical Report: 2006-DN-BX-K027
Figure 71. IMS plasmagram of Backgrounds Obtained From Blank Dynamic
PDMS Devices Created Using Various Spin Programs
The substrate preparation procedure was also optimized in order to minimize the
background to the levels seen in figure 71 and to minimize the yellowish tinge and
sometimes burned appearance that was observed at times following curing and
conditioning.
The IMS backgrounds in the IonScan 400B (+/- polarities) and the Itemiser 2 (+ polarity)
obtained for both the dynamic PSPME filter and manufacturer provided filter are shown
in figure 73 (A-C). Low background signal for the sampling media used in IMS is
desirable to diminish the effects of any competitive ionization between the analyte signal
and that of the background signal peak(s). The clean background seen for the dynamic
PSPME device relative to that of the manufacturer provided filter, was achieved by
This document is a research report submitted to the U.S. Department of Justice. This report has not been published by the Department. Opinions or points of view expressed are those of the author(s) and do not necessarily reflect the official position or policies of the U.S. Department of Justice.

160
Almirall, Diaz-Guerra, Holness and Furton Final Technical Report: 2006-DN-BX-K027
optimization of the preparation of the glass fiber filter substrate used in dynamic PSPME,
and is mainly influenced by ensuring that the surface is washed well with deionized water
(neutral pH) after each of the preparation steps: 1) treatment with the H2SO4 and H202
mixture and 2) treatment with NaOH in order to expose the silanol groups that participate
in the anchoring of the sol-gel PDMS to the surface and throughout the thickness of the
filter. Figure 73A is a plasmagram of the blanks of the manufacturer provided filter and
dynamic PSPME device obtained from the IonScan 400B in the negative polarity. The
peaks to the left of 11.3 ms are inherent to the negative mode plasmagram and are a result
of the reactant gas, clean dry air doped with hexachloroethane, which provided the two
peaks at (K0= 2.60 and 2.32cm2 V-1 s-1) and the O2- peak (K0= 2.22 cm2 V-1 s-1). The
calibrant (cal) peak is from 4-nitrobenzyl nitrile (K0= 1.65 cm2 V-1 s-1). To the right of
the calibrant peak it is evident that the manufacturer provided filter produces a large peak
at 16 ms when desorbed. This can suppress the signal of the analytes targeted in the
negative mode in this IMS instrument since it will compete with the analyte for the pool
of reactant ions. The three minor peaks (13.4, 15.6, and 17.7 ms, all with intensities
below 50 d.u.) for the dynamic PSPME device do not interfere with the drift times of 2,4-
DNT (11.8 ms, K0= 1.57 cm2 V-1 s-1) and TNT (12.8 ms, K0= 1.45 cm2 V-1 s-1). Figure
73B is a plasmagram of the blanks of the manufacturer provided filter and the dynamic
PSPME device obtained from the IonScan 400B in the positive polarity. It is immediately
evident that the trace of the dynamic PSPME device represents a much cleaner
background than that of the manufacturer provided filter. The reactant ion peak (RIP),
also the calibrant (Cal) is nicotinamide (K0= 1.86 cm2 V-1 s-1), has a much higher
intensity for the dynamic PSPME which translates to a larger pool of reactant ions to
This document is a research report submitted to the U.S. Department of Justice. This report has not been published by the Department. Opinions or points of view expressed are those of the author(s) and do not necessarily reflect the official position or policies of the U.S. Department of Justice.

161
Almirall, Diaz-Guerra, Holness and Furton Final Technical Report: 2006-DN-BX-K027
produce product ion peaks. The depletion of the RIP evident from the plasmagram of the
manufacturer provided filter is likely due to the background peaks seen in this trace. In
the positive polarity, this study targeted DPA (K0= 1.61 cm2 V-1 s-1) and EC (K0= 1.24
cm2 V-1 s-1). The background shown in figure 73C resulted from IMS analysis using the
Itemiser 2. The RIP is nicotinamide at a drift time of 5.4 ms. There is no major difference
observed between each trace. Piperonal is detected at 8.3 ms (K0= 1.51 cm2 V-1 s-1).
Figure 72. Aging Study of TNT in ACN on the Surface of Manufacturer Provided
Filters and Dynamic PSPME Devices Created Using Various Spin Programs
This document is a research report submitted to the U.S. Department of Justice. This report has not been published by the Department. Opinions or points of view expressed are those of the author(s) and do not necessarily reflect the official position or policies of the U.S. Department of Justice.

162
Almirall, Diaz-Guerra, Holness and Furton Final Technical Report: 2006-DN-BX-K027
180 °C
This document is a research report submitted to the U.S. Department of Justice. This report has not been published by the Department. Opinions or points of view expressed are those of the author(s) and do not necessarily reflect the official position or policies of the U.S. Department of Justice.

163
Almirall, Diaz-Guerra, Holness and Furton Final Technical Report: 2006-DN-BX-K027
Figure 73. IMS Plasmagrams of Both the PSPME Device and Manufacturer Filter
Blanks. IonScan 400B in negative polarity (a); IonScan 400B in positive polarity (b);
Itemiser2 in positive polarity (c) [165]
Characterization of Final Dynamic PSPME Devices The surface and cross-section of both the uncoated glass fiber filter and the dynamic
PSPME device were characterized by SEM. Figure 74a displays the cross section of the
glass fiber filter with a thickness of ~280 µm while figure 74b is that of the dynamic
PSME device (thickness ~324 µm). This represents a 44 µm increase in thickness of the
glass fiber filter following coating with sol-gel PDMS using the spin-coating program
described in the Methods section. The porous nature of the dynamic PSME device is
evident from the cross-section seen in figure 74b. This porosity provides additional
surface area and capacity since more sites for partitioning/ absorption of analyte onto the
extraction phase are available. This is expected to result in enhanced extraction efficiency
and sensitivity in SPME-IMS. Additionally, improved desorption profiles compared to
static PSPME are expected since: 1) the thickness of the dynamic PSPME device coating
is much smaller, ~44 µm, as compared to 170 µm for static PSPME and 2) because the
dynamic PSPME device allows flow through the sample media, it can take advantage of
the suction/ sample flow of IMS instruments, that besides the high temperature of
desorption, helps direct the analyte from the dynamic PSPME device into the IMS
analyzer. Figure 74c and 74d display surface images of the uncoated glass fiber filter and
dynamic PSPME device, which demonstrate retention of the porous properties in
dynamic PSPME even after coating and final curing of the device.
This document is a research report submitted to the U.S. Department of Justice. This report has not been published by the Department. Opinions or points of view expressed are those of the author(s) and do not necessarily reflect the official position or policies of the U.S. Department of Justice.

164
Almirall, Diaz-Guerra, Holness and Furton Final Technical Report: 2006-DN-BX-K027
Figure 74. SEM Images of the Glass Fiber Filter and the Dynamic PSPME Device:
the surface (c & d), and cross section (a & b), of the original substrate, the glass
fiber filter (a & c) and the dynamic PSPME device (b & d) [165]
The dynamic PSPME device is placed in the slot of the handheld vacuum and the pump is
turned on. The average air speed at the head of the nozzle was measured to be 0.5 m s-1
with a EA-3010U handheld anemometer (La Crosse Technology, La Crosse, WI). When
sampling was done using the manufacturer provided filter, the air speed was measured to
be an average of 1.3 m s-1. The volumetric flow rate, Q, or the volume of fluid that passes
through a surface (m3 s-1), is defined in equation 14 as:
225 °C 300 °C
180 °C 225 °C
This document is a research report submitted to the U.S. Department of Justice. This report has not been published by the Department. Opinions or points of view expressed are those of the author(s) and do not necessarily reflect the official position or policies of the U.S. Department of Justice.

165
Almirall, Diaz-Guerra, Holness and Furton Final Technical Report: 2006-DN-BX-K027
θcos××= vAQ (Equation 14)
where A is the area of surface (0.03 m), v is the velocity at the head of the nozzle (0.5 m
s-1 for dynamic PSPME and 1.3 m s-1 for the manufacturer provided filter), and θ is the
angle away from the perpendicular direction to A (in this case it is 0°). The values for the
volume of air sampled per unit time, result in 0.35 L s-1 for dynamic PSPME and 0.92 L
s-1 for the manufacturer provided filter. The resistivity encountered by using the dynamic
PSPME device when compared to the manufacturer provided filter, evident from the
3-fold greater volume of air sampled for the former, is not surprising because of the
durable, heat resistant, rugged sol-gel PDMS coating of the PSPME device that allows
100 times of use as other PDMS SPME devices, unlike the one-time use designated for
these manufacturer provided filters. The handheld vacuum was chosen as the pump for
these experiments since it represents a common and readily available accessory for
sampling particles that can typically accompany the sale of commercial IMS and the
training/use by security screeners.
Volatile Chemical Signature Standards for Dynamic PSPME Sampling Spike on Manufacturer Provided Filters
Standard solutions of piperonal, 2,4-DNT, DPA, TNT and EC, were spiked onto the
surface of both the dynamic PSPME and manufacturer provided filters, followed by
analysis with the appropriate IMS instrument. Corresponding and reproducible
cumulative signals (n=3, low SD see figure 76) were obtained from both filters for the
This document is a research report submitted to the U.S. Department of Justice. This report has not been published by the Department. Opinions or points of view expressed are those of the author(s) and do not necessarily reflect the official position or policies of the U.S. Department of Justice.
166
Almirall, Diaz-Guerra, Holness and Furton Final Technical Report: 2006-DN-BX-K027
standard solutions of most compounds proving their calibration with the Teflon
manufacturer provided filter valid for further quantitation. Piperonal was dissolved in
DCM while DPA, TNT and EC were all dissolved in ACN, as described in the Methods
section. An exceptional result was obtained for the compound 2,4-DNT. This compound
was dissolved in hexane, a solvent with comparable volatility to 2,4-DNT, but when
spiked over the dynamic PSPME surface yielded a response curve (equation 15) that
underestimated the mass of 2,4-DNT detected following vapor sampling due because of
the interaction of hexane with the sol-gel PDMS phase (almost instantaneous solvent
evaporation). However, the generation of 2,4-DNT standard solutions on the
manufacturer filters provided response curves for quantitation purposes.
9846.0,29.524511.89 2 =+= rxy (Equation 15)
Table 9 summarizes the response curves determined for all target compounds by using
the manufacturer provided filter for further quantitation in this study. All response curves
exhibited a linear regression over the tested dynamic range. The results, including the r2
values, are shown in Table 9 along with the IMS linear dynamic range (LDR) and
minimal detection limit (MDL). Typical LDR’s of one order of magnitude characterized
these response curves. Standard solutions of piperonal, 2,4-DNT, DPA, TNT and EC,
were analyzed individually using the appropriate IMS instrument. The response curves
exhibited a linear regression over the tested dynamic range. Quantitation of TNT in a
broader dynamic range of two orders of magnitude was enabled by determining two
linear dynamic ranges along the low (0.025- 1 ng) and high (0.2-8 ng) concentrations,
yielding for this compound the lowest LOQ and MDL of 0.025 ng. Two linear dynamic
This document is a research report submitted to the U.S. Department of Justice. This report has not been published by the Department. Opinions or points of view expressed are those of the author(s) and do not necessarily reflect the official position or policies of the U.S. Department of Justice.
167
Almirall, Diaz-Guerra, Holness and Furton Final Technical Report: 2006-DN-BX-K027
ranges can often been seen in IMS analysis since the pool of reactant ions available to
yield product ions is temporally fixed. Because the kinetics of reactant ion formation are
much slower than reactant ion consumption, when higher concentrations are introduced,
the reactant ion pool becomes depleted much faster than it can be regenerated, resulting
in product ion signals that are lower than expected [142]. The signal/noise ratio obtained
for the LDR's lowest concentration of piperonal, TNT and 2,4-DNT confirmed their LOQ
as their MDL, while for the other analytes, lower LOD's than LOQ's are expected.
Extrapolation for the minimal signal/noise ratio (S/N≥3) yielded estimated MDL's of 0.05
ng and 2 ng as detected masses of EC and DPA, respectively.
It is important to note that liquid spikes on a substrate do not necessarily desorb in the
same fashion as absorbed vapor or swipe deposition, but this is remedied by using the
cumulative amplitude, the sum of all the peak amplitudes that alert for the compound in
IMS. Given complete desorption of the standard, meaning the signal returns to baseline
before analysis ends, quantitation is possible because there is a specific instrumental
response for a given mass introduced into the IMS.
This document is a research report submitted to the U.S. Department of Justice. This report has not been published by the Department. Opinions or points of view expressed are those of the author(s) and do not necessarily reflect the official position or policies of the U.S. Department of Justice.
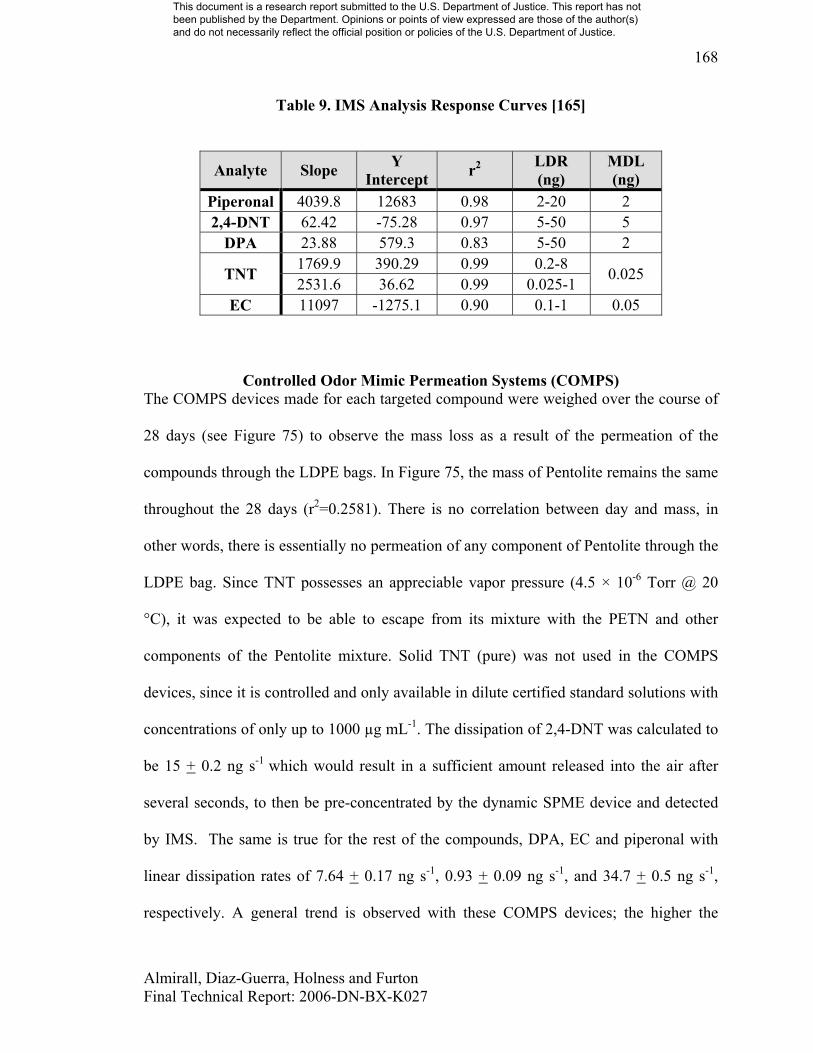
168
Almirall, Diaz-Guerra, Holness and Furton Final Technical Report: 2006-DN-BX-K027
Table 9. IMS Analysis Response Curves [165]
Analyte Slope Y Intercept r2 LDR
(ng) MDL (ng)
Piperonal 4039.8 12683 0.98 2-20 2 2,4-DNT 62.42 -75.28 0.97 5-50 5
DPA 23.88 579.3 0.83 5-50 2
TNT 1769.9 390.29 0.99 0.2-8 0.025 2531.6 36.62 0.99 0.025-1
EC 11097 -1275.1 0.90 0.1-1 0.05
Controlled Odor Mimic Permeation Systems (COMPS) The COMPS devices made for each targeted compound were weighed over the course of
28 days (see Figure 75) to observe the mass loss as a result of the permeation of the
compounds through the LDPE bags. In Figure 75, the mass of Pentolite remains the same
throughout the 28 days (r2=0.2581). There is no correlation between day and mass, in
other words, there is essentially no permeation of any component of Pentolite through the
LDPE bag. Since TNT possesses an appreciable vapor pressure (4.5 × 10⁻⁶ Torr @ 20
°C), it was expected to be able to escape from its mixture with the PETN and other
components of the Pentolite mixture. Solid TNT (pure) was not used in the COMPS
devices, since it is controlled and only available in dilute certified standard solutions with
concentrations of only up to 1000 µg mL-1. The dissipation of 2,4-DNT was calculated to
be 15 + 0.2 ng s-1 which would result in a sufficient amount released into the air after
several seconds, to then be pre-concentrated by the dynamic SPME device and detected
by IMS. The same is true for the rest of the compounds, DPA, EC and piperonal with
linear dissipation rates of 7.64 + 0.17 ng s-1, 0.93 + 0.09 ng s-1, and 34.7 + 0.5 ng s-1,
respectively. A general trend is observed with these COMPS devices; the higher the
This document is a research report submitted to the U.S. Department of Justice. This report has not been published by the Department. Opinions or points of view expressed are those of the author(s) and do not necessarily reflect the official position or policies of the U.S. Department of Justice.

169
Almirall, Diaz-Guerra, Holness and Furton Final Technical Report: 2006-DN-BX-K027
vapor pressure of the compound in the COMPS device, the faster is dissipates through the
LDPE bag. The TNT in Pentolite is an exception due to competition it encounters with
the compounds in the mixture for release into the headspace, but if the COMPS device
were made with solid TNT alone, the resulting dissipation rate is expected to be between
those observed for DPA and EC. As another note, due to the volatility of piperonal, this
compound shows a tendency for exponential decay (exponential fit; r2=0.9891) as is
permeates through the LDPE over the course of 28 days. This translates to a half-life of
about 15 days. Since the other compounds (DPA, EC, and 2,4-DNT) are losing
compound every second, then with each passing time interval there is essentially less
starting material to continue to lose mass from. This exponential decay behavior would
likely be experimentally observed when measuring the mass loss for time periods much
longer than 1 month. This was not studied since the COMPS bags were developed as a
simple and inexpensive calibration device, and are only meant for use within the time
used to calculate the reported permeation rate.
This document is a research report submitted to the U.S. Department of Justice. This report has not been published by the Department. Opinions or points of view expressed are those of the author(s) and do not necessarily reflect the official position or policies of the U.S. Department of Justice.

170
Almirall, Diaz-Guerra, Holness and Furton Final Technical Report: 2006-DN-BX-K027
Figure 75. Dissipation Rates of Volatile Chemical Signatures in COMPS Devices
[165]
Validation Experiments for Dynamic PSPME Dynamic PSPME Retaining Capability Studied by Analyte Solution Spiking
The retention capability of the novel PSPME device for the pre-concentration of analytes
sampled dynamically from air was studied first by directly spiking the standard analyte
solution in a minimal solvent volume onto the substrate followed by clean air pumping.
The ability of the dynamic PSPME device to retain compounds when subjected to the
pumping of increasing air volumes was studied. The results shown in Figure 76, are
arranged by from the most volatile compound, piperonal, down to the least, EC. Equal
This document is a research report submitted to the U.S. Department of Justice. This report has not been published by the Department. Opinions or points of view expressed are those of the author(s) and do not necessarily reflect the official position or policies of the U.S. Department of Justice.

171
Almirall, Diaz-Guerra, Holness and Furton Final Technical Report: 2006-DN-BX-K027
amounts of targeted compound that resulted in a mass that fell close to the center of each
analyte's LDR (Table 9), were spiked onto the surface of both the dynamic PSPME and
manufacturer filters. The initial points, in immediate analyses (t= 0 s) with no pumping of
air applied, originate from essentially the same signal for all compounds from both spiked
substrates except for 2,4-DNT. Figure 76, shows that the 2,4-DNT spike on the dynamic
PSPME filter provided a significantly greater response than that for the manufacturer
provided filter. This is a first indication of the affinity of the 2,4-DNT to the sol-gel
PDMS extraction phase of the dynamic PSPME device. The only difference in the sample
preparation of the standard solutions was that the solvent used for 2,4-DNT was hexane,
while the other compounds were dissolved in ACN, as described in the Methods section.
Unlike ACN, the use of hexane enabled the generation of IMS response curve for 2,4-
DNT quantification purposes. Another study [59], suggested the hypothesis that 2,4-DNT
desorbed slowly from surfaces preventing lower mass loadings from being detectable by
IMS. Taking this into account, the dynamic PSPME device developed may also serve an
additional purpose as an improved sampling surface for the calibration of IMS for 2,4-
DNT, a compound that has proven difficult to introduce and reliably transport into the
IMS reaction chamber. This extraction phase absorbs 2,4-DNT extremely well, retains it,
and facilitates thermal desorption from the surface and by aid of the IMS sample tray
flow.
Figure 76 clearly shows opposing trends for both the PSPME device and the
manufacturer filter, while simulating dynamic sampling by pumping clean air through
both substrates. After only a short time of pumping (10-15 s), an increased signal was
obtained for all compounds spiked on the dynamic PSPME filter, while a large drop was
This document is a research report submitted to the U.S. Department of Justice. This report has not been published by the Department. Opinions or points of view expressed are those of the author(s) and do not necessarily reflect the official position or policies of the U.S. Department of Justice.

172
Almirall, Diaz-Guerra, Holness and Furton Final Technical Report: 2006-DN-BX-K027
measured for the manufacturer provided filter. Generally, while pumping air, unavoidable
evaporation of the volatile solvent involved with the delivery of the analyte, is expected
for both substrates. While significant co-evaporation of analyte was measured for the
manufacturer provided filters, analytes were strongly retained on the adsorptive phase of
the dynamic PSPME filter, confirming its efficient pre-concentration capability. The
trend in increasing IMS signals measured for all compounds at only the shortest pumping
time applied for the dynamic PSPME filters, when at least the same results as for t=0
were expected, can be explained. At t=0 s, since pumping is not applied, both the solvent
and analyte are introduced into the IMS reaction chamber. The presence of the solvent in
the reaction region can serve to cluster or solvate the reaction ions affecting both the
thermodynamics and kinetics of ionization [17]. Since the available charge is shielded,
the ionization of analytes becomes less favorable leading to diminished responses.
Pumping for as little as 10 s aids in desolvation and maximizes interactions between the
analyte and the reactant ions that lead to effective ionization.A study was conducted to
evaluate the solvent effects encountered when attempting to quantitate extracted analytes
by SPME using IMS and GC-MS response curves [160]. This study showed that by
minimizing the solvent, from the µL range to the sub-nL range, both instrumentals
responses were greatly enhanced.
The compounds, DPA, TNT, and EC are retained on the dynamic PSPME filter
throughout the complete range of sampling time intervals, up to 70 s, as evidenced by the
absence of signal decreases in these cases. The maximum sampling time, 70 s, was
designated as a length of time that is amenable to field sampling and/or high throughput
situations, allowing for multiple sampling before battery recharging or replacement is
This document is a research report submitted to the U.S. Department of Justice. This report has not been published by the Department. Opinions or points of view expressed are those of the author(s) and do not necessarily reflect the official position or policies of the U.S. Department of Justice.

173
Almirall, Diaz-Guerra, Holness and Furton Final Technical Report: 2006-DN-BX-K027
necessary. Piperonal signal increased up to 45 s of sampling time (Figure 76) after which
the signal decreased 28 % from the initial amount. This is not surprising due to the
volatility of piperonal and its tendency to remain in the headspace. Specifically, for the
2,4-DNT (Figure 76), after 30 s of pumping, there is some signal loss (2 % at 45 s), with
70 s of pumping causing the greatest signal reduction (33 %).
This document is a research report submitted to the U.S. Department of Justice. This report has not been published by the Department. Opinions or points of view expressed are those of the author(s) and do not necessarily reflect the official position or policies of the U.S. Department of Justice.

174
Almirall, Diaz-Guerra, Holness and Furton Final Technical Report: 2006-DN-BX-K027
Figure 76. Retention Capability Study by Spiking Standard Solution of the Analytes
onto the PSPME Surface Device Followed by Clean Air Pumping [165]
This document is a research report submitted to the U.S. Department of Justice. This report has not been published by the Department. Opinions or points of view expressed are those of the author(s) and do not necessarily reflect the official position or policies of the U.S. Department of Justice.

175
Almirall, Diaz-Guerra, Holness and Furton Final Technical Report: 2006-DN-BX-K027
From Figure 76 it also evident that when spiking onto the manufacturer provided filter,
pumping of only 15 s caused a large drop in retention for all the compounds, with the
most being retained for EC (79%) and the least for 2,4-DNT (4%). The original
designation of this filter is not for pre-concentration but rather for capturing particulate
matter. There is no specific adsorptive/absorptive coating for collecting vapors as
opposed to the dynamic PSPME device. The same would be concluded while analyzing
the results taking into account total air volume sampled instead of pumping time. Even
though the volume of air that was sampled is 3-fold higher for the manufacturer provided
filter, when the sampling time is correlated with the appropriate sample volumes,
dynamic PSPME still outperforms the manufacturer provided filter. For example, by
comparing the 15 s sampling time for the manufacturer provided filter (13.8 L air
sampled) with the 45 s sampling time for the dynamic PSPME device (15.75 L air
sampled), the dynamic PSPME device still retains all of the starting compounds (100 %
or greater), except 2,4-DNT which as previously mentioned, loses a mere 2%.
Dynamic PSPME Retaining Capability Studied by COMPS Vapor Source The performance of the dynamic PSPME devices coupled to IMS analysis was estimated
further by dynamic sampling of air containing the analytes. Controlled Odor Mimic
Permeation Systems (COMPS) devices were used to generate vapor source of the tested
analytes, which enabled quantitation of the maximum mass available in air for extraction.
This was an alternate manner to simulate dynamic sampling in the field for detection of
vapors emitted from drugs, high and low explosives in order to test the performance of
dynamic PSPME device. The optimum sampling height was determined for 30 s of
pumping above the COMPS devices for each targeted compound. Sampling of piperonal,
This document is a research report submitted to the U.S. Department of Justice. This report has not been published by the Department. Opinions or points of view expressed are those of the author(s) and do not necessarily reflect the official position or policies of the U.S. Department of Justice.

176
Almirall, Diaz-Guerra, Holness and Furton Final Technical Report: 2006-DN-BX-K027
DPA, EC, and 2,4-DNT at the height of 10, 10, 5 and 5 cm, respectively, produced IMS
responses within the linear dynamic range of each analyte. Figure 77 shows the
pervasiveness of piperonal odor. This is indicated by the amount of piperonal that is
detected reproducibly following dynamic PSPME sampling from even the farthest
distance possible in the hood (40 cm high).
Figure 77. Mass of Piperonal Detected When Dynamically Sampling a COMPS
Device for 30 s at Different Sampling Heights
At the selected sampling heights, the effect of pumping time was studied, and as with the
retention capability study, the manufacturer provided filter was also tested for
comparison purposes (Figure 78). It is key to note that on Figure 78, for the compounds,
piperonal, 2,4-DNT and DPA, there is an increasing trend of amount extracted versus the
sampling time, demonstrating yet again the trapping capability of the dynamic PSPME
This document is a research report submitted to the U.S. Department of Justice. This report has not been published by the Department. Opinions or points of view expressed are those of the author(s) and do not necessarily reflect the official position or policies of the U.S. Department of Justice.

177
Almirall, Diaz-Guerra, Holness and Furton Final Technical Report: 2006-DN-BX-K027
device absorbent phase. Figure 78 depicts opposing results for the extraction of the same
compounds using the manufacturer provided filter. No detectable amounts of DPA vapors
were collected. Piperonal and 2,4-DNT were detected but at significantly lower masses.
Moreover, those amounts collected remained constant regardless of sampling time. This
demonstrates that the vapors sampled are being passed through this filter while pumping,
and there is no net gain in the amount of targeted compound adsorbed, although the
vapors are continuously generated. Figure 78 shows the results for sampling EC
producing the least mass detected among the suite of the target analytes. With similar
masses extracted by both collection media, no advantage was seen for the novel device.
The minimal responses obtained could be due to the low volatility of EC. The steady
mass detected by the PSPME device, with no gain in mass as pumping time is increased,
can be explain by the analyte's dissipation rate. The EC COMPS devices were calculated
to emit only 0.93 ng s-1 by measuring the mass of the device each day for 28 days as
described in the Methods section. However, for a compound like EC that has a relatively
low vapor pressure, this method of determining the dissipation rate may not directly
correlate directly with seconds, thus not allowing steady and continuous generation of the
vapors in this time scale. Evaluation of the PSPME device in sampling TNT vapors
generated by COMPS bags was not possible since solid TNT (pure) was not available,
and by using the only available source, Pentolite, no permeation through the LDPE bag
was obtained. Overall, these results demonstrate the powerful pre-concentration power of
dynamic PSPME device desirable for rapidly (on the order of seconds) sampling trace
amounts of volatile chemical signatures of illicit compounds in the field from air.
This document is a research report submitted to the U.S. Department of Justice. This report has not been published by the Department. Opinions or points of view expressed are those of the author(s) and do not necessarily reflect the official position or policies of the U.S. Department of Justice.

178
Almirall, Diaz-Guerra, Holness and Furton Final Technical Report: 2006-DN-BX-K027
When considering extraction efficiency, or the mass detected divided by the mass
available, the dynamic PSPME device performs much better than the manufacturer
provided filter. The mass available is derived by the COMPS dissipation rates (ng s-1)
(Figure 75) multiplied by the sampling time (s) to give a total maximal mass available for
extraction. For piperonal (Figure 78), 30-45s is required to extract the highest mass when
considering only the sampling time, but when taking into account the mass of piperonal
in air with every passing second, a sampling time of 15 s was the best, resulting in 4.9%
extraction efficiency. Averaging the extraction efficiency for all sampling times, the
dynamic PSPME device resulted in 3.4% versus 1% for the manufacturer provided filter.
For 2,4-DNT, the average extraction efficiency was 3.1% and 0.42% for the dynamic
PSPME device and the manufacturer provided filter, respectively. For DPA, detection
was only possible with the dynamic PSPME device, whose best extraction efficiency was
at 30 s, with an extraction efficiency of 12.4% (average of 6.3% for all sampling times).
This document is a research report submitted to the U.S. Department of Justice. This report has not been published by the Department. Opinions or points of view expressed are those of the author(s) and do not necessarily reflect the official position or policies of the U.S. Department of Justice.

179
Almirall, Diaz-Guerra, Holness and Furton Final Technical Report: 2006-DN-BX-K027
Figure 78. Retention Capability Study and Sampling Time Optimization by
Dynamically Sampling Vapors of Analytes Emitted from COMPS Bags [165]
This document is a research report submitted to the U.S. Department of Justice. This report has not been published by the Department. Opinions or points of view expressed are those of the author(s) and do not necessarily reflect the official position or policies of the U.S. Department of Justice.

180
Almirall, Diaz-Guerra, Holness and Furton Final Technical Report: 2006-DN-BX-K027
These large recoveries are a testament to the pre-concentration power of the dynamic
PSPME device considering that sampling was conducted in an open laboratory clean
bench on the scale of seconds. By employing a dynamic sampling scenario, the extraction
device’s mass uptake rate is increased and the boundary layer that has to be overcome in
a static sampling scenario is decreased [86] thus allowing faster extractions. This,
coupled with the large surface area of this porous dynamic PSPME device, provides
greater capacity to capture a larger portion of the targeted analytes from air selectively.
Another advantage of this selectivity is that artifacts that would cause competitive
ionization in IMS, thus depressing signal of the target analyte, are not extracted/ detected
from ambient air. Again, it is important to emphasize that the amounts detected also fell
within the IMS LDR’s for each compound, adding to the reliability of this quantification
approach.
Dynamic PSPME LOD The detection limits for the targeted compounds using the complete dynamic PSPME-
IMS method were estimated. The method, based on three consecutive steps: dynamic
sampling, desorption and detection, proved to be highly efficient in the first two stages
with no virtually loss of sample, whereby determining the method’s sensitivity became
restricted by the third step, the IMS analysis. Accumulative extraction of a total mass of
analyte onto the adsorbent phase of the novel device that is above the IMS analysis MDL
is expected to alarm. The sensitivity of the PSPME-IMS method was estimated for each
of the tested analytes in this study, considering a 10 s sampling time (total air volume of
3.5 L) as applicable to real case scenarios, followed by 100% efficient absorption on the
substrate and complete IMS desorption. The resulting LOD’s, or the minimum amounts
This document is a research report submitted to the U.S. Department of Justice. This report has not been published by the Department. Opinions or points of view expressed are those of the author(s) and do not necessarily reflect the official position or policies of the U.S. Department of Justice.

181
Almirall, Diaz-Guerra, Holness and Furton Final Technical Report: 2006-DN-BX-K027
of target analyte that must be available in air for sampling, are as follows: 0.6, 1.5, 0.6,
0.01, and 0.02 ng L-1 for piperonal, 2,4-DNT, DPA, TNT, and EC, respectively.
Application of Dynamic PSPME- IMS for Screening of Illicit Compounds The retaining capabilities obtained for the novel dynamic PSPSME device confirm its
validity in detection of the target analytes from real case scenarios. The dynamic PSPME
device was tested on the headspace of illicit compounds under conditions designed to
simulate difficult sampling conditions in the field. These results along with the sampling
conditions are listed in Table 10. Sample plasmagrams are shown in figure 79.
Suspected MDMA tablets were sampled and analyzed, in a blind study test, on-site at a
local crime laboratory. Case 2 was negative for MDMA, by GC/MS, and this was
corroborated by a negative response for piperonal by dynamic PSPME-IMS. Case 4 was
positive for MDMA, from GC/MS data, and 40 ng of piperonal were detected by IMS
following only 10 s extractions with 15 min of equilibration time. In the difficult
scenario, case 1, minimal amounts of the MDMA drug were confirmed by GC/MS data,
resulting in even less amounts of piperonal being present. Despite this, 11.7 ng of
piperonal were detected from only a 10 s dynamic PSPME extraction in the first trial.
Since 15 min was not a sufficient sealing time for such a small initial concentration of
piperonal in the tablets to rebuild the headspace, no piperonal was detected for the two
subsequent dynamic extractions. Because of time constraints related to sampling at this
crime laboratory, the cans could not be sealed longer.
This document is a research report submitted to the U.S. Department of Justice. This report has not been published by the Department. Opinions or points of view expressed are those of the author(s) and do not necessarily reflect the official position or policies of the U.S. Department of Justice.

182
Almirall, Diaz-Guerra, Holness and Furton Final Technical Report: 2006-DN-BX-K027
Table 10. Detection of Target Analytes from Real Case Samples Using the Dynamic
PSPME–IMS Method [165]
Analyte Emitting source Source
mass
Equilibrium
time (h)
Pumping
time (s)
Mass
detected
(ng)
Piperonal Ecstasy
tablets
Case 4 [178] 5 tablets
(~1.5g) 24 10
40.0 ± 2
Case 1 [178] 12
2,4-DNT
Smokeless
Powder
IMR 4198
100mg
0.5 30
35.0 ±
11.5
Hodgon H322
26.0 ±
14.0
DPA
Hodgon H322
24 60
38.0 ± 9.3
IMR 4198 11.2 ± 2.5
Unique
73.9 ±
13.4
Red Dot
69.1 ±
18.6
EC Red Dot 24 60 N/D
A mass of 100 mg of several brands of the smokeless powders (low explosives), were
sealed in a quart can, opened, and sampled by dynamic PSPME. For 2,4-DNT detection
in the negative polarity, only 30 min of sealing was required followed by 30 s of
This document is a research report submitted to the U.S. Department of Justice. This report has not been published by the Department. Opinions or points of view expressed are those of the author(s) and do not necessarily reflect the official position or policies of the U.S. Department of Justice.

183
Almirall, Diaz-Guerra, Holness and Furton Final Technical Report: 2006-DN-BX-K027
sampling dynamically in order to detect 35 ng from the IMR 4198 powder and 26 ng
from the Hogdon H322 powder. This is significant, since in a previous study it was
reported that although up to 41 ng of 2,4-DNT was detected by GC/MS following
extraction from the headspace of 100 mg of these powders for 120 min in a 50 mL vial
following equilibration, detectable amounts were not observed by SPME-IMS [59]. With
dynamic PSPME, pre-equilibrium sampling of the same mass from a sample container
with a volume 80-fold greater was possible in only 30 s resulting in the relatively same
amount of 2,4-DNT being detected as by GC/MS.
In the positive polarity, the powders were sampled in a similar fashion except they were
sealed overnight. DPA was detectable from the four powders following dynamic PSPME-
IMS method (see Table 10), with lesser amounts detected from the powders that also
contained 2,4-DNT. The smokeless powder Red Dot is known to contain both DPA and
EC, but only DPA alarmed in this experimental scheme. As was shown in the COMPS
sampling optimization, there was no accumulation of the EC on the dynamic PSPME
even while sampling this compound alone. Additionally, the EC may in fact have been
pre-concentrated, but its detection was likely inhibited by competitive ionization with
DPA in the IMS ionization chamber. It is expected that in a sealed static sampling system
using PSPME, or if a greater mass of the smokeless powders was used as is typical for
improvised explosive devices (IEDs), then this compound would be detectable.
Additional research must be conducted to determine the optimal dynamic sampling
parameters and IMS operating conditions to favor detection of the more discriminating
compound, EC. Since smokeless powders are available in a variety of particle shapes,
rods, discs, and balls, the difference in their surface area may affect the amount of the
This document is a research report submitted to the U.S. Department of Justice. This report has not been published by the Department. Opinions or points of view expressed are those of the author(s) and do not necessarily reflect the official position or policies of the U.S. Department of Justice.

184
Almirall, Diaz-Guerra, Holness and Furton Final Technical Report: 2006-DN-BX-K027
volatile chemical signature that is emitted into air. This phenomenon may inhibit an
additive such as EC from being released despite that fact it is in the formulation, and
should be investigated. In figure 80b a sample plasmagram from the dynamic sampling of
an EC COMPS device for 30 s from 5 cm has been included. From these results, dynamic
PSPME-IMS is a rapid and sensitive option for the detection of 2,4-DNT and DPA from
a variety of smokeless powders, covering both IMS ionization polarities.
The high explosive, Pentolite, was sampled by the dynamic PSPME device targeting
TNT. Although the COMPS device created for Pentolite showed no measurable
dissipation, it was still sampled without the barrier of an LDPE bag expecting that the
semi-volatile component, TNT would still be released. After sealing a small amount, 100
mg of this powder in a can for 1 hr and sampling only 30 s, an amount of 0.6 ng was
detected by IMS, a value within the LDR.
This document is a research report submitted to the U.S. Department of Justice. This report has not been published by the Department. Opinions or points of view expressed are those of the author(s) and do not necessarily reflect the official position or policies of the U.S. Department of Justice.

185
Almirall, Diaz-Guerra, Holness and Furton Final Technical Report: 2006-DN-BX-K027
Cum. Signal (d.u.)
Cum. Signal (mV)
This document is a research report submitted to the U.S. Department of Justice. This report has not been published by the Department. Opinions or points of view expressed are those of the author(s) and do not necessarily reflect the official position or policies of the U.S. Department of Justice.

186
Almirall, Diaz-Guerra, Holness and Furton Final Technical Report: 2006-DN-BX-K027
Figure 79. Sample IMS Plasmagrams Following Dynamic PSPME Sampling of
Illicit Drugs and Explosives. a) TNT from Pentolite and 2,4-DNT from H322
Smokeless Powder, b) EC from COMPS and DPA from Red Dot Smokeless Powder,
and c) Piperonal from MDMA [165]
Chapter 8 Controlled odor mimic permeation system (COMPS) The creation of a controlled odor mimic permeation system has been researched and
evaluated in order to determine an optimized method for odor delivery [66]. These
devices incorporate a polymer matrix for delivery of the target odor. The polymer matrix
allows for the presentation of the odor mimic with a reliable and measurable delivery of
the target odor. The use of COMPS devices should allow for the creation of better
training aids that are safer, easier to acquire, and more consistent than currently available.
Overall, this will lead to improvements in the performance and standardization of
biological and instrumental stand-off detection of targets.
Polymers Polyethylene
Polyethylene is the most commonly encountered polymer used to date. Among its many
commercial uses include items such as grocery bags, shampoo bottles, children's toys,
and even bullet proof vests. The simplest structure of all commercial polymers,
polyethylene is comprised of a long chain of carbon atoms with two hydrogen atoms
attached to each carbon atom (Figure 1 [182]). This structure is referred to as a linear
polyethylene or high-density polyethylene (HDPE).
This document is a research report submitted to the U.S. Department of Justice. This report has not been published by the Department. Opinions or points of view expressed are those of the author(s) and do not necessarily reflect the official position or policies of the U.S. Department of Justice.

187
Almirall, Diaz-Guerra, Holness and Furton Final Technical Report: 2006-DN-BX-K027
Figure 5 - Polymer Structures
Within this simple structure, variations/mutations can occur. One mutation is the
substitution of additional polyethylene chains in place of the hydrogens (322HFigure 2 [182]).
This is referred to as branching and occurs in low-density polyethylene (LDPE). LDPE
has a lower tensile strength and increased ductility as compared to high-density
polyethylene (HDPE). While linear polyethylene is much stronger than branched
polyethylene, branched polyethylene is cheaper and easier to make.
Figure 6 - Simulated appearance of HDPE and LDPE
HDPE
LDPE
This document is a research report submitted to the U.S. Department of Justice. This report has not been published by the Department. Opinions or points of view expressed are those of the author(s) and do not necessarily reflect the official position or policies of the U.S. Department of Justice.

188
Almirall, Diaz-Guerra, Holness and Furton Final Technical Report: 2006-DN-BX-K027
131BPolypropylene Polypropylene is a versatile polymer that serves as both a plastic and as a fiber. As a
plastic it is used to make things such as dishwasher-safe food containers. Polypropylene
does not melt below 160oC, unlike polyethylene which anneals at 100oC which causes
dishes to warp in a dishwasher. As a fiber, polypropylene is used to make indoor-outdoor
carpeting. Because it is easy to color and resistant to water, it is often seen around pools
and miniature-golf courses.
Structurally, polypropylene is comprised of a carbon backbone with methyl groups
attached at alternating carbon atoms. Depending on the orientation of the methyl group,
the tacticity (rigidity) of polypropylene is affected. The most commonly used
polypropylene is isotactic, meaning that all the methyl groups are arranged on the same
side of the chain. Polypropylene can also present as atactic, meaning that the methyl
groups are randomly arranged on both sides of the chain (323HFigure 3 [182]).
Figure 7 - Polypropylene structures
This document is a research report submitted to the U.S. Department of Justice. This report has not been published by the Department. Opinions or points of view expressed are those of the author(s) and do not necessarily reflect the official position or policies of the U.S. Department of Justice.

189
Almirall, Diaz-Guerra, Holness and Furton Final Technical Report: 2006-DN-BX-K027
Certain synthesis processes can form polymers that contain sections of both isotactic and
atactic polypropylenes in the same polymer chain (324HFigure 4 [182]). In this polymer,
alignment of the isotactic blocks form crystals which are held together by soft rubbery
tethers of atactic polypropylene. Conversely, the hard isotactic blocks add strength to the
rubbery atactic material together resulting in a polymer that is rubbery and makes a good
elastomer.
Figure 8 - Polypropylene polymer chains
61BCreation of Controlled Odor Mimic Permeation System (COMPS) devices The COMPS devices themselves were created by heat sealing a specific amount of odor
compound within the polymer bags. The solid amounts varied from 5mg to 2g and liquid
amounts varied from 1mL to 5mL. The polymer bags that were used included 3in x 3in
1.5mil, 2mil, 3mil, 4mil LDPE and 2mil HDPP. The COMPS device was then heat sealed
and stored within an aluminized Kapak bag.
This document is a research report submitted to the U.S. Department of Justice. This report has not been published by the Department. Opinions or points of view expressed are those of the author(s) and do not necessarily reflect the official position or policies of the U.S. Department of Justice.

190
Almirall, Diaz-Guerra, Holness and Furton Final Technical Report: 2006-DN-BX-K027
62BPermeation of Odor Compounds The permeation rate of the compounds within the COMPS devices was determined. The
mass (grams) of the bags was recorded for fifteen to thirty consecutive days. Each sample
was made-up in triplicate for statistical purposes. The plotted results of average mass loss
vs. time in days allowed for a calculation of permeation rate and half-life for each odor
compounds through the polymer bags. Empty bags were also heat sealed and kept in the
same environment to use as control samples.
63BCOMPS Odor Delivery of Narcotics Following the determination of piperonal as a dominant odor compound in the headspace
of MDMA based drugs, the next step was to develop an optimized odor delivery system.
COMPS devices were prepared in several variations/combinations: masses ranging from
11mg to 2g, LDPE and HDPP polymer chemistries, polymer bag thickness (1.5mil, 2mil,
3mil, and 4mil), and polymer bag dimensions (1in x 1in, 1in x 2in, 1in x 3in, 2in x 2in,
2in x 3in, and 3in x 3in). Since all polymer bags were acquired with the dimensions of
3in x 3in, the other sizes had to be created. This was accomplished by heat-sealing the
bags to the appropriate dimensions prior to application of the sample. Since piperonal is a
solid compound, each sample of piperonal was weighed out and heat-sealed directly into
the polymer bag.
Once the COMPS were prepared, they were monitored (weighed) over the course of
fifteen days to determine the mass loss per time, i.e. the permeation rate through the
polymer bags. Triplicate blanks were kept and monitored concurrently to maintain a
baseline. At the conclusion of the weighing process, the data was plotted as mass vs.
This document is a research report submitted to the U.S. Department of Justice. This report has not been published by the Department. Opinions or points of view expressed are those of the author(s) and do not necessarily reflect the official position or policies of the U.S. Department of Justice.

191
Almirall, Diaz-Guerra, Holness and Furton Final Technical Report: 2006-DN-BX-K027
time. A linear-fit application yielded a direct value of permeation rate in grams per day
(g/d) which was converted to a permeation rate in nanograms per second (ng/sec).
325HFigure 5 represents the plotted data of Mass (grams) vs. Time (days) for the following
range of masses: 11mg, 50mg, 100mg, 200mg, 500mg, and 2000mg. Each sample was
heat-sealed within 3in x 3in 2mil LDPE bags.
y = -0.0151x + 2.0034R2 = 0.9984
y = -0.0095x + 0.4859R2 = 0.9921
y = -0.0061x + 0.1824R2 = 0.9921
y = -0.0036x + 0.0928R2 = 0.9978
y = -0.0022x + 0.042R2 = 0.9929
y = -0.0006x + 0.0102R2 = 0.8837
0.00
0.20
0.40
0.60
0.80
1.00
1.20
1.40
1.60
1.80
2.00
0 2 4 6 8 10 12 14 16
Time (days)
Mas
s (g
)
11mg
50mg
100mg
200mg
500mg
2000mg
Figure 9 - Piperonal permeation rate by mass for 3in x 3in 2mil LDPE bags
The permeation rate was affected by the starting amount of material sealed within the
COMPS devices (326HTable 1). The larger the starting mass, the faster the permeation rate
(175ng/sec); conversely, the lower the starting mass, the slower the permeation rate
(10ng/sec).
This document is a research report submitted to the U.S. Department of Justice. This report has not been published by the Department. Opinions or points of view expressed are those of the author(s) and do not necessarily reflect the official position or policies of the U.S. Department of Justice.

192
Almirall, Diaz-Guerra, Holness and Furton Final Technical Report: 2006-DN-BX-K027
Table 1 - Piperonal permeation rate by mass
Mass (mg) Permeation Rate
(ng/sec) 11 7 ± 1
50 25 ± 1
100 42 ± 1
200 71 ± 2
500 110 ± 3
2000 175 ± 1
A direct comparison of permeation rate vs. starting mass is shown in 327HFigure 6. Two
relationships can be drawn from this plot, one linear and one exponential. There is a
highly correlated (r2 > 0.99) linear relationship below 200mg of starting material. At the
larger starting masses (greater than 200mg), a highly correlated (r2 > 0.99) exponential
relationship is seen. As with any absolute container, there is maximum permeation rate
available that is dependent upon the relationship between the analyte of interest and the
membrane chemistry. Since the permeation rate for the LDPE bags increases linearly at
the smaller masses, minimal usage of the polymer’s permeation potential is suggested.
The exponential relationship of the higher masses to permeation rate suggests that the
maximum permeation potential for the 3in x 3in 2mil LDPE bags is significantly affected
by the amount of piperonal present.
This document is a research report submitted to the U.S. Department of Justice. This report has not been published by the Department. Opinions or points of view expressed are those of the author(s) and do not necessarily reflect the official position or policies of the U.S. Department of Justice.

193
Almirall, Diaz-Guerra, Holness and Furton Final Technical Report: 2006-DN-BX-K027
Permeation Rate vs. Mass
y = 43.017e0.022x
R2 = 0.9995
y = 3.167x - 27.047R2 = 0.9963
0
500
1000
1500
2000
2500
0 20 40 60 80 100 120 140 160 180 200
Rate (ng/sec)
Mas
s (m
g)
Figure 10 - Piperonal permeation rate in 3in x 3in 2mil LDPE by starting mass
328HFigure 7 - Plot of piperonal permeation rate by bag dimension represents the plotted data
of Mass (grams) vs. Time (days) for a variation in bag dimension: 1in x 1in, 1in x 2in,
1in x 3in, 2in x 2in, and 2in x 3in. For each sample, 2g of piperonal was heat-sealed
within 1.5mil LDPE bags.
This document is a research report submitted to the U.S. Department of Justice. This report has not been published by the Department. Opinions or points of view expressed are those of the author(s) and do not necessarily reflect the official position or policies of the U.S. Department of Justice.

194
Almirall, Diaz-Guerra, Holness and Furton Final Technical Report: 2006-DN-BX-K027
LDPE Bag Dimmension (2g Piperonal)
y = -0.0074x + 2.4401R2 = 0.9846
y = -0.0091x + 2.4319R2 = 0.9847
y = -0.0115x + 2.4277R2 = 0.9857
y = -0.0136x + 2.4267R2 = 0.9839
y = -0.018x + 2.4205R2 = 0.9806
2.0000
2.0500
2.1000
2.1500
2.2000
2.2500
2.3000
2.3500
2.4000
2.4500
2.5000
0 2 4 6 8 10 12 14 16
Time (days)
Mas
s (g
)
1x1
1x2
1x3
2x2
2x3
Figure 11 - Plot of piperonal permeation rate by bag dimension
As expected, the permeation rate is affected by the dimensions of the COMPS device
( 329HTable 2 - Piperonal permeation rate values by bag dimension). The larger the area of the
COMPS device, the faster the permeation rate (208ng/sec for 2x3 bag); conversely, the
smaller the area, the slower the permeation rate (86ng/sec for 1x1 bag). This offers a
second element of control for the creation of COMPS devices other than amount of
piperonal.
This document is a research report submitted to the U.S. Department of Justice. This report has not been published by the Department. Opinions or points of view expressed are those of the author(s) and do not necessarily reflect the official position or policies of the U.S. Department of Justice.

195
Almirall, Diaz-Guerra, Holness and Furton Final Technical Report: 2006-DN-BX-K027
Table 2 - Piperonal permeation rate values by bag dimension
Dimension (in x in)
Area (in2)
Permeation Rate (ng/sec)
1x1 1 86
1x2 2 105
1x3 3 133
2x2 4 157
2x3 6 208
The relationship between permeation rate and bag area (330HFigure 8) is shown to have a
highly correlated linearity (r2 > 0.99). Logically, the permeation rate will continue to
increase as the bag size increases.
Permeation Rate vs. Area
y = 24.853x + 58.433R2 = 0.9984
0.0
50.0
100.0
150.0
200.0
250.0
0 1 2 3 4 5 6 7
Area (in^2)
Rat
e (n
g/s)
Figure 12 - Plot of piperonal permeation rate by bag area
This document is a research report submitted to the U.S. Department of Justice. This report has not been published by the Department. Opinions or points of view expressed are those of the author(s) and do not necessarily reflect the official position or policies of the U.S. Department of Justice.

196
Almirall, Diaz-Guerra, Holness and Furton Final Technical Report: 2006-DN-BX-K027
331HFigure 9 represents the plotted data of Mass (grams) vs. Time (days) for a variation in
bag thickness: 1.5mil LDPE, 2mil LDPE, 3mil LDPE, and 4mil LDPE, and 2mil HDPP.
For each sample, 2g of piperonal was heat-sealed within 3in x 3in bags.
Polymer Thickness (2g Piperonal)
y = -0.019x + 2.4203R2 = 0.9898
y = -0.0161x + 2.5632R2 = 0.9841
y = -0.0141x + 2.7905R2 = 0.9688
y = -0.0113x + 3.1156R2 = 0.9919
y = -0.0007x + 2.721R2 = 0.27
2.0000
2.2000
2.4000
2.6000
2.8000
3.0000
3.2000
0 2 4 6 8 10 12 14 16
Time (days)
Mas
s (g
)
1.5mil2mil3mil4mil2mil HD
Figure 13 - Plot of piperonal permeation rate by polymer thickness
As expected, the permeation rate is affected by the thickness of the LDPE bags (332HTable 3).
The thinner the polymer bag, the faster the permeation rate (220ng/sec for 1.5mil bag);
conversely, the thicker the polymer bag, the slower the permeation rate (131ng/sec for
4mil bag). Permeation through the HDPP bag was even lower than the thickest LDPE
bags (8ng/sec). This is attributed to the increased density and the increased rigidity of the
polypropylene structure over that of the polyethylene structure.
This document is a research report submitted to the U.S. Department of Justice. This report has not been published by the Department. Opinions or points of view expressed are those of the author(s) and do not necessarily reflect the official position or policies of the U.S. Department of Justice.

197
Almirall, Diaz-Guerra, Holness and Furton Final Technical Report: 2006-DN-BX-K027
Table 3 - Piperonal permeation rate values by bag thickness
Bag Thickness (mil)
Permeation Rate (ng/sec)
1.5 220
2 186
3 163
4 131
HD (2mil) 8
The relationship between permeation rate and bag thickness (333HFigure 10) is shown to have
a highly correlated linearity (r2 > 0.96). The plot also shows that the relationship between
permeation rate and bag thickness is inversely proportional. This relationship is to be
expected since the thinner the medium, the easier compounds are able to pass through.
Permeation Rate vs. Thickness
y = -33.31x + 262.5R2 = 0.9651
100
120
140
160
180
200
220
240
1 1.5 2 2.5 3 3.5 4 4.5
Bag Thickness (mil)
Rat
e (n
g/s)
This document is a research report submitted to the U.S. Department of Justice. This report has not been published by the Department. Opinions or points of view expressed are those of the author(s) and do not necessarily reflect the official position or policies of the U.S. Department of Justice.

198
Almirall, Diaz-Guerra, Holness and Furton Final Technical Report: 2006-DN-BX-K027
Figure 14 - Plot of piperonal permeation rate by bag thickness
A summary of the permeation rates of the piperonal COMPS is given in 334HTable 4.
Utilization of this table will help with the selection of training aids that have permeation
rates at different orders of magnitude for threshold testing purposes.
Table 4 - Piperonal permeation rate summary
COMPS Permeation Rate (ng/sec)
10-20 20-50 50-100 100-150 150-200 200-250 11mg 3x3
2mil LDPE X
50mg 3x3 2mil LDPE X
100mg 3x3 2mil LDPE X
200mg 3x3 2mil LDPE X
500mg 3x3 2mil LDPE X
2000mg 3x3 1.5mil LDPE X
2000mg 3x3 2mil LDPE X
2000mg 3x3 3mil LDPE X
2000mg 3x3 4mil LDPE X
2000mg 3x3 2mil HDPP X
2000mg 1x1 1.5mil LDPE X
2000mg 1x2 1.5mil LDPE X
2000mg 1x3 1.5mil LDPE X
2000mg 2x2 1.5mil LDPE X
2000mg 2x3 1.5mil LDPE X
This document is a research report submitted to the U.S. Department of Justice. This report has not been published by the Department. Opinions or points of view expressed are those of the author(s) and do not necessarily reflect the official position or policies of the U.S. Department of Justice.

199
Almirall, Diaz-Guerra, Holness and Furton Final Technical Report: 2006-DN-BX-K027
64BField Trials and Validation of COMPS for Narcotics It has been shown that dogs trained to alert to ecstasy will alert to piperonal [62]. In order
to confirm the reliability and accuracy of piperonal as a training aid, “new canines” were
imprinted on piperonal and then tested with ecstasy samples. The term “new canine”
refers to canines that were not exposed to any type of drug sample prior to or during the
piperonal training process. The training consisted of 2 sessions a day for 5-15 days
(depending on the training agency) using 50g of a piperonal training aid (1:10, piperonal:
matrix). The testing phase consisted of a double-blind line-up using 25g of blank matrix,
50g of the piperonal aid, and 30g of ecstasy tablets. For the line-up, each sample was
placed in a separate scent box/electrical box along a wall. The handlers were instructed to
have their canines sample the odor in each box and identify a response of alert, no-alert,
or extended interest. The results of these tests are given in 335HFigure 11. 100% of the
canines (24 of 24) correctly identified the positive control (50g of piperonal aid) to which
they had been trained. 96% of the canines (23 of 24) gave a final alert response to the
ecstasy tablets after demonstrating their ability to identify the piperonal correctly. The
single canine that did not alert to the ecstasy showed extended interest in the sample, but
did not give a final response.
This document is a research report submitted to the U.S. Department of Justice. This report has not been published by the Department. Opinions or points of view expressed are those of the author(s) and do not necessarily reflect the official position or policies of the U.S. Department of Justice.

200
Almirall, Diaz-Guerra, Holness and Furton Final Technical Report: 2006-DN-BX-K027
0
10
20
30
40
50
60
70
80
90
100
Piperonal Ecstacy
Non-AlertInterestAlert
Figure 15 - Results of ecstasy tested, piperonal imprint canines
After demonstration of piperonal’s capability for reliable MDMA mimicry (e.g. ecstasy),
field tests were held to help determine the canine’s lower threshold of detection. 336HTable 5
shows field results for the first round of double blind field tests of piperonal COMPS
presented in Sigma PseudoTM Scent Cages. The canines that participated in this trial
were certified drug dogs whose training and certification included detection of ecstasy
tablets. The COMPS were created by spiking a 600ppt (part-per-thousand) piperonal
solution in acetonitrile onto sterile gauze. The spiked gauze sat for 20min to allow for the
evaporation of the acetonitrile. Afterwards, the spiked gauze was sealed within 3in x 3in
2mil LDPE bags and then heat sealed within aluminized Kapak bags for travel. As
shown, 60% (3/5) of the dogs alerted to the COMPS devices that possessed 80mg and
120mg of piperonal. For those same COMPS, 100% of the canines showed at least some
interest even though all did not give a final response. No interest or final response alerts
This document is a research report submitted to the U.S. Department of Justice. This report has not been published by the Department. Opinions or points of view expressed are those of the author(s) and do not necessarily reflect the official position or policies of the U.S. Department of Justice.

201
Almirall, Diaz-Guerra, Holness and Furton Final Technical Report: 2006-DN-BX-K027
were seen for any of the other piperonal samples. Based on these results, the lower limit
of detection for piperonal is between 40mg and 80mg.
Table 5 - Piperonal COMPS Field Trials
Piperonal solutions spiked onto gauze, sealed in 2mil LDPE, presented in Sigma Pseudo Cages
Content No Alert Interest Alert % Alert
Silica Blank 115, 116, 117, 118, 119 - - 0
10g Piperonal Silica (10%) 115, 116, 117, 118, 119 - - 0
5g Piperonal Silica (10%) 115, 116, 117, 118, 119 - - 0
Blank COMPS 115, 116, 117, 118, 119 - - 0
120mg in COMPS - 116, 119 115, 117, 118 60%
80mg in COMPS - 115, 116 117, 118, 119 60%
40mg in COMPS 115, 116, 117, 118, 119 - - 0
20mg in COMPS 115, 116, 117, 118, 119 - - 0
The results for the second round of field tests for the lower threshold of piperonal
detection are given in 337HTable 6. The COMPS were created by sealing pure piperonal
within 3in x 3in 2mil LDPE bags. While there was at least interest shown in every
piperonal sample, the only full response alerts occurred with the 5mg sample (4/4, 100%)
and the 25mg piperonal sample (1/4, 25%). These results are in stark contrast to these
from the first field trial results. The threshold of detection for piperonal is quite different
for this second set of dogs. This may have to do with the training that the canines receive.
This document is a research report submitted to the U.S. Department of Justice. This report has not been published by the Department. Opinions or points of view expressed are those of the author(s) and do not necessarily reflect the official position or policies of the U.S. Department of Justice.

202
Almirall, Diaz-Guerra, Holness and Furton Final Technical Report: 2006-DN-BX-K027
One group may train at lower quantities of ecstasy and another group may train upon
larger quantities of ecstasy. This presents problems for both groups: the group with the
lower detection limit may not recognize large quantities of ecstasy (i.e. bulk) while the
converse may be true for the other group.
Table 6 - Piperonal COMPS field trials
Solid piperonal, sealed in 2mil LDPE, presented in Sigma Pseudo Cages
Content No Alert Interest Alert % Alert5mg Pip
2mil LDPE in Electrical Box - - 132, 133, 134, 135 100%
10mg Pip 2mil LDPE in Electrical Box 132, 134 133, 135 - 0%
(50%)
25mg Pip 2mil LDPE in Electrical Box 134 132, 135 133 25%
(75%)
Blank 2mil LDPE in Electrical Box 132, 133, 134, 135 - - 0%
50mg Pip 2mil LDPE in Electrical Box 133, 134, 135 132 - 0%
(25%)
75mg Pip 2mil LDPE in Electrical Box 132, 133, 134 135 - 0%
(25%)
100mg Pip 2mil LDPE in Electrical Box 133, 134, 135 132 - 0%
(25%)
In order to gain a better grasp on the threshold range for piperonal COMPS (both high
and low), several samples were prepared at different orders of magnitude. Based on the
piperonal permeation results from section 338HChapter 1738111889, samples with 10ng/sec,
100ng/sec, and 1000ng/sec permeation rates were selected. The 3in x 3in 2mil HDPP
with 2g was used for the 10ng/sec sample and the 3in x 3in 1.5mil LDPE with 500mg
was used for the 100ng/sec sample. Since there was no COMPS aid with a permeation
rate of 1000ng/sec, five 3in x 3in 1.5mil LDPE with 2g were used in combination (5 x
This document is a research report submitted to the U.S. Department of Justice. This report has not been published by the Department. Opinions or points of view expressed are those of the author(s) and do not necessarily reflect the official position or policies of the U.S. Department of Justice.

203
Almirall, Diaz-Guerra, Holness and Furton Final Technical Report: 2006-DN-BX-K027
210ng/sec). The results from this experimentation are given in 339HTable 7. A logarithmic
plot was created utilizing the % final response alert and permeation rate (340HFigure 12).
Table 7 - Piperonal COMPS field trials
Solid piperonal, sealed in 2mil LDPE, presented in Sigma Pseudo Cages
Content No Alert Interest Alert % Alert
Blank 3” x 3”LDPE in
Sigma Scent Cage
101, 106, 109, 111, 114, 115, 122, 125, 127, 128, 130, 136, 137, 138, 140, 141
- - 0%
10ng/sec 2g in 3”x3” 2mil HDPP in
Sigma Scent Cage
101, 111, 114, 115, 125, 127, 128, 130, 137, 138, 140, 141
- 106, 109, 122, 136 25%
100ng/sec 500mg in 3”x3” 1.5mil LDPE in
Sigma Scent Cage
109, 111, 114, 125, 128, 130, 138, 140,
141 -
101, 106, 115, 122, 127, 136,
137 44%
1000ng/sec 2g in 3”x3” 1.5mil LDPE in
Sigma Scent Cage 138 114, 125, 127
101, 106, 109, 111, 115, 122, 128, 130, 136, 137, 140, 141
75%
A biological dose-response curve is demonstrated by the permeation rate of piperonal
plotted against the behavioral response of the canine. The results suggest that a dose-
response relationship exists between the permeation rate of piperonal and a positive alert
response from trained detector canines. The effective dose for 50% of the canines tested
is approximately 100ng/s.
This document is a research report submitted to the U.S. Department of Justice. This report has not been published by the Department. Opinions or points of view expressed are those of the author(s) and do not necessarily reflect the official position or policies of the U.S. Department of Justice.

204
Almirall, Diaz-Guerra, Holness and Furton Final Technical Report: 2006-DN-BX-K027
0
10
20
30
40
50
60
70
80
10 100 1000
Permeation Rate (ng/s)
Res
pons
e (%
Can
ine
Ale
rt)
Figure 16 - Logarithmic plot of canine alert response vs. piperonal permeation rate
65BCOMPS Odor Delivery of Explosive After examination of the high and low explosives headspace, the dominant compounds
present in the odor of the explosives were identified. The next step was to develop an
optimized odor delivery system for the selected compounds to be used in the explosive
mimics. This was accomplished through the creation of six different COMPS devices
constructed with 3in x 3in 2mil LDPE bags. The six COMPS included one compound for
TNT based explosives, one compound for nitroglycerine based explosives, one
compound for tagged explosives, one compound for plasticized explosives, and two
compounds for smokeless powders. Two compounds were selected for the smokeless
powders because of the lack of a single compound which is present in all smokeless
powders that was readily detectable in the headspace of the powders (i.e. a highly volatile
compound).
This document is a research report submitted to the U.S. Department of Justice. This report has not been published by the Department. Opinions or points of view expressed are those of the author(s) and do not necessarily reflect the official position or policies of the U.S. Department of Justice.

205
Almirall, Diaz-Guerra, Holness and Furton Final Technical Report: 2006-DN-BX-K027
Based on the results of the headspace analysis of the high explosives and low explosives
using SPME-GC-MS, it was determined that select smokeless powders could be used as
explosive mimics for select high explosives. The first example of this would be the use of
a single based smokeless powder for the TNT based Explosive Mimic. In order for the
single based smokeless powder to accurately mimic TNT-based explosives, a common
headspace compound would need to be present in both the selected powder and high
explosive. The results of this study suggest that the compound 2,4-dinitrotoluene would
be the most likely choice. The level of 2,4-dinitrotoluene varies among smokeless
powders both across brands and within brands. It must also be noted that some powders
do not possess 2,4-dinitrotoluene (e.g. VihtaVuori powders). The levels of 2,4-
dinitrotoluene detected using HS-SPME-GC-MS for the single based powders are shown
in 341HFigure 13. Using this information, a powder with a mid-range level of 2,4-
dinitrotoluene could be selected.
This document is a research report submitted to the U.S. Department of Justice. This report has not been published by the Department. Opinions or points of view expressed are those of the author(s) and do not necessarily reflect the official position or policies of the U.S. Department of Justice.

206
Almirall, Diaz-Guerra, Holness and Furton Final Technical Report: 2006-DN-BX-K027
Figure 17 - Detected levels of 2,4-dinitrotoluene
Single based smokeless powder samples using HS-SPME-GC-MS
In order to accurately mimic nitroglycerine based explosives, a double based smokeless
powder with a high level of nitroglycerine should be chosen. Nitroglycerine has a highly
volatile nature; however this study was unable to reliably detect nitroglycerine levels
within the double based powders. This is because of the thermal degradation associate
with the use of GC-MS analysis. Nitroglycerine levels of the double based smokeless
powders can be found in the MSDS sheets provided by the smokeless powder company.
The smokeless powder mimics each used a compound that was found to be common
among most of the powders. Smokeless Powder Mimic 1 used the stabilizer ethyl
centralite and Smokeless Powder Mimic 2 used the stabilizer diphenylamine. The Tagged
Explosive Mimic used the common compound 2,3-dimethyl-2,3-dinitrobutane. Lastly, 2-
This document is a research report submitted to the U.S. Department of Justice. This report has not been published by the Department. Opinions or points of view expressed are those of the author(s) and do not necessarily reflect the official position or policies of the U.S. Department of Justice.

207
Almirall, Diaz-Guerra, Holness and Furton Final Technical Report: 2006-DN-BX-K027
ethyl-1-hexanol was used as the odor compound for the Plasticized Explosive Mimic.
The solid compounds (single based powder, double based powder, ethyl centralite,
diphenylamine, and 2.3-dimethylso-2,3-dinitrobutane) were weighed out and heat-sealed
directly into the polymer bag. The liquid sample (2-ethyl-1-hexanol) was spiked onto
sterile gauze which was then heat-sealed within the polymer bag.
Once the COMPS were prepared, they were again monitored (weighed) over the course
of fifteen days to determine the mass loss per time, i.e. the permeation rate through the
polymer bags. At the conclusion of the weighing process, the data was plotted as mass vs.
time. A linear-fit application yielded a direct value of permeation rate in grams per day
(g/d) which was converted to a permeation rate in nanograms per second (ng/sec). 342HFigure
14, 343HFigure 15, 344HFigure 16, 345HFigure 17, 346HFigure 18 and 347HFigure 19 give the permeation results
of the six explosive mimic COMPS. A summary of the permeation rates for the explosive
mimic COMPS is given in 348HTable 8.
The ethyl centralite COMPS was based on a 10g sample. 349HFigure 14 represents the plotted
data of Mass (grams) vs. Time (days) for the ethyl centralite COMPS. The permeation
rate for ethyl centralite was determined to be 3.5g/s.
This document is a research report submitted to the U.S. Department of Justice. This report has not been published by the Department. Opinions or points of view expressed are those of the author(s) and do not necessarily reflect the official position or policies of the U.S. Department of Justice.

208
Almirall, Diaz-Guerra, Holness and Furton Final Technical Report: 2006-DN-BX-K027
y = ‐0.0003x + 9.9226R² = 0.9899
9.9175
9.9180
9.9185
9.9190
9.9195
9.9200
9.9205
9.9210
9.9215
9.9220
9.9225
9.9230
0 2 4 6 8 10 12 14 16 18
Mass (g)
Time (days)
Ethyl Centralite
Figure 18 - Ethyl centralite permeation rate 2mil 3in x 3in LDPE
The diphenylamine COMPS was based on a 10g sample. 350HFigure 15 represents the plotted
data of Mass (grams) vs. Time (days) for the diphenylamine COMPS. The permeation
rate for diphenylamine was determined to be 34.7ng/s.
This document is a research report submitted to the U.S. Department of Justice. This report has not been published by the Department. Opinions or points of view expressed are those of the author(s) and do not necessarily reflect the official position or policies of the U.S. Department of Justice.

209
Almirall, Diaz-Guerra, Holness and Furton Final Technical Report: 2006-DN-BX-K027
y = ‐0.003x + 9.968R² = 0.9975
9.9100
9.9200
9.9300
9.9400
9.9500
9.9600
9.9700
0 2 4 6 8 10 12 14 16 18
Mass (g)
Time (days)
Diphenylamine
Figure 19 - Diphenylamine permeation rate 2mil 3in x 3in LDPE
The 2,3-dimethyl-2,3-dinitrobutane COMPS was based on a 10g sample. 351HFigure 16
represents the plotted data of Mass (grams) vs. Time (days) for the 2,3-dimethyl-2,3-
dinitrobutane COMPS. The permeation rate for 2,3-dimethyl-2,3-dinitrobutane was
determined to be 2.3ng/s.
This document is a research report submitted to the U.S. Department of Justice. This report has not been published by the Department. Opinions or points of view expressed are those of the author(s) and do not necessarily reflect the official position or policies of the U.S. Department of Justice.

210
Almirall, Diaz-Guerra, Holness and Furton Final Technical Report: 2006-DN-BX-K027
y = ‐0.0002x + 9.9751R² = 0.9835
9.9710
9.9715
9.9720
9.9725
9.9730
9.9735
9.9740
9.9745
9.9750
9.9755
0 2 4 6 8 10 12 14 16 18
Mass (g)
Time (days)
2,3‐Dimethyl‐2,3‐dinitrobutane
Figure 20 - DMNB permeation rate 2mil 3in x 3in LDPE
The 2-ethyl-1-hexanol COMPS was based on a 1mL spiked onto gauze. 352HFigure 17
represents the plotted data of Mass (grams) vs. Time (days) for the 2-ethyl-1-hexanol
COMPS. The permeation rate for 2-ethyl-1-hexanol was determined to be 312.5ng/s.
This document is a research report submitted to the U.S. Department of Justice. This report has not been published by the Department. Opinions or points of view expressed are those of the author(s) and do not necessarily reflect the official position or policies of the U.S. Department of Justice.

211
Almirall, Diaz-Guerra, Holness and Furton Final Technical Report: 2006-DN-BX-K027
y = ‐0.027x + 0.8688R² = 0.9992
0.0000
0.1000
0.2000
0.3000
0.4000
0.5000
0.6000
0.7000
0.8000
0.9000
0 2 4 6 8 10 12 14 16
Mass (g)
Time (days)
2‐Ethyl‐1‐hexanol
Figure 21 - 2-Ethyl-1-hexanol permeation rate 2mil 3in x 3in LDPE
The single based smokeless powder COMPS was based on a 10g sample. 353HFigure 18
represents the plotted data of Mass (grams) vs. Time (days) for the single based
smokeless powder COMPS. The permeation rate for the single based smokeless powder
was determined to be 11.6ng/s.
This document is a research report submitted to the U.S. Department of Justice. This report has not been published by the Department. Opinions or points of view expressed are those of the author(s) and do not necessarily reflect the official position or policies of the U.S. Department of Justice.

212
Almirall, Diaz-Guerra, Holness and Furton Final Technical Report: 2006-DN-BX-K027
y = ‐0.001x + 9.992R² = 0.9906
9.9740
9.9760
9.9780
9.9800
9.9820
9.9840
9.9860
9.9880
9.9900
9.9920
0 2 4 6 8 10 12 14 16 18
Mass (g)
Time (days)
Single Based Smokeless Powder
Figure 22 - Single based smokeless powder permeation rate 2mil 3in x 3in LDPE
The double based smokeless powder COMPS was based on a 10g sample. 354HFigure 19
represents the plotted data of Mass (grams) vs. Time (days) for the double based
smokeless powder COMPS. The permeation rate for the double based smokeless powder
was determined to be 9.3ng/s.
This document is a research report submitted to the U.S. Department of Justice. This report has not been published by the Department. Opinions or points of view expressed are those of the author(s) and do not necessarily reflect the official position or policies of the U.S. Department of Justice.

213
Almirall, Diaz-Guerra, Holness and Furton Final Technical Report: 2006-DN-BX-K027
y = ‐0.0008x + 9.9481R² = 0.9616
9.9320
9.9340
9.9360
9.9380
9.9400
9.9420
9.9440
9.9460
9.9480
9.9500
0 2 4 6 8 10 12 14 16 18
Mass (g)
Time (days)
Double Based Smokeless Powder
Figure 23 - Double based smokeless powder permeation rate 2mil 3in x 3in LDPE
As seen in 355HTable 8, the permeation rates vary depending on the compound. The fastest
permeation rate (313.7ng/s) is from the compound 2-ethyl-1-hexanol while the slowest
permeation rates were from the taggant, 2,3-dimethyl-2,3-dinitrobutane (2.3ng/s), and the
stabilizer, ethyl centralite (3.5ng/s). Because 2-ethyl-1-hexanol has a high volatility
(3.6×10⁻¹ mmHg at 20°C [183]) and is the smallest molecule of the set (130g/mol), it was
expected to pass through the polymer membrane at the fastest rate. The compound
DMNB possesses what is considered to be a low vapour pressure (2.07×10⁻³ mmHg at
25°C [184]). Possessing a lower vapour pressure translates to a slow rate of dissipation
which is a good quality for a taggant, such as DMNB. This will help ensure the longevity
(i.e. shelf life) as a detectable compound in high explosives. Ethyl centralite possesses a
This document is a research report submitted to the U.S. Department of Justice. This report has not been published by the Department. Opinions or points of view expressed are those of the author(s) and do not necessarily reflect the official position or policies of the U.S. Department of Justice.

214
Almirall, Diaz-Guerra, Holness and Furton Final Technical Report: 2006-DN-BX-K027
high vapour pressure (6×10⁻⁶ mmHg at 20°C [183]), but the increased size of the
molecule (287g/mol) slows the escape through the polymer bags giving a reduced
permeation rate.
Table 8 - Explosive mimic compound permeation rate in 2mil 3in x3in LDPE
Compound Permeation Rate (ng/sec)
Single Based Powder 11.6
Double Based Powder 9.3
Diphenylamine 34.7
Ethyl Centralite 3.5
DMNB 2.3
2-Ethyl-1-hexanol 312.5
The masses that were selected for the aids were chosen for two purposes: availability of
odor and expense. The ultimate concept of the optimized explosive training aids is the
development of a non-hazardous, non-explosive, commercially available, inexpensive,
and comprehensive kit. To keep the cost low, a minimum amount of COMPS devices
were used while still maintaining detectable levels of odor. The optimized kit possessed
multiple samples of each of the explosive COMPS described in this section. This allowed
for the trainers to utilize as much or as little as they feel is necessary for training purposes
while still maintaining the low expense.
66BField Trials and Validation of COMPS for Explosives Preliminary field results for TNT and nitroglycerine mimics were collected by supplying
a local Alcohol Tobacco Firearms and Explosives (ATF) certified canine trainer with
This document is a research report submitted to the U.S. Department of Justice. This report has not been published by the Department. Opinions or points of view expressed are those of the author(s) and do not necessarily reflect the official position or policies of the U.S. Department of Justice.

215
Almirall, Diaz-Guerra, Holness and Furton Final Technical Report: 2006-DN-BX-K027
samples of a single based powder and double based powder. The selected powders
possessed a detectable level of 2,4-dinitrotoluene and nitroglycerine, respectively. As
with the piperonal imprint, the explosive mimic training utilized “new canines”. In this
case, the term “new canine” refers to canines that were not exposed to any type of
explosive sample prior to or during the TNT and nitroglycerine mimic training process.
The training consisted of 2 sessions a day for 5 days using 50g of both the single based
and double based smokeless powders. The testing phase was kept double-blind and
consisted of a line-up of 50g of each smokeless powder used during training and 30g of
TNT and dynamite (both supplied by the trainer). For the line-up, each sample was
placed in a separate scent box/electrical box along a wall. Each handler was instructed to
have their canine sample the odor emanating from each box and then to interpret their
canine’s response as an alert, a no-alert, or interest. 356HFigure 20 shows that 100% of the
canines (4 out of 4) alerted to the high explosives after demonstrating their ability to
correctly identify the powders upon which they were trained.
This document is a research report submitted to the U.S. Department of Justice. This report has not been published by the Department. Opinions or points of view expressed are those of the author(s) and do not necessarily reflect the official position or policies of the U.S. Department of Justice.

216
Almirall, Diaz-Guerra, Holness and Furton Final Technical Report: 2006-DN-BX-K027
Figure 24 - Field test results from smokeless powder imprint
Four additional explosive mimics were created based on the results seen from the
headspace analysis of the high explosives performed in the laboratory by headspace Solid
Phase Micro- extraction (HS-SPME-GC/MS).
These six mimics were assembled for use in a comprehensive explosive training aid kit.
The six-member kit was presented to trained, certified explosive canine teams for
verification of the odor recognition. 357HTable 9 shows the results from this validation
process. There was 100% identification/alert by the canine teams for the TNT Mimic, the
NG Mimic and the Plasticized Explosive Mimic. Thirteen of the fourteen canines alerted
to Smokeless Powder Mimic 2 yielding 93% recognition. The canine that did not alert to
Smokeless Powder Mimic 2 (canine 207) showed extended interest in the training aid.
Smokeless Powder Mimic 1 results were slightly lower with twelve of fourteen dogs
giving an alert response (86%), one canine showing extended interest (canine 211), and
This document is a research report submitted to the U.S. Department of Justice. This report has not been published by the Department. Opinions or points of view expressed are those of the author(s) and do not necessarily reflect the official position or policies of the U.S. Department of Justice.

217
Almirall, Diaz-Guerra, Holness and Furton Final Technical Report: 2006-DN-BX-K027
one canine showing no recognition (canine 221). The canine that did not alert to
Smokeless Powder Mimic 1 may not have been trained on powders that possessed this
compound. This demonstrates the necessity for multiple training aids for smokeless
powders. The lowest identification/alert percentage was seen in recognition of the Tagged
Explosive Mimic at 71%. The tagged component utilized for the Tagged Explosive
Mimic has a limited shelf life as compared to the explosive; therefore, canine recognition
is dependent on the age of the tagged explosives being utilized in training by law
enforcement.
Table 9 - Proofing results from IFRI explosive kit
Content No Alert Interest Alert % Alert
TNT Mimic - - 202, 206, 207, 208, 209, 210, 211, 212, 213, 214, 215, 221, 222, 223 100%
NG Mimic - - 202, 206, 207, 208, 209, 210, 211, 212, 213, 214, 215, 221, 222, 223 100%
Tagged Explosive Mimic
206, 207, 211, 212 - 202, 208, 209 210, 213, 214, 215,
221, 222, 223 71%
Plasticized Explosive Mimic - - 202, 206, 207, 208, 209, 210, 211,
212, 213, 214, 215, 221, 222, 223 100%
Smokeless Powder Mimic 1 221 211 202, 206, 207, 208, 209, 210, 212,
213, 214 215, 222, 223 86%
(93%)
Smokeless Powder Mimic 2 - 207 202, 206, 208 209, 210, 211 212,
213, 214, 215, 221, 222, 223 93%
(100%)
Upon verification that the odors within the kit were recognized by trained canines, the kit
was used for training purposes with new untrained canines. The trainers were instructed
This document is a research report submitted to the U.S. Department of Justice. This report has not been published by the Department. Opinions or points of view expressed are those of the author(s) and do not necessarily reflect the official position or policies of the U.S. Department of Justice.

218
Almirall, Diaz-Guerra, Holness and Furton Final Technical Report: 2006-DN-BX-K027
to train per their normal routine utilizing the training aids within the kit in place of actual
explosive samples. Additionally, the trainers/handlers were informed that the canines
were not to be exposed to actual explosives until the conclusion of the training. This
condition was maintained to ensure the validity of the results when using the mimic kit.
At the conclusion of training, the canines were tested using actual explosive samples
already in the possession of the ATF certified canine trainers. 358HTable 10 shows the results
of the testing phase. As shown, 100% of the canines trained upon the IFRI kit gave a final
alert response to all of the actual explosives. This demonstrates the reliability in the
selection of the compounds used for the training aids within the IFRI kit as mimics for
specific classes of explosives.
Table 10 - IFRI Explosive Kit Results
(a) US K-9 Dog Academy (b) Prince George’s Co. SD – included among 19 high and low explosives
Content No Alert Interest Alert % Alert
TNTa,b - - 216, 217, 218, 219, 220 100%
Slurryb - - 216, 217, 218, 219, 220 100%
Dynamitea,b - - 216, 217, 218, 219, 220 100%
PETN Det Corda,b - - 216, 217, 218, 219, 220 100%
C-4a,b - - 216, 217, 218, 219, 220 100%
Single Based SPa,b - - 216, 217, 218, 219, 220 100%
Double Based SPa,b - - 216, 217, 218, 219, 220 100%
This document is a research report submitted to the U.S. Department of Justice. This report has not been published by the Department. Opinions or points of view expressed are those of the author(s) and do not necessarily reflect the official position or policies of the U.S. Department of Justice.

219
Almirall, Diaz-Guerra, Holness and Furton Final Technical Report: 2006-DN-BX-K027
Chapter 9 9BCONCLUSIONS 67BStatic PSPME This study has shown that by altering the widely-used SPME fiber type to a planar
geometry SPME device, the surface area is greatly increased by a factor of 50 to 100
times. As a result, the capacity is also increased because the volume of the SPME phase
is increased by a factor of at least 16 times over the fiber geometry. The use of PSPME
for static sampling from closed systems enhanced analyte recovery at least 10 times when
extracting even trace amounts. Another advantage is the decrease in equilibrium time
required for extraction of TNT, from more than 10 hr down to 40 min, for example.
Although sampling at equilibrium results in the highest signal, it has been shown that
sampling at pre-equilibrium (on the order of min), does result in detectable signals.
Because of the reduction in equilibrium time, faster on-site analyses can be conducted
with this geometry when compared to fiber SPME.
When comparing two PSPME devices for the extraction of TNT, sol-gel PDMS takes
longer to reach equilibrium than PDMS due to its increased capacity over PDMS
PSPME, yet for shorter extraction times, PDMS produces a consistently higher signal.
The PDMS PSPME device affords higher throughput with increased sensitivity at shorter
extraction times, while sol-gel PDMS PSPME is designed for applications that can
accommodate longer sampling times and require even higher sensitivity.
Extraction of more volatile compounds such as taggants (4-NT) and volatile signatures
from their parent compounds (cyclohexanone from RDX, 2,4-DNT, etc.) has been shown
to be practical and effective when coupled with fast detection by IMS. In particular, the
PSPME-IMS method was applied to the analysis of odor compounds from drugs at a
This document is a research report submitted to the U.S. Department of Justice. This report has not been published by the Department. Opinions or points of view expressed are those of the author(s) and do not necessarily reflect the official position or policies of the U.S. Department of Justice.

220
Almirall, Diaz-Guerra, Holness and Furton Final Technical Report: 2006-DN-BX-K027
local crime laboratory, where in a blind study of suspected MDMA tablets, 100 % correct
detection of the target analytes was achieved in short sampling times (15 min). The
SPME fiber-IMS method, although sensitive for the detection of piperonal, produced a
false negative for one blind case that in fact had a minute concentration of MDMA. The
extraction of piperonal with PSPME was enhanced over 600 times due to the capacity of
PSPME that enabled quantitation of a dimer product ion peak seen at high concentration
of piperonal. This peak was not seen in significant intensities when extracting by fiber
SPME because capacity had been reached. The volatile chemical signatures of smokeless
powders were also successfully extracted and detected using PSPME-IMS, where
sampling of the standards proved difficult.
Alternate phase chemistries for static PSPME were also tested. Besides sol-gel PDMS,
which demonstrated enhanced surface area and capacity from the presence of sol-gel
nanoparticles, and PDMS that has fast absorption/desorption kinetics, selective coatings
based on La (dihed) proved to enhance the extraction efficiency and retention of two
important volatile chemical signatures, TNT and 2,4-DNT over sol-gel PDMS and PDMS
PSPME devices. The results obtained provide motivation for continued work to further
improve the thermal stability and reduce the hygroscopicity of the La (dihed) component
by incorporation into a sol-gel network.
Finally, with PSPME, it is no longer necessary to fabricate an interface between SPME
and each particular IMS instrument model since with the planar geometry of PSPME is
readily compatible with the already large installed base of IMS instruments. As a result,
This document is a research report submitted to the U.S. Department of Justice. This report has not been published by the Department. Opinions or points of view expressed are those of the author(s) and do not necessarily reflect the official position or policies of the U.S. Department of Justice.

221
Almirall, Diaz-Guerra, Holness and Furton Final Technical Report: 2006-DN-BX-K027
no significant modification of the security infrastructure should be necessary for
implementation of PSPME for screening purposes.
68BDynamic PSPME The static PSPME pre-concentration device was improved by development of dynamic
PSPME that enables rapid open air sampling of the volatile chemical signatures of drugs
and explosives for direct introduction into existing IMS instruments. Dynamic PSPME is
accomplished by use of a planar device that allows sampling of a large volume of air and
has a high surface area for the capture and strong retention of these compounds from air.
These attributes suggest dynamic PSPME as an exhaustive sampler, as opposed to the
other SPME configurations that are generally considered as non-exhaustive, equilibrium-
based sampling devices. This is advantageous when extracting trace amounts of volatile
chemical signatures diluted in a large volume of air, as is the case when sampling in the
field. Dynamic PSPME affords improved desorption profiles over static PSPME. This
device was developed and optimized in a manner applicable to field sampling using an
accessory, the handheld vacuum, as a portable, easy-to-use pump, that is already
available and in use for the collection of particles.
The results obtained for the novel device demonstrate that even with a minimal amount of
emitting source present, the dynamic PSPME-IMS method performs well as a rapid and
sensitive screening tool applicable for field analysis.
Dynamic PSPME represents a significant improvement in detection of drugs and
explosives via their volatile chemical signatures since it more closely resembles sampling
by trained canines. Dynamic PSPME was tested on the same COMPS devices used to
This document is a research report submitted to the U.S. Department of Justice. This report has not been published by the Department. Opinions or points of view expressed are those of the author(s) and do not necessarily reflect the official position or policies of the U.S. Department of Justice.

222
Almirall, Diaz-Guerra, Holness and Furton Final Technical Report: 2006-DN-BX-K027
determine and calibrate canine sensitivity. This biological detector uses a dynamic
sampling process to allow for rapid detection over a large search area. By coupling a
sensitive, portable, and rapid dynamic sampling device (effective preconcentration of
analytes present in air at the ppt level) with a sensitive (ng-pg detection limits) and rapid
(ms response) detector, PSPME-IMS is one step closer to the gold standard in explosives
and drug detection.
69BPSPME Terminology It is important to emphasize that the PSPME devices developed in this research are based
on the solid phase microextraction technique, with an alternative configuration. PSPME
should not be thought of as an extension of solid phase extraction (SPE). SPE is a three-
step process whereby the sample is passed through a sorbent bed and the sample is
exhaustively extracted from the matrix to the sorbent material. In the second step,
unwanted analytes (interferences) are removed from the sorbent by selecting an
appropriate solvent/solution capable of desorbing the unwanted analytes. The desired
analytes remain on the sorbent and then are washed out by another solvent/solution that is
able to elute the desired analytes. This eluent can be concentrated to the desired volume
by evaporation. SPME, on the other hand, is an equilibrium technique that employs a
coating with a high affinity for the desired analytes. Mass transfer occurs upon contact
with the sample, and the analytes are absorbed/adsorbed, depending on the phase
chemistry are subsequently introduced into the analytical instrument. There is no
intermediate clean up step and SPME is a solvent-free technique. Additionally, SPME
devices have an open bed structure relative to SPE devices where the sampling media
This document is a research report submitted to the U.S. Department of Justice. This report has not been published by the Department. Opinions or points of view expressed are those of the author(s) and do not necessarily reflect the official position or policies of the U.S. Department of Justice.

223
Almirall, Diaz-Guerra, Holness and Furton Final Technical Report: 2006-DN-BX-K027
(disks, packing, etc.) are packed into a cartridge. With SPME, the extraction phase is
itself accessible for instrumental analysis.
The dynamic PSPME devices developed satisfy all these requirements. Extraction occurs
when the device comes into contact with the sample (volatile chemical signatures in air),
it has an open bed structure, no clean up is required, and the device has intimate and
direct access to the instrumentation for desorption of the analytes from the extraction
phase. Lastly, of the many configurations that SPME can take including fiber, vessel
walls, disk/ membrane, etc, this is the first report of the planar configuration of SPME
(high surface area) that allows both static and dynamic sampling (flow through and
simultaneous extraction of volatile and semi-volatile compounds from air) for direct
introduction into the IMS instrumentation. The work herein shows development of a
novel PSPME device that allows air pumping, the dynamic sampling configuration of
SPME, a considerable advancement since only static PSPME sampling was previously
possible. Dynamic PSPME allows the open system sampling of air in seconds because of
the reduction in boundary layer thickness resulting from constant agitation provided by
pumping. The novel features of static and dynamic planar SPME, allow for the new
acronym PSPME.
70BImplications of PSPME-IMS for Security The advent of PSPME provides a much-needed rapid, sensitive and cost-effective pre-
concentration and sampling device for security applications. First, this research has
demonstrated that PSPME in both sampling configurations is effective at detecting drugs
and explosives from large volume spaces. The PSPME device is operationally feasible
since it is low cost, easy to use, reusable, and easily couples to existing IMS detectors. It
This document is a research report submitted to the U.S. Department of Justice. This report has not been published by the Department. Opinions or points of view expressed are those of the author(s) and do not necessarily reflect the official position or policies of the U.S. Department of Justice.

224
Almirall, Diaz-Guerra, Holness and Furton Final Technical Report: 2006-DN-BX-K027
is envisioned that the static PSPME devices can be placed inside cargo containers before
transport in order to take advantage of the long dwell times during shipment, which can
be up to 2 weeks. Then, upon arrival at port, IMS detectors, already in place, can be use
to analyze the absorbed compounds on the devices. This would be a simple, non-intrusive
and inexpensive way of helping to meet the screening of 100 % of cargo containers that
could be implemented rapidly. A similar methodology could be extended to help meet the
100 % air cargo screening demand instead by using the dynamic PSPME method
sampling near baggage much the same as canines are used. Additional applications of
PSPME include medical screening for diseases from breath analysis and have yet to be
explored.
71BFuture Directions Future work on PSPME would involve the development of alternate chemistries that
provide more selectivity for the volatile chemical signatures even in the presence of
interferents. The most obvious route is to continue to optimize the La (dihed) chemistry.
Also, it was an unexpected result, but sol-gel dipped in methanol for 1 hr prior to
sampling increased extraction efficiency. Methanol is likely a porogenic solvent that
further increases sites and surface area for absorption and this should be further explored.
In terms of dynamic PSPME, a net could be stamped out into a fiberglass filter, coated
and, cured. This would allow sampling of a greater volume of air, which may help
improve extraction outcomes.
Work on the field applications of static and dynamic PSPME should be continued. Cargo
container sampling must be done to simulate conditions that the sampling devices would
This document is a research report submitted to the U.S. Department of Justice. This report has not been published by the Department. Opinions or points of view expressed are those of the author(s) and do not necessarily reflect the official position or policies of the U.S. Department of Justice.

225
Almirall, Diaz-Guerra, Holness and Furton Final Technical Report: 2006-DN-BX-K027
be subject to. The air around packaged explosives (military and improvised) must also be
sampled, in conjunction with law enforcement, preferably with the dynamic PSPME
since rapid sampling times would be required for this application. Lastly, in collaboration
with military and law enforcement partners, the volatile chemical signatures of pre-blast
and post detonation homemade explosive devices, made under different (illicit) protocols,
must be determined by a confirmatory technique such as GC/MS. This would be followed
by method development with PSPME-IMS.
72BControlled Odor Mimic Permeation System Piperonal has been shown to be a dominant odor compound in the headspace of some
ecstasy samples and a recognizable odor mimic by trained detection canines. The
threshold level of piperonal (i.e. ~50% canines with a correct positive alert) while using
the COMPS devices was found to be approximately 100ng/s.
.
Because of the similarities within respective explosive classes (i.e. TNT-based, plastics,
smokeless powders, etc.), several compounds were chosen for explosive mimics. A single
based powder with an easily detectable level of 2,4-DNT was shown to be a reliable
mimic for detection training of TNT-based explosives. A double based powder with an
easily detectable level of nitroglycerine was shown to be a reliable mimic for detection
training of NG-based explosives. The plasticizer 2-ethyl-1-hexanol was shown to be a
reliable mimic for detection training of plastic explosives. The taggant DMNB was
shown to be a reliable mimic for detection training of tagged explosives. Ethyl centralite
and diphenylamine can be used in combination for reliable mimicry of all single based
and double based smokeless powders. The combination of these six odors represents a
This document is a research report submitted to the U.S. Department of Justice. This report has not been published by the Department. Opinions or points of view expressed are those of the author(s) and do not necessarily reflect the official position or policies of the U.S. Department of Justice.

226
Almirall, Diaz-Guerra, Holness and Furton Final Technical Report: 2006-DN-BX-K027
comprehensive explosive odor kit for the explosive groups they represent. This was
demonstrated by the by training and imprint of the mimics on canines followed by
detection of actual explosive samples.
This document is a research report submitted to the U.S. Department of Justice. This report has not been published by the Department. Opinions or points of view expressed are those of the author(s) and do not necessarily reflect the official position or policies of the U.S. Department of Justice.

227
Almirall, Diaz-Guerra, Holness and Furton Final Technical Report: 2006-DN-BX-K027
REFERENCES
[] Public Law 104-132, Antiterrorism and Effective Death Penalty Act of 1996; Section 603; April 24, 1996. [2] Connelly, J.M.; Curby, W.A.; Fox, F.T.; and Hallowell, S.F. Detection of hidden explosives, In: Forensic Investigations of Explosions. Ed: Beveridge, A.D., 1998,Taylor & Francis, London, pp 45-74. [3] Statement of the Sporting Arms and Ammunition Manufacturers' Institute in the H.R. 1710 (The Comprehensive Anti-Terrorism Act of 1995) hearings before the House Committee on the Judiciary, June 13, 1995, distributed to the committee on January 15, 1998. [4] National Research Council. Black and smokeless powders: technologies for finding bombs and the bomb makers, 1998, National Academy Press, Washington, D.C. [5] Public Law 110-53, 9/11 Act.; August 3, 2007. [6] Air Cargo. http://www.tsa.gov/what_we_do/layers/aircargo/index.shtm, accessed January 4, 2010.
[7] Chris Strohm, U.S. Lacks Technology to Meet Air Cargo Screening Goal, March 19, 2009, http://gsn.nti.org/gsn/nw_20090319_2186.php, accessed January 4, 2010.
[8] Container Security Initiative 2006-2011, U.S. CUSTOMS AND BORDER PROTECTION, Pub# 0000-0703 August 2006, Washington, D.C. [9]Global Security Newswire, Napolitano Says U.S. Cannot Meet Cargo-Screening Goal, Thursday, December 3, 2009, http://www.globalsecuritynewswire.org/gsn/nw_20091203_5175.php, accessed January 4, 2010. [10]Secure Freight Initiative, Department of Homeland Security, http://www.dhs.gov/files/programs/gc_1166037389664.shtm#2, accessed January 4, 2010. [1]Lieberman, Collins React to Limited Progress on 100 Percent Cargo Scanning at Foreign Ports, Senate Committee on Homeland Security and Governmental Affairs http://hsgac.senate.gov/public/index.cfm?FuseAction=Press.MajorityNews&ContentRecord_id=5105ac86-5056-8059-76ae-28516ab3dfac, accessed January 4, 2010.
This document is a research report submitted to the U.S. Department of Justice. This report has not been published by the Department. Opinions or points of view expressed are those of the author(s) and do not necessarily reflect the official position or policies of the U.S. Department of Justice.

228
Almirall, Diaz-Guerra, Holness and Furton Final Technical Report: 2006-DN-BX-K027
[2] The U.S. Coast Guard Strategy for Maritime Safety, Security, and Stewardship Washington, D.C. Pub # 20593-0001, January 19, 2007. [3] Drug Interdiction, http://www.uscg.mil/hq/cg5/cg531/drug_interdiction.asp, accessed December 1, 2009. [4] Office of Law Enforcement (CG-531), http://www.uscg.mil/hq/cg5/cg531/Drugs/stats.asp, accessed December 1, 2009. [5] MDMA (Ecstacy) Abuse. National Institute On Drug Abuse. Pub# 06-4728. National Institutes of Health, Washington, D.C., March 2006. [6] Cole, M. D. The Analysis of Controlled Substances. 2003, John Wiley and Sons West Sussex, England. [7] Eiceman, Karpas Ion Mobility Spectrometry, 2nd Ed. CRC Press, Boca Raton, 2005. [8] Griffy, T.A. A model of explosive vapor concentration II, in Proceedings of the Fourth International Symposium on the Analysis and Detection of Explosives. Ed.: J. Yinon, 1992, Kluwer-Academic, New York, pp. 503-511. [9] Perr, J.M., Furton, K.G., Almirall, J.R., J. Sep. Sci. 2005, 28, 177. [20] Akhavan, J. The Chemistry of Explosives. 2nd Ed., Royal Society of Chemistry, 2004. [2] Bender, E.C. Analysis of Low Explosives. In: Forensic Investigation of Explosions; Ed.:Beveridge, A.D., 1998, Taylor & Francis, London, pp 343-385. [22] Hopler, R. B. In: Forensic Investigation of Explosives; Beveridge, A.D., Ed.; Taylor & Francis: London, 1998, pp 1-13. [23] Heramb, R.M.; McCord, B.R. The Manufacture of Smokeless Powders and their Forensic Analysis: A Brief Review, Forensic Science Communications, April 2002 Vol 4 (2). http://www.fbi.gov/hq/lab/fsc/backissu/april2002/mccord.htm, accessed January 23, 2010. [24] Furton, K.J.; Myers, L.J. Talanta 2001, 5, 487. [25] Yinon, J. Trends in Analytical Chemistry 2002, 21, 292. [26] Conrad, F.J. Nuclear Materials Management 1984, 13, 212 [27] Harper, R.J.; Almirall, J.R.; Furton, K.G. Talanta 67 (2005) 313. [28] Beveridge, A.D. Forensic Sci Rev 1992, 4(17), 18.
This document is a research report submitted to the U.S. Department of Justice. This report has not been published by the Department. Opinions or points of view expressed are those of the author(s) and do not necessarily reflect the official position or policies of the U.S. Department of Justice.

229
Almirall, Diaz-Guerra, Holness and Furton Final Technical Report: 2006-DN-BX-K027
[29] DEA Mission Statement, http://www.justice.gov/dea/agency/mission.htm, accessed Jan. 23, 2010. [30] Public Law 91-513, Controlled Substances Act, October 27, 1970. [31] Savelli, L. Street Drugs. Looseleaf Law Publications, Inc. Flushing, NY, 2008. [32] Dejarme, L. E.; Gooding, R.E.; Lawhon, S. J.; Ray, P.; Kuhlman, M.R. Proceedings of SPIE-The International Society for Optical Engineering 1997, 2937, 19. [33] Methyl benzoate [93-58-3], http://www.thegoodscentscompany.com/data/rw1015011.html, accessed January 23, 2010. [34] Poulsen, H.A.; Sutherland, G.J. Sci. Justice, 2000, 40, 171. [35] Moffat, A.C. Sci. Justice 2002, 42, 55. [36] Lorenzo, N.; Wan, T; Harper , R.J.; Hsu, Y.; Chow, M.; Rose, S.; Furton, K.G. Anal Bioanal Chem 2003, 376,1212. [37] Shulgin, A. T. J Psychoactive Drugs 1986, 18, 291. [38] Davis W. M.; Borne, R. F. Substance Alcohol Actions/Misuse 1984, 5,105. [39] O’Brien B.A.; Bonicamp J. M.; Jones, D. W. J Anal Toxico 1982, l6, 143. [40] Braun U, Shulgin AT, Braun G J Pharm Sci 1980, 69,192. [41] Eckenrode, B.; Bartick, E.G.; Harvey, S.; Vucelick, M.E.; Wright, B.W.; Huff, R.A. Forensic Science Communications 2001, 3 (4), http://www.fbi.gov/hq/lab/fsc/backissu/oct2001/eknrode.htm, accessed January 24, 2010. [42] Eliasson, C.; Macleod, N. A.; Matousek, P. Anal. Chim. Acta 2008, 607, 50. [43] Lewis, I. R.; Daniel, N. W., Jr.; Chaffin, N. C.; Griffiths, P. R.; Tungol, M. W. Spectrochimica Acta, Part A: Molecular and Biomolecular Spectroscopy 1995, 51A(12), 1985. [44] Shibamoto, K.; Katayama, K.; Fujinami, M.; Sawada, T. Review of Scientific Instruments 2003, 74, 910. [45] Heflinger, D.; Arusi-Parpar, T.; Ron, Y.; Lavi, R. Optics Communications 2002, 204, 327.
This document is a research report submitted to the U.S. Department of Justice. This report has not been published by the Department. Opinions or points of view expressed are those of the author(s) and do not necessarily reflect the official position or policies of the U.S. Department of Justice.

230
Almirall, Diaz-Guerra, Holness and Furton Final Technical Report: 2006-DN-BX-K027
[46] Rodacy, P. J.; Bender, S.; Bromenshenk, J.; Henderson, C.; Bender, G. Proceedings of SPIE-The International Society for Optical Engineering 2002, 4742, 474. [47] Jackson, P. Development of methods that detect and monitor environment munitions contaminants using plant sentinels and molecular probes. Report 1996, AD-A309 583, 23 pp. [48] Settles, G.S. J. Fluid. Eng. 2005, 127, 189. [49] Johnston, J.M. Institute for Biological Detections Systems, Auburn University, Alabama, 1999. [50] Macias, M.S.; Guerra-Diaz, P.; Almirall, J.R.; Furton, K.G. Forensic Sci. Int. 2010, 195, 132-138. [51] Gardener, J.W; Bartlett, P.N. Electronic noses and principles and applications, Oxford University Press, Oxford. [52] Yinon, J. Anal. Chem. 2003, 75, 99A. [53] SWGDOG SC1i – Terminology, http://www.swgdog.org, accessed January 21, 2010. [54] MacCrehan, W.A.; Bedner, M. Forensic Sci. Int. 2006, 163,119. [55] Northop, D.M.; MacCrehan, W.A. Smokeless Powder Residue Analysis by Capillary Electrophoresis, National Institutes of Justice, 1997. [56] Wissinger, C.E.; McCord, B.R. J. For. Sci. 2004, 479,168. [57] West, C.; Baron, G.; Minet, J.J. Forensic Sci. Int. 2007, 166, 91. [58] Harper, R.J.; Almirall, J.R.; Furton, K.G. Improving the scientific reliability of biological detection of explosives by canis familiaris through active odor signatures and their implications, in: Proceedings of the 8th International Symposium on the Analysis and Detection of Explosives, Ottawa, Canada, 2004.
[59] Joshi, M.; Delgado, Y.; Guerra, P.; Lai, H.; Almirall, J. R. Forensic Sci. Int. 2009, 188, 112. [60] Jenkins, T. F.; Leggett, D. C.; Miyares, P. H.; Walsh, M. E.; Ranney, T. A.; Cragin, J. H.; George, V. Talanta 2001, 54, 501. [61] Baez, B.; Correa, S. N.; Hernandez-Rivera, S. P. Proceedings of SPIE 2005, 5794(2), 1263.
This document is a research report submitted to the U.S. Department of Justice. This report has not been published by the Department. Opinions or points of view expressed are those of the author(s) and do not necessarily reflect the official position or policies of the U.S. Department of Justice.

231
Almirall, Diaz-Guerra, Holness and Furton Final Technical Report: 2006-DN-BX-K027
[62] Lorenzo, N. M.S. Thesis, Florida International University, Florida 2002. [63] Furton, K.G.; Hong, Y.; Hsu, Y.; Lue, T.; Rose, S.; Walton, J. Journal of Chromatographic Science 2002, 40, 147. [64] Aarons, J.N.; Furton, K.G. Proceedings of the American Academy of Forensic Sciences, Washington DC, 2008, pp. 52-53. [65] http://www.arb.ca.gov/db/solvents/solvent_pages/Ketones-HTML/cylclohexanone.htm, accessed January 21, 2010. [66] Harper, R.J. Ph.D. Dissertation. 2005, Florida International University, Miami, FL. [67] Nelson, G.O. Gas Mixtures: Preparation and Control, CRC Press, Boca Raton, FL, 1992. [68] Koziel, J. A.; Martos, P. A.; Pawliszyn, J. J. Chromatogr. A 2004, 1025, 3. [69] Antohe, B. V.; Hayes, D. J.; Ayers, S.; Wallace, D. B.; Grove, M. E.; Christison, M. Portable Vapor Generator for the Calibration and Test of Explosive Detectors. In Proceedings of the 2009 IEEE International Conference on Technologies for Homeland Security; 2009 May 11-12; Boston, MA. [70] Pawliszyn, J., Solid Phase Microextraction: Theory and Practice, Wiley-VCH, New York, 1997. [71] Pawliszyn, J.; Liu, S. Anal. Chem. 1987, 59, 1475. [72] Belardi, R.G.; Pawliszyn, J. Water Pollut. Res. J. Can., 1989, 24,179. [73] Arthur, C. L.; Pawliszyn, J. Anal. Chem. 1990, 62, 2145. [74] Risticevic, S.; Niri, V. H.; Vuckovic, D.; Pawliszyn, J. Anal. Bioanal. Chem. 2009, 393, 781. [75] Kataoka, H. Anal. Bioanal. Chem. 2009, in press, DOI 10.1007/s00216-009-3076-2. [76] Hakkarainen, M. Adv. Polym. Sci. 2008, 211, 23. [77] Pawliszyn, J. Solid Phase Microextraction, In: Comprehensive Analytical Chemistry XXXVII Ed: Pawliszyn, J. 2002. [78] Baltussen, E., Sandra, P., David, F., Cramer, C., J. Microcol. Sep. 1999, 11, 737. [79] Soini, H.A., Bruce, E.K., Wiesler, D., David, F., Sandra, P., Novotny, M.V., J. Chem. Ecol. 2005, 31, 377.
This document is a research report submitted to the U.S. Department of Justice. This report has not been published by the Department. Opinions or points of view expressed are those of the author(s) and do not necessarily reflect the official position or policies of the U.S. Department of Justice.

232
Almirall, Diaz-Guerra, Holness and Furton Final Technical Report: 2006-DN-BX-K027
[80] Bruheim, I., Liu, X., Pawliszyn, J., Anal. Chem. 2003, 75, 1002. [8] Hinshaw, J.V. LCGC NORTH AMERICA 2003, 21, 1056. [82] Wercinski, S.A.S., Pawliszyn, J., in: Wercinski, S.A.S. (Ed.), Solid phase microextraction theory, Solid phase microextraction: a practical guide. Marcel Dekker, Inc., New York, 1999. [83] Isetun, S.; Nilsson, U.; Colmsjo, A. Anal. Bionanal. Chem. 2004, 380, 319. [84] Isetun, S.; Nilsson, U. Analyst 2005, 130, 94. [85] Larroque, V.; Desauziers, V.; Mocho, P. J. Environ. Monit. 2006, 8, 106. [86] Augusto, F.; Koziel, J.; Pawliszyn. Anal. Chem. 2001, 73, 481. [87] Ramsey, S. A.; Mustacich, R. V.; Smith, P. A.; Hook, G. L.; Eckenrode, B. A. Anal. Chem. 2009, 81, 8724. [88] Shirey, R. E. J. Chromatogr. Sci. 2000, 38, 270. [89] Jiang, G.; Huang, M.; Cai, Y.; Lv, J.; Zhao, Z. J. Chromatogr. Sci. 2006, 44, 324. [90] Harvey, S. J. Chromatogr. A 2008, 1213, 110. [9] Dintith, J. Facts on File Dictionary of Organic Chemistry, 2004 Market House Books, New York, NY. [92] Dale E. Niesz, "Ceramics", in AccessScience@McGraw-Hill, http://www.accessscience.com, DOI 10.1036/1097-8542.121000, accessed Jan. 13, 2010. [93] Kumar, A.; Gaurav; Malik, A.K.; Tewary, D.K.; Singh, B. Anal. Chim. Acta 2008, 610, 1. [94] Rath, K. Novel materials from solgel chemistry. Lawrence Livermore National Laboratory, ST&R, May 2005, 24-26. [95] Fang, L.; Kulkarni, S.; Alhooshani, K.; Malik, A. Anal. Chem. 2001, 79, 9441. [96] Liu, W.; Hu, Y.; Zhao, J.; Xu, Y.; Guan, Y. J. Chromatogr. A 2006, 1102, 37. [97] Sarwar, M.I.; Ahmad, Z. Eur. Polym. J. 2000, 36, 89. [98] Tilgner, I.C.; Fischer, P.; Bohne, F.M. Rehage, H. Maier, W.F. Microporous Mater. 5, 1995, 77.
This document is a research report submitted to the U.S. Department of Justice. This report has not been published by the Department. Opinions or points of view expressed are those of the author(s) and do not necessarily reflect the official position or policies of the U.S. Department of Justice.

233
Almirall, Diaz-Guerra, Holness and Furton Final Technical Report: 2006-DN-BX-K027
[99] Schmidt, H. Thin Films, The Chemical Processing Up To Gelation, In: Structure and Bonding 77, Chemistry, Spectroscopy, and Applications of Sol-gel Glasses, Springer-Verlag, Berlin Eds. Reisfeld, R. and Jørgensen, C.K.1992, pp 119-151. [00] Sakka, S.; Yoko, T. Sol-gel coating films and applications. In: Structure and Bonding 77, Chemistry, Spectroscopy, and Applications of Sol-gel Glasses, Springer-Verlag, Berlin Eds. Reisfeld, R. and Jørgensen, C.K.1992, pp 89-118. [01] Chong, S.L.; Wang, D.; Hayes, J.D.; Wilhite, B.W.; Malik, A. Anal. Chem. 1997, 69, 3889. [02] Mackenzie, J.D., in: Mark, J.E.; Lee, C.C.Y.; Bianconi, P.A. (Eds.), Hybrid Organic-Inorganic Composites, ACS Symposium Series, vol. 585, American Chemical Society, Washington, D.C., 1995, p. 227. [03] Ligor, M.; Scibiorek, M.; Buszewski, B. Micro. Sep. 1999, 5, 377. [04] Liu, Y.; Shen, Y.; Lee, M.L. Anal. Chem. 1997, 69, 190. [05] Liu, M.; Zeng, Z.; Fang, H. J. Chromatogr. A 2005, 1076, 16. [06] Cai, L.; Gong, S.; Chen, M.; Wu, C. Analytica Chimica Acta 2006, 559, 89. [07] Z.Y. Wang, C.H. Xiao, C.Y. Wu, H.M. Han, J. Chromatogr. A 2000, 893, 157. [08] J.X. Yu, L. Dong, C.Y. Wu, J. Xing, J. Chromatogr. A 2002, 978, 37. [09] Springer, C.S.; Meek, D.W.; Sievers, R.E. Inorg. Chem. 1967, 6(6), 1105. [10]Charles, R.G.; Perrotto, A. J. Inorg. Nucl. Chem., 1964, 26, 373. [11] Eisentraut, K.J.; Sievers, R.E. J. Am. Chem. Soc. 1965, 87, 5254. [12] Taketatsu, T.; Banks, C.V. Anal. Chem. 1966, 38, 1524. [13] Davis, T.S.; Fackler, J.P. Inorg. Chem. 1966, 5, 242. [14] Feibush, B.; Richardson, M.F.; Sievers, R.E.; Springer, C.S. J. Amer. Chem. Soc. 1972, 94, 6717. [15] Brooks, J.J.; Sievers, R.E. J. Chromatogr. Sci. 1973, 11, 303. [16] Picker, J.E.; Sievers, R.E. J. Chromatogr. 1981, 203, 29.
This document is a research report submitted to the U.S. Department of Justice. This report has not been published by the Department. Opinions or points of view expressed are those of the author(s) and do not necessarily reflect the official position or policies of the U.S. Department of Justice.

234
Almirall, Diaz-Guerra, Holness and Furton Final Technical Report: 2006-DN-BX-K027
[17] Wenzel, T.J.; Yarmaloff, L.W.; St. Cyr, L.Y.; O’Meara, L.J.; Donatelli, M.; Bauer, R.W. J. Chromatogr. 1987, 396, 51. [18] Harvey, S.D.; Ewing, R.G.; Waltman, M.J. Int. J. Ion Mobil. Spec. 2009, 12, 115. [19] Skoog, D.A.; Holler, J.F.; Nieman, T.A. Principles of Instrumental Analysis, 5th Ed. Tompson Learning, 1998, United States. [20] http://www.mse.iastate.edu/microscopy/backscatter.html, accessed January 20, 2010. [21] http://www.mse.iastate.edu/microscopy/secondary.html, accessed January 20, 2010. [22] Trejos, T. SEM basic training: Philips XL 30. Florida International University, April 2007. [23] Solomons, G.T.W.; Fryhle, C.B. Organic Chemistry, 8th Ed. John Wiley & Sons, Inc., 2004, New Jersey, United States. [24] Hop, C.E.C.A, Bakhtiar, R. J. Chem. Edu. 1996, 73, A118. [25] Kirkbride, K.P.; Klass, G.; Pigou, P.E. J Forensic Sci 1998, 43(1), 76. [26] Jenkins, T.F., Leggett, D.C., Ranney, TA. Vapor signatures from military explosives: part 1. vapor transport from buried military-grade TNT. Washington (DC): U.S. Army Cold Regions Research and Engineering Laboratory; 1999: Special Report No. 99-21. [27] Muller, D.; Levy, A.; Shelef, R.; Abramovich-Bar, S.; Sonenfeld, D.; Tamiri, T. J Forensic Sci 2004, 49(5), 935. [28] K.G. Furton , J.R. Almirall, M. Bi, J. Wang, L. Wu, J. Chromatogr. A. 2000, 885,
419.
[29] Yonamine, M.; Tawil, N.; Moreau, R. L. M.; Silva, O. A. J. Chromatogr. B. 2003, 789, 73. [30] Kenji, M.; Tetsuya, A.; Takeshi, K.; Masae, I.; Yoko, M.; Hideki, H.; Akira, I.; Osamu, S.; Hiroshi, S. Japanese Journal of Forensic Toxicology 2005, 23(1), 33. [31] Fucci, N.; De Giovanni, N.; Chiarotti, M. Forensic Sci. Int. 2003, 134(1), 40. [32] Follador, M. J. D.; Yonamine, M.; Moreau, R. L. M.; Silva, O. A. J. Chromatogr. B. 2004, 811(1), 37. [33] Frank, M.; Junker, H. P.; Lachenmeier, D. W.; Kroener, L.; Madea, B. Journal of
Analytical Toxicology 2002, 26(8), 554.
This document is a research report submitted to the U.S. Department of Justice. This report has not been published by the Department. Opinions or points of view expressed are those of the author(s) and do not necessarily reflect the official position or policies of the U.S. Department of Justice.

235
Almirall, Diaz-Guerra, Holness and Furton Final Technical Report: 2006-DN-BX-K027
[34] Frank, M.; Junker, H. P.; Lachenmeier, D. W.; Kroener, L.; Madea, B. J.
Chromatogr. Sci. 2002, 40(6), 359.
[135] Rodrigues de Oliveira, D.; Yonamine, M.; Moreau, R. L. M. J. Sep. Sci. 2007, 30,
128.
[136] Koester, C. J.; Andersen, B. D.; Grant, P. M. J. Forensic Sci. 2002, 47(5), 1002.
[37] Brown, H.; Kirkbride, K. P.; Pigou, P. E.; Walker, G. S. J. Forensic Sci. 2003, 58(6),
1232.
[38] Keller, T.; Keller, A.; Tutsch-Bauer, E.; Monticelli, F. Forensic Sci. Int. 2006, 161, 130. [39] Lawrence, A.H.; Neudorfl, P.; Stoneb, J.A. Int. J. Ion Mobil. Spec. 2001, 209, 185. [40] Lawrence, A.H.; Neudorfl, P. Anal. Chem. 1988, 60, 104. [41] Miki, A.; Keller, T, Regenschiet, P., Dirnhofer, R.; Tatsuno, M.; Katagi, M.; Nishikawa, M.; Tsuchihashi, H. J. Chromatogr. B 1997, 692, 319. [42] Young, D.; Thomas, C.L.P; Breach, J.; Brittain, A.H.; Eiceman, G.A. Analytica Chimica Acta 1999, 381, 69. [43] Ewing, R.G.; Atkinson, D.; Eiceman G.A. ; Ewing, G.J. Talanta 2001, 54, 515. [44] Fythce, L.M.; Hupe, M.; Kovar, J.B.; Pilon, P. J Forensic Sci 1992, 37, 1550. [45] Gordon Research Conference, Detecting Illicit Substances: Explosives & Drugs-Sampling, Signatures And Clutter: Unconventional And Novel Approaches To Age Old Problems (Les Diablerets, Switzerland) June 17, 2009. [46] Verkouteren, J. R.; Coleman, J. L.; Fletcher, R. A.; Smith, W. J.; Klouda, G. A.; Gillen, G. Meas. Sci. Technol. 2008, 19, 115101 (12pp). [47] GE Product Literature, The science behind ion trap mobility spectrometry, http://tracedetection.net/Itemiser_White_Paper.pdf, accessed January 22, 2010. [48] Mina, N.; Hernández, S.P.; Román, F.R.; Rivera, L.A. Int. J. Ion Mobil. Spec. 2001, 4(1), 37. [49] Patent Application. US20090249897A1 2009-10-08 Transfer of Substances Adhering to Surfaces Into a Detection Instrument. [50] Greenberg, D., Grigoriev, A.G., James, R., Lynds, P., Nacson, S., in: Garbutt, D., Pilon, P., Lightfoot, P.(Ed.), Proceedings of the 8th International Symposium on Analysis and Detection of Explosives 2004, 55.
This document is a research report submitted to the U.S. Department of Justice. This report has not been published by the Department. Opinions or points of view expressed are those of the author(s) and do not necessarily reflect the official position or policies of the U.S. Department of Justice.

236
Almirall, Diaz-Guerra, Holness and Furton Final Technical Report: 2006-DN-BX-K027
[51] Hunter, J. A. Baumann, M. J.; Carlson, D. L.; Lenz, M. C.; Hannum, D. W.; Mitchell, M.; Gladwell, T. S.; Hobart, C. G.; Anderson, R. J.; Denning, D. J.; Peterson D.J. SAND Report 2005-5916, 2005. [52]Parmeter, J. E.; Eiceman, G. A.; Rodriguez, J. E. NIJ Report 602–00 Trace Detection of Narcotics Using a Preconcentrator/Ion Mobility Spectrometer System April 2001, Washington, DC. [53] Perr, J.M., Furton, K.G., Almirall, J.R., Proc. SPIE Int. Soc. Opt. Eng. 2005, 5778, 667. [54] Perr, J., PhD Dissertation, Florida International University, Florida 2005. [55] Lai, H.; Corbin, I.; Almirall, J.R. Anal. Bioanal. Chem. 2008, 392, 105. [56] Lai, H.; Guerra, P.; Joshi, M.; Almirall, J. R. J. Sep. Sci. 2008, 31, 402. [57] Orzechowska, G.; Poziomek E.J.; Tersol, V. Analytical Letters, 1997, 30, 1437. [58] Liu, X., Nacson, S., Grigoriev, A., Lynds, P., Pawliszyn, J., Anal. Chim. Acta 2006, 559, 159. [59] Arce, L., Menedez, M., Garrido-Delgado, R., Valcarcel, M. Trends Anal. Chem. 2008, 27, 139. [60] Martin, M.; Crain, M.; Walsh, K.; McGill, R.A.; Houser, E.; Stepnowski, J.; Stepnowski, S.; Huey-Daw, W.; Ross, S. Sensors and Actuators B 2007,126, 447. [161] http://www.solgel.com/articles/Nov00/mennig.htm, accessed Spring 2006. [62] Lawrence, C.J. Phys. Fluids 1988, 31, 2786. [63] Product Information: Dow Corning Sylgard 184 Silicone Elastomer. Report No. 10-1204A-01. [64] Picker, J.E.; Sievers, R.E. Journal of Chromatography, 1981, 203, 29. [165] Guerra- Diaz, Patricia; Gura, Sigalit; Almirall, José R. Ana.l Chem., in press, DOI 10.1021/ac902785y. [66] Overdiep, W.S. Prog. Org. Coating 1986, 14, 159. [67] Gu, J.; Bullwinkel, M.D.; Campbell, G.A. J. Electrochem. Soc. 1995, 142(3), 907. [168] Guerra, Patricia; Lai, Hanh; Almirall, José R.. J. Sep. Sci. (2008), 31, 2891-2898.
This document is a research report submitted to the U.S. Department of Justice. This report has not been published by the Department. Opinions or points of view expressed are those of the author(s) and do not necessarily reflect the official position or policies of the U.S. Department of Justice.

237
Almirall, Diaz-Guerra, Holness and Furton Final Technical Report: 2006-DN-BX-K027
[69] Laurell Technologies, Certificate of Calibration, Spin Processor S/N 07265.
[70] Dow Corning Product Information. Sylgard 184 Silicone Elastomer. Ref no. 10-1204A-01 [71] Supelco Product Information. Solid Phase Microextraction Fiber Assemblies. 1999, T794123N. [72] Mehrotra, R. C.; Bohra, R.; Guar, D.P. Metal β-diketonates and Allied Derivatives. Academic press, 1978.
[73] Silverstein, R.M. Spectrometric Identification of Organic Compounds, 5th edition, John Wiley & Sons, Inc. 1991.
[74] Nakanishi, K. Infrared Absorption Spectroscopy, 2nd edition, Holden-Day, Inc, 1977. [75]Wang, R.; Li, J.; Jin, T.; Xu, G.; Zhou, Z.; Zhou, X. Polyhedron 1997, 16(8), 1361.
[76] Walker, F.A. Advances In Single and Multi-Dimensional NMR Spectroscopy of Paramagnetic Metal Complexes. In: Spectroscopic Methods in Bioinorganic Chemistry, 1998, American Chemical Society, San Francisco, CA.
[77] Binnemans, K. Rare-Earth Beta-Diketonates. In: Handbook on the Physics and Chemistry of Rare Earths. Vol 35, Ed. Gschneider, K.A., et.al. 2005, Elsevier, 107. [78] Gura, S.; Guerra-Diaz, P.; Lai, H.; Almirall, J.R. Drug Testing and Analysis, 2009, 1, 355.
[79] Eiceman, G.A.; Nazarov, E.G.; Rodriguez, J.E. Analytica Chimica Acta 2001, 433, 53. [80] Spangler, G. E.; Lawless P. A. Anal. Chem. 1978, 50(7), 884.
[181] Gura, S.; Joshi, M.; Almirall, J.R. Personal communication, 2009.
[182] 160Hwww.wikipedia.org accessed on 5/5/08
[183] 161Hhttp://www.osha.gov/dts/chemicalsampling/toc/toc_chemsamp.html accessed on 11/29/08
[184] Thomas, S.W.; Amara, J.P.; Bjork, R.E.; Swager, T.M. “Amplifying fluorescent
polymer sensors for the explosives taggant 2,3-dimethyl-2,3-dinitrobutane (DMNB).”
Chem. Commun., 2005, 4572-4574
This document is a research report submitted to the U.S. Department of Justice. This report has not been published by the Department. Opinions or points of view expressed are those of the author(s) and do not necessarily reflect the official position or policies of the U.S. Department of Justice.

238
Almirall, Diaz-Guerra, Holness and Furton Final Technical Report: 2006-DN-BX-K027
ANNEX A STATIC PSPME PREPARATION
A.1 Substrate Preparation
Prior to coating, cut 1 mm thick, pre-cleaned microscope slides (Chase Scientific Glass,
Vineland, NJ), into 3.81 cm × 2.54 cm pieces. Dip the glass substrates individually into a
2:1 mixture of concentrated sulfuric acid (Fisher Scientific, Fair Lawn, NJ) and 30%
hydrogen peroxide (Fisher Scientific, Fair Lawn, NJ) and placed in an oven at 90°C for
20 min. Decant the solution and rinse the substrates thoroughly with 18 mΩ deionized
water. Dip each substrate in 1M NaOH for 1 hr to expose the silanols on the glass
surface. Thoroughly rinse with deionized water to ensure wettability (no beading of water
on the glass surface). Place the substrates in an oven at 120°C for 12 hr to dry.
A.2 Sol-gel PDMS
Dissolve 6.40 g vinyl-terminated polydimethylsiloxane (vt-PDMS) (Gelest, Inc.,
Morrisville, PA) in 8 mL of dichloromethane (DCM, Acros, New Jersey, USA); then add
3.42 mL of methyltrimethoxysilane (MTMOS, > 98%) (Fluka, Steinheim, Germany) and
1.67 g poly(methylhydrosiloxane) (PMHS) (Sigma-Aldrich, Inc., St. Louis, MO),
followed by 2.73 mL of trifluoroacetic acid (TFA, 99 %, Acros, New Jersey, USA), (5%
water, v/v). Vortex the solution and allowed a 30 min stay. Dip the prepared substrate in
the solution for 1 h. Place the planar sol-gel PDMS SPME device in the dessicator for 12
hr, followed by a 6 hr dip in dichloromethane. Gelate the sol-gel PDMS PSPME device
This document is a research report submitted to the U.S. Department of Justice. This report has not been published by the Department. Opinions or points of view expressed are those of the author(s) and do not necessarily reflect the official position or policies of the U.S. Department of Justice.

239
Almirall, Diaz-Guerra, Holness and Furton Final Technical Report: 2006-DN-BX-K027
by placing the it in a GC oven at 40 °C for 12 h. The next step is conditioning the sol-gel
PDMS PSPME as follows: place the device in a GC oven under nitrogen atmosphere at
120°C for 1 hr, 240°C for 1 hr, and 300°C for 3 hr. Following conditioning, cool the
device slowly to room temperature to prevent cracking of the phase.
A.3 PDMS by a Chlorine-Terminated Route
Spin-coat a prepared glass substrate with a 3:1 mixture of chlorine-terminated
polydimethylsiloxane (Cl-PDMS) (Sigma-Aldrich, Inc., St. Louis, MO) and DCM as
follows: deposit one mL of the coating solution on the substrate and activate the spin
program, 1000 rpm for 60s. Place the PDMS planar SPME device in a dessicator at room
temperature for 12 hr then dip in 18 mΩ deionized water to remove any excess
hydrochloric acid that could result from the reaction. Place the PDMS PSPME device in a
GC oven at 40°C following the rinse with deionized water condition in the same manner
as the sol-gel PDMS (Section A.2).
This document is a research report submitted to the U.S. Department of Justice. This report has not been published by the Department. Opinions or points of view expressed are those of the author(s) and do not necessarily reflect the official position or policies of the U.S. Department of Justice.

240
Almirall, Diaz-Guerra, Holness and Furton Final Technical Report: 2006-DN-BX-K027
ANNEX B DYNAMIC PSPME PREPARATION
Prior to coating, cut glass fiber filter circles (G6, Fisherbrand, Pittsburgh, PA) down to
3.1 cm in diameter. Activate the surface of the glass fiber filter circles as described in
Section A.1. Prepare a sol-gel PDMS solution in the following quantities: 2.060 g vt-
PDMS dissolved in 8 mL of DCM; then add 1.10 mL of MTMOS and 0.5351 g PMHS,
followed by 0.875 mL of TFA (Acros) (5% water v/v). Vortex the solution and allow a
30 min stay. Place the prepared glass fiber filter circle atop a cut glass slide held by
vacuum on the chuck of a model WS-400B- 6NPP-LITE spin-coater (Laurell
Technologies, North Wales, PA). Deposit one mL of the coating solution on the glass
fiber filter circle and activate the spin program, 1000 rpm for 60 s. Place the newly coated
substrate in the dessicator for 12 h, dip for 1.5 hr in DCM and gelate for 12 hr in an oven
at 40 °C. Place the dynamic PSPME device in a GC oven in a nitrogen atmosphere at 120
°C for 1 hr, 240 °C for 1 hr, and 300 °C for 3 hr, for conditioning and to complete the
curing process.
This document is a research report submitted to the U.S. Department of Justice. This report has not been published by the Department. Opinions or points of view expressed are those of the author(s) and do not necessarily reflect the official position or policies of the U.S. Department of Justice.
241
Almirall, Diaz-Guerra, Holness and Furton Final Technical Report: 2006-DN-BX-K027
Dissemination of Research Findings.
The following appendices (A, B and C) list the number of scientific peer-reviewed
publications (Appendix A) and presentations (Appendix B) that were derived from this
work. A total of 11 scientific publications and a total of 33 scientific presentations were
derived from this effort. A copy of each of the publications (1-11) are included as an
attachment in Appendix C.
73BAppendix A – Peer-reviewed publications derived from this work. 11. M Joshi, K Rigsby and JR. Almirall, Determination of the headspace composition of smokeless powders using GC-MS, GC-Micro-ECD and IMS, Forensic Science International, 2011, 208 (1-3), 29-36. 10. S Gura, M Joshi, JR Almirall, SPME Calibration Using Inkjet Microdrop Printing, Analytical and Bioanalytical Chem, 2010, 398 (2), 1049-1060. 9. P Guerra-Diaz, S Gura, and JR. Almirall, Dynamic Planar Solid Phase Microextraction (PSPME)- Ion Mobility Spectrometry (IMS) for Rapid Field Air Sampling and Analysis of Illicit Drugs and Explosives, Analytical Chemistry, 2010, 82 (7), 2826–2835. 8. H Lai, A Leung, M Magee and JR Almirall - Identification of Volatile Chemical Signatures from Plastic Explosives by SPME-GC/MS and Detection by Ion Mobility Spectrometry, Analytical and Bioanalytical Chem, 2010, 396, 2997–3007. 7. M Macias, P. Guerra-Diaz, JR Almirall and KG Furton, Detection of piperonal emitted from polymer controlled odor mimic permeation systems utilizing Canis familiaris and solid phase microextraction-ion mobility spectrometry, For. Sci. Intl., 2010, 195(1-3), 132-138. 6. S Gura, P Guerra-Diaz, H Lai, JR Almirall, Enhancement in Sample Collection for the Detection of MDMA Using a Novel Planar SPME (PSPME) Device Coupled to Ion Mobility Spectrometry (IMS), Drug Testing and Analysis, 2009, 1, 355-362. 5. M. Joshi, Y. Delgado, P. Guerra, H. Lai, J.R. Almirall, Detection of odor signatures of smokeless powders using solid phase microextraction coupled to an ion mobility spectrometer, Forensic Science International, 2009, 188 (1-3), 112-118. 4. H Lai, I Corbin and JR Almirall, Headspace Sampling and Detection of Cocaine, MDMA, and Marijuana via Volatile Markers in the Presence of Potential Interferences by Solid Phase Microextraction-Ion Mobility Spectrometry (SPME-IMS), Analytical and Bioanalytical Chemistry, 2008, 392 (1-2), 105-113. 3. P Guerra, H Lai, JR Almirall, Extraction and detection of the volatile chemical markers of explosives with a novel planar geometry solid phase microextraction device coupled to ion mobility spectrometry, J. of Separation Sciences, 2008, 31, 2891-2898.
This document is a research report submitted to the U.S. Department of Justice. This report has not been published by the Department. Opinions or points of view expressed are those of the author(s) and do not necessarily reflect the official position or policies of the U.S. Department of Justice.

242
Almirall, Diaz-Guerra, Holness and Furton Final Technical Report: 2006-DN-BX-K027
2. H Lai, T McJunkin, CJ Miller, J Scott, and JR Almirall, Evaluation of the Predictive Power of SIMION/SDS Simulation Software for Modeling Ion Mobility Instruments, International Journal of Mass Spectrometry, 2008, 276(1), 1-8. 1. H Lai, P Guerra, M Joshi and JR Almirall, Solid Phase Microextraction-Ion Mobility Spectrometry (SPME-IMS) Analysis of Volatile Components from Drugs and Explosives, J. of Separation Science, 2008, 31, 402-412. Appendix B – Peer-reviewed presentations derived from this work. 1. June 2011. Performance Evaluation and Calibration of Planar Solid Phase Microextraction (PSPME) Using Vapors of Standards Followed by Ion Mobility Spectrometry (IMS) Detection, Gordon Research Conference, Lucca, Italy (Poster) 2. June 2011. Headspace Profiling of Volatile Compounds from Explosives Using Planar Solid Phase Microextraction (PSPME) Followed by Ion Mobility Spectrometer (IMS) Detection Gordon Research Conference, Lucca, Italy (Student Poster) 3. June 2011. Fast Detection of Triacetone Triperoxide (TATP) from Headspace using Planar Solid Phase Microextraction (PSPME) Coupled to an Ion Mobility Spectrometer Detector, Gordon Research Conference, Lucca, Italy (Student Poster) 4. April 2011. Sampling and Detection of Volatile Chemical Signatures from Explosives, Trace Explosives Detection Conference, Portland, OR (Invited Tutorial, PA) 5. April 2011. Fast Detection of Triacetone Triperoxide (TATP) from Headspace using Planar Solid Phase Microextraction (PSPME) Coupled to an Ion Mobility Spectrometer Detector, Trace Explosives Detection Conference, Portland, OR (Poster, PA) 6. April 2011. Planar Solid Phase Microextraction- Ion Mobility Spectrometry for Rapid Field Air Sampling and Analysis of Explosives and their Associated Volatile Chemical Signatures, Trace Explosives Detection Conference, Portland, OR (Poster, P. Diaz-Guerra) 7. March 2011. Development of Simulants of Hydrogen Peroxide Based Explosives for use by Canine and IMS Detectors, ALERT Conference, Rhode Island Department of Homeland Security Center of Excellence, Boston, MA (Invited Poster, SP) 8. Dec. 2010, Rapid detection of drugs and explosives using planar solid phase microextraction coupled to ion mobility spectrometry, PACIFICHEM 2010, Honolulu, HI (PA, Invited Poster) 9. October 2010. Detection of Drugs and Explosives in Large Volume Headspace Using Planar Microextraction and Ion Mobility Spectrometry, Federation of Analytical Chemists and Spectroscopies Societies (FACSS) Meeting, Raleigh, NC (PA, Invited Oral)
This document is a research report submitted to the U.S. Department of Justice. This report has not been published by the Department. Opinions or points of view expressed are those of the author(s) and do not necessarily reflect the official position or policies of the U.S. Department of Justice.

243
Almirall, Diaz-Guerra, Holness and Furton Final Technical Report: 2006-DN-BX-K027
10. September 2010. Detection of Explosives in Large Volumes Using Planar Solid Phase Microextraction (PSPME) Followed by IMS, ANZFSS, Sydney, Australia (PA, Poster) 11. July 2010. Detection of Drugs and Explosives in Large Volumes Using Planar Solid Phase Microextraction Followed by IMS, ISIMS 2010 Conference, Albuquerque, NM (SP) 12. February 2010, Field Detection of Drug and Explosive Odor Signatures using solid phase microextraction ion mobility spectrometry (SPME-IMS), NIJ Grantees Meeting, AAFS Conference, Seattle, WA (PA, Invited Oral) 13. January 2010, Field Detection of Drug and Explosive odor Signatures Using SPME-IMS, Technologies for Critical Incident Preparedness Conference, Philadelphia, PA (PA, Invited Oral) 14. October 2009, High-volume dynamic sampling of volatiles from explosives using planar SPME coupled with IMS detection, DoD Explosives Detection Conference, San Diego (PA, Poster) 15. October 2009, Detection of volatile odor signatures of smokeless powders using solid phase microextraction-Ion mobility spectrometry, DoD Explosives Detection Conference, San Diego (PA, Poster) 16. October 2009, Sampling and Instrumental Detection of Odor Signatures of Explosives, Homeland Security Explosive Detection Conference, DHS Center of Excellence, Providence, Rhode Island (PA, Invited Oral) 17. August 2009, Detection of Plastic Explosives by SPME-IMS via their volatile chemical markers, 55th International Conference on Analytical Sciences and Spectroscopy (ICASS), Kingston, Ontario, Canada (SP, Oral, Winner of Student Travel Award) 18. July 2009, Determination of Volatile Signatures from Explosives Using SPME-IMS, Transportation Security Laboratory, Atlantic City, NJ (PA, Invited Oral) 19. June 2009, Static and Dynamic Sampling of Volatiles from Drugs and Explosives Using Planar Solid Phase Microextraction (PSPME) for Detection with Ion Mobility Spectrometry (IMS) Gordon Research Conference, Les Diableretes, Switzerland (PA, Invited Poster) 20. June 2009, Headspace sampling and detection of the plastic explosives C-4, Detasheet, and Semtex via their volatile components by SPME-IMS, Gordon Research Conference, Les Diableretes, Switzerland (SP, Invited Oral)
This document is a research report submitted to the U.S. Department of Justice. This report has not been published by the Department. Opinions or points of view expressed are those of the author(s) and do not necessarily reflect the official position or policies of the U.S. Department of Justice.

244
Almirall, Diaz-Guerra, Holness and Furton Final Technical Report: 2006-DN-BX-K027
21. June 2009, Detection of volatile odor signatures of smokeless powders using solid phase microextraction- Ion Mobility Spectrometry, Gordon Research Conference, Les Diableretes, Switzerland (SP, Invited Poster, Selected as Best Poster Presentation) 22. May 2009, Detection of Odor Signatures of Smokeless Powders Using Solid Phase Microextraction Coupled to an Ion Mobility Spectrometer, FAME 2009, Orlando, FL (SP) 23. February 2009. High-volume dynamic sampling using planar SPME coupled with IMS for the detection of explosives, American Academy of Forensic Sciences, Denver, CO (SP) 24. July 2008, Detection of Chemical Volatile Markers in the Headspace of Explosives and Illicit Drugs by SPME-IMS and Demonstration of Novel Planar Geometry SPME Devices, International Society of Ion Mobility Spectrometry (ISIMS), Ottawa (PA, Oral) 25. July 2008, Modeling of Ion Mobility Spectrometry Instruments at Atmospheric Pressure Using SIMION/Statistical Diffusion Simulation, ISIMS, Ottawa (SP, Poster) 26. April 2008, Detection and Quantification of Volatile Organic Chemical Markers in Smokeless Powders by Gas Chromatography-Mass Spectrometry and Ion Mobility Spectrometry, American Chemical Society Meeting, New Orleans LA (SP, Poster) 27. April 2008, Project Updates; LIBS and SPME-IMS Research Progress, Technical Working Group on General Forensics-NIJ, Washington D.C., (PA, Invited Oral) 28. February 2008, Characterization of Microdrop Printed Calibration Standards for Ion Mobility Spectrometers, AAFS Meeting, Washington D.C. (SP, Oral) 29. February 2008, Demonstration of the Utility of a Planar Geometry Solid Phase Microextraction Device for Use with Ion Mobility Spectrometers, American Academy of Forensic Sciences (AAFS) Meeting, Washington D.C. (SP, Oral) 30. February 2008, Headspace Sampling and Detection of Cocaine, MDMA, and Marijuana via Volatile Chemical Markers; Solid Phase Microextraction-Ion Mobility Spectrometry, American Academy of Forensic Sciences (AAFS) Meeting, Washington D.C. (SP, Oral) 31. September 2007, Detection for Odor Signature Compounds of Explosives and Illicit Drugs by IMS, Gordon Research Conference, Big Sky, MT (SP, Best Student Poster Award) 32. June 2007, Field Detection of Explosive Odor Signatures Using SPME-IMS, Nano-DDS Conference, Washington D.C. (SP) 33. Feb. 2007, Study of Detection Limits of Odor Signatures of Drugs of Abuse Using SPME-GC-MS and SPME-IMS, AAFS Meeting, San Antonio, TX (SP, Oral)
This document is a research report submitted to the U.S. Department of Justice. This report has not been published by the Department. Opinions or points of view expressed are those of the author(s) and do not necessarily reflect the official position or policies of the U.S. Department of Justice.

245
Almirall, Diaz-Guerra, Holness and Furton Final Technical Report: 2006-DN-BX-K027
74BAppendix C – Copies of publications listed in Appendix A
This document is a research report submitted to the U.S. Department of Justice. This report has not been published by the Department. Opinions or points of view expressed are those of the author(s) and do not necessarily reflect the official position or policies of the U.S. Department of Justice.
246
Almirall, Diaz-Guerra, Holness and Furton Final Technical Report: 2006-DN-BX-K027
References [1] Public Law 104-132, Antiterrorism and Effective Death Penalty Act of 1996; Section 603; April 24, 1996. [2] Connelly, J.M.; Curby, W.A.; Fox, F.T.; and Hallowell, S.F. Detection of hidden explosives, In: Forensic Investigations of Explosions. Ed: Beveridge, A.D., 1998,Taylor & Francis, London, pp 45-74. [3] Statement of the Sporting Arms and Ammunition Manufacturers' Institute in the H.R. 1710 (The Comprehensive Anti-Terrorism Act of 1995) hearings before the House Committee on the Judiciary, June 13, 1995, distributed to the committee on January 15, 1998. [4] National Research Council. Black and smokeless powders: technologies for finding bombs and the bomb makers, 1998, National Academy Press, Washington, D.C. [5] Public Law 110-53, 9/11 Act.; August 3, 2007. [6] Air Cargo. http://www.tsa.gov/what_we_do/layers/aircargo/index.shtm, accessed January 4, 2010.
[7] Chris Strohm, U.S. Lacks Technology to Meet Air Cargo Screening Goal, March 19, 2009, http://gsn.nti.org/gsn/nw_20090319_2186.php, accessed January 4, 2010.
[8] Container Security Initiative 2006-2011, U.S. CUSTOMS AND BORDER PROTECTION, Pub# 0000-0703 August 2006, Washington, D.C. [9]Global Security Newswire, Napolitano Says U.S. Cannot Meet Cargo-Screening Goal, Thursday, December 3, 2009, http://www.globalsecuritynewswire.org/gsn/nw_20091203_5175.php, accessed January 4, 2010. [10]Secure Freight Initiative, Department of Homeland Security, http://www.dhs.gov/files/programs/gc_1166037389664.shtm#2, accessed January 4, 2010. [11]Lieberman, Collins React to Limited Progress on 100 Percent Cargo Scanning at Foreign Ports, Senate Committee on Homeland Security and Governmental Affairs http://hsgac.senate.gov/public/index.cfm?FuseAction=Press.MajorityNews&ContentRecord_id=5105ac86-5056-8059-76ae-28516ab3dfac, accessed January 4, 2010. [12] The U.S. Coast Guard Strategy for Maritime Safety, Security, and Stewardship Washington, D.C. Pub # 20593-0001, January 19, 2007. [13] Drug Interdiction, http://www.uscg.mil/hq/cg5/cg531/drug_interdiction.asp, accessed December 1, 2009.
This document is a research report submitted to the U.S. Department of Justice. This report has not been published by the Department. Opinions or points of view expressed are those of the author(s) and do not necessarily reflect the official position or policies of the U.S. Department of Justice.
247
Almirall, Diaz-Guerra, Holness and Furton Final Technical Report: 2006-DN-BX-K027
[14] Office of Law Enforcement (CG-531), http://www.uscg.mil/hq/cg5/cg531/Drugs/stats.asp, accessed December 1, 2009. [15] MDMA (Ecstacy) Abuse. National Institute On Drug Abuse. Pub# 06-4728. National Institutes of Health, Washington, D.C., March 2006. [16] Cole, M. D. The Analysis of Controlled Substances. 2003, John Wiley and Sons West Sussex, England. [17] Eiceman, Karpas Ion Mobility Spectrometry, 2nd Ed. CRC Press, Boca Raton, 2005. [18] Griffy, T.A. A model of explosive vapor concentration II, in Proceedings of the Fourth International Symposium on the Analysis and Detection of Explosives. Ed.: J. Yinon, 1992, Kluwer-Academic, New York, pp. 503-511. [19] Perr, J.M., Furton, K.G., Almirall, J.R., J. Sep. Sci. 2005, 28, 177. [20] Akhavan, J. The Chemistry of Explosives. 2nd Ed., Royal Society of Chemistry, 2004. [21] Bender, E.C. Analysis of Low Explosives. In: Forensic Investigation of Explosions; Ed.:Beveridge, A.D., 1998, Taylor & Francis, London, pp 343-385. [22] Hopler, R. B. In: Forensic Investigation of Explosives; Beveridge, A.D., Ed.; Taylor & Francis: London, 1998, pp 1-13. [23] Heramb, R.M.; McCord, B.R. The Manufacture of Smokeless Powders and their Forensic Analysis: A Brief Review, Forensic Science Communications, April 2002 Vol 4 (2). http://www.fbi.gov/hq/lab/fsc/backissu/april2002/mccord.htm, accessed January 23, 2010. [24] Furton, K.J.; Myers, L.J. Talanta 2001, 5, 487. [25] Yinon, J. Trends in Analytical Chemistry 2002, 21, 292. [26] Conrad, F.J. Nuclear Materials Management 1984, 13, 212 [27] Harper, R.J.; Almirall, J.R.; Furton, K.G. Talanta 67 (2005) 313. [28] Beveridge, A.D. Forensic Sci Rev 1992, 4(17), 18. [29] DEA Mission Statement, http://www.justice.gov/dea/agency/mission.htm, accessed Jan. 23, 2010. [30] Public Law 91-513, Controlled Substances Act, October 27, 1970. [31] Savelli, L. Street Drugs. Looseleaf Law Publications, Inc. Flushing, NY, 2008.
This document is a research report submitted to the U.S. Department of Justice. This report has not been published by the Department. Opinions or points of view expressed are those of the author(s) and do not necessarily reflect the official position or policies of the U.S. Department of Justice.

248
Almirall, Diaz-Guerra, Holness and Furton Final Technical Report: 2006-DN-BX-K027
[32] Dejarme, L. E.; Gooding, R.E.; Lawhon, S. J.; Ray, P.; Kuhlman, M.R. Proceedings of SPIE-The International Society for Optical Engineering 1997, 2937, 19. [33] Methyl benzoate [93-58-3], http://www.thegoodscentscompany.com/data/rw1015011.html, accessed January 23, 2010. [34] Poulsen, H.A.; Sutherland, G.J. Sci. Justice, 2000, 40, 171. [35] Moffat, A.C. Sci. Justice 2002, 42, 55. [36] Lorenzo, N.; Wan, T; Harper , R.J.; Hsu, Y.; Chow, M.; Rose, S.; Furton, K.G. Anal Bioanal Chem 2003, 376,1212. [37] Shulgin, A. T. J Psychoactive Drugs 1986, 18, 291. [38] Davis W. M.; Borne, R. F. Substance Alcohol Actions/Misuse 1984, 5,105. [39] O’Brien B.A.; Bonicamp J. M.; Jones, D. W. J Anal Toxico 1982, l6, 143. [40] Braun U, Shulgin AT, Braun G J Pharm Sci 1980, 69,192. [41] Eckenrode, B.; Bartick, E.G.; Harvey, S.; Vucelick, M.E.; Wright, B.W.; Huff, R.A. Forensic Science Communications 2001, 3 (4), http://www.fbi.gov/hq/lab/fsc/backissu/oct2001/eknrode.htm, accessed January 24, 2010. [42] Eliasson, C.; Macleod, N. A.; Matousek, P. Anal. Chim. Acta 2008, 607, 50. [43] Lewis, I. R.; Daniel, N. W., Jr.; Chaffin, N. C.; Griffiths, P. R.; Tungol, M. W. Spectrochimica Acta, Part A: Molecular and Biomolecular Spectroscopy 1995, 51A(12), 1985. [44] Shibamoto, K.; Katayama, K.; Fujinami, M.; Sawada, T. Review of Scientific Instruments 2003, 74, 910. [45] Heflinger, D.; Arusi-Parpar, T.; Ron, Y.; Lavi, R. Optics Communications 2002, 204, 327. [46] Rodacy, P. J.; Bender, S.; Bromenshenk, J.; Henderson, C.; Bender, G. Proceedings of SPIE-The International Society for Optical Engineering 2002, 4742, 474. [47] Jackson, P. Development of methods that detect and monitor environment munitions contaminants using plant sentinels and molecular probes. Report 1996, AD-A309 583, 23 pp.
This document is a research report submitted to the U.S. Department of Justice. This report has not been published by the Department. Opinions or points of view expressed are those of the author(s) and do not necessarily reflect the official position or policies of the U.S. Department of Justice.

249
Almirall, Diaz-Guerra, Holness and Furton Final Technical Report: 2006-DN-BX-K027
[48] Settles, G.S. J. Fluid. Eng. 2005, 127, 189. [49] Johnston, J.M. Institute for Biological Detections Systems, Auburn University, Alabama, 1999. [50] Macias, M.S.; Guerra-Diaz, P.; Almirall, J.R.; Furton, K.G. Forensic Sci. Int. 2010, 195, 132-138. [51] Gardener, J.W; Bartlett, P.N. Electronic noses and principles and applications, Oxford University Press, Oxford. [52] Yinon, J. Anal. Chem. 2003, 75, 99A. [53] SWGDOG SC1i – Terminology, http://www.swgdog.org, accessed January 21, 2010. [54] MacCrehan, W.A.; Bedner, M. Forensic Sci. Int. 2006, 163,119. [55] Northop, D.M.; MacCrehan, W.A. Smokeless Powder Residue Analysis by Capillary Electrophoresis, National Institutes of Justice, 1997. [56] Wissinger, C.E.; McCord, B.R. J. For. Sci. 2004, 479,168. [57] West, C.; Baron, G.; Minet, J.J. Forensic Sci. Int. 2007, 166, 91. [58] Harper, R.J.; Almirall, J.R.; Furton, K.G. Improving the scientific reliability of biological detection of explosives by canis familiaris through active odor signatures and their implications, in: Proceedings of the 8th International Symposium on the Analysis and Detection of Explosives, Ottawa, Canada, 2004.
[59] Joshi, M.; Delgado, Y.; Guerra, P.; Lai, H.; Almirall, J. R. Forensic Sci. Int. 2009, 188, 112. [60] Jenkins, T. F.; Leggett, D. C.; Miyares, P. H.; Walsh, M. E.; Ranney, T. A.; Cragin, J. H.; George, V. Talanta 2001, 54, 501. [61] Baez, B.; Correa, S. N.; Hernandez-Rivera, S. P. Proceedings of SPIE 2005, 5794(2), 1263. [62] Lorenzo, N. M.S. Thesis, Florida International University, Florida 2002. [63] Furton, K.G.; Hong, Y.; Hsu, Y.; Lue, T.; Rose, S.; Walton, J. Journal of Chromatographic Science 2002, 40, 147. [64] Aarons, J.N.; Furton, K.G. Proceedings of the American Academy of Forensic Sciences, Washington DC, 2008, pp. 52-53.
This document is a research report submitted to the U.S. Department of Justice. This report has not been published by the Department. Opinions or points of view expressed are those of the author(s) and do not necessarily reflect the official position or policies of the U.S. Department of Justice.

250
Almirall, Diaz-Guerra, Holness and Furton Final Technical Report: 2006-DN-BX-K027
[65] http://www.arb.ca.gov/db/solvents/solvent_pages/Ketones-HTML/cylclohexanone.htm, accessed January 21, 2010. [66] Harper, R.J. Ph.D. Dissertation. 2005, Florida International University, Miami, FL. [67] Nelson, G.O. Gas Mixtures: Preparation and Control, CRC Press, Boca Raton, FL, 1992. [68] Koziel, J. A.; Martos, P. A.; Pawliszyn, J. J. Chromatogr. A 2004, 1025, 3. [69] Antohe, B. V.; Hayes, D. J.; Ayers, S.; Wallace, D. B.; Grove, M. E.; Christison, M. Portable Vapor Generator for the Calibration and Test of Explosive Detectors. In Proceedings of the 2009 IEEE International Conference on Technologies for Homeland Security; 2009 May 11-12; Boston, MA. [70] Pawliszyn, J., Solid Phase Microextraction: Theory and Practice, Wiley-VCH, New York, 1997. [71] Pawliszyn, J.; Liu, S. Anal. Chem. 1987, 59, 1475. [72] Belardi, R.G.; Pawliszyn, J. Water Pollut. Res. J. Can., 1989, 24,179. [73] Arthur, C. L.; Pawliszyn, J. Anal. Chem. 1990, 62, 2145. [74] Risticevic, S.; Niri, V. H.; Vuckovic, D.; Pawliszyn, J. Anal. Bioanal. Chem. 2009, 393, 781. [75] Kataoka, H. Anal. Bioanal. Chem. 2009, in press, DOI 10.1007/s00216-009-3076-2. [76] Hakkarainen, M. Adv. Polym. Sci. 2008, 211, 23. [77] Pawliszyn, J. Solid Phase Microextraction, In: Comprehensive Analytical Chemistry XXXVII Ed: Pawliszyn, J. 2002. [78] Baltussen, E., Sandra, P., David, F., Cramer, C., J. Microcol. Sep. 1999, 11, 737. [79] Soini, H.A., Bruce, E.K., Wiesler, D., David, F., Sandra, P., Novotny, M.V., J. Chem. Ecol. 2005, 31, 377. [80] Bruheim, I., Liu, X., Pawliszyn, J., Anal. Chem. 2003, 75, 1002. [81] Hinshaw, J.V. LCGC NORTH AMERICA 2003, 21, 1056.
This document is a research report submitted to the U.S. Department of Justice. This report has not been published by the Department. Opinions or points of view expressed are those of the author(s) and do not necessarily reflect the official position or policies of the U.S. Department of Justice.

251
Almirall, Diaz-Guerra, Holness and Furton Final Technical Report: 2006-DN-BX-K027
[82] Wercinski, S.A.S., Pawliszyn, J., in: Wercinski, S.A.S. (Ed.), Solid phase microextraction theory, Solid phase microextraction: a practical guide. Marcel Dekker, Inc., New York, 1999. [83] Shirey, R. E. J. Chromatogr. Sci. 2000, 38, 270. [84] Jiang, G.; Huang, M.; Cai, Y.; Lv, J.; Zhao, Z. J. Chromatogr. Sci. 2006, 44, 324. [85] Harvey, S. J. Chromatogr. A 2008, 1213, 110. [86] Dintith, J. Facts on File Dictionary of Organic Chemistry, 2004 Market House Books, New York, NY. [87] Dale E. Niesz, "Ceramics", in AccessScience@McGraw-Hill, http://www.accessscience.com, DOI 10.1036/1097-8542.121000, accessed Jan. 13, 2010. [88] Kumar, A.; Gaurav; Malik, A.K.; Tewary, D.K.; Singh, B. Anal. Chim. Acta 2008, 610, 1. [89] Rath, K. Novel materials from solgel chemistry. Lawrence Livermore National Laboratory, ST&R, May 2005, 24-26. [90] Fang, L.; Kulkarni, S.; Alhooshani, K.; Malik, A. Anal. Chem. 2001, 79, 9441. [91] Liu, W.; Hu, Y.; Zhao, J.; Xu, Y.; Guan, Y. J. Chromatogr. A 2006, 1102, 37. [92] Sarwar, M.I.; Ahmad, Z. Eur. Polym. J. 2000, 36, 89. [93] Tilgner, I.C.; Fischer, P.; Bohne, F.M. Rehage, H. Maier, W.F. Microporous Mater. 5, 1995, 77. [94] Schmidt, H. Thin Films, The Chemical Processing Up To Gelation, In: Structure and Bonding 77, Chemistry, Spectroscopy, and Applications of Sol-gel Glasses, Springer-Verlag, Berlin Eds. Reisfeld, R. and Jørgensen, C.K.1992, pp 119-151. [95] Sakka, S.; Yoko, T. Sol-gel coating films and applications. In: Structure and Bonding 77, Chemistry, Spectroscopy, and Applications of Sol-gel Glasses, Springer-Verlag, Berlin Eds. Reisfeld, R. and Jørgensen, C.K.1992, pp 89-118. [96] Chong, S.L.; Wang, D.; Hayes, J.D.; Wilhite, B.W.; Malik, A. Anal. Chem. 1997, 69, 3889. [97] Mackenzie, J.D., in: Mark, J.E.; Lee, C.C.Y.; Bianconi, P.A. (Eds.), Hybrid Organic-Inorganic Composites, ACS Symposium Series, vol. 585, American Chemical Society, Washington, D.C., 1995, p. 227.
This document is a research report submitted to the U.S. Department of Justice. This report has not been published by the Department. Opinions or points of view expressed are those of the author(s) and do not necessarily reflect the official position or policies of the U.S. Department of Justice.

252
Almirall, Diaz-Guerra, Holness and Furton Final Technical Report: 2006-DN-BX-K027
[98] Ligor, M.; Scibiorek, M.; Buszewski, B. Micro. Sep. 1999, 5, 377. [99] Liu, Y.; Shen, Y.; Lee, M.L. Anal. Chem. 1997, 69, 190. [100] Liu, M.; Zeng, Z.; Fang, H. J. Chromatogr. A 2005, 1076, 16. [101] Cai, L.; Gong, S.; Chen, M.; Wu, C. Analytica Chimica Acta 2006, 559, 89. [102] Z.Y. Wang, C.H. Xiao, C.Y. Wu, H.M. Han, J. Chromatogr. A 2000, 893, 157. [103] J.X. Yu, L. Dong, C.Y. Wu, J. Xing, J. Chromatogr. A 2002, 978, 37. [104] Springer, C.S.; Meek, D.W.; Sievers, R.E. Inorg. Chem. 1967, 6(6), 1105. [105]Charles, R.G.; Perrotto, A. J. Inorg. Nucl. Chem., 1964, 26, 373. [106] Eisentraut, K.J.; Sievers, R.E. J. Am. Chem. Soc. 1965, 87, 5254. [107] Taketatsu, T.; Banks, C.V. Anal. Chem. 1966, 38, 1524. [108] Davis, T.S.; Fackler, J.P. Inorg. Chem. 1966, 5, 242. [109] Feibush, B.; Richardson, M.F.; Sievers, R.E.; Springer, C.S. J. Amer. Chem. Soc. 1972, 94, 6717. [110] Brooks, J.J.; Sievers, R.E. J. Chromatogr. Sci. 1973, 11, 303. [111] Picker, J.E.; Sievers, R.E. J. Chromatogr. 1981, 203, 29. [112] Wenzel, T.J.; Yarmaloff, L.W.; St. Cyr, L.Y.; O’Meara, L.J.; Donatelli, M.; Bauer, R.W. J. Chromatogr. 1987, 396, 51. [113] Harvey, S.D.; Ewing, R.G.; Waltman, M.J. Int. J. Ion Mobil. Spec. 2009, 12, 115. [114] Skoog, D.A.; Holler, J.F.; Nieman, T.A. Principles of Instrumental Analysis, 5th Ed. Tompson Learning, 1998, United States. [115] http://www.mse.iastate.edu/microscopy/backscatter.html, accessed January 20, 2010. [116] http://www.mse.iastate.edu/microscopy/secondary.html, accessed January 20, 2010. [117] Trejos, T. SEM basic training: Philips XL 30. Florida International University, April 2007.
This document is a research report submitted to the U.S. Department of Justice. This report has not been published by the Department. Opinions or points of view expressed are those of the author(s) and do not necessarily reflect the official position or policies of the U.S. Department of Justice.

253
Almirall, Diaz-Guerra, Holness and Furton Final Technical Report: 2006-DN-BX-K027
[118] Solomons, G.T.W.; Fryhle, C.B. Organic Chemistry, 8th Ed. John Wiley & Sons, Inc., 2004, New Jersey, United States. [119] Hop, C.E.C.A, Bakhtiar, R. J. Chem. Edu. 1996, 73, A118. [120] Keller, T.; Keller, A.; Tutsch-Bauer, E.; Monticelli, F. Forensic Sci. Int. 2006, 161, 130. [121] Lawrence, A.H.; Neudorfl, P.; Stoneb, J.A. Int. J. Ion Mobil. Spec. 2001, 209, 185. [122] Lawrence, A.H.; Neudorfl, P. Anal. Chem. 1988, 60, 104. [123] Miki, A.; Keller, T, Regenschiet, P., Dirnhofer, R.; Tatsuno, M.; Katagi, M.; Nishikawa, M.; Tsuchihashi, H. J. Chromatogr. B 1997, 692, 319. [124] Young, D.; Thomas, C.L.P; Breach, J.; Brittain, A.H.; Eiceman, G.A. Analytica Chimica Acta 1999, 381, 69. [125] Ewing, R.G.; Atkinson, D.; Eiceman G.A. ; Ewing, G.J. Talanta 2001, 54, 515. [126] Fythce, L.M.; Hupe, M.; Kovar, J.B.; Pilon, P. J Forensic Sci 1992, 37, 1550. [127] Gordon Research Conference, Detecting Illicit Substances: Explosives & Drugs-Sampling, Signatures And Clutter: Unconventional And Novel Approaches To Age Old Problems (Les Diablerets, Switzerland) June 17, 2009. [128] Verkouteren, J. R.; Coleman, J. L.; Fletcher, R. A.; Smith, W. J.; Klouda, G. A.; Gillen, G. Meas. Sci. Technol. 2008, 19, 115101 (12pp). [129] GE Product Literature, The science behind ion trap mobility spectrometry, http://tracedetection.net/Itemiser_White_Paper.pdf, accessed January 22, 2010. [130] Mina, N.; Hernández, S.P.; Román, F.R.; Rivera, L.A. Int. J. Ion Mobil. Spec. 2001, 4(1), 37. [131] Patent Application. US20090249897A1 2009-10-08 Transfer of Substances Adhering to Surfaces Into a Detection Instrument. [132] Greenberg, D., Grigoriev, A.G., James, R., Lynds, P., Nacson, S., in: Garbutt, D., Pilon, P., Lightfoot, P.(Ed.), Proceedings of the 8th International Symposium on Analysis and Detection of Explosives 2004, 55. [133] Hunter, J. A. Baumann, M. J.; Carlson, D. L.; Lenz, M. C.; Hannum, D. W.; Mitchell, M.; Gladwell, T. S.; Hobart, C. G.; Anderson, R. J.; Denning, D. J.; Peterson D.J. SAND Report 2005-5916, 2005.
This document is a research report submitted to the U.S. Department of Justice. This report has not been published by the Department. Opinions or points of view expressed are those of the author(s) and do not necessarily reflect the official position or policies of the U.S. Department of Justice.

254
Almirall, Diaz-Guerra, Holness and Furton Final Technical Report: 2006-DN-BX-K027
[134]Parmeter, J. E.; Eiceman, G. A.; Rodriguez, J. E. NIJ Report 602–00 Trace Detection of Narcotics Using a Preconcentrator/Ion Mobility Spectrometer System April 2001, Washington, DC. [135] Perr, J.M., Furton, K.G., Almirall, J.R., Proc. SPIE Int. Soc. Opt. Eng. 2005, 5778, 667. [136] Perr, J., PhD Dissertation, Florida International University, Florida 2005. [137] Lai, H.; Corbin, I.; Almirall, J.R. Anal. Bioanal. Chem. 2008, 392, 105. [138] Lai, H.; Guerra, P.; Joshi, M.; Almirall, J. R. J. Sep. Sci. 2008, 31, 402. [139] Orzechowska, G.; Poziomek E.J.; Tersol, V. Analytical Letters, 1997, 30, 1437. [140] Liu, X., Nacson, S., Grigoriev, A., Lynds, P., Pawliszyn, J., Anal. Chim. Acta 2006, 559, 159. [141] Arce, L., Menedez, M., Garrido-Delgado, R., Valcarcel, M. Trends Anal. Chem. 2008, 27, 139. [142] Martin, M.; Crain, M.; Walsh, K.; McGill, R.A.; Houser, E.; Stepnowski, J.; Stepnowski, S.; Huey-Daw, W.; Ross, S. Sensors and Actuators B 2007,126, 447. [143] http://www.solgel.com/articles/Nov00/mennig.htm, accessed Spring 2006. [144] Lawrence, C.J. Phys. Fluids 1988, 31, 2786. [145] Picker, J.E.; Sievers, R.E. Journal of Chromatography, 1981, 203, 29. 146 Guerra- Diaz, Patricia; Gura, Sigalit; Almirall, José R. Ana.l Chem., in press, DOI 10.1021/ac902785y. [147] Overdiep, W.S. Prog. Org. Coating 1986, 14, 159. [148] Gu, J.; Bullwinkel, M.D.; Campbell, G.A. J. Electrochem. Soc. 1995, 142(3), 907. [149] Guerra, Patricia; Lai, Hanh; Almirall, José R.. J. Sep. Sci. (2008), 31, 2891-2898. [150] Laurell Technologies, Certificate of Calibration, Spin Processor S/N 07265. [151] Supelco Product Information. Solid Phase Microextraction Fiber Assemblies. 1999, T794123N. [152] Mehrotra, R. C.; Bohra, R.; Guar, D.P. Metal β-diketonates and Allied Derivatives. Academic press, 1978.
This document is a research report submitted to the U.S. Department of Justice. This report has not been published by the Department. Opinions or points of view expressed are those of the author(s) and do not necessarily reflect the official position or policies of the U.S. Department of Justice.

255
Almirall, Diaz-Guerra, Holness and Furton Final Technical Report: 2006-DN-BX-K027
[153] Silverstein, R.M. Spectrometric Identification of Organic Compounds, 5th edition, John Wiley & Sons, Inc. 1991. [154] Nakanishi, K. Infrared Absorption Spectroscopy, 2nd edition, Holden-Day, Inc, 1977. [155]Wang, R.; Li, J.; Jin, T.; Xu, G.; Zhou, Z.; Zhou, X. Polyhedron 1997, 16(8), 1361.
[156] Walker, F.A. Advances In Single and Multi-Dimensional NMR Spectroscopy of Paramagnetic Metal Complexes. In: Spectroscopic Methods in Bioinorganic Chemistry, 1998, American Chemical Society, San Francisco, CA.
[157] Binnemans, K. Rare-Earth Beta-Diketonates. In: Handbook on the Physics and Chemistry of Rare Earths. Vol 35, Ed. Gschneider, K.A., et.al. 2005, Elsevier, 107. 158 Gura, S.; Guerra-Diaz, P.; Lai, H.; Almirall, J.R. Drug Testing and Analysis, 2009, 1, 355. [159] Eiceman, G.A.; Nazarov, E.G.; Rodriguez, J.E. Analytica Chimica Acta 2001, 433,
53.
[160] Gura, S.; Joshi, M.; Almirall, J.R. Personal communication, 2009.
This document is a research report submitted to the U.S. Department of Justice. This report has not been published by the Department. Opinions or points of view expressed are those of the author(s) and do not necessarily reflect the official position or policies of the U.S. Department of Justice.