field evaluation of nuclear gages used in compaction
TRANSCRIPT

Field Evaluation of Nuclear Gages Used Compaction Control of Embankments VALENTIN WORONA and WILLIAM GUNDERMAN*
. Ill
Respectively, Materials Engineer, Pennsylvania Department of Highways; and Highway Research Board
This study was designed to evaluate nuclear moisture density gages under actual field conditions. A preliminary evaluation of one Nuclear-Chicago d/ M system showed favorable results, hence a more extensive study was conducted with eleven additional nuclear gages. A complete d/ M system was assigned to each of Pennsylvania's engineering districts and used on varied construction and soil types. These gages were used in the field for one full year, and the results were compared to the sandcone method for determining soil density and the oven-drying and speedy moisture methods of determining moisture content.
Test results were compiled and tabulated by IBM 650 data processing machine. Tabulations were requested to isolate variables affecting correlation of nuclear to sand-cone results. These variables are soil type, soil gradation, construction type (embankment, soil cement, subbase, etc.) and different d/ M systems. Standard deviations were computed for series of grouped tests to determine the repeatability of both methods for measuring moisture and densities of construction materials.
•THE PURPOSE for this investigation was to determine the feasibility of using nuclear moisture-density gages to control material compaction in highway construction. Collection of data was performed by regular construction inspectors under normal job conditions.
SCOPE
A three -year study on field correlation of nuclear moisture-density gages was conducted by the Pennsylvania Department of Highways. The first-year study was conducted by Central Research and Testing Laboratory technicians. Samples in groups of five tests were collected. These "grouped data" were only used for the repeatability analysis of the nuclear gage. The second year, a larger program was started with eleven nuclear density-moisture systems distributed throughout the State. Regular construction inspectors used these gages in conjunction with sand-cone density apparatus. These comparative tests were used for correlation of the two testing methods. This project was continued for another year and the additional data were used for repeatability analysis.
All nuclear equipment was manufactured by the Nuclear Chicago Corporation of Des Plaines, Ill. The density gage P-22, the moisture gage P-21, and the electronic scaler Model 2800 used in the laboratory study were improved by the manufacturer and the newer models were obtained for use by the eleven engineering districts. Data collected by the new gages were kept separate from laboratory results.
*Formerly with the Test i ng and Research Laboratory , Pennsylvania Department of Highways . Paper sponsored by Special Committee on Nuclea r Princ iples ru1d Applicati ons .

The nuclear gages were correlated to sand-cone density determined by AASHO Designation T-147. Correlation of the data was limited to material that could be tested by the sand cone.
BACKGROUND
Brief History
35
The initial use of gamma rays for soil investigation was applied by geologists and geophysicists to locate qualitative changes in subsurface conditions. Pontecorvo (1) used gamma-ray logging technique that depended on natural radioactivity of sedimentary rocks. In 1944, Russel (2) published radioactivity data for virtually all types of sedimentary rock based on laboratory measurements. Thus, the potentials of gamma radiation became evident. By the late 1940's, the petroleum industry (3) began to use neutron well-logging techniques that became the forerunner of the present day depth moisture probe.
The engineering field became interested in the potentials of using radioactivity to measure soil density and moisture. Research, sponsored by the Civil Aeronautics Administration, was initiated at Cornell University. In 1950, Belcher, Cykendall, and Sack ( 4) reported on the use of nuclear moisture and density depth apparatus on soils. Since that time scientists and engineers have devoted much work to improving the instruments. Today there are several manufacturers producing good nuclear equipment for construction materials control.
d/M Gage System
The Nuclear-Chicago d/ M gage (5) is a system of portable instruments for fast, accurate, in-place measurement of the density of soil and related construction materials. The complete surface system consists of an electronic readout unit (scaler) and two separate gages to provide readings of surface moisture and surface density.
Portable Scaler Model 2800-A. -The portable scaler has five glow-tube decade counters that can accumulate up to 99,999 counts. The maximum steady repetition rate is 12,000 counts per second. A push-button reset is provided to zero (reset) all decades. The scaler used by the laboratory in 1961 has a spring-wound timer of 1 percent repeated accuracy. The later scalers are equipped with a constant speed de timer motor with push-button start and 1- or 2-min counting times. The electric timer has an accuracy of ± 0. 1 percent over the entire timing range. The battery is charged automatically when the unit is plugged into an ac line. An internal wet-cell battery provides all power required for field use. The scaler weighs 33 lb and is 12 in. wide by 10½ in. high by 81
/ 2 in. deep. Surface Moisture Gage Model P-21. -The surface moisture gage is supplied with
ten high-efficiency shunt-connected BlOF3 slow-neutron detector tubes. The source is 5-mc radium-beryllium with a half-life of 1,620 yr. Three transistors are used in a negative feedback arrangement to provide a stabilized gain of 95 which remains constant with temperature, transistor, or voltage variations. The gage weighs approximately 40 lb. A separate paraffin stand is provided for standardizing the gage in the field and weighs approximately 20 lb.
Surface Density Gage. -The first unit had one bismuth-cathode organic-quenched Geiger-Muller tube as a detector. The later models were supplied with six halogenquenched Geiger-Muller detector tubes. A 3-mc source of cesium-137 with half-life of 30 yr provided the gamma radiation. The loss in the source activity was automatically compensated for by use of a standard count and ratio-density graph. A feedback transistorized amplifier provided a gain of 100. The gage weighed approximately 20 lb with the carrying case serving as the standard.
APPARATUS AND PROCEDURE
Use of Moisture and Density Test Apparatus
Pennsylvania Department of Highways specifications state that "Compaction density in the field shall be determined in accordance with the AASHO Designation T147-54

36
Method A; modified for the use of the sand-cone density apparatus," and the soil moisture density relationship, by AASHO Interim Methods T99-61 I Method A (6). Because these methods measure the density and moisture relationship only for mate rial passing the No. 4 sieve, and the d/M system measures the average moisture content of all material to yield the average density of the total sample, the sand-cone calculations had to be modified to yield the average density of the total sample. The moisture contents, however, as determined by the carbide method on the material passing the No. 4 sieve, could not be satisfactorily modified. Thus, whereas the correlation of density determination is for the same material, the moisture correlation involves only the moisture content of the fine material as opposed to the average moisture of the whole sample as tested by the nuclear moisture gage.
The d/M system operates on nondestructive principles and can, therefore, be used on any material where a reasonably smooth surface can be prepared. The most frequent use of d/M gages was on embankments since the policy was to concentrate the use of the d/M system where a sand-cone test can be performed. In areas where sandcone density testing was not possible, due to large aggregate size, d/M gages were used to check uniformity of compaction. Test results from areas not accompanied by sand-cone density data had recorded comments of visual observations, such as nonmovement of material under compaction equipment. Such information was not used in correlation.
Initial Laboratory Investigation
The initial field evaluation was conducted during the summer of 1961. This was a dual-purpose assignment requiring the introduction and explanation of the nuclear method to district field personnel as well as the collection of comparative data. Samples were taken mainly at large interstate construction sites throughout Pennsylvania and included a great variety of soils.
The test locations were prepared by removing loose materials and smoothing the surface with a 12- by 12- by ½-in. steel plate. The voids in the area were filled with fine material and leveled down with the plate to produce a smooth surface (see Appendix B).
The r epeatability of both the sand-cone and nuclear testing systems was investigated by taking tests in groups of five laid out in no particular pattern within a 6-ft diameter circle. The d/M system was used first because it is nondestructive. A sand-cone test was then performed at the exact location where the d/M gages were used. Maryland quartz sand, commercially available throughout Pennsylvania, was used in the study and each bag was calibrated by four persons before use ( see Appendix A). All soil removed from the test hole was placed in air-tight cans, weighed and shipped to the laboratory where all samples were oven dried to determine moisture content, classified, and compacted according to the standard Proctor test. Difficulties in digging, spillage of sand or other mishaps reduced the number of tests in some groups to three or four. Over 300 tests were taken but only 178 could be used in the repeatability study (Figs. 1 and 2). All of the nuclear tests and most of the sand-cone tests were conducted by the same laboratory personnel.
1962 Statewide Field Study
The preliminary evaluation of the Nuclear-Chicago d/M system in 1961 showed favorable results; therefore, during the 1962 construction season, a more extensive study was conducted. Twelve additional surface d/M systems and one depth d/M system were purchased. One d/M system was assigned to each of the eleven engineering districts in the State and two to four inspectors were trained from each district.
A 3-day training session was held before the start of the construction season to show how the nuclear method might best be applied to improve materials control. The statistical approach on the use of nuclear data was explained and the inspectors were shown how to recognize counts falling outside statistical counting limits. One day was devoted to field exercise with the apparatus. Field maintenance was limited to charging the scaler battery and cleaning the gages; repair work on the electric circuits was not

LL 12.0 u a..
I
~ 10.0
I<(
> 8.0 w 0
ci I- 6.0 Cl)
a.. :::) 4.0 0 0:: (9
I- 2.0 Cl) w l-
o
- S-C WET DENSITY - - -- d/M WET DEN SITY
I i
I
Li / l
/ I I ' V--; ./l /
,),// / .7 .,,
/ --..,,,,/
/t-==l/,/ 20 40 60 80 100
PERCENT OF TEST GROUPS Figure 1. Density repeatability test (1961 Study) .
LL 5.0 u a..
I 4.0 z 0 I-<( 3.0 > w 0
0 2.0 I-C/)
~ 1.0 0 0:: (9
I- 0 Cl) w I-
' - S-C MOISTURE -- NUCLEAR MOISTURE
I
I L
/ / v· I
/ /,
vl v .,,, l /
/ /
V ---~-/~L-------
_-o,--___ .,,..
20 40 60 80 100
PERCENT OF TEST GROUPS Figure 2, Moisture repeatability test (1961 Sbudy).
37

38
permitted. The point was stressed that the d/M procedure was not a specification method for job control testing. The nuclear results were to be considered only as extra information and the acceptability of embankments could only be officially determined by the standard method of testing.
The initial use of the nuclear apparatus showed that a jeep station wagon was better suited for the job than a passenger vehicle. A specially constructed case with padded compartments for individual gages was made so it could be pulled out onto the tailgate for easy accessibility during test operations.
The testing procedure for the district inspectors was limited to one test at each location because grouped tests would have conflicted with the fast pace of construction. The use of the steel plate for surface preparation at each test site was also discarded, but surface was leveled before testing. At the beginning of this statewide testing program, two men were used to operate the d/M system, but as the operators gained experience, only one man was used.
Comparative sand-cone tests were performed at the same location by the construction inspector on the job. Different types of sands were used, including standard Ottawa sand, Maryland sand, and local, sieved sand. Moisture was determined by the "Speedy" carbide method, which has been recently approved for statewide use. Over 2, 000 tests were submitted to the laboratory, but only 600 were usable comparative tests because many of the nuclear tests were taken on base course and subbase material where sand-cone testing was not possible.
1963 Statewide Field Study
Before the start of the 1963 construction season, a 2-day symposium was held for all operators and their immediate supervisors. It was necessary to inform the supervisors of the policy on the use of nuclear gages to insure conformity to established operating procedures. The symposium proved to be a success; many common problems were resolved and uniformity of testing procedure was improved.
A special request was made that each district take at least five groups of five tests in a 6-ft diameter circle to test the repeatability of the new gages. A total of 275 such tests were taken and are included in this study. With the exception of these grouped tests, the field testing procedure remained essentially the same as that instituted during the 1962 investigation.
Data Processing
The data received from the field were checked for errors and then transferred onto punch cards. This information consisted of soil identification, date, standard count, nuclear wet weight, nuclear moisture content, sand-cone wet weight and carbide moisture content. All measurements were independent of each other; however, the moisture results were reported in pounds per cubic foot by the nuclear method and in percent moisture by the carbide method. Therefore, it was necessary to program the conversion of carbide moisture into pounds per cubic foot. This made the carbide moisture dependent on the sand-cone volume determination. Any errors in the sandcone density results were thus introduced into the carbide moisture results during conversion. These errors, however, are of the second order. The correlation of moisture results might have been better if the nuclear results were converted. The transferred error would have been smaller because the indications are that d/M gages give more reliable results.
The first program was written to yield information for correlation of the two systems and to investigate the possibility of using the combination of the two test methods. The latter analysis was not completed. The results used in correlation were arithmetically averaged.
A second program was used for grouped tests to determine repeatability of each system. Standard deviation of measurements from the group arithmetic mean was computed for each group of tests. The output was sorted by variables of soil type and material gradation. Table 1 gives corresponding standard deviations of the groups for measurements taken by the four testers. For easier interpretation the standard

39
TABLE 1
AVERAGE GROUP RESULTS (1961 Laboratory Study)
Nuclear Sand Cone Group No. Soil Grad.
OC No. Test Typea Mat.b Avg. oC • Avg. QC Avg. aC Avg. Wet Density (lb/cu ft) Moisture (lb/cu ft) Wet Density (lb/cu ft) Moisture (lb/cu ft)
42 3 3 5 134. 5 0. 00 13, 3 0.17 127. 8 2. 28 13.1 1. 57 23 3 3 0 130. 2 0. 24 16. 7 1. 03 115. 3 3. 47 18. B 1. 04 29 J I ~ 144. 7 0. 24 6, 5 0. 42 138. 3 7. 59 7. 3 0. 82 44 2 3 I 133. 3 o. 26 11. 5 0. 50 121. 7 1. 30 8, 5 1. 95 35 3 I 0 134. 3 0. 28 12. 1 0. 37 130. 0 28. 2 15. 3 0. 91 48 3 I ~ 132. 2 0. 46 13. 2 o. 84 11B. 7 11. 73 11.8 4.10 28 2 1 2 132. 4 0. 60 10. 7 0.10 129. S 2. 50 12. 6 1.15 51 3 3 1 140. 6 0. 60 12. 4 0. 66 132. 3 0. 75 12. 6 1, 95
12 3 4 2 128,3 0. 65 9. 0 0. 37 123. 3 7. 98 11. 0 o. 71 21 4 5 2 137. I 0. 74 10, 3 o. 20 119. 7 5. 79 6. 2 2. 74 18 3 l I. 140.0 o. 82 16. l 0. 57 134. 9 2.13 17. 3 2. 35 39 3 2 I 127. 8 1. 03 14. 5 2. 31 124. 5 2. 95 18. 2 1.12
5 3' I 3 131. 8 1.18 11. 9 o. 82 126. 7 4.19 1B. 4 1. 82 22 3 I l 109. 8 1. 20 6. 5 0. 40 104. 7 3, 30 7. 2 0.17
8 2 I I 129, 8 1.25 13. 5 0. 30 124. 6 1. 55 22. 2 o. 90 19 3 4 l 133.8 1. 31 16. 0 1. 76 125. 0 4. 96 15. 9 1. 68 20 3 1 0 132. 2 1. 31 13. 7 0. 47 120. 5 0. 28 14. 9 o. 62 32 3 I 0 132. 2 1. 40 13. 8 0. 50 134. 0 10. 61 17. 3 2. 73 33 3 j 4 140. 0 1. 47 6. 2 0. 24 138. 7 3. 79 7. 2 1. 77 31 2 I 9 129. 5 1. 50 9. 6 0.10 105. 8 3. 75 9. 7 0.17 47 2 3 2 140. 5 1. 55 11. 9 0. 20 132. 8 0. 26 12. 0 0. 56 24 3 •1 0 116. 0 1. 63 6. 2 0. 62 108. 8 4. 81 6. 9 o. 71 27 4 I 0 140. 5 1. 70 9. 4 1. 90 129. 5 4. 56 9. 6 2. 66 25 3 4 0 117. 7 1. 70 5. ? 0. 20 107. 5 4. 69 6. 1 0. 42 30 3 •1 5 144. 3 1. 70 6. 2 0. 55 134. 0 3. 74 6. 3 0. 50
4 ?. 3 , 125. 8 1. 75 13. 8 0. 46 118. 2 1. 15 20. 2 o. 90 7 3 5 0 85.1 1. 78 12. 7 2. 29 88. 3 5. 56 18. 4 2. 64
45 5 3 2 13. 3 1. 80 15. 5 1. 45 124. 1 4.14 18. 6 1. 19 50 4 4 I. 135. 3 1. B4 12. I 0. 30 130. 4 1. 35 10. 5 o. 59 9 2 l -0 125. 9 2. 10 13. 4 0. 50 123. 5 0. 50 22. 9 1. 40
15 3 3 J 139. 6 2.17 9. 0 0. 57 146. 5 1. 78 12. 0 4. 30 11 3 4 3 137. 3 2. 39 7. 5 0. 20 128. 5 1.08 8. 7 0. 66
3 4 I 0 127. 6 2. 49 123. 4 3. 66 13 3 3 4 133. 4 2. 78 137. 5 1. 78 53 5 0 127. 7 2. 78 10.1 0. 24 124. 6 4. 63 8. 4 2. 94 16 5 5 3 105. 9 2. 78 15. 7 1. 04 107. 4 4. 26 7. 8 2. 05 36 3 5 3 141. 7 2. 86 10.3 0. B6 123. 7 4. 49 11. 2 o. 28 54 3 1 3 132. 8 3. 06 13.1 0. 33 122. 4 o. 44 11. 5 0. 89
1 5 4 5 122. 3 3. 22 10. 4 1. 61 117. 9 4. 57 10. 0 1.06 10 2 I 0 129. 8 3. 25 9. 2 o. 60 118. 0 0,00 13. 0 1.00 34 3 4 0 140. 3 3. 30 5. 9 o. 30 140. 0 4. 26 7. 3 1. 50 17 3 I 4 129. 5 3. 34 11. 7 1. 67 125. 5 1. 26 12. 0 0. 97 41 4 2 2 132. 6 3. 35 16. 7 o. 50 121. 5 7. 90 15. 9 1. 93 46 4 3 4 138.1 3. 54 12. 4 0. 51 122. 1 5, 74 12. 4 1.10 52 3 5 4 139. 2 3. 66 13. 7 o. 22 123. 3 2. 62 13. 1 1. 23 49 4 4 4 134. 7 4.13 9. 5 0.42 131. 5 2. 69 11. 2 2. 97 26 3 3 5 137. 3 4.13 9. 2 0. 37 126. 3 6. 41 7. 6 1.14 43 3 1 I 130. 0 4. 53 17. 6 0. 54 120. 3 2. 01 19. 4 1. 52 40 3 2, I 127. 0 4. 89 15. 9 0. 83 123. 7 3, 60 16. 9 2. 39 14 3 3 4 124. 3 5. 25 121. 5 1. 08 37 3 s 3 135. 7 7.04 10. 8 0. 84 121. 9 8. 82 12. 0 2. 27 38 5 4 4 126. 6 7.15 9. 4 2. 72 139, 0 5, 10 10. 6 3.15
6 3 I 4 115. 9 8. 08 11. 4 0. 90 118. 0 4. 54 14. 4 0. 44
acode used: bRetained on No. 4 sieve: Ca = standard deviation of measurements in a 1 = silt and clay, 0 11; 0 to 10 percent, test group. 2 = mica, .1 • , 10 to 20 percent, 3 = shale, 2 ~ 20 to 30 percent, 4 = gravel, sand, dense-graded 3 ~ 30 to 40 percent,
base course, and 4 ~ 40 to 50 percent, 5 = random material. 5 ::;; 50 to 60 percent, and
6 -_ 60 to 70 percentj 9 = unknown gradation.
deviations were arranged in ascending order for all gages. Only the data from state -wide study are given in this form; laboratory results are given in graph form (Figs. 1 and 2). This procedure does not violate the validity of the data because the gages were all used on the same location and the same number of tests were taken by both systems.
RESULTS AND DISCUSSION
Evaluating the d/M system became a difficult problem because the sand-cone den-sity apparatus is not a precise measuring method. The solution to this problem of standardization was to collect a sufficient number of comparison samples to permit isolation of the variables causing discrepancies between the system.

40
The data collected by the laboratory with the older d/M model were used only for the repeatability analysis. The newer, modified gages were correlated separately to detect any changes in correlation between the two models. The 1962 series of statewide results was used for general analysis and the 1963 series was used for repeatability testing of the new gages. Over 1, 000 comparative tests were used in the study.
Repeatability
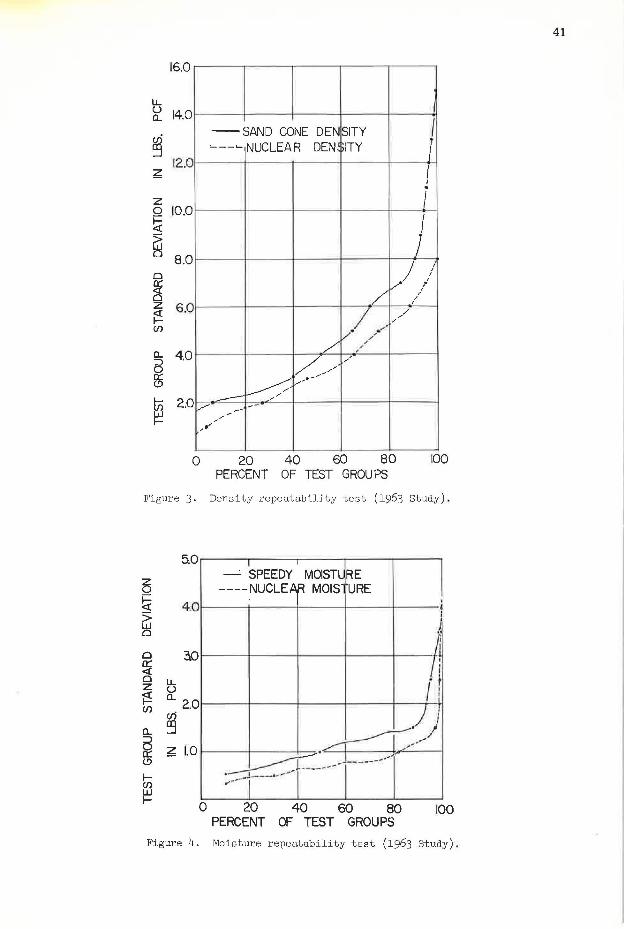
The repeatability analysis of the old d/M gages used during the laboratory evaluation in 1961 is shown in Figures 1 and 2 and Tables 2 and 3, and that of the new d/M gages used during the field evaluation of 1963 is shown in Figures 3 and 4. These figures show standard deviation of measurements from the arithmetic mean of test groups for both the d/M and sand-cone methods of determining wet densities and moisture content. The variation within test groups is not entirely due to instrument error, but is also attributable to soil density variation which can be appreciable even in 6- ft circles. If the extent of soil density variation could have been determined and removed, then the relative repeatability of the d/M to sand-cone methods would have been increased.
TABLE 2
STANDARD DEVIATION OF MEASUREMENTS (Statewide Study)
Wet Densities Moisture Sample No .
1 2 3 4 5 6 7 8 9
10 11 12 13 14 15 16 17 18 19
21 22 23 24 25 26 27 28 29 30 31 32 33 34 35 36 37 38 39 40 41 42 43 44 45 46 47 48 49 50 51 52 53 54
Nuclear
I.I 1. 2 I, 2 1. 3 1. 3 1. 4 1. 6 1. 7 1.8 1.8 1.8 1.8 1.8 1.8 1. 9 2.1 2.1 2. 3 2. 4
2. 6 2. 7 2. 8 2. 9 3, 0 3, 0 3, 2 3. 2 3. 2 3. 3 3. 3 3, 3 3. 7 3. 9 3. 9 4.0 4. 1 4. 5 4. 7 4, 9 5. 0 5.1 5. 2 5, 4 5. 4 5. 6 5, 7 5. 8 6. 5 6. 5 6, 5 7. 0 7. 6 8.1
Sand Cone
0. 6 l. G 1. 9 2. I 2. I 2. I 2. I 2. 1. 2. 2 2. 2 2. 3 2. 3 2. 5 2. 5 2. 5 2. 6 2. 6 2. 6 2. 7 " 0
2. 8 2. 9 3. 0 3. 4 3. 6 3. 7 3, 8 4.1 4.1 4.1 4.1 4. 4 4. 7 4. 7 4. 9 5. 2 5. 3 5, 7 6. 0 6. 2 6, 3 6. 4 6. 4 6. 7 6. 8 6. 8 6. 9 7. 9 8. 0 8. 7 9, 9
10. 0 13, 0 15, 3
Nuclear
0.17 0. 24 0. 24 0. 31 0. 31 0. 37 o. 40 0. 42 0. 42 0. 44 0. 45 0. 45 0. 46 o. 46 0. 48 0. 50 0. 50 o. 55 0. 56 n on
0. 60 0. 61 o. 62 0. 62 0. 63 0. 63 o. 69 o. 70 o. 70 o. 71 0. 72 0. 73 o. 74 o. 76 0. 78 0. Bl 0. Bl o. 81 0. 83 0. 87 0. 90 0. 92 0. 92 0. 98 1, 07 I. 20 I. 20 1. 21 1. 21 1. 24 I. 65 1. 79 1. 88 4. 30
Speectv
o. 38 0, 42 o. 44 0. 50 0. 51 0, 54 0. 54 o. 57 o. 57 0. 58 0. 59 0. 66 0. 67 0. 67 0. 69 0, 69 0. 73 0. 73 o. 76 IJ. 83 o. 85 0. 88 0. 88 0. 88 o. 91 o. 93 0. 96 0. 99 I.OB 1. 13 I, 13 1.14 1.17 1. 22 1. 23 1. 27 1. 28 I. 29 I, 31 I, 35 1. 36 1. 36 I. 37 1. 37 I. 43 I, 44 I, 50 I. 85 1. 92 1. 95 2. 01 2. 23 2. 38 3. 51
The curves show the standard deviation of the d/M system to be lower than that of the sand-cone method. The area under the lower curve is the average standard deviation when using the nuclear system and represents the variation of soil density ...-1~~~ L ... ~••-,.... ,.......,.....,,..,...,. mt..,.. ..,...,.,..,. .... 1,..,,...4-............. - Ll- ..... ,lJ.lUi:) LCOL.Ul5 V.L.lU.L • .I.lit::' ct...LCa.. UC'LWCC:11 lU.t::'
two curves is the difference in standard deviation or the repeatability of the testing methods. Figures 1 and 3 show the standard deviations of the d/M and sandcone wet densities. Figures 2 and 4 show the standard deviations of the d/M, oven -dried, and Speedy moisture contents. The d/M system shows a better repeatability in measuring wet density than the sand-cone method and a better repeatability in measuring moisture content than either the Speedy or the oven-dried method. The Speedy method has a better repeatability than the oven-dried method in measuring moisture content.
Gradation Effect on Repeatability
Gradation as used here means the percentage of material retained on the No. 4 sieve. When gradation was used as an independent variable (Figs. 5 and 6), no correlation of variances of nuclear from
TABLE 3
EFFECT OF SOIL TYPE ON REPEAT ABILITY OF MEASUREMENTSa
Soil Type No , Test
Groups
Clay silt 19 Micaceous 3 Shale 12 Sand & gravel 12 Random 7
Std. Dev. (pc!)
Nuclear Conventional
Wet Density Moisture Wet Density Moisture
2. I 3.l 2. 0 2. 0 3. I
o. 55 I. 20 o. 50 0. 75 o. 80
3,0 4,0 2. 5 4. 1 5.1
1, 28 1, 96 1, 30 1, 26 2. 02
aStandard deviation of measurements within groups, from laboratory study.
16.0
LL
~ 14.0
12.0
--SAND CONE DEN SITY I ~--~ NUCLEAR DEN ' ,ITY
( . z o 10.0 ~ ~
8.0 0
8 2 6.0 ~ (/)
a. 4.0 ;
I
j /
/./,/ /
/~,,-·/
,/ ,,
/ /
/_,,-- /
-
~ ,,,,,,.-.,.,. -~ 2.0 V -- --,, ,,
,•'
0 20 40 60 80 100 PERCENT OF TEST GROUPS
Figure 3. Density repeatability test (1963 Study).
5.0
t5 ~ 4.0 > ~
0
~ ao
z t, i=! a. 2.0 (/) (/j
0. ~ g ~ 1.0 (.9
I--ff}
I '
I -· SPEEDY MOISTU RE
----NUCLEAR MOIS URE ' '
~ • r / I
.) ) -~----✓
~ I .~ >-r---- I ----r -------1--
0 20 40 60 80 100 PERCENT OF TEST GROUPS
Figure 4. Moisture repeatability test (1963 Study) .
41

42
6.0 LL 0 a..
I 4.0
z 0 i= 2.0 <(
> w 0
ci I-(/)
Figure
~ 6.0 0....
:z: ~ 4,0 ""' > UJ c:,
~ 2.0 c:, z: ~ en
-
--
I I 6 9 _9 __ 5 N . OF SAMPLES
/ I
I
/M WET DENSITY S-C WET DENSITY
9 C, C>
~ C, g
('J ro;> In
' I 6 I C, !: C> C, C,
('J "° - .,, PERCENT RETAINED ON #4 SIEVE
5. Gradation effect on repeatability (1961 Study) .
10 ~ · L_ .3
/ ' --< -- -/- ./ ---- ----- I """I _,,/:/ /
1: ---- /
C,
I 0
~
C> ('J
I C>
0
"° I C, ('J
C, .... I
C,
"°
C, .,, I
C, .... PERCENT RETAINED ON # 4 SIEVE
2
C, = I C, .,,
N . OF GROUPS
- -- S· C W ET DENSITY AR WET OEN. - ~UCLE
Figure 6. Gradation effect on repeatability (1963 Study).
6 OUPS 1:1 9 6 !I !S 15 NO. Of GR LL 0 0..
I 4 z 0
~ 52 w 0
0
~o 0 z i en
I
I
i I , ____
f.--- ,_
~ --i::------ - -- ------- -, ---~
0
6 0 (),J
I
Q
PERCENT
- - L---
0 0 ro ._,. I I
0 0 (),J i<)
RETAINED ON
0 LO ' 0
s;f'
NO. 4
I
- OVEN DRIEn .... ____
---0 ~ 0 I()
SIEVE
-~ UCLEAR
Figure 7. Gradation effect on repeatability (1961 Study) .

43
sand-cone density apparatus was possible. The effect of gradation on variance, as indicated by comparing the similarity of the curves, was reproducible by both density measuring methods. The highest nuclear density variance was obtained in soil having 40 to 50 percent of material retained on the No. 4 sieve. This may be attributed to the increased difficulty in obtaining proper gage setting on coarse material.
Gradation, as shown in Figures 7 and 8, did not appear to have any effect on the determination of moisture contents, and the repeatability of the moisture methods appears to be independent of the gradation of the soil.
Soil Effect on Repeatability
The effect of soil type on the repeatability of density and moisture measurement, as tested by the laboratory, is indicated in Figures 9 and 10 and Table 1. That the nuclear density curve is parallel to the sand-cone density curve indicates that soil type affects the repeatability of both density testing methods. Tests performed on shale and clay soils appeared to result in better repeatability than other soils. Standard deviation of moisture tests within groups !Fig. 10) formed parallel curves indicating a fluctuation in the repeatability of the nuclear and oven-dried moisture determination methods with different soil types.
Grouped results of density and moisture determination, as tested by the districts, consisted of only three different types of soils. This was an insufficient number to yield a meaningful graph.
Repeatability Summai·y
The nuclear results showed consistently better repeatability than conventional test results for all studies. The data from the new model d/ M gages as used by the districts showed a poorer repeatability than the data from old model d/ M gages as used by the laboratory. This was believed to have been caused by the superior technique of laboratory technicians and by the change in test procedure whereby the use of the steel plate for surface preparation was eliminated. The irregularity of the surface possibly introduced an additional variance.
A uniform test procedure using the steel plate will be established for the next construction season. The use of the plate reduced the surface preparation time and improved the repeatability of the d/ M system.
CORRELATION
The statewide results, collected during the 1962 construction season, and the grouped results, collected during the 1963 construction season, were sorted, tabulated, and totaled by individual gages, gradation, and soil type to determine the effect
z 0
~ 5 ~ 0
8 z ~ en
6,0
b 4.o a..
' 0 5 2.0 0 a..
~
'.10 7 -
- ---__ _L - --, ____
- -I
0
b ~ I
Q
!Q_ 9 e
- -,.... _____ ---I
0
~
12 NO. OF TESTS
----s -· -PEEDY
LEAR --NLC
PERCENT RETAINED ON NO. 4 SIEVE
Figure 8 . Gradation eff ect on r epeatabil it.y (1963 St udy) .

44
u. 6 0 Cl.
I
6 4 ~ 5 w 0 2 ~ g z 1=! 0 (/)
~
1-----+---+---+----- - NUCLEAR
~ _J 0
w ...J 5 <t
~ 05 SOIL TYPE
Figure 9. Effect of soil type on r epe atability (1961 Study) .
~ :r: I-~ w a:: ::::> ~ 0 ~ a:: LL w 0 ~ z s: 0
LL ~ 0
Cl. > w ui 0 (I)
_J
0 er
vi <t 0 Cl. z ::::> ~~ (/) (.!)
6.0
4.0
- --
2.0
19
- -
/ , i, '
V
~ _J (_)
~
3
<( (_)
~
2
----- ---------....___
w <:/. :r: (/)
SOIL TYPE
IL
,,.,,. -... -
-
--
lL
NO. OF TESTS
Figure 10, Effect of soil type on repeatability (1961 Study).
of these variables on the correlation of the systems. The laboratory da:a of the 1961 study were not used for correlation purposes.
Correlation of Individual Gages
Analysis of the test data of the 1962 and 1963 seasons showed the density variation between the sand-cone and nuclear methods to be reproducible for ten out of eleven d/ M density gages. To determine which method was responsible for the variation, all nuclear density gages were tested on the same standard granite block. The variation from the standard did not agree with the variation of nuclear from sand-cone density tests. This indicated that a portion of the error is due to miscalibration of the nuclear gages and the rest is due to sand-cone error. The moisture results by the nuclear method were generally 1 ½ pcf lower than the Speedy moisture results.

45
Gradation Effec t on Correlation
The 1962 and 1963 results were graphed with the gradation used as an independent variable a nd deviation of nuclear wet density from sand-cone wet density as the dependent variable. Both graphs (Figs. 11 and 12) yielded bell-shaped curves with the apex centered about the 20 to 30 percent retained point.
The two sets of data were then collated and subdivided into gradation by soil type. That is , the gradation of silt and clay, shale, embankment sand and gravel, and soilcement sand and gravel-type soils were plotted against the deviation of nuclear density from sand-cone density (Figs. 11, 13, 14, and 15). The average density of the samples changed from 124 pcf for very fine material to 127 pcf for soils with 20 to 30 percent retained and gradually decreased to 125 pcf as the soil became more granular. The average deviation of the d/ M results from the sand-cone results for different soils varied subs tantially: -1. 45 pcf for shale, -4. 22 pcf for sand and gravel , -3. 86 for
w z 0 u I
0 z ff.i
0:: <{ w _j u :::::) z e; ~ a:: g >-I-en z w 0
+2.0
0
-2.0 LL
~ 0~ -3.0 0 I I-w ~
23 39 ?q l?i::;. 115 '19
----/ ~ ,, / \
/ ----- -----/ --\-- f--- - AVE. I/ \
\ ~
0-10 10-20 20-30 ?D-40 40-5:J 50--60 PERCENT RETAINED ON NO. 4 SIEVE
NO. OF TESTS
VARIATIONS=-l45#
Figure 11 . Gradation effect on shale density correlation (1962 and 1963 Study) .
..._ <..:> <>...
I
<..:> I ..,, E 0 .... ,._
::E ~
0
:z -2.0 C>
I< 0:::
~ -4.0 >-1--
en z: LU 0
102 147
/ ~ -
C> C>
T "" I C> C>
142
_,.,,,,- I'-..
C> ro I = ~
'\
116
' I'--._
C> '<t" I
C> ro
52
C> LO
I C> '<t"
PERCENT RETAINED ON #4 SIEVE
41
~ L/ C> CD I
C> Ui")
12 NO. TESTS
J I
= 'j"" C>
=
Figure 12. Gradation effect on density correlation (1962 and 1963 Study).

46
2 0 0 0:: LL
a:: <I'. LL -2 w t.)
d Q_ :::)
z >-"" - f-6 Vi -4 _z ~~ 0:: :s ~ -6
0 >- 0 f- f
~~ w <I'. 0 (/)
Q I
0
0
~ 9. Q ~~
PERCENT RETAINED ON NO. 4 SIEVE
AVG. -- VARI iTION =-4.22 PCF.
Figure 13 . Gradation effect on density corre l ation of embankment sand and gravel.
2 0 U:: LL
0:: <I'. u..
0
w () d n. ~>-~ - 2
f-"u'i Zz
Qw !:::i: 0 - 4 Ir w ~ z
0 >- t.) f- I Vi 0 -, -, '- «.. w <I'. 0 (/)
II
_\,_
Q I
0
14
"---- l.......,../"
0 C\J
I
Q
22
/
------~
f 0 C\.!
9 NO OF TESTS
ti. ~ - VARIATION=-3.86 PCF.
~
PERCENT RETAINED ON NO. 4 SIEVE
Figure 14. Gradation effect on de ns ity correlation of sand and gravel of s oi l cement.
LL 0 0 Q_
z 0
~ - 2 Ir :s >-f-Vi z w 0
T 0
0 C\l
PERCENT RETAINED ON #- 4 SI EVE
AV . VARIATION· -1.02 PCF
Figure 15. Gradation effe ct on dens i ty correlation of clay and s ilt used in embankments.

47
sand and gravel used in soil cement, and -1. 02 pcf for clay and silt. A strong bellshaped trend is indicated by the shale and sand and gravel soils (Figs. 11 and 13). A weak trend was indicated by the silt and clay soils and a similar trend was indicated by the sand and gravel used in soil cement.
In all sortings of data by gradation, the deviations always peaked at the 20 to 30 percent-retained point. This suggests that either the sand cone gives too low a result or the nuclear density gage reads too high. It has been shown by Redus (7) that sandcone apparent density is higher than actual density when soil becomes too-granular. This explains the increase in the deviation of the nuclear results as the material becomes coarser; however, no explanation can be given for the initial positive slope of the curves.
Gradation plays a definite role in correlation of the two density systems. The single graphs do not show which gage is most affected; they merely indicate that a trend does exist. Figures 11 and 13 show the trend for granular material to be nonlinear with reversal of curvature occurring at the 20 to 30 percent point. An examination of Figures 14 and 15 shows that the reversal points also occur at the 20 to 30 percent point; however, the initial part of these curves has a negative slope. Figure 14 represents gradation effect on correlation of sand and gravel used in soil-cement construction. The first half of the curve diametrically opposes the curve of sand and gravel behavior in embankment construction (Fig. 13). The similarity of Figures 14 and 15 suggests that sand and gravel used in soil-cement construction and silt and clay soils possesses some identical physical characteristic, possibly cohesion. The addition of cement to sand and gravel duplicates the cohesive property of the clay. If cement had influenced the nuclear density gage, the curve would not have changed its shape but would have shifted in some direction. Because no such shift occurred, the change in behavior of the first half of the curve is probably due to the mechanics of the sand-cone procedure. From this it may be concluded that the sand-cone accuracy is susceptible to the physical properties of the soil.
Gradation showed no effect on the on-elation of moisture results by either method. Nuclear results were consistently lower by approximately 1 % lb of water per cubic foot of soil. This may be due to two reasons: (a) the conversion of Speedy results into pounds per cubic foot introduced additional error; and (b) the Speedy tester measures only the surface moisture of fine material, whereas the nuclear gage measures the average moisture of all the sample.
Soil Type Effect on Correlation
The data collected during 1962 and 1963 was sorted and tabulated by five soil groups: silt and clay, micaceous soils, shale, sand and gravel, and random material. A gage correlation analysis was then conducted for each soil type except micaceous soils. This type was omitted because only a few tests had been taken.
The reproducible variation between the conventional and d/ M systems indicates a definite effect of soil type on correlation. Shale with silt and clay had the smallest density differences, being almost 2 lb lower than by the sand-cone method. Sand and gravel had the largest deviation, -4. 2 pcf. This may be due in part to the indirect influence of gradation and cohesion of soil particles on the sand-cone apparatus. Freshly crushed shale has very little cohesion and behaves like sand and gravel during the density test (Figs. 11 and 13), the only difference being the location of the curves with respect to the horizontal axis. The similarity of shale to silt and clay in density variation is thought to be a result of a similarity in chemical composition.
Soil type also appears to affect d/M calibration. Calibration error for each soil type varies from -1. 7 pcf for shale and silt and clay to 4. 2 pcf for sand. If the d/ M gage were calibrated for the average variation of all soils, the calibration error would be in the range of± 1. 5 pcf.
Soil type did not appear to have any effect on nuclear moisture test correlation or repeatability. The nuclear moisture gage had consistently lower readings, averaging -1. 5 pcf. The repeatability of the nuclear moisture gage was better than of the Speedy moisture tester.

48
TABLE 4
VARIATION IN DENSITY CORRELATION BY DISTRICTsa
Distric t Ci WW (1962) Ci WW (1963) C.STD (pcf) (pcf) (pcf)
1 2 3 4 5 6 8 9
10 11 12
- 2.29 +1. 67 +1. 90 +1. 89 -4 . 31 -2.56 +3 . 12 -2.19 -3.50 -1. 20 -0.18
a Nuclear [rom sand cone .
-2.05 +0.68 +1. 60 -4.65 -4.12 -2. 28 +1. 68 -2.60 - 2. 70 -1. 40 +0.43
-2.50 -1. 80 -0.50 -2.00 0.00
+0. 98 +6. 00 -2. 55 - 2.00 -3.06 -0.96
The variation in density correlation be -tween nuclear and sand-cone methods is summarized by districts in Table 4.
CONCLUSIONS
1. The standard deviation of the measurement taken with the d/M system is approximately one -half that of measurements taken with sand-cone and Speedy moisture apparatus.
2. Gradation has a reproducible effect on d/ M and sand-cone density repeatability. This effect will require further study.
3. Correlation of moisture gages was not changed by soil properties. Nuclear moisture results were consistently 1. 5 pcf lower than Speedy moisture results.
4. Soil cohesion and gradation affect sand-cone density accuracy. 5. Soil types influence d/M calibration. An average calibration of d/M gages for
all soils will result in a maximum expected instrument deviation of ± 1. 5 pcf. 6. The d/ M gages are a rapid and reliable means of determining the moisture and
density of embankment and base construction.
REFERENCES
1. Pontecorvo, B., "Radioactivity Analysis of Oil Well Samples." Geophysics, 7: 90-94 (1942).
2. Russel, W. L., "The Total Gamma-Ray Activity of Sedimentary Rocks as Indicated by Geiger Counter Determinations." Geophysics, 9: 180-216 (1944).
3. Fearon, R. E., "Neutron Well Logging." Nucleonics, 4 (B): 30-42 (1949). 4. Belcher, D. J. , Cykendall, T. R. ., and Sack, H. S., "The Measurement of Soil
Moisture and Density by Neutron and Gamma-Ray Scattering." CAA Tech. Rept. 127 (1950).
5. Nuclear- Chicago Corp. , "Measurement of Moisture and Density in Soils by the Nuclear Method." ASTM Symp. on Radioisotope Test Methods (1959).
6. Commonwealth of Pennsylvania, Dept. of Highways Specs., Form 408, p. 125-126 (1960).
7. Redus, J. F., "A Study of In-Place Density Determinations for Base Course and Soils." HRB Bull. 159, p. 33-40 (1957).
ACKNOWLEDGMENTS
The authors wish to acknowledge the statistical assistance in data processing by F. D. Geissler, Director, Bureau of Electronic Data Processing; the collection of data of district construction inspectors; editing of D. M. Skean; cooperation in field work of the Soil Engineering Unit; and the critical review of P. E. Irick.
49
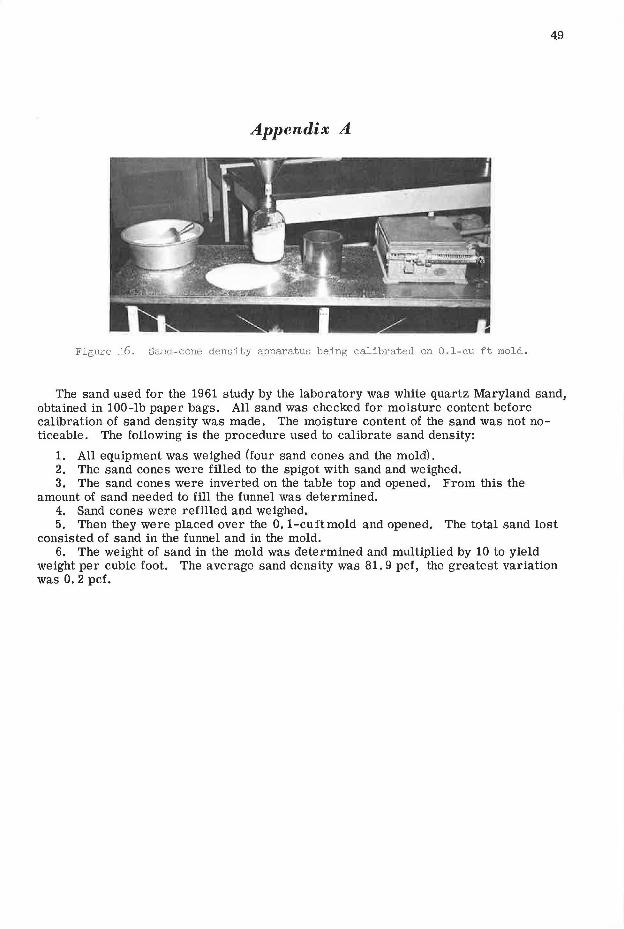
Appendix A
Figure 16. Sanc1-cone density apparatus being calibrated on 0.1-cu ft mold.
The sand used for the 1961 study by the laboratory was white quartz Maryland sand, obtained in 100-lb paper bags. All sand was checked for moisture content before calibration of sand density was made. The moisture content of the sand was not noticeable. The following is the procedure used to calibrate sand density:
1. All equipment was weighed (four sand cones and the mold). 2. The sand cones were filled to the spigot with sand and weighed. 3. The sand cones were inverted on the table top and opened. From this the
amount of sand needed to fill the funnel was determined. 4. Sand cones were refilled and weighed. 5. Then they were placed over the 0.1-cuftmold and opened. The total sand lost
consisted of sand in the funnel and in the mold. 6. The weight of sand in the mold was determined and multiplied by 10 to yield
weight per cubic foot. The average sand density was 81. 9 pcf, the greatest variation was 0. 2 pcf.

50
Appendix B
Figure 17. Steel plate,½ by 12 by 12 in., with welded reinforcing bar for handle.
The use of steel plate expedites surface preparation and secures ·a smooth surface. The following are the steps followed in preparing a test surface:
1. Plate is placed on roughly leveled surface and moved back and forth an inch or two, several times. This motion tends to shave off the peaks of granular material.
2. The plate is lifted off and the voids are filled with fine parent material. 3. The plate is pressed down and with back and forth motion excess material is
leveled off.
If the material is very granular and the surface very irregular, as in the case of shale embankments, the plate must be slid along the surface for a foot length so that the sharp edge will shear off the protruding material. Then the preceding steps can be followed.