field evaluation of real-time xbt systems
TRANSCRIPT

811
Field Evaluation of Real-Time XBT Systems
Michael SZABADOS and Darren WRIGHT
National Ocean Service, NOM600} Executive Blvd
Rockville, MD 20852 - U.SA.
INTRODUCTION
The use of XBT's to measure the ocean's subsurface temperature hassignificantly increased over the past decade. NOAA is activelyparticipating in an international effort to increase the number ofsubsurface temperature observations in support of globaloceanographic and climate studies. NOAA's XBT program currentlysupports more than one hundred voluntary observing ships (VOS).These vessels are responsible for more than 12,000 XBT observationseach year. Determining the field performance of XBT data systemsis an importance step in the quality control of these data. Thepurpose of this field test was to evaluate the performance of fourXBT systems under field conditions. The systems evaluated were aSEAS III (Sippican's MK-9), a Bathy Systems' 810 XBT Controller,an ARGOS XBT system, and Oregon State University's (OSU) XBT DataBox. In addition, the capability of both the ARGOS and GOESsatellite systems to transmit XBT data in the JJXX format wereevaluated. The SEAS III and ARGOS systems were used to evaluatethe satellite transmission process for GOES and ARGOS respectively.
METHODS AND PROCEDURES
All XBT data were evaluated relative to a field standard. Thefield standard used was a Neil-Brown Instrument Systems Mark IIICTD. Each XBT system and the Neil-Brown CTD were calibrated beforeand after the test. A decade box and XBT test canister were usedto evaluate the XBT systems over a range of eleven resistance(temperature) values. The results of the XBT calibration check arepresented in Table 1. Initially the OSU system failed thecalibration test at temperatures below 5 degrees Celsius. Thesystem was returned to the manufacturer for adjustments. Thevalues from the OSU system in Table 1 were taken from a secondcalibration check of the OSU system after adjustments were made bythe manufacturer.
The XBT Field Evaluation took place on board the NOAA Ship WHITINGduring July 1988. The WHITING was participating in studies of thecurrent and water mass structure in the Southwestern North AtlanticOcean in the context of the SUbtropical Atlantic Climate Studies(STACS) Program. The evaluation occurred during the BarbadosBarbados leg of the cruise when thirty-three CTD casts were taken.Station locations are shown in Figure 1. During each CTD cast, twoXBT's were released from each system. One was released during thedescent of the CTD and one was released during the ascent of theCTD. Each XBT system s set ~ r an XBT drop prior to the
ORSToM

812
descent of the CTD. To m1n1m1ze the influence of internal waves,XBT's were released from each system at the same time when the CTDwas located in the thermocline. Similar procedures were repeatedduring the ascent of the CTD. XBT's released during the ascent ofthe CTD were used to help indicate the temporal variability of thethermal structure while on station. Only XBT's released during thedescent of the CTD were used for the XBT-CTD comparison. A totalof 250 XBT's were released during the evaluation. Of these, 126were released during the descent of the CTD. Table 2 presents thetotal number and type of XBT probe released for each system duringthe descent of the CTD. No T-5 or T-10 probes were used with theOSU and ARGOS system since these systems were not programmed withthe corresponding depth coefficients.
Table 1. XBT SYSTEM CALIBRATION CHECK(Temperature in Degrees Celsius)
Resistance3193335040245000624772749948
12679163291728718094
(Calibration Temp)(35.55)(34.44)(30.00)(25.00)(20.00)(16.66)(10.00)( 5.00)( 0.00)(-1.10)(-2.00)
XBT System Temp -MK-9 BATHY0.00 -0.06
-0.05 0.080.02 0.13
-0.01 0.080.00 0.060.01 0.050.02 0.040.03 0.040.01 0.000.00 0.010.01 0.00
Calibrationosu
-0.05-0.08-0.01-0.04-0.05-0.05-0.05-0.02-0.05-0.06-0.04
tempARGOS**N/A**N/A-0.03-0.06-0.06-0.06-0.06-0.03-0.06-0.07-0.05
** - The ARGOS system does not handle temperatures in these tworanges.
.0-:' ~ ., . S'l'ACS Crui8e - Sui" 19811 1811
1811
I."IZN
ION
eN
'OW
Figure 1. Cruise Track and XBT/CTD stations

813
Table 2. PROBE TYPE AND NUMBER RELEASED FOR EACHXBT SYSTEM DURING DESCENT OF CTD
PROBE TYPE MK-9 BATHY OSO ARGOS
T-10 7 7 0 0T-7 7 7 7 7T-6 7 7 15 15T-5 5 5 0 0T-4 7 7 8 8
Out of the 250 XBT's released, there were a total of five probefailures (2%). A summary of common XBT malfunctions is presentedin Kroner and Blumenthal, 1978. The BATHY system had one probefailure, while the OSU and ARGOS systems each had two probefailures. Five software/system crashes occurred with the OSUsystem. These failures were attributed to incompatibility betweenthe OSU software and the PC clone (televideo XL computer) used.All XBT data collected by the SEAS III and the ARGOS systems weretransmitted in real-time contingent on available space in thesatellite transmission window.
Before comparing the XBT data to the CTD data, XBT depthtemperature pairs were computed using a linear interpolation schemeso as to have the XBT depth.coincide with the CTD depth. Exceptfor the profile plots comparing the XBT and CTD traces, analysiswas based on the interpolated XBT data.
RESULTS
Several factors must be considered in the evaluation of XBT - CTDtemperature comparisons. Some of the important factors are themethods used to determine the depth of the XBT and the CTD,thermistor errors, and environmental factors such as the stabilityof the water column. Differences between a temperature measuredby the CTD and an XBT can in part be attributed to the computationof the XBT probe depth. The depth of the XBT is determined byusing a depth equation based on the fall rate of the probe, whilethe CTD depth is measured using a pressure transducer. Inaddition, the XBT descends at a faster rate than the CTD ( 6.5m/sec, XBT; 0.5 m/sec, CTD). The XBT and CTD will thereforemeasure temperature simultaneously at the same depth and time onlyonce. Any changes in the thermal structure of the water columnduring the descent of the CTD due to internal waves will appear asa temperature difference between the CTD and XBT. Temperaturedifferences between an XBT system and the CTD can also beattributed to the individual thermistor in each XBT probe. Whileeach XBT system and the CTD thermistor were calibrated, the actualthermistor in each XBT probe were not.
814
The mean of the absolute temperature difference between the CTDand each XBT system over the total XBT profile for each probe typeis provided in Table 3. These results show differences greaterthan the +/- 0.15 degree Celsius specification for XBT probes. Tointerpret these results it is important to identify the factorswhich contribute to these differences between .the XBT and CTDmeasurements.
Table 3. MEAN OF THE ABSOLUTE DIFFERENCE BETWEEN THE XBT AND CTDTEMPERATURE (Degrees Celsius)
Probe Type
SYSTEM T-04 T-05 T-06 T-07 T-10Mean SD Mean SD Mean SD Mean SD Mean SD
MK-9 .36 .14 .11 .06 .33 .13 .34 .24 .30 .21BATHY .30 .15 .24 .17 .26 .11 .30 .19 .33 .18OSU .19 .19 .14 .06 .18 .07ARGOS .38 .22 .39 .11 .42 .33
To isolate the contributions of the XBT thermistor error to theresults shown in Table 3, temperature differences in the isothermalportion of the mixed layers were analyzed. This was done becausetemperature differences due to depth errors, instrument response,and internal waves would be minimized by these conditions. ThUS,as shown in Table 4, when comparing only temperatures in theisothermal portion of the mixed layers, the temperature differencebetween the CTD and all four systems was reduced by an order ofmagnitude. The mean departure of the XBT temperature from that ofthe CTD is well within the XBT specifications. These results alsoagree well with the XBT system calibration check in Table 1.
Table 4. MEAN TEMPERATURE DIFFERENCES BETWEEN THE XBT AND CTD INTHE MIXED LAYERS (DEGREES CELSIUS)
SYSTEM MEAN STANDARD DEVIATION
MK-9 .029 .046BATHY .106 .064OSU -.074 .083ARGOS .016 .055
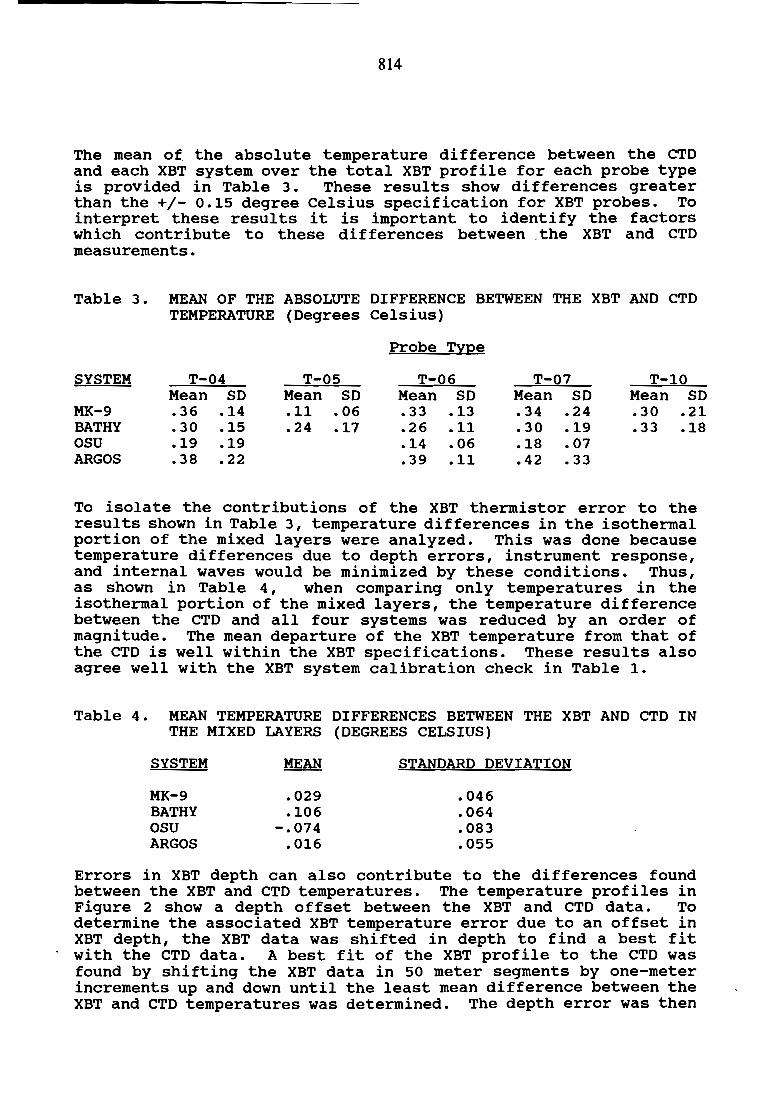
Errors in XBT depth can also contribute to the differences foundbetween the XBT and CTD temperatures. The temperature profiles inFigure 2 show a depth offset between the XBT and CTD data. Todetermine the associated XBT temperature error due to an offset inXBT depth, the XBT data was shifted in depth to find a best fitwith the CTD data. A best fit of the XBT profile to the CTD wasfound by shifting the XBT data in 50 meter segments by one-meterincrements up and down until the least mean difference between theXBT and CTD temperatures was determined. The depth error was then
00-VI
'50
800700eoo
'00
••••• BATHv
..... a..THV
OEp-r ... lmI
Mean XBT DepthError
300 400 soo
50
T-10 PROBE
T-OS PROBE
200'00
-- ....-11
Figure J.
-- ....-11
0EPT>4 ...
-~
.0
20rl------------_---.
0/ ~..;..., ~ I'0
20 1 •
-'0
-20' , , ,o
-20' , . Io
~~ -'0~
I
i
400
400
--.-
300
300
200
200
------------ _.._-_ _------
'0()
'00
100 200 300 400 soo eoo 700 800
._".;"::::~-"-
-'......
~~~: ....~~ .~._~-----_._-~
T-04 PROBE
-- twt<-o .0._- B.. THT ----. OSU _._.~
T-06 PROBE
OEP1H Cml
-- M<-9 .0 ••• B .. THV ---_. 09.J --. ARGOS
-- M<-O .-••. BATHV' ----- 09.J -- ARGOS
T-07 PROBE
[EPTH ....
10l I
10. I
'0 ,,---------------------,
-30' "Io
-20
-30' "o
I ::z-, I
i 0
'''':;;;;;;;;;;>",,,,,.:.::::: ii -'0 ~
~~ -20 ~
I
i~ -'0~
~
I
i -,:~~ -20
~~ -30
-400
n
u
CTD
DSU
C'ft>
........ .
IS
15 ZI'_N_I",CI
(b)
11
11 IS ZIIt_"pat... (.... C)
(d)
1.
4SI
SSI'"
IS
SI
III
1S1
ZII
nlJII
~ UIt~.
• 4SI
SII
SSI
HI
".711
lSIS
" ZSI~; I: 311t
3S1
.1
ZS
eee
RJ:-I •••••••
CTD
Bo\'I'1lY •••••••
r
IS
IS
IS zj Z,I••"ra.... etlt' C)
(C)
IS ZIIt......... lu, Cl
(a)
11
11
1.
1.7S11'1 i • i j
S
711
7S1kV i ' , ,~
S
SIr i i , )
SI
III
ISI
ZII
ZSI
JII
I~ i i , i ..
'Ir111~
jISI~
ZlItnitJllf
I3S1t
tilttSlt
'"'SI
'"151
711
tSl
SII
SSI
'"'SI
~ JSI•~-•
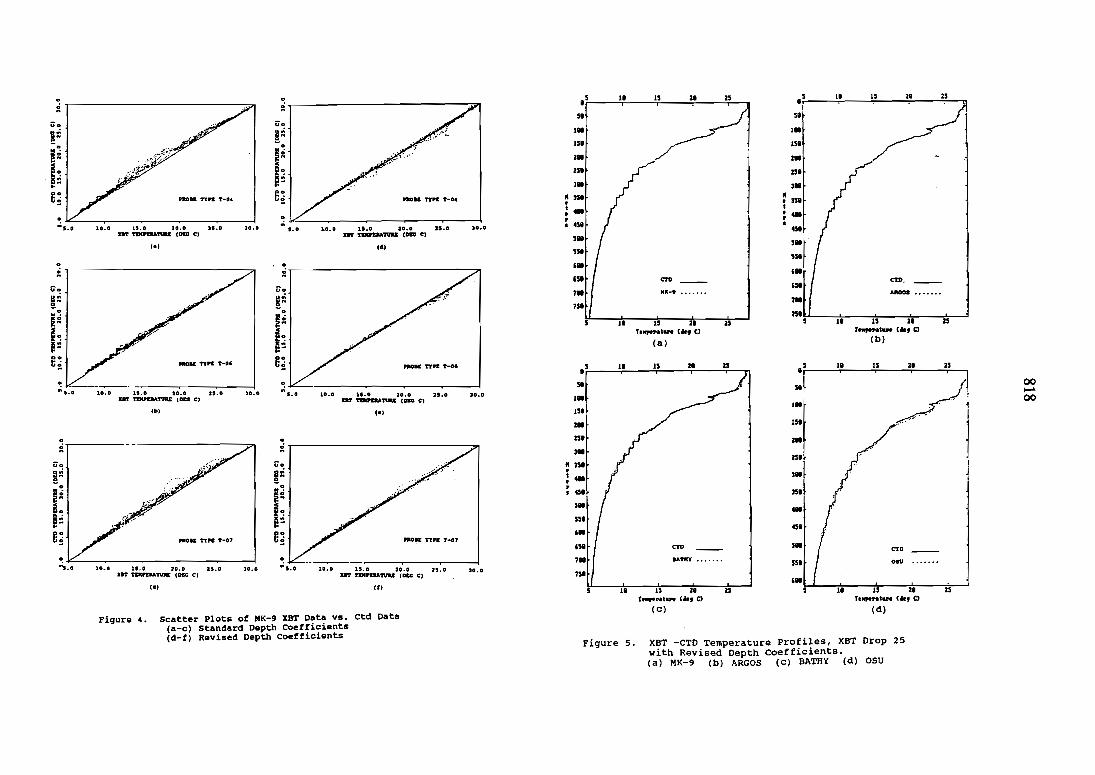
Figure 2. XBT - CTD Temperature Profiles, XBT Drop 25.(a) HK-9 (b) ARGOS (c) BATHY (d) OSU
DEPTH II'nI
816
computed from how many meters the original XBT data was moved tobest fit the CTD data. Table 5 provides a sample output from thisanalysis. As is shown in Table 5, by shifting the XBT depth thetemperature difference between the XBT and CTD can be reduced byan order of magnitude. The mean temperature difference with adepth correction agrees well with the temperature difference foundin the mixed layers and those from the calibration check.
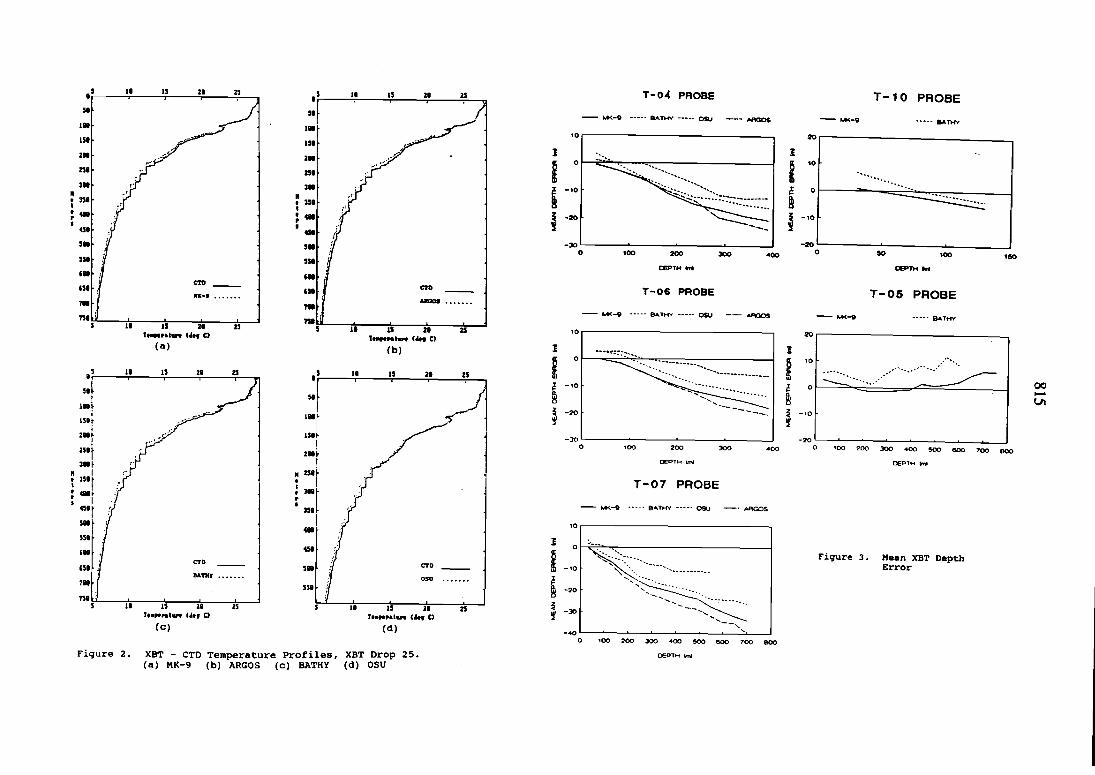
For each of the XBT systems, the mean depth error in 50 metersegments is shown in Figure 3 by probe type. While there appearsto be some bias between different XBT systems, it is important tonote that for all the XBT systems the depth error for probe typesT-4, T-6, and T-7 show a similar trend. This trend indicates thatthese XBT probe types are falling at a faster rate than calculatedby the XBT depth equation, using the standard coefficients. Thestandard depth equation and coefficients are provided in Table 6(Sippican, 1973). Similarly, the T-10 probes are falling at afaster rate, while the T-5 probes are falling at the proper rate.The OSU system depth error, as shown in Figure 3, was less than theother systems. This resulted in a smaller temperature differencefrom the CTD data as was indicated in Table 3.
Table 5. BEST-FIT ANALYSIS
System type: MK-9 Drop Number 27 Probe Type T-07
Depth Range(meters)
5.0 to 52.756.7 to 104.4
108.4 to 156.1160.0 to 207.7211.7 to 259.4263 . 4 to 311. 0315.0 to 362.7366.6 to 414.3418.2 to 465.9469.8 to 517.5521.4 to 569.0573.0 to 620.6624.6 to 672.2676.1 to 723.7
Depth Error(meters)- 0.99- 3.98- 6.96-10.93-17.88-19.86-21. 84-24.82-27.79-30.76-33.73-41. 65-48.58-49.56
Mean Temp. Error w/Depth Corrected (C)
0.05 +/- 0.030.09 +/- 0.050.11 +/- 0.070.05 +/- 0.050.04 +/- 0.040.02 +/- 0.030.03 +/- 0.020.03 +/- 0.020.04 +/- 0.020.04 +/- 0.020.04 +/- 0.020.03 +/- 0.020.01 +/- 0.020.03 +/- 0.02
Mean Temp. Error w/Depth Uncorr. (C)
0.07 +/- 0.040.45 +/- 0.100.63 +/- 0.080.62 +/- 0.100.68 +/- 0.140.49 +/- 0.100.37 +/- 0.120.48 +/- 0.070.32 +/- 0.070.32 +/- 0.030.35 +/- 0.040.35 +/- 0.020.31 +/- 0.020.22 +/- 0.02
Table 6. STANDARD FORM OF THE DROP EQUATION
Probe typeT-4T-5T-6T-7T-10
CoefficientsA B
6.472 .002166.828 .001826.472 .002166.472 .002166.301 .00216
2Depth= A*T - B*T (meters)T= sample rate * sample no.

817
To determine if the XBT depth for the T-4, T-6, and T-7 probescould be corrected by modifying the coefficient in the depthequation, a regression analysis was employed to revise thecoefficients using the MK-9 data. This was accomplished by firstcalculating what the sample interval would have to be to providethe correct depth as determined by the best fit analysis. Thissample interval was found to be 0.105 seconds. The actual MK-9sample interval is 0.1 seconds. The revised coefficients AI andBI were then determined by the following method:
AI = (6.472 * 0.105) / 0.1 = 6.7962
BI = (0.00216 * (0.105) ) / 0.01 = 0.00238
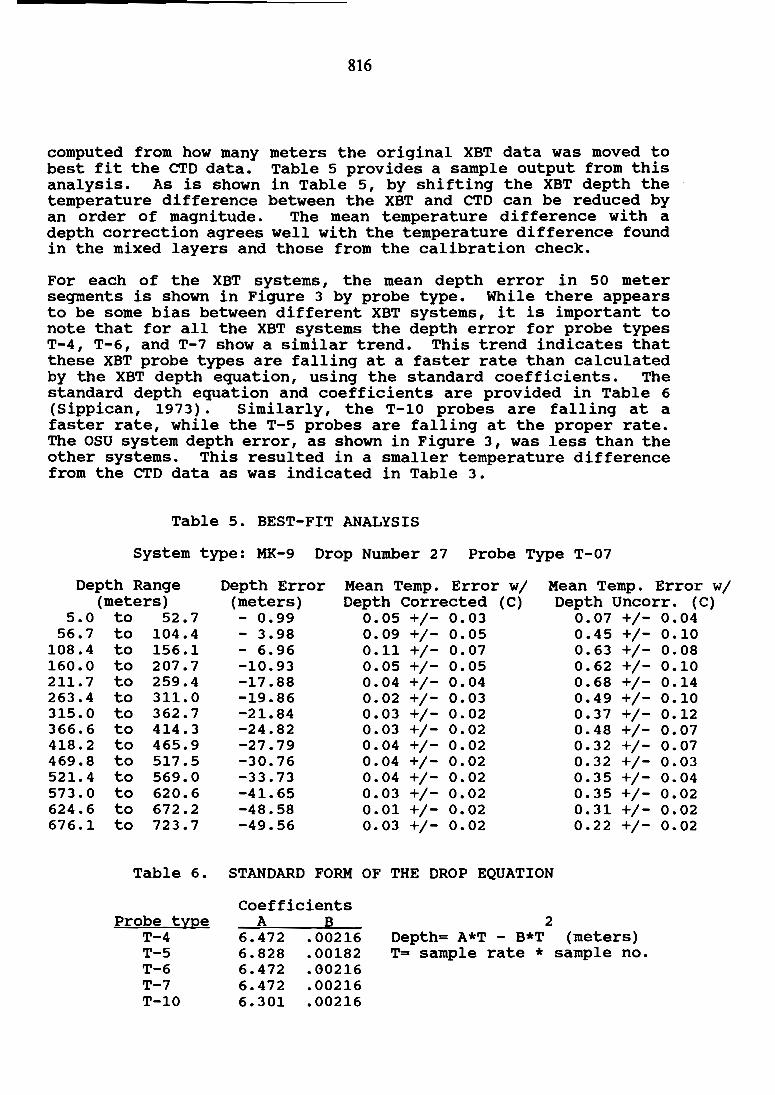
New temperature and depth pairs for the T-4, T-6, and T-7 probesusing the revised coefficients were then computed. Scatter plotscomparing the XBT and CTD using the standard and revisedcoefficients are presented in Figure 4. As shown in these plotsthe revised coefficients improve the agreement between the XBT andCTD temperature data. Using the same revised coefficients, theARGOS and BATHY data had similar results. The temperature profilesthat were shown in Figure 2 are replotted in Figure 5 using therevised coefficients. Most of the temperature errors associatedwith the depth offset (previously characterized by the temperatureprofiles in Figure 2) are now reduced or eliminated. The exceptionis the OSU XBT data which has better agreement with the CTD datausing the standard coefficients.
To determine the temporal variability of the water column duringthe XBT-CTD comparison, XBTls were launched from each system duringthe ascent of the CTD. This provided a measure of the variabilityon the scale of one hour. Any variability on this time scale islikely a result of internal waves. While a few stations exhibitedvariability in the thermocline of about 10 meters, typically thevariability was less than 2 meters. To quantitatively determinethe influence of internal waves on the CTD - XBT comparison,several more XBT drops are required during the descent of the CTD.Although variability of the water column due to internal waves caninfluence the comparison between the XBT and CTD, it should beminimal since it takes approximately 16 minutes for the CTD toreach 500 meters.
The real-time transmission of XBT data is crucial to the optimumutilization of these data sets by the oceanographic andclimatological communities. The alternative is retrospective datasubmission to national data archives which historically can takemonths, years or even worse never. During the field test the ARGOSand GOES satellite systems were evaluated for their XBT datatransmission capability using the SEAS III and ARGOS XBT systems,respectively. For both these systems, data received wasdisseminated to the community on the Global TelecommunicationSystem (GTS).
00I--'00
as
as
IS
~'j,d I~ ..
jJI
CTD
osa
CtD. _
ARG08 •••••• 0
15 21
15 alI_NI_''', Cl
(b)
11 15 alh ....NtUPI ee, C)
(d)
11
11
5 " 15 U Z5
.: 'i i i
51
ISI
451
551
351
.51
2•
151
3.
5.
2.
5:t' .1. . ~..r-" .
~ ..151
1.
..
a51
3.: 351I
~-•
25
25
Z5
al
/
C10
15
XBT -CTD Temperature Profiles, XBT Drop 25with Revised Depth coefficients.(a) MK-9 (b) ARGOS (c) BATHY (d) OSU
"11[-9 .0.•.••
1tA11I'Y •••••••
15 21h ..... "•• .,.. ,.,, C)
(c)
15 altt ....NtUft Ut, C)
(a)
11
"
11
451-
51I.151a.
51
1.
15'
2.251
3.
Figure 5.
7.751
,5
"·I•••
" ISI·I•••JO.O
30.0
30.0
10.0 11.0 3:0.0 n.DDI' ftDDA'I'UU (DIl; Cl
'4'
10.0 15.0 n.D 25.0D'I' ftIIJ'DA1'VU (OEG C)
'0'
10.0 15.0 20.0 n.DUT TDlnu:rvu (DIG CJ
~~ IL.
:.v '...
.o T,-----------------...,""""',
~T,------------------:;........,I
~TI------------------7:71,
VD
~:~~aDe=e~
VD
~:~~aDe=Do
t~
VDI:::;~aoi=e~
30.0
'0.0
PIlOK nn T-O'
PIlOII '"PE 1'-07
noBI TTn 1''''04
Scatter Plots of MK-9 XBT Data vs. Ctd Data(a-c) Standard Depth Coefficients(d-f) Revised Depth Coefficients
(et Ut
Fiqure 4.
'0'
10.0 lS.0 20.0 n.D n ••D'I' TDlftM1'VU I DIG Cl
10.0 15.0 20.0 U.OlIT TDtPD.A1'VRE (DIG CJ
~ ...,::------. -. t'.0 10.0 11.0 10.0 25.0
UT TDl..PEaA1'VR£ tDEG CJ
'0'
~TI-----
DO
t~
o.;.--- A
o.;'1-------.•JI
VD
11=;~~~5::~
e~
VD
~:~~aDe=
VD
",;e. N
=~il"~~e=t~
819
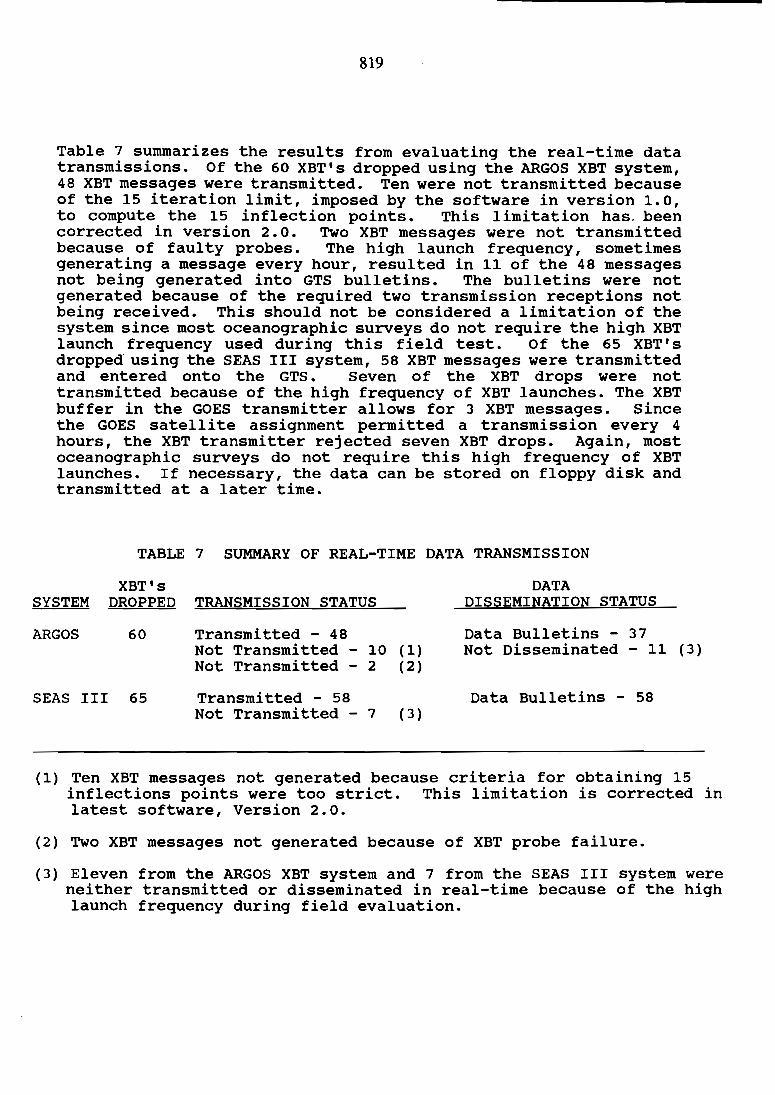
Table 7 summarizes the results from evaluating the real-time datatransmissions. Of the 60 XBT's dropped using the ARGOS XBT system,48 XBT messages were transmitted. Ten were not transmitted becauseof the 15 iteration limit, imposed by the software in version 1.0,to compute the 15 inflection points. This 1imitation has.. beencorrected in version 2.0. Two XBT messages were not transmittedbecause of faulty probes. The high launch frequency, sometimesgenerating a message every hour, resulted in 11 of the 48 messagesnot being generated into GTS bulletins. The bulletins were notgenerated because of the required two transmission receptions notbeing received. This should not be considered a limitation of thesystem since most oceanographic surveys do not require the high XBTlaunch frequency used during this field test. Of the 65 XBT'sdropped using the SEAS III system, 58 XBT messages were transmittedand entered onto the GTS. Seven of the XBT drops were nottransmitted because of the high frequency of XBT launches. The XBTbuffer in the GOES transmitter allows for 3 XBT messages. Sincethe GOES satellite assignment permitted a transmission every 4hours, the XBT transmitter rejected seven XBT drops. Again, mostoceanographic surveys do not require this high frequency of XBTlaunches. If necessary, the data can be stored on floppy disk andtransmitted at a later time.
TABLE 7 SUMMARY OF REAL-TIME DATA TRANSMISSION
XBT's DATASYSTEM DROPPED TRANSMISSION STATUS DISSEMINATION STATUS
ARGOS 60 Transmitted - 48 Data Bulletins - 37Not Transmitted - 10 (1) Not Disseminated - 11 (3)Not Transmitted - 2 (2)
SEAS III 65 Transmitted - 58 Data Bulletins - 58Not Transmitted - 7 (3)
(1) Ten XBT messages not generated because criteria for obtaining 15inflections points were too strict. This limitation is corrected inlatest software, Version 2.0.
(2) Two XBT messages not generated because of XBT probe failure.
(3) Eleven from the ARGOS XBT system and 7 from the SEAS III system wereneither transmitted or disseminated in real-time because of the highlaunch frequency during field evaluation.

820
SUMMARY
This field test evaluated both the performance of XBT systems underfield conditions and the capability of the ARGOS and GOES satellitesystems to transmit XBT data in the JJXX format. Results show:. thatthe mean temperature differences between the CTD and each XBTsystem over the total XBT profile were greater than the +/- 0.15degrees Celsius specification for XBT probes. In the isothermalportion of the mixed layer where the temperature differencesbetween the XBT and CTD are minimized due to depth, instrumentresponse, and internal waves, the temperature differences betweenthe XBT' sand CTD were reduced by an order of magnitude. Fromthese results, it was determined that temperature error due to theXBT's thermistor is small. The major contributing factor for thedifferences in temperature is an error in the computation of theXBT probe depth. The error in depth for the T-4, T-6, and T-7probe types was found to be greater than allowable by themanufacturer's specifications (+/- 5 meters or +/- 2% of depth,whichever is greater). It was determined that these probes arefalling at a faster rate than calculated by the standardcoefficient of the drop equation. This depth error has beenpreviously identified by Heinmiller et al.(1983) and Seaver andKuleshov (1982). The depth errors can be reduced by revising thecoefficients in the depth equation. While all XBT systemsindicated a depth error, there was a system bias among the systems,some showing a greater error than others. This bias among systemrequires further analysis. Transmission results demonstrated thatboth ARGOS and GOES satellite based XBT systems provided adequatecapability to transmit data in real-time. Together, ARGOS and GOESprovide the necessary data communications for a global oceanobservation program.
ACKNOWLEDGEMENTS
We would like to express our sincere thanks to SonnyRichardson for help making this evaluation possible and for allhis helpful suggestions. We'd like to thank Yvonne Newmen forhelping with the data processing and preparation of this report.Also we appreciate the help, suggestions, and support of thefollowing people, Archie Shaw and Mitch Tiger of Argos, Rod Mesecarand Jim Wagner of Oregon State University, Jim Hannon of Sippican,Don Dorson of Bathy Systems, Mike Miyake of the Institute of OceanSciences and Bob Molinari of NOAA/AOML.

821
REFERENCES
Seaver, G.A., KUleshov, S., "Experimental and Analytical Error ofthe Expendable Bathythermograph. " Journal of Physics andOceanography, 12, 592-600, 1982.
Heinmiller, R.H., Ebbesmeyer, C.C., Taft, B.A., Olson, D.B. andNikitin, o.P., "systematic Errors in Expendable Bathythermograph(XBT) Profiles." Deep Sea Research, 30, 1185-1197, 1983.
Kroner, S.M., Blumenthal, B.P., "Guide to Common ShipboardExpendable Bathythermograph (SXBT) Recording Malfunctions." NavalOceanographic Office, August 1978.
Sippican Ocean Systems, "operation/Maintenance Manual MK-9 DigitalXBT/XSV System." September 1983.
WESTERN PACIFIC INTERNATIONAL MEETING
AND WORKSHOP ON TOGA COARE
Noumea, New Caledonia
May 24-30, 1989
edited by
Joel Picaut *Roger Lukas **
Thierry Delcroix *
* ORSTOM, Noumea, New Caledonia** JIMAR, University of Hawaii, U.S.A.
INSTITUT FRANCAIS DE RECHERCHE SCIENTIFIQUEPOUR LE DtVELOPPEMENT EN COOPtRATlON
Centre de Noumea

vii
TABLE OF CONTENTS
ABSTRACT i
RESUME iii
ACKNOWLEDGMENTS vi
INTRODUCTION
1. Motivation 12. Structure ..... .......................... ... ... .......... ............. ......... .... ...... .. ...... . .. 2
LIST OF PARTICIPANTS 5
AGENDA 7
WORKSHOP REPORT
1. Introduction ............................... ............. .. .......... .. ....... ...... .... ... ...... .. 192. Working group discussions, recommendations, and plans 20
a. Air-Sea Fluxes and Boundary Layer Processes 20b. Regional Scale Atmospheric Circulation and Waves 24c. Regional Scale Oceanic Circulation and Waves 30
3. Related prograDlS ................. ......... ......... ............ .......... ...... .... . ........ . . 35a. NASA Ocean Processes and Satellite Missions .. . .. .. . 35b. Tropical Rainfall Measuring Mission .. . .. . . 37c. Typhoon Motion Program 39d. World Ocean Circulation Experiment .. . .. .. . 39
4. Presentations on related technology ....... ............ .. .. ..... ... ..... ... .. ...... .. . 405. National reports 406. Meeting of the International Ad Hoc Committee on TOGA COARE 40
APPENDIX: WORKSHOP RELATED PAPERS
Robert A. WeUer and David S. Hosom: Improved MeteorologicalMeasurements from Buoys and Ships for the World OceanCirculation Experiment ............. .. .... ............. .......... .. ........ ....... .... . ....... .... 45Peter H. Hildebrand: Flux Measurement using Aircraftand Radars 57-Waiter F. Dabberdt, Hale Cole, K. Gage, W. Ecklund and W.L. Smith:Determination of Boundary-Layer Fluxes with an IntegratedSounding System 81·
viii
MEETING COLLECTED PAPERS
WATER MASSES. SEA SURFACE TOPOGRAPHY. AND CIRCULATION
KJaus Wyrtki: Some Thoughts about the West Pacific Warm Pool.................. 99Jean Rene Donguy, Gary Meyers, and Eric Lindstrom: Comparison ofthe Results of two West Pacific Oceanographic Expeditions FOC (l971)and WEPOCS (1985-86) 111Dunxin Hu, and Maochang Cui: The Western Boundary Current in theFar Western Pacific Ocean 123Peter Hacker, Eric Firing, Roger Lukas, Philipp L. Richardson. andCurtis A. Collins: Observations of the Low-latitude Western BoundaryCirculation in the Pacific during WEPOCS ill ................ .. . . .. .. .. 135Stephen P. Murray, John Kindle, Dharma Arief, and Harley Hurlburt:Comparison of Observations and Numerical Model Results in the IndonesianThroughflow Region 145Christian Henin: Thermohaline Structure Variability along 165eEin the Western Tropical Pacific Ocean (January 1984 - January 1989) 155David J. Webb. and Brian A. King: Preliminary Results fromCharles Darwin Cruise 34A in the Western Equatorial Pacific 165Warren B. White, Nicholas Graham. and Chang-Kou Tai: Reflection ofAnnual Rossby Waves at The Maritime Western Boundary of the TropicalPacific ..... .......... ... .. .. .... .... ... .............................. ............ ........ ... .... .... .... 173William S. Kessler: Observations ofLong Rossby Waves in the NorthernTropical Pacific .......................... ..... .. .. ... . .. ... . ........... .. .. ......... .... . .. .. ... ... .. 185Eric Firing, and Jiang Songnian: Variable Currents in the WesternPacific Measured During the US/PRC Bilateral Air-Sea Interaction Programand WEPOCS 205John S. Godfrey, and A. Weaver: Why are there Such StrongSteric Height Gradients off Western Australia? 215John M. Toole, R.C. Millard, Z. Wang, and S. Po: Observationsof the Pacific North Equatorial Current Bifurcation at the Philippine Coast 223
EL NINO/SOUTHERN OSCILLATION 1986-87
Gary Meyers, Rick Bailey, Eric Lindstrom, and Helen PhiUips:Air/Sea Interaction in the Western Tropical Pacific Ocean during1982/83 and 1986/87 229Laury Miller, and Robert Cheney: GEOSAT Observations of SeaLevel in the Tropical Pacific and Indian Oceans during the 1986-87El Nino Event 247Thierry Delcroix, Gerard Elmn, and Joel Picaut: GEOSAT SeaLevel Anomalies in the Western Equatorial Pacific duringthe 1986-87 El Nino. Elucidated as Equatorial Kelvinand Rossby Waves 259Gerard Eldin. and Thierry Delcroix: Vertical Thermal StructureVariability along 165eE during the 1986-87 ENSO Event 269Michael J. McPhaden: On the Relationship between Winds andUpper Ocean Temperature Variability in the Western EquatorialPacific ..... ..... ...... ... .. .... ... ........................................... ..... .. .. .... .. .... ........ 283

i"'{
John S. Godfrey, K. Ridgway, Gary Meyers, and Rick Bailey:Sea Level and Thennal Response to the 1986-87 ENSO Event in theFar Western Pacific 291Joel Picaut, Bruno Camusat, Thierry Delcroix, MichaelJ. McPhaden, and Antonio J. Busalacchi: Surface Equatorial FlowAnomalies in the Pacific Ocean during the 1986-87 ENSO using GEOSATAltimeter Data 301
TIlEORETICAL AND MODELING STUDIES OF ENSOAND RELATED PROCESSES
Julian P. McCreary, Jr.: An Overview of Coupled Ocean-AtmosphereModels of El Nino and the Southern Oscillation 313Kensuke Takeuchi: On Wann RossbyWaves and their Relationsto ENSO Events 329Yves du Penhoat, and Mark A. Cane: Effect of Low Latitude WesternBoundary Gaps on the Reflection of Equatorial Motions 335Harley Hurlburt, John Kindle, E. Joseph Metzger, and Alan Wallcraft:Results from a Global Ocean Model in the Western Tropical Pacific 343John C. Kindle, Harley E. Hurlburt, and E. Joseph Metzger: On theSeasonal and Interannual Variability of the Pacific to Indian OceanThroughflow 355Antonio J. Busalacchi, Michael J. McPhaden, Joel Picaut, and ScottSpringer: Uncertainties in Tropical Pacific Ocean Simulations: TheSeasonal and Interannual Sea Level Response to Three Analyses of theSurface Wind Field 367Stephen E. Zebiak: Intraseasonal Variability - A Critical Componentof ENSO? 379Akimasa Sumi: Behavior of Convective Activity over the "Jovian-type"Aqua-Planet Experiments 389Ka-Ming Lau: Dynamics of Multi-Scale Interactions Relevant to ENSO 397Pecheng C. Chu and Roland W. Garwood, Jr.: Hydrological Effectson the Air-Ocean Coupled System 407Sam F. Iacobellis, and Richard CJ. Somerville: A one DimensionalCoupled Air-Sea Model for Diagnostic Studies during TOGA-COARE 419AlIan J. Clarke: On the Reflection and Transmission of Low FrequencyEnergy at the Irregular Western Pacific Ocean Boundary - a PreliminaryReport 423Roland W. Garwood, Jr., Pecheng C. Chu, Peter Muller, and NiklasSchneider: Equatorial Entrainment Zone: the Diurnal Cycle 435Peter R. Gent: A New Ocean GCM for Tropical Ocean and ENSO Studies 445Wasito Hadi, and Nuraini: The Steady State Response of IndonesianSea to a Steady Wind Field .......................................................... ............ 451Pedro Ripa: Instability Conditions and Energetics in the Equatorial Pacific 457Lewis M. Rothstein: Mixed Layer Modelling in the Western EquatorialPacific Ocean 465Neville R. Smith: An Oceanic Subsurface Thermal Analysis Scheme withObjective Quality Control 475Duane E. Stevens, Qi Hu, Graeme Stephens, and David Randall: Thehydrological Cycle of the Intraseasonal Oscillation , 485Peter J. Webster, Hai-Ru Chang, and Chidong Zhang: TransmissionCharacteristics of the Dynamic Response to Episodic Forcing in the WannPool Regions of the Tropical Oceans .. _ 493
x
MOMENWM, REAT, AND MOISlURE FLUXES BETWEENATMOSPHERE AND OCEAN
W. Timothy Liu: An Overview of Bulk Parametrization and RemoteSensing of Latent Heat Flux in the Tropical Ocean ...................................... 513E. Frank Bradley, Peter A. Coppin, and John S. Godfrey: Measurementsof Heat and Moisture Fluxes from the Western Tropical Pacific Ocean 523Richard W. Reynolds, and Ants Leetmaa: Evaluation of NMC'sOperational Surface Fluxes in the Tropical Pacific 535Stanley P. Hayes, Michael J. McPhaden, John M. Wallace, and JailPicaut: The Influence of Sea-Surface Temperature on Surface Wind in theEquatorial Pacific Ocean 543T.D. Keenan, and Richard E. Carbone: A Preliminary Morphology ofPrecipitation Systems In Tropical Northern Australia 549Phillip A. Arkin: Estimation of Large-Scale Oceanic Rainfall for TOOA 561Catherine Gautier, and Robert Frouin: Surface Radiation Processes inthe Tropical Pacific 571Thierry Delcroix, and Christian Henin: Mechanisms of SubsurfaceThermal Structure and Sea Surface Thermo-Haline Variabilities in the SouthWestern Tropical Pacific during 1979-85 - A Preliminary Report 581Greg. J. Holland, T.D. Keenan, and MJ. Manton: Observations from theMaritime Continent: Darwin, Australia 591Roger Lukas: Observations of Air-Sea Interactions in the Western PacificWarm Pool during WEPOCS 599M. Nunez, and K. Michael: Satellite Derivation of Ocean-Atmosphere HeatFluxes in a Tropical Environment ............................................................. 611
EMPIRICAL SlUDIES OF ENSO AND SHORT-TERM CLIMATE VARIABILITY
Klaus M. Weickmann: Convection and Circulation Anomalies over theOceanic Warm Pool during 1981-1982 623Claire Perigaud: Instability Waves in the Tropical Pacific Observed withGEOSAT 637Ryuichi Kawamura: Intraseasonal and Interannual Modes of Atmosphere;.Ocean System Over the Tropical Western Pacific 649David Gutzler, and Tamara M. Wood: Observed Structure of ConvectiveAnomalies 659Siri Jodha Khalsa: Remote Sensing of Atmospheric Thermodynamics inthe Tropics 665Bingrong Xu: Some Features of the Western Tropical Pacific: Surface WindField and its Influence on the Upper Ocean Thermal Structure 677,Bret A. Mullan: Influence of Southern Oscillation on New ZealandWeather 687Kenneth S. Gage, Ben Basley, Warner Ecklund, D.A. Carter, andJohn R.McAfee: Wind Profiler Related Research in the Tropical Pacific 699John Joseph Bates: Signature of a West Wind Convective Event inSSM/I Data 711David S. Gutzler: Seasonal and Interannual Variability of the Madden-Iulian Oscillation 723Marie-H~lene Radenac: Fine Structure Variability in the Equatorial WesternPacific Ocean 735George C. Reid, Kenneth S. Gage, and John R. McAfee: The Oimatologyof the Western Tropical Pacific: Analysis of the Radiosonde Data Base 741

xi
Chung-Hsiung Sui, and Ka-Ming Lau: Multi-Scale Processes in theEquatorial Western Pacific , 747Stephen E. Zebiak: Diagnostic Studies of Pacific Surface Winds 757
MISCELLANEOUS
Rick J. Bailey, Helene E. Phillips, and Gary Meyers: Relevance to TOGAof Systematic XBT Errors 775Jean Blanchot, Robert Le Borgne, Aubert Le Bouteiller, and MartineRodier: ENSO Events and Consequences on Nutrient, Planktonic Biomass,and Production in the Western Tropical Pacific Ocean 785Yves Dandonneau: Abnonnal Bloom of Phytoplankton around weN in theWestern Pacific during the 1982-83 ENSO 791Ceclle Dupouy: Sea Surface Chlorophyll Concentration in the South WesternTropical Pacific, as seen from NIMBUS Coastal Zone Color Scanner from1979 to 1984 (New Caledonia and Vanuatu) 803Michael Szabados, and Darren Wright: Field Evaluationof Real-Time XBT Systems 811Pierre Rual: For a Better XBT Bathy-Message: Onboard Quality Control,plus a New Data Reduction Method 823