field investigation and estimates of hydraulic ...tupa.gtk.fi/raportti/arkisto/13_2011.pdf · south...
TRANSCRIPT

South Finland Office Land Use and Environment 31.03.2011 13/2011 Espoo
Field Investigation and Estimates of Hydraulic Conductivity from Slug Tests in the First Salpausselkä formation in the
Santala area, Hanko, south Finland
Samrit Luoma and Arto Pullinen

GEOLOGICAL SURVEY OF FINLAND DOCUMENTATION PAGE Date / Rec. no.
Authors
Samrit Luoma and Arto Pullinen Type of report
Archived report
Commissioned by
BaltCICA Project - Geological Survey of Finland
Title of report
Field Investigation and Estimates of Hydraulic Conductivity from Slug Tests in the First Salpausselkä formation in the Santala area, Hanko, south Finland
Abstract
This report describes the field collection, analyses, and distribution of hydraulic conductivity data obtained from slug tests completed in the First Salpausselkä end moraine deposit in the Santala area in west Hanko during 8-9 April 2010. This estimate of horizontal hydraulic conductivity will be used as data input in groundwater flow modeling in the area. Slug tests were done using the rising head method by quickly removed a solid cylindrical PVC slug of known volume from the static water column in the wells, and measured pressure differences as results of water levels recovery over time using Schlumberger Mini-DiverTM data logger and pressure transducer. The recorded data from Mini-Diver was extracted by the Diver-Office 2009 software. The estimated hydraulic conduc-tivity was calculated an analytical relation between the instantaneous displacement of water in a well and the re-covery time that water return to the original static condition using the Bouwer & Rice method provided by the Aq-uifer TestTM 4.0 software program. The estimates of hydraulic conductivity (K) values from slug tests are overall smaller than the K values from the laboratory as shown in well MV904. The K values of the First Salpausselkä formation in the Santala area are summarized from the slug test data and the previous study. The estimates of K values correspond with the lithol-ogy and theirs settlements during the depositions, e.g. gravel, sand, and sand & gravel contain high K values of 7.6 – 12.48 m/d. Also fine sand with well sorted, the average K value is 6.12 m/d. In the high variations of sediments such as interbedded of sand & stone, and silt-fine sand-stone, the average K values are 4.79 and 2.79 m/d, respec-tively. Low estimated K values are found in silty sand, and silty & clay with the K values of 1.3 and 0.4 m/d re-spectively. These data will be used as initial values for a ground-water-flow model and thus likely will be revised during model calibration. Slug test provides a quick and inexpensive estimate of K value, however some unknown uncertainties can still arise during the operation such as in well MV104. Precaution and strictly follow the field operation is recommended. Keywords
Hydraulic conductivity, slug test, soil, sediments
Geographical area
Hanko, Santala
Map sheet
2011
Other information
Report serial
Groundwater study Archive code
13/2011
Total pages
Language
English Price
Confidentiality
Public
Unit and section
Project code
3242003
Signature/name
Samrit Luoma Signature/name
Arto Pullinen

Contents
Documentation page
1 INTRODUCTION 1 1.1 Study area 1 1.2 Geological background 1 1.3 Previous studies 2
2 MATERIAL AND METHOD 4 2.1 Slug Tests - Theory 4 2.2 Field operation 5 2.3 Analyses and Estimates of Hydraulic Conductivity 7
3 RESULTS AND DISCUSSION 8
4 CONCLUSIONS 10
5 REFERENCE 11
6 APPENDICES 11
1
1 INTRODUCTION
GTK was carried out slug tests in five observation wells in the Santala area in west Hanko during 8-9 April 2010, in order to obtain the estimates of horizontal hydraulic conductivity (Kh) to use as parameter input for the groundwater flow model in this area. The objective of this report is to describe the collection, analyses, and distribution of hydraulic conductivity data obtained from slug tests. Slug test was selected for the estimate of hydraulic conductivity because it provides a quick, inexpensive and has fewer disturbances to the aquifer compare to the other well tests in-volve with pumping activity. This report also integrates information of K values from previous studies and from slug test during the BaltCICA Project field investigation. This study was part of the field investigation for the groundwater flow model study in the Hanko aquifer in the BaltCICA Project (Climate Change: Impacts, Costs and Adaptation in the Baltic Sea Region), which is part-financed by the European Union in the Baltic Sea Region Programme 2007-2013.
1.1 Study area
Santala study area is located in west of Hanko City, about 120 km southwest of Helsinki. It lies entirely on the First Salpausselkä end moraine deposit which is the main shallow groundwater resource of the Hanko City (Fig.1). This area is also the location of the Santalanranta water work, which provides the main contribution of the daily water supply to the city with the average pump-ing rate of 1300 m3/d. The study area contains groundwater’s risk areas including the State Highway 25 and the railway that run through the middle of the main aquifer area and a number of factories of small and medium sizes in many parts of the area.
1.2 Geological background
The shallow groundwater aquifer of Hanko belongs entirely to the First Salpausselkä end moraine formation deposited (Fig.1) in the front of the ice sheet into deep water in the end of the Weich-selian glaciation about 11 250 – 9 900 years ago (Fyfe 1991, Saarnisto & Saarinen 2001). When the ice sheet withdrew from the area, this in deep water sitting formation was covered by fine sediments of fine sand, silt, and clay layers of Ancylus Lake and Littorina Sea. Later on the sea level has been regressive due to the isostatic land uplift, the Salpausselkä formation was exposed to sea waves and also for wind. Littoral sand and gravel, and aeolian fine sand deposits covered the clay and fine sand sediments in places. The bedrock in the Hanko area consists mainly of Pre-cambrian crystalline igneous and metamorphic rock strongly fractured along preferential direc-tions. The bedrock is covered by Quaternary deposits, with only few outcrops in the area. The complicated geological structure of the First Salpausselkä formation due to the changes in the grain sizes, thicknesses and distributions of the different layers such as the interbedded of sand, gravel, silt and clay, causes the heterogeneities and complicated groundwater conditions and hy-draulic properties in the Hanko aquifer. Groundwater level in this area varies from place to place correspond to the topography. In the low surface elevation area in the west coast along the Baltic Sea, groundwater level is generally below 2 m amsl, while in the high topography in the middle of the area groundwater level is generally 10-12 m amsl. Groundwater flow direction is from east to west of the study area. Seepage of groundwater flow into the Baltic Sea can be seen in many places at depth around sea level (0.0 - 0.5 m amsl.).

2
Fig 1. The study area presents with wells that were performed slug tests and wells that have the hydraulic conductivity (Kh) analysis from the previous study in Santala area, Hanko, with the background of Qua-ternary deposits in the study area. Geological mapping data © Geological Survey of Finland, Basemap © National Land Survey of Finland, licence no. 13MML/11 and Logica Suomi Oy. Groundwater area © SYKE 2011
1.3 Previous studies
In the previous study (Maa ja vesi 2005), analysis of the horizontal hydraulic conductivity (Kh) was carried out from the soils laboratory analysis of three observation wells: MV904, MV804 and MV704 (Fig.1). These three wells drilled into the main First Salpausselkä end moraine de-posits. The Kh values were analysed based on lithology which sampled from the main production zone of the wells. The summary of the average Kh values from the previous study are presented in table 1.

3
Fig. 2 Cross-section through out the wells in the study area.
Table 1. Average horizontal hydraulic conductivity (Kh) from soils analysis of wells MV904, MV804 and MV704.
Well Depth Lithology Minimum Median Average Maximum (m amsl) (m/d) (m/d) (m/d) (m/d)
MV704 9.74 sand 1.3 10.8 10.9 27.7
MV704 -4.26 silt&clay 0.4 0.4 0.4 0.4
MV804 8.66 sand 6.8 10.8 10.8 14.7
MV804 6.66 sand&stone 1.2 7.7 6.9 10.4
MV804 1.66 sand 3.3 5.3 5.5 8.6
MV804 -4.34 silty sand 0.3 1.1 1.1 1.7
MV904 8.56 fine sand 5.4 5.4 5.4 5.4
MV904 7.56 sand&gravel 5.1 12.5 12.5 19.9
MV904 5.56 gravel 6.7 7.6 7.6 8.5
MV904 3.56 silty sand 0.3 1.6 1.7 3.3
4
2 MATERIAL AND METHOD
Slug test was carried out in five observation wells in the Santala area in west Hanko during 8.-9.4.2010, to estimate the horizontal hydraulic conductivity of the aquifer to use as an input data for the groundwater flow model of the Hanko aquifer. The tested wells were selected from obser-vation wells that located in the main groundwater flow area including wells MV904, HP179, HP183, MV104 and Balt1. Besides, well MV904 was done before the soils analysis to evaluate the Kh values in the previous study. These Kh values will be used to compare with the results from slug test.
2.1 Slug Tests - Theory
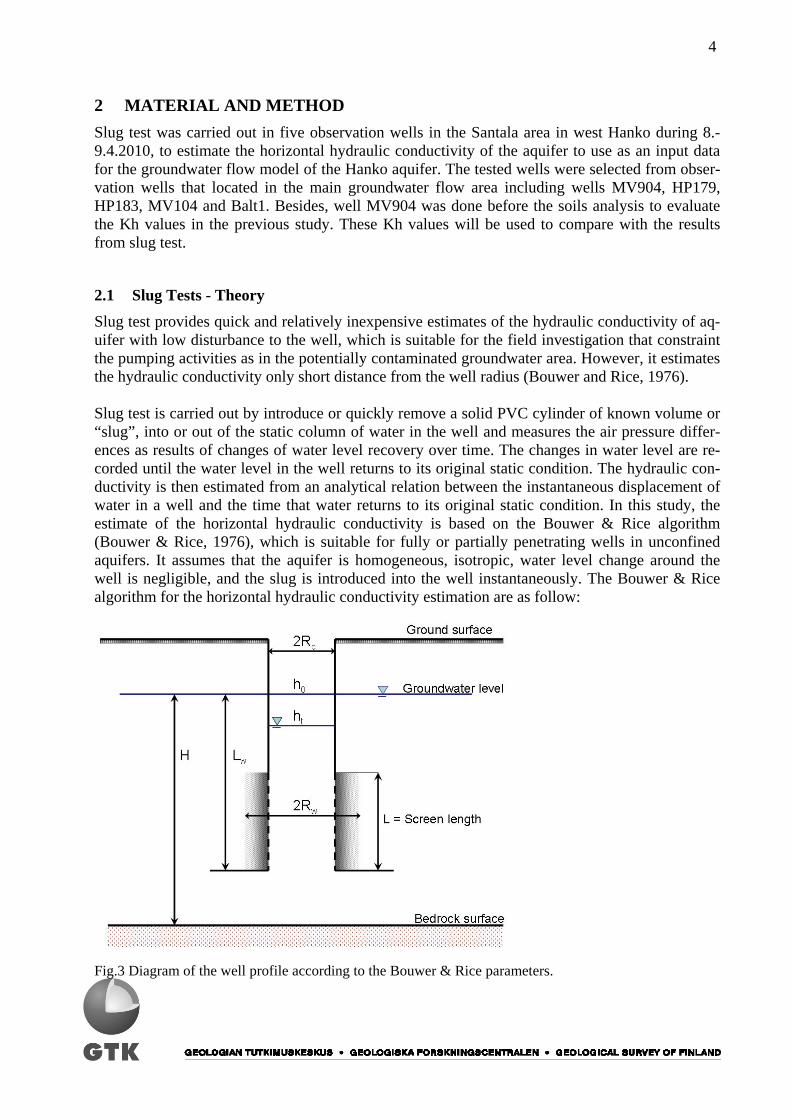
Slug test provides quick and relatively inexpensive estimates of the hydraulic conductivity of aq-uifer with low disturbance to the well, which is suitable for the field investigation that constraint the pumping activities as in the potentially contaminated groundwater area. However, it estimates the hydraulic conductivity only short distance from the well radius (Bouwer and Rice, 1976). Slug test is carried out by introduce or quickly remove a solid PVC cylinder of known volume or “slug”, into or out of the static column of water in the well and measures the air pressure differ-ences as results of changes of water level recovery over time. The changes in water level are re-corded until the water level in the well returns to its original static condition. The hydraulic con-ductivity is then estimated from an analytical relation between the instantaneous displacement of water in a well and the time that water returns to its original static condition. In this study, the estimate of the horizontal hydraulic conductivity is based on the Bouwer & Rice algorithm (Bouwer & Rice, 1976), which is suitable for fully or partially penetrating wells in unconfined aquifers. It assumes that the aquifer is homogeneous, isotropic, water level change around the well is negligible, and the slug is introduced into the well instantaneously. The Bouwer & Rice algorithm for the horizontal hydraulic conductivity estimation are as follow:
Fig.3 Diagram of the well profile according to the Bouwer & Rice parameters.

5
K = Rc
2 ln (Re/Rw) x 1 x ln (h0/ht) (1) 2L t
Where K = hydraulic conductivity [L/T] Rc = radius of well casing [L] Rw = effective radial distance between well centre and undisturbed aquifer [L] Re = effective radial distance over which the head difference is dissipated [L] L = screened interval [L] t = time [T] h0 = static (undisturbed pre-test) water level at time 0 [L] ht = slug-displaced water levels at time t [L] Lw = length from screen bottom to water level [L] H = saturated thickness, length from top bedrock to water table [L] A dimensionless ratio of ln (Re/Rw) is evaluated from analogue curves and it depends on the well geometry (Bouwer & Rice, 1976): If the well is partially penetrated (Lw < H):
ln (Re/Rw) = [ 1.1 + A+B ln (H-Lw) / Rw] -1 (2) ln(Lw/Rw) L/Rw If the well is fully penetrated (Lw = H):
ln (Re/Rw) = [ 1.1 + C ] -1 (3) ln(Lw/Rw) L/Rw Parameters A, B, and C are dimensionless number plotted as a function of L/Rw.
2.2 Field operation
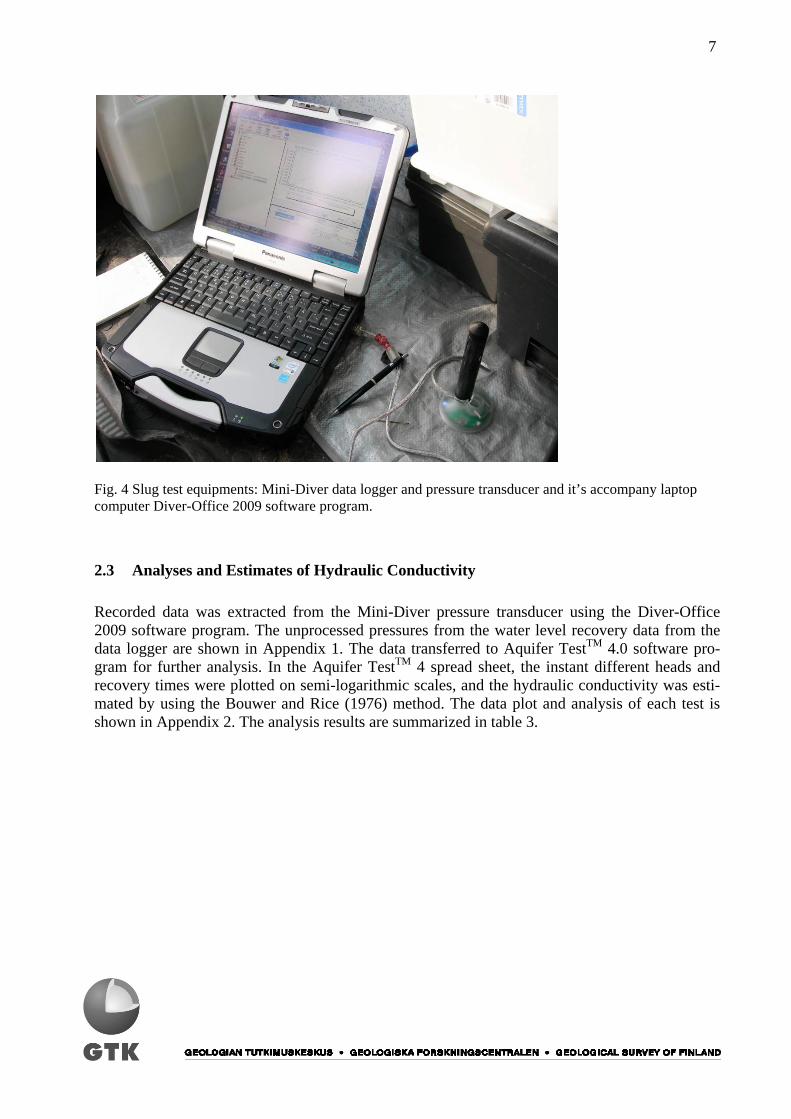
The slug test field procedure was performed following the ASTM-D4044 standard. Equipments needed are the slug, a pressure transducer, and groundwater level logger. In this study the Schlumberger Mini-Diver DI241 (10m)TM data logger and pressure transducer was used to meas-ure the pressures due to the changes of water levels over times and it was read by the Diver-Office 2009, a Mini-Diver’s accompany computer program from Schlumberger. A Heron groundwater level logger was used to measure the groundwater water level during the test. Slug tests were performed followed the steps below:
1. Pre-test: collected all well information including depths of well, screens (top & bottom), top bedrock, groundwater level, casing size, lithology at screen interval. The measurement of groundwater level can be done several times before the test to ensure the static condi-tion of groundwater level. These data provides the saturated thickness information of the well.

6
2. designed slug, which is depends on the casing size and the saturated thickness. The slug used for this study was a solid cylindrical PVC diameter size 40 mm, 4 m long provides the volume of 5 dm3. This slug size is fit well with the normal observation well size 50 mm diameter. This slug is tied to the cable or rope and is ready to introduce into the well.
3. started slug test by placed the Mini-Diver pressure transducer into the water column to the level about 30 cm or more above the bottoms of well.
4. then placed the slug into the well until its bottom is around 30 cm or more above the top of transducer and its top around 30 cm or more below the static groundwater level.
5. Slug test was done using the rising-head test by removed slug quickly from the well. The rising-head test is reduced the interference from the unsaturated zone above the water ta-ble and it is also recommended for the well that water levels are below the top of the screen. The Mini-Diver pressure transducer recorded the hydrostatic pressure, which comes directly from the change of water pressure from the recovery of groundwater level to the static level above the diver. The recovery time depends on the lithology and its hy-draulic properties. Sand with well sorted will provide a shorter recover time compare to finer grain or clay.
6. Multi tests (repeat of steps 4 & 5) should be conducted at each well to ensure the reliabil-ity of the measurements and errors that might occurs. The Mini-Diver pressure transducer was then removed from the well and uploaded data by the Diver-Office 2009 software.
Screen depths data of the observation wells HP179 and HP183 are not available from the data-base and both wells drilled did not reach bedrock surface. Top bedrock from both well locations were extracted from the predicted bedrock surface map in that area and screen tops of both wells were assumed below the groundwater level, the screen length was assumed at 2 m. Well MV904, the bottom screen depth was also missing, the screen length was assumed at 10 m. Static groundwater levels and wells information are presented in table 2. Table 2 Static groundwater levels and wells information of slug test wells. Sieve size is 0.3 mm for all wells.
Casing Well Well Top Bottom Surface GW Top Lithology Well Ø top bottom screen screen level level bedrock at screen
mm m amsl m amsl m amsl m amsl m amsl m amsl m amsl interval HP183 50 1.48 n/a n/a n/a 0.51 0.26 -6.7 Fine sand HP179 50 3.13 n/a n/a n/a 2.42 0.28 -3.7 Sand MV904 50 15.56 -1.44 9.56 n/a 14.96 11.4 -6.0 Sand MV104 50 16.03 -15.87 9.13 -15.87 14.93 7.5 -19.1 Sand&stone Balt1 52 15.08 -2.72 9.28 -2.72 14.08 11.9 -13.6 Silty sand
7
Fig. 4 Slug test equipments: Mini-Diver data logger and pressure transducer and it’s accompany laptop computer Diver-Office 2009 software program.
2.3 Analyses and Estimates of Hydraulic Conductivity
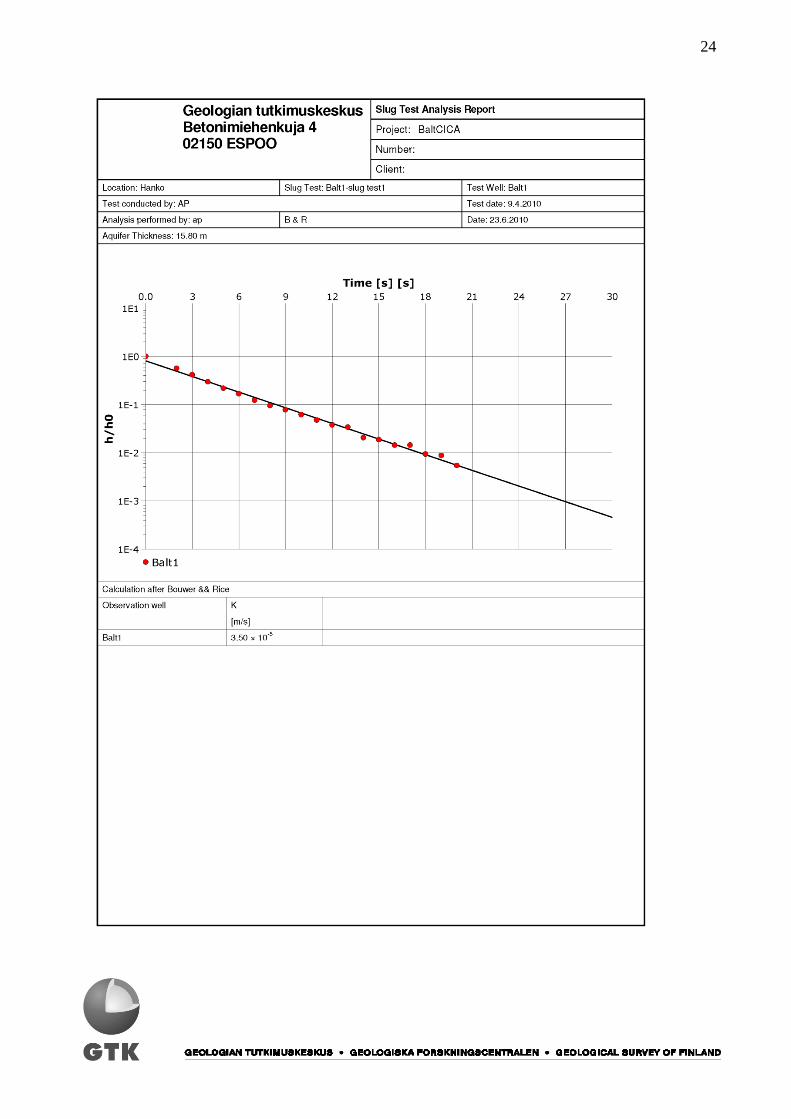
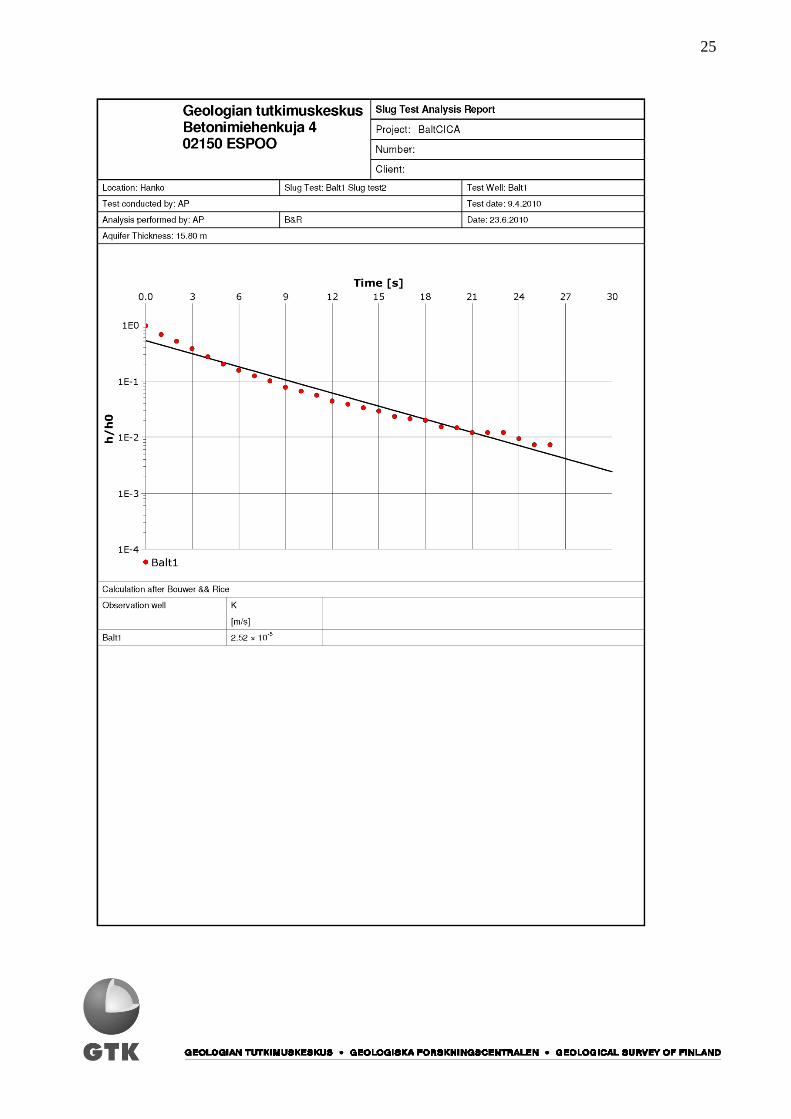
Recorded data was extracted from the Mini-Diver pressure transducer using the Diver-Office 2009 software program. The unprocessed pressures from the water level recovery data from the data logger are shown in Appendix 1. The data transferred to Aquifer TestTM 4.0 software pro-gram for further analysis. In the Aquifer TestTM 4 spread sheet, the instant different heads and recovery times were plotted on semi-logarithmic scales, and the hydraulic conductivity was esti-mated by using the Bouwer and Rice (1976) method. The data plot and analysis of each test is shown in Appendix 2. The analysis results are summarized in table 3.

8
3 RESULTS AND DISCUSSION
The estimates of hydraulic conductivity (K) from slug tests using the Bouwer & Rice method are summarized in table 3. Table 3 Estimates of hydraulic conductivity from slug test data on wells in the Santala area during 8 - 9 April 2010.
Well Lithology Test Aquifer Method Average K Previous
number thickness Bouwer & Rice (m/d) Study*
(m) K (m/d) K (m/d)
HP183 Fine sand 1 7 6.9 6.9 n/a
HP179 Sand 1 3.9 13.8 13.8 n/a
MV904 Sand, 1 10.7 4.3
Stone 2 10.7 3.5 4.1 5.4
3 10.7 4.8
4 10.7 3.8
Balt1 Fine sand, 2 15.8 2.2
Silty sand, 1 15.8 3.0 2.7 n/a
Sand, stone 3 15.8 2.9 * Previous study from Maa ja vesi (2005). Base on the lithology description, in well MV904 lithology at the slug test interval are sand and stone. The estimates of K values of well MV904 range from 3.46 to 4.78 m/d, with the average of 4.07 m/d. Average laboratory’s K values of well MV904 ranges from 1.67 m/d in silty sand to 12.48 m/d in sand&gravel, and in sand 5.36 m/d. The slug test K value of this well was about 1.29 m/d (24%) smaller than the K value of sand evaluated from the laboratory (5.36 m/d). The differences may come from different measurements, in the field measurements the flow is multi-dimensional directions, and heterogeneities around the well, while in the laboratory measure-ments the flow is constraint in one directional and lithology is more specific for each test sample. Apart from well MV104, the estimated K values from slug test correspond well with lithology and its settlement (e.g. sorting). The highest K value of 13.82 m/d derived from sand in HP179, which is interpreted as the littoral sand and rework sediments deposit from waves activities dur-ing the isostatic uplift in this area. In the nearby well, HP183, which located about 60 m west of HP179, the lithology of this well contains higher fine grains (fine sand and silt) contents and the estimated K value is 6.87 m/d, around 50% smaller than HP179. In wells MV904 and Balt1, the lithology consists of interbedded of sand, stone, fine sand and silt. These indicate the heterogenei-ties and probably poor sorted and they probably cause the lower K values in these well. Well MV104 drilled into the gravel and sand interval in the main Salpausselkä formation. During the test, after instantly removed slug out of the well, the water returned to the original static con-dition very quickly, although the 4 m slug created almost one meter thick of water. The data log-ger was consequently unable to read properly and contains high uncertainty. The interpretation of slug test was excluded the data from this well. The rapid return of water, however, indicates very high hydraulic conductivity in gravel and sand sediments in this well. The slug test in the very high hydraulic conductivity in the future may be done by increase the number of slugs in order to increase the thickness of water column. Then the suitable of slug test for an estimate of K value

9
in the very high hydraulic conductivity sediment may also be interested to evaluate in the future studies. Based on data from slug tests and laboratory in previous study, the hydraulic conductivity of each lithology type in the Santala area can be summarized in the table 4. These data will be used as initial values for a ground-water-flow model and they likely will be revised during model calibra-tion. Table 4 Summary of hydraulic conductivity (K) based on lithology in Santala area.
Well Lithology K (m/d) Average K (m/d) Method
MV904 gravel 7.6 7.6 Laboratory
HP179 sand 13.8 Slug test
MV704 sand 10.8 10.2 Laboratory
MV804 sand 10.8 Laboratory
MV804 sand 5.3 Laboratory
MV904 sand & gravel 12.5 12.5 Laboratory
MV804 sand, stone 7.7 Laboratory
MV904 sand, stone 4.3 Slug test
MV904 sand, stone 3.5 4.8 Slug test
MV904 sand, stone 4.8 Slug test
MV904 sand, stone 3.8 Slug test
HP183 fine sand 6.9 6.1 Slug test
MV904 fine sand 5.4 Laboratory
Balt1 fine sand, silty, stone 2.2 Slug test
Balt1 fine sand, silty, stone 3.0 2.7 Slug test
Balt1 fine sand, silty, stone 2.9 Slug test
MV804 silty sand 1.0 1.3 Laboratory
MV904 silty sand 1.6 Laboratory
MV704 silt & clay 0.4 0.4 Laboratory

10
4 CONCLUSIONS
Slug tests were performed in the five observation wells (HP179, HP183, MV104, MV904 and Balt1) in the Santala area, Hanko during 8-9 April 2010 during the BaltCICA Project, to obtain estimates of horizontal hydraulic conductivity to use as initial values in the groundwater flow model of the Hanko aquifer. Slug test was done using the rising-head test by quickly removed slug solid cylindrical PVC) of known volume from the well. The Mini-Diver pressure transducer, which was placed first below the bottom of the slug, recorded the hydrostatic pressure, which comes directly from the change of water pressure from the recovery of groundwater to the origi-nal static level above the diver. The rate of recovery depends on the hydraulic properties of the aquifer. The differences of instantaneous displacement of water in a well bore and the recovery times of each test were plotted on the semi-logarithmic scale in the spread sheet in the Aquifer Test 4 software program and the hydraulic conductivity was estimated by using the Bouwer and Rice (1976) method, which accounts for fully or partially penetrating wells in unconfined aqui-fers. The estimates of hydraulic conductivity (K) values from slug tests are overall smaller than the K values from the laboratory as shown in well MV904. The K values of the First Salpausselkä for-mation in the Santala area are summarized from the slug test data and the previous study. The es-timates of K values correspond with the lithology and theirs settlements during the depositions, e.g. gravel, sand, and sand & gravel contain high K values of 7.6 – 12.48 m/d. Also fine sand with well sorted, the average K value is 6.12 m/d. In the high variations of sediments such as in-terbedded of sand & stone, and silt-fine sand-stone, the average K values are 4.79 and 2.79 m/d, respectively. Low estimated K values are found in silty sand, and silt & clay with the K values of 1.3 and 0.4 m/d respectively. The K values from well MV104 are probably very high hydraulic conductivity, however the data received was insufficient and contain high uncertainties. The re-sults of MV104 may imply an unsuitable of slug test in the very high hydraulic property media. Although the test was carried out with precaution, unknown uncertainties in the well during the operation still arose. The field test with precaution and strictly follow the field procedure is rec-ommended.

11
5 REFERENCE
Bouwer, H., and Rice, R.C., 1976. A slug test method for determining hydraulic conductivity of unconfined aquifers with completely or partially penetrating wells: Water Resources Research, v. 12, no. 3, p. 423–428. Fyfe, G. J., 1991. The morphology and sedimentology of the Salpausselkä I Moraine in southwest Finland. Fitzwilliam College, Cambridge University. Maa ja vesi, 2005. Hangon kaupunki - Hangon pohjavesialueiden suojelusuunnitelman päivitys. 39 s. + 12 liitteet. Kielosto, S., Kukkonen, M., Stén, C.-G. & Backman, B., 1996. Hangon ja Perniön karttaalueiden maaperä. Suomen geologinen kartta 1:100 000, maaperäkarttojen selitykset, lehdet 2011 ja 2012. Geologian tutkimuskeskus, Espoo, 1996. Saarnisto, M., & Saarinen, T., 2001. Deglaciation chronology of the Scandinavian Ice Sheet from the Lake Onega basin to the Salpausselkä end moraines. In: Thiede, J. [et al.] (eds.) The Late Quaternary stratigraphy and environments of northern Eurasia and the adjacent Arctic seas - new contributions from QUEEN: selected papers from the annual QUEEN workshops held in Øystese, Norway, April 1999, and in Lund, Sweden, April 2000. Global and Planetary Change 31 (1 - 4), 387 - 405.
6 APPENDICES
Appendix 1 Plots of unprocessed pressure data of slug test wells HP179, HP183, MV104, MV904 and Balt1. Appendix 2 Slug test data plots and analysis of wells HP179, HP183, MV904 and Balt1.

12
Appendix 1 Plots of unprocessed pressure data versus time of slug test wells HP179, HP183, MV104, MV904 and Balt1.

13

14

15
Appendix 2 Slug test data plots and analysis of wells HP179, HP183, MV904 and Balt1.

16

17

18

19

20

21

22

23
24
25

26