field observations during wind turbine foundation ... reports/boem_2018-029.pdfwind farm, rhode...
TRANSCRIPT

OCS Study
BOEM 2018-029
Field Observations During Wind Turbine Foundation Installation at the Block Island Wind Farm, Rhode Island
US Department of the Interior Bureau of Ocean Energy Management Office of Renewable Energy Programs

OCS Study BOEM 2018-029
Field Observations During Wind Turbine Foundation Installation at the Block Island Wind Farm, Rhode Island
May 2018
Authors (in alphabetical order):
Jennifer L. Amaral, Robin Beard, R.J. Barham, A.G. Collett, James Elliot, Adam S. Frankel,
Dennis Gallien, Carl Hager, Anwar A. Khan, Ying-Tsong Lin, Timothy Mason, James H. Miller,
Arthur E. Newhall, Gopu R. Potty, Kevin Smith, and Kathleen J. Vigness-Raposa
Prepared under BOEM Award
Contract No. M15PC00002,
Task Order No. M16PD00031 By HDR 9781 S Meridian Boulevard, Suite 400 Englewood, CO 80112
U.S. Department of the Interior Bureau of Ocean Energy Management Office of Renewable Energy Programs

DISCLAIMER
Study concept, oversight, and funding were provided by the US Department of the Interior, Bureau of
Ocean Energy Management (BOEM), Environmental Studies Program, Washington, DC, under
Contract Number M15PC00002, Task Order No. M16PD00031. This report has been technically
reviewed by BOEM, and it has been approved for publication. The views and conclusions contained
in this document are those of the authors and should not be interpreted as representing the opinions or
policies of the US Government, nor does mention of trade names or commercial products constitute
endorsement or recommendation for use.
REPORT AVAILABILITY
To download a PDF file of this report, go to the U.S. Department of the Interior, Bureau of Ocean
Energy Management Data and Information Systems webpage (http://www.boem.gov/Environmental-
Studies-EnvData/), click on the link for the Environmental Studies Program Information System
(ESPIS), and search on 2018-029. The report is also available at the National Technical Reports
Library at https://ntrl.ntis.gov/NTRL/.
CITATION
HDR. 2018. Field Observations during Wind Turbine Foundation Installation at the Block Island
Wind Farm, Rhode Island. Final Report to the U.S. Department of the Interior, Bureau of Ocean
Energy Management, Office of Renewable Energy Programs. OCS Study BOEM 2018-029. 175
pp.
ABOUT THE COVER
Cover photo: Block Island Wind Farm Facility Wind Turbine 3 Foundation Construction. Courtesy of
HDR RODEO Team. Used with permission. All rights reserved.

ACKNOWLEDGMENT
The HDR RODEO Team includes the following subcontractors (in alphabetical order):
Arthur Popper, Ph.D.
Clark Group, LLC
EA Engineering Science & Technology, Inc.
Fugro Marine GeoServices, Inc.
Fugro GB Marine Ltd.
H.T. Harvey & Associates
Loughine Limited
Subacoustech Environmental.
Significant additional technical support for the monitoring effort was provided by the following
institutions:
Marine Acoustics, Inc.
University of Rhode Island
Woods Hole Oceanographic Institution
Blue Land Media.
Vessel services for visual monitoring were provided by Hula Charters.
Assistance and support from all team members is greatly appreciated.

i
Contents
List of Figures ............................................................................................................................................ iv
List of Tables .............................................................................................................................................. ix
List of Abbreviations and Acronyms ....................................................................................................... xi
Editorial Notes ............................................................................................................................................ xi
Executive Summary .................................................................................................................................... 1
1 Introduction ......................................................................................................................................... 5
1.1 The RODEO Program ................................................................................................................... 5
1.2 The BIWF ...................................................................................................................................... 5
1.3 Phase 1 Construction Activity Characterization ............................................................................ 9
1.4 Report Organization .................................................................................................................... 13
2 Visual Monitoring .............................................................................................................................. 15
2.1 Survey Approach and Methods .................................................................................................. 15
2.1.1 Onshore Monitoring .............................................................................................................. 15
2.1.2 Significant Events Affecting Documentation of Visual Observations ................................... 17
2.1.3 Offshore Monitoring .............................................................................................................. 19
2.2 Visual Monitoring Observations Summary ................................................................................. 21
2.3 Visual Observations: Highlights and Lessons Learned .............................................................. 27
3 Airborne Noise Monitoring ............................................................................................................... 29
3.1 Monitoring Approach and Methods ............................................................................................. 29
3.1.1 Onshore Monitoring .............................................................................................................. 29
3.1.2 Offshore Monitoring .............................................................................................................. 29
3.2 Airborne Noise Equation Terms .................................................................................................. 30
3.2.1 Introduction ........................................................................................................................... 30
3.2.2 Source Level (SL) ................................................................................................................. 30
3.2.3 N Coefficient ......................................................................................................................... 30
3.2.4 Absorption Coefficient, α ...................................................................................................... 31
3.2.5 Sound Metrics ...................................................................................................................... 31
3.2.6 Spherical and Cylindrical Spreading .................................................................................... 31
3.3 Background Noise Measurements .............................................................................................. 32
3.3.1 Onshore ................................................................................................................................ 32
3.3.2 Offshore ................................................................................................................................ 33
3.4 Monitoring Results ...................................................................................................................... 33
3.5 Data Analyses ............................................................................................................................. 36
3.5.1 Wind Direction ...................................................................................................................... 36
3.5.2 Receiver Downwind of the Piling .......................................................................................... 37
3.5.3 Receiver Crosswind of the Piling ......................................................................................... 37

ii
3.5.4 Receiver Upwind of the Piling .............................................................................................. 38
3.5.5 Calm wind and Seas ............................................................................................................ 39
3.6 Frequency Spectra...................................................................................................................... 40
3.6.1 Frequency Spectra Downwind ............................................................................................. 41
3.6.2 Frequency Spectra Upwind .................................................................................................. 41
3.7 Piling Blow Energy and Noise Source Levels ............................................................................. 41
3.7.1 Frequency Spectra Calm Winds .......................................................................................... 42
3.8 Discussion ................................................................................................................................... 44
3.9 Conclusions ................................................................................................................................ 45
3.10 Summary ..................................................................................................................................... 46
4 Underwater Sound Monitoring ........................................................................................................ 48
4.1 Stationary and Towed Array Monitoring ..................................................................................... 48
4.1.1 Approach .............................................................................................................................. 48
4.1.2 Monitoring Methods and Results .......................................................................................... 52
4.1.3 Acoustic 3D Modeling ........................................................................................................... 64
4.1.4 Stationary and Towed Array Monitoring Summary .............................................................. 67
4.1.5 Fish Hearing and Effect of Sound and Particle Motion ........................................................ 67
4.2 Variable Depth Single Sensor and Seabed Vibration Monitoring ............................................... 70
4.2.1 Monitoring Approach ............................................................................................................ 70
4.2.2 Source Level Estimations and Model Results ...................................................................... 73
4.2.3 Background Sound Measurement Results........................................................................... 74
4.2.4 SL Estimation Summary Results and Comparisons ............................................................ 75
4.2.5 Piling Seabed Vibration Measurements ............................................................................... 83
4.2.6 Single Hydrophone and Seabed Vibration Monitoring Conclusions .................................... 86
5 Seafloor Disturbance and Recovery Monitoring ........................................................................... 88
5.1 Methods ...................................................................................................................................... 90
5.1.1 Bathymetry Surveys and Data Processing ........................................................................... 90
5.1.2 Data Interpretation ................................................................................................................ 92
5.1.3 Data Variability and Repeatability ........................................................................................ 93
5.1.4 Data Quality .......................................................................................................................... 93
5.2 Results and Findings .................................................................................................................. 93
5.2.1 Survey 1 ............................................................................................................................... 93
5.2.2 Survey 2 ............................................................................................................................... 93
5.2.3 Survey 3 ............................................................................................................................... 93
5.2.4 Wind Turbine Generator 1 .................................................................................................... 98
5.2.5 Wind Turbine Generator 2 .................................................................................................... 98
5.2.6 Wind Turbine Generator 3 .................................................................................................... 98
5.2.7 Wind Turbine Generator 4 .................................................................................................. 100

iii
5.2.8 Wind Turbine Generator 5 .................................................................................................. 100
5.2.9 Seafloor Disturbances Elsewhere in the Work Area .......................................................... 100
5.2.10 Surficial Sediment Mobility ................................................................................................. 100
5.2.11 Overview of Spatial Extent of Disturbance at Wind Turbines ............................................ 102
5.3 Wind Turbine Scour Assessment ............................................................................................. 105
5.3.1 Monitoring Approach and Methods .................................................................................... 105
5.3.2 Monitoring Results .............................................................................................................. 108
5.3.3 Discussion and Conclusions .............................................................................................. 123
6 References ....................................................................................................................................... 125
Appendix A: Field Plan ........................................................................................................................... 127
Appendix B: Visual Monitoring Data ..................................................................................................... 128
Appendix C: Airborne Noise Monitoring Data...................................................................................... 172
Appendix D: Underwater Sound Monitoring Data (Near and Far-Field) ............................................ 173
Appendix E: Seafloor Disturbance and Recovery Monitoring Data .................................................. 174
Appendix F: Scour Monitoring Data ...................................................................................................... 175
iv
List of Figures
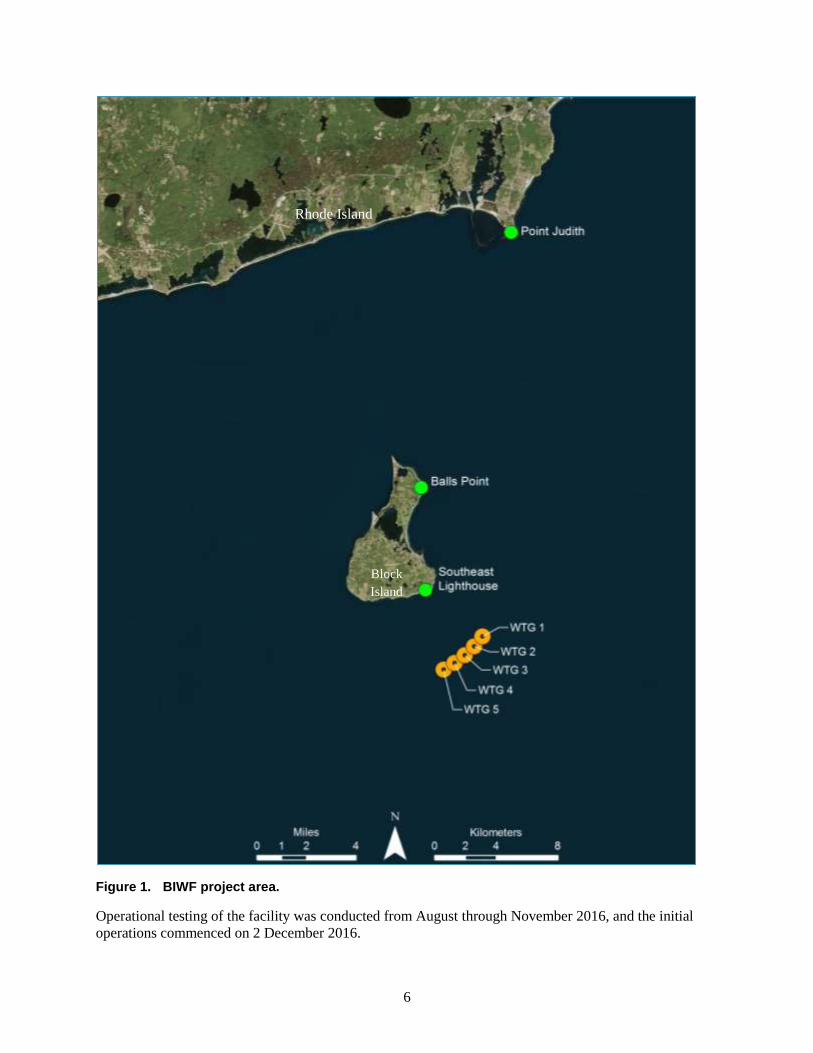
Figure 1. BIWF project area. ................................................................................................................. 6
Figure 2. WTG foundations en route to Block Island Work Area. ......................................................... 9
Figure 3. Schematic showing a fully assembled turbine foundation (courtesy Deepwater
Wind). ................................................................................................................................... 10
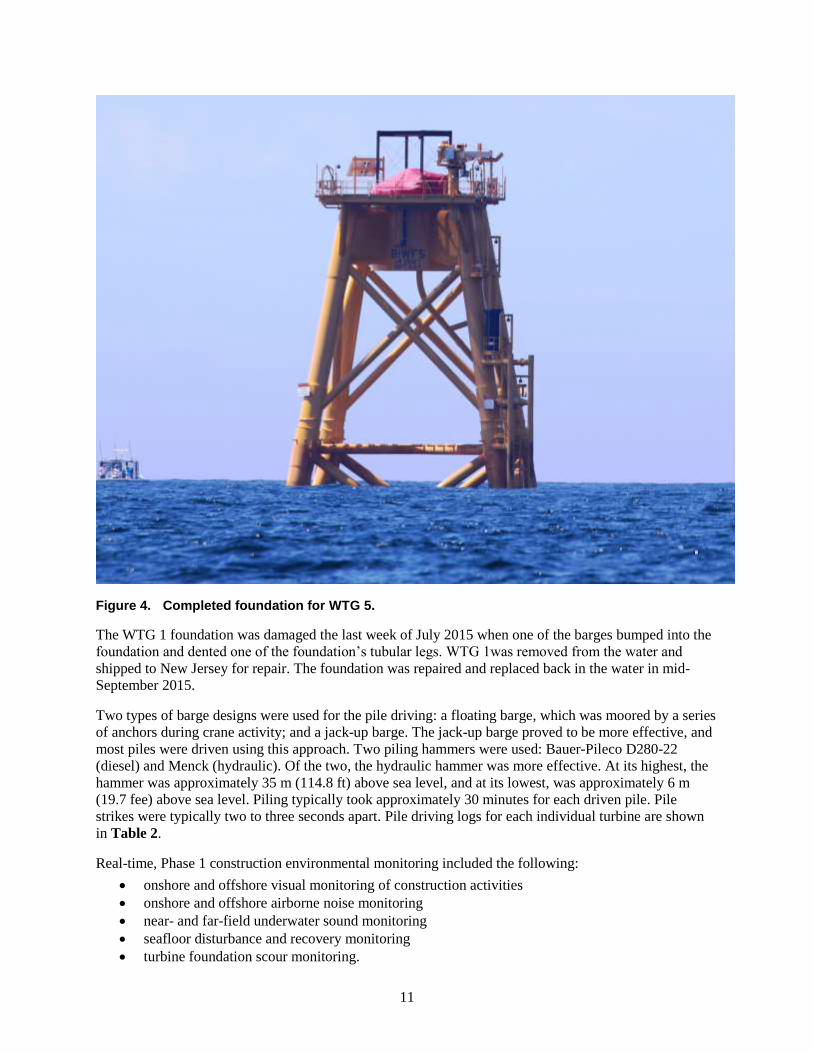
Figure 4. Completed foundation for WTG 5. ....................................................................................... 11
Figure 5. Location of visual monitoring station on the Southeast Lighthouse grounds. ...................... 16
Figure 6. Fixed monitoring location on Southeast Lighthouse. ........................................................... 17
Figure 7. Sample data log screen........................................................................................................ 18
Figure 8. View from the Southeast Lighthouse monitoring station foggy and clear conditions. .......... 18
Figure 9. Comparison of offshore areas under foggy versus clear conditions (approximately
457.2 m [500 yards, 1,500 ft]). ............................................................................................. 19
Figure 10. The R/V Whale Researcher. ................................................................................................ 20
Figure 11. Charter Vessel F/V Hula Dog. .............................................................................................. 20
Figure 12. Lowering of the WTG 1 steel jacket into the sea. ................................................................ 22
Figure 13. Placing of piles into the WTG 3 steel jacket guide holes. .................................................... 22
Figure 14. Piles inserted into jacket prior to pile driving. ....................................................................... 23
Figure 15. Pileco diesel hammer attempting to drive piles at WTG 2. .................................................. 23
Figure 16. Menck hydraulic hammer. .................................................................................................... 24
Figure 17. L/B Roberts hammering piles at WTG 1. ............................................................................. 24
Figure 18. Transition deck installation. .................................................................................................. 25
Figure 19. Support vessels at WTG 2 to WTG 5. .................................................................................. 25
Figure 20. Offshore Southeast Lighthouse and Point Judith LAeq,1s noise levels versus time
recorded during pile driving of WTG 2 on 18 August 2015. ................................................. 35
Figure 21. Offshore noise levels versus time (1-second increments) recorded during pile
driving of WTG 2 on 3 September 2015. .............................................................................. 36
Figure 22. Level vs range plot for winds at 180° (downwind) to the direction of travel. Far-field
[R>800m] coefficients: N = 6, α = 0.0021. ............................................................................ 37
Figure 23. Level vs range plot for winds at 90° to the direction of travel. Far-field coefficients
[R>800 m (2,624.7 ft)]: N = 6, α = 0.0021. ........................................................................... 38
Figure 24. Level vs range plot for winds at 45° to the direction of travel. Far-field coefficients
[R>800m]: N = 12, α = 0.0021. ............................................................................................. 39
Figure 25. Level vs range plot for winds at 67.5° to the direction of travel. Far-field coefficients
[R>800 m (2,624.7 ft)]: N = 12, α = 0.0021. ......................................................................... 39
Figure 26. Level vs. range plot for calm winds and seas. Far-field coefficients [R>800m]: N =
19, α = 0.00063. ................................................................................................................... 40
Figure 27. One-third octave band Lmax spectra taken under downwind conditions on 18
September 2015. .................................................................................................................. 41

v
Figure 28. One-third octave band Lmax spectra taken under upwind conditions on 17
September 2015. .................................................................................................................. 42
Figure 29. One-third octave band Lmax spectra taken under upwind conditions on 19
September 2015. .................................................................................................................. 42
Figure 30. Scatter chart of calculated source noise levels from the diesel and hydraulic piling
hammer. ............................................................................................................................... 43
Figure 31. Overview of the various measurements of acoustic and seismic signals from pile
driving for the Block Island Wind Farm along with nominal ranges. .................................... 49
Figure 32. Pile driving underwater sound monitoring summary. ........................................................... 50
Figure 33. Field work description (left) and summary of geophysical sled, vertical hydrophone
array and towed hydrophone array tracks (right). ................................................................ 51
Figure 34. Towed array spool configuration (left) and data collection station installed in the
vessel lab (right). .................................................................................................................. 52
Figure 35. Track lines from 2 September 2015 (left); track lines from 17 September 2015
(right). ................................................................................................................................... 53
Figure 36. Time series (left) and spectrogram (right color bars show decibel rms) taken from a
30-second file, with x-axis as local time, when the vessel was 5.25 km (3.3 mi) from
pile driving of leg A2 on WTG 3 on 2 September 2015. ....................................................... 54
Figure 37. Peak to peak received level calculated for all of the hammer strikes from the three
different pile driving recordings plotted against distance of the array from the
turbine................................................................................................................................... 55
Figure 38. Kurtosis calculated using 17 September 2015 data, presented as a function of
distance from WTG 5. .......................................................................................................... 56
Figure 39. Mooring design for the 7.5 km (4.7 mi) and 15 km (9.3 mi) vertical hydrophone
arrays.................................................................................................................................... 57
Figure 40. A recording of pile driving signals is shown from SHRU 913 deployed at 7.5 km
(4.7 mi) from WTG 3; the duration of the recording is 1 minute 45 seconds with
approximately 2 seconds between each strike. ................................................................... 58
Figure 41. Images of the geophysical sled before deployment (left and center). These two
photographs show the tetrahedral array of hydrophones with a spacing of 0.5 m
(1.6 ft). Photo of the surface floats for the sled with WTG 4 in the background
(right). ................................................................................................................................... 59
Figure 42. An underwater photo captured via a GoPro camera mounted on the bow of the sled
shows the tetrahedral array of hydrophones is maintained despite the sled landing
on its side. ............................................................................................................................ 59
Figure 43. Spectrogram of data from a single tetrahedral array hydrophone (left) and acoustic
pressure signals on the four channels of the tetrahedral array (right) collected on
25 October 2015. .................................................................................................................. 61
Figure 44. Particle velocity calculated from the sound pressure gradients for one hammer
strike. Left panel shows the values in mm/s and the right panel shows the
magnitude of the total velocity (vector sum) in dB re nm/s. ................................................. 62
Figure 45. An example of the particle velocity data (in mm/s in three mutually perpendicular
directions) from the 3-axis geophone deployed off the geophysical sled (left panel).
Right panel shows the acoustic pressure measured by the hydrophone co-located
with the geophone. ............................................................................................................... 62

vi
Figure 46. Particle velocity magnitude of the total velocity (vector sum) in dB re nm/s
measured by the geophone (left panel). Right panel shows the magnitude of the
total velocity (vector sum) calculated from the tetrahedral array data. Note that the
start times (x-axis) are arbitrary. .......................................................................................... 63
Figure 47. Spectra of the particle velocity (red) and acoustic pressure (blue) measured on the
seabed using the co-located geophone and hydrophone. Note that the amplitudes
are normalized using the peak values. The difference in frequency content between
the hydrophone and geophone response is apparent. ........................................................ 64
Figure 48. Measurement setup as described by Betke (2004) for monitoring underwater sound
from an offshore wind turbine in water 10 m (32.8 ft) deep (left). One-third octave
band levels measured 110 m (360.9 ft) from the turbine for different operating
conditions (right). Wind speeds are measured at the hub height. ....................................... 65
Figure 49. Reinhall and Dahl (2011) modeled the creation of an acoustic wave in the water
from a vertical pile. The speed of the wave in the pile is approximately 5,015 m/s
and much greater than the water sound speed of approximately 1,500 m/s. This
creates a Mach wave which propagates at an angle of approximately 17o from the
vertical. ................................................................................................................................. 66
Figure 50. A finite element simulation using ABAQUS of the acoustic effects of impact pile
driving into an elastic sea bottom is shown. ......................................................................... 66
Figure 51. Initial estimates of the sound pressure level peak-to-peak versus range for the
various sensors and dates. .................................................................................................. 68
Figure 52. Spectra of the particle acceleration (black) in the water column estimated using the
tetrahedral array (left panel) and measured on the seabed using the geophone
(right panel). ......................................................................................................................... 69
Figure 53. Orientation of the four transects. .......................................................................................... 72
Figure 54. Plot showing the predicted underwater sound pressure propagation along the north
transect. ................................................................................................................................ 73
Figure 55. Level vs. range plot showing the predicted transmission loss along the north
transect. ................................................................................................................................ 74
Figure 56. Power spectral density plots of background sound measurements taken near the
Block Island Wind Farm site. ................................................................................................ 76
Figure 57. Comparison between measured data and modeled thresholds for transects 2 (left)
and 3 (right) using the modeled data from the 315° transect using a 200 kJ blow
energy................................................................................................................................... 79
Figure 58. Comparison between measured data and modeled thresholds for transects 4 (left)
and 5 (right) using the modeled data from the 90° transect using a 200 kJ blow
energy................................................................................................................................... 80
Figure 59. Comparison between measured data and modeled thresholds for transect 6 using
the modeled data from the 90° transect using a 600 kJ blow energy. ................................. 81
Figure 60. Comparison between measured data and modeled thresholds for transect 7 (pile 1,
left, and piles 2-4, right) using the modeled data from the 0° transect using a 200 kJ
blow energy. ......................................................................................................................... 82
Figure 61. Comparison of peak-to-peak sound pressure levels between a Diesel Hammer and
a Hydraulic hammer. ............................................................................................................ 84
vii
Figure 62. PPV magnitudes plotted against range for a northwest transect from WTG 5 for the
installation of Pile 2. ............................................................................................................. 85
Figure 63. PPV magnitudes plotted against range for a northwest transect from WTG 5 for the
installation of Pile 3. ............................................................................................................. 86
Figure 64. BIWF seafloor monitoring study area. .................................................................................. 89
Figure 65. Bathymetric map from Survey 1. .......................................................................................... 91
Figure 66. Examples of seafloor disturbance features at WTG 4 observed in Survey 2 data. ............. 92
Figure 67. Interpreted sediment mobility zones. ................................................................................... 96
Figure 68. Side-by-side comparison of the seabed disturbance and recovery monitoring data
from the three bathymetry surveys. ...................................................................................... 97
Figure 69. Recovery of spud depressions at WTG 2. ........................................................................... 99
Figure 70. Variability in seafloor recovery at WTG 4. .......................................................................... 101
Figure 71. Installation vessel impact extent at WTG 2. ....................................................................... 103
Figure 72. Seafloor disturbance corridor resulting from construction. ................................................. 104
Figure 73. Scour monitor in bracketing (left); Seabed frame and AWAC (right). ................................ 105
Figure 74. Location of deployed equipment. ....................................................................................... 106
Figure 75. Positioning of the scour monitors on the turbine foundation. ............................................. 107
Figure 76. Winter water level data – height to lowest astronomic tide and residuals. ........................ 108
Figure 77. January 2017 current data – observed and non-tidal components. ................................... 109
Figure 78. All current data – progressive vector plot. .......................................................................... 110
Figure 79. All wave data – significant wave height versus coming direction hodogram (rose
plot). .................................................................................................................................... 111
Figure 80. March 2017 wave data. ...................................................................................................... 111
Figure 81. SE Beam 1 scour depth. .................................................................................................... 114
Figure 82. SE Beam 2 scour depth. .................................................................................................... 114
Figure 83. SE Beam 3 scour depth. .................................................................................................... 115
Figure 84. SE Beam 4 scour depth. .................................................................................................... 115
Figure 85. NE Beam 1 scour depth. .................................................................................................... 116
Figure 86. NE Beam 2 scour depth. .................................................................................................... 116
Figure 87. NE Beam 3 scour depth. .................................................................................................... 117
Figure 88. NE Beam 4 scour depth. .................................................................................................... 117
Figure 89. Mean scour depth of each beam per month. ..................................................................... 118
Figure 90. Summary mean scour profile. ............................................................................................ 119
Figure 91. Significant wave height....................................................................................................... 121
Figure 92. Depth average velocity. ...................................................................................................... 121
Figure 93. Residual water level. .......................................................................................................... 122
Figure 94. Comparative time series for August 2016. ......................................................................... 122

viii
Figure 95. Comparative time series for January 2017. ....................................................................... 123
Figure B-1. 9/07/2015 Offshore Photo 3929. Placing WTG 5 steel jacket in the water. ....................... 129
Figure B-2. 9/07/2015 Offshore Photo 3933. Placing WTG 5 steel jacket in the water. ....................... 129
Figure B-3. 9/07/2015 Offshore Photo 3943. Placing WTG 5 steel jacket in the water. ....................... 130
Figure B-4. 08/18/2015 Southeast Lighthouse, Block Island – Photo 0154: Weeks Barge 533
placing the diesel hammer on piling at WTG 2. First day of pile driving. ........................... 130
Figure B-5. 08/18/2015 Offshore Photo 0111: Weeks Barge 533 piling at WTG2 with diesel
hammer (notice smoke). ..................................................................................................... 131
Figure B-6. 08/18/2015 Offshore Photo 0118: Diesel hammer piling at WTG 2. .................................. 131
Figure B-7. 08/18/2015 Offshore Photo 0111: Weeks Barge 533 removing diesel hammer from
piling at WTG2. ................................................................................................................... 132
Figure B-8. 8/15/2015 Offshore Photo 0014: Two foundations, WTG 2 transition deck, and piles
aboard the Cashman barge with support tug Reed Danos. Anchor buoy visible. ............. 132
Figure B-9. 09/17/2015 Offshore Photo 2359: WTG 1 steel jacket arriving onsite after being
repaired from being struck by a derrick barge after initial installation. ............................... 133
Figure B-10. 8/23/2015 Offshore Photo 0186: Weeks Barge 533 just placed third pile at WTG 3. ........ 133
Figure B-11. 8/26/2015 Offshore Photo 0581: Supply vessel Josephine Miller and Weeks derrick
barge 526 at WTG 2. WTG 3 is to the far right with four piles ready to be driven. ............ 134
Figure B-12. 8/29/2015 Offshore Photo 0622: Hydraulic hammer being lifted from Weeks Derrick
Barge 533. .......................................................................................................................... 134
Figure B-13. 8/30/2015 Offshore Photo 0679: Pile driving at WTG 3 with hydraulic hammer................ 135
Figure B-14. 8/30/2015 Offshore Photo 0692: Pile driving at WTG 3 with hydraulic hammer................ 135
Figure B-15. 9/02/2015 Offshore Photo 1010: WTG 3 with first set of piles driven by Weeks
Derrick Barge 533. Block Island in the background. .......................................................... 136
Figure B-16. 9/19/2015 Offshore Photo 2542: Lift Boat Roberts driving the last pile at WTG 1. ........... 136
Figure B-17. 9/17/2017 Offshore Photo 2352: Lift Boat Roberts driving the first pile at WTG 5. ........... 137
Figure B-18. 11/09/2015 Onshore Southeast Lighthouse Photo 2591: Lift Boat Roberts placing
transition deck at WTG 4. ................................................................................................... 137
Figure B-19. 11/09/2015 Onshore Photo 2661: Lift Boat Robert at dusk next to WTG 4. ...................... 138
Figure B-20. 9/20/2015 Offshore Photo 2565: View shed to the south, WTGs 1-5. WTG 1 is in
the foreground. ................................................................................................................... 138
Figure B-21. 9/20/2015 Offshore Photo 2579: Weeks Barge 526 next to WTG 5 with second set
of piles in place. .................................................................................................................. 139
Figure B-22. 9/20/2015 Offshore Photo 2584 WTG 1 ready for transition deck. .................................... 139
Figure B-23. 8/25/2015 Offshore Photo 0483: Tug Robert. .................................................................... 140
Figure B-24. 9/01/2015 Offshore Photo 0861: University of Rhode Island’s Shanna Rose. .................. 140
Figure B-25. 8/25/2015 Offshore Photo 0508: Supply vessel Josephine Miller. .................................... 141
Figure B-26. 8/24/2015 Offshore Photo 0257: Supply Vessel Sorensen Miller. ..................................... 141
Figure B-27. 8/18/2015 Block Island Town Beach – Photo 0036: Tug IONA McAlister. ........................ 142

ix
Figure B-28. 8/23/2015 Offshore Photo 0178: Subacoustech aboard University of Rhode
Island’s R/V McMaster. ...................................................................................................... 142
List of Tables
Table 1. RODEO Program monitoring conducted at the BIWF. ........................................................... 7
Table 2. BIWF pile driving log. ........................................................................................................... 12
Table 3. WTG coordinates and distance from Block Island. .............................................................. 15
Table 4. August 2015 significant events. ........................................................................................... 26
Table 5. September 2015 significant events. ..................................................................................... 26
Table 6. Vessels supporting jacket installation. ................................................................................. 27
Table 7. Selected pile driving times.................................................................................................... 28
Table 8. Summary of background noise level sample at the Southeast Light, 9 August 2015. ......... 32
Table 9. Summary of background noise level sample at Balls Point North, 9 August 2015. ............. 32
Table 10. Summary of background noise level sample at Point Judith, 30 August 2015. ................... 33
Table 11. August 25, 2015 Summary of background noise level sample offshore (excluding
engines). ............................................................................................................................... 33
Table 12. 19 September 2015 Summary of background noise level sampled offshore
(excluding engines). ............................................................................................................. 33
Table 13. Summary of piling event airborne noise measurements. ..................................................... 34
Table 14. Summary of noise attenuation coefficients under different wind and sea conditions. ......... 44
Table 15. Underwater acoustic monitoring summary. .......................................................................... 49
Table 16. Stationary sensors locations and depth. .............................................................................. 49
Table 17. Single hydrophone transect measurements summary. ........................................................ 71
Table 18. Single hydrophone fixed measurements summary. ............................................................. 72
Table 19. Details of location and observed conditions during the background underwater
sound measurements. .......................................................................................................... 74
Table 20. Summary of SPL RMS background sound measurements taken near the Block
Island Wind Farm site. .......................................................................................................... 75
Table 21. Estimates of SL based on fits to the measurement transects from the piling
operations. ............................................................................................................................ 75
Table 22. Comparison of measured sound levels at a range of 750 m (2,460.6 ft) at the BIWF
site (with pile diameters of 1.4 m [4.6 ft) and other measurements undertaken in the
EU. Pile diameters given in (parentheses), closest measured range from the pile in
[brackets]. ............................................................................................................................. 77
Table 23. Summary of the measured transects and the modeling parameters from Deepwater
Wind that closest correspond. .............................................................................................. 78
Table 24. Summary of the difference in range, between the measured and modeled sound
levels for the three disturbance thresholds. ......................................................................... 83
x
Table 25. Measurements of the PPV magnitudes taken along a northwest transect from WTG
5 for the installation of Pile 2. ............................................................................................... 84
Table 26. Measurements of the PPV magnitudes taken along a northwest transect from WTG
5 for the installation of Pile 3. ............................................................................................... 85
Table 27. Seafloor disturbance and recovery monitoring survey summary. ........................................ 88
Table 28. Comparison of bathymetry data from Surveys 1, 2 and 3. ................................................... 94
Table 29. Equipment positions – deployment. ................................................................................... 105
Table 30. Monthly significant wave height statistics. .......................................................................... 113
Table B-1. Onshore Photo Log Key and Field Observation Summary ................................................ 143
Table B-2. Offshore Photo Log Key and Field Observations Summary .............................................. 155
Table B-3. Meteorological Data Recorded During Visual Monitoring .................................................. 166

xi
List of Abbreviations and Acronyms
3D three-dimensional AWAC acoustic wave and current profiler BIWF Block Island Wind Farm BOEM Bureau of Ocean Energy Management cm centimeter(s) dB decibel(s) DTM digital terrain model Hz Hertz km kilometer(s) kJ kilojoules m meter(s) m
2 square meter(s)
mi mile(s) mm/s millimeter(s)per second mm millimeter(s) m/s meter(s)/second PPV peak particle velocity RMS root mean square RODEO Real-Time Opportunity for Development Environmental Observations SHRU Several Hydrophone Receiving Unit SL source level SLM sound level meter SPL sound pressure level VLA vertical arrays WGS84 World Geodetic System, 1984 WTG wind turbine generator
Editorial Notes
All coordinates used in this report are referenced to WGS84 unless stated otherwise.
Current direction is the direction towards which the current is flowing.
1
Executive Summary
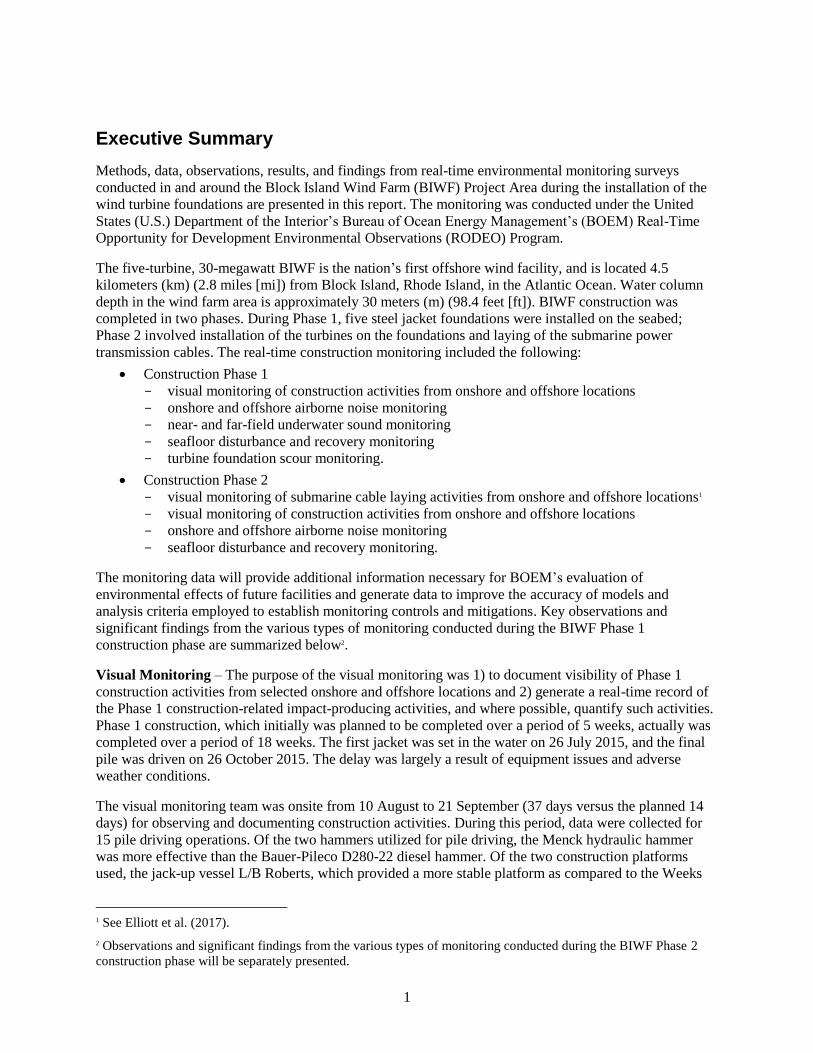
Methods, data, observations, results, and findings from real-time environmental monitoring surveys
conducted in and around the Block Island Wind Farm (BIWF) Project Area during the installation of the
wind turbine foundations are presented in this report. The monitoring was conducted under the United
States (U.S.) Department of the Interior’s Bureau of Ocean Energy Management’s (BOEM) Real-Time
Opportunity for Development Environmental Observations (RODEO) Program.
The five-turbine, 30-megawatt BIWF is the nation’s first offshore wind facility, and is located 4.5
kilometers (km) (2.8 miles [mi]) from Block Island, Rhode Island, in the Atlantic Ocean. Water column
depth in the wind farm area is approximately 30 meters (m) (98.4 feet [ft]). BIWF construction was
completed in two phases. During Phase 1, five steel jacket foundations were installed on the seabed;
Phase 2 involved installation of the turbines on the foundations and laying of the submarine power
transmission cables. The real-time construction monitoring included the following:
Construction Phase 1
- visual monitoring of construction activities from onshore and offshore locations
- onshore and offshore airborne noise monitoring
- near- and far-field underwater sound monitoring
- seafloor disturbance and recovery monitoring
- turbine foundation scour monitoring.
Construction Phase 2
- visual monitoring of submarine cable laying activities from onshore and offshore locations1
- visual monitoring of construction activities from onshore and offshore locations
- onshore and offshore airborne noise monitoring
- seafloor disturbance and recovery monitoring.
The monitoring data will provide additional information necessary for BOEM’s evaluation of
environmental effects of future facilities and generate data to improve the accuracy of models and
analysis criteria employed to establish monitoring controls and mitigations. Key observations and
significant findings from the various types of monitoring conducted during the BIWF Phase 1
construction phase are summarized below2.
Visual Monitoring – The purpose of the visual monitoring was 1) to document visibility of Phase 1
construction activities from selected onshore and offshore locations and 2) generate a real-time record of
the Phase 1 construction-related impact-producing activities, and where possible, quantify such activities.
Phase 1 construction, which initially was planned to be completed over a period of 5 weeks, actually was
completed over a period of 18 weeks. The first jacket was set in the water on 26 July 2015, and the final
pile was driven on 26 October 2015. The delay was largely a result of equipment issues and adverse
weather conditions.
The visual monitoring team was onsite from 10 August to 21 September (37 days versus the planned 14
days) for observing and documenting construction activities. During this period, data were collected for
15 pile driving operations. Of the two hammers utilized for pile driving, the Menck hydraulic hammer
was more effective than the Bauer-Pileco D280-22 diesel hammer. Of the two construction platforms
used, the jack-up vessel L/B Roberts, which provided a more stable platform as compared to the Weeks
1 See Elliott et al. (2017).
2 Observations and significant findings from the various types of monitoring conducted during the BIWF Phase 2
construction phase will be separately presented.
2
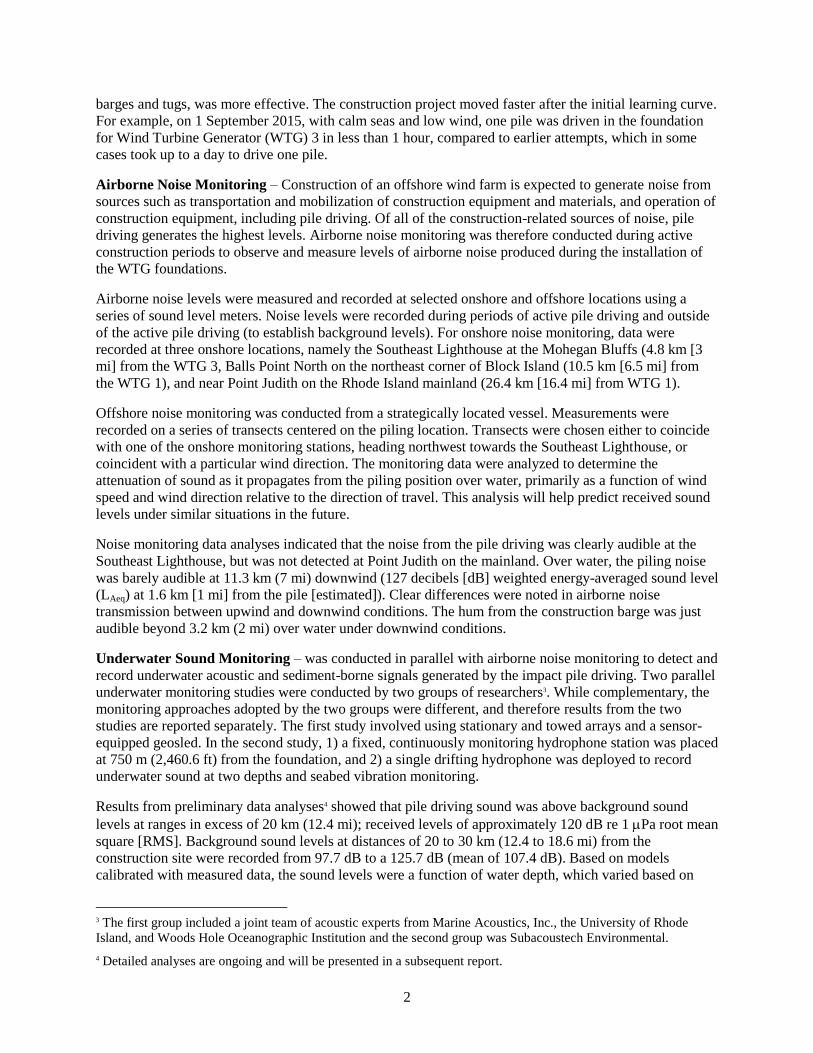
barges and tugs, was more effective. The construction project moved faster after the initial learning curve.
For example, on 1 September 2015, with calm seas and low wind, one pile was driven in the foundation
for Wind Turbine Generator (WTG) 3 in less than 1 hour, compared to earlier attempts, which in some
cases took up to a day to drive one pile.
Airborne Noise Monitoring – Construction of an offshore wind farm is expected to generate noise from
sources such as transportation and mobilization of construction equipment and materials, and operation of
construction equipment, including pile driving. Of all of the construction-related sources of noise, pile
driving generates the highest levels. Airborne noise monitoring was therefore conducted during active
construction periods to observe and measure levels of airborne noise produced during the installation of
the WTG foundations.
Airborne noise levels were measured and recorded at selected onshore and offshore locations using a
series of sound level meters. Noise levels were recorded during periods of active pile driving and outside
of the active pile driving (to establish background levels). For onshore noise monitoring, data were
recorded at three onshore locations, namely the Southeast Lighthouse at the Mohegan Bluffs (4.8 km [3
mi] from the WTG 3, Balls Point North on the northeast corner of Block Island (10.5 km [6.5 mi] from
the WTG 1), and near Point Judith on the Rhode Island mainland (26.4 km [16.4 mi] from WTG 1).
Offshore noise monitoring was conducted from a strategically located vessel. Measurements were
recorded on a series of transects centered on the piling location. Transects were chosen either to coincide
with one of the onshore monitoring stations, heading northwest towards the Southeast Lighthouse, or
coincident with a particular wind direction. The monitoring data were analyzed to determine the
attenuation of sound as it propagates from the piling position over water, primarily as a function of wind
speed and wind direction relative to the direction of travel. This analysis will help predict received sound
levels under similar situations in the future.
Noise monitoring data analyses indicated that the noise from the pile driving was clearly audible at the
Southeast Lighthouse, but was not detected at Point Judith on the mainland. Over water, the piling noise
was barely audible at 11.3 km (7 mi) downwind (127 decibels [dB] weighted energy-averaged sound level
(LAeq) at 1.6 km [1 mi] from the pile [estimated]). Clear differences were noted in airborne noise
transmission between upwind and downwind conditions. The hum from the construction barge was just
audible beyond 3.2 km (2 mi) over water under downwind conditions.
Underwater Sound Monitoring – was conducted in parallel with airborne noise monitoring to detect and
record underwater acoustic and sediment-borne signals generated by the impact pile driving. Two parallel
underwater monitoring studies were conducted by two groups of researchers3. While complementary, the
monitoring approaches adopted by the two groups were different, and therefore results from the two
studies are reported separately. The first study involved using stationary and towed arrays and a sensor-
equipped geosled. In the second study, 1) a fixed, continuously monitoring hydrophone station was placed
at 750 m (2,460.6 ft) from the foundation, and 2) a single drifting hydrophone was deployed to record
underwater sound at two depths and seabed vibration monitoring.
Results from preliminary data analyses4 showed that pile driving sound was above background sound
levels at ranges in excess of 20 km (12.4 mi); received levels of approximately 120 dB re 1 Pa root mean
square [RMS]. Background sound levels at distances of 20 to 30 km (12.4 to 18.6 mi) from the
construction site were recorded from 97.7 dB to a 125.7 dB (mean of 107.4 dB). Based on models
calibrated with measured data, the sound levels were a function of water depth, which varied based on
3 The first group included a joint team of acoustic experts from Marine Acoustics, Inc., the University of Rhode
Island, and Woods Hole Oceanographic Institution and the second group was Subacoustech Environmental.
4 Detailed analyses are ongoing and will be presented in a subsequent report.

3
direction away from the pile. Overall, underwater sound levels were lower in deep waters and higher in
shallow waters; the difference between the two could be as large as 10 dB. Sound levels were also shown
to be dependent upon the orientation of the pile to the recording vessel. The piles are driven at an angle
(13.3° relative to perpendicular). A 10 or 15 dB difference in sound levels resulted depending on whether
the pile was angled towards, perpendicular, or away from the measuring vessel. Particle motion, which is
important to demersal fish and megabenthos, was greater at the sea floor compared to higher in the water
column.
Seafloor disturbance and recovery monitoring – Three rounds of bathymetry surveys were conducted
to monitor seafloor disturbances caused by Phase 1 and Phase 2 construction and to track seabed recovery
(healing) over time. The first survey was conducted on 11 and 12 May 2016, approximately 8 months
after completion of the Phase 1 construction in October 2015. The second survey was conducted from 2 to
5 October 2016, 2 months after the completion of Phase 2 construction activities in August 2016. The
third survey was conducted on 18 and 19 May 2017, approximately 18 months after the completion of
Phase 1 construction. Survey data were used to characterize four different types of seafloor disturbance
features. Documented features were tracked over a 12-month period to assess rate of recovery.
During the first survey, 160 seafloor disturbance features, which resulted from Phase 1 construction
activities, were interpreted. Collectively, these scar features impacted approximately 11,570 square
meters (m2). Data from the second survey showed 103 new seafloor disturbance features, which had
resulted from Phase 2 construction activities were observed. Collectively, these 103 new scars impacted
approximately 6,876 m2. New seafloor disturbance features associated with the Phase 2 construction were
concentrated around each of the five WTG locations and along the inter-array cable route.
Data from the third survey indicated that 75 and 60 disturbance features from Construction Phases 1 and
2, respectively were completely healed. In addition, all disturbance features appeared to be undergoing
either infilling and/or a decrease in size, albeit at varying rates. Survey 3 data also indicated that of the
160 disturbance features noted during the first survey, 64 features had partially healed, and 75 were
completely healed. Also, of the 103 disturbance features noted from the Survey 2 data, Survey 3 data
indicated that 34 features had partially healed and 68 were completely healed. Fifty-six of the 68 features
that have completely healed were in or adjacent to areas comprised predominantly of fine-grained sand.
The other 15 features were in areas comprised of predominantly medium- to coarse-grained sand. Long
term trends indicate that the seabed level changed by approximately 0.2 m (0.7 ft) and monthly variations
were up to 0.6 m (2 ft). Scour pits appeared to exhibit deepening and infilling during the measurement
period. Deepening events corresponded to storm events (as expected) but also appear to reflect seasonal
variations.
Survey 3 data also identified 12 new scour features that had developed around the concrete mats placed to
protect the cable at the turbine entry points. Cable sections near the wind turbines were intentionally left
unburied until the cables were pulled into the wind turbines. After the cable pulls, concrete mats were
placed on the unburied sections of cables for protection. This scour development was only observed on
turbines 1 and 2. These disturbance features comprised an area of approximately 844 m2. Scour appears to
be notably deeper and wider on the northwestern side of the mats, which potentially indicates there was a
dominate bottom current flow direction.
Comparison of data from the three surveys identified changes in seafloor bedforms that indicate the
seafloor was active during the time between surveys. Ripple fields changed in spatial extent and ripples
also changed in orientation and size between Surveys 1 and 2 and then again between Surveys 2 and 3.
Ripples were two times taller in Surveys 1 and 3 (conducted at the end of winter) than observed in Survey
2 (conducted at the end of summer). This is expected, as the winter wave climate is typically
characterized by shorter wavelength, higher frequency and higher amplitude waves than the calmer,
longer swells typical of summer months.

4
Seafloor recovery rates generally correspond to seabed mobility. Based on data collected during the three
surveys, the seafloor within the Project Area was classified into three zones (Zones 1, 2 and 3) and two
subzones (Zones 1a and 2a). Seafloor mobility was observed to be the highest within Zone 1, moderate in
Zone 2, and low in Zone 3. In general, the zones of higher seafloor mobility correlated with higher
sediment infill/seafloor disturbance recovery rates.
Turbine foundation scour monitoring – A pair of scour monitors were also tested at the BIWF. The
monitors were installed on the WTG 3 foundation for measuring and recording in real-time changes in
seabed elevations at a distance of up to 10 m (32.8 ft) from the foundation. A near continuous seabed
elevation dataset was collected over the course of 14 months and 19 days. A seabed-mounted acoustic
wave and current profiler was also installed nearby to provide data on oceanographic conditions (water
levels, currents, and waves).
Evaluation of the data collected by scour monitors indicated that changes in the seabed elevation were
seen to occur at three distinct periods: 1) less than 1 day, consistent with the periodicity of the local tidal
forcing, 2) over the course of one week to one month, appearing to coincide with perturbations to the tidal
current flow resulting from increased wave energy; and 3) a seasonal signal consistent with increased
wave activity in the winter months, and calmer conditions in the summer months. The orientation of the
acoustic beams allowed for observation of the variation in seabed level with distance from the foundation,
and response of the seabed to physical oceanographic forcing.
The scour monitors provide a long-term time series of seabed elevations at specific points close to the
foundation that can be used to enhance the understanding of the variation in seabed levels. Data collected
by the monitors cannot be duplicated by bathymetry surveys. For future projects, the scour monitors could
be used to generate data to support design assumptions about seabed mobility, or if scour occurs under
specific circumstances then appropriate preventative intervention can be designed and actioned to
maximize the life of the structures.
The data, findings, and recommendations presented in this report were generated for BOEM by the HDR
RODEO Team under IDIQ Contract M15PC00002, Task Order M15PD00031.
5
1 Introduction
This report presents methods, data, observations, results, and findings from real-time environmental
monitoring surveys conducted in and around the Block Island Wind Farm (BIWF) Project Area (Figure
1) during the installation of wind turbine foundations. This monitoring was conducted under the Bureau
of Ocean Energy Management’s (BOEM) Real-Time for Opportunity Development Environmental
Observations (RODEO) Program. This report focuses on visual observations, airborne and underwater
sound, seafloor disturbance and recovery, and scour monitoring.
1.1 The RODEO Program
The purpose of the RODEO Program is to make direct, real-time measurements of the nature, intensity,
and duration of potential stressors during the construction and initial operations of selected proposed
offshore wind facilities. The purpose also includes recording direct observations during the testing of
different types of equipment that may be used during future offshore development to measure or monitor
activities and their impact producing factors.
Data collected under the RODEO Program may be used as input to analyses or models that are used to
evaluate effects or impacts from future offshore activities. This Program is not intended to duplicate or
substitute for any monitoring that may otherwise be required to be conducted by the developers of the
proposed projects. Also, RODEO Program monitoring is coordinated with the industry and is not
intended to interfere with or result in delay of industry activities.
The BIWF is the first facility to be monitored under the RODEO Program. All monitoring surveys were
implemented in accordance with a pre-approved field sampling plan, which included a project-specific
health and safety plan (Appendix A). Table 1 identifies the types of field data collected under the
RODEO Program during construction and/or initial operations of this facility.
1.2 The BIWF
The BIWF is the nation’s first offshore wind farm, and it is located 4.5 kilometers (km) (2.8 mi [mi])
from Block Island, Rhode Island, in the Atlantic Ocean. Water column depth in the wind farm area is
approximately 30 meters (m) (98.4 feet [ft]). The five-turbine, 30-megawatt facility is owned and
operated by Deepwater Wind Block Island, LLC. Power from the turbines is transmitted to Block Island.
A 32 km (19.9 mi) transmission submarine power cable transfers excess power from Block Island to the
mainland. This cable is buried under the ocean floor and makes landfall on the mainland, north of
Scarborough Beach at Narragansett.
BIWF construction began in July 2015, and was completed in a phased manner by the end of November
2016. During the first phase, five turbine foundations were installed on the seabed from 26 July to 26
October 2015. These turbines were designated as wind turbine generator (WTG) 1 to WTG 5. Phase 2
construction was initiated in January 2016, and it included laying of the submarine power transmission
cables, and installation of the turbine towers, blades, and nacelles on the foundations. Phase 2 components
included the following:
an inter-array submarine cable connecting the five turbines
an export cable connecting northernmost WTG to Block Island
the Block Island substation, located near New Shoreham on Block Island, includes approximately
1.3 km (0.8 mi) of underground cable from the beach to the new substation
the Block Island Transmission System, which includes a bi-directional 32.1 km (19.6 mi)
submarine cable from Block Island to Scarborough State Beach in Narragansett and 5.6 km (3.5
mi) of underground cable from Scarborough State Beach to the Dillon’s Corner substation.
6
Figure 1. BIWF project area.
Operational testing of the facility was conducted from August through November 2016, and the initial
operations commenced on 2 December 2016.
Rhode Island
Block
Island

7
Table 1. RODEO Program monitoring conducted at the BIWF.
Phase Key Activities Dates Monitoring Surveys Comment
Construction Phase 1
Steel jacket foundations were installed on the seabed using two different types of hammers. Both derrick barges and a lift boat were used as construction platforms. Piles were installed with a 13.27° rake from the vertical.
26 July 2015–26 October 2015.
Visual observations and documentation of the construction activities.
Airborne noise monitoring associated with the pile driving.
Underwater sound monitoring associated with the pile driving.
Seafloor sediment disturbance and recovery monitoring through bathymetry surveys conducted immediately after construction was completed and in approximately 3-month intervals for one year.
Turbine platform scour monitoring through installation of two scour monitoring devices on selected WTG foundations.
An Acoustic Wave and Current Profiler was also deployed within the project area.
Results, finding, and recommendations from Construction Phase 1 monitoring are presented in this report.
Construction Phase 2
WTGs were installed on the steel foundations.
13 May 2016–18 August 2016.
Airborne noise monitoring.
Visual observations and documentation of activities.
Results, finding, and recommendations from Phase 2 Construction Monitoring will be presented in a separate report, which is tentatively titled ”Field Observations during Phase 2 Construction, Operational Testing, and Initial Operations at the Block Island
Wind Farm, Rhode Island”1

8
Phase Key Activities Dates Monitoring Surveys Comment
Submarine transmission power cables connecting Block Island and mainland were laid using a jet plowing in the offshore portions and horizontal directional drilling in the near shore area.
3 June 2016–26 June 2016.
Visual observations and documentation of the cable laying activities and of turbine installation from both on shore and off shore locations.
Still photography and filming of portions of trenching operations for cable laying.
Seafloor sediment disturbance monitoring.
Post-construction seafloor recovery through bathymetry surveys.
See report entitled: “Observing Cable Laying and Particle Settlement During the Construction of the Block Island Wind Farm” for detailed information on Construction Phase 2 monitoring (Elliott et al. 2017).
Operational Phase
Testing of the newly installed turbines.
Testing of the submarine transmission power cables.
Operational testing conducted from 29 August 2016–30 November 2016.
Visual observations of the operational wind farm from varied distances on shore and off shore locations.
Results, finding, and recommendations from monitoring conducted during operational testing and initial operations will be presented in a separate report, which is tentatively titled ”Field Observations during Phase 2 Construction, Operational Testing, and Initial Operations at the Block Island Wind Farm, Rhode Island”
1
Facility operations.
Wind Farm operation began on 2 December 2016.
Airborne noise monitoring.
Underwater sound monitoring.
Seafloor sediment disturbance and recovery monitoring.
Benthic monitoring.
1 This report is currently under preparation.

9
1.3 Phase 1 Construction Activity Characterization
Phase 1 construction covered installation of the turbine foundations on the seafloor. Each foundation
consisted of a larger steel jacket and a smaller transition deck. The jackets and decks were fabricated by
Gulf Island Fabrication at their facility in Houma, Louisiana, and shipped via barge to a mobilization area
approximately 4.8 km (3 mi) from Block Island (Figure 2). The distance to the project area from Houma,
Louisiana, is approximately 3,379.6 km (2,100 mi) and it took the derrick barges approximately 3 weeks
to cover the distance. The steel jackets consist of a lattice structure with four hollow leg structures around
the perimeter and they are designed to withstand a CAT III Hurricane. Each jacket weighs over 1,500 tons
and its base measures 24.4 × 24.4 m (80 × 80 ft).
Figure 2. WTG foundations en route to Block Island Work Area.
During construction, each steel jacket was lowered by a crane onto the seabed and then individual piles,
which measured between 1.4 to 1.7 m (4.6 to 5.6 ft) in diameter, were lowered by a crane into the guide
holes at jacket corners. Impact (percussive) pile driving was used to drive the piles incrementally into the
seabed. The piles were driven to their final penetration design depth of 76.2 m (250 ft) or until refusal,
whichever came first.
In each corner of the jacket, there are guide holes (tubes) into which the piles are placed by crane and then
driven by impact pile driving. Once the first set of piles were driven into each corner, a second set of piles
(and in some cases a third set) were welded on and driven into the foundation jacket guide holes using the
same procedure. Once all the piles were hammered into place and the steel jacket was firmly anchored,
the transition deck was placed on top of the steel jacket and bolted in place to complete the foundation.
Figure 3 is a schematic showing a completely assembled turbine foundation. Figure 4 shows the
completed WTG 5 foundation.
Steel Jackets
Transition Deck
Piles

10
Figure 3. Schematic showing a fully assembled turbine foundation (courtesy Deepwater Wind).
11
Figure 4. Completed foundation for WTG 5.
The WTG 1 foundation was damaged the last week of July 2015 when one of the barges bumped into the
foundation and dented one of the foundation’s tubular legs. WTG 1was removed from the water and
shipped to New Jersey for repair. The foundation was repaired and replaced back in the water in mid-
September 2015.
Two types of barge designs were used for the pile driving: a floating barge, which was moored by a series
of anchors during crane activity; and a jack-up barge. The jack-up barge proved to be more effective, and
most piles were driven using this approach. Two piling hammers were used: Bauer-Pileco D280-22
(diesel) and Menck (hydraulic). Of the two, the hydraulic hammer was more effective. At its highest, the
hammer was approximately 35 m (114.8 ft) above sea level, and at its lowest, was approximately 6 m
(19.7 fee) above sea level. Piling typically took approximately 30 minutes for each driven pile. Pile
strikes were typically two to three seconds apart. Pile driving logs for each individual turbine are shown
in Table 2.
Real-time, Phase 1 construction environmental monitoring included the following:
onshore and offshore visual monitoring of construction activities
onshore and offshore airborne noise monitoring
near- and far-field underwater sound monitoring
seafloor disturbance and recovery monitoring
turbine foundation scour monitoring.

12
Table 2. BIWF pile driving log.
Foundation Pile
Type Leg Name Date
Start Time
End Time Duration Vessel
WTG 1 P1 A1 J1P1A1 2015-09-19 13:00 13:37 0:37 L/B
Robert
A2 J1P1A2 2015-09-19 15:10 15:53 0:43 L/B
Robert
B1 J1P1B1 2015-09-19 8:28 12:40 4:12 L/B
Robert
B2 J1P1B2 2015-09-19 13:56 14:44 0:48 L/B
Robert
P2 A1 J1P2A1 2015-10-17 13:37 14:11 0:34 L/B
Robert
A2 J1P2A2 2015-10-17 12:39 13:25 0:45 L/B
Robert
B1 J1P2B1 2015-10-17 14:17 14:49 0:32 L/B
Robert
B2 J1P2B2 2015-10-17 11:39 12:32 0:53 L/B
Robert
P3 A1 J1P3A1 2015-10-21 10:16 11:09 0:53 L/B
Robert
A2 J1P3A2 2015-10-21 9:10 10:10 1:00 L/B
Robert
B1 J1P3B1 2015-10-19 16:25 17:15 0:50 L/B
Robert
B2 J1P3B2 2015-10-19 15:05 16:10 1:05 L/B
Robert
WTG 2 P1 B2 J2P1B2 2015-08-18 16:05 16:12 0:05 W533
P1 A1 J2P1A1 2015-09-03 11:13 11:41 0:28 W533
A2 J2P1A2 2015-09-03 9:55 10:22 0:27 W533
B1 J2P1B1 2015-09-03 14:40 15:15 0:35 W533
B2 J2P1B2 2015-09-03 16:49 17:17 0:28 W533
P2/P3 A1 J2P2A1 2015-10-11 12:43 13:47 0:48 W533
A2 J2P2A2 2015-10-11 14:55 15:45 0:50 W533
B1 J2P2B1 2015-10-11 16:14 17:22 1:08 W533
B2 J2P2B2 2015-10-11 9:53 10:51 0:58 W533
WTG 3 P1 A1 J3P1A1 2015-08-30 9:23 10:25 1:03 W533
A2 J3P1A2 2015-09-02 12:40 13:38 0:58 W533
B1 J3P1B1 2015-09-01 15:39 16:47 1:08 W533
B2 J3P1B2 2015-09-02 10:21 11:07 0:46 W533
P2 A1 J3P2A1 2015-09-18 10:01 10:49 0:48 W533
A2 J3P2A2 2015-09-18 14:17 15:08 0:51 W533
B1 J3P2B1 2015-09-18 8:36 9:38 1:02 W533
B2 J3P2B2 2015-09-18 12:52 13:58 1:06 W533
WTG 4 P1 B1 J4P1B1 2015-09-20 8:16 8:22 0:06 L/B
Robert
P1 A1 J4P1A1 2015-10-08 10:09 12:25 2:16 L/B
Robert

13
Foundation Pile
Type Leg Name Date
Start Time
End Time Duration Vessel
A2 J4P1A2 2015-10-09 16:40 17:36 0:56 L/B
Robert
B1 J4P1B1 2015-10-08 8:57 9:26 0:27 L/B
Robert
B2 J4P1B2 2015-10-10 9:30 10:37 1:07 L/B
Robert
P2 A1 J4P2A1 2015-10-12 16:25 16:54 0:29 W533
A2 J4P2A2 2015-10-12 17:36 18:07 0:31 W533
B1 J4P2B1 2015-10-13 9:23 9:45 0:22 W533
B2 J4P2B2 2015-10-13 9:58 10:14 0:16 W533
P3 A1 J4P3A1 2015-10-26 4:09 5:12 1:03 W526,
L/B Robert
A2 J4P3A2 2015-10-25 14:36 15:46 1:10 W526,
L/B Robert
B1 J4P3B1 2015-10-25 12:15 13:06 0:51 W526,
L/B Robert
B2 J4P3B2 2015-10-25 13:20 14:17 0:57 W526,
L/B Robert
WTG 5 P1 A1 J5P1A1 2015-09-17 12:30 13:40 1:10 L/B
Robert
A2 J5P1A2 2015-09-17 15:16 16:13 0:57 L/B
Robert
B1 J5P1B1 2015-09-17 18:06 19:02 0:56 L/B
Robert
B2 J5P1B2 2015-09-17 16:38 17:51 1:13 L/B
Robert
P2 A1 J5P2A1 2015-10-08 15:58 16:52 0:54 W533
A2 J5P2A2 2015-10-08 5:42, 8:22 9:26 1:42 W533
B1 J5P2B1 2015-10-09 12:45 13:32 0:47 W533
B2 J5P2B2 2015-10-09 11:18 12:18 1:00 W533
Note: Data provided by Deepwater Wind.
1.4 Report Organization
Key results, major observations, and conclusions from each type of environmental monitoring are
summarized in individual sections in this report. Raw data and detailed discussions from each type of
monitoring are contained in technical reports, which are provided as digital appendices to this summary
report:
Section 1 presented an overview of the BIWF Facility and the RODEO Program and included a
summary description of the construction activities conducted during the two phases.
Methods and key observations from the onshore and offshore visual monitoring conducted during
construction Phase 1 are presented in Section 2.
Section 3 contains a description of the onshore and offshore airborne noise monitoring.

14
Underwater sound monitoring methods and findings from preliminary acoustic data analyses are
presented in Section 4.
Seafloor disturbances and recovery monitoring from three rounds of bathymetry surveys are
described in Section 5. This section also contains information on the turbine scour monitors that
were field tested under the RODEO Program.
References cited in the report are listed in Section 6.

15
2 Visual Monitoring
The purpose of visual monitoring was 1) to document visibility of Phase 1 construction activities from
selected onshore and offshore locations, and 2) generate a real-time record of the Phase 1 construction-
related impact-producing activities, and where possible, quantify such activities. Visual monitoring
surveys were accordingly conducted from selected onshore and offshore locations during the installation
of WTG 2 and WTG 3 foundations over a 14-day period. Relevant information on size, type and number
of vessels, pile-driving activities and duration, and other impact-producing factors were recorded during
14 days of real-time field observations in accordance with a pre-approved Phase 1 construction activity
monitoring plan. Meteorological conditions that affected visibility during construction were also noted
(Appendix B).
The monitoring team mobilized to Block Island on 7 August 2015. Site reconnaissance was conducted on
8 and 9 August 2015 to select the most optimal onshore monitoring location. On-site training was
conducted for all field observers to ensure consistency in describing activities and recording observations.
Monitoring was initiated on 10 August and completed on 21 September 2015. Key observations and
significant findings from the monitoring are discussed in the subsections below; additional information is
contained in the Visual Monitoring Logs contained in Appendix B.
2.1 Survey Approach and Methods
Visual surveys were conducted by a team of dedicated observers to document visibility of Phase 1
construction activities from selected onshore and offshore locations. The onshore observer also served as
the field safety coordinator and maintained contact with the construction vessel via VHF communications.
2.1.1 Onshore Monitoring
The most strategic location for recording visual observations from the Block Island shoreline was
determined to be the Southeast Lighthouse (Figure 1 and Figure 5). This lighthouse is situated on top of
Mohegan Bluff at the southeastern corner of the island at an elevation of approximately 75 m (246 ft)
above mean sea level and approximately 4.8 km (3 mi) away from the BIWF construction site. From the
lighthouse grounds, the survey team had a clear uninterrupted view of the turbines as they were brought to
the site and placed on the seabed. Access to the lighthouse grounds was coordinated through Ms. Lisa
Nolan, Executive Director of the Southeast Lighthouse Foundation.
Construction observations were made from a fixed location on the lighthouse grounds (N 41º09º.17’, W
071º33.097’). The monitoring location was adjacent to the wooden boundary fence along the southern
edge of the lighthouse grounds and provided direct line of sight to the construction site (Figure 6). The
WTG coordinates and their distance from Block Island are listed in Table 3.
Table 3. WTG coordinates and distance from Block Island.
WTG Latitude
(Deepwater Wind 2016) Longitude
(Deepwater Wind 2016) Distance from Block
Island
1 41o 7.546’ N 71
o 30.451’ W 4.55 km (2.83 mi)
2 41o 7.193’ N 71
o 30.837’ W 4.69 km (2.91 mi)
3 41o 6.883’ N 71
o 31.270’ W 4.81 km (2.99 mi)
4 41o 6.609’ N 71
o 31.744’ W 4.97 km (3.09 mi)
5 41o6.380’ N 71
o32.258’ W 5.17 km (3.21 mi)
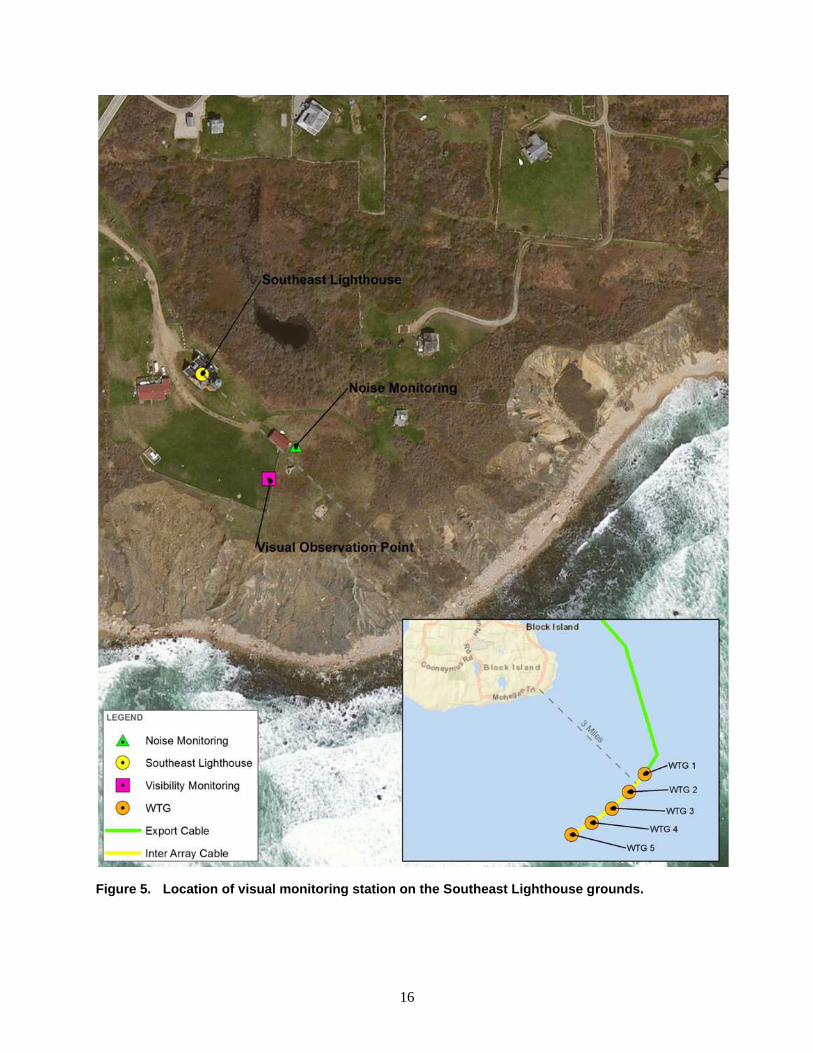
16
Figure 5. Location of visual monitoring station on the Southeast Lighthouse grounds.

17
Figure 6. Fixed monitoring location on Southeast Lighthouse.
Visual observations of construction activities were recorded in the morning, mid-day, sunset, and during
significant changes in meteorological conditions (e.g., rain, fog, etc.). During each recording event, a set
of still photographs and high-resolution video of turbines and construction activities were taken from the
monitoring location using a Canon 5D Mark III camera with a 70- to 200-millimeter (mm) telephoto lens.
The telephoto lens was wide enough to capture ambient lighting and environmental conditions and had
the capability of zooming in for closer images. To ensure that photographs taken at different times could
be compared side-by-side, the same camera angle and a constant zoom setting was used, and the camera
was mounted on a tripod to maintain image consistency.
During each monitoring event, observations were recorded using a customized iPad application (app),
which was specially created for this project using the database platform FileMaker Go. The app was field
tested prior to being used for the monitoring. Standardized data entry procedures were used for data entry
to ensure consistency among the field observers. Observers took a photograph and then recorded the
photo frame number along with notes on activity observed, time, and weather conditions. Meteorological
data recorded included wind direction, wind speed, sea state, cloud cover, and humidity. These data were
verified, quality checked, edited if needed, and synchronized with a dedicated hard drive at the end of
each day. Figure 7 shows an example of the iPad app input screen.
2.1.2 Significant Events Affecting Documentation of Visual Observations
The project area experienced heavy fog on 25 August, 2 September, and 9 September; this limited
visibility from the shoreline and affected visual observations. In addition, on several mornings there was a
slight haze around the foundations, which affected the quality of images captured. The view of the WTGs
from the Southeast Lighthouse monitoring station under foggy and clear weather conditions (as observed
on 2 September 2015) is compared side-by-side in Figure 8. As seen in this figure, the foundation and
Derrick barge are not visible from shore during the morning foggy conditions, but were clearly visible
once fog dissipated in the early afternoon.

18
Figure 7. Sample data log screen.
Figure 8. View from the Southeast Lighthouse monitoring station foggy and clear conditions.
Weather and sea state also impacted onshore visual observations. Figure 9 shows the WTGs under foggy
and clear conditions from a distance of 500 m (1,640.4 ft). These images were taken in parallel with the
images shown in Figure 8.
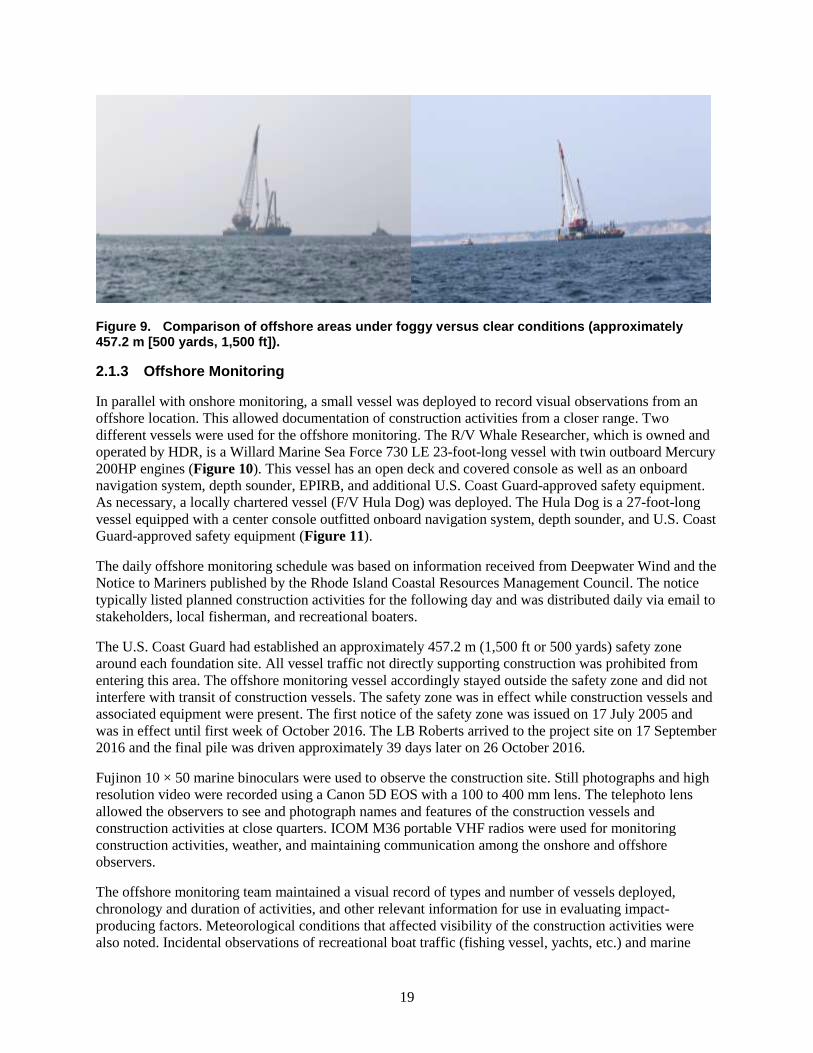
19
Figure 9. Comparison of offshore areas under foggy versus clear conditions (approximately 457.2 m [500 yards, 1,500 ft]).
2.1.3 Offshore Monitoring
In parallel with onshore monitoring, a small vessel was deployed to record visual observations from an
offshore location. This allowed documentation of construction activities from a closer range. Two
different vessels were used for the offshore monitoring. The R/V Whale Researcher, which is owned and
operated by HDR, is a Willard Marine Sea Force 730 LE 23-foot-long vessel with twin outboard Mercury
200HP engines (Figure 10). This vessel has an open deck and covered console as well as an onboard
navigation system, depth sounder, EPIRB, and additional U.S. Coast Guard-approved safety equipment.
As necessary, a locally chartered vessel (F/V Hula Dog) was deployed. The Hula Dog is a 27-foot-long
vessel equipped with a center console outfitted onboard navigation system, depth sounder, and U.S. Coast
Guard-approved safety equipment (Figure 11).
The daily offshore monitoring schedule was based on information received from Deepwater Wind and the
Notice to Mariners published by the Rhode Island Coastal Resources Management Council. The notice
typically listed planned construction activities for the following day and was distributed daily via email to
stakeholders, local fisherman, and recreational boaters.
The U.S. Coast Guard had established an approximately 457.2 m (1,500 ft or 500 yards) safety zone
around each foundation site. All vessel traffic not directly supporting construction was prohibited from
entering this area. The offshore monitoring vessel accordingly stayed outside the safety zone and did not
interfere with transit of construction vessels. The safety zone was in effect while construction vessels and
associated equipment were present. The first notice of the safety zone was issued on 17 July 2005 and
was in effect until first week of October 2016. The LB Roberts arrived to the project site on 17 September
2016 and the final pile was driven approximately 39 days later on 26 October 2016.
Fujinon 10 × 50 marine binoculars were used to observe the construction site. Still photographs and high
resolution video were recorded using a Canon 5D EOS with a 100 to 400 mm lens. The telephoto lens
allowed the observers to see and photograph names and features of the construction vessels and
construction activities at close quarters. ICOM M36 portable VHF radios were used for monitoring
construction activities, weather, and maintaining communication among the onshore and offshore
observers.
The offshore monitoring team maintained a visual record of types and number of vessels deployed,
chronology and duration of activities, and other relevant information for use in evaluating impact-
producing factors. Meteorological conditions that affected visibility of the construction activities were
also noted. Incidental observations of recreational boat traffic (fishing vessel, yachts, etc.) and marine

20
mammal sightings were also noted by the offshore observers. All construction activity observations were
recorded using an iPad in a customized database as described in Section 2.1.1.
Figure 10. The R/V Whale Researcher.
Figure 11. Charter Vessel F/V Hula Dog.

21
2.2 Visual Monitoring Observations Summary
Figure 12 shows the WTG 1 steel jacket being lowered into the sea. Placement of the first section of piles
into the steel jacket corner guide holes can be seen in Figures 13 and 14. A Pileco diesel hammer was
used on the first day of pile driving (Figure 15), but was discontinued because of poor success and
multiple problems encountered. A Menck hydraulic hammer (Figure 16) was mobilized to the site to
replace the diesel hammer, and proved to be more effective for pile driving.
Two vessel platforms were used during construction. Initially, a Derrick barge was maneuvered into place
with tugs and anchored next to the foundations. The barge was equipped with two deck cranes used for
placing the piles into the jackets and subsequently hosting the hammer above the piles to drive them into
the seafloor, as shown in Figure 17. The barge-mounted crane platform was not stable, and progress was
slow, especially during bad weather and rough sea states.
In September 2016, the barge-mounted crane platform was replaced by a more stable vessel platform,
namely the jack-up offshore support vessel L/B Roberts. This platform has a self-elevating hull with three
legs, 306 m (1,004 ft) in length. The platform can be raised up to 219 m (718.5 ft) above sea level, and is
equipped with four cranes on deck; it also includes living quarters for up to 152 workers (Figure 18). The
L/B Roberts was used for both pile driving and placement of the transition deck on top of the anchored
jackets (Figure 19). On the highly stable L/B Roberts platform’s first day of deployment, crews were able
to complete driving of three piles, which was a substantial improvement on progress made with the barge-
mounted crane platform.
A total of 16 different vessels were observed during Phase 1 construction; the number of vessels on site
on a given day varied with weather and the nature of activities being conducted. Vessel anchoring within
the work zone is likely to contribute to seabed scarring.
On a typical day, Derrick barges Weeks 533 and Weeks 526, along with LB Roberts, were generally
positioned next to the jackets. The Weeks 533 and Weeks 526 barges were used primarily to place the
piles into the jacket corners and for welding operations. Tug support for the Derrick barges was provided
by two tugs. One tug would be attached to the barge and the other would provide anchoring support as
needed. Cranes on the L/B Roberts would transfer a pile to the jacket and then commence pile driving
using the Menck hydraulic hammer.
Crews and supplies were brought in to the work site daily from Galilee and Quonset aboard the Rosemary
Miller and Sorenson Miller, respectively. The Project Management Team typically used the F/V Lindsey
E for transport to the work site. Other vessels on site included the R/V Heather Lynn, which was used for
environmental monitoring conducted prior to the start of pile driving.
A summary of significant events that occurred during the Phase 1 construction period is presented in
Table 4 (for August 2015) and Table 5 (for September 2015). A complete list of vessels observed during
the construction period and their known functions is shown in Table 6.
During the visual monitoring, over 4,500 photographs were taken from Southeast Light House and
research vessels. These photographs provide visual examples of the types of activities that occurred
during construction. They were provided to BOEM on a DVD and are available upon request.
Selected high-quality photographs, which are illustrative of the construction activities described in this
report, are presented in the photolog below. Key observations recorded during onshore and offshore
visual monitoring are summarized in Sections 2.1 and 2.2, respectively. These two sections also include a
key for the photographs stored on the DVD that has been provided to BOEM. Section 2.3 describes
meteorological observations recorded during the visual monitoring.

22
Figure 12. Lowering of the WTG 1 steel jacket into the sea.
Figure 13. Placing of piles into the WTG 3 steel jacket guide holes.

23
Figure 14. Piles inserted into jacket prior to pile driving.
Figure 15. Pileco diesel hammer attempting to drive piles at WTG 2.

24
Figure 16. Menck hydraulic hammer.
Figure 17. L/B Roberts hammering piles at WTG 1.
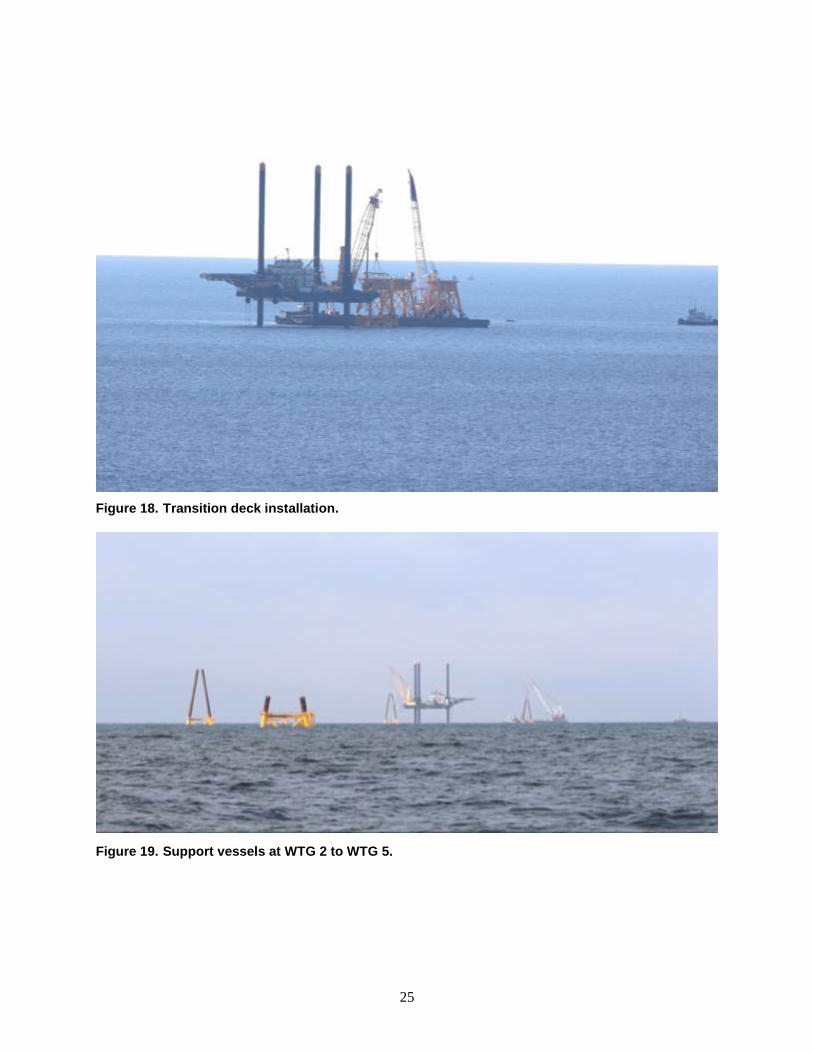
25
Figure 18. Transition deck installation.
Figure 19. Support vessels at WTG 2 to WTG 5.

26
Table 4. August 2015 significant events.
Date Pile
Driving Significant Events
8/18 Yes 1513 first strike heard at SE Lighthouse from piling at WTG 2. Soft start till 1600. 1610 Continuous hammering occurs for approximately 3 minutes then stops. Hammer was damaged and day ended with only one partially driven pile.
8/23 No Expected pile driving at WTG 2 in late afternoon. Two tugs positioned Weeks 526 next to WTG 2 but never hammered. Weeks 533 next to WTG 3 stabbing 3
rd pile
which Subacoustech Environmental captured acoustics and reported in Section 3.
8/24 No Expected pile driving at WTG 2. Cable broke on hammer once set on pile. Pile driving did not occur.
8/25 No Expected pile driving at WTG 2. Heavy fog limited visual. Lifted hammer and placed on barge deck, then removed hammer. Weeks Barge requested a welder so assume problem with rigging.
8/26 No Winch is broken on crane. Onshore observer captured whale breach near WTG 3.
8/27 No Weeks barge is not stable enough to accurately and consistently drive the piles. Weeks engineers coming from Louisiana to assess.
8/28 No Hammer placed on WTG 3 and became jammed. Caliper and winch damaged.
8/29 No Placed hammer on pile at WTG 3 and it got stuck again.
8/30 Yes First pile on WTG 3 driven. Soft start began on 0923. 0931 Start hammering consistently. 1026 Hammer stops. 1530 hammer put on deck to readjust anchors.
8/31 No No activity due to adverse weather conditions.
Table 5. September 2015 significant events.
Date Hammer Summary of Activity
9/1 Yes Piling occurred at WTG 3. Second pile was driven in 58 minutes. Sound easily detectable at SE Lighthouse. URI Santa Rose pulling towed array and reported in Section 4.
9/2 Yes 2 piles driven at WTG 3. URI captured acoustics for both which is described in Section 4. Heavy fog in morning created poor visibility for onshore observer.
9/3 Yes 4 piles driven at WTG 2 by Weeks 533 Crane.
9/4 thru 9/16
No DW safety inspection. No piling. Team demobilized. 2 jackets in the water. Hammer moved to LB Roberts.
9/16 No Team mobilized back to BI.
9/17 Yes L/B Roberts onsite. 3 piles driven at WTG 5. Also stabbing piles at WTG 2. Subacoustech captured underwater sound on 2 piles. Attached GoPro to particle motion as described in Section 4.6.
9/18 Yes. Hammered 4 piles at WTG 3. Welding second set of piles at WTG 5. Remaining work consists of second set of piles at WTG 5, 2, and 1. WTG 4 will need both sets of piles driven:
9/19 Yes
4 piles driven at WTG 1. Drove first pile to approximately 75% complete and had hydraulic leak on hammer. Repairs made and finished all piles. Piles are taking just under an hour to drive. Barge onsite with top piece for jackets. Weeks Barge installing platforms on foundations.
9/20 No
WTG 4 While on pile 1 at WTG 4, the pile hit a soft spot on ocean bottom and slid down quickly causing the hammer to come off. The hammer was striking air at that point and concern is that it may have damaged crane from the force. They are having the crane inspected at Quonset today. They got approximately one-third of the way through the first pile before incident.
9/21 Team demobilized.
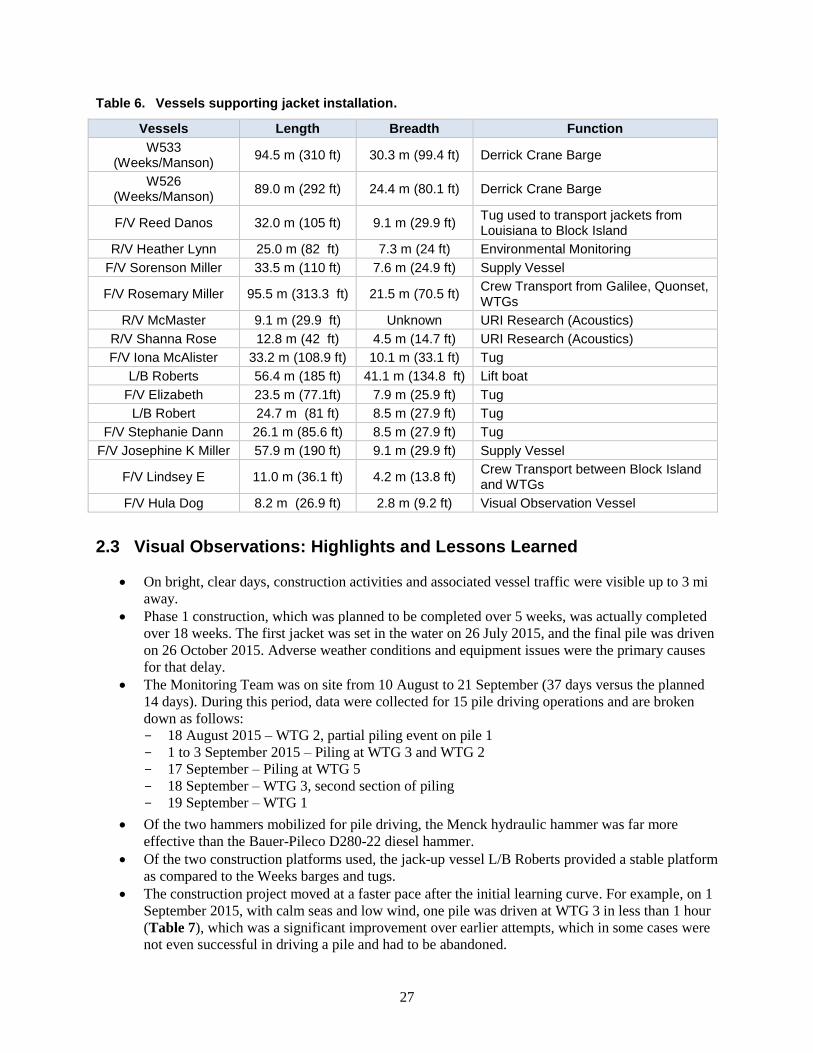
27
Table 6. Vessels supporting jacket installation.
Vessels Length Breadth Function
W533 (Weeks/Manson)
94.5 m (310 ft) 30.3 m (99.4 ft) Derrick Crane Barge
W526 (Weeks/Manson)
89.0 m (292 ft) 24.4 m (80.1 ft) Derrick Crane Barge
F/V Reed Danos 32.0 m (105 ft) 9.1 m (29.9 ft) Tug used to transport jackets from Louisiana to Block Island
R/V Heather Lynn 25.0 m (82 ft) 7.3 m (24 ft) Environmental Monitoring
F/V Sorenson Miller 33.5 m (110 ft) 7.6 m (24.9 ft) Supply Vessel
F/V Rosemary Miller 95.5 m (313.3 ft) 21.5 m (70.5 ft) Crew Transport from Galilee, Quonset, WTGs
R/V McMaster 9.1 m (29.9 ft) Unknown URI Research (Acoustics)
R/V Shanna Rose 12.8 m (42 ft) 4.5 m (14.7 ft) URI Research (Acoustics)
F/V Iona McAlister 33.2 m (108.9 ft) 10.1 m (33.1 ft) Tug
L/B Roberts 56.4 m (185 ft) 41.1 m (134.8 ft) Lift boat
F/V Elizabeth 23.5 m (77.1ft) 7.9 m (25.9 ft) Tug
L/B Robert 24.7 m (81 ft) 8.5 m (27.9 ft) Tug
F/V Stephanie Dann 26.1 m (85.6 ft) 8.5 m (27.9 ft) Tug
F/V Josephine K Miller 57.9 m (190 ft) 9.1 m (29.9 ft) Supply Vessel
F/V Lindsey E 11.0 m (36.1 ft) 4.2 m (13.8 ft) Crew Transport between Block Island and WTGs
F/V Hula Dog 8.2 m (26.9 ft) 2.8 m (9.2 ft) Visual Observation Vessel
2.3 Visual Observations: Highlights and Lessons Learned
On bright, clear days, construction activities and associated vessel traffic were visible up to 3 mi
away.
Phase 1 construction, which was planned to be completed over 5 weeks, was actually completed
over 18 weeks. The first jacket was set in the water on 26 July 2015, and the final pile was driven
on 26 October 2015. Adverse weather conditions and equipment issues were the primary causes
for that delay.
The Monitoring Team was on site from 10 August to 21 September (37 days versus the planned
14 days). During this period, data were collected for 15 pile driving operations and are broken
down as follows:
- 18 August 2015 – WTG 2, partial piling event on pile 1
- 1 to 3 September 2015 – Piling at WTG 3 and WTG 2
- 17 September – Piling at WTG 5
- 18 September – WTG 3, second section of piling
- 19 September – WTG 1
Of the two hammers mobilized for pile driving, the Menck hydraulic hammer was far more
effective than the Bauer-Pileco D280-22 diesel hammer.
Of the two construction platforms used, the jack-up vessel L/B Roberts provided a stable platform
as compared to the Weeks barges and tugs.
The construction project moved at a faster pace after the initial learning curve. For example, on 1
September 2015, with calm seas and low wind, one pile was driven at WTG 3 in less than 1 hour
(Table 7), which was a significant improvement over earlier attempts, which in some cases were
not even successful in driving a pile and had to be abandoned.
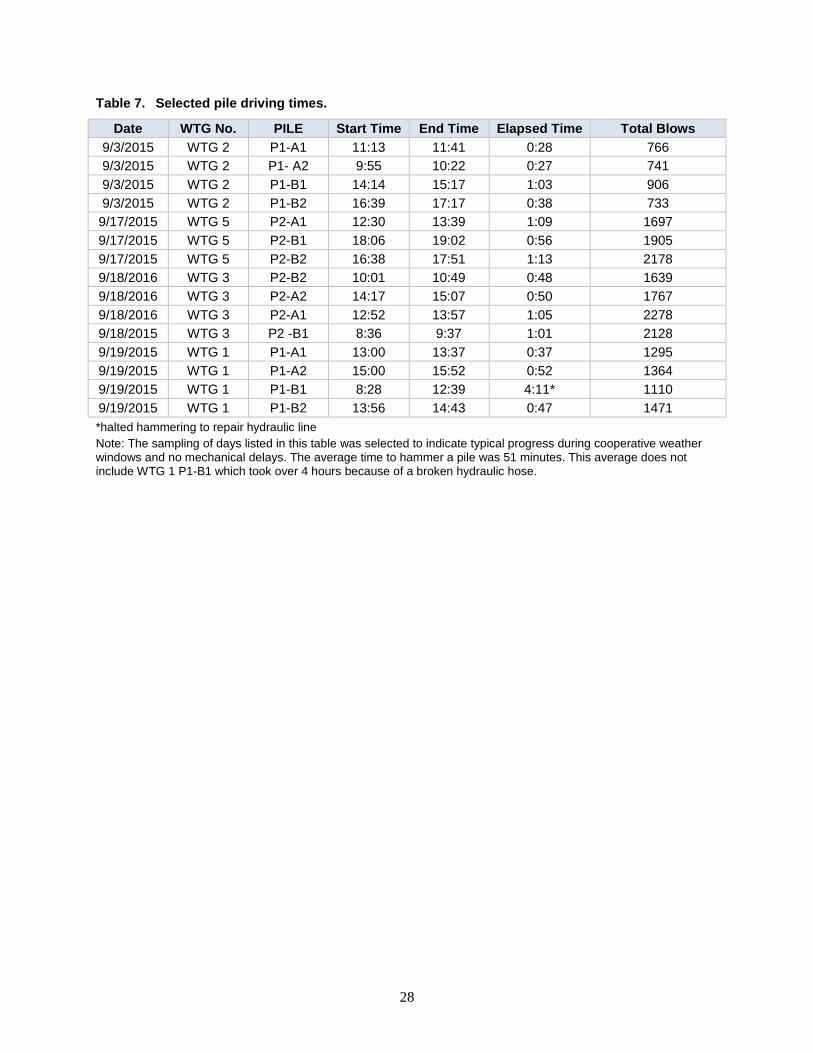
28
Table 7. Selected pile driving times.
Date WTG No. PILE Start Time End Time Elapsed Time Total Blows
9/3/2015 WTG 2 P1-A1 11:13 11:41 0:28 766
9/3/2015 WTG 2 P1- A2 9:55 10:22 0:27 741
9/3/2015 WTG 2 P1-B1 14:14 15:17 1:03 906
9/3/2015 WTG 2 P1-B2 16:39 17:17 0:38 733
9/17/2015 WTG 5 P2-A1 12:30 13:39 1:09 1697
9/17/2015 WTG 5 P2-B1 18:06 19:02 0:56 1905
9/17/2015 WTG 5 P2-B2 16:38 17:51 1:13 2178
9/18/2016 WTG 3 P2-B2 10:01 10:49 0:48 1639
9/18/2016 WTG 3 P2-A2 14:17 15:07 0:50 1767
9/18/2016 WTG 3 P2-A1 12:52 13:57 1:05 2278
9/18/2015 WTG 3 P2 -B1 8:36 9:37 1:01 2128
9/19/2015 WTG 1 P1-A1 13:00 13:37 0:37 1295
9/19/2015 WTG 1 P1-A2 15:00 15:52 0:52 1364
9/19/2015 WTG 1 P1-B1 8:28 12:39 4:11* 1110
9/19/2015 WTG 1 P1-B2 13:56 14:43 0:47 1471
*halted hammering to repair hydraulic line
Note: The sampling of days listed in this table was selected to indicate typical progress during cooperative weather windows and no mechanical delays. The average time to hammer a pile was 51 minutes. This average does not include WTG 1 P1-B1 which took over 4 hours because of a broken hydraulic hose.

29
3 Airborne Noise Monitoring
Construction of an offshore wind farm is expected to generate noise from sources such as transportation
and mobilization of construction equipment and materials, and operation of construction equipment,
including pile driving. Of all of the construction-related sources of noise, pile driving generates the
highest levels. During BIWF Phase 1 construction, airborne noise monitoring was conducted during
active construction periods to observe and measure levels of airborne noise produced during the
installation of the WTG foundations. Noise levels were sampled both on land and on the water. The
monitoring data were analyzed to determine the attenuation of noise as it propagates from the piling
position over water, primarily as a function of wind speed and wind direction relative to the direction of
travel. This analysis will help predict received noise levels under similar situations in the future.
Major results and significant findings from the monitoring and data analyses are discussed in the
subsections below; additional information is contained in the Airborne Noise Monitoring Report
(Appendix C).
3.1 Monitoring Approach and Methods
Airborne noise levels were sampled at selected onshore and offshore locations using a series of sound
level meters (SLMs). Noise levels were recorded during periods of active pile driving and outside of the
active pile driving (to establish background levels).
3.1.1 Onshore Monitoring
For onshore noise monitoring, SLMs were fixed to tripods facing the direction of the site, and
windscreens were fitted at all times. Wind speed, pressure, air temperature and relative humidity were
measured while offshore at 3 m (9.8 ft) above sea level, and at the measurement locations at the top of the
cliffs on Block Island, approximately 80 m (262.5 ft) above sea level, and 2 m (6.6 ft) above ground level.
There was no precipitation over the duration of the survey.
Data were recorded at three onshore locations, namely the Southeast Lighthouse at the Mohegan Bluffs
(4.8 km [3.1 mi] from the WTG 3, Balls Point North on the northeast corner of Block Island (10.5 km
[6.5 mi] from the WTG 1), and near Point Judith on the Rhode Island mainland (26.4 km [16.4 mi] from
WTG 1) (Figure 1). At the Southeast lighthouse monitoring station, the SLM was located south of the
lighthouse near the edge of the cliff. This location was as far as possible from public use areas and had a
clear line of sight to the BIWF work area. Background noise at his location was dominated by rustling
foliage and distant waves, sporadic voices from members of the public and occasional light aircraft.
Measurements at Balls Point North were recorded on the edge of a quiet footpath at the top of the cliff
overlooking the site. The background noise at this location was dominated by vegetation rustling in the
wind and wave sound, and occasional light aircraft and vessels passing. At Point Judith the SLM was
located at an accessible but relatively-remote point on the coastline. The background noise at this location
was dominated by intermittent wave action at the beach.
3.1.2 Offshore Monitoring
For offshore noise monitoring, surveyors took measurements on a series of transects centered on the
piling location. Transects were chosen either to coincide with one of the onshore monitoring stations,
heading northwest towards the Southeast Lighthouse, or coincident with a particular wind direction. The
monitoring vessel also was used simultaneously for taking underwater sound measurements; accordingly,
transects also occasionally focused on directions pertinent to underwater conditions. A key element of the
scope of work was to sample a range of conditions, especially transects under different wind directions
relative to the transect direction.

30
A weather-protected microphone was set up on the survey vessel R/V McMaster, which was fixed to a
frame in a position that selected to minimize reflections and noise shielding from vessel structures. The
microphone was approximately 3 m (9.8 ft) above sea level.
Transects began at the edge of the offshore safety exclusion zone–457.2 m (0.29 mi [500 yards]) from the
piling location—and continued out until the vessel reached land, piling ended, or piling noise was no
longer audible or detectable because of distance. In practice, the measurements typically continued
beyond the range of audibility both 1) in air and 2) underwater, where the sound was detectable to a much
greater distance.
Noise data was acquired at intervals starting at approximately 500 m (1,640.4 ft) and doubling in distance
(1 km [0.6 mi], 2 km [1.2 mi), and 4 km [2.5 mi]), together with details of the boat’s position and other
relevant information. The boat’s position was recorded on the computer system by sending the output
from a GPS receiver to a USB port on a computer. This was used to determine the range to the piling
from the survey vessel.
3.2 Airborne Noise Equation Terms
3.2.1 Introduction
ISO 9613-2:1996 states that airborne environmental sound propagation over substantial distance tends to
follow a basic equation where the noise level at a receiver position is affected by the level of sound at
source, a directivity correction relating to any changes in noise emission is dependent on the direction
from the source and the attenuation with distance, which is a combination of multiple factors. As piling is
effectively an ‘omnidirectional’ sound source—that is, it radiates noise equally in all directions—
directivity at source can be discounted. Discounting factors that will also not have an effect offshore
(e.g., screening effects), the equation for estimation of sound level at a receiver becomes:
𝑹𝑳 = 𝑺𝑳 − 𝑵 𝐥𝐨𝐠𝟏𝟎𝑹− 𝜶𝑹
where, RL is the sound level at the receiver, SL is the sound level at the source location, R is the range or
distance from the source, N is a coefficient relating to the rate of geometric sound attenuation dependent
on a number of factors, and α is the atmospheric absorption coefficient.
3.2.2 Source Level (SL)
Critical to the calculation of the sound level at a receiver is the sound level at source. Previous offshore
impact piling noise underwater monitoring has shown that the source level is primarily related to the
diameter of the pile and how hard the pile is struck (the blow energy of the hammer in use) (See the
Technical Report in Appendix C). While other factors will also have an effect on the sound produced
(e.g. material type and thickness, properties of the ground and properties of the pile), the source sound
emission can be described adequately by the diameter of the pile and blow energy. As the pile size and
hammer used for the installation of foundations at the BIWF remained the same, the source level is likely
to change only by the energy used in each strike.
It should be noted that for the purposes of this study, the source level is defined as a theoretical sound
level at 1 m (3.3 ft) from the sound source. This assumes that the source itself is effectively a point
source, as it will appear at the distances at which the measurements were taken.
3.2.3 N Coefficient
Also known as geometric spreading, the value of N defines how quickly the sound at source reduces over
distance and is primarily related to how the sound ‘spreads out’. However, this value changes with the
shape of the source (i.e., if the source is a ‘point,’ a ‘line’ or an ‘area’), how far the receiver is from the

31
source, weather conditions, changes in the atmosphere, reflective surfaces and others. Typically a simple
assumption of a sound spreading spherically from the source in ideal conditions provides a value of N of
20, and real world conditions lead to variations around this value depending on the exact situation. For
example, downwind conditions might be expected to lead to slower attenuation of sound and a slightly
lower value of N, but upwind the sound will attenuate more quickly and the value of N will be greater.
Depending on the value of N, the real reduction in sound tends to vary between 3 and 6 dB per doubling
of distance from the sound source.
3.2.4 Absorption Coefficient, α
While the N coefficient causes a reduction in the sound level with every doubling of distance, the
absorption coefficient (α) applies a small reduction with every unit of distance, because of absorption in
the medium in which the sound is travelling. The consequence of this is that the overall attenuation of
sound is controlled by N when near the sound source, and α becomes more significant at a greater
distance.
Like N, the value of α depends on many factors, including the frequency of the sound and the
environmental conditions, such as air temperature and humidity. Detailed tables showing the values of α
under a variety of environmental conditions can be found in ISO 9613-1:1993 Acoustics - Attenuation of
sound during propagation outdoors, and for the purposes of this study, are considered to be a known
quantity.
This analysis is designed to estimate an appropriate value for N and α coefficients based on the measured
airborne sound levels. It is acknowledged that other factors will have an impact on the attenuation of
sound, such as scattering by the water surface, weather conditions (e.g., clouds/fog) or variations in
temperature with altitude, but analysis to this level of detail is beyond the scope of this study.
3.2.5 Sound Metrics
LAeq,t – the A-weighted, Equivalent Average Sound Pressure Level (or Energy-Averaged Sound Level). It
indicates the decibel level of a constant sound source that would have the same total acoustical energy
over the same time interval as the actual time-varying sound condition being measured or estimated. Leq
values must be associated with an explicit or implicit averaging time “t” in order to have practical
meaning.
LAFmax,t – the A-weighted Maximum Sound Pressure Level measured with a fast 125 millisecond time
constant and associated with an averaging time “t.”
LA90,t – the A-weighted Sound Pressure Level Sound exceeded for 90 percent of the measurement period
“t.”
LCPeak – the C-weighted, largest absolute value of the instantaneous sound pressure.
A Weighting – a weighting applied to received sound pressure level spectra designed to filter out the
lower and higher frequencies that the average person cannot hear.
C Weighting – similar to A-weighting, C-weighting filters less of the lower frequencies of received
sound pressure levels.
3.2.6 Spherical and Cylindrical Spreading
This relates to the manner in which the sound spreads from the source, and depends on the distance from
the source and the shape of the source. Assuming the source appears to be a single point, at certain
distances the sound behaves as if it is spreading out in an approximately spherical shape, and this leads to

32
a theoretical reduction of 6 dB per doubling of distance (as per Section 3.2.3). In other situations, the
sound can spread in a cylindrical shape, leading to a theoretical reduction of 3 dB per doubling of
distance. In practice, the conditions are rarely this well-defined.
In this situation, the noise spreading tends to be approximately spherical near to the sound source then
transitions to a more cylindrical pattern at a greater distance.
3.3 Background Noise Measurements
Background noise readings were taken outside of active pile-driving periods at the same onshore and
offshore locations. Although construction machinery was in position at all times, the activities
undertaken, and the distances between the measurement location and the machinery, were such that no
appreciable noise from it could be detected or was audible outside of piling.
3.3.1 Onshore
3.3.1.1 Southeast Lighthouse
Background noise levels measured at the Southeast Lighthouse on 9 August 2015 are shown in Table 8.
Average wind speed was 9 meter/second (m/s), northeast. Noise levels were predominantly
anthropogenic. The microphone was located in a location that was sheltered from the effects of wind
noise.
Table 8. Summary of background noise level sample at the Southeast Light, 9 August 2015.
LAeq,30mins LAFmax LA90,30mins
16:00 – 16:30 43.3 dB 61.5 dB 38.6 dB
16:30 – 17:00 41.1 dB 56.5 dB 37.5 dB
A longer-duration background noise survey was undertaken at this location in January 2016 (table not
provided), which sampled noise levels over day and night periods at higher wind speeds, more indicative
of optimum wind turbine conditions. Wind speeds ranged from 6 to 12 m/s, northwest. Noise levels were
caused by wind in bare winter trees and correlated well with wind speed.
3.3.1.2 Balls Point North
Background noise levels sampled at Balls Point North are shown in Table 9. Note that the noise levels
recorded were LCpeak rather than LAFmax and not directly comparable with one another. Noise levels were
caused by passing vessels, wave noise, and rustling vegetation.
Table 9. Summary of background noise level sample at Balls Point North, 9 August 2015.
LAeq,30mins LCpeak,30mins LA90,30mins
08:00 – 08:30 50.2 dB 91.6 dB 45.8 dB
08:30 – 09:00 49.3 dB 78.3 dB 45.5 dB
09:00 – 09:30 51.4 dB 84.8 dB 46.4 dB
09:30 – 10:00 50.3 dB 81.9 dB 46.0 dB
Background noise levels sampled at Point Judith are shown in Table 10. Noise levels were dominated
by the continuous wave noise on the pebbly shore.

33
Table 10. Summary of background noise level sample at Point Judith, 30 August 2015.
LAeq,30mins LAFmax LA90,30mins
09:00 – 09:30 62.0 dB 70.4 dB 58.7 dB
09:30 – 10:00 61.3 dB 72.9 dB 58.2 dB
3.3.2 Offshore
Background noise levels offshore were entirely dependent on the sea state and the orientation of the
vessel to the waves (Table 11). As the vessel was shut down for the duration of the measurement period,
the orientation was somewhat out of the control of the personnel on board. There was also some influence
from small creaks on the vessel and occasional radio transmissions, therefore the background LAeq should
be considered indicative and a valid LAFmax cannot be stated. For 25 August, the winds were calm and the
wave height <0.5 m (1.6 ft).
Table 11. August 25, 2015 Summary of background noise level sample offshore (excluding engines).
LAeq,10mins LAFmax LA90,10mins
16:00-16:10 53.3 dB n/a 49.8 dB
Table 12 displays noise levels measured on 19 September when the wind and wave conditions were
extremely calm and the sea, especially early in the sample, was glassy. The LA90 is approximately 7 dB
lower than under the slightly choppy conditions normally present during the survey. As previously,
influence from small vessel noises and radio transmissions cannot be excluded from the noise levels
calculated.
Table 12. 19 September 2015 Summary of background noise level sampled offshore (excluding engines).
LAeq,15mins LAFmax LA90,15mins
12:20–12:30, 12:45–12:50
56.6 dB n/a 42.5 dB
3.4 Monitoring Results
Measurements taken offshore using the SLM set up on the R/V McMaster during all of the piling events
are detailed in Table 13. Onshore measurements were taken for all piling events at the Southeast
Lighthouse on Block Island except for events on 19 September, where the monitor moved to Balls Point
North.
As the noise levels measured were variable from pile strike to pile strike, 30-second samples of
continuous piling noise were recorded. Levels were discounted if obviously affected by spurious noise
sources, such as a nearby vessel or aircraft passing. One second LAeq, LAFmax and LCpeak values were
selected from the higher levels sampled of the pile strikes over a measurement period. The reported value
typically was the second highest measured within the period to avoid the risk of spurious spikes. Short,
selective samples of pile strikes were used as longer periods were subject to variability in pile strike rate.

34
Table 13. Summary of piling event airborne noise measurements.
Transect ID Date Turbine
foundation Transect Direction
Ranges Time Wind
direction Wind speed
1 18-Aug-15 WTG 2 Northwest 450 m – 700 m
(1,476.4 ft – 2,296.6 ft) 15:53 – 16:11 SW 3–4.5 m/s
2 03-Sep-15 WTG 2 Northwest 550 m – 4.9 km
(1,804.5 ft – 3 mi) 09:56 – 10:20 WSW 3–3.5 m/s
3 03-Sep-15 WTG 2 East 640 m – 12.0 km
(2,099.7 ft – 7.5 mi) 11:14 – 15:11 WSW-S 3 m/s
4 17-Sep-15 WTG 5 Northwest 470 m – 5.3 km
(1,542 ft – 3.3 mi) 12:42 – 13:35 SW 3 m/s
5 17-Sep-15 WTG 5 Northwest 590 m – 5.3 km
(1,935.7 ft – 3.3 mi) 15:20 – 15:53 W 4 m/s
6 17-Sep-15 WTG 5 Northwest 420 m – 5.3 km
(1,378 ft – 3.3 mi) 16:39 – 17:21 W 3 m/s
7 18-Sep-15 WTG 3 Southeast 730 m – 6.0 km
(2,395 ft – 3.7 mi) 13.09 – 13:49 SW 2 m/s
8 18-Sep-15 WTG 3 Southeast 500 m – 6.4 km
(1,640.4 ft – 4 mi) 14:22 – 15:07 NW 3 m/s
9 19-Sep-15 WTG 1 North 710 m – 10.5 km
(2,329.4 ft – 6.5 mi) 08:37 – 08:55 NE Calm
10 19-Sep-15 WTG 1 North 3.9 km – 6.2 km
(2.4 mi – 3.9 mi) 15:29 – 15:52 S 2 m/s

35
The monitoring vessel had to move between locations, sometimes over significant distances. To ensure
that the offshore measurement periods overlapped with the onshore measure periods, the length of the
onshore measure period was appropriately extended. This somewhat selective technique was deemed
necessary to obtain the best quality comparable results because of the frequent presence of local non-
piling noise sources during the busy holiday period.
Two examples of piling event noise metric trends are provided. Coinciding 18 August LAeq, data histories
recorded at the R/V McMaster, the Southeast Lighthouse and Point Judith are shown in Figure 20. Three
initial pile strikes can be seen clearly at approximately 15:55, followed by a few sporadically before
continuous piling for three distinct periods over the next 20 minutes.
Piling can be detected in the lighthouse time history and was clearly audible, although it is frequently lost
in recreational light aircraft flybys (e.g., 15:53, 16:01). The noise level remains high at Point Judith
because of noise of waves on the shore. Subjectively, pile strikes were never audible at any time at Point
Judith.
Figure 21 shows a summary of the data captured along the east transect. Noise events of pile strikes were
recorded up to 12 km (7.46 mi) from the piling at WTG 2 on 3 September 2015. The chart clearly
displays three ‘blocks’ which correspond to survey vessel operation and so these represent engine noise
(i.e., self-noise), which can be discounted. The SLM was not shut down during these periods. The time
average assigned is 1 second for the LAeq metric.
The offshore time history shows a progressive reduction over time, and therefore distance, outside the
periods of transit and high engine noise. There is also a clear reduction in the noise level received at the
fixed lighthouse location at approximately 11:25, which cannot be explained but may be due to a
variation in wind conditions as there was no obvious change in piling in the logs.
Figure 20. Offshore Southeast Lighthouse and Point Judith LAeq,1s noise levels versus time recorded during pile driving of WTG 2 on 18 August 2015.
30
40
50
60
70
80
90
15:50:00 15:55:00 16:00:00 16:05:00 16:10:00 16:15:00 16:20:00
So
un
d L
ev
el, d
B
Time
Offshore LAeq
Lighthouse LAeq
Point Judith LAeq
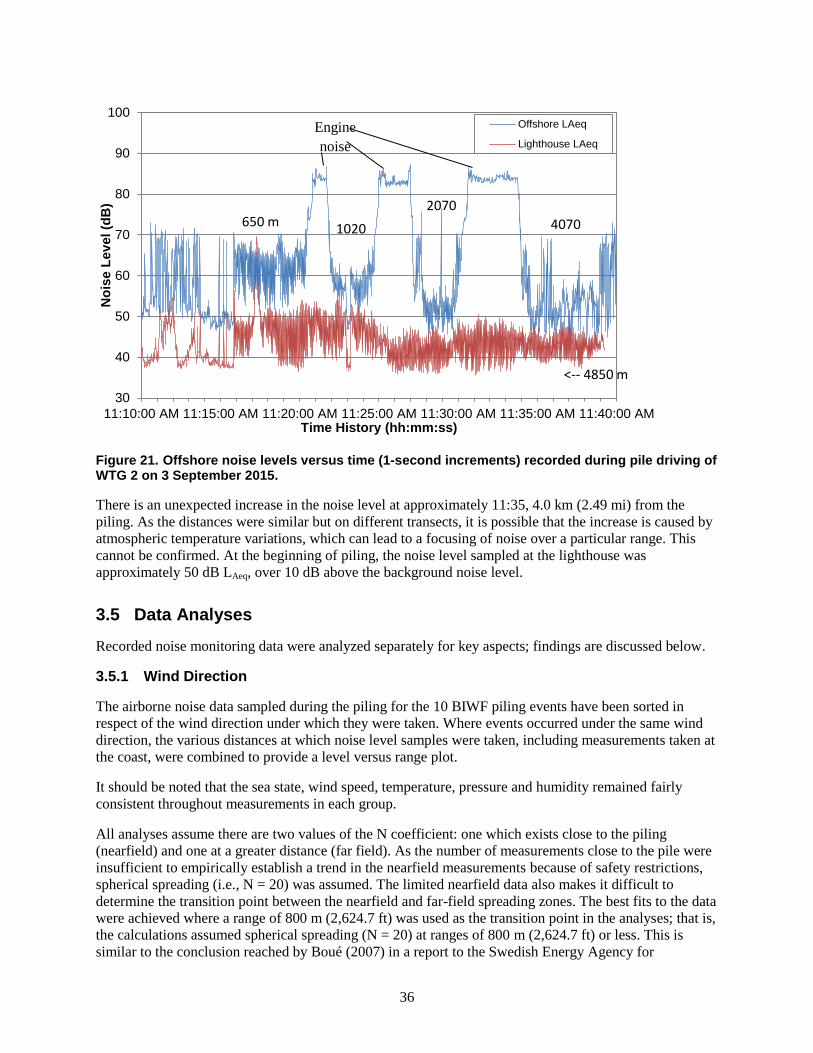
36
Figure 21. Offshore noise levels versus time (1-second increments) recorded during pile driving of WTG 2 on 3 September 2015.
There is an unexpected increase in the noise level at approximately 11:35, 4.0 km (2.49 mi) from the
piling. As the distances were similar but on different transects, it is possible that the increase is caused by
atmospheric temperature variations, which can lead to a focusing of noise over a particular range. This
cannot be confirmed. At the beginning of piling, the noise level sampled at the lighthouse was
approximately 50 dB LAeq, over 10 dB above the background noise level.
3.5 Data Analyses
Recorded noise monitoring data were analyzed separately for key aspects; findings are discussed below.
3.5.1 Wind Direction
The airborne noise data sampled during the piling for the 10 BIWF piling events have been sorted in
respect of the wind direction under which they were taken. Where events occurred under the same wind
direction, the various distances at which noise level samples were taken, including measurements taken at
the coast, were combined to provide a level versus range plot.
It should be noted that the sea state, wind speed, temperature, pressure and humidity remained fairly
consistent throughout measurements in each group.
All analyses assume there are two values of the N coefficient: one which exists close to the piling
(nearfield) and one at a greater distance (far field). As the number of measurements close to the pile were
insufficient to empirically establish a trend in the nearfield measurements because of safety restrictions,
spherical spreading (i.e., N = 20) was assumed. The limited nearfield data also makes it difficult to
determine the transition point between the nearfield and far-field spreading zones. The best fits to the data
were achieved where a range of 800 m (2,624.7 ft) was used as the transition point in the analyses; that is,
the calculations assumed spherical spreading (N = 20) at ranges of 800 m (2,624.7 ft) or less. This is
similar to the conclusion reached by Boué (2007) in a report to the Swedish Energy Agency for
30
40
50
60
70
80
90
100
11:10:00 AM 11:15:00 AM 11:20:00 AM 11:25:00 AM 11:30:00 AM 11:35:00 AM 11:40:00 AM
No
ise L
ev
el (d
B)
Time History (hh:mm:ss)
Offshore LAeq
Lighthouse LAeq
650 m 1020
2070
4070
<-- 4850 m
Engine
noise
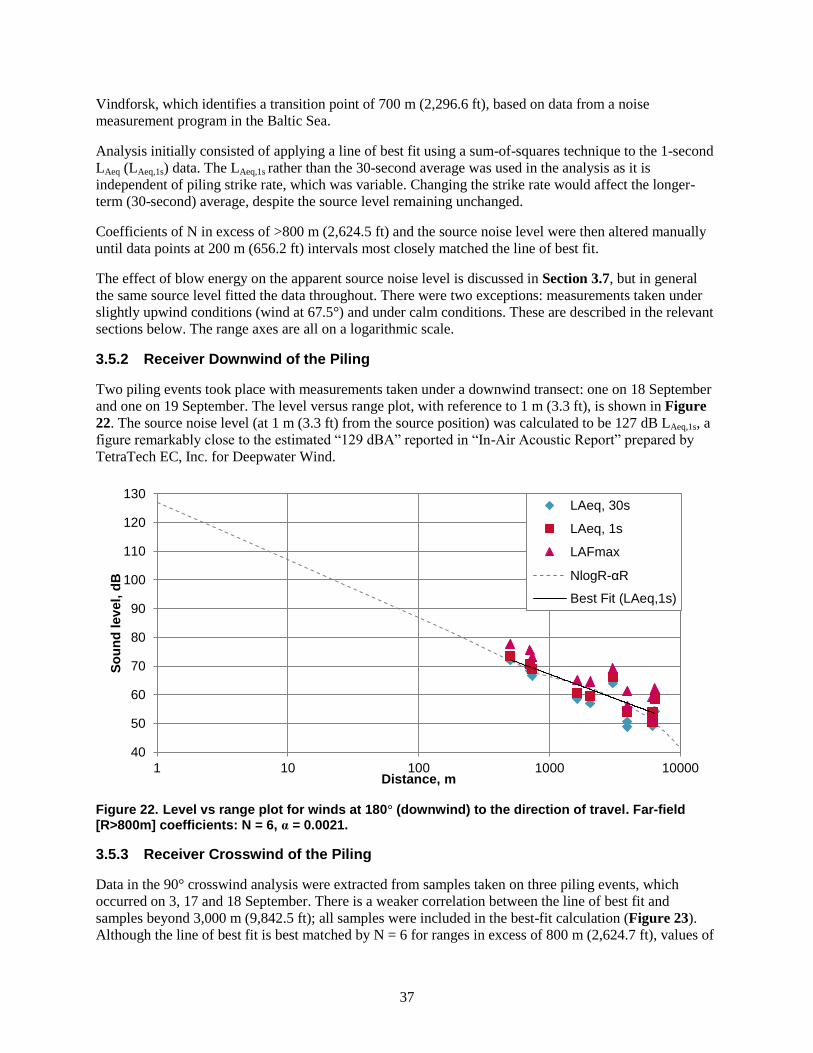
37
Vindforsk, which identifies a transition point of 700 m (2,296.6 ft), based on data from a noise
measurement program in the Baltic Sea.
Analysis initially consisted of applying a line of best fit using a sum-of-squares technique to the 1-second
LAeq (LAeq,1s) data. The LAeq,1s rather than the 30-second average was used in the analysis as it is
independent of piling strike rate, which was variable. Changing the strike rate would affect the longer-
term (30-second) average, despite the source level remaining unchanged.
Coefficients of N in excess of >800 m (2,624.5 ft) and the source noise level were then altered manually
until data points at 200 m (656.2 ft) intervals most closely matched the line of best fit.
The effect of blow energy on the apparent source noise level is discussed in Section 3.7, but in general
the same source level fitted the data throughout. There were two exceptions: measurements taken under
slightly upwind conditions (wind at 67.5°) and under calm conditions. These are described in the relevant
sections below. The range axes are all on a logarithmic scale.
3.5.2 Receiver Downwind of the Piling
Two piling events took place with measurements taken under a downwind transect: one on 18 September
and one on 19 September. The level versus range plot, with reference to 1 m (3.3 ft), is shown in Figure
22. The source noise level (at 1 m (3.3 ft) from the source position) was calculated to be 127 dB LAeq,1s, a
figure remarkably close to the estimated “129 dBA” reported in “In-Air Acoustic Report” prepared by
TetraTech EC, Inc. for Deepwater Wind.
Figure 22. Level vs range plot for winds at 180° (downwind) to the direction of travel. Far-field [R>800m] coefficients: N = 6, α = 0.0021.
3.5.3 Receiver Crosswind of the Piling
Data in the 90° crosswind analysis were extracted from samples taken on three piling events, which
occurred on 3, 17 and 18 September. There is a weaker correlation between the line of best fit and
samples beyond 3,000 m (9,842.5 ft); all samples were included in the best-fit calculation (Figure 23).
Although the line of best fit is best matched by N = 6 for ranges in excess of 800 m (2,624.7 ft), values of
40
50
60
70
80
90
100
110
120
130
1 10 100 1000 10000
So
un
d lev
el, d
B
Distance, m
LAeq, 30s
LAeq, 1s
LAFmax
NlogR-αR
Best Fit (LAeq,1s)

38
up to N = 12 show a progressive steepening of the curve which remains visually within the trend,
especially if the sample at 4.1 km (2.6 mi) is considered a spurious outlier.
Figure 23. Level vs range plot for winds at 90° to the direction of travel. Far-field coefficients [R>800 m (2,624.7 ft)]: N = 6, α = 0.0021.
It is suggested that there is likely to be greater variation in crosswind than under an entirely upwind or
downwind condition, as a small variation in direction would change the condition to a potentially upwind
or downwind situation. A slightly higher value of N would be reasonable, especially considering the
analysis for the 67.5° winds discussed in Section 3.5.4. There is also a confounding factor in that the
measurements taken on 3 September are under foggy conditions, which will affect the noise propagation
over long range and is likely to have influenced the outliers at 4-5 km (2.49–3.11 mi). The source level
remains at 127 dB LAeq,1s.
3.5.4 Receiver Upwind of the Piling
Most events occurred during measurements taken under winds with an upwind component. There were
two piling events where the wind was at 45° to the transect, both on 17 September, and data combined
show an excellent correlation to the line of best fit between 400 m (1,312.3 ft) and 5 km (3.1 mi) (Figure
24). The NlogR-αR points fit the line well at N = 12, i.e., a faster attenuation with distance than the
standard N = 10 for cylindrical spreading. This is to be expected, as the adverse winds lead to greater
reductions in noise. The source noise level remains as previously at 127 dB LAeq,1s.
The 67.5° transect, or just beyond crosswind conditions, was only sampled briefly over one event at four
points on 3 September; however, the line of best fit remains at N = 12 for R>800 m (2,624.7 ft) (Figure
25).
It is worth noting that for the event when the wind is at 67.5° from the direction of travel, the standard N
= 20 (R<800 m [(2,624.7 ft)]) and α coefficients only fitted the data when the apparent source level was
130 dB LAeq,1s. The data also would fit if the source level remained constant and the value of N in the near
field range reduced to 19; although, it seems more plausible that environmental conditions remain
consistent and there was an increase in the overall noise output during this event. Piling logs do not show
a notably high blow energy at this time (energy was 60 to 100 kilojoules (kJ) over this period, which is
representative of most sampled periods), and so the apparently higher source noise level may be caused
by the small sample size taken over this wind condition.
40
50
60
70
80
90
100
110
120
130
1 10 100 1000 10000
So
un
d L
ev
el, d
B
Distance, m
LAeq, 30s
LAeq, 1s
LAFmax

39
Figure 24. Level vs range plot for winds at 45° to the direction of travel. Far-field coefficients [R>800m]: N = 12, α = 0.0021.
Figure 25. Level vs range plot for winds at 67.5° to the direction of travel. Far-field coefficients [R>800 m (2,624.7 ft)]: N = 12, α = 0.0021.
3.5.5 Calm wind and Seas
On the final day of measurement, the wind dropped completely with flat, calm seas. Only one short
transect was possible under these conditions. Under entirely calm conditions, the propagation of noise in
the far-field behaved somewhat differently to all other wind and sea states. There appears to be no
significant transition from spherical (N = 20) to cylindrical (N ≈ 10) spreading, with the data sampled
between 700 m and 10 km (2,296.6 ft and 6.2 mi) fitting N = 19 (Figure 26). All other conditions (i.e.,
40
50
60
70
80
90
100
110
120
130
1 10 100 1000 10000
So
un
d L
ev
el, d
B
Distance, m
LAeq, 30s
LAeq, 1s
LAFmax
NlogR-αR
Best fit (LAeq,1s)
40
50
60
70
80
90
100
110
120
130
1 10 100 1000 10000
So
un
d L
ev
el, d
B
Distance, m
LAeq, 30s
LAeq, 1s
LAFmax
NlogR-αR

40
with any wind present) have much slower attenuations with N = 12 or less. This may be due to flat seas
scattering noise less and reflecting more to the atmosphere, or effects on the layering of the atmosphere.
Figure 26. Level vs. range plot for calm winds and seas. Far-field coefficients [R>800m]: N = 19, α = 0.00063.
The measurements under calm conditions also required a lower attenuation coefficient (α) of 0.00063,
instead of 0.0021 to keep the trend line from deviating from the measured noise levels.
As with the results where the wind is at 67.5° from the direction of travel, the standard N = 20 and α
coefficients only fitted the data when the source level was increased by 3 dB to 130 dB LAeq,1s. An
investigation of the piling logs showed that there was an increase in the blow energy at the time when the
two shortest range measurements (710 m and 1.6 km [2,329.4 ft and 1 mi]) were taken, and were nearly
double the energy for this short period. A higher source noise level was also noted in the results of the
concurrent underwater noise measurements, compared to other piling events on the same day.
A doubling of blow energy could reasonably represent a 3 dB increase in the source noise level, and so
applying a reduction of 3 dB to the first two data points reduces the best-fit line to a source level of
127 dB LAeq,1s, in consensus with the other wind condition trends, but the high N = 19 remains.
3.6 Frequency Spectra
All pile strikes will have a frequency signature, which will be dependent on factors including pile material
and dimensions, position, type and force of strike, seabed properties, and numerous others. For future
analyses, the most useful frequency data will be that taken close to the pile, as any variation over the
distance between source and receiver will be a function of the environment in which the noise travels.
This will affect every frequency band slightly differently, high frequencies generally being attenuated
more quickly than low frequencies.
While analysis of noise propagation in individual frequency bands will provide detailed and accurate data
for that specific band, it is considered more useful to analyze and present the data as single overall values,
particularly as almost all criteria used in environmental noise assessments are denoted in A-weighted
decibels. However, one-third octave band spectra have been acquired and can be reanalyzed at a later
date.
40
50
60
70
80
90
100
110
120
130
1 10 100 1000 10000
So
un
d L
ev
el, d
B
Distance, m
LAeq, 30s
LAeq, 1s
LAFmax
NlogR-αR

41
The frequency spectra for each piling event are provided in Appendix A of the Airborne Noise
Monitoring Technical Report (Appendix C). Below is a sample of the spectra under upwind, downwind,
and calm conditions.
3.6.1 Frequency Spectra Downwind
Taken on a southeast transect, with north-westerly winds at 3 m/s (Figure 27). Most of the energy
received in the strikes is at low frequency and primarily below 400 Hertz (Hz), although the spectra are
clearly broadband (non-tonal) in nature.
Figure 27. One-third octave band Lmax spectra taken under downwind conditions on 18 September 2015.
3.6.2 Frequency Spectra Upwind
The spectra were taken on a westerly transect, with a north-westerly wind (i.e. taken on 45° upwind
conditions). A sample was taken closer to the piling here than on the downwind sample in Figure 28.
After little more than 1 km (0.6 mi) most of the energy in frequency bands over 630 Hz has been lost. The
consistency between Figures 28 and 29 where the spectrum at 740/750 m (2,427.8/2,460.6 ft) both start
to drop off above 250 Hz.
3.7 Piling Blow Energy and Noise Source Levels
The airborne source noise level of the piling has been calculated based on a 20 logR + αR spreading
attenuation and using measurements made closest to the pile. An absorption coefficient of α = 2.1 has
been set based on the results presented in Section 3.5. Only airborne noise levels measured at 750 m
(2,460.6 ft) from the pile or less have been included in the analysis to reduce the influence of wind and
other far-field factors.
Figure 30 shows the results of the analysis by the distance from piling, to help identify any influence the
distance has on calculated source levels, i.e., noise levels normalized to 1 m (3.3 ft). Results are broken
down in the chart by hammer type: the Menck hydraulic hammer in blue (3 and 17 September, the last
two at 710 m (2,329.4 ft) on 19 September) and the Bauer-Pileco D280-22 diesel hammer in red (18
August).
30
40
50
60
70
80
90
63.0 125 250 500 1000 2000 4000 8000
So
un
d L
ev
el, L
ma
x (
dB
)
1/3 Oct Frequency (Hz)
6.4 km
3.0 km
2.1 km
1.6 km
740 m
500 m
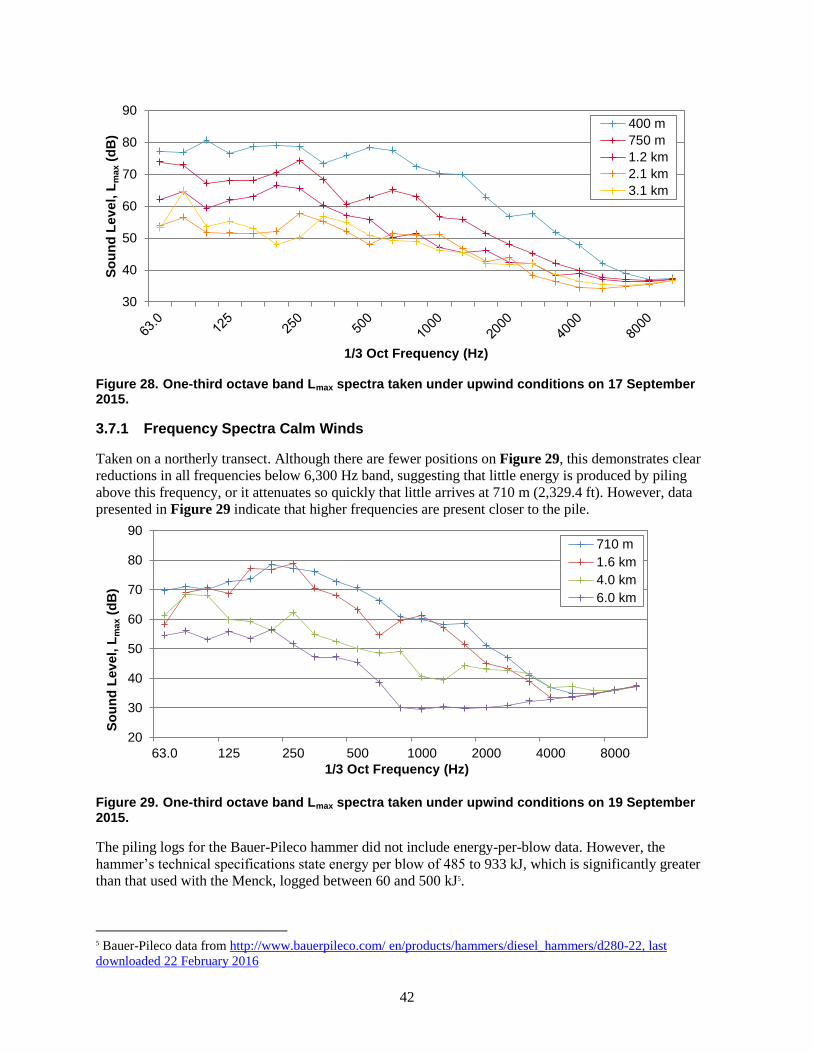
42
Figure 28. One-third octave band Lmax spectra taken under upwind conditions on 17 September 2015.
3.7.1 Frequency Spectra Calm Winds
Taken on a northerly transect. Although there are fewer positions on Figure 29, this demonstrates clear
reductions in all frequencies below 6,300 Hz band, suggesting that little energy is produced by piling
above this frequency, or it attenuates so quickly that little arrives at 710 m (2,329.4 ft). However, data
presented in Figure 29 indicate that higher frequencies are present closer to the pile.
Figure 29. One-third octave band Lmax spectra taken under upwind conditions on 19 September 2015.
The piling logs for the Bauer-Pileco hammer did not include energy-per-blow data. However, the
hammer’s technical specifications state energy per blow of 485 to 933 kJ, which is significantly greater
than that used with the Menck, logged between 60 and 500 kJ5.
5 Bauer-Pileco data from http://www.bauerpileco.com/ en/products/hammers/diesel_hammers/d280-22, last
downloaded 22 February 2016
30
40
50
60
70
80
90S
ou
nd
Lev
el, L
ma
x (
dB
)
1/3 Oct Frequency (Hz)
400 m
750 m
1.2 km
2.1 km
3.1 km
20
30
40
50
60
70
80
90
63.0 125 250 500 1000 2000 4000 8000
So
un
d L
ev
el, L
ma
x (
dB
)
1/3 Oct Frequency (Hz)
710 m
1.6 km
4.0 km
6.0 km

43
Figure 30. Scatter chart of calculated source noise levels from the diesel and hydraulic piling hammer.
The diesel hammer clearly shows higher calculated source noise levels, than the hydraulic hammer at 100
kJ, with the noise levels typically being above 130 dB LAeq,1s. With one exception, the hydraulic hammer
at lower energy produced source noise levels lower than 130 dB LAeq,1s. The high energy hydraulic
hammer strikes were some of the loudest at 134 to 136 dB LAeq,1s. Results show little correlation with
distance, except possibly a small downward trend, suggesting that the simple 20 logR + αR propagation
loss produces reasonable results over this range. Natural’ strike-to-strike variability in source level is
greater than the effects of range. It should be noted that the small collection of closest measurements
(approximately 400 m (1,312.3 ft)) are also among the highest. Also note that these three samples
occurred during soft start on 17 September at approximately 16:40. Slightly higher noise levels during
soft start also were noted in the underwater measurements, despite lower blow energies. The reason of
this is unknown.
It is possible that there are three ‘bands’ within the blue X results at 124 to 126 dB, 126 to 128 dB and
128 to 130 dB, with a gentle decline with range. The data points that make up these ‘bands’ are scattered
and do not follow a particular day, time or wind direction. The gentle decline could reflect a slightly
higher value of α that may in fact be more appropriate and investigations with the least-squares line of
best fit shows α = 0.009 provides the ‘flattest’ trend. This corresponds with a one-third octave band center
frequency of 1,600 Hz, which is much higher than where most of the energy is contained in the signal,
even at close range (refer to Section 3.6), and so this seems unlikely to be the explanation.
All results denoted with a blue X (in Figure 30) occurred with a blow energy of approximately 100 kJ.
The blue spots denoted energies of 300 or 450 kJ with the two results between 134 and 136 dB LAeq,1s at
the higher 450 kJ energy. It is notable that the results at 300 kJ did not appear to be significantly louder
than those at the typical lower 100 kJ, but the 450 kJ stood clearly out. The block of blue spot results in
excess of 700 m (2,296.6 ft) at approximately 128 dB LAeq,1s were all taken under downwind conditions
and so wind is unlikely to have caused any lowering effect.
120
122
124
126
128
130
132
134
136
138
140
0.30 0.40 0.50 0.60 0.70 0.80
Calc
ula
ted
so
urc
e s
ou
nd
lev
el, d
B L
Ae
q
Distance from pile, km
Diesel hammer
Hydraulic hammer, 100kJ
Hydraulic hammer, 300-450kJ

44
The Menck hydraulic hammer produced an arithmetic average source level of 127.4 dB LAeq,1s and the
diesel hammer averaged 132.2 dB LAeq,1s. In the absence of any explanation for the variation in noise
emission with the same hammer under the same energy, there appears to be a ‘natural’ noise level spread
of ± 3 dB across each hammer type.
3.8 Discussion
The data acquired during the surveys generally follow the expected trend for far-field noise propagation,
with a transition from spherical to cylindrical spreading, and more rapid attenuation with distance in
upwind conditions. Table 14 provides a summary of the coefficients that best fit the measured data under
different wind conditions. Note that 0° would denote upwind conditions, 180° denotes downwind
conditions and the transition between nearfield and far-field is at 800 m (2,624.7 ft) from the pile.
Table 14. Summary of noise attenuation coefficients under different wind and sea conditions.
Wind bearing Nearfield N value
Far-field N value
Absorption coefficient, α
45° 20 12 0.0021
67.5° 20 12 0.0021
90° 20 6 0.0021
180° 20 6 0.0021
Calm 20 19 0.00063
The data fits the theory well, with greater than cylindrical spreading (N = 10) under upwind conditions
and lower than cylindrical spreading downwind. Also, perhaps surprisingly, the data under crosswinds
(90°) shows a better agreement with the line of best fit where N is equivalent to that of downwind
spreading. However, correlation with the line of best fit under crosswinds is weaker than with the upwind
or downwind conditions and so the confidence in this conclusion is somewhat lower.
Noise levels normalized by distance from piling showed that the diesel hammer was louder than the
hydraulic hammer (at 100 kJ) by an average of 5 dB, which agrees with subjective observations by the
surveyor at the Southeast Lighthouse. The average calculated source noise level for the diesel hammer
was 132 dB LAeq,1s at
1 m (3.3 ft), compared with the hydraulic hammer at 127 dB LAeq,1s
at
1 m (3.3 ft)
based on measurements between 400 and 750 m (1,312.3 and 2,460.6 ft). There was no clear correlation
between source noise level and blow energy for the hydraulic hammer at blow energies 300 kJ and under.
However, an average source noise level of 135 dB LAeq,1s at
1 m (3.3 ft) was calculated where the blow
energy increased to 450 kJ. No blow energy data for the diesel hammer was available but generic
specifications for it show its minimum blow energy was similar to the maximum used for the hydraulic
hammer.
The offshore background noise level, at between 42 dB and 50 dB LA90 (depending on sea state) was in
general sufficiently below the measured piling noise impulses so as not to influence the measured levels,
up to the order of 6,000 m (19,685 ft) from the pile. Beyond that range there tends to be a small upward
deviation from the NlogR-αR line, which could indicate that the received noise levels are close to
background. Most measurements, however, are closer to the piling than this.
To simplify the assessment, only an overall A-weighted value for the received noise levels and a single-
figure value of α has been used, rather than the more robust technique of breaking down the individual
frequency components of the measured noise levels. A deeper analysis of the data would provide more
accurate conclusions, as the value of α would no longer be a selection. However, this simplified approach
has produced good agreement with the measured results across a long range.

45
This study primarily utilized A-weighted metrics, in keeping with international standards for the
assessment of airborne environmental noise. The A-weighting of noise is designed to correct for the
sensitivity of human hearing. The effect of this is to reduce the significance of noise frequencies
progressively below and above 2,000 Hz, as this is the frequency of peak sensitivity. This avoids any
undue emphasis on very low (and very high) frequencies to which humans are not sensitive. The analysis
of the frequency data for the samples of piling noise show that most of the energy in the received noise
levels at a distance is dominated by low frequencies.
The consequence of this is that the A-weighting effectively attenuates some of the energy in the received
noise levels and this is a consequence of the standards used across most environmental noise assessments.
Despite this, the fact that the data do appear to follow the theory suggests that the A-weighting does not
eliminate useful information.
For future studies, it may be worth investigating the data in terms of a criterion that takes better account
of low frequency characteristics, such as the C-weighting, an unweighted metric or investigation of a
single frequency band. However, this may be of limited use when it comes to comparison with
environmental criteria and it is recommended that the A-weighting continue to be the primary metric in
the airborne data analysis.
3.9 Conclusions
The results of measurements of the airborne noise emission during piling and its propagation have been
analyzed. In general, wind speed, humidity, temperature and sea states were reasonably consistent over
the measurement periods, although the wind direction was changeable. The measurements demonstrate
variations depending on the environmental conditions, with the main difference in noise propagation
caused by changes in the wind direction relative to the direction of travel on the measurement transects.
The propagation of noise from the piling over water will change from a roughly spherical to cylindrical
spreading pattern at a distance, but the location of this transition point is hard to identify. Access was
restricted closer than 500 yards (457.2 m [1,500.2 ft]) from piling activities for safety reasons, limiting
more detailed examination of this aspect. It is also reasonable to assume that there is no single transition
‘point’ and the change will be progressive over a range. This range will be dependent on environmental
factors, particularly the wind direction. However, based on the information available the transition is
estimated to occur approximately 800 m (2,624.7 ft) from the pile.
Extrapolations from measurements at a distance show a noise pressure level of approximately 127 dB
LAeq,1s re 20 µPa calculated at 1 m (3.3 ft) from the pile, treating the piling as an effective point source
when viewed from a long distance. Because of the limited measurements within the 500-yard (457.2 m
[1,500 ft]) exclusion zone around the piling, there is significant uncertainty (± 3 dB) in this figure.
An estimate of the value of the geometric spreading loss was estimated for different relative wind
directions within the cylindrical spreading zone. Measurements over long distance clearly demonstrated
higher noise levels under downwind conditions than when the wind was against the direction of travel.
One short opportunity was available to sample noise propagation over water in flat calm conditions and
measurements were taken between 710 m and 10 km (2,329.4 ft and 6.2 mi) from the source. Analysis of
the results suggest that even a modest increase in sea state will have an effect on the propagation of
airborne noise over water. The noise was also affected on the one day where conditions were foggy,
which is reasonable to expect because of effect of humidity on noise attenuation.
Noise from piling was always clearly audible at the Southeast Lighthouse, 4.8 km (3 mi) away, and
sometimes just audible at Balls Point North at 11.3 km (7 mi) under ideal conditions. At the lighthouse,
noise levels were measured at over 50 dB LAeq,1s, more than 10 dB above background noise levels,

46
which were typically of the order of 39 dB LA90 and dominated by rustling vegetation. Piling noise was
never audible at Point Judith; although background noise levels were substantially raised by wave noise
on the shore at Point Judith, no noise could be heard in breaks in wave noise nor would it be expected to
be audible at this distance based on the audibility at sea. However, it is possible under certain
environmental conditions that greater noise projection could occur.
While substantial data was acquired during piling for the foundations at Block Island Wind Farm, only a
small number of repeated transects were possible, and most under similar environmental conditions (i.e.,
daytime, summer, clear, dry, temperature and humidity). Further investigations of offshore piling noise
over water would ideally be under different conditions and it is likely that these would be available in a
different location or time of year. The greatest data gaps exist for airborne noise measurements at close
range, i.e. within the 500-yard (457.2 m [1,500 ft] security exclusion zone and at a greater range,
particularly in excess of 8,000 m (26,246.7 ft). In addition, it was not possible to take samples of the noise
level as it propagates long range over land, and so it would be useful to attempt to identify any changes in
the propagation in the transition from water to land.
3.10 Summary
Airborne noise levels have been sampled during the installation of the foundation piles for the Block
Island Wind Farm in August and September 2015. Measurement stations were located at three coastal
locations facing BIWF and on a mobile survey vessel that transited on transects around the foundations
during piling.
A total of 10 piling events were sampled, with a piling event consisting of a single period of pile driving
of approximately 30 minutes in duration. Pile strikes were typically 2 to 3 seconds apart. Conditions
during the surveys were ideal for environmental noise measurement, sunny and dry, with temperatures at
approximately 25 degrees Celsius (77 degrees Fahrenheit) and relative humidity 80 percent remaining
fairly consistent day to day. Wind direction was variable, but typically remained between 2 and 4 m/s.
Seas were less than 1 m (3.3 ft) and usually between 0.3 and 0.9 m (0.9 and 3 ft). Completely calm
conditions were present during one piling event. All measurements were undertaken in daylight hours.
Noise during piling was always audible at the closest coastal measurement station, 5 km (3.1 mi) from the
offshore wind farm. At the furthest location, 27 km (17 mi) from the piling, the noise was never audible.
A mid-point coastal location at 11 km (7 mi) from the piling was visited for a short period and it was
found that the piling was only intermittently audible under totally calm conditions, with minimal
background noise, and no longer audible shortly afterwards under light, downwind conditions.
The mobile measuring station on a survey vessel sampled noise levels at various distances from the
piling, between 420 m (1,378 ft) at the closest and 12 km (7.5 mi) at the furthest. No measurements were
possible closer to the piling than this for safety reasons.
The measured noise levels were used to calculate the rate at which the noise attenuates over water. It was
found that noise attenuated independently of any weather conditions in a spherical manner, i.e., 20 log(R)
or a 6 dB attenuation per doubling of distance, up to approximately 800 m (2,624.7 ft) from the source,
where R is the distance in meters from the pile. Beyond that point, the attenuation changed to a cylindrical
pattern and wind direction was critical, with attenuations of 6 log(R) under downwind conditions and 12
log(R) under upwind conditions best fitting the measured data. An attenuation of 6 log(R) best fitted the
crosswind condition data, although the received noise levels showed a poorer correlation with the line of
best fit and so there is consequently a lower confidence in this value.
The attenuation changed significantly under calm conditions, demonstrating approximately spherical
spreading in both the near and far-field. Measurements were possible up to 6 km (3.7 mi) from the
foundation; only a single event in these conditions could be sampled.

47
Frequency spectra of the measurements showed that most of the energy in the received pulses was below
the 630 Hz one-third octave band at distances up to 400 m (1,312.3 ft) from the piling, and below 250 Hz
at distances beyond 2 km (1.3 mi).
Future studies should attempt to investigate noise levels closer to the pile to verify the initial spherical
spreading assumption and improve confidence in the source noise levels. It is likely the source noise level
will change with the piles and piling equipment in use, so this is important to bear in mind with the
variety of foundations currently in use or proposed for offshore wind turbines. Close range measurements
could be done either by vessel, where safe to do so, or by potentially setting up an SLM on the deck of the
piling barge.
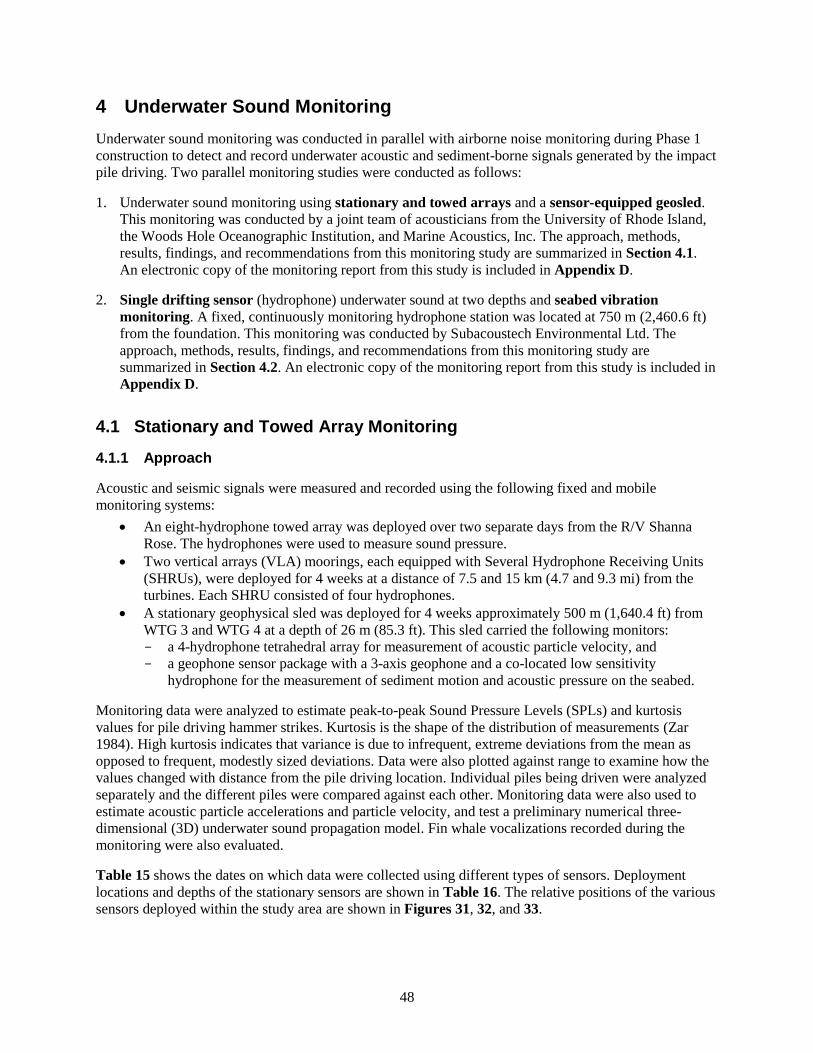
48
4 Underwater Sound Monitoring
Underwater sound monitoring was conducted in parallel with airborne noise monitoring during Phase 1
construction to detect and record underwater acoustic and sediment-borne signals generated by the impact
pile driving. Two parallel monitoring studies were conducted as follows:
1. Underwater sound monitoring using stationary and towed arrays and a sensor-equipped geosled.
This monitoring was conducted by a joint team of acousticians from the University of Rhode Island,
the Woods Hole Oceanographic Institution, and Marine Acoustics, Inc. The approach, methods,
results, findings, and recommendations from this monitoring study are summarized in Section 4.1.
An electronic copy of the monitoring report from this study is included in Appendix D.
2. Single drifting sensor (hydrophone) underwater sound at two depths and seabed vibration
monitoring. A fixed, continuously monitoring hydrophone station was located at 750 m (2,460.6 ft)
from the foundation. This monitoring was conducted by Subacoustech Environmental Ltd. The
approach, methods, results, findings, and recommendations from this monitoring study are
summarized in Section 4.2. An electronic copy of the monitoring report from this study is included in
Appendix D.
4.1 Stationary and Towed Array Monitoring
4.1.1 Approach
Acoustic and seismic signals were measured and recorded using the following fixed and mobile
monitoring systems:
An eight-hydrophone towed array was deployed over two separate days from the R/V Shanna
Rose. The hydrophones were used to measure sound pressure.
Two vertical arrays (VLA) moorings, each equipped with Several Hydrophone Receiving Units
(SHRUs), were deployed for 4 weeks at a distance of 7.5 and 15 km (4.7 and 9.3 mi) from the
turbines. Each SHRU consisted of four hydrophones.
A stationary geophysical sled was deployed for 4 weeks approximately 500 m (1,640.4 ft) from
WTG 3 and WTG 4 at a depth of 26 m (85.3 ft). This sled carried the following monitors:
- a 4-hydrophone tetrahedral array for measurement of acoustic particle velocity, and
- a geophone sensor package with a 3-axis geophone and a co-located low sensitivity
hydrophone for the measurement of sediment motion and acoustic pressure on the seabed.
Monitoring data were analyzed to estimate peak-to-peak Sound Pressure Levels (SPLs) and kurtosis
values for pile driving hammer strikes. Kurtosis is the shape of the distribution of measurements (Zar
1984). High kurtosis indicates that variance is due to infrequent, extreme deviations from the mean as
opposed to frequent, modestly sized deviations. Data were also plotted against range to examine how the
values changed with distance from the pile driving location. Individual piles being driven were analyzed
separately and the different piles were compared against each other. Monitoring data were also used to
estimate acoustic particle accelerations and particle velocity, and test a preliminary numerical three-
dimensional (3D) underwater sound propagation model. Fin whale vocalizations recorded during the
monitoring were also evaluated.
Table 15 shows the dates on which data were collected using different types of sensors. Deployment
locations and depths of the stationary sensors are shown in Table 16. The relative positions of the various
sensors deployed within the study area are shown in Figures 31, 32, and 33.

49
Table 15. Underwater acoustic monitoring summary.
Sensor Type
18 A
ug
30 A
ug
1 S
ep
t
2 S
ep
t
3 S
ep
t
17 S
ep
t
18 S
ep
t
19 S
ep
t
12 O
ct
13 O
ct
14 O
ct
15 O
ct
16O
ct
17 O
ct
18 O
ct
19 O
ct
20 O
ct
21 O
ct
22 O
ct
23 O
ct
24 O
ct
25 O
ct
26 O
ct
Towed Array √ √
Vertical Line Arrays
√ √ √ √ √ √ √ √ √ √ √ √ √ √ √
Geophysical Sled
√ √ √ √ √ √ √ √ √ √ √ √ √ √ √
Note: Pile driving was completed on 26 October 2015; stationary moorings were retrieved on 4 November 2015, which provided one week of post-construction ambient background sound measurements.
Table 16. Stationary sensors locations and depth.
Mooring Latitude
(Degrees N)
Longitude
(Degrees W)
Depth
Geophysical Sled (with Geophone 917 and Tetrahedral Array 918)
41.1110 71.5225 26 m (85.3 ft)
VLA SHRU 913 41.0127 71.4044 40 m (131.2 ft)
VLA SHRU 919 41.0664 71.4590 41 m (134.5 ft)
Note: The 750 m (2,460.6 ft) fixed monitoring station was conducted in conjunction with the dipped hydrophone measurement transect and its location was in line with the direction of travel during that pile installation.
Figure 31. Overview of the various measurements of acoustic and seismic signals from pile driving for the Block Island Wind Farm along with nominal ranges.

50
Figure 32. Pile driving underwater sound monitoring summary.

51
Figure 33. Field work description (left) and summary of geophysical sled, vertical hydrophone array and towed hydrophone array tracks (right).
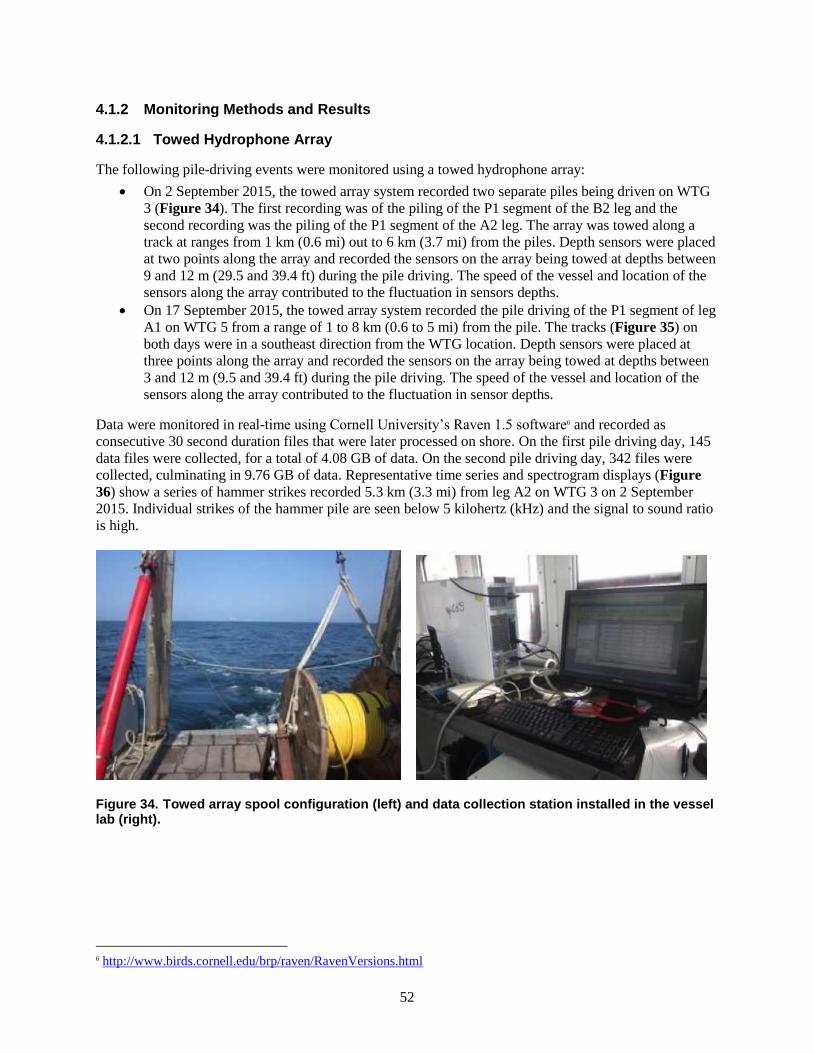
52
4.1.2 Monitoring Methods and Results
4.1.2.1 Towed Hydrophone Array
The following pile-driving events were monitored using a towed hydrophone array:
On 2 September 2015, the towed array system recorded two separate piles being driven on WTG
3 (Figure 34). The first recording was of the piling of the P1 segment of the B2 leg and the
second recording was the piling of the P1 segment of the A2 leg. The array was towed along a
track at ranges from 1 km (0.6 mi) out to 6 km (3.7 mi) from the piles. Depth sensors were placed
at two points along the array and recorded the sensors on the array being towed at depths between
9 and 12 m (29.5 and 39.4 ft) during the pile driving. The speed of the vessel and location of the
sensors along the array contributed to the fluctuation in sensors depths.
On 17 September 2015, the towed array system recorded the pile driving of the P1 segment of leg
A1 on WTG 5 from a range of 1 to 8 km (0.6 to 5 mi) from the pile. The tracks (Figure 35) on
both days were in a southeast direction from the WTG location. Depth sensors were placed at
three points along the array and recorded the sensors on the array being towed at depths between
3 and 12 m (9.5 and 39.4 ft) during the pile driving. The speed of the vessel and location of the
sensors along the array contributed to the fluctuation in sensor depths.
Data were monitored in real-time using Cornell University’s Raven 1.5 software6 and recorded as
consecutive 30 second duration files that were later processed on shore. On the first pile driving day, 145
data files were collected, for a total of 4.08 GB of data. On the second pile driving day, 342 files were
collected, culminating in 9.76 GB of data. Representative time series and spectrogram displays (Figure
36) show a series of hammer strikes recorded 5.3 km (3.3 mi) from leg A2 on WTG 3 on 2 September
2015. Individual strikes of the hammer pile are seen below 5 kilohertz (kHz) and the signal to sound ratio
is high.
Figure 34. Towed array spool configuration (left) and data collection station installed in the vessel lab (right).
6 http://www.birds.cornell.edu/brp/raven/RavenVersions.html

53
Note: Track 1 relates to the first recording of pile driving on this day and Track 2 relates to the second recording. Decimal degrees of latitude and longitude correspond to the vertical and horizontal axes respectively.
Figure 35. Track lines from 2 September 2015 (left); track lines from 17 September 2015 (right).

54
Figure 36. Time series (left) and spectrogram (right color bars show decibel rms) taken from a 30-second file, with x-axis as local time, when the vessel was 5.25 km (3.3 mi) from pile driving of leg A2 on WTG 3 on 2 September 2015.

55
The peak-to-peak SPL level (RL) and kurtosis values were determined for each hammer strike. Kurtosis is
the shape of the distribution of measurements (Zar 1984). It is calculated from a scaled version of the
fourth power of the deviations from mean, giving a unitless quantity (Zar 1984, p. 82 Equation 7.13).
High kurtosis indicates that variance is due to infrequent, extreme deviations from the mean as opposed to
frequent, modestly-sized deviations. These metrics were plotted against range to examine how the values
changed with distance from the pile driving location. Each pile driving recording was analyzed separately
and then compared.
Preliminary results from the analysis show that all channels on the hydrophone array functioned as
expected and collected data for the entire deployment. Figure 37 presents calculations of the peak to peak
received level for all of the hammer strikes from the three pile driving recordings. The blue dots represent
the hammer strikes from the pile driving on WTG 5 recorded on 17 September and the black and red dots
represent the data from 2 September for WTG 3. The depth of the array on 17 September was between 3
to 12 m (39.4 ft) and the depth of the array on September 2 was between 9 and 12 m (29.5 and 39.4 ft).
The received levels for each day exhibit a similar trend where the received level decreases as the range
from the pile driving increases. The outliers with received levels at approximately 140 dB at distances
between 2 and 4 km (1.2 and 2.5 mi) in the 17 September data are being investigated as part of the
ongoing analysis.
Figure 37. Peak to peak received level calculated for all of the hammer strikes from the three different pile driving recordings plotted against distance of the array from the turbine.
Figure 38 presents calculations of kurtosis for the pile driving of segment P1 on leg A1 from WTG 5 that
was recorded on 17 September 2015. The trend toward decreased kurtosis with range is suggestive that
this metric can be applied successfully to field data to better characterize the temporal nature of the
received signals. However, further analyses and replication are needed.

56
Note: additional detailed analyses of the towed array monitoring data are still ongoing and updated results will be presented in one or more peer-reviewed technical publications at a future date.
Figure 38. Kurtosis calculated using 17 September 2015 data, presented as a function of distance from WTG 5.
4.1.2.2 Vertical Array SHRUs
Two vertical sound pressure hydrophone array moorings with SHRUs (Several Hydrophone Receiving
Units) were deployed at 7.5 and 15 km (4.7 and 9.3 mi) from the turbines. The mooring configuration is
shown in Figure 39. Each array had four hydrophones; the top and third hydrophones had a normal gain
of 26 dB, while the second and bottom phones had a lower gain of 6 dB. The different gains were used to
assure that the peak pressure from the pile driving would not clip the received signals.
An example time series of the acoustic pile-driving signal recorded with the VLA is shown in Figure 40.
In the top panel, a single pile-driving recording is shown from SHRU 913 deployed at 7.5 km (4.7 mi)
from WTG 3. While some clipping is evident in the high gain hydrophones, none was experienced with
the low gain channel.

57
Figure 39. Mooring design for the 7.5 km (4.7 mi) and 15 km (9.3 mi) vertical hydrophone arrays.

58
Note: While some clipping is evident in the high gain hydrophones, the low gain hydrophone (lower time series shows no clipping.
Figure 40. A recording of pile driving signals is shown from SHRU 913 deployed at 7.5 km (4.7 mi) from WTG 3; the duration of the recording is 1 minute 45 seconds with approximately 2 seconds between each strike.
4.1.2.3 Geophysical Sled
A geophysical sled with a 4 sound pressure hydrophone tetrahedral array (for measurement of acoustic
pressure and particle velocity near the seabed) and a 3-axis geophone with low sensitivity sound pressure
hydrophone (for the measurement of sediment motion and acoustic pressure on the seabed) was deployed
approximately 500 m (1,640.4 ft) from WTG 3 and 4 at 41o 6’ 39.7152” N latitude 71
o 31’ 21.0258” W
longitude in approximately 26 m (85.3 ft) of water (Figure 41). The sound pressure hydrophones had a
spacing of 0.5 m (1.6 ft). In Figure 41, the right panel shows the surface floats for the geophysical sled;
the middle and left panel shows the geophysical sled before deployment.
When the sled was deployed, it landed on its side (Figure 42). However, the photograph taken by a
GoPro camera mounted on the bow of the sled showed that the hydrophone array maintained its
tetrahedral shape.
Tetrahedral Array Results – An example spectrogram of the data collected on one of the sound pressure
channels of the tetrahedral array is shown in the left panel of Figure 43. The x-axis for both plots is
referenced to an arbitrary start time. The peak-to-peak SPL for these signals was approximately 185 dB re
1 μPa. The array was deployed approximately 500 m (1,640.4 ft) from WTG 3 and 4 in approximately 26
m of water. Pile-driving signals from 25 October 2015 from all four hydrophones of the tetrahedral array
are shown in the right panel. Data from tetrahedral array 500 m (1,640.4 ft) from pile driving is to be used
to calculate particle velocity for fish studies (Potty et al. 2018).

59
Figure 41. Images of the geophysical sled before deployment (left and center). These two photographs show the tetrahedral array of hydrophones with a spacing of 0.5 m (1.6 ft). Photo of the surface floats for the sled with WTG 4 in the background (right).
Figure 42. An underwater photo captured via a GoPro camera mounted on the bow of the sled shows the tetrahedral array of hydrophones is maintained despite the sled landing on its side.

60
As noted earlier, for the hammer strike data shown in Figure 43, the peak-to-peak SPL at the sled was
found to be approximately 185 dB re 1 μPa. Assuming only spherical spreading attenuation form source
to receiver, the peak-to-peak source level of the pile driving signal was estimated to be approximately 239
dB re 1 μPa at 1 m (3.3 ft).
The acoustic particle accelerations can be computed from the gradient of the acoustic pressures using
the following equation:
The particle velocity can be estimated from the above equation by numerically integrating the particle
accelerations. An example of the particle acceleration and velocity calculated for a hammer strike is
shown in Figure 44.
3D Geophone Results – An example of the data from the 3-axis geophone deployed off the geophysical
sled is shown in Figure 45. The figure shows the particle velocity along vertical and two horizontal
directions (left panel) and pressure (right panel) generated by a single impact pile driving at a range of
500 m (1,640.4 ft)from WTG 3 and 4. These data were recorded on 25 October 2015 at approximately
2:58 p.m. The pile driving signals had a high signal-to-noise ratio, no clipping, and the time series has
complexity that may be ascribed to the pile driving mechanisms. The velocities are shown in mm/s and
the pressure in kPa. The peak–to–peak SPLs are comparable to the levels measured in the hydrophones in
the tetrahedral array. The magnitudes of the velocities are higher compared to values calculated using the
tetrahedral array data. This will be discussed later in this section.
Figure 46 shows two clips of sound data (time on the x-axis is arbitrary) with the particle velocity
magnitude of the total velocity (vector sum) in dB re nm/s measured at the seabed using the geophone
(left panel). Right panel shows the particle velocity in the water column (same units), 1 m (3.3 ft) from
the seabed, calculated using the tetrahedral array data. There is an approximate 10 dB difference in peak
velocities (dB re nm/s).
The spectral distribution of the energy in the geophone and co-located hydrophone is shown in Figure 47.
The difference in frequency content between the hydrophone and geophone response is apparent in the
figure. This indicates that the response of the geophone and hydrophone are possibly dominated by
different wave types. The geophones measure the ground motions whereas the tetrahedral array estimates
the particle velocities above the ground in the water column (approximately 1 m (3.3 ft) from the bottom).
The single sound pressure hydrophone measures the compressional waves in the water whereas the
geophone measures the motion generated by shear and interface (Scholte) waves in addition to the motion
associated with compressional waves. Particle motions produced by interface waves (Scholte waves) are
likely to dominate the geophone signal. These motions decay exponentially away from the interface
(seabed).
Previous studies have shown that signals recorded on seismic sensors on the seafloor are found to be more
complicated than on co-located hydrophones (Bibee 2011). The differences were attributed to the
response of the seismometer sensors to shear waves in the seafloor and interface waves at the water-
sediment boundary. It is conjectured that differences between particle velocities measured at the bottom
and in the water column can be different because shear and interface waves can contribute (in addition to
compressional waves) in the sediment medium as opposed to compressional waves alone in the water
medium.
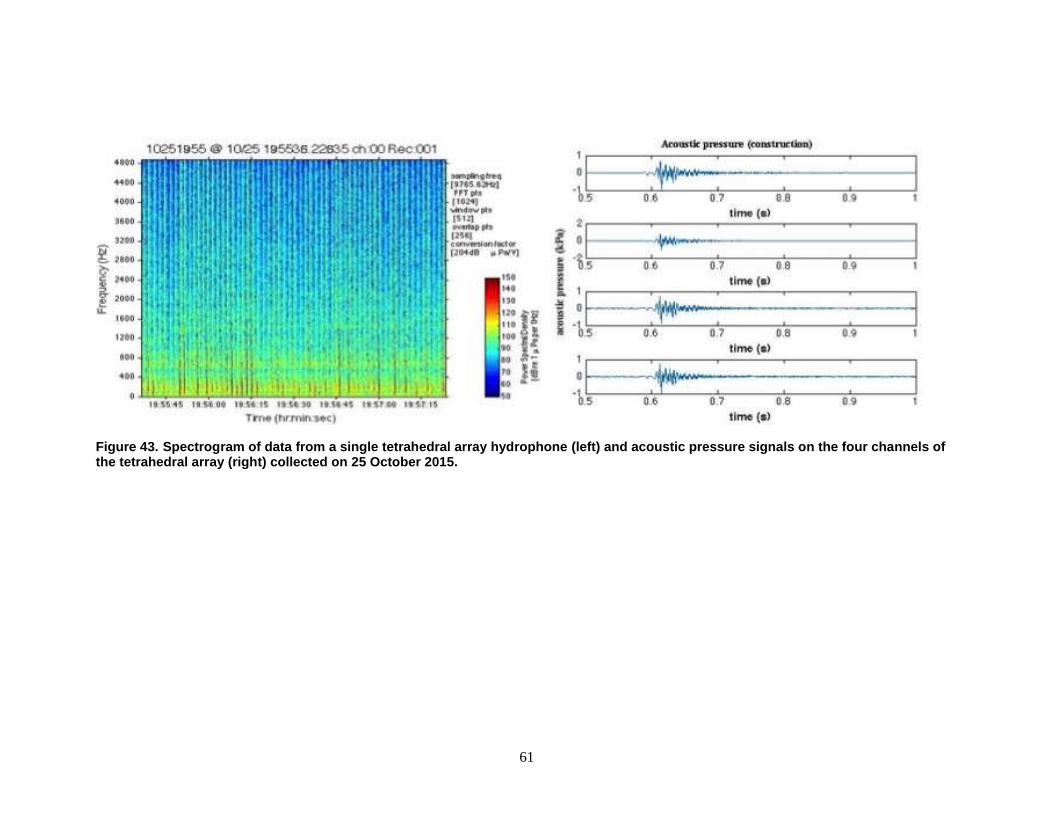
61
Figure 43. Spectrogram of data from a single tetrahedral array hydrophone (left) and acoustic pressure signals on the four channels of the tetrahedral array (right) collected on 25 October 2015.

62
Figure 44. Particle velocity calculated from the sound pressure gradients for one hammer strike. Left panel shows the values in mm/s and the right panel shows the magnitude of the total velocity (vector sum) in dB re nm/s.
Figure 45. An example of the particle velocity data (in mm/s in three mutually perpendicular directions) from the 3-axis geophone deployed off the geophysical sled (left panel). Right panel shows the acoustic pressure measured by the hydrophone co-located with the geophone.

63
Figure 46. Particle velocity magnitude of the total velocity (vector sum) in dB re nm/s measured by the geophone (left panel). Right panel shows the magnitude of the total velocity (vector sum) calculated from the tetrahedral array data. Note that the start times (x-axis) are arbitrary.

64
Figure 47. Spectra of the particle velocity (red) and acoustic pressure (blue) measured on the seabed using the co-located geophone and hydrophone. Note that the amplitudes are normalized using the peak values. The difference in frequency content between the hydrophone and geophone response is apparent.
4.1.3 Acoustic 3D Modeling
4.1.3.1 Previous Studies/Results
There have been several offshore wind farms constructed in Europe and underwater sound monitoring is
typically undertaken during the construction phase to monitor underwater sound levels. Betke (2006) and
his colleagues at ITAP in Oldenberg, Germany measured sound from construction and operation of a
monopile wind turbine. In particular, they showed the variability of radiated sound from the turbine with
various power production levels and wind speeds as shown in Figure 48.
Reinhall and Dahl (2011) have reported on modeling and measurement of vertical pile driving. They
reported that when the hammer strikes the pile, a compression wave produces a local radial deformation
because of Poisson’s effect. This radial deformation propagates down the pile. The speed of the wave in
the steel shell of the pile that is surrounded by water is approximately 5,015 m/s and much greater than
water sound speed of 1,500 m/s. The pile driving creates a Mach wave in the water and sediment with an
angle of 17o from the vertical. This phenomenon is displayed in Figure 49.
Kim et al. (2012) and Kim (2014) modeled the effect of pile driving on an elastic seabed. The higher the
angle of the Mach wave, the more energy is absorbed by the seafloor. Figure 50 shows Kim’s (2014)
results and the resultant compressional wave in the water and bottom, shear wave in the bottom and
interface wave at the seafloor.
65
Figure 48. Measurement setup as described by Betke (2004) for monitoring underwater sound from an offshore wind turbine in water 10 m (32.8 ft) deep (left). One-third octave band levels measured 110 m (360.9 ft) from the turbine for different operating conditions (right). Wind speeds are measured at the hub height.

66
Figure 49. Reinhall and Dahl (2011) modeled the creation of an acoustic wave in the water from a vertical pile. The speed of the wave in the pile is approximately 5,015 m/s and much greater than the water sound speed of approximately 1,500 m/s. This creates a Mach wave which propagates at an angle of approximately 17
o from the vertical.
Note: The water depth is approximately 12 m (39.4 ft) and chosen to match the scenario modelled in Reinhall and Dahl (2011). The y-axis is depth below the water. The x-axis is range in meters. The pressure field is plotted in the water between -4 and +2 kPa. Pressures above 2 kPa are shown in grey and pressures below -4 kPa are shown in black. The magnitude of the particle velocity in sediment is shown between 0 and 0.005 m/s. Particle velocity magnitudes greater 0.005 m/s are shown in grey.
Figure 50. A finite element simulation using ABAQUS of the acoustic effects of impact pile driving into an elastic sea bottom is shown.
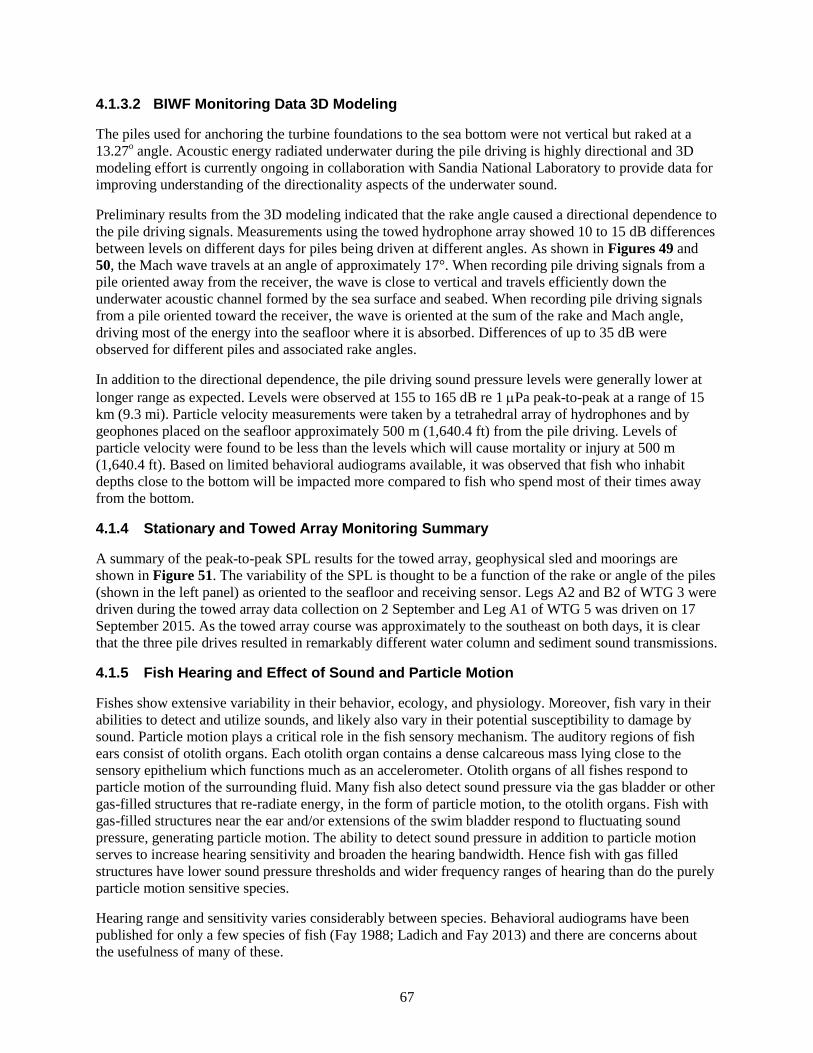
67
4.1.3.2 BIWF Monitoring Data 3D Modeling
The piles used for anchoring the turbine foundations to the sea bottom were not vertical but raked at a
13.27o angle. Acoustic energy radiated underwater during the pile driving is highly directional and 3D
modeling effort is currently ongoing in collaboration with Sandia National Laboratory to provide data for
improving understanding of the directionality aspects of the underwater sound.
Preliminary results from the 3D modeling indicated that the rake angle caused a directional dependence to
the pile driving signals. Measurements using the towed hydrophone array showed 10 to 15 dB differences
between levels on different days for piles being driven at different angles. As shown in Figures 49 and
50, the Mach wave travels at an angle of approximately 17°. When recording pile driving signals from a
pile oriented away from the receiver, the wave is close to vertical and travels efficiently down the
underwater acoustic channel formed by the sea surface and seabed. When recording pile driving signals
from a pile oriented toward the receiver, the wave is oriented at the sum of the rake and Mach angle,
driving most of the energy into the seafloor where it is absorbed. Differences of up to 35 dB were
observed for different piles and associated rake angles.
In addition to the directional dependence, the pile driving sound pressure levels were generally lower at
longer range as expected. Levels were observed at 155 to 165 dB re 1 Pa peak-to-peak at a range of 15
km (9.3 mi). Particle velocity measurements were taken by a tetrahedral array of hydrophones and by
geophones placed on the seafloor approximately 500 m (1,640.4 ft) from the pile driving. Levels of
particle velocity were found to be less than the levels which will cause mortality or injury at 500 m
(1,640.4 ft). Based on limited behavioral audiograms available, it was observed that fish who inhabit
depths close to the bottom will be impacted more compared to fish who spend most of their times away
from the bottom.
4.1.4 Stationary and Towed Array Monitoring Summary
A summary of the peak-to-peak SPL results for the towed array, geophysical sled and moorings are
shown in Figure 51. The variability of the SPL is thought to be a function of the rake or angle of the piles
(shown in the left panel) as oriented to the seafloor and receiving sensor. Legs A2 and B2 of WTG 3 were
driven during the towed array data collection on 2 September and Leg A1 of WTG 5 was driven on 17
September 2015. As the towed array course was approximately to the southeast on both days, it is clear
that the three pile drives resulted in remarkably different water column and sediment sound transmissions.
4.1.5 Fish Hearing and Effect of Sound and Particle Motion
Fishes show extensive variability in their behavior, ecology, and physiology. Moreover, fish vary in their
abilities to detect and utilize sounds, and likely also vary in their potential susceptibility to damage by
sound. Particle motion plays a critical role in the fish sensory mechanism. The auditory regions of fish
ears consist of otolith organs. Each otolith organ contains a dense calcareous mass lying close to the
sensory epithelium which functions much as an accelerometer. Otolith organs of all fishes respond to
particle motion of the surrounding fluid. Many fish also detect sound pressure via the gas bladder or other
gas-filled structures that re-radiate energy, in the form of particle motion, to the otolith organs. Fish with
gas-filled structures near the ear and/or extensions of the swim bladder respond to fluctuating sound
pressure, generating particle motion. The ability to detect sound pressure in addition to particle motion
serves to increase hearing sensitivity and broaden the hearing bandwidth. Hence fish with gas filled
structures have lower sound pressure thresholds and wider frequency ranges of hearing than do the purely
particle motion sensitive species.
Hearing range and sensitivity varies considerably between species. Behavioral audiograms have been
published for only a few species of fish (Fay 1988; Ladich and Fay 2013) and there are concerns about
the usefulness of many of these.
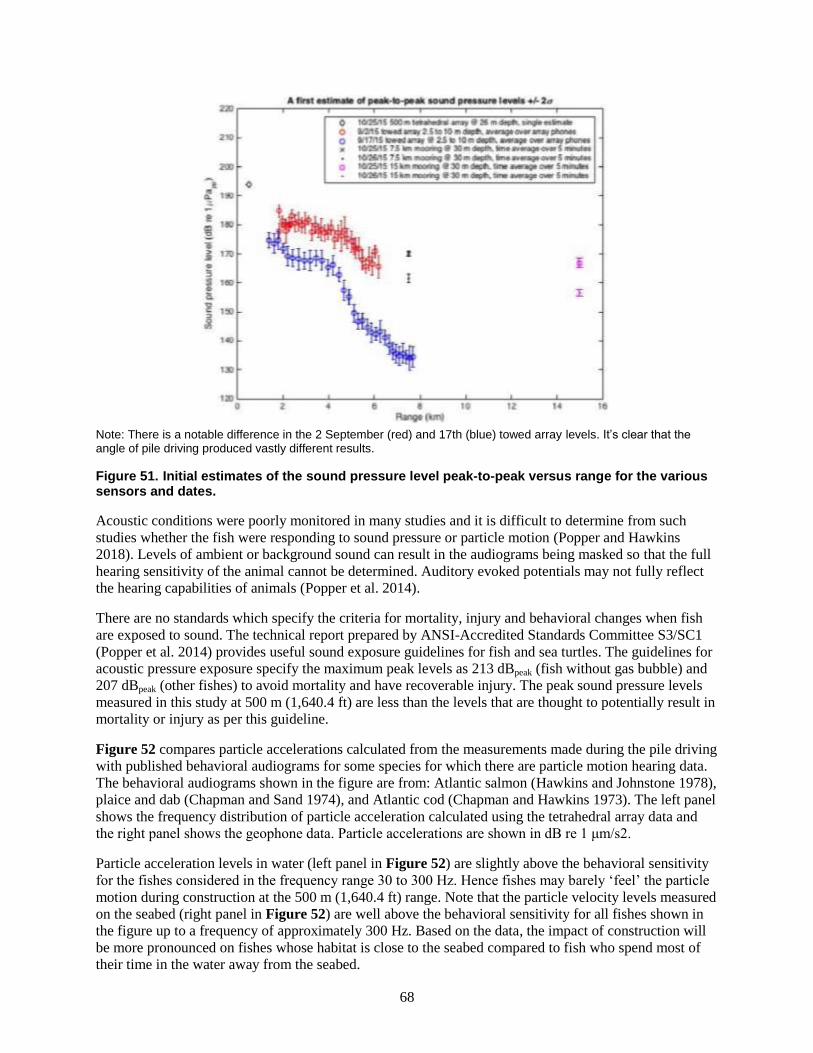
68
Note: There is a notable difference in the 2 September (red) and 17th (blue) towed array levels. It’s clear that the angle of pile driving produced vastly different results.
Figure 51. Initial estimates of the sound pressure level peak-to-peak versus range for the various sensors and dates.
Acoustic conditions were poorly monitored in many studies and it is difficult to determine from such
studies whether the fish were responding to sound pressure or particle motion (Popper and Hawkins
2018). Levels of ambient or background sound can result in the audiograms being masked so that the full
hearing sensitivity of the animal cannot be determined. Auditory evoked potentials may not fully reflect
the hearing capabilities of animals (Popper et al. 2014).
There are no standards which specify the criteria for mortality, injury and behavioral changes when fish
are exposed to sound. The technical report prepared by ANSI-Accredited Standards Committee S3/SC1
(Popper et al. 2014) provides useful sound exposure guidelines for fish and sea turtles. The guidelines for
acoustic pressure exposure specify the maximum peak levels as 213 dBpeak (fish without gas bubble) and
207 dBpeak (other fishes) to avoid mortality and have recoverable injury. The peak sound pressure levels
measured in this study at 500 m (1,640.4 ft) are less than the levels that are thought to potentially result in
mortality or injury as per this guideline.
Figure 52 compares particle accelerations calculated from the measurements made during the pile driving
with published behavioral audiograms for some species for which there are particle motion hearing data.
The behavioral audiograms shown in the figure are from: Atlantic salmon (Hawkins and Johnstone 1978),
plaice and dab (Chapman and Sand 1974), and Atlantic cod (Chapman and Hawkins 1973). The left panel
shows the frequency distribution of particle acceleration calculated using the tetrahedral array data and
the right panel shows the geophone data. Particle accelerations are shown in dB re 1 μm/s2.
Particle acceleration levels in water (left panel in Figure 52) are slightly above the behavioral sensitivity
for the fishes considered in the frequency range 30 to 300 Hz. Hence fishes may barely ‘feel’ the particle
motion during construction at the 500 m (1,640.4 ft) range. Note that the particle velocity levels measured
on the seabed (right panel in Figure 52) are well above the behavioral sensitivity for all fishes shown in
the figure up to a frequency of approximately 300 Hz. Based on the data, the impact of construction will
be more pronounced on fishes whose habitat is close to the seabed compared to fish who spend most of
their time in the water away from the seabed.

69
Note: The acceleration levels are compared with published behavioural audiograms of some fishes. The audiogram data is from: Atlantic salmon (Hawkins and Johnstone 1978), two flat fish plaice and dab (Chapman and Sand 1974), and Atlantic cod (Chapman and Hawkins 1973).
Figure 52. Spectra of the particle acceleration (black) in the water column estimated using the tetrahedral array (left panel) and measured on the seabed using the geophone (right panel).

70
4.2 Variable Depth Single Sensor and Seabed Vibration Monitoring
4.2.1 Monitoring Approach
Sound level measurements were recorded under a series of varying environmental conditions for 14
separate piles being driven over 5 days. The following monitoring equipment was deployed:
OceanSonics icListen HF-SB9 (Serial No. 1400)
icListen HF-X2 (Serial No. 1287) hydrophones
Reson TC4014 hydrophones (Serial No. 4005034 and 4005035)
Brüel & Kjær type 8106 hydrophone (Serial No.2575949)
Tri-axial Vibrock V901 geophone
Drift measurements were taken from a single hydrophone deployed from the side of the survey vessel
(R/V McMaster). The survey vessel’s engines and other equipment, which might otherwise have caused
acoustic interference with the measurements, were turned off and the boat was allowed to drift while
measurements were taken.
The hydrophone was attached under a spar-buoy to provide anti-heave while undertaking measurements,
thereby reducing the effect of surface waves. The suspended hydrophone was allowed to drift freely from
the vessel to minimize flow noise during measurements. The hydrophone would drift up to 10 to 15 m
(32.8 to 49.2 ft) from the start position, before it was recovered to the vessel and redeployed. The GPS
position was logged at the start of the drift, at the closest point of the hydrophone to the vessel (typically
within five m (16.4 ft) of the actual hydrophone position). Measurements of the sound pressure were
taken at mid-water depth and at 1 m (3.3 ft) from the seabed.
At intervals starting at approximately 500 m (1,640.4 ft) from the piling and doubling in distance (1 km
[0.6 mi], 2 km [1.2 mi], and 4 km [2.5 mi]) sound data were acquired on the computer, together with
details of the boat’s position and other relevant information. In general, measurements were repeated in
each location, taken in succession. For several transects, measurements were taken at two depths: mid-
depth and 1 m (3.3 ft) above the seabed. This was done by immediately recovering the hydrophone and
changing the connection position of the spar-buoy in order to re-deploy the hydrophone at the second
depth. A summary of the measurement details below is shown in Table 17. Figure 53 provides an
illustrative map of measurement transects taken from the various wind turbine foundations.
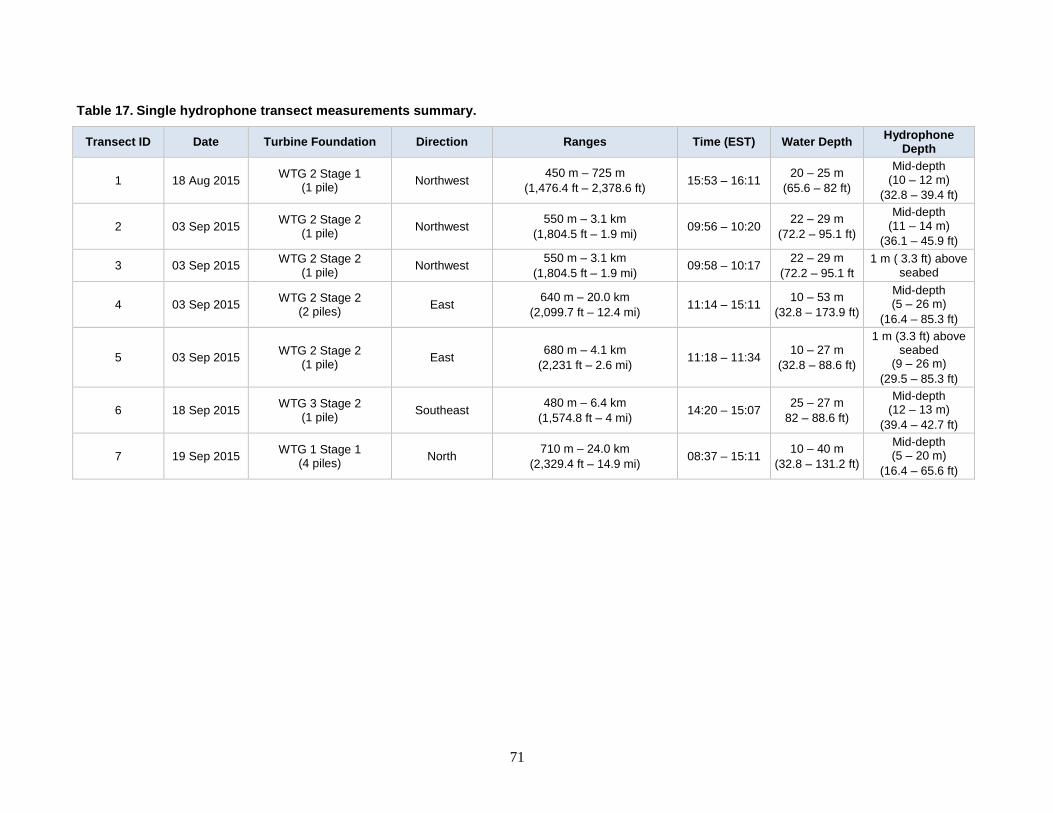
71
Table 17. Single hydrophone transect measurements summary.
Transect ID Date Turbine Foundation Direction Ranges Time (EST) Water Depth Hydrophone
Depth
1 18 Aug 2015 WTG 2 Stage 1
(1 pile) Northwest
450 m – 725 m
(1,476.4 ft – 2,378.6 ft) 15:53 – 16:11
20 – 25 m
(65.6 – 82 ft)
Mid-depth (10 – 12 m)
(32.8 – 39.4 ft)
2 03 Sep 2015 WTG 2 Stage 2
(1 pile) Northwest
550 m – 3.1 km
(1,804.5 ft – 1.9 mi) 09:56 – 10:20
22 – 29 m
(72.2 – 95.1 ft)
Mid-depth (11 – 14 m)
(36.1 – 45.9 ft)
3 03 Sep 2015 WTG 2 Stage 2
(1 pile) Northwest
550 m – 3.1 km
(1,804.5 ft – 1.9 mi) 09:58 – 10:17
22 – 29 m
(72.2 – 95.1 ft
1 m ( 3.3 ft) above seabed
4 03 Sep 2015 WTG 2 Stage 2
(2 piles) East
640 m – 20.0 km
(2,099.7 ft – 12.4 mi) 11:14 – 15:11
10 – 53 m
(32.8 – 173.9 ft)
Mid-depth (5 – 26 m)
(16.4 – 85.3 ft)
5 03 Sep 2015 WTG 2 Stage 2
(1 pile) East
680 m – 4.1 km
(2,231 ft – 2.6 mi) 11:18 – 11:34
10 – 27 m
(32.8 – 88.6 ft)
1 m (3.3 ft) above seabed
(9 – 26 m)
(29.5 – 85.3 ft)
6 18 Sep 2015 WTG 3 Stage 2
(1 pile) Southeast
480 m – 6.4 km
(1,574.8 ft – 4 mi) 14:20 – 15:07
25 – 27 m
82 – 88.6 ft)
Mid-depth (12 – 13 m)
(39.4 – 42.7 ft)
7 19 Sep 2015 WTG 1 Stage 1
(4 piles) North
710 m – 24.0 km
(2,329.4 ft – 14.9 mi) 08:37 – 15:11
10 – 40 m
(32.8 – 131.2 ft)
Mid-depth (5 – 20 m)
(16.4 – 65.6 ft)

72
Figure 53. Orientation of the four transects.
For Fixed Monitoring, an OceanSonics icListen hydrophone was deployed for each measurement day
listed in Table18. The hydrophone was fixed at mid-depth in the water column between 750 m (2,460.6
ft) and 840 m (2,756 ft) from the location of the piling, except on 19 September 2015 where the
hydrophone was fixed at 1 m (3.3 ft) above the seabed at 5.9 km (3.7 mi) north of the piling.
Table 18. Single hydrophone fixed measurements summary.
Date Turbine Foundation Direction Range
03 Sep 2015 WTG 2 Stage 2 (4 piles) Northwest 750 m (2,460.6 ft)
17 Sep 2015 WTG 2 Stage 2 (3 piles) Northwest 790 m (2,591.9 ft)
18 Sep 2015 WTG 3 Stage 2 (4 piles) Southeast 840 m (2,756 ft)
19 Sep 2015 WTG 1 Stage 1 (4 piles) North 5.9 km (3.7 mi)
Seabed Vibration measurements were conducted on transects following a similar procedure to the
underwater noise transect measurements. The geophone assembly was lowered onto the seabed using a
second line to maintain orientation and allowed to settle in the sediment. In addition, the geophone was
oriented such that the longitudinal axis was in line with the direction of each transect.
Once the geophone was deployed and as each measurement was started, the cable was fed out and
allowed to drift with the flow to minimize the effect of additional vibration induced by the current on the
cable (cable strum). Each measurement lasted for approximately 30 seconds and once complete, the cable
was retrieved to remove any slack and the measurement repeated.
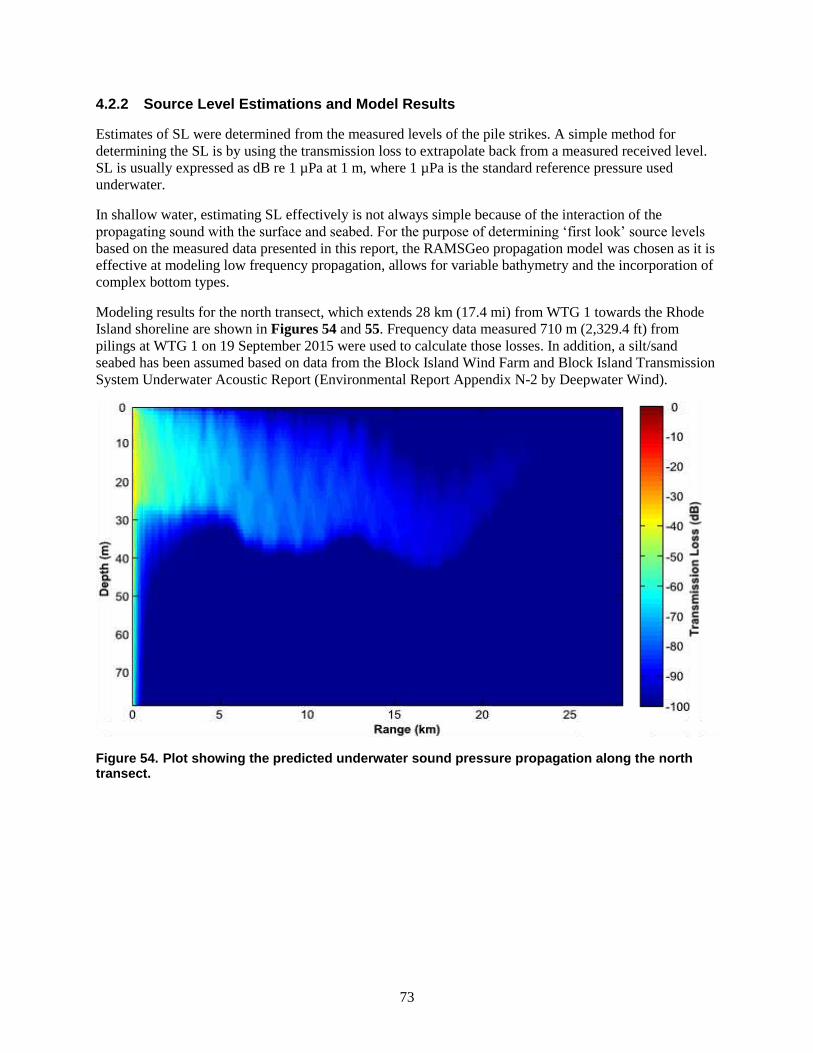
73
4.2.2 Source Level Estimations and Model Results
Estimates of SL were determined from the measured levels of the pile strikes. A simple method for
determining the SL is by using the transmission loss to extrapolate back from a measured received level.
SL is usually expressed as dB re 1 µPa at 1 m, where 1 µPa is the standard reference pressure used
underwater.
In shallow water, estimating SL effectively is not always simple because of the interaction of the
propagating sound with the surface and seabed. For the purpose of determining ‘first look’ source levels
based on the measured data presented in this report, the RAMSGeo propagation model was chosen as it is
effective at modeling low frequency propagation, allows for variable bathymetry and the incorporation of
complex bottom types.
Modeling results for the north transect, which extends 28 km (17.4 mi) from WTG 1 towards the Rhode
Island shoreline are shown in Figures 54 and 55. Frequency data measured 710 m (2,329.4 ft) from
pilings at WTG 1 on 19 September 2015 were used to calculate those losses. In addition, a silt/sand
seabed has been assumed based on data from the Block Island Wind Farm and Block Island Transmission
System Underwater Acoustic Report (Environmental Report Appendix N-2 by Deepwater Wind).
Figure 54. Plot showing the predicted underwater sound pressure propagation along the north transect.
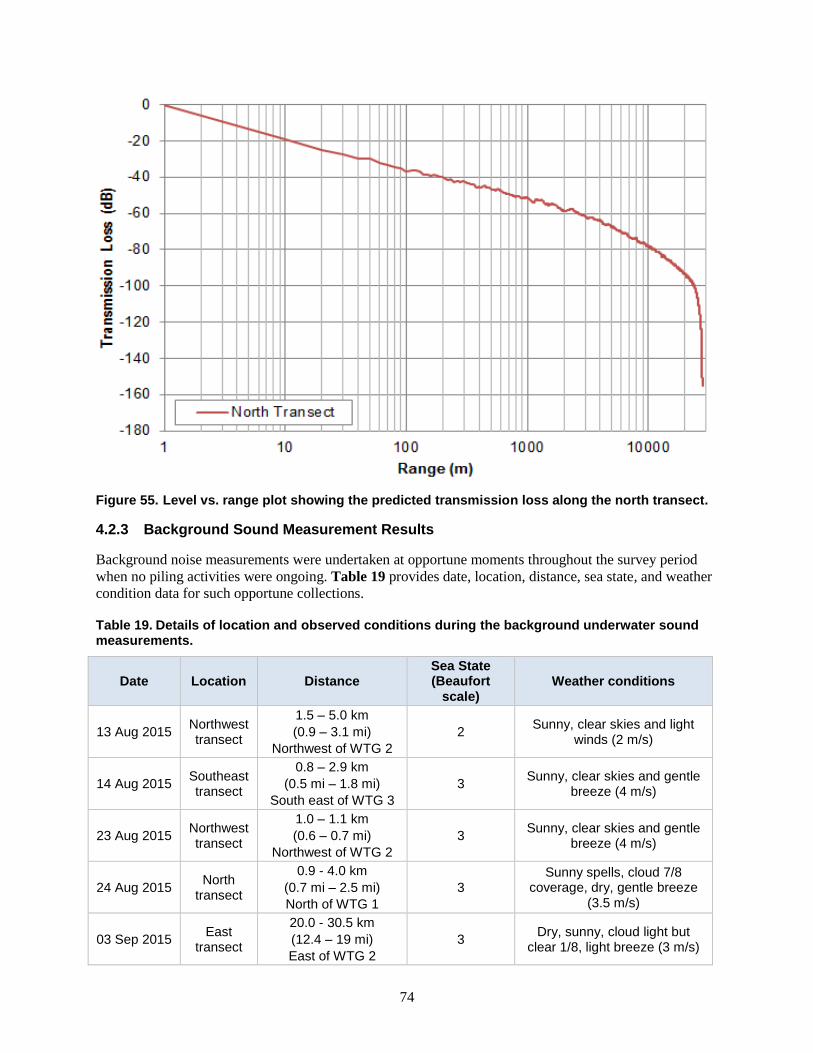
74
Figure 55. Level vs. range plot showing the predicted transmission loss along the north transect.
4.2.3 Background Sound Measurement Results
Background noise measurements were undertaken at opportune moments throughout the survey period
when no piling activities were ongoing. Table 19 provides date, location, distance, sea state, and weather
condition data for such opportune collections.
Table 19. Details of location and observed conditions during the background underwater sound measurements.
Date Location Distance Sea State (Beaufort
scale) Weather conditions
13 Aug 2015 Northwest transect
1.5 – 5.0 km
(0.9 – 3.1 mi)
Northwest of WTG 2
2 Sunny, clear skies and light
winds (2 m/s)
14 Aug 2015 Southeast transect
0.8 – 2.9 km
(0.5 mi – 1.8 mi)
South east of WTG 3
3 Sunny, clear skies and gentle
breeze (4 m/s)
23 Aug 2015 Northwest transect
1.0 – 1.1 km
(0.6 – 0.7 mi)
Northwest of WTG 2
3 Sunny, clear skies and gentle
breeze (4 m/s)
24 Aug 2015 North
transect
0.9 - 4.0 km
(0.7 mi – 2.5 mi)
North of WTG 1
3 Sunny spells, cloud 7/8
coverage, dry, gentle breeze (3.5 m/s)
03 Sep 2015 East
transect
20.0 - 30.5 km
(12.4 – 19 mi)
East of WTG 2
3 Dry, sunny, cloud light but
clear 1/8, light breeze (3 m/s)

75
The maximum, minimum, and mean measured background sound levels are presented in Table 20. The
mean levels (SPL RMS) range from 107.4 dB re 1 µPa, for measurements taken up to 30 km (18.6 mi)
east of the BIWF site, to 118.7 dB re 1 µPa for measurements taken as close as 1 km (0.6 mi) from the
work site.
Table 20. Summary of SPL RMS background sound measurements taken near the Block Island Wind Farm site.
Date Location Max level (dB re 1
µPa)
Min Level (dB re 1
µPa)
Mean Level (dB re 1
µPa) Comments
13-Aug-15
Northwest transect
123.7 104.2 115.3 Sound from small vessels
and construction barge
14-Aug-15
Southeast transect
124.7 96.0 112.4 Some sound from construction barge
23-Aug-15
Northwest transect
129.7 111.1 118.7 Machinery sound from construction barge and
passing vessels
24-Aug-15
North transect
119.7 103.2 112.1 Sound from construction
barge and from ferry
03-Sep-15
East transect 125.7 97.7 107.4 Vessel traffic contributes at 20 km (12.4 mi), very quiet
at 30 km (16.6 mi)
The background sound pressure levels measured near to the BIWF work site were found to be higher due
to the presence of construction vessels and also more small recreational vessels than in other locales. The
lowest levels were measured at a distance of 30 km (18.6 mi) east of the BIWF site away from vessel
traffic and other man-made sound sources. The power spectral density plot presented in Figure 56 reveals
the level across the frequency range is less than that of the measurements from other locations. This was
sampled on a different day and, because of the small variation and small sample size, no conclusions
should be drawn aside from a general indication of background noise levels in the region. However, the
other power spectral density plots show higher levels between 30 and 300 Hz, which are expected to be
mostly due to the presence of vessels associated with the BIWF construction operation.
4.2.4 SL Estimation Summary Results and Comparisons
A summary of the estimated source levels for each measurement transect is presented in Table 21. The
estimated peak-to-peak source levels are between 233 and 245 dB re 1 µPa at 1 m (3.3 ft) and are based
on the hammer blow energies after ramp up.
Table 21. Estimates of SL based on fits to the measurement transects from the piling operations.
Transect ID Transect direction Hydrophone depth SL
1 Northwest Mid -
2 Northwest Mid 234
3 Northwest Seabed 236
4 East Mid 235
5 East Seabed 237
6 Southeast Mid 242
7 (Pile 1) North Mid 245
7 (Piles 2–4) North Mid 233
Note: The source level for Transect ID 1 (diesel hammer) could not be estimated because of a short piling time and number of ranges sampled.
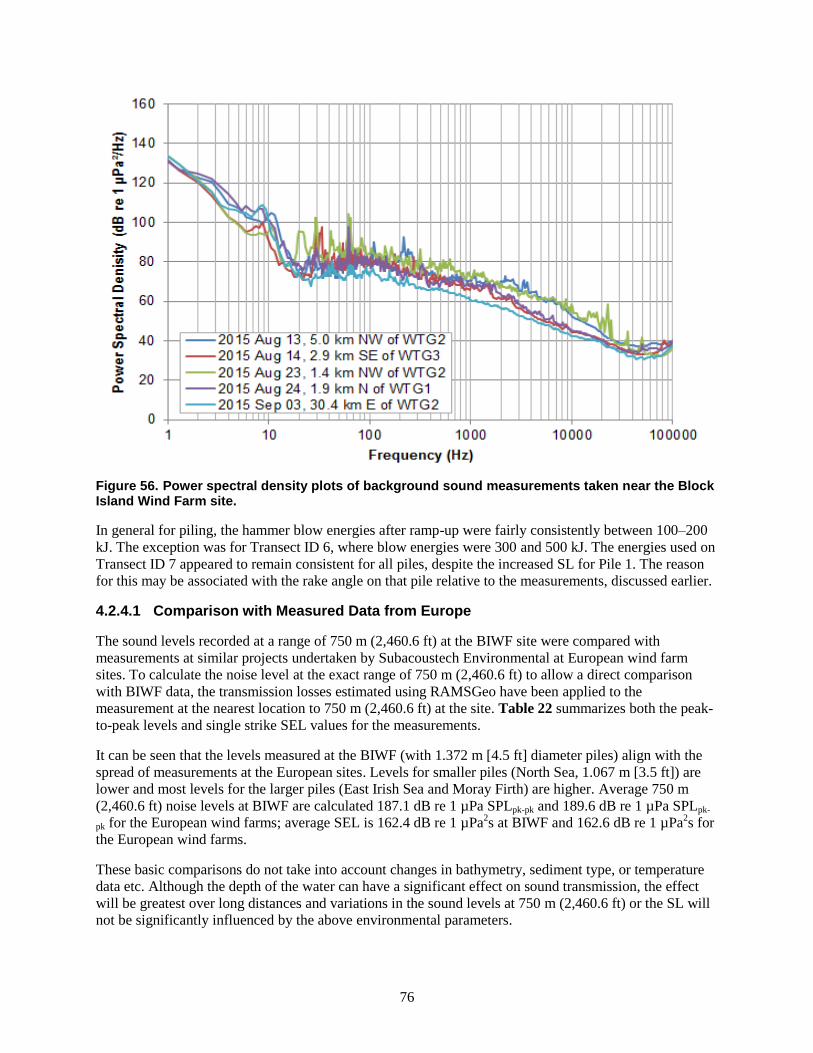
76
Figure 56. Power spectral density plots of background sound measurements taken near the Block Island Wind Farm site.
In general for piling, the hammer blow energies after ramp-up were fairly consistently between 100–200
kJ. The exception was for Transect ID 6, where blow energies were 300 and 500 kJ. The energies used on
Transect ID 7 appeared to remain consistent for all piles, despite the increased SL for Pile 1. The reason
for this may be associated with the rake angle on that pile relative to the measurements, discussed earlier.
4.2.4.1 Comparison with Measured Data from Europe
The sound levels recorded at a range of 750 m (2,460.6 ft) at the BIWF site were compared with
measurements at similar projects undertaken by Subacoustech Environmental at European wind farm
sites. To calculate the noise level at the exact range of 750 m (2,460.6 ft) to allow a direct comparison
with BIWF data, the transmission losses estimated using RAMSGeo have been applied to the
measurement at the nearest location to 750 m (2,460.6 ft) at the site. Table 22 summarizes both the peak-
to-peak levels and single strike SEL values for the measurements.
It can be seen that the levels measured at the BIWF (with 1.372 m [4.5 ft] diameter piles) align with the
spread of measurements at the European sites. Levels for smaller piles (North Sea, 1.067 m [3.5 ft]) are
lower and most levels for the larger piles (East Irish Sea and Moray Firth) are higher. Average 750 m
(2,460.6 ft) noise levels at BIWF are calculated 187.1 dB re 1 µPa SPLpk-pk and 189.6 dB re 1 µPa SPLpk-
pk for the European wind farms; average SEL is 162.4 dB re 1 µPa2s at BIWF and 162.6 dB re 1 µPa
2s for
the European wind farms.
These basic comparisons do not take into account changes in bathymetry, sediment type, or temperature
data etc. Although the depth of the water can have a significant effect on sound transmission, the effect
will be greatest over long distances and variations in the sound levels at 750 m (2,460.6 ft) or the SL will
not be significantly influenced by the above environmental parameters.

77
Table 22. Comparison of measured sound levels at a range of 750 m (2,460.6 ft) at the BIWF site (with pile diameters of 1.4 m [4.6 ft) and other measurements undertaken in the EU. Pile diameters given in (parentheses), closest measured range from the pile in [brackets].
BIWF Transect ID
Level at 750 m dB SPLpk-pk
Level at 750 m dB SELss
EU Windfarm site
Level at 750 m (2,460.6 ft)
dB SPLpk-pk
Level at 750 m (2,460.6 ft)
dB SELss
2 184 160 UK east coast
(1.37 m [558 m]) 182 158
3 185 161 North Sea
(1.829 m [721 m]) 193 165
4 185 161 North Sea
(1.077 m [675 m]) 185 158
5 187 162 East Irish Sea
(1.83 m [637 m]) 191 163
6 191 166 East Irish Sea (1.83m [500 m])
192 164
7 (Pile 1) 195 168 East Irish Sea
(1.83 m [517 m]) 192 166
7 (Piles 2-4) 183 159 East Irish Sea (1.83m [510 m])
192 164
Moray Firth
(1.83m [728 m]) 194 165
4.2.4.2 Comparison with Modeled Data
Underwater sound modeling for impact piling at the Block Island site was carried out by Deepwater Wind
using the RAMSGeo acoustic model, as reported in the Block Island Wind Farm and Block Island
Transmission System, Environmental Report Appendix N-2 Underwater Acoustic Report (Deepwater
Wind 2012). The modeling was carried out in accordance with thresholds defined by the National Marine
Fisheries Service over eight equally spaced transects (one every 45°) for two pile hammer energies;
200 kJ and 600 kJ. These thresholds were valid at the time of the assessment, although have since been
updated. The ranges to three thresholds were presented:
180 dB re 1 µPa (RMS) – Level A harassment threshold, where sound has the potential to injure a
marine mammal.
160 dB re 1 µPa (RMS) – Level B harassment threshold, where sound has the potential to disturb
a marine mammal. This threshold is specifically for impulsive sound sources.
120 dB re 1 µPa (RMS) – Level B harassment threshold; as above. This threshold is for a
continuous sound source or an intermittent non-pulsed source; this is not specifically relevant to
impact piling, however it has been included to aid comparisons to the modeling undertaken by
Deepwater Wind.
The measured data along with the RAMSGeo transmission losses are presented alongside the modeled
data from Deepwater Wind below. Table 23 shows the transects measured during piling next to the
modeled transects that have the closest orientation match. This table also shows these transects and
compares the difference in range between the modeled and measured calculated disturbance thresholds.
These results are shown as level versus range plots in Figures 57 to 60.

78
Table 23. Summary of the measured transects and the modeling parameters from Deepwater Wind that closest correspond.
BIWF Measured Transect ID
Approx. measured bearing
Closest modelled bearing
Closest modelled blow energy
Modelled Range to 180 dBRMS
Modelled Range to 160 dBRMS
Modelled Range to 120 dBRMS
2 (Northwest) 316° 315° 200 kJ
61 m
(200.1 ft)
3.1 km
(1.9 mi)
5.8 km
(3.6 mi) 3 (Northwest)
4 (East) 80° 90° 200 kJ
60 m
(196.9 ft)
2.7 km
(1.7 mi)
30.6 km
(19 mi) 5 (East)
6 (Southeast) 97° 90° 600 kJ 382 m
(1,253.3 ft)
4.6 km
(2.9 mi)
37.5 km
(23.3 mi)
7 (Pile 1) (North) 346° 0° 200 kJ
61 m
(200.1 ft)
2.8 km
(1.7 mi)
27.4 km
(17.03) 7 (Piles 2-4) (North)

79
Figure 57. Comparison between measured data and modeled thresholds for transects 2 (left) and 3 (right) using the modeled data from the 315° transect using a 200 kJ blow energy.

80
Figure 58. Comparison between measured data and modeled thresholds for transects 4 (left) and 5 (right) using the modeled data from the 90° transect using a 200 kJ blow energy.
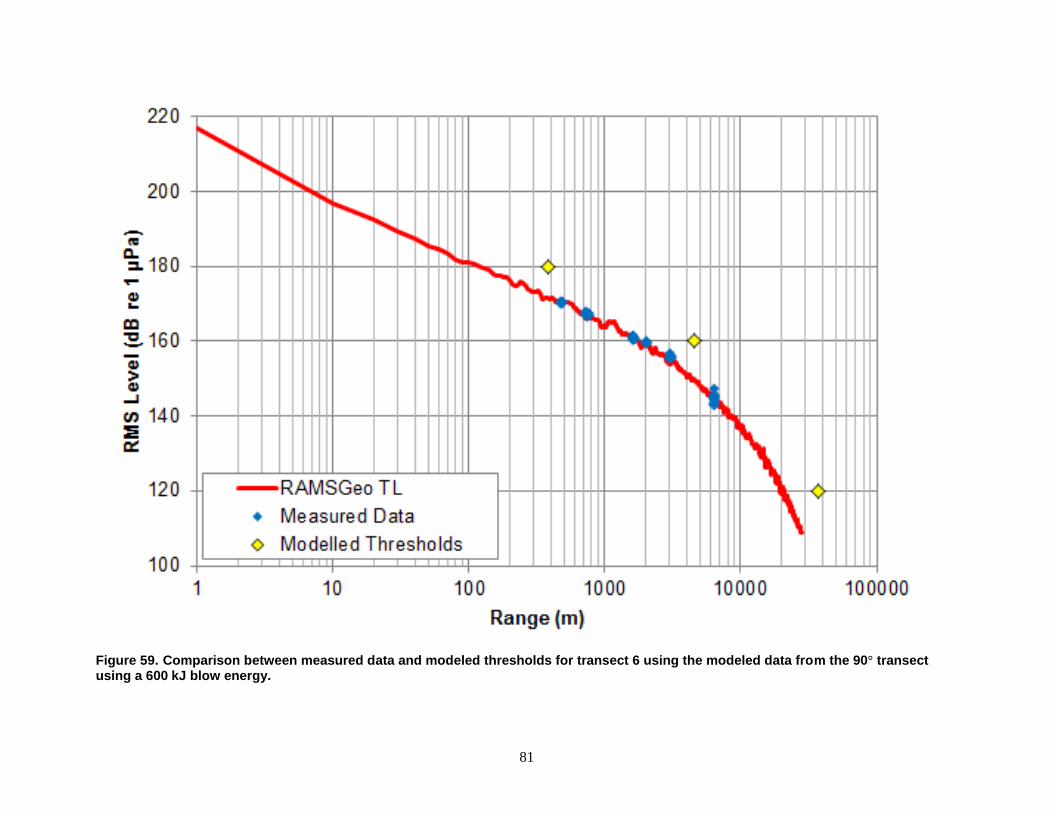
81
Figure 59. Comparison between measured data and modeled thresholds for transect 6 using the modeled data from the 90° transect using a 600 kJ blow energy.

82
Figure 60. Comparison between measured data and modeled thresholds for transect 7 (pile 1, left, and piles 2-4, right) using the modeled data from the 0° transect using a 200 kJ blow energy.

83
Table 24 shows the results of the comparison between the ranges calculated from modeling by Deepwater
Wind and those measured during pile installation. The modeled ranges were conservative, and tended to
overestimate the noise levels produced during piling, and thus most differences in the table are positive.
For example, the modeling calculated that 160 dBRMS at Transect ID 2 would be reached 2.4 km (1.5 mi)
farther from the pile than was measured, meaning that the piling was less noisy than was predicted.
Table 24. Summary of the difference in range, between the measured and modeled sound levels for the three disturbance thresholds.
BIWF Transect ID
Difference in range between the measured and modelled disturbance threshold levels
180 dBRMS 160 dBRMS 120 dBRMS
2 (Northwest) + 21 m (68.9 ft) + 2.4 km (1.5 mi) + 0.4 km (0.2 mi)
3 (Northwest) + 11 m (36.1 ft) + 2.1 km (1.3 mi) + 0.3 km (0.2 mi)
4 (East) + 2 m (6.6 ft) + 1.8 km (1.1 mi) + 14.2 km ( 8.8 mi)
5 (East) 0 m + 1.5 km (0.9 mi) + 13.8 km (8.6 mi)
6 (Southeast) + 270 m (885.8 ft) + 2.8 km (1.7 mi) + 16.7 km (10.4 mi)
7 (Pile 1) (North) - 69 m (226.4 ft) + 0.9 km (0.6 mi) + 4.5 km (2.8 mi)
7 (Piles 2-4) (North) + 30 m (98.4 ft) + 2.1 km (1.3 mi) + 10.8 km (6.7 mi)
These results show that the modeling gives an upper estimate of the measured sound, with almost all the
measured levels being lower than those predicted by Deepwater Wind using RAMSGeo. In addition, the
difference between measured and modeled levels becomes greater with range for most transects.
4.2.4.3 Hammer and SPL Comparison
A comparison of the measured peak-to-peak sound pressure levels, at a range less than 1.2 km (0.8 mi) to
piling, for two different hammer types is presented in Figure 61. On 3 September 2015, the levels
measured for the Bauer-Pileco Inc. Model D280-22 diesel hammer are generally of the same order as the
levels measured for the Menck hydraulic hammer and follow the same trend. As compared with the levels
measured on 3 September, higher levels were recorded for the diesel hammer on 18 and 19 September
2015 and these are most likely linked to higher blow energies. The blow energies for the diesel hammer
were not available for comparison, although specifications for it state that its available blow energy range
is much greater than that of the Menck.
The hydraulic hammer used on September 18 and 19 at the higher hammer energies led to the highest
overall noise levels relative to distance.
4.2.5 Piling Seabed Vibration Measurements
Seabed vibration measurements of impact piling were recorded on 17 September 2015 along transects
from the WTG 5 foundation during driving of the first stage piles. All monitored piles were the first
segment of each leg. The measurements from these transects are discussed below in the order they were
collected.
Measurements of seabed vibration were carried out along a northwest transect from turbine foundation
WTG 5. Each measurement transect was sampled twice. Measurements began at approximately 500 m
(1,640.4 ft) from the foundation and were then taken at increasing distance in steps of approximately 500
m (1,640.4 ft). The measurements were then repeated on a return transect. The axes were vertical (away
from the seabed), longitudinal (toward piling) and transverse (perpendicular to piling).
The first transect measurement was carried out between 12:42 and 13:36 on 17 September 2015. On
review of the data, it was found that interference had occurred because of the survey vessel’s engines not
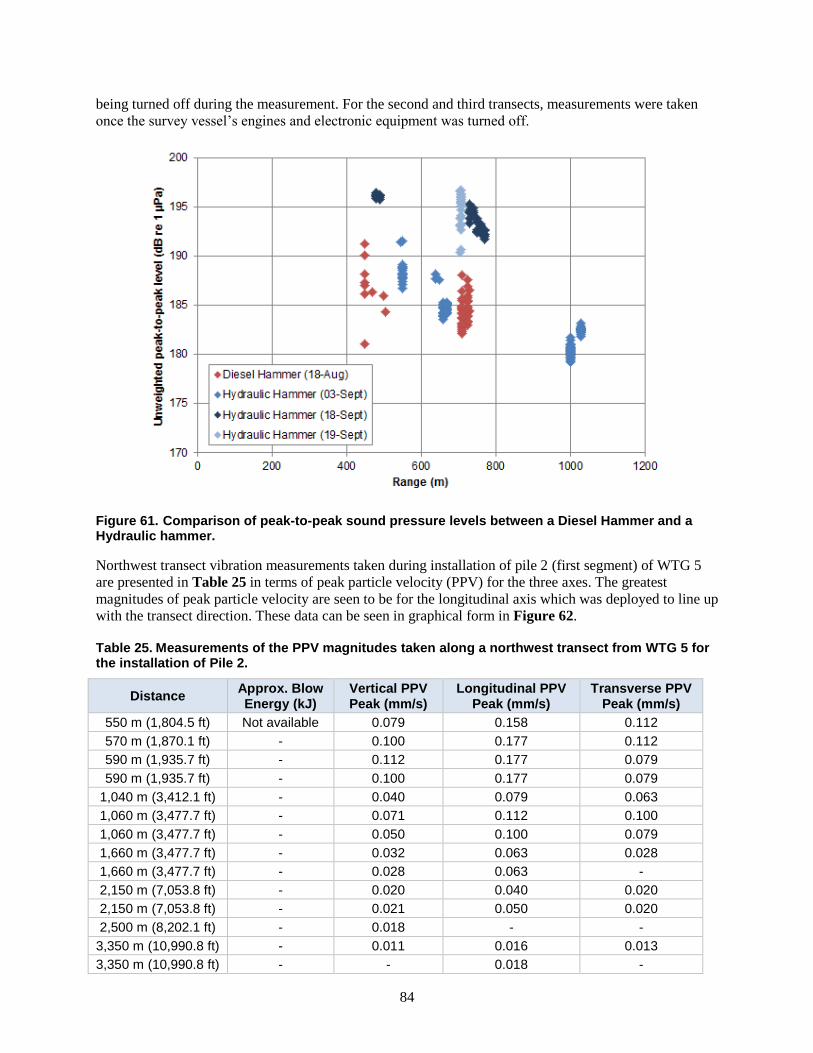
84
being turned off during the measurement. For the second and third transects, measurements were taken
once the survey vessel’s engines and electronic equipment was turned off.
Figure 61. Comparison of peak-to-peak sound pressure levels between a Diesel Hammer and a Hydraulic hammer.
Northwest transect vibration measurements taken during installation of pile 2 (first segment) of WTG 5
are presented in Table 25 in terms of peak particle velocity (PPV) for the three axes. The greatest
magnitudes of peak particle velocity are seen to be for the longitudinal axis which was deployed to line up
with the transect direction. These data can be seen in graphical form in Figure 62.
Table 25. Measurements of the PPV magnitudes taken along a northwest transect from WTG 5 for the installation of Pile 2.
Distance Approx. Blow Energy (kJ)
Vertical PPV Peak (mm/s)
Longitudinal PPV Peak (mm/s)
Transverse PPV Peak (mm/s)
550 m (1,804.5 ft) Not available 0.079 0.158 0.112
570 m (1,870.1 ft) - 0.100 0.177 0.112
590 m (1,935.7 ft) - 0.112 0.177 0.079
590 m (1,935.7 ft) - 0.100 0.177 0.079
1,040 m (3,412.1 ft) - 0.040 0.079 0.063
1,060 m (3,477.7 ft) - 0.071 0.112 0.100
1,060 m (3,477.7 ft) - 0.050 0.100 0.079
1,660 m (3,477.7 ft) - 0.032 0.063 0.028
1,660 m (3,477.7 ft) - 0.028 0.063 -
2,150 m (7,053.8 ft) - 0.020 0.040 0.020
2,150 m (7,053.8 ft) - 0.021 0.050 0.020
2,500 m (8,202.1 ft) - 0.018 - -
3,350 m (10,990.8 ft) - 0.011 0.016 0.013
3,350 m (10,990.8 ft) - - 0.018 -

85
Figure 62. PPV magnitudes plotted against range for a northwest transect from WTG 5 for the installation of Pile 2.
Northwest transect vibration measurements taken during the installation of pile 3 (first segment) of WTG
5 are presented in Table 26 in terms of PPV for the three axes. The greatest magnitudes of PPV are again
seen to be for the longitudinal axis 0.354 mm/s at 400 m (1,312.3 ft). Magnitudes of PPV were measured
in excess of 0.2 mm/s, at a range of 750 m (2,460.6 ft), greater than the highest magnitude of PPV,
measured at a closer range of 570 m (1,870 ft), on the first transect.
Table 26. Measurements of the PPV magnitudes taken along a northwest transect from WTG 5 for the installation of Pile 3.
Distance Approx. Blow Energy (kJ)
Vertical PPV Peak (mm/s)
Longitudinal PPV Peak
(mm/s)
Transverse PPV Peak (mm/s)
400 m (1,312.3 ft) 65 0.177 0.354 0.177
420 m ( 1,378 ft) 70 0.188 0.281 0.186
710 m (2,329.4 ft) 230 0.112 0.171 0.133
750 m (2,460.6 ft) 70 0.071 0.126 0.092
750 m (2,460.6 ft) 80 0.079 0.149 0.112
750 m (2,460.6 ft) 235 0.119 0.199 0.112
750 m (2,460.6 ft) 235 0.106 0.199 0.100
750 m (2,460.6 ft) 235 0.100 0.211 0.094
780 m (2,559.1 ft) 250 0.094 0.223 0.112
780 m (2,550.1 ft) 230 0.106 0.164 0.089
1,210 m (3,969.8 ft) 80 0.035 0.133 0.040
1,250 m (4,101.1 ft) 70 0.050 0.100 0.045
2,050 m (6,725.7 ft) 240 - 0.028 -
3,050 m (10,006.6 ft) 240 0.014 0.021 0.019

86
Figure 63 displays the underwater sound time history for 17 September 2015 and indicates a greater
vibration emission in the impact piling of pile 3 compared with pile 2, hence the higher magnitudes of
peak particle velocity measured for pile 3.
Figure 63. PPV magnitudes plotted against range for a northwest transect from WTG 5 for the installation of Pile 3.
4.2.6 Single Hydrophone and Seabed Vibration Monitoring Conclusions
Background sound measurements were collected when no piling occurred predominantly in and around
the wind farm site. Samples of background sound between 20 Hz and 100 kilohertz were taken up to 30
km (18.6 mi) from the site in quieter waters. The mean RMS SPLs recorded ranged between 107.4 and
118.7 dB re 1 µPa. Higher levels of background sound were found closer to the wind farm site which can
be attributed to construction vessels and also to recreational vessel traffic.
As expected, transect measurements of underwater impact piling sound pressure levels were shown to
decrease with increasing distance. A comparison of the underwater sound levels measured at mid-depth
with those measured at one meter above the seabed showed sound pressure levels of the order of 2 dB
higher nearer the seabed.
For each transect, the transmission loss was calculated, using the RAMSGeo propagation model in order
to determine the source levels. The estimated peak-to-peak source levels extrapolated from the measured
data ranged between 233 and 245 dB re 1 µPa at 1 m (3.3 ft).
The measured data from the fixed monitor captured the variation in the underwater sound level during
pile driving operations over the period of a day. These data provided useful information for the analysis of
the measured transect data, most notably for the north transect where measurements were taken during the
piling of the four piles for the WTG 1 foundation.

87
Transect measurements of seabed vibration were also undertaken during impact piling operations on
WTG 5 using a tri-axial geophone. The measurements were repeated for subsequent piles on a northwest
transect. The greatest magnitude of peak particle velocity was measured to be 0.354 mm/s on the
longitudinal axis (towards piling) at a range of 400 m (1,312.3 ft) from the piling.
4.2.6.1 Recommendations for future measurements and observations
The following recommendations are offered to guide the design of underwater sound monitoring efforts
for future offshore pile driving:
1. At the BIWF, the nearest measurements of pile driving were taken 500 m (1,640.4 ft) away
because of safety concerns. It is recommended that measurements be taken at closer ranges if at
all possible. In addition, if feasible, accelerometers should be attached to the foundation jackets.
Having such data is particularly important because the highest sound pressure and particle motion
levels are likely to be within this region, and thus these sound levels are those most likely to have
the most significant impact on fishes (and invertebrates). While modeling from data farther from
the source appears to be effective, this is not a substitute for testing the model close to the source,
and particularly for determining the 3D particle motion levels where models may not work in the
shallow water.
2. BIWF measurements were generally confined to one azimuth; more meaningful data would be
generated if measurements were recorded simultaneously at different azimuths.
3. At BIWF, sound level measurements were recorded up to 15 km (9.3 mi). For future monitoring,
it is recommended that a VLA be placed approximately 50 km (31 mi) away from sound source.
4. Particle velocity was measured on the seabed and close to it (approximately 1 m (3.3 ft) from the
bottom). It will be useful if particle velocity measurements can be made mid-water column depth.
This could be accomplished by deploy a multi-depth tetrahedral SHRU Array.
5. There is a need to measure particle motion levels at different heights above the seabed to
investigate the fall-off.
6. There is also a need to investigate the level of sound pressure at different depths.
Also, the purpose of the RODEO Program is to make direct, real-time measurements of the nature,
intensity, and duration of potential stressors during the construction and initial operations of offshore
wind facilities. It is well established that the stressors can potentially impact marine life (receptors),
and therefore, to get a complete picture, it would be useful to also gather relevant real-time data and
conduct analyses for determining potential impacts of the stressors on receptors such as fish, sea
turtles, and marine mammals. The impact analyses should focus on the latest guidelines for the key
receptor groups and compare ambient underwater sound levels to applicable and relevant guidelines.
For example, analysis for fish impacts could reference Popper et al. (2014) while marine mammal
analysis might be conducted in terms of recent NOAA reports (NMFS 2016; NOAA 2016).
Relatively little information is currently available on the effects of man-made sounds on aquatic life,
and particularly on fishes and invertebrates (Normandeau 2012a, 2012b; Hawkins et al. 2015), and
impact analyses would provide data to fill in the knowledge gaps. These analyses would also improve
understand of the need and the extent to which underwater sounds from offshore wind farm
construction and operation need to be managed and and/or mitigated for.

88
5 Seafloor Disturbance and Recovery Monitoring
The main objective of the seafloor disturbance and recovery monitoring task was to identify seafloor
disturbances associated with the BIWF construction activities and monitor seabed recovery over time.
Monitoring was also performed to collect field data for evaluation of the spatial extent of seafloor
disturbances around each turbine related to construction activities. High-resolution bathymetric data were
gathered in the field in parallel with the construction activities and data were analyzed to evaluate seafloor
changes.
Three separate surveys were conducted in the area where the construction vessels were positioned
(designated as the Work Area) (Figure 64). Detailed technical reports from each survey are contained in
Appendix E. Round 1 was conducted on 11 May and 12 May 2016, and survey data were used to
determine seafloor disturbances resulting from Phase 1 construction activities that took place between
July and October 2015. A second round of monitoring was conducted from 2 to 5 October 2016 and the
focus was to record seafloor disturbances resulting from Phase 2 construction activities that took place
between May through August 2016. The last bathymetry survey was conducted on 18 and 19 May 2017,
and its purpose was to assess seabed recovery past-construction approximately 18-months post-
construction7. Table 27 shows key dates related to the seafloor disturbance and recovery monitoring.
Table 27. Seafloor disturbance and recovery monitoring survey summary.
Construction Phase
Duration of Construction
Major Activities Undertaken Disturbance and
Recovery Monitoring Survey Duration
Phase1 26 July–
26 October 2015 Installation of steel jacket
foundations 11 and 12 May 2016
Phase 2 13 May–
18 August 2016 Wind turbine generators were
installed on the foundations
2 to 5 October 2016
3 June –
26 June 2016.
Submarine transmission power cables connecting Block Island and mainland were laid using a jet plowing in the offshore portions and horizontal directional drilling in the near shore area.
Post-Construction
-- -- 18 and 19 May 2017
7 The actual survey dates were dictated by availability of research vessel, weather conditions, and sea states.

89
Figure 64. BIWF seafloor monitoring study area.
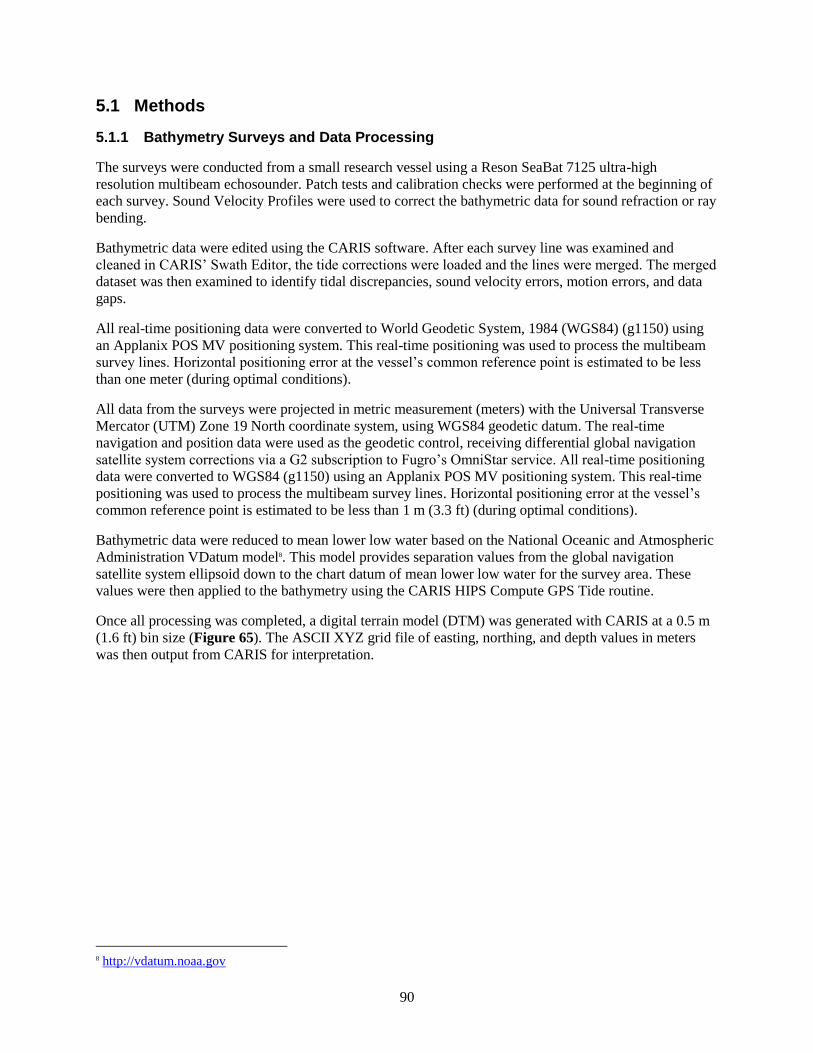
90
5.1 Methods
5.1.1 Bathymetry Surveys and Data Processing
The surveys were conducted from a small research vessel using a Reson SeaBat 7125 ultra-high
resolution multibeam echosounder. Patch tests and calibration checks were performed at the beginning of
each survey. Sound Velocity Profiles were used to correct the bathymetric data for sound refraction or ray
bending.
Bathymetric data were edited using the CARIS software. After each survey line was examined and
cleaned in CARIS’ Swath Editor, the tide corrections were loaded and the lines were merged. The merged
dataset was then examined to identify tidal discrepancies, sound velocity errors, motion errors, and data
gaps.
All real-time positioning data were converted to World Geodetic System, 1984 (WGS84) (g1150) using
an Applanix POS MV positioning system. This real-time positioning was used to process the multibeam
survey lines. Horizontal positioning error at the vessel’s common reference point is estimated to be less
than one meter (during optimal conditions).
All data from the surveys were projected in metric measurement (meters) with the Universal Transverse
Mercator (UTM) Zone 19 North coordinate system, using WGS84 geodetic datum. The real-time
navigation and position data were used as the geodetic control, receiving differential global navigation
satellite system corrections via a G2 subscription to Fugro’s OmniStar service. All real-time positioning
data were converted to WGS84 (g1150) using an Applanix POS MV positioning system. This real-time
positioning was used to process the multibeam survey lines. Horizontal positioning error at the vessel’s
common reference point is estimated to be less than 1 m (3.3 ft) (during optimal conditions).
Bathymetric data were reduced to mean lower low water based on the National Oceanic and Atmospheric
Administration VDatum model8. This model provides separation values from the global navigation
satellite system ellipsoid down to the chart datum of mean lower low water for the survey area. These
values were then applied to the bathymetry using the CARIS HIPS Compute GPS Tide routine.
Once all processing was completed, a digital terrain model (DTM) was generated with CARIS at a 0.5 m
(1.6 ft) bin size (Figure 65). The ASCII XYZ grid file of easting, northing, and depth values in meters
was then output from CARIS for interpretation.
8 http://vdatum.noaa.gov

91
Figure 65. Bathymetric map from Survey 1.

92
5.1.2 Data Interpretation Processed bathymetric data were loaded into a workstation and interpreted using Environmental Systems
Research Institute’s ArcGIS version 10.4.1 software program. In addition to the DTM, ArcGIS was used
to create bathymetric contours and sun-illuminated, hill shaded-relief renderings of the seafloor DTM to
enhance seafloor features and aid in visually identifying seafloor disturbances. Initially, a sink-analysis
was performed on each survey data set using ArcGIS. The sink-analysis identifies all closed depressions
(e.g., spud depression). After the automated screening step was completed, a user reviewed the features
and accepted or rejected the feature as being related to construction activities. Also during the review of
each feature, the user refined the digitized extent of the feature and calculated the size of each feature
(e.g., area, perimeter, and depth). Each digitized feature was associated with the respective construction
phase and stored in a GIS database file.
Interpreted seafloor disturbance features (Figure 66) are classified based on the following:
Spud: Circular or rectangular depressions arranged in a pattern that match one of the lift boats
and are generally located near a WTG. Likely created when a lift boat was on position during
installation of the foundation.
Circular Depression: Circular depression not associated with a geometric pattern that would
have been created when a lift boat was on position and had all 3 or 4 legs deployed. Circular
depression was generally located away from WTG position and may be related to a spud
depression or anchor drop.
Drag Mark: Elongated or linear disturbance feature likely created from the dragging of a spud
leg or anchor.
Scour: Scour feature that formed around the leg of the jacket foundation or around the concrete
mat cable protection.
Figure 66. Examples of seafloor disturbance features at WTG 4 observed in Survey 2 data.

93
Features interpreted from each survey were compared to their extents in the previous survey and
interpreted to be no change, partially healed, or completely healed. Completely healed features indicate
that the feature was no longer discernable in the data.
5.1.3 Data Variability and Repeatability
Water depths from an area outside the likely construction impact zone (reference site) were used to
establish a baseline degree of variability between the three surveys. Elevation differences between the
surveys were obtained by extracting data within the likely impact zone and then subtracting values on a
bin node-by-node basis. An average systematic bias of -0.04 (0.1 ft) and 0.02 m (0.07 ft) was observed in
the sample set that can likely be attributed to tidal error, subtle boat draft discrepancies, and normal
limitations associated with multibeam head calibration.
5.1.4 Data Quality
Sea states during the May 2016 survey were calm, resulting in good quality raw data. Minimal data
processing was required to generate bathymetric deliverables that were free of motion artifacts and other
surface noise. Sea states during the October 2016 were fair to marginal. Quality of the raw data collected
during the October 2016 survey was reported to be affected by the marginal sea states and motion
artifacts were noted on the outer portions of the bathymetric swath.
Post-acquisition data processing resulted in final deliverables of good quality; however, some motion
related artifacts are still observable in the final DTM but the data are deemed adequate for meeting the
study’s objectives. Data quality for the raw data collected for the May 2017 survey was affected by some
motion in the moonpool at the time of the survey; however, the overall data quality was good and post-
acquisition data processing resulted in final deliverables of good quality.
5.2 Results and Findings
5.2.1 Survey 1
During the first survey 160 seafloor disturbance features were interpreted. These features collectively
covered approximately 11,570 square meters (m2) (Table 28). Circular depressions comprise the largest
number of features; drag marks made up the largest total area of the five different categories of features.
5.2.2 Survey 2
During the second survey, 103 new seafloor disturbance features were interpreted. These features
collectively comprise an area of approximately 6,876 m2 (Table 28). Circular depressions comprised the
largest number of features; however, spud impressions comprise the largest total area of the three
different categories of features. New seafloor disturbance features that appeared to be associated with the
Construction Phase 2 were concentrated around each of the five WTG locations and along the inter-array
cable route.
5.2.3 Survey 3
Data from Survey 3 indicated that of the 160 disturbance features that were noted during the first survey,
64 features had partially healed and 75 were completely healed (Table 28). The completely healed
features covered approximately 4,194 m2, which indicated that approximately 36 percent of the disturbed
area has completely healed. Sixty of the 75 features that have completely healed were in or adjacent to
areas comprised predominantly of fine-grained sand. The other 15 features were in areas comprised of
predominantly medium- to coarse-grained sand. The data indicate that disturbance features in areas of
predominantly fine-grained sand recovered faster than in areas comprised predominantly of medium- to
coarse-grained sand.

94
Table 28. Comparison of bathymetry data from Surveys 1, 2 and 3.
Interpreted Features
Construction Season Baseline Disturbance Construction Season 1 (2015) Disturbances Construction Season 2 (2016)
Disturbances 2015 and 2016 Disturbances
Recovery Construction
Season 1 (2015) Features
Construction Season 2 (2016)
Features
Construction Seasons 1 and 2
Total
Recovery Since Baseline at Time of Survey 2 (Oct. 2016)
Recovery Since Baseline at Time of Survey 3 (May 2017)
Recovery Since Baseline at Time of Survey 3 (May 2017)
Nu
mb
er
of
Fe
atu
res
Are
a (
m2)
Nu
mb
er
of
Fe
atu
res
Are
a (
m2)
Nu
mb
er
of
Fe
atu
res
Are
a (
m2)
Part
ially H
eale
d
Fe
atu
res
Co
mp
lete
ly
Heale
d
Fe
atu
res
Co
mp
lete
ly
Heale
d A
rea
(m2)
Part
ially H
eale
d
Fe
atu
res
Co
mp
lete
ly
Heale
d
Fe
atu
res
Co
mp
lete
ly
Heale
d A
rea
(m2)
Part
ially H
eale
d
Fe
atu
res
Co
mp
lete
ly
Heale
d
Fe
atu
res
Co
mp
lete
ly
Heale
d A
rea
(m2)
Co
mp
lete
ly
Heale
d A
rea
(m2)
Perc
en
t D
istu
rbe
d A
rea
Co
mp
lete
ly
Heale
d
Spud 26 1,102 37 4,152 63 5,254 19 0 0 (0%) 8 18 663
(60%) 25 12 830 (20%) 1,493 28%
Circular Depressions
69 2,803 51 1,595 120 4,398 0 3 58 (2%) 31 38 1,454 (52%)
8 43 1,298 (81%) 2,752 63%
Drag Marks 44 6,414 13 1,129 57 7,543 1 12 1,300 (20%) 25 19 2,077 (32%)
1 12 1,061 (94%) 3,138 42%
Total 160 11,570 103 6,928 263 18,498 20 15 1,358 (13%) 64 75 4,194 (36%)
34 68 3,189 (46%) 7,383 40%
Note: Features were categorized as partially healed if the disturbance feature had lessened in size or depth but still remained discernible. A feature was labelled as completely healed if the feature was no longer discernible in the data set. Scour features were not included in these statistics because they are likely to be present as longs as the structures (e.g., foundations) are present.
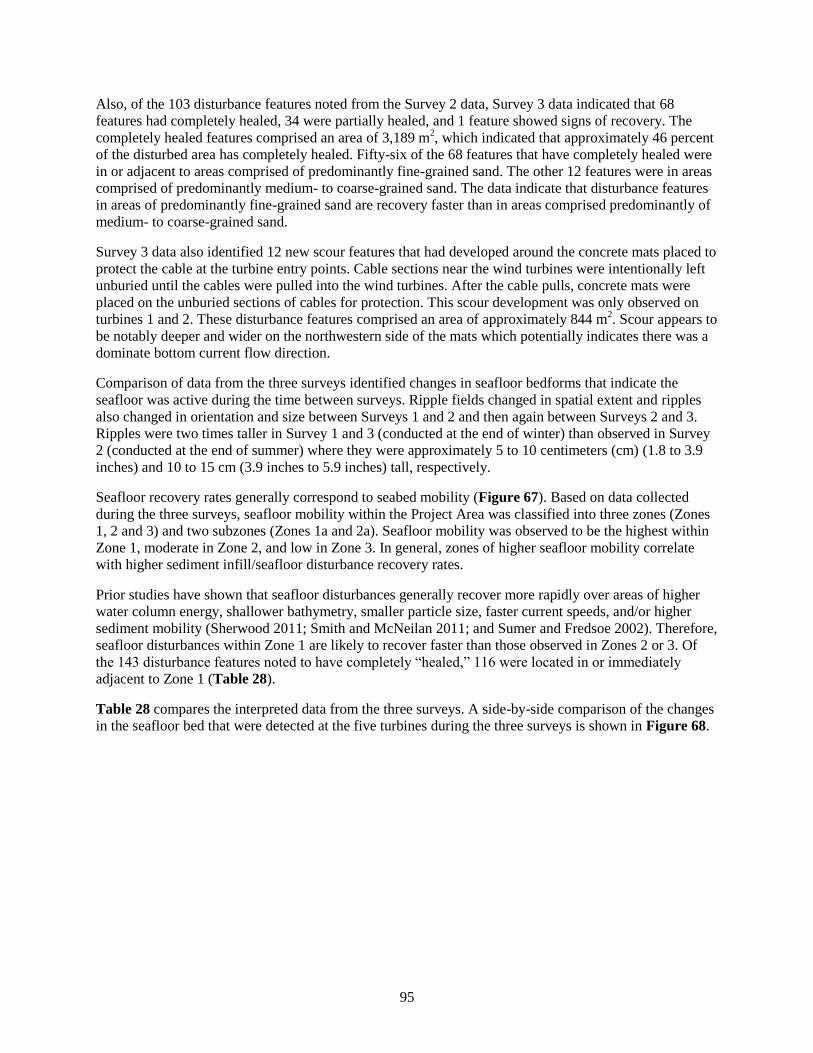
95
Also, of the 103 disturbance features noted from the Survey 2 data, Survey 3 data indicated that 68
features had completely healed, 34 were partially healed, and 1 feature showed signs of recovery. The
completely healed features comprised an area of 3,189 m2, which indicated that approximately 46 percent
of the disturbed area has completely healed. Fifty-six of the 68 features that have completely healed were
in or adjacent to areas comprised of predominantly fine-grained sand. The other 12 features were in areas
comprised of predominantly medium- to coarse-grained sand. The data indicate that disturbance features
in areas of predominantly fine-grained sand are recovery faster than in areas comprised predominantly of
medium- to coarse-grained sand.
Survey 3 data also identified 12 new scour features that had developed around the concrete mats placed to
protect the cable at the turbine entry points. Cable sections near the wind turbines were intentionally left
unburied until the cables were pulled into the wind turbines. After the cable pulls, concrete mats were
placed on the unburied sections of cables for protection. This scour development was only observed on
turbines 1 and 2. These disturbance features comprised an area of approximately 844 m2. Scour appears to
be notably deeper and wider on the northwestern side of the mats which potentially indicates there was a
dominate bottom current flow direction.
Comparison of data from the three surveys identified changes in seafloor bedforms that indicate the
seafloor was active during the time between surveys. Ripple fields changed in spatial extent and ripples
also changed in orientation and size between Surveys 1 and 2 and then again between Surveys 2 and 3.
Ripples were two times taller in Survey 1 and 3 (conducted at the end of winter) than observed in Survey
2 (conducted at the end of summer) where they were approximately 5 to 10 centimeters (cm) (1.8 to 3.9
inches) and 10 to 15 cm (3.9 inches to 5.9 inches) tall, respectively.
Seafloor recovery rates generally correspond to seabed mobility (Figure 67). Based on data collected
during the three surveys, seafloor mobility within the Project Area was classified into three zones (Zones
1, 2 and 3) and two subzones (Zones 1a and 2a). Seafloor mobility was observed to be the highest within
Zone 1, moderate in Zone 2, and low in Zone 3. In general, zones of higher seafloor mobility correlate
with higher sediment infill/seafloor disturbance recovery rates.
Prior studies have shown that seafloor disturbances generally recover more rapidly over areas of higher
water column energy, shallower bathymetry, smaller particle size, faster current speeds, and/or higher
sediment mobility (Sherwood 2011; Smith and McNeilan 2011; and Sumer and Fredsoe 2002). Therefore,
seafloor disturbances within Zone 1 are likely to recover faster than those observed in Zones 2 or 3. Of
the 143 disturbance features noted to have completely “healed,” 116 were located in or immediately
adjacent to Zone 1 (Table 28).
Table 28 compares the interpreted data from the three surveys. A side-by-side comparison of the changes
in the seafloor bed that were detected at the five turbines during the three surveys is shown in Figure 68.

96
Figure 67. Interpreted sediment mobility zones.

97
Figure 68. Side-by-side comparison of the seabed disturbance and recovery monitoring data from the three bathymetry surveys.

98
5.2.4 Wind Turbine Generator 1
WTG 1 is located in the northeastern-most section of the study area. The surficial sediment around this
turbine are characterized by coarse- to medium-grained sand with fine gravel and include patches of
rippled sand and gravel. The May 2016 bathymetry surveys showed 21 well-defined seafloor disturbances
around this turbine as a result of the Phase 1 construction activities. Over a 12-month period (i.e., through
May 2017), 12 of the 21 disturbances appeared to have completely healed and are were not discernable, 5
appeared diminished in depth most likely due to sediment infilling of up to 8 cm (3.2 inches), and the
remaining four disturbances did not show any significant change.
The October 2016 bathymetry survey indicated 48 well-defined disturbance features around turbine 1 as a
result of the Phase 2 construction activities. Over a seven month period (through May 2017), 33 of the 48
were completely healed and the remaining 15 showed varying levels of recovery because of sediment
infilling.
The May 2017 survey showed that several new scour features appear to have formed on the seafloor
around this turbine since the completion of the Phase 2 construction activities. These features include
disturbances on either side of the concrete mats that were placed on top of the inter-array cable to provide
protection to the section of cable that was intentionally not buried. The depth of scour for these features
ranges from 5 to 20 cm (2 to 7.9 inches) and extends up to approximately 3 m (9.8 ft) from the concrete
mats. Scour development appears to be more extensive in both depth and size on the northwest side of the
cable, possibly indicating a dominant flow direction of bottom currents.
5.2.5 Wind Turbine Generator 2
WTG 2 is also located in the northeastern-most section of the study area and surficial sediments in this
area are similar to those observed around turbine 1. The May 2016 bathymetry surveys showed 10 well-
defined seafloor disturbances around this turbine as a result of the Phase 1 construction activities. Over a
12-month period (through May 2017), 4 of the 10 features appeared to have completely healed and were
no longer discernable, 2 were reduced in depth because of sediment infilling of up to 3 cm (1.2 inches), 1
appeared to have widened in extent to the northwest by approximately 1.5 m (4.9 ft), and the remaining 3
did not show any change (Figure 69).
The October 2016 bathymetry survey indicated 16 well-defined disturbance features around turbine 2 as a
result of the Phase 2 construction activities. Over a 7-month period (through May 2017), 7 of the 16
features were completely healed and are no longer discernable, and the remaining 9 experienced some
degree of change associated with sediment infilling.
The May 2017 survey showed several new scour features that were formed since the completion of the
Phase 2 construction activities. These scour features were observed on either side of the concrete mats
that were placed on top of the inter-array cable to provide protection of the section of cable that was
intentionally not buried. The depth of scour ranged from 5 to 20 cm (2 to 7.9 inches) and extends up to
approximately 3 m (9.8 ft) from the concrete mats. Scour development appeared to be more extensive in
both depth and size on the northwest side of cable, possibly indicating a dominant flow direction of
bottom currents.
5.2.6 Wind Turbine Generator 3
WTG 3 is located in the central section of the study area, in a slightly deeper channelized area of the
seafloor where wave ripples were more dominant. The surficial sediment surrounding this turbine is
predominantly medium-grained sand with a minor component of fine gravel. The May 2016 bathymetry
surveys showed eight well-defined seafloor disturbances around this turbine as a result of the Phase 1
construction activities. Over a 12-month period (through May 2017), four of the eight features remained
unchanged.

99
Figure 69. Recovery of spud depressions at WTG 2.

100
The October 2016 bathymetry survey revealed four spud depressions around WTG 3 as a result of the
Phase 2 construction activities. Over a 7-month period (through May 2017), 1 feature was completely
healed and the remaining three showed decrease in depth because of sediment infilling of an average of 1
m (3.3 ft). No new seafloor disturbance features were observed on the seafloor around turbine 3 in May
2017.
5.2.7 Wind Turbine Generator 4
WTG 4 is located in the southwestern section of the study area and the surficial sediment surrounding this
turbine is made up of coarse sand and contains alternating patches (ridges/furrows) of sand and gravel.
Wave ripples up to 10 cm (3.9 inches) were also observed on the seafloor. The May 2016 bathymetry
surveys showed nine well-defined seafloor disturbances around this turbine as a result of the Phase 1
construction activities. Over a 12-month period (through May 2017), four of the nine features were
completely healed and the remaining five showed no measurable change.
The October 2016 bathymetry survey revealed 10 disturbance features around WTG 4 as a result of the
Phase 2 construction activities. Over a 7-month period (through May 2017), 6 of the 10 were completely
healed, and the remaining 4, which were spud depressions, underwent varying levels of sediment infilling.
Of four spud depressions that were still discernable in May 2017, the two located towards the southwest
seemed to have filled in with twice as much sediment as compared to the two located to the northwest
(Figure 70). The differential rate of infilling is probably due to the southwesterly depressions being
located in an actively migrating sand ripple field. No new seafloor disturbance features were observed on
the seafloor around WTG 4 in May 2017.
5.2.8 Wind Turbine Generator 5
WTG 5 is also located in the southwestern section of the study area and the surficial sediment
surrounding this turbine is predominantly medium sand. The May 2016 bathymetry surveys showed four
well-defined seafloor disturbances around this turbine as a result of the Phase 1 construction activities.
Over a 12-month period (through May 2017), none of these features showed significant change. The
October 2016 bathymetry survey also showed four disturbance features around WTG 5 as a result of the
Phase 2 construction activities. Over a 7-month period (through May 2017), all four features were
completely healed. No new seafloor disturbance features were observed on the seafloor around WTG 5 in
May 2017.
5.2.9 Seafloor Disturbances Elsewhere in the Work Area
The May 2017 survey showed that approximately 45 percent of the disturbances that resulted from Phase
1 construction activities in the Work Area (outside of the immediate vicinity of the turbines) were
completely healed and the rest showed varying levels of sediment infilling. Also, approximately 87
percent of the disturbances that from Phase 2 construction activities were completely healed and the rest
showed some change as a result of sediment infilling.
5.2.10 Surficial Sediment Mobility
Bathymetry survey data indicated variable bedforms in the BIWF Project Work Area. The bedforms
varied both in size (dune and ripple scale) and orientation. From May 2016 to May 2017, orientation and
location of individual bedforms appeared to have changed. Ripple fields changed in spatial extent and
ripples also changed in orientation and size between Surveys 1 and 2 and then again between Surveys 2
and 3. Ripples were two times taller in Survey 1 and 3 (conducted at the end of winter) than observed in
Survey 2 (conducted at the end of summer).

101
Figure 70. Variability in seafloor recovery at WTG 4.

102
These bedform changes were primarily responsible for the varying levels of disturbance feature sediment
infilling that was observed. Changing seasons also seem to have influenced the sediment mobility, which
in turn influenced rate of seabed recovery.
5.2.11 Overview of Spatial Extent of Disturbance at Wind Turbines
The spatial extent of seafloor disturbance surrounding the WTGs were evaluated. This evaluation
provides information that may be used to aid in defining the size of construction corridors where
construction equipment is permitted to disturb the seafloor. Currently in the United States, marine
archaeological resource assessment surveys of all areas potentially impacted by construction are required
prior to conducting activities (e.g., construction, geotechnical exploration, etc.) that will disturb the
seafloor. If the surveys and subsequent construction activities could be constrained to corridors in the
wind farm, then this could result in a reduction of the amount of area surveyed and ultimately time and
costs associated with the surveys.
It should be noted that the BIWF construction activities were not confined to a corridor but were
restricted to an area identified (referred to as the Work Area), which was surveyed under this monitoring
study. Therefore, seafloor disturbances identified outside the corridors discussed herein do not necessarily
indicate that a corridor approach is not feasible. However, developers would need to carefully consider
the corridor width required for their equipment.
It appears that the WTG installation vessels (Brave Tern and supporting lift boat [Figure 71]) occupied an
area within 150 m (1,476.4 ft) around each turbine. Most of the seafloor disturbance occurred within an
approximately 300 to 600 m (984.3 to 1,968.5 ft)-wide corridor (Figure 72).

103
Figure 71. Installation vessel impact extent at WTG 2.
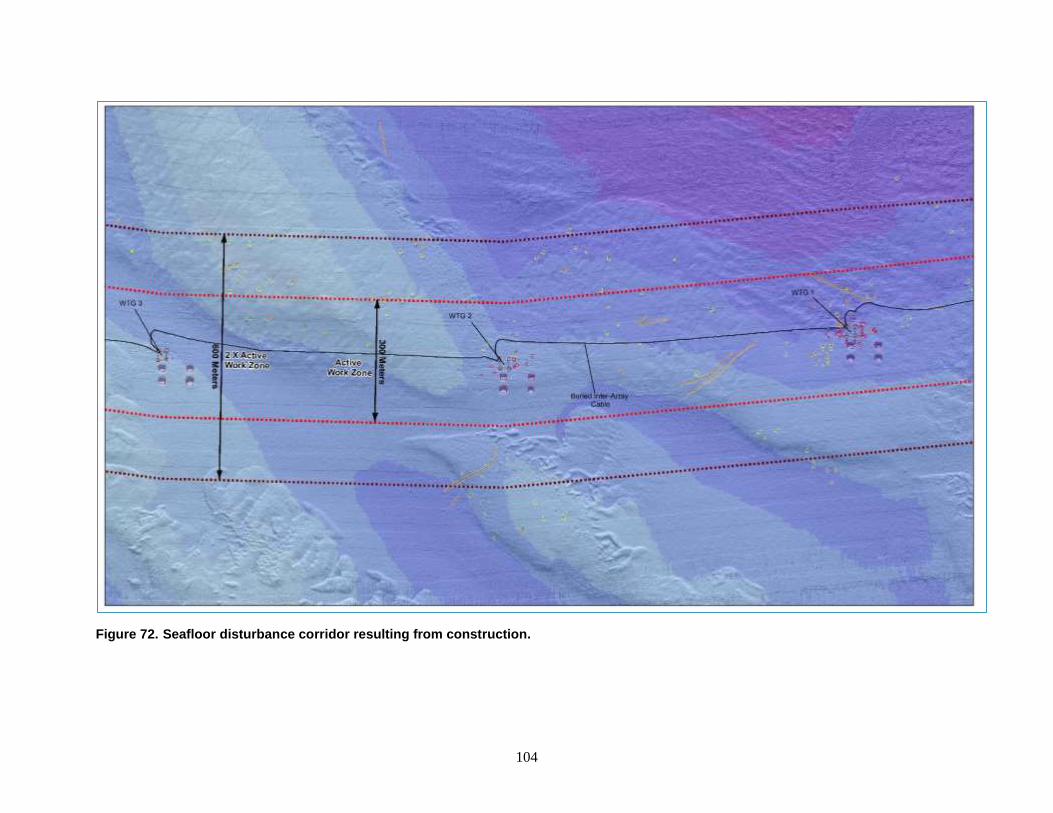
104
Figure 72. Seafloor disturbance corridor resulting from construction.

105
5.3 Wind Turbine Scour Assessment
The primary objective of this task was to develop, implement, and test a methodology for monitoring
scour around the WTG foundations using a scour monitor. The results of the scour monitoring will be
used to guide design of field studies for monitoring scour conditions at future offshore WTGs. A detailed
technical report from the scour assessment is contained in Appendix F.
5.3.1 Monitoring Approach and Methods
Two scour monitors (Figure 73) were installed on the BIWF WTG 3 foundation and changes in seabed
levels (scouring patterns) near the foundations were tracked over a 14-month period9. The units were
serviced every 3 months. An acoustic wave and current profiler (AWAC) was also simultaneously
deployed on a seabed frame approximately 500 m (1,640.4 ft) southeast of the turbine (Figure 73). The
wave, water level and current data collected by the AWAC were used to inform assessment of the factors
affecting seabed level changes as measured by the scour monitors. A comprehensive dataset of seabed
elevations near the turbine foundation and associated oceanographic data was generated by the study. The
data were analyzed to improve understanding of factors that influence scouring rates and patterns.
Figure 73. Scour monitor in bracketing (left); Seabed frame and AWAC (right).
Table 29 and Figure 74 show the instrument deployment locations and dates. Following the deployment
in June 2016, the monitors were serviced in November 2016, March 2017, and October 2017. Figure 75
is a schematic illustrating the position of the scour monitors on the turbine foundation.
Table 29. Equipment positions – deployment.
Location Name
Latitude (WGS84)
Longitude (WGS84)
UTM Coordinates (NAD83 Zone 19 N)
Deployment Date
Seabed Frame 41° 06’ 34.5” N 071° 31’ 00.5” W 288674.5 m E, 4553973.8 m N 15 June 2016
Anchor Weight 41° 06 ’36.2” N 071° 31’ 01.1” W 288662.0 m E, 4554026.6 m N 15 June 2016
Scour Monitors (WTG 3)
41° 06’ 54.0” N 071° 31’ 15.6” W 288339.6 m E, 4554585.4 m N 28 July 2016
See the Scour Monitoring Technical Report in Appendix F for additional information on the scour
monitor and AWAC configuration and techncial specifications.
9 Scour monitor data were collected for 14 months and 19 days; AWAC data were collected for 16 months and 3
days.

106
Figure 74. Location of deployed equipment.
107
Figure 75. Positioning of the scour monitors on the turbine foundation.

108
5.3.2 Monitoring Results
A comprehensive dataset of seabed elevations near the turbine foundation and associated oceanographic
data was generated by the study. The data were analyzed to improve understanding of factors that
influence scouring rates and patterns.
5.3.2.1 Oceanographic Data Summary
5.3.2.1.1 Water Levels
The Block Island tidal environment is dominated by the open ocean tidal signal, and is therefore
characterized by a semidiurnal micro-tidal (less than 2 m [6.6 ft] range) signal. The mean spring range is
1.1 m (3.6 ft) and the mean high water to mean low water interval difference is 6.1 hours; thus, the tide
curve is near symmetrical. The autumn and winter months show multiple periods of non-tidal (residual)
sea level variations. Figure 76 presents an extract of the sea level observations and the calculated non-
tidal values from a 60-point harmonic analysis of the 16 months of data. The residual values vary by up to
± 0.5 m (1.6 ft) and are thus approximately the same range as the astronomically forced tide. The form of
these appear to indicate two potential forcing processes:
Short to medium term suppression or enhancement of the sea level resulting from atmospheric
forcing, either variations in atmospheric pressure or wind enhancement
24- to 48-hour oscillations in the residuals that are indicative of a coastally trapped (or Kelvin)
wave, however additional data and analysis would be needed to correctly define these.
Figure 76. Winter water level data – height to lowest astronomic tide and residuals.
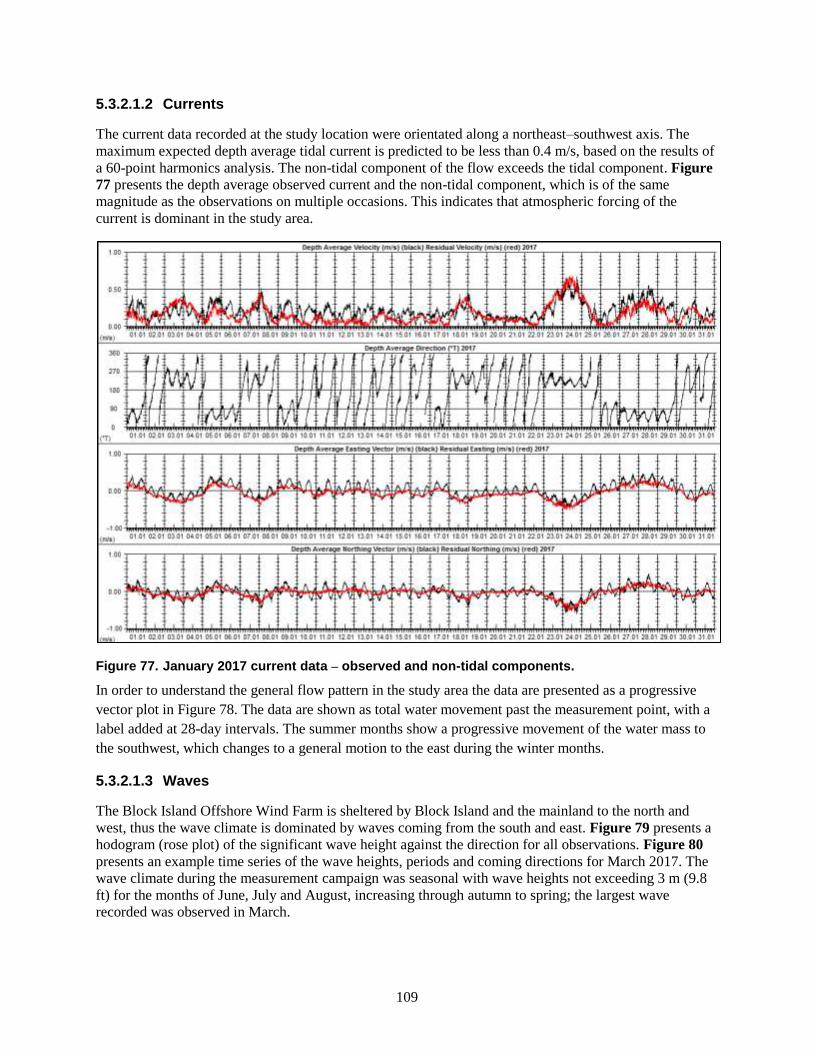
109
5.3.2.1.2 Currents
The current data recorded at the study location were orientated along a northeast–southwest axis. The
maximum expected depth average tidal current is predicted to be less than 0.4 m/s, based on the results of
a 60-point harmonics analysis. The non-tidal component of the flow exceeds the tidal component. Figure
77 presents the depth average observed current and the non-tidal component, which is of the same
magnitude as the observations on multiple occasions. This indicates that atmospheric forcing of the
current is dominant in the study area.
Figure 77. January 2017 current data – observed and non-tidal components.
In order to understand the general flow pattern in the study area the data are presented as a progressive
vector plot in Figure 78. The data are shown as total water movement past the measurement point, with a
label added at 28-day intervals. The summer months show a progressive movement of the water mass to
the southwest, which changes to a general motion to the east during the winter months.
5.3.2.1.3 Waves
The Block Island Offshore Wind Farm is sheltered by Block Island and the mainland to the north and
west, thus the wave climate is dominated by waves coming from the south and east. Figure 79 presents a
hodogram (rose plot) of the significant wave height against the direction for all observations. Figure 80
presents an example time series of the wave heights, periods and coming directions for March 2017. The
wave climate during the measurement campaign was seasonal with wave heights not exceeding 3 m (9.8
ft) for the months of June, July and August, increasing through autumn to spring; the largest wave
recorded was observed in March.

110
Figure 78. All current data – progressive vector plot.
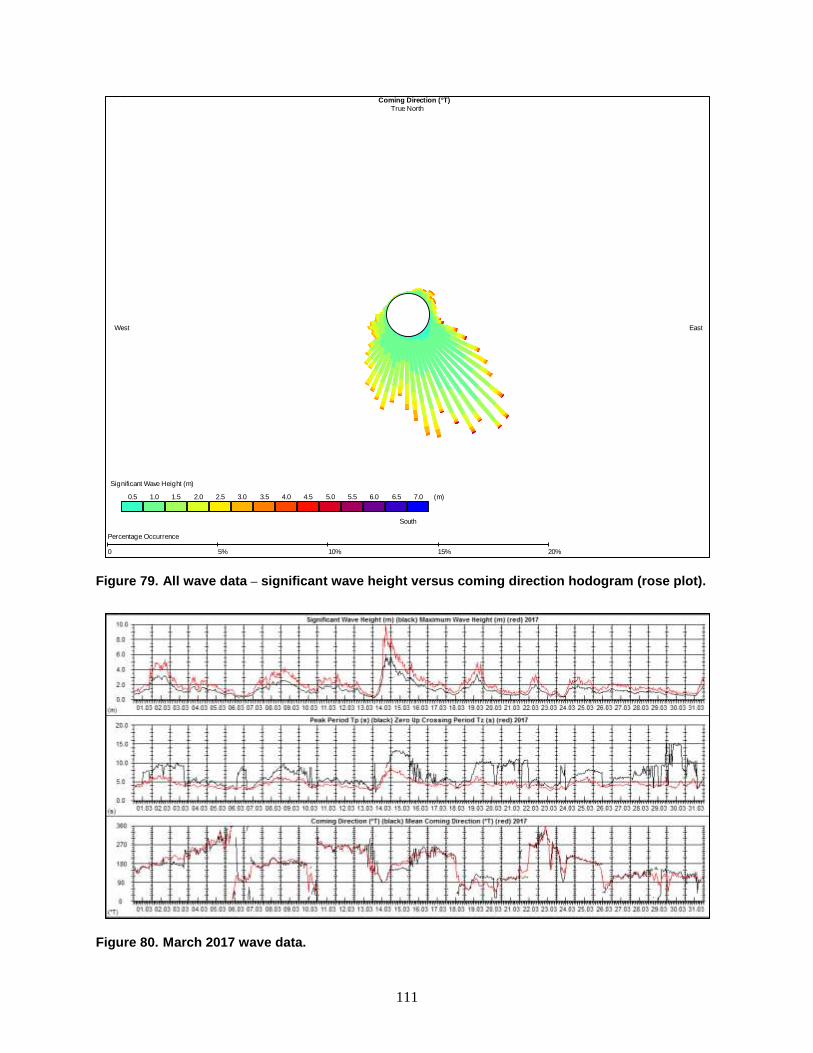
111
Figure 79. All wave data – significant wave height versus coming direction hodogram (rose plot).
Figure 80. March 2017 wave data.
HDR Environmental, Operations and Construction, Inc. Wav e Data Hodogram (Rose Diagram)Block Island Wind Farm: Fugro Scour Monitors, WTG 3, Deployment 1-4
Current Meter / AWAC Storm DataLatitude: 41°06'N Longitude: 071°31'W Approximate Site depth below LAT: 26.8m Instrument height off seabed: 0.6m
Serial No.: 1444/1457/1444/1457Deployed: 15/06/2016 15:09 Recovered: 21/10/2017 13:35
Fugro GB Marine Limited Coastal Oceanography Job No: 160215
Coming Direction (°T)
True North
South
West East
Significant Wave Height (m)
0.5 1.0 1.5 2.0 2.5 3.0 3.5 4.0 4.5 5.0 5.5 6.0 6.5 7.0 (m)
Percentage Occurrence
0 5% 10% 15% 20%

112
Table 30 presents a summary of the significant wave heights for each month and the number of storm
events observed (a storm event was defined as any period were significant wave height exceeded 3 m (9.8
ft) for this report). The seasonality of the reported events is clear with the highest number recorded in
January and through the winter months; however, there is a second smaller peak in September, coincident
with the period of anticipated hurricane activity. The duration of storm events observed in September
appear to be of longer duration than those in the winter months. However, the duration of the data is
insufficient to confirm the statistical significance of this observation.
5.3.2.2 Seabed Data Summary
5.3.2.2.1 Long-term Trends
Figures 81 to 88 present a temporal summary of seabed level data from beam 1 to 4 for SE and NE scour
monitors, respectively. Mean scour depth of each beam per month is shown in Figure 89 and a summary
mean scour profile is presented in Figure 90.
Beam 1 is orientated at an angle of 5° and therefore represents measurements taken closest to the turbine.
In contrast, beam 4 is orientated at an angle of 20° and represents measurements taken furthest from the
turbine. Scour data from the SE leg contained higher levels of interference, which resulted in a loss of the
seabed return signal for the 5° beam during the fourth deployment. Thus, summary statistics from the SE
leg are unreliable during July, September and October 2017. The NE leg showed little interference and
data were thus available for all month on all beams.
Also, the NE monitor seems to show an expected recovery of the seabed at increasing distance from the
foundation. Although the minimum level reached over the measurement period are in line. On the other
hand, data from the SE monitor is maybe somewhat misleading as it appears the orientation has changed
slightly, and the data became corrupted towards the end of the project. It is possible that the data from this
instrument show something interesting, in that beam1 data, closest to the foundation and potentially
recording the level of the mud mat, show an unexpected trend after April 2017.

113
Table 30. Monthly significant wave height statistics.
Month Maximum Mean Minimum Average number of events with significant wave
height > 3m, and approximate total duration (m) (ft) (m) (ft) (m) (ft)
January 4.74 15.55 1.507 4.94 0.38 1.25 4 events 40 hours
February 5.24 17.19 1.228 4.03 0.32 1.05 2 events 24 hours
March 6.04 19.81 1.407 4.61 0.32 1.05 3 events 60 hours
April 3.63 11.91 1.307 4.29 0.32 1.05 2 events 23 hours
May 3.06 10.04 1.189 3.90 0.36 1.18 1 event 1 hour
June 2.3 7.54 0.999 3.28 0.36 1.18 0 events (in 2 months)
July 2.14 7.02 0.886 2.91 0.38 1.25 0 events (in 2 months)
August 2.89 9.48 0.913 2.99 0.37 1.21 0 events (in 2 months)
September 3.5 11.48 1.396 4.58 0.4 1.31 2 events 40 hours (in 2 months)
October 3.28 10.76 1.254 4.11 0.31 1.02 1 event 3 hours (in 2 months)
November 2.94 9.64 1.209 3.97 0.39 1.28 0 events
December 3.44 11.28 1.385 4.54 0.32 1.05 2 events 24 hours
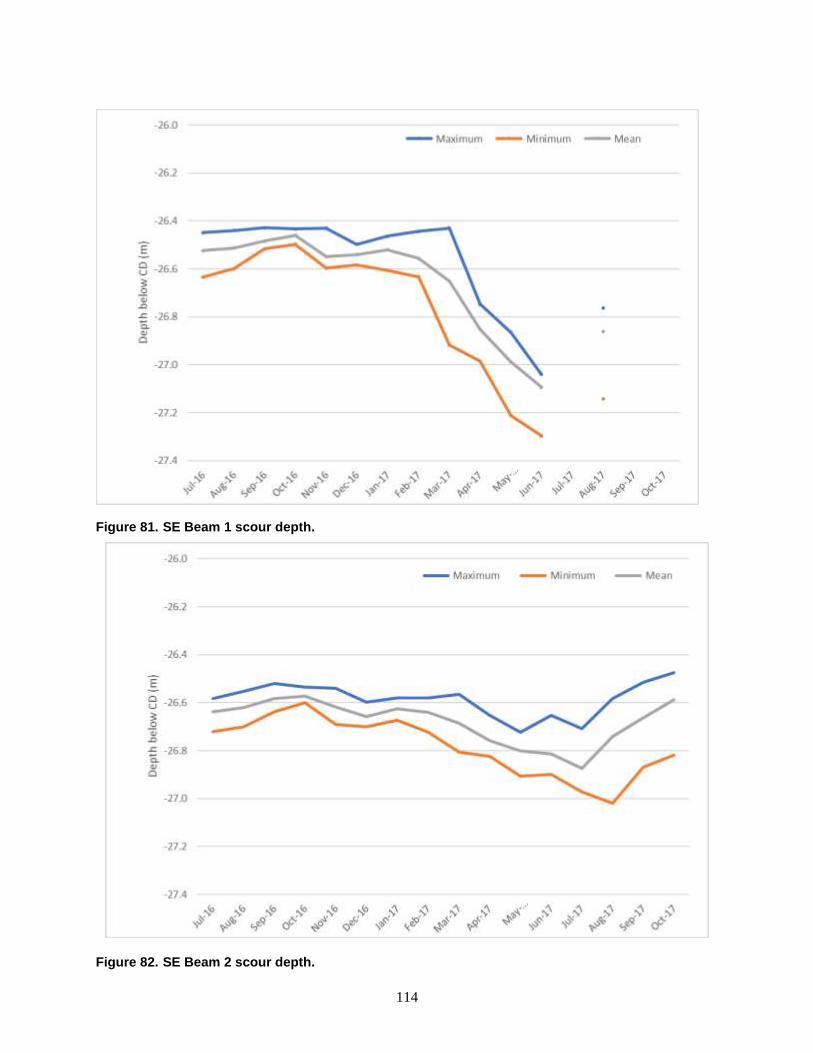
114
Figure 81. SE Beam 1 scour depth.
Figure 82. SE Beam 2 scour depth.

115
Figure 83. SE Beam 3 scour depth.
Figure 84. SE Beam 4 scour depth.

116
Figure 85. NE Beam 1 scour depth.
Figure 86. NE Beam 2 scour depth.
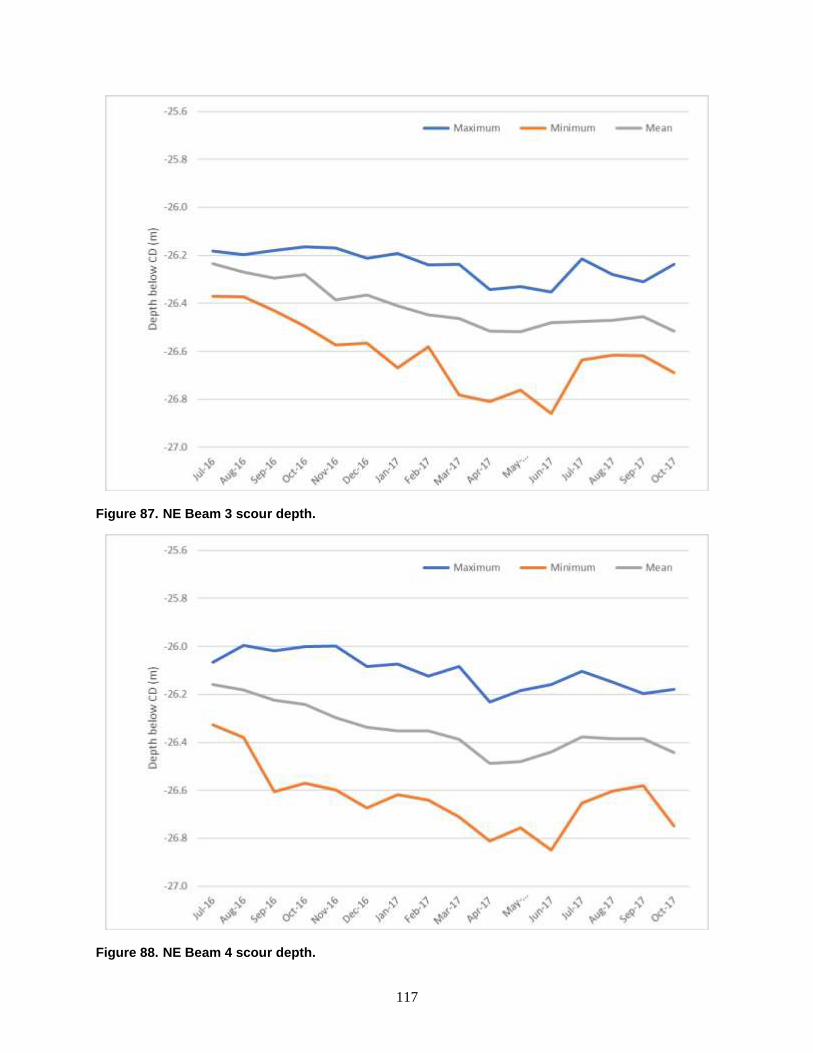
117
Figure 87. NE Beam 3 scour depth.
Figure 88. NE Beam 4 scour depth.

118
Figure 89. Mean scour depth of each beam per month.

119
Figure 90. Summary mean scour profile.

120
Figures 91 to 93 present a temporal summary of oceanographic data from the AWAC. Measurements
from both SE and NE units show a slow reduction in the monthly mean seabed level by approximately 0.2
m (0.7 ft) over 14 months. The range of seabed levels (monthly maximum and minimum) exhibit a
variation of up to 0.6 m (2 ft) over the month. There appears some correlation between the greatest levels
of scour and the highest significant wave heights as measured by the AWAC. It is possible that increased
wave action during the winter and early spring lead to reductions in seabed level. Some recovery of the
seabed level is seen, particularly on the SE leg. This may be due to increased deposition of sediments
following winter conditions close to the foundation. The NE unit shows a small recovery of the mean
seabed level (<0.1 m [0.3 ft]) during the summer months, July to September, but does not recover to the
levels observed at the start of the study.
5.3.2.2.2 Short-Term Trends
Short term trends show the seabed level responding to changing oceanographic conditions. Bed levels
appear to fluctuate by up to 0.2 m (0.7 ft) with tidal conditions. The current flow in the Block Island
development responds to increased wave action which significantly alters the flow pattern around the
structure leading to a change in the seabed topography at or close to the structure. Figures 94 and 95
present a comparative time series of scour heights from the northeast sensor compared to the sea level,
wave and current data. The scour data presented are based on a 3-hour rolling mean, with Beam 1 closest
to the foundation (approximately 5 m (16.4 ft) and Beam 4 furthest from the foundation (approximately
10 m 32.8 ft). The seabed scour level is generally deepest closest to the structure and gets shallower
progressively with distance from the foundation.
Variability of approximately 0.2 m (72.2 ft) over 12 to 24 hours is seen in August data (Figure 94) and
tends to occur in line with the tidal forcing, being most obvious during the period when the net current
flow is from the northeast towards the southwest. The presence of an area of sand ripples that are
migrating into the area around the foundation during the summer months have been observed in
bathymetric surveys conducted at the site (Fugro’s Seafloor Disturbance and Recovery Monitoring
Program Survey 3, May 2017, Block Island Wind Farm, 2017). Ripples that are approximately 0.1 to 0.2
m (0.4 to 0.7 ft) tall (peak to trough) are inferred to be dynamic and in the area surrounding the
monitoring site.
During periods of increased wave activity, the seabed level shows reduced variation, for example between
23 and 25 January 2017 (Figure 95). Further work is needed to understand the mechanism for this;
however, it is possible that the local seabed morphology changes and the sand ripples that migrate across
the site during calm conditions are levelled by the increased seabed disturbance.

121
Figure 91. Significant wave height.
Figure 92. Depth average velocity.

122
Figure 93. Residual water level.
Figure 94. Comparative time series for August 2016.

123
Figure 95. Comparative time series for January 2017.
5.3.3 Discussion and Conclusions
The general outcomes of the study were as follows:
The two scour monitors functioned as planned. A near continuous seabed elevation data set was
collected over the 14 months and 19 days.
The seabed mounted AWAC also functioned as planned. A near continuous oceanographic
condition (water levels, currents, and waves) dataset was collected over the 16 months and 3 days
deployment period.
The scour monitors returned the following data:
- Continuous acoustic return data along four beams per instrument
- Seabed elevations at distance up to 10 m (32.8 ft) rom the foundation
- Changes in the seabed elevation seen to occur at a variety of periodicities:
Less than one day, consistent with the periodicity of the local tidal forcing
Over the course of a week to a month, appearing to coincide with perturbations to the
tidal current flow resulting from increased wave energy
A seasonal signal consistent with increased wave activity in the winter months, and
calmer conditions in the summer months.
- The orientation of the acoustic beams allowed observation of the variation in seabed level
with distance from the foundation, and response of the seabed to physical oceanographic
forcing.
Issues encountered with the scour data:
- Orientation of the scour monitor on the southeast leg meant the data were collected closer to
the foundation than planned
- Corruption of one scour monitor beam on the southeast leg occurred during the final 3
months, probably due to interference from the structure

124
Lessons learned:
- Early interaction with the construction team was vital to allow bracketing to be mounted and
orientated correctly.
- At sites with a strong seasonal thermocline it is essential for long-term variation in the seabed
levels to be calculated using a speed of sound derived from a model of (or average of) the
conditions between the scour monitor and the seabed. In this case the presence of a strong
summer thermocline caused errors in the initial range calculations. Vertical conductivity,
temperature, and depth profiles taken in the summer months showed that the thermocline
depth was approximately midway between the scour monitor and the seabed. Thus, the
average speed of sound between the scour monitor and the seabed AWAC was calculated and
used to correct the acoustic ranges.
Future opportunities:
- The scour monitors provide a long-term time series of seabed elevations at specific points
close to the foundation (in this case up to 10 m (32.8 ft) that can be used to enhance the
understanding of the variation in seabed levels.
- The scour monitors allow measurement of the seabed response in conditions where
bathymetric surveys are not feasible.
- For future sites the scour monitors could be used at a limited selection of foundations in order
to support the assumptions about seabed mobility made during design, or if scour occurs
under specific circumstances then appropriate preventative intervention can be designed and
actioned to maximize the life of the structures.

125
6 References
Bibee, L.D. 2011. A comparison of seismometer and hydrophone recordings of VLF seismo-acoustic
signals, OCEANS 91 Proceedings, Volume: 1, 93 – 96.
Betke, K. 2006. Measurement of underwater noise emitted by an offshore wind turbine at Horns Rev.
Report for Institut fur technische und angewandte Physik GmbH (ITAP), Oldenburg, Germany.
Boué, M. 2007. Long-range sound propagation over the sea with application to wind turbine noise. Final
report for the Swedish Energy Agency project 21597-3. TRITA-AVE 2007:22 ISSN 1651-
7660Chapman CJ, Sand O. 1974. Field studies of hearing in two species of flatfish,
Pleuronectes platessa (L.) and Limanda limanda (L.) (Family Pleuronectidae), Comp. Biochem.
Physiol., 47A, 371–385.
Chapman C.J. and A.D. Hawkins. 1973. A field study of hearing in the cod, Gadus morhua L., J Comp.
Physiol, 85, 147–167.
Chapman C.J., and O. Sand. 1974. Field studies of hearing in two species of flatfish Pleuronectes
platessa (L.) and Limanda limanda (L.) (Family Pleuroncctidae). Comp. Biochem. Physiol.,
47A: 371-385.
Elliott J., K. Smith, D.R. Gallien, and A. Khan. 2017. Observing Cable Laying and Particle Settlement
During the Construction of the Block Island Wind Farm. Final Report to the U.S. Department
of the Interior, Bureau of Ocean Energy Management, Office of Renewable Energy Programs.
OCS Study BOEM 2017-027. 225 pp.
Fay R.R. 1988. Hearing in vertebrates: a psychophysics databook. Hill-Fay Associates, Winnetka,
Illinois. 621 pp.
Hawkins A.D. and A.N. Popper. 2016a. A sound approach to assessing the impact of underwater noise
on marine fishes and invertebrates. ICES Journal of Marine Science: Journal du Conseil, 74(3),
635-671.
Hawkins A.D. and A.N. Popper. 2016b. Developing sound exposure criteria for fishes. In A. N. Popper
& A. D. Hawkins (Eds.), The Effects of Noise on Aquatic Life II (pp. 431-439). New York:
Springer.
Hawkins A.D., A. Pembroke, and A. Popper. 2015. Information gaps in understanding the effects of
noise on fishes and invertebrates. Reviews in Fish Biology and Fisheries, 25, 39-64.
Hawkins A.D. and A.D.F. Johnstone. 1978. The hearing of the Atlantic salmon, Salmo salar. J. Fish.
Biol., 13, 655–673.
Kim H. 2014. Prediction of structure borne noise radiation and propagation from offshore impact pile
driving, PhD Dissertation, University of Rhode Island.
Kim H., G.R. Potty ., G. Dossot, K.B. Smith, and J.H. Miller. 2012. Long range propagation modeling
of offshore wind turbine construction noise using Finite Element and Parabolic Equation
models," IEEE OCEANS, 2012 - Yeosu (1)5, 21-24 May.

126
Ladich F. and R.R. Fay. 2013. Auditory evoked potential audiometry in fish. Rev Fish Biol Fisheries
(2013) 23:317–364. DOI 10.1007/s11160-012-9297-z.
National Marine Fisheries Service (NMFS). 2016. Technical Guidance for Assessing the Effects of
Anthropogenic Sound on Marine Mammal Hearing: Underwater Acoustic Thresholds for Onset
of Permanent and Temporary Threshold Shifts. (NOAA Technical Memorandum NMFS-OPR-
55). Silver Spring, MD: U.S. Department of Commerce Retrieved from
http://www.nmfs.noaa.gov/pr/publications/techmemos.htm.
National Oceanographic and Atmospheric Administration (NOAA). 2016. Ocean Noise Strategy
Roadmap: National Oceanographic and Atmospheric Administration.
Normandeau. 2012a. Effects of noise on fish, fisheries, and invertebrates in the US Atlantic and Arctic
from energy industry sound-generating activities. A Workshop Report for the US Department of
the Interior, Bureau of Ocean Energy Management.
Normandeau. 2012b. Effects of noise on fish, fisheries, and invertebrates in the U.S. Atlantic and Arctic
from energy industry sound-generating activities. A Literature Synthesis for the US Department
of the Interior, Bureau of Ocean Energy Management.
Potty G.R., J.H. Miller, Lin Ying-Tsong, A. Newhall, K.J. Vigness-Raposa. 2018 (in preparation).
Measurements of particle motion near the seafloor during construction and operation of the
Block Island Wind Farm. IEEE J. Ocean. Eng., in preparation.
Popper A.N. and A.D. Hawkins. 2018. The importance of particle motion to fishes and invertebrates.
The Journal of the Acoustical Society of America, 143, 470-486.
Popper A.N., A.D. Hawkins, R.R. Fay, D.A. Mann, S. Bartol, T.J. Carlson, S. Coombs, W.T. Ellison,
R.L. Gentry, and M.B. Halvorsen. 2014. Sound Exposure Guidelines for Fishes and Sea Turtles:
A Technical Report prepared by ANSI Accredited Standards Committee S3/SC1 and registered
with ANSI. New York: Springer.
Reinhall P.G. and P.H. Dahl. 2011. Underwater Mach wave radiation from impact pile driving: Theory
and observation J. Acoust. Soc. Am., 130, 1209-1216.
Sherwood C.R.. 2011. Directional Bottom Roughness Associated with Waves, Currents, and Ripples.
The proceedings of the Coastal Sediments 2011, pp. 1075-1086.
Smith K. and T. McNeilan. 2011. Seabed Scour Considerations for Offshore Wind Energy Development
in the Atlantic OCS., Technology Assessment and Research Study No. 656 prepared for the
Bureau of Ocean Energy Management.
Sumer B.M. and J. Fredsøe. 2002. The Mechanics of Scour in the Marine Environment. World
Scientific. Advanced Series on Ocean Engineering; No. 17.
Zar J.H. 1984. Biostatistical Analysis, Second Edition. Prentice Hall, Englewood Cliffs, N.J. 744 pp.

127
Appendix A: Field Plan
Appendix A is available as a separate digital file.

128
Appendix B: Visual Monitoring Data
During the visual monitoring, over 4,500 photographs were taken from Southeast Light House and
research vessels. These photographs provide visual examples of the types of activities that occurred
during construction. They were provided to BOEM on a DVD and are available upon request.
Selected high-quality photographs, which are illustrative of the construction activities described in this
report, are presented in the following photolog. Key observations recorded during onshore and offshore
visual monitoring are summarized in Sections 2.1 and 2.2, respectively. These two sections also include
a key for the photographs stored on the DVD that has been provided to BOEM. Section 2.3 describes
meteorological observations recorded during the visual monitoring.

129
Figure B-1. 9/07/2015 Offshore Photo 3929. Placing WTG 5 steel jacket in the water.
Figure B-2. 9/07/2015 Offshore Photo 3933. Placing WTG 5 steel jacket in the water.

130
Figure B-3. 9/07/2015 Offshore Photo 3943. Placing WTG 5 steel jacket in the water.
Figure B-4. 08/18/2015 Southeast Lighthouse, Block Island – Photo 0154: Weeks Barge 533
placing the diesel hammer on piling at WTG 2. First day of pile driving.

131
Figure B-5. 08/18/2015 Offshore Photo 0111: Weeks Barge 533 piling at WTG2 with diesel hammer
(notice smoke).
Figure B-6. 08/18/2015 Offshore Photo 0118: Diesel hammer piling at WTG 2.

132
Figure B-7. 08/18/2015 Offshore Photo 0111: Weeks Barge 533 removing diesel hammer from
piling at WTG2.
Figure B-8. 8/15/2015 Offshore Photo 0014: Two foundations, WTG 2 transition deck, and piles
aboard the Cashman barge with support tug Reed Danos. Anchor buoy visible.

133
Figure B-9. 09/17/2015 Offshore Photo 2359: WTG 1 steel jacket arriving onsite after being
repaired from being struck by a derrick barge after initial installation.
Figure B-10. 8/23/2015 Offshore Photo 0186: Weeks Barge 533 just placed third pile at WTG 3.

134
Figure B-11. 8/26/2015 Offshore Photo 0581: Supply vessel Josephine Miller and Weeks derrick
barge 526 at WTG 2. WTG 3 is to the far right with four piles ready to be driven.
Figure B-12. 8/29/2015 Offshore Photo 0622: Hydraulic hammer being lifted from Weeks Derrick
Barge 533.

135
Figure B-13. 8/30/2015 Offshore Photo 0679: Pile driving at WTG 3 with hydraulic hammer.
Figure B-14. 8/30/2015 Offshore Photo 0692: Pile driving at WTG 3 with hydraulic hammer.
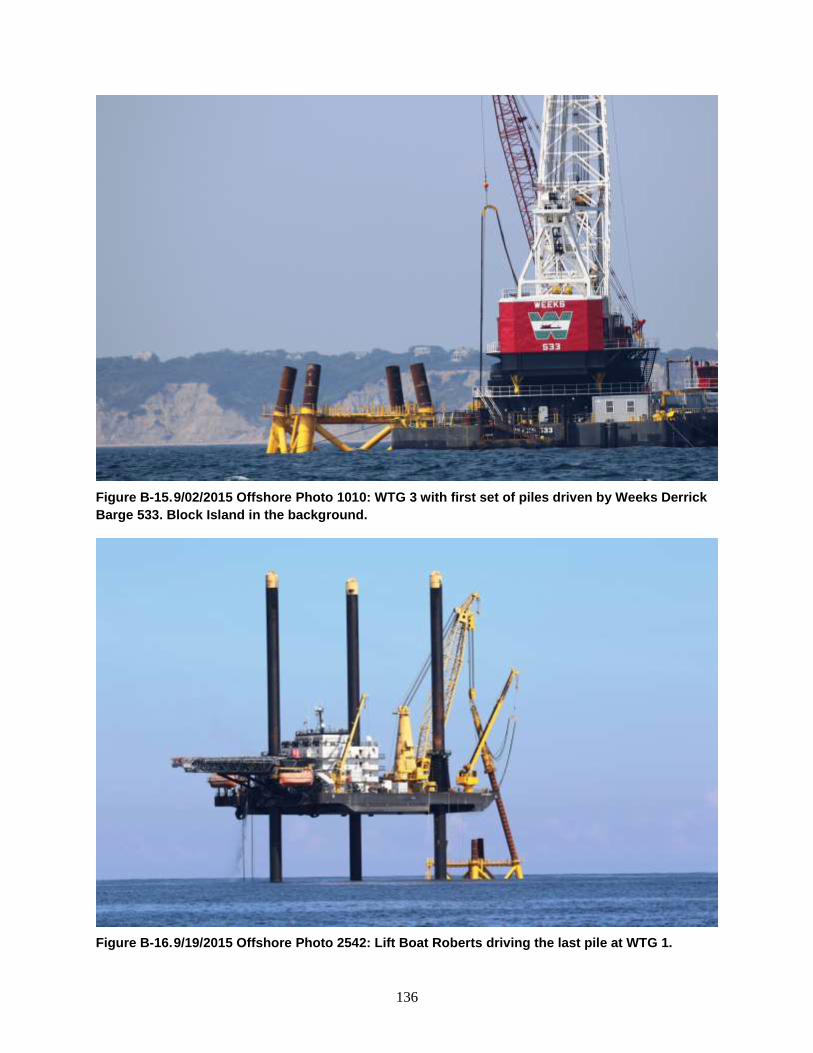
136
Figure B-15. 9/02/2015 Offshore Photo 1010: WTG 3 with first set of piles driven by Weeks Derrick
Barge 533. Block Island in the background.
Figure B-16. 9/19/2015 Offshore Photo 2542: Lift Boat Roberts driving the last pile at WTG 1.

137
Figure B-17. 9/17/2017 Offshore Photo 2352: Lift Boat Roberts driving the first pile at WTG 5.
Figure B-18. 11/09/2015 Onshore Southeast Lighthouse Photo 2591: Lift Boat Roberts placing
transition deck at WTG 4.

138
Figure B-19. 11/09/2015 Onshore Photo 2661: Lift Boat Robert at dusk next to WTG 4.
Figure B-20. 9/20/2015 Offshore Photo 2565: View shed to the south, WTGs 1-5. WTG 1 is in the
foreground.

139
Figure B-21. 9/20/2015 Offshore Photo 2579: Weeks Barge 526 next to WTG 5 with second set of
piles in place.
Figure B-22. 9/20/2015 Offshore Photo 2584 WTG 1 ready for transition deck.

140
Figure B-23. 8/25/2015 Offshore Photo 0483: Tug Robert.
Figure B-24. 9/01/2015 Offshore Photo 0861: University of Rhode Island’s Shanna Rose.
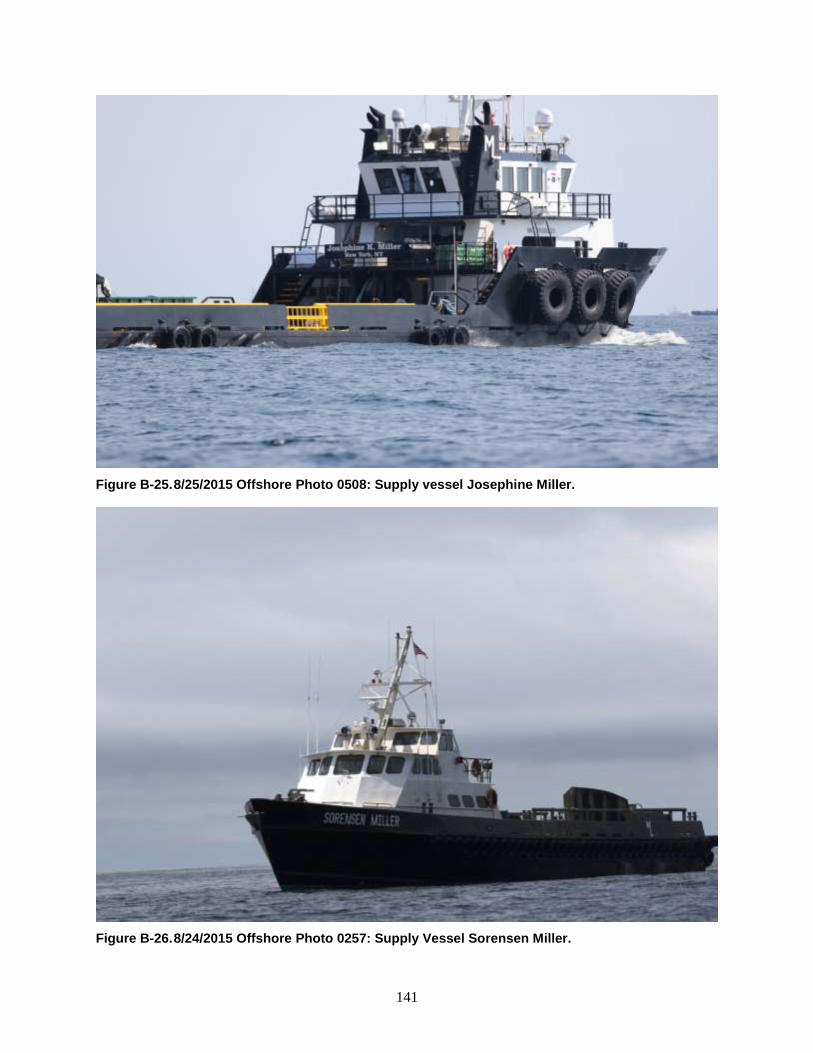
141
Figure B-25. 8/25/2015 Offshore Photo 0508: Supply vessel Josephine Miller.
Figure B-26. 8/24/2015 Offshore Photo 0257: Supply Vessel Sorensen Miller.
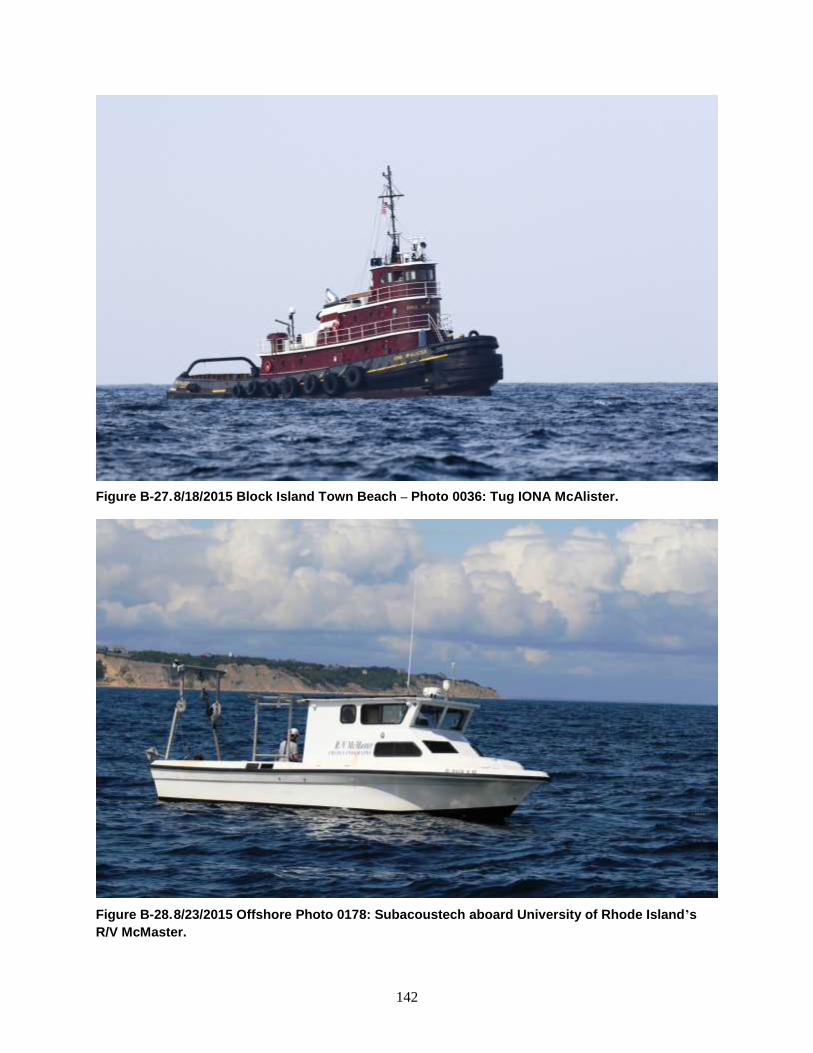
142
Figure B-27. 8/18/2015 Block Island Town Beach – Photo 0036: Tug IONA McAlister.
Figure B-28. 8/23/2015 Offshore Photo 0178: Subacoustech aboard University of Rhode Island’s
R/V McMaster.

143
Table B-1. Onshore Photo Log Key and Field Observation Summary
Date/Timestamp Observations Notes Photo Frames ID
08/18/2015 07:12:54 f8, 70 mm, first picture of survey, preparing to pile drive 90
08/18/2015 07:15:53 f8, 200 mm appear to be 2 piles sticking up from WTG 2
91–96
08/18/2015 08:09:10 f8' 70. Pile driving not started. Barge and 3 vessels on site.
97–99
08/18/2015 08:10:02 f8, 200 100–102
08/18/2015 08:26:38 f8' 70 mm. barge moved next to piling. 3 other vessels onsite.
103
08/18/2015 08:27:53 f8 200 mm 104
08/18/2015 08:52:03 f8, 200 mm hammer not in place yet 105–106
08/18/2015 08:53:57 f8, 70 mm haze creating poor vis. 107
08/18/2015 09:48:28 3 vessels onsite. 108–115
08/18/2015 10:14:43 3 vessels onsite. Weeks Barge has re-positioned near piling, appears crane may be hooking to hammer
118–121
08/18/2015 10:20:40 Crane stopped moving.
08/18/2015 10:30:04 The crane is picking up the hammer 124–146
08/18/2015 10:37:49 3 vessels onsite, one appears to be a tug. visibility has improved
08/18/2015 10:43:15 Another vessel just arrived, making 4 total onsite. 178–180
08/18/2015 10:49:18 Lifting hammer to top of piling at WTG 2 130–146
08/18/2015 11:12:39 Hammer is on pile. 3 vessels onsite 147–154
08/18/2015 11:27:41 Crane has moved hammer off the piling 157
08/18/2015 11:42:49 Another vessel on site, 4 total now 158–159
08/18/2015 11:55:45 Vessel passing by site 160–161
08/18/2015 12:24:50 2 new vessels on site (HDR vessel) 162–164
08/18/2015 12:59:04 Crane movement. 3 vessels on site. Construction communication shows they want to attempt pile driving again.
165–169
08/18/2015 13:12:54 Crane is placing hammer on pile at WTG 2 170–177
08/18/2015 13:22:21 Removed hammer from pile 178–204
08/18/2015 13:34:10 Lifting hammer off deck 205–206
08/18/2015 13:38:26 Crane is placing the hammer 207–213
08/18/2015 14:01:57 Hammer down , fishing vessel passing by 214–215
08/18/2015 14:08:04 Small vessel on site 217–216
08/18/2015 14:39:29 4 vessel on site 218–0219
08/18/2015 15:09:14 5 vessels on site , no activity on barge 220–221
08/18/2015 15:29:35 Crane is placing the hammer 224–229
08/18/2015 15:46:35 First strike heard 3:45 at WTG 2; another at 3:47; VHF radio indicates soft start.
230–231
08/18/2015 16:01:39 4:01 heard another strike. and another at 4:03 233–234
08/18/2015 16:05:03 4:05 heard 5 strikes
08/18/2015 16:08:08 4:07 another round of approximately 5 strikes.
08/18/2015 16:10:16 4:10 constant striking occurring 235–243
08/18/2015 16:13:59 4:13 pile driving stops
08/18/2015 16:23:59 Hammer moved off pile and back on barge 244–250
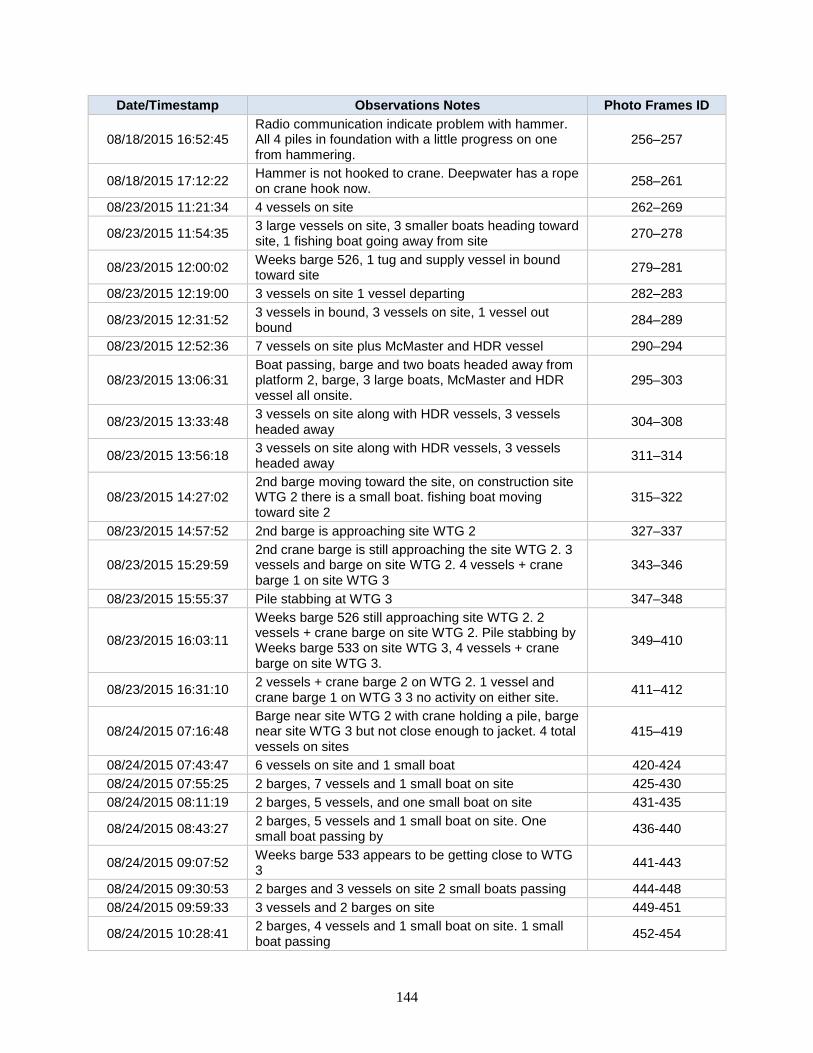
144
Date/Timestamp Observations Notes Photo Frames ID
08/18/2015 16:52:45 Radio communication indicate problem with hammer. All 4 piles in foundation with a little progress on one from hammering.
256–257
08/18/2015 17:12:22 Hammer is not hooked to crane. Deepwater has a rope on crane hook now.
258–261
08/23/2015 11:21:34 4 vessels on site 262–269
08/23/2015 11:54:35 3 large vessels on site, 3 smaller boats heading toward site, 1 fishing boat going away from site
270–278
08/23/2015 12:00:02 Weeks barge 526, 1 tug and supply vessel in bound toward site
279–281
08/23/2015 12:19:00 3 vessels on site 1 vessel departing 282–283
08/23/2015 12:31:52 3 vessels in bound, 3 vessels on site, 1 vessel out bound
284–289
08/23/2015 12:52:36 7 vessels on site plus McMaster and HDR vessel 290–294
08/23/2015 13:06:31 Boat passing, barge and two boats headed away from platform 2, barge, 3 large boats, McMaster and HDR vessel all onsite.
295–303
08/23/2015 13:33:48 3 vessels on site along with HDR vessels, 3 vessels headed away
304–308
08/23/2015 13:56:18 3 vessels on site along with HDR vessels, 3 vessels headed away
311–314
08/23/2015 14:27:02 2nd barge moving toward the site, on construction site WTG 2 there is a small boat. fishing boat moving toward site 2
315–322
08/23/2015 14:57:52 2nd barge is approaching site WTG 2 327–337
08/23/2015 15:29:59 2nd crane barge is still approaching the site WTG 2. 3 vessels and barge on site WTG 2. 4 vessels + crane barge 1 on site WTG 3
343–346
08/23/2015 15:55:37 Pile stabbing at WTG 3 347–348
08/23/2015 16:03:11
Weeks barge 526 still approaching site WTG 2. 2 vessels + crane barge on site WTG 2. Pile stabbing by Weeks barge 533 on site WTG 3, 4 vessels + crane barge on site WTG 3.
349–410
08/23/2015 16:31:10 2 vessels + crane barge 2 on WTG 2. 1 vessel and crane barge 1 on WTG 3 3 no activity on either site.
411–412
08/24/2015 07:16:48 Barge near site WTG 2 with crane holding a pile, barge near site WTG 3 but not close enough to jacket. 4 total vessels on sites
415–419
08/24/2015 07:43:47 6 vessels on site and 1 small boat 420-424
08/24/2015 07:55:25 2 barges, 7 vessels and 1 small boat on site 425-430
08/24/2015 08:11:19 2 barges, 5 vessels, and one small boat on site 431-435
08/24/2015 08:43:27 2 barges, 5 vessels and 1 small boat on site. One small boat passing by
436-440
08/24/2015 09:07:52 Weeks barge 533 appears to be getting close to WTG 3
441-443
08/24/2015 09:30:53 2 barges and 3 vessels on site 2 small boats passing 444-448
08/24/2015 09:59:33 3 vessels and 2 barges on site 449-451
08/24/2015 10:28:41 2 barges, 4 vessels and 1 small boat on site. 1 small boat passing
452-454

145
Date/Timestamp Observations Notes Photo Frames ID
08/24/2015 11:00:58 2 barges, 4 vessels, 2 small boats 455-460
08/24/2015 11:32:48 2 barges, 4 small boats, 6 vessels on site 461-463
08/24/2015 11:59:33 2 barges, 7 vessels and 4 little boats barge at left site is beginning to turn
464-467
08/24/2015 12:13:30 Weeks barge 526 at WTG 2 is moving closer to piles and turning
468-474
08/24/2015 12:43:54 2 barges 4 vessels 3 small boats on site barge is still moving closer to left site
475-480
08/24/2015 13:12:13 2 barges, 3 vessels, 3 small boats and 1 small passing boat
481-483
08/24/2015 13:22:11 Lifted hammer at WTG 2 484-498
08/24/2015 13:37:14 Lowering hammer back to deck at WTG 2. 499-504
08/24/2015 13:53:28 Crane no longer holding hammer, 2 barges 6 vessels and 3 small boats on site
505-507
08/24/2015 14:00:34 Crane at WTG 3 swung pile around, not closer to jacket
508-509
08/24/2015 14:29:59 2 barges, 4 vessels and 3 small boats on site. the crane with the pile is no longer holding the pile directly next to WTG 3 jacket
510-517
08/24/2015 14:54:57 Crane at right site is holding pile close jacket 518-527
08/24/2015 15:17:57 2 barges, 3 vessels, 1 small boat on site 527-530
08/24/2015 15:32:57 2 barges 4 vessels and 1 small boat 531-533
08/25/2015 07:27:43 Very foggy, close to zero visibility 534-539
08/25/2015 07:59:11 Can't see anything 540-541
08/25/2015 08:33:04 Still can't see anything 542-543
08/25/2015 09:01:01 Can't see anything 544-545
08/25/2015 09:32:09 Can't see anything but fog is starting to lighten up 546-547
08/25/2015 10:08:53 Still too foggy. can't even see the water 548-549
08/25/2015 10:32:14 Still can't see anything 550-551
08/25/2015 10:59:19 Still can't see the water 552-553
08/25/2015 11:30:04 Still can't see the water 554-555
08/25/2015 11:57:31 WTG 3: Pile is being held up by the crane, 1 barge and 3 vessels on site. Left site: there are 3 vessels and a crane barge no activity
558-559
08/25/2015 12:20:06 Crew boat at barge on left site 565-566
08/25/2015 12:59:19 WTG 2: 3 boats and Weeks barge. WTG 3: crane barge and 3 boats
571-572
08/25/2015 13:09:04 Last pile has been stabbed into the right jacket 575-576
08/25/2015 13:32:23 Right site: no activity on crane barge, 2 boats. left site: no activity on crane barge, 3 boats
579-580
08/25/2015 13:58:32 Nothing has changed from previous 596-597
08/25/2015 14:22:46 Lifted the crane at WTG 2 but some distance from the jacket, incoming service barge from the south side
598-599
08/25/2015 14:39:52 Lifting hammer at WTG 2 606-609
08/25/2015 15:02:59 Weeks Barge moving closer to WTG 2 610-622
08/25/2015 15:21:50 Weeks Barge lifting hammer 623 - 634
08/25/2015 15:50:56 Weeks Barge lifting up the hammer. 635-639

146
Date/Timestamp Observations Notes Photo Frames ID
08/25/2015 16:10:58 After short stop in operation , crane lifting hammer again
640-651
08/25/2015 16:23:54 Crane bringing down the hammer again. 653-654
08/25/2015 16:33:08 Deepwater just sat hammer down on deck and asked if other barge had a welder.
08/25/2015 16:37:07 Crane barge on WTG 3 , separated from jacket and approaching site WTG 2
656 -659
08/25/2015 17:10:22 No new activity. 679 -682
08/26/2015 07:53:30 2nd crane barge is not on site. The first crane barge is moored close to WTG 2. 2 other service vessel on WTG 2. No activity. 5 vessels + crane barge on site
683-691
08/26/2015 08:36:22 Weeks barge is getting close to WTG 2 692 -695
08/26/2015 09:00:48 Weeks barge and 3 vessels on site, no visual activity. the service tug disconnected from barge
696 -701
08/26/2015 09:32:57 Crew boat inbound, Weeks barge on site WTG 2. 4 vessels +crane barge on site. no piling activity
702-713
08/26/2015 10:00:30 No visual activity on site. 4 vessels + crane barge on site.
714 -716
08/26/2015 10:33:36 Barge movement on site 2, rotating on the old location only. 2 vessel + crane barge on site 2. No activity on site 3.
717 -719
08/26/2015 11:02:11 2nd barge still in previous position. Crane activity on barge. No sign of other activities. 2 vessels + crane barge on site.
720 -725
08/26/2015 11:38:30 No visual activity ,2 boats and crane barge on site 726 -728
08/26/2015 12:01:18 No new activity. Discussing whales on VHF. 729 -732
08/26/2015 12:31:30 Crane repositioned. 3 boat + crane barge on site 2. 733 -742
08/26/2015 12:37:37 Service vessel moving in bond of crane barge 743 - 744
08/26/2015 12:49:38 The service vessel is moving out of site 2. 745 -747
08/26/2015 13:06:17 A whale surfaced near WTG 2. 748 -764
08/26/2015 13:09:53 2 vessels + crane barge on site. No activity 765 -767
08/26/2015 13:39:44 2 vessels + crane barge on site. Crane relocated. No visual sign of pile driving.
768 -771
08/26/2015 13:53:22 Transferring some equipment using small crane to the service vessel.
772-775
08/26/2015 14:01:27 3 boat + crane barge on site. 776 -779
08/26/2015 14:27:46 Some equipment has been shipped off the barge by a service boat
780 -785
08/26/2015 14:57:08 Crane movement. A new tug boat inbound to WTG 3. Connected to jacket on WTG 3. No sign of pile driving yet.
786 -796
08/26/2015 15:33:25 Tug boat disconnected from WTG 3 moving toward crane barge. No activity on crane barge.
797 -799
08/26/2015 15:38:20 Tug boat attached to port side of crane barge 800 -815
08/26/2015 15:49:55 2nd tug boat moving toward the crane barge. The first tug boat is connected to barge.
816 -833
08/26/2015 16:08:31 Weeks barge moving away from WTG 2. No visual pile driving activity.
834 -836

147
Date/Timestamp Observations Notes Photo Frames ID
08/26/2015 16:30:55 One of the tug boats connected on port side of crane barge. Another one is close the crane hook on the starboard of crane barge. No visual pile driving activity.
837 -839
08/28/2015 13:41:12 The crane barge approaching WTG 3. 3 vessels + crane barge on site. No activity on WTG 2.
841-850
08/28/2015 14:10:53 Barge slowly try to dock on the jacket. 3 vessels moved back from WTG 3
851 -852
08/28/2015 14:44:08 No new activity on the barge. 3 vessels + crane barge on site
866 -867
08/28/2015 15:10:16 Pick up chatter on radio, about a damaged caliper. Barge requested for hydraulic Jack to fix it. No new activity on site regarding pile driving.
870 -871
08/28/2015 15:23:57 Crane relocation on barge 872 -880
08/28/2015 15:35:05 The crane cable is down. The service boat is back on site. 5 vessels + crane barge on site
881 -894
08/28/2015 15:48:47 Incoming service vessel from north to WTG 3. 895 -911
08/28/2015 16:03:19 Service vessel disconnected from barge. no crane activity at the moment
912 -913
08/28/2015 16:19:24 Service vessel leaved the construction site. 914 -915
08/28/2015 16:36:56 6 vessels + crane barge on site. No visual pile driving activity.
916 -920
08/28/2015 17:02:41 A chatter on the radio showed they still working on a caliper on barge. Crew is asking for spare steel shaft.
08/28/2015 17:09:27 A tug boat connected to the barge, crane movement on barge, no sign of pile driving.
921 -934
08/28/2015 17:36:54 Barge request a mechanic for fixing the cliper. Some crane activity. No sign of pile driving. 3 vessels and crane barge on site 3. 1 service vessel on site 2.
935 -936
08/28/2015 17:59:04 Chatter on radio about fixing the winch. Construction crew calls ends work for the day.
937-944
08/29/2015 07:28:43 No activity on site. 3 vessels (Heather Lynn, HDR, and unknown) + Weeks barge on site.
945 -947
08/29/2015 07:47:53 The project manager vessel and environmental team vessel on site. Crane activity on the barge.
948 -949
08/29/2015 08:00:22 6 vessels (Supply vessel, Lindsey E, HDR, fishing vessels, Heather Lynne) + Weeks barge at WTG 3. No visual pile driving activity
950 -951
08/29/2015 08:16:04 Chatter on radio: PSO gave them thumbs up for start 954
08/29/2015 08:30:25 4 vessel + crane barge on site. Chatter on radio as they try to lift the hammer at WTG 3
954 -955
08/29/2015 08:42:19 They are lifting the hammer 960 -964
08/29/2015 08:48:13 The barge is getting closer to the WTG 3 jacket. 965 -971
08/29/2015 09:03:06 Hammer is half way up. Weeks barge getting closer to the jacket.
973-974
08/29/2015 09:08:09 Positioning hammer over the piles on WTG 3 975 -986
08/29/2015 09:22:19 Hammer on top of pile 988 -989
08/29/2015 09:30:19 Heard a chatter on radio the hammer is stuck on the pile
995
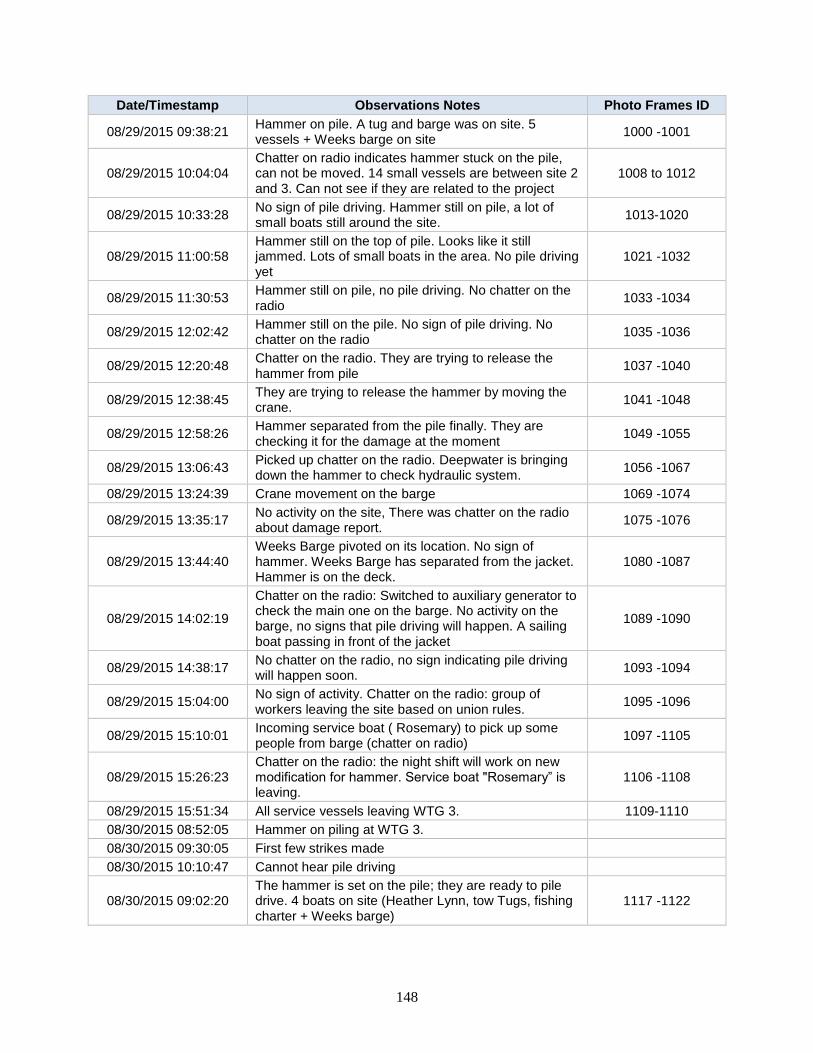
148
Date/Timestamp Observations Notes Photo Frames ID
08/29/2015 09:38:21 Hammer on pile. A tug and barge was on site. 5 vessels + Weeks barge on site
1000 -1001
08/29/2015 10:04:04 Chatter on radio indicates hammer stuck on the pile, can not be moved. 14 small vessels are between site 2 and 3. Can not see if they are related to the project
1008 to 1012
08/29/2015 10:33:28 No sign of pile driving. Hammer still on pile, a lot of small boats still around the site.
1013-1020
08/29/2015 11:00:58 Hammer still on the top of pile. Looks like it still jammed. Lots of small boats in the area. No pile driving yet
1021 -1032
08/29/2015 11:30:53 Hammer still on pile, no pile driving. No chatter on the radio
1033 -1034
08/29/2015 12:02:42 Hammer still on the pile. No sign of pile driving. No chatter on the radio
1035 -1036
08/29/2015 12:20:48 Chatter on the radio. They are trying to release the hammer from pile
1037 -1040
08/29/2015 12:38:45 They are trying to release the hammer by moving the crane.
1041 -1048
08/29/2015 12:58:26 Hammer separated from the pile finally. They are checking it for the damage at the moment
1049 -1055
08/29/2015 13:06:43 Picked up chatter on the radio. Deepwater is bringing down the hammer to check hydraulic system.
1056 -1067
08/29/2015 13:24:39 Crane movement on the barge 1069 -1074
08/29/2015 13:35:17 No activity on the site, There was chatter on the radio about damage report.
1075 -1076
08/29/2015 13:44:40 Weeks Barge pivoted on its location. No sign of hammer. Weeks Barge has separated from the jacket. Hammer is on the deck.
1080 -1087
08/29/2015 14:02:19
Chatter on the radio: Switched to auxiliary generator to check the main one on the barge. No activity on the barge, no signs that pile driving will happen. A sailing boat passing in front of the jacket
1089 -1090
08/29/2015 14:38:17 No chatter on the radio, no sign indicating pile driving will happen soon.
1093 -1094
08/29/2015 15:04:00 No sign of activity. Chatter on the radio: group of workers leaving the site based on union rules.
1095 -1096
08/29/2015 15:10:01 Incoming service boat ( Rosemary) to pick up some people from barge (chatter on radio)
1097 -1105
08/29/2015 15:26:23 Chatter on the radio: the night shift will work on new modification for hammer. Service boat "Rosemary” is leaving.
1106 -1108
08/29/2015 15:51:34 All service vessels leaving WTG 3. 1109-1110
08/30/2015 08:52:05 Hammer on piling at WTG 3.
08/30/2015 09:30:05 First few strikes made
08/30/2015 10:10:47 Cannot hear pile driving
08/30/2015 09:02:20 The hammer is set on the pile; they are ready to pile drive. 4 boats on site (Heather Lynn, tow Tugs, fishing charter + Weeks barge)
1117 -1122

149
Date/Timestamp Observations Notes Photo Frames ID
08/30/2015 09:22:37 The caption acknowledge presence of HDR team near the WTG 3
08/30/2015 09:25:23 They Inform on radio pile driving is on! The offshore vessel had couple hits.
1123 -1126
08/30/2015 09:29:06 They were 10 spaced strokes and their acoustic team on the radio approve the sound level for pile driving
08/30/2015 09:31:07 They start to pile drive consistently. Can't hear any noise at SE Lighthouse.
08/30/2015 09:32:39 The boat acknowledge they do the pile driving in 1 Hz 1127 -1145
08/30/2015 09:38:55 The pile is 1/3 driven. 1146-1156
08/30/2015 09:48:29 Still driving, hear no noise at lighthouse regarding pile driving! The level of noise and wind direction would not allow me to hear the impacts.
08/30/2015 09:55:55 They are still piling driving and it's going forward slowly! Still too much noise can not hear anything. More than half of the pile has been driven.
1157-1163
08/30/2015 10:04:14 Still pile driving. Looks it's slowly going forward. I can see 9 vessel + Weeks barge on site.
1068-1070
08/30/2015 10:08:43 More than two third of pile has been driven , still no piling sound can be heard
1171-1173
08/30/2015 10:18:29 Finally I can hear the strokes in lighthouse location. 1174
08/30/2015 10:25:05 It's the last 10 percent of pile. Still hear the strokes! It's less than 1 hz strokes
1175-1178
08/30/2015 10:28:21 Pile driving complete on south east corner pile. Looks like they are all through.
1179 -1187
08/30/2015 10:40:27 Separating the hammer from the pile 1188 -1189
08/30/2015 10:44:26 Chatter on the radio: Difficulty removing hammer. 1195
08/30/2015 10:46:19 Chatter on radio : Repositioning barge for better angle for putting the hammer on next pile
1199 -1200
08/30/2015 10:54:00 Chatter: They are trying to set the hammer for the next pile, looks like they have an issue.
1202 -1216
08/30/2015 10:58:22 They are lots of small boats between WTGs 2 and 3. Still in progress of releasing the hammer from jacket for next pile driving
1217
08/30/2015 11:02:18 Chatter: Attempting to put the hammer back on barge deck
1219 -1232
08/30/2015 11:09:11 Chatter: Looks like a hose stuck on pile and they are having a problem setting the hammer on deck.
1234 -1235
08/30/2015 11:30:08 Hammer is still on crane hook. Chatter on radio: they still need to bring the hammer on deck for resetting and deal with the hydraulic lines.
1242 -1243
08/30/2015 11:32:41 Try to put the hammer on the barge 1243 -1248
08/30/2015 11:58:40 Still working on hammer. 1256 -1257
08/30/2015 12:12:35 Lifting the hammer again for another try to release the hose from jacket
1261 -1274
08/30/2015 12:41:39 Hammer is back on the deck. chatter : they requested a welder
1275-1276
08/30/2015 13:00:59 VHF Chatter : looks like there are something wrong with the winch , they requested a mechanic

150
Date/Timestamp Observations Notes Photo Frames ID
08/30/2015 13:03:35 They are moving the barge. 4 vessels + crane barge on site
1277 -1278
08/30/2015 13:37:37 They were trying to relocate the barge for doing the second pile
1279 -1303
08/30/2015 14:15:52 Still repositioning the barge. 1304 -1310
08/30/2015 14:25:33 Service vessel Rosemary Miller, approaching the barge. bring some personnel
1311 -1314
08/30/2015 14:30:11 Service vessel Rosemary Miller is moving out of the site
1315 -1317
08/30/2015 14:45:33 They barge still moving toward the new position. 1318 -1327
08/30/2015 14:55:51 They pick the hammer out of the deck. 1328-1333
08/30/2015 15:12:55 They try to put the hammer up but they had wrong angle (chatter), putting the hammer on the barge again
1334 -1343
08/30/2015 15:24:41 Picking the hammer up again 1344 -1349
08/30/2015 15:30:19 They put the hammer back down; they are changing the barge position.
1350 -1374
08/30/2015 16:06:28 Still repositioning the barge, no sign of hammer. 1375 -1381
08/30/2015 16:21:12 They are still reposition the barge. Received update they are resuming work tomorrow morning
1382 -1383
08/31/2015 18:44:47 Started sound meter around 08:45; restarted at 11:56:42
09/01/2015 12:24:48 4 boats at WTG 3 1384-1385
09/01/2015 12:33:44 4 vessels; no driving; restarted meter at 11:56:42; meter started around 8:45 for the day
1386-1387
09/01/2015 12:55:43 1 vessel, Weeks Barge 1388-1389
09/01/2015 13:24:34 3 vessels moving north out of area; crane moving 1390-1391
09/01/2015 13:41:26 Moving hammer to pile at WTG 3 1392-1393
09/01/2015 13:54:50 Setting hammer back down 1397-1398
09/01/2015 14:25:14 2 vessels and 2 planes pass by 1399-1400
09/01/2015 15:10:13 Crew still working on barge 1401-1402
09/01/2015 15:29:03 Raising the hammer 1403-1404
09/01/2015 15:40:37 Hammer appears to be on the pile at WTG 3 1408-1409
09/01/2015 15:48:04 One possible blow 1410-1412
09/01/2015 15:51:38 First 3 soft starts occurred at 15:50; next15:52;15:53:30 full impact
1413-1414
09/01/2015 15:53:38 Started
09/01/2015 15:54:03 Stopped
09/01/2015 15:54:58 Restart 1415-1420
09/01/2015 16:21:59 Continue driving 1421-1428
09/01/2015 16:53:55 Stopped at 16:48:00
09/01/2015 16:54:41 Hammer off pile 1429-1431
09/01/2015 17:24:57 Moving barge; 3 vessels in area 1432-1433
09/01/2015 18:02:07 No activity 1434-1435
09/02/2015 08:53:27 Extremely foggy; started meter at 08:45 1436-1437
09/02/2015 09:16:01 Still extremely foggy; can barely make out barge 1438-1445
09/02/2015 09:45:34 Visibility just dropped again, I cannot see the barge;9:53 I can no longer see water
1446-1448

151
Date/Timestamp Observations Notes Photo Frames ID
09/02/2015 10:13:31 Visibility is extremely bad, cannot see water 1449-1451
09/02/2015 10:18:55 Start hammer at WTG 3; 10:21 fog horn started around that time
1452-1453
09/02/2015 10:31:24 Restarted; will need to rely on Tyler for exact start and stop
1454-1455
09/02/2015 11:02:18 Extreme fog and glare cannot see water 1456-1457
09/02/2015 11:07:40 Hammer stopped 1458-1459
09/02/2015 11:14:26 Barge repositioning; fog beginning to lift 1460-1463
09/02/2015 11:21:23 Repositioning barge 1464-1470
09/02/2015 12:01:13 Moving barge around 1471-1473
09/02/2015 12:19:54 Hammer is up at WTG 3 1473-1476
09/02/2015 12:36:29 Hammer is on pile at WTG 3 1477-1478
09/02/2015 12:46:44 Barely hear driving, assumed it started at 12:44 1479-1480
09/02/2015 12:55:17 Barely hearing hammer; 5 vessels present 1481-1482
09/02/2015 13:05:59 Pile still being driven 1483-1484
09/02/2015 13:14:20 Driving deeper 1485-1486
09/02/2015 13:36:01 Continuous driving 1487-1488
09/02/2015 13:38:30 Just stopped 1489-1490
09/02/2015 14:19:18 End of day, moving barge, 2 piles driven today at WTG 3
1495-1496
09/03/2015 08:48:56 Started meter at 8:47
09/03/2015 09:03:48 Moving crane; appears to be 4 vessels in the area of WTG 2
1497-1501
09/03/2015 09:39:57 Moving things around on barge 1502-1503
09/03/2015 09:45:55 Lifting the hammer onto pile at WTG 2; 9 vessels in sight
1504-1505
09/03/2015 09:54:03 Hammer is on pile at WTG 2 1506-1507
09/03/2015 10:00:00 Start at 9:58:40; 6 vessels 1508-1509
09/03/2015 10:10:25 8 vessels in area while driving 1510-1511
09/03/2015 10:30:36 Pile driving ended around 10:22:00;hammer is off pile 1512-1513
09/03/2015 10:57:13 Placing hammer on next pile at WTG 2; 5 vessels visible
1514-1517
09/03/2015 11:09:37 Visibility dropped, very poor, can barely make out barge
1518-1519
09/03/2015 11:14:25 Visibility dropped, very poor, can barely make out barge; 4 bangs
1520-1521
09/03/2015 11:39:35 Visibility is still poor 1522-1523
09/03/2015 12:00:38 Stopped driving at 11:42; again visibility is extremely poor, no photos taken
09/03/2015 12:46:26 Visibility very poor, can barely make out barge, have not heard what's going on
1524-1525
09/03/2015 13:02:05 Visibility very poor, can barely make out barge, have not heard what's going on, can only see 3 vessels
09/03/2015 13:37:57 Visibility is getting better; the other tug and barge are crossing in front of the main barge
1526-1527
09/03/2015 14:03:57 Visibility improving; waiting on wildlife boat; about to lift the hammer; 6 vessels
1528-1529

152
Date/Timestamp Observations Notes Photo Frames ID
09/03/2015 14:18:29 Lowering hammer on pile, visibility is fair 1530-1531
09/03/2015 14:37:01 Hammer on pile 1532-1533
09/03/2015 14:43:55 14:43:53 start 1533-1536
09/03/2015 14:48:26 Temporarily stopped
09/03/2015 14:51:25 Resumed at 14:51:16
09/03/2015 15:10:52 Visibility worsening, faintly hear hammer 1537-1538
09/03/2015 15:21:13 Stopped at15:16:23; barely heard hammering; lots of ambient noise; visibility is very poor, only see 3 vessels
09/03/2015 15:59:42 Positioning hammer; visibility is poor 1539-1540
09/03/2015 16:36:09 Moving hammer; visibility is very poor about 3 vessels in sight
1541-1543
09/03/2015 16:43:07 Hammer is going on; fog horn in distance north
09/03/2015 16:53:18 Started full at 16:52:10; visibility is very poor 1544-1545
09/03/2015 17:11:38 Continuing; visibility is very poor 1546-1547
09/03/2015 17:21:35 End pile driving at 17:18:09 1548-1549
09/03/2015 17:24:16 Visibility is very poor; end of day
09/06/2015 20:00:00 Night time photos 3857-3886
09/07/2015 13:53:43 WTG 3, there are 3 welders that are welding northeastern most pile in the jacket. At WTG 5, Weeks Barge is placing foundation in water (jacket).
3980-3986
09/07/2015 14:15:17 Continuing same as before; WTG 3 is welding pile onto other pile; WTG 5 straps still on jacket
09/07/2015 14:31:24 WTG 3, successfully welded pile to another pile (looks like NE most pile) unaided by crane; on WTG 5 a tug entered area
3987-3997
09/07/2015 15:04:52 WTG 3, welding on unaided pile, barge maybe being pushed to different position; on WTG 5, jacket maybe in proper position, checking now
3987-4006
09/07/2015 15:34:17 WTG 3 appears they are prepping another pile to lift, and continue welding; on WTG 5, lowering crane boom on jacket, appears they are finalizing jacket position.
4007- 4014
09/07/2015 20:11:29 Night time shots. WTG 3, they have 2 piles up, welding on the pile; on WTG 5,barge has released the jacket
4015-4023
09/08/2015 07:59:07
Can only see WTG 3, continued welding on second pile and preparing the third pile (crane over pile barge); extremely hazy/foggy and windy not as much wind as yesterday; fog horn sounding before I got here
4024-4034
09/08/2015 08:16:10 Heavier haze/fog rolled in, will come back later today to check progress
09/08/2015 11:25:48
Does not appear to be a second barge, but jacket 5 is in place; visibility cleared up significantly; continued welding and the 3rd pile is hooked up to the crane and being lifted
4035-4047
09/08/2015 11:43:53 Pile being raised is angled/pointed
09/08/2015 11:52:48 Pile is being placed into position 4048-4068
09/08/2015 17:06:56 Pile 3 is being worked on welding, still attached to crane; wind has greatly increased from this morning
4069-4074
09/08/2015 17:31:29 Seem to be working somewhat cautiously because of high winds and swell; still welding third pile.

153
Date/Timestamp Observations Notes Photo Frames ID
09/08/2015 19:37:41 Night pictures. Still working on welding 3rd pile; at the moment, it does not appear to be anybody on the pile
4075-4082
09/09/2015 07:59:34 Welding 4th extender pile on, still breezy but not as bad as yesterday
4089-4094
09/09/2015 08:21:13 Appears they are welding piles 3 and 4
09/09/2015 08:28:30 Moving pile barge southeast towards jacket 5 4095-4099
09/09/2015 08:47:43 Crane is off the pile, still welding pile 3; relocating pile barge northward
4100-4103
09/09/2015 09:33:23 Welding on pile 4 4104-4106
09/09/2015 14:43:04 Appears that they are inspecting the piles, and very little welding
4107-4111
11/09/2015 08:24:43
Start visual survey of installation of transition deck on WTG 4. Deepwater Wind on VHF65. They have transition deck on crane and started positioning. DW said they would not start till 12:00
11/09/2015 08:38:31 LB Roberts next WTG 4 installing the transition deck. 400 mm zoom
2588-2591
11/09/2015 08:42:06 100 mm zoom. LB Roberts with 3 tugs and crew tender 2592
11/09/2015 08:43:11 LB Roberts at WTG 4 installing transition deck 2593-2594
11/09/2015 08:44:16 WTG 5 - no activity. 400 mm 2595
11/09/2015 08:46:06 WTG 3 - no activity 2596
11/09/2015 08:47:49 WTG 2 with transition deck previously installed. No activity
2597
11/09/2015 08:48:40 WTG 1 with top deck that has been previously installed.
2598
11/09/2015 08:54:35 Slowly lowering transition deck onto piles from steel foundation.
2599
11/09/2015 08:58:27 Radio communication indicate platform is set and within tolerance. They are doing final inspection to prepare for welders
11/09/2015 09:14:19 41deg09.167 o71deg33.110 GPS coordinates of observation site
11/09/2015 09:35:46 Deepwater lowering boom to unhook from top 2605
11/09/2015 09:41:19 Taken by sign so Change GPS coordinates 2606-2608
11/09/2015 09:45:39 3 tugs and crew tender still onsite, have not moved 2608
11/09/2015 10:06:29 Crane is de-rigging from top deck. Small fishing boat in background
2611
11/09/2015 10:11:37 Rosemary Miller is the crew tender onsite per VHF communications
11/09/2015 10:23:37 Rosemary miller crew tender leaving site. WTG 2 in background
2612-2613
11/09/2015 10:34:21 Crane unhooked from platform at no. 4 2614
11/09/2015 10:40:09 LBV Roberts starting to jack down, crane is unhooked. They are lowering walkway that welders use to access the transition deck on WTG 4
2615
11/09/2015 11:04:30 Weeks barge with top deck, leaving moving away from WTG 4, pulled by 2 tugs. 100 mm
2616
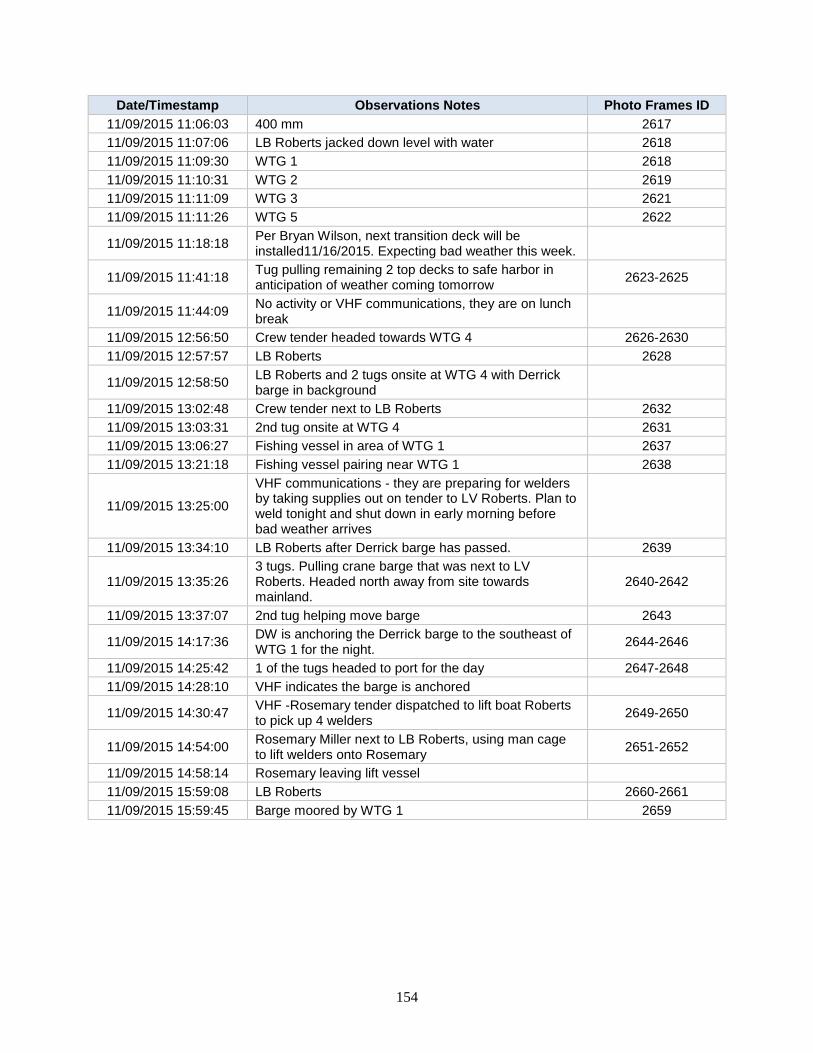
154
Date/Timestamp Observations Notes Photo Frames ID
11/09/2015 11:06:03 400 mm 2617
11/09/2015 11:07:06 LB Roberts jacked down level with water 2618
11/09/2015 11:09:30 WTG 1 2618
11/09/2015 11:10:31 WTG 2 2619
11/09/2015 11:11:09 WTG 3 2621
11/09/2015 11:11:26 WTG 5 2622
11/09/2015 11:18:18 Per Bryan Wilson, next transition deck will be installed11/16/2015. Expecting bad weather this week.
11/09/2015 11:41:18 Tug pulling remaining 2 top decks to safe harbor in anticipation of weather coming tomorrow
2623-2625
11/09/2015 11:44:09 No activity or VHF communications, they are on lunch break
11/09/2015 12:56:50 Crew tender headed towards WTG 4 2626-2630
11/09/2015 12:57:57 LB Roberts 2628
11/09/2015 12:58:50 LB Roberts and 2 tugs onsite at WTG 4 with Derrick barge in background
11/09/2015 13:02:48 Crew tender next to LB Roberts 2632
11/09/2015 13:03:31 2nd tug onsite at WTG 4 2631
11/09/2015 13:06:27 Fishing vessel in area of WTG 1 2637
11/09/2015 13:21:18 Fishing vessel pairing near WTG 1 2638
11/09/2015 13:25:00
VHF communications - they are preparing for welders by taking supplies out on tender to LV Roberts. Plan to weld tonight and shut down in early morning before bad weather arrives
11/09/2015 13:34:10 LB Roberts after Derrick barge has passed. 2639
11/09/2015 13:35:26 3 tugs. Pulling crane barge that was next to LV Roberts. Headed north away from site towards mainland.
2640-2642
11/09/2015 13:37:07 2nd tug helping move barge 2643
11/09/2015 14:17:36 DW is anchoring the Derrick barge to the southeast of WTG 1 for the night.
2644-2646
11/09/2015 14:25:42 1 of the tugs headed to port for the day 2647-2648
11/09/2015 14:28:10 VHF indicates the barge is anchored
11/09/2015 14:30:47 VHF -Rosemary tender dispatched to lift boat Roberts to pick up 4 welders
2649-2650
11/09/2015 14:54:00 Rosemary Miller next to LB Roberts, using man cage to lift welders onto Rosemary
2651-2652
11/09/2015 14:58:14 Rosemary leaving lift vessel
11/09/2015 15:59:08 LB Roberts 2660-2661
11/09/2015 15:59:45 Barge moored by WTG 1 2659

155
Table B-2. Offshore Photo Log Key and Field Observations Summary
Date/Timestamp Observations Notes Photo Frames ID
08/18/2015 06:42:01 Leaving harbor
08/18/2015 07:14:37 Arrived on site, Cashman supply barge with foundations and piles on deck, tug Reed Danos
0011-0014
08/18/2015 07:21:18 Tender ship "Rosemary Miller" just departed, we are 750m northwest of platform
0019
08/18/2015 07:51:42 Tug "Robert" and Tug "Elizabeth" 0016-0017
08/18/2015 08:20:09 Weeks Barge 533 gearing up to start pile driving. Cranes are moving!
0018
08/18/2015 08:39:06 Marine Mammal Lookout vessel “Heather Lynn" hanging out 500m south of barge.
0048-0051
08/18/2015 09:44:13 Team removed a balloon floating in water, from Block Island wedding
08/18/2015 10:18:46 "Lindsey E" ~25 ft white, down east style boat 0064-0068
08/18/2015 10:26:41 Large crane is picking up the hammer 0069-0084
08/18/2015 10:41:51 Transfer boat "Rosemary Miller" arriving 0085-0088
08/18/2015 10:48:23 Transfer boat "Rosemary Miller" leaving 0089
08/18/2015 10:51:33 Placing hammer to top of first piling, WTG 2 0090
08/18/2015 10:56:55 Hammer fixed to piling 0091
08/18/2015 11:35:54 Removed hammer from pile and setting it back down on the barge
100-110
08/18/2015 13:03:46 Picking the hammer back up. We think work halted for lunch break.
08/18/2015 13:24:00 Rosemary Miller is back
08/18/2015 13:32:05 Putting the hammer back down, again.
08/18/2015 13:42:38 Hammer attached to top of piling
08/18/2015 13:59:10 Picking hammer back up off piling and lowering it back to the deck
08/18/2015 15:25:50 Lifting the hammer 111
08/18/2015 15:33:00 Hammer on top of piling at WTG 2. 112
08/18/2015 15:45:54 Heard a few single smacks. "Soft start" to test hammer. 113-120
08/18/2015 16:01:08 Couple big smacks
08/18/2015 16:04:50 Started hammering for about 5 seconds
08/18/2015 16:07:43 Started hammering again for about 5 seconds. Deepwater testing how much pile moves after being struck.
08/18/2015 16:09:49 Hammering again. Can see piston moving and exhaust smoke
121
08/18/2015 16:12:37 Video of pile driving. 122
08/18/2015 16:12:00 Pile driving stopped
08/18/2015 16:15:06 Moving hammer back to the deck
08/18/2015 16:25:27 The Lindsey E has left. Boats remaining on site are the two tugs and the fishing vessel Heather Lynn. Pictures of URI McMaster.
124-127
08/23/2015 11:56:34 Arrived on site. WTG 3 appears to have 2 of 4 piles stabbed. 2 tugs and a fishing vessel on site. Barge for WTG 2 pile driving inbound.

156
Date/Timestamp Observations Notes Photo Frames ID
08/23/2015 12:24:25 Tug Robert comes out to meet Weeks 526 Derrick barge
130 - 134
08/23/2015 12:25:48 Tugboat Robert 134-138
08/23/2015 12:27:28 Supply vessel Josephine K Miller arrives onsite 139 - 150
08/23/2015 12:41:38 Tug Reed Danos positioning Weeks Barge 526 151 -164
08/23/2015 12:46:31 Weeks Barge 526 165 -173
08/23/2015 15:24:15 Weeks Barge 533 lifting a piling at WTG 3 to be stabbed
182 - 183
08/23/2015 15:24:53 Weeks Barge 526 arriving at WTG 2 179 -181
08/23/2015 15:36:02 WTG 2, stabbing 3 pile 182-183
08/23/2015 16:11:13 WTG 3, pile 3 stabbed 186 -187
08/23/2015 16:30:00 View of onshore observation post at Southeast Lighthouse from vessel
188-195
08/24/2015 07:05:19 Arrived on site. Two barges and two tugs (Todd Danos) on site. Some weather coming thru, dry for now.
08/24/2015 07:38:21 Crew tender boat arriving for Weeks Barge 533 (WTG 3)
08/24/2015 07:49:07 Another crew tender arriving for Weeks barge 526
08/24/2015 07:51:40 First tender leaving barge 533
08/24/2015 08:01:58 Second tender leaving
08/24/2015 08:09:20 White fishing vessel is sitting just off site to the east
08/24/2015 09:12:31 Tug with equipment barge moving south west away from site. Barge looks like it holds the pilings
196-211. blank at 212
08/24/2015 11:27:12 Shots of the site. No significant change yet blanks 242 and 252
08/24/2015 11:38:40 Supply Vessel "Sorensen Miller" 253 - 259
08/24/2015 12:21:55 Weeks Barge 526 moving into position
08/24/2015 13:24:38 Picking up the hammer off deck of Weeks Barge 526 260-282. blank 283
08/24/2015 13:44:53 Putting the hammer back down. Shots of the Lindsey E with Deepwater staff
284-289
08/24/2015 13:54:56 Heather Lynn is whale spotter.
08/24/2015 15:00:10 Heather-Lynn photo shoot. White fishing vessel with outriggers
290 - 303
08/24/2015 15:39:26 Hammer has been on deck and unhooked from crane for an hour. Marine Mammal Observation and VIP boats have left. Team ended survey
08/25/2015 07:12:40 Departing harbor. Fog is strong. Visibility less than 0.3 mi
08/25/2015 07:36:20 On site. Positioned 0.25 mi north, fog too strong to see anything
08/25/2015 07:50:02 Shots in direction of barge. Too foggy to see, but we can hear engines running
304-309
08/25/2015 08:22:16 WTG 3. Tug and Weeks barge 533 emerge through the fog.
310 - 318
08/25/2015 08:30:23 Fishing vessel and Weeks barge 526 319 - 328. 329 is
blank
08/25/2015 08:32:45 R/V McMaster 330 - 337. 338 is
blank
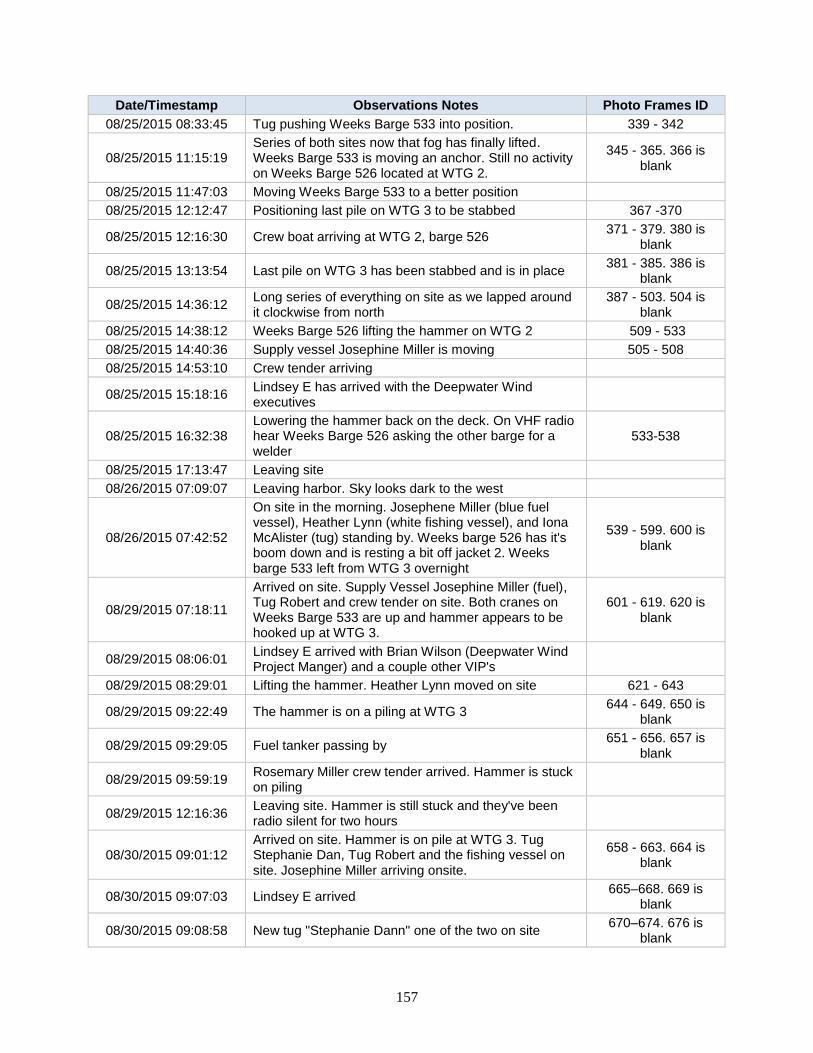
157
Date/Timestamp Observations Notes Photo Frames ID
08/25/2015 08:33:45 Tug pushing Weeks Barge 533 into position. 339 - 342
08/25/2015 11:15:19 Series of both sites now that fog has finally lifted. Weeks Barge 533 is moving an anchor. Still no activity on Weeks Barge 526 located at WTG 2.
345 - 365. 366 is blank
08/25/2015 11:47:03 Moving Weeks Barge 533 to a better position
08/25/2015 12:12:47 Positioning last pile on WTG 3 to be stabbed 367 -370
08/25/2015 12:16:30 Crew boat arriving at WTG 2, barge 526 371 - 379. 380 is
blank
08/25/2015 13:13:54 Last pile on WTG 3 has been stabbed and is in place 381 - 385. 386 is
blank
08/25/2015 14:36:12 Long series of everything on site as we lapped around it clockwise from north
387 - 503. 504 is blank
08/25/2015 14:38:12 Weeks Barge 526 lifting the hammer on WTG 2 509 - 533
08/25/2015 14:40:36 Supply vessel Josephine Miller is moving 505 - 508
08/25/2015 14:53:10 Crew tender arriving
08/25/2015 15:18:16 Lindsey E has arrived with the Deepwater Wind executives
08/25/2015 16:32:38 Lowering the hammer back on the deck. On VHF radio hear Weeks Barge 526 asking the other barge for a welder
533-538
08/25/2015 17:13:47 Leaving site
08/26/2015 07:09:07 Leaving harbor. Sky looks dark to the west
08/26/2015 07:42:52
On site in the morning. Josephene Miller (blue fuel vessel), Heather Lynn (white fishing vessel), and Iona McAlister (tug) standing by. Weeks barge 526 has it's boom down and is resting a bit off jacket 2. Weeks barge 533 left from WTG 3 overnight
539 - 599. 600 is blank
08/29/2015 07:18:11
Arrived on site. Supply Vessel Josephine Miller (fuel), Tug Robert and crew tender on site. Both cranes on Weeks Barge 533 are up and hammer appears to be hooked up at WTG 3.
601 - 619. 620 is blank
08/29/2015 08:06:01 Lindsey E arrived with Brian Wilson (Deepwater Wind Project Manger) and a couple other VIP's
08/29/2015 08:29:01 Lifting the hammer. Heather Lynn moved on site 621 - 643
08/29/2015 09:22:49 The hammer is on a piling at WTG 3 644 - 649. 650 is
blank
08/29/2015 09:29:05 Fuel tanker passing by 651 - 656. 657 is
blank
08/29/2015 09:59:19 Rosemary Miller crew tender arrived. Hammer is stuck on piling
08/29/2015 12:16:36 Leaving site. Hammer is still stuck and they've been radio silent for two hours
08/30/2015 09:01:12 Arrived on site. Hammer is on pile at WTG 3. Tug Stephanie Dan, Tug Robert and the fishing vessel on site. Josephine Miller arriving onsite.
658 - 663. 664 is blank
08/30/2015 09:07:03 Lindsey E arrived 665–668. 669 is
blank
08/30/2015 09:08:58 New tug "Stephanie Dann" one of the two on site 670–674. 676 is
blank
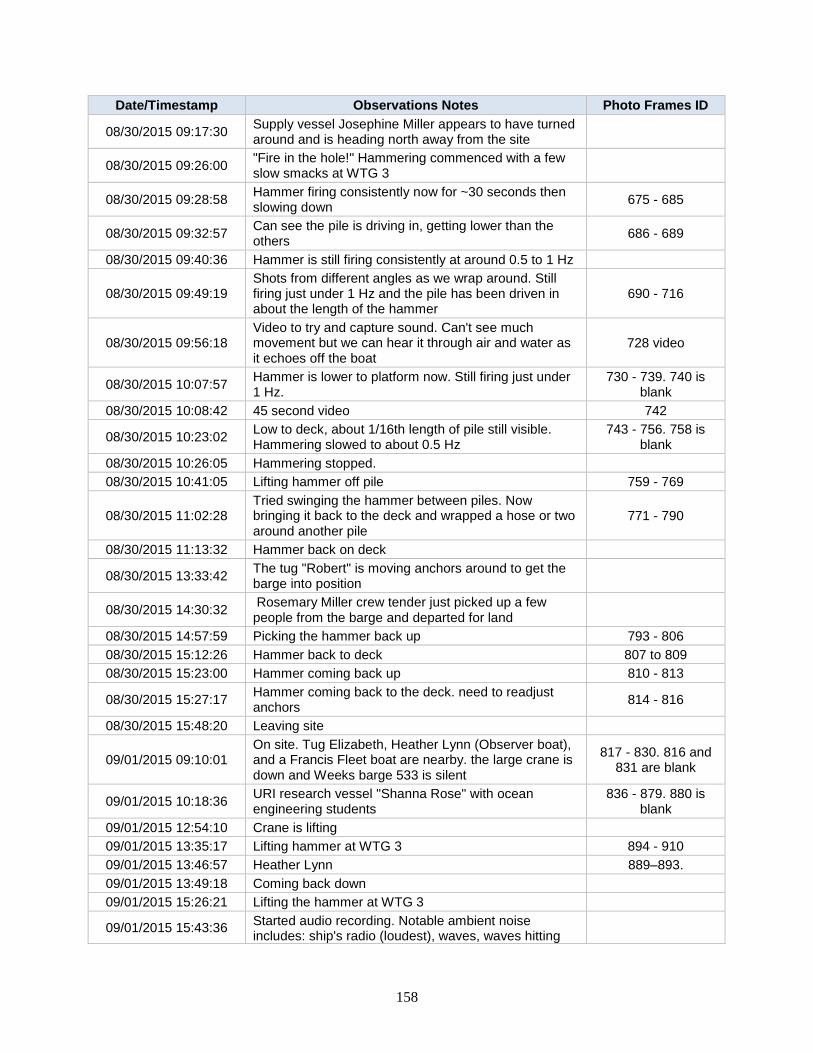
158
Date/Timestamp Observations Notes Photo Frames ID
08/30/2015 09:17:30 Supply vessel Josephine Miller appears to have turned around and is heading north away from the site
08/30/2015 09:26:00 "Fire in the hole!" Hammering commenced with a few slow smacks at WTG 3
08/30/2015 09:28:58 Hammer firing consistently now for ~30 seconds then slowing down
675 - 685
08/30/2015 09:32:57 Can see the pile is driving in, getting lower than the others
686 - 689
08/30/2015 09:40:36 Hammer is still firing consistently at around 0.5 to 1 Hz
08/30/2015 09:49:19 Shots from different angles as we wrap around. Still firing just under 1 Hz and the pile has been driven in about the length of the hammer
690 - 716
08/30/2015 09:56:18 Video to try and capture sound. Can't see much movement but we can hear it through air and water as it echoes off the boat
728 video
08/30/2015 10:07:57 Hammer is lower to platform now. Still firing just under 1 Hz.
730 - 739. 740 is blank
08/30/2015 10:08:42 45 second video 742
08/30/2015 10:23:02 Low to deck, about 1/16th length of pile still visible. Hammering slowed to about 0.5 Hz
743 - 756. 758 is blank
08/30/2015 10:26:05 Hammering stopped.
08/30/2015 10:41:05 Lifting hammer off pile 759 - 769
08/30/2015 11:02:28 Tried swinging the hammer between piles. Now bringing it back to the deck and wrapped a hose or two around another pile
771 - 790
08/30/2015 11:13:32 Hammer back on deck
08/30/2015 13:33:42 The tug "Robert" is moving anchors around to get the barge into position
08/30/2015 14:30:32 Rosemary Miller crew tender just picked up a few people from the barge and departed for land
08/30/2015 14:57:59 Picking the hammer back up 793 - 806
08/30/2015 15:12:26 Hammer back to deck 807 to 809
08/30/2015 15:23:00 Hammer coming back up 810 - 813
08/30/2015 15:27:17 Hammer coming back to the deck. need to readjust anchors
814 - 816
08/30/2015 15:48:20 Leaving site
09/01/2015 09:10:01 On site. Tug Elizabeth, Heather Lynn (Observer boat), and a Francis Fleet boat are nearby. the large crane is down and Weeks barge 533 is silent
817 - 830. 816 and 831 are blank
09/01/2015 10:18:36 URI research vessel "Shanna Rose" with ocean engineering students
836 - 879. 880 is blank
09/01/2015 12:54:10 Crane is lifting
09/01/2015 13:35:17 Lifting hammer at WTG 3 894 - 910
09/01/2015 13:46:57 Heather Lynn 889–893.
09/01/2015 13:49:18 Coming back down
09/01/2015 15:26:21 Lifting the hammer at WTG 3
09/01/2015 15:43:36 Started audio recording. Notable ambient noise includes: ship's radio (loudest), waves, waves hitting
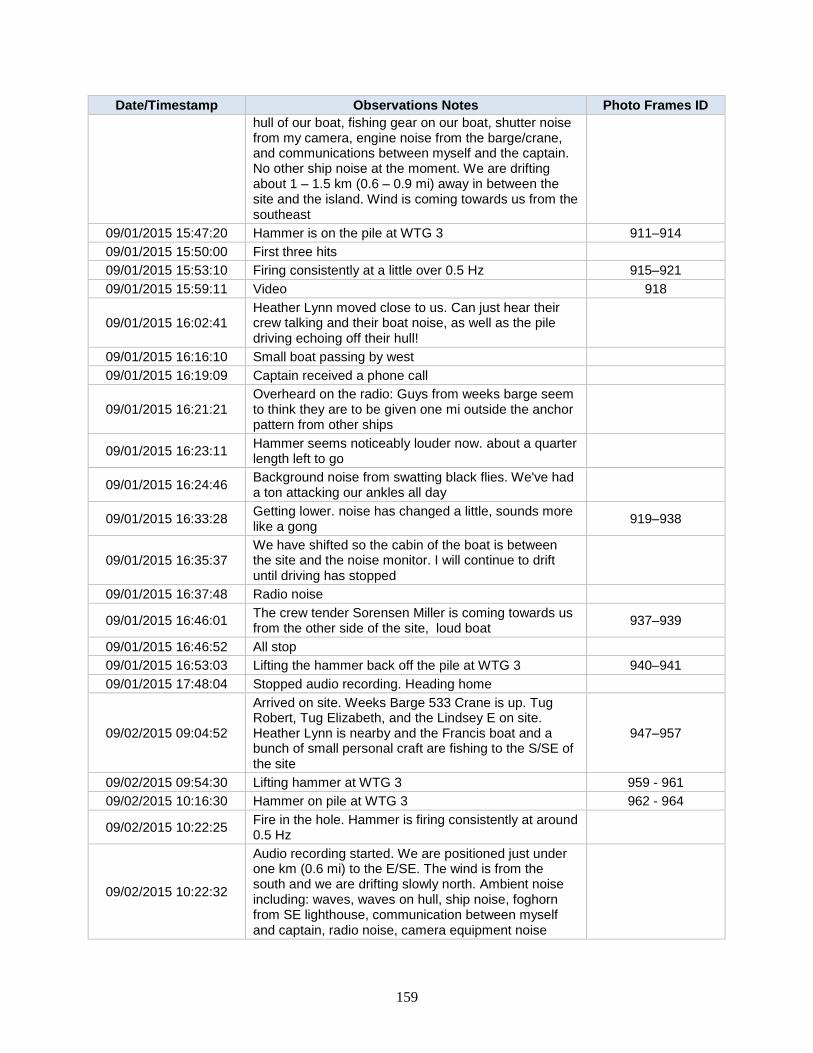
159
Date/Timestamp Observations Notes Photo Frames ID
hull of our boat, fishing gear on our boat, shutter noise from my camera, engine noise from the barge/crane, and communications between myself and the captain. No other ship noise at the moment. We are drifting about 1 – 1.5 km (0.6 – 0.9 mi) away in between the site and the island. Wind is coming towards us from the southeast
09/01/2015 15:47:20 Hammer is on the pile at WTG 3 911–914
09/01/2015 15:50:00 First three hits
09/01/2015 15:53:10 Firing consistently at a little over 0.5 Hz 915–921
09/01/2015 15:59:11 Video 918
09/01/2015 16:02:41 Heather Lynn moved close to us. Can just hear their crew talking and their boat noise, as well as the pile driving echoing off their hull!
09/01/2015 16:16:10 Small boat passing by west
09/01/2015 16:19:09 Captain received a phone call
09/01/2015 16:21:21 Overheard on the radio: Guys from weeks barge seem to think they are to be given one mi outside the anchor pattern from other ships
09/01/2015 16:23:11 Hammer seems noticeably louder now. about a quarter length left to go
09/01/2015 16:24:46 Background noise from swatting black flies. We've had a ton attacking our ankles all day
09/01/2015 16:33:28 Getting lower. noise has changed a little, sounds more like a gong
919–938
09/01/2015 16:35:37 We have shifted so the cabin of the boat is between the site and the noise monitor. I will continue to drift until driving has stopped
09/01/2015 16:37:48 Radio noise
09/01/2015 16:46:01 The crew tender Sorensen Miller is coming towards us from the other side of the site, loud boat
937–939
09/01/2015 16:46:52 All stop
09/01/2015 16:53:03 Lifting the hammer back off the pile at WTG 3 940–941
09/01/2015 17:48:04 Stopped audio recording. Heading home
09/02/2015 09:04:52
Arrived on site. Weeks Barge 533 Crane is up. Tug Robert, Tug Elizabeth, and the Lindsey E on site. Heather Lynn is nearby and the Francis boat and a bunch of small personal craft are fishing to the S/SE of the site
947–957
09/02/2015 09:54:30 Lifting hammer at WTG 3 959 - 961
09/02/2015 10:16:30 Hammer on pile at WTG 3 962 - 964
09/02/2015 10:22:25 Fire in the hole. Hammer is firing consistently at around 0.5 Hz
09/02/2015 10:22:32
Audio recording started. We are positioned just under one km (0.6 mi) to the E/SE. The wind is from the south and we are drifting slowly north. Ambient noise including: waves, waves on hull, ship noise, foghorn from SE lighthouse, communication between myself and captain, radio noise, camera equipment noise

160
Date/Timestamp Observations Notes Photo Frames ID
09/02/2015 10:22:59 Hammer slowed to under 0.5 Hz
09/02/2015 10:23:19 Hammer stopped firing
09/02/2015 10:24:39 Firing consistently again at WTG 3
09/02/2015 10:25:15 The Shanna Rose passed right by us, deployed their equipment. And hammer paused again.
09/02/2015 10:27:38 Started again. ~0.5 Hz
09/02/2015 10:34:50 Video of pile driving. 964
09/02/2015 10:36:53 Smacks are around 67 dB LAeq is 66.8. LApeak is 94.9
09/02/2015 10:44:55 Noise monitor was knocked over a few seconds ago
09/02/2015 10:47:06 Heather Lynn passed right next to piling 965 - 969
09/02/2015 10:53:27 Crew tender Rosemary Miller arriving. 970 - 979
09/02/2015 11:01:30 Rosemary Miller coming close to us, loud boat
09/02/2015 11:07:21 All stop
09/02/2015 11:18:49 Lifting hammer 980 - 986
09/02/2015 12:19:13 Lifting hammer again
09/02/2015 12:22:34 Audio recording stopped to change battery and reposition boat. We drifted slowly north, just past turbine 2
09/02/2015 12:34:32 Audio recording started again. positioned slightly farther south than last time
09/02/2015 12:38:39 Small personal craft passed about 500 m (1,640.4 ft) by us
09/02/2015 12:40:12 Couple starting smacks
09/02/2015 12:46:02 Firing consistently but slowly. impacts are a little quieter this time, could be wind which has picked up from the south
987 - 995
09/02/2015 12:55:53 Firing at about 0.5 Hz
09/02/2015 13:19:44 Hammer paused for a few seconds then started up again
09/02/2015 13:37:36 Monitor fell over
09/02/2015 13:38:09 Hammer stopped and removed from pile 996-1019
09/03/2015 08:48:35
09/03/2015 08:51:40 5 boats in area: Tug Elizabeth, Weeks Barge 533, Tug Robert, URI McMaster, fishing charter boat in the area.
1025 -1049
09/03/2015 08:40:00 Arrival at WTG 2, setting prior to pile driving commencement
1050-1067
09/03/2015 09:37:00 Hammer being lifted to first pile WTG -2 1067-1101
09/03/2015 09:45:00 Working to seat hammer on pile. 1102-1123
09/03/2015 09:47:00 Hammer aligned 1124-1133
09/03/2015 09:50:00 Green Light received on hammer, hammer penetration 1134-1140
09/03/2015 09:52:00 Fire in the hole @ 0953, First strikes @ 0955, Area shots of vessels on site
1141-1156
09/03/2015 10:02:00 Hammer striking, area shots 1157-1213
09/03/2015 10:08:00 Hammer striking, area Shots 1214-1332
09/03/2015 10:21:00 Hammer striking, area Shots, birds 1333-1341
09/03/2015 10:22:00 Piling Stopped. Area shots. 1342-1353
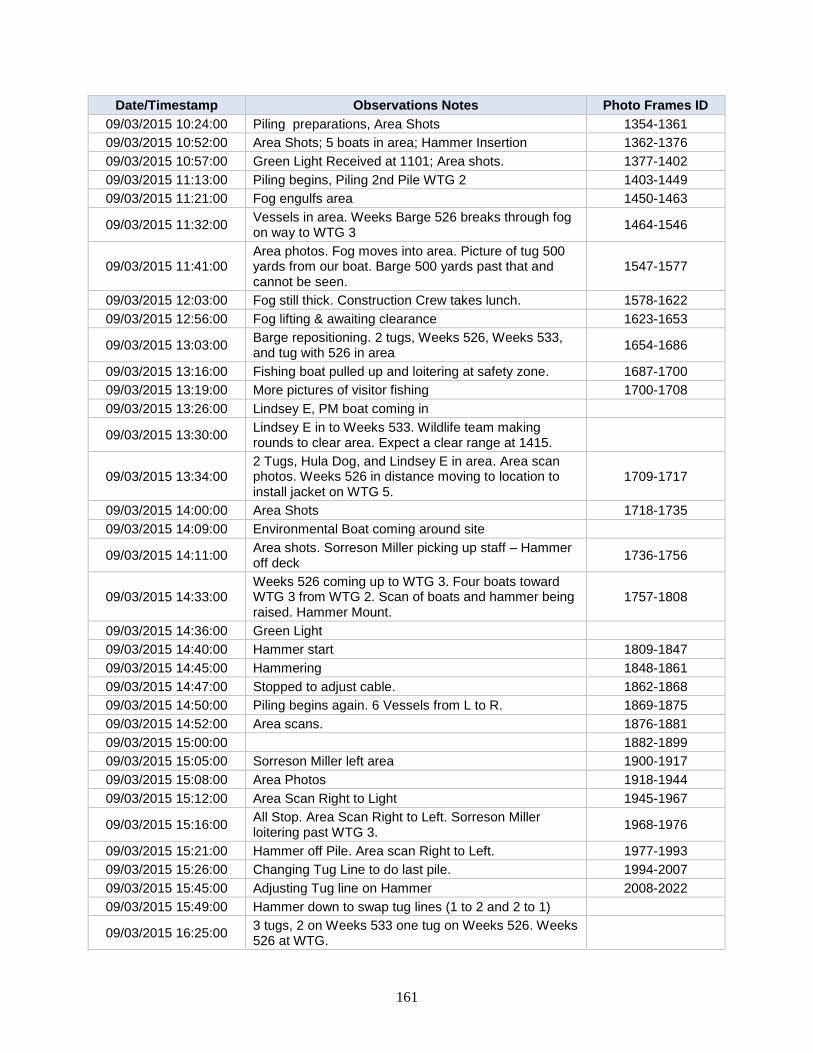
161
Date/Timestamp Observations Notes Photo Frames ID
09/03/2015 10:24:00 Piling preparations, Area Shots 1354-1361
09/03/2015 10:52:00 Area Shots; 5 boats in area; Hammer Insertion 1362-1376
09/03/2015 10:57:00 Green Light Received at 1101; Area shots. 1377-1402
09/03/2015 11:13:00 Piling begins, Piling 2nd Pile WTG 2 1403-1449
09/03/2015 11:21:00 Fog engulfs area 1450-1463
09/03/2015 11:32:00 Vessels in area. Weeks Barge 526 breaks through fog on way to WTG 3
1464-1546
09/03/2015 11:41:00 Area photos. Fog moves into area. Picture of tug 500 yards from our boat. Barge 500 yards past that and cannot be seen.
1547-1577
09/03/2015 12:03:00 Fog still thick. Construction Crew takes lunch. 1578-1622
09/03/2015 12:56:00 Fog lifting & awaiting clearance 1623-1653
09/03/2015 13:03:00 Barge repositioning. 2 tugs, Weeks 526, Weeks 533, and tug with 526 in area
1654-1686
09/03/2015 13:16:00 Fishing boat pulled up and loitering at safety zone. 1687-1700
09/03/2015 13:19:00 More pictures of visitor fishing 1700-1708
09/03/2015 13:26:00 Lindsey E, PM boat coming in
09/03/2015 13:30:00 Lindsey E in to Weeks 533. Wildlife team making rounds to clear area. Expect a clear range at 1415.
09/03/2015 13:34:00 2 Tugs, Hula Dog, and Lindsey E in area. Area scan photos. Weeks 526 in distance moving to location to install jacket on WTG 5.
1709-1717
09/03/2015 14:00:00 Area Shots 1718-1735
09/03/2015 14:09:00 Environmental Boat coming around site
09/03/2015 14:11:00 Area shots. Sorreson Miller picking up staff – Hammer off deck
1736-1756
09/03/2015 14:33:00 Weeks 526 coming up to WTG 3. Four boats toward WTG 3 from WTG 2. Scan of boats and hammer being raised. Hammer Mount.
1757-1808
09/03/2015 14:36:00 Green Light
09/03/2015 14:40:00 Hammer start 1809-1847
09/03/2015 14:45:00 Hammering 1848-1861
09/03/2015 14:47:00 Stopped to adjust cable. 1862-1868
09/03/2015 14:50:00 Piling begins again. 6 Vessels from L to R. 1869-1875
09/03/2015 14:52:00 Area scans. 1876-1881
09/03/2015 15:00:00 1882-1899
09/03/2015 15:05:00 Sorreson Miller left area 1900-1917
09/03/2015 15:08:00 Area Photos 1918-1944
09/03/2015 15:12:00 Area Scan Right to Light 1945-1967
09/03/2015 15:16:00 All Stop. Area Scan Right to Left. Sorreson Miller loitering past WTG 3.
1968-1976
09/03/2015 15:21:00 Hammer off Pile. Area scan Right to Left. 1977-1993
09/03/2015 15:26:00 Changing Tug Line to do last pile. 1994-2007
09/03/2015 15:45:00 Adjusting Tug line on Hammer 2008-2022
09/03/2015 15:49:00 Hammer down to swap tug lines (1 to 2 and 2 to 1)
09/03/2015 16:25:00 3 tugs, 2 on Weeks 533 one tug on Weeks 526. Weeks 526 at WTG.

162
Date/Timestamp Observations Notes Photo Frames ID
09/03/2015 16:27:00 Still working on positioning hammer. Hammer coming up.
2023-2038
09/03/2015 16:32:00 Hammer tugs re-rigged and hammer angle looks good. 2039-2052
09/03/2015 16:36:00 Area scan. 2053-2065
09/03/2015 16:40:00 Hammer Insertion. 2066-2110
09/03/2015 16:46:00 Area Scan 2111-2176
09/03/2015 16:58:00 1 km (0.6 mi) away. Video 2185
09/03/2015 17:01:00 Video of later part of piling and area scan. Video 2287, Video 2209, 2177-2220
09/03/2015 17:17:00 All Stop.
09/07/2015 10:32:20
Arriving on site. Sea state a choppy 4. Wind speed 17 mph. WTG 3 has a pile lifted in the air and three tugs nearby. WTG 5 has two transition decks and one steel foundation on the material barge and three tugs and the Lindsey E nearby. The base is hooked up to the crane
09/07/2015 10:38:05 WTG 3 from the west 3893 - 3912
09/07/2015 10:41:47 WTG 5 from the north. Sounds like they are trying to lift the base. Two of the tugs are in position right against the leeward side of the barge
3913 - 3926
09/07/2015 10:51:28 Placing the WTG 5 foundation. They lift the base and move the material barge out from under it before dropping the base into the water
3927 -3941
09/07/2015 10:54:28 WTG 2 has 5 guys welding another section of pile on 3946 - 3957
09/07/2015 11:06:08 Lowering the base into the water 3942–3943
09/07/2015 11:16:18 Materials barge holding the top jackets is leaving site for Quonset
3944 and 3945
09/07/2015 11:49:39 Foundation for site 5 is in position. We are heading home
3958 - 3979
09/09/2015 09:01:08 Onsite, Deepwater is welding on fourth pile at WTG 3 2247-2250
09/09/2015 09:08:13 WTG 5 2251-2254
09/09/2015 09:29:42
09/09/2015 09:35:44 Tug Elizabeth onsite. 2255-2257
09/09/2015 09:36:52 WTG 2 2258-2260
09/09/2015 09:37:52 Sorenson Miller 2261 -2263
09/09/2015 09:37:52 Weeks Barge 526 at WTG 2 2264- 2281
09/17/2015 08:10:51 WTG 5 preparing to hammer
09/17/2015 08:16:39 WTG 3 2284-2285
09/17/2015 08:18:25 Weeks barge 533, Weeks Barge 526 and crew tender by WTG 2
2286-2286
09/17/2015 08:21:54 Cashman barge with WTG 1 foundation 2287-2288
09/17/2015 08:21:59 Heather Lynne Marine Mammal Observer boat 2289
09/17/2015 08:43:53 Shanna Rose , west of WTG 5 2290-2293
09/17/2015 08:52:48 Sorenson Miller Crew tender arrives on WTG 5 2296
09/17/2015 09:41:40 3 different tugs onsite: Tug Robert, Tug Elizabeth, Tug Stephanie
2297-2298-2299
09/17/2015 10:21:32 URI's McMaster by WTG 5 22300-22304

163
Date/Timestamp Observations Notes Photo Frames ID
09/17/2015 10:22:16 Sorensen Miller next to LB Roberts 2305
09/17/2015 10:36:46 WTG 2 2306
09/17/2015 10:46:07 Picking up hammer at WTG 5 2307
09/17/2015 10:48:50 Setting hammer back down, not sure why
09/17/2015 11:19:32 Close up of hammer on deck 2317-2318
09/17/2015 11:37:25 Picking up hammer again 2320-2321
09/17/2015 11:49:24 Tug Robert next to WTG 5, we think he is spotter to help set hammer on pile
2326-2327
09/17/2015 11:59:47 LB Robert elevating prior to hammering 2328-2329
09/17/2015 12:20:38 Lowering hammer down on pile at WTG 5 2338
09/17/2015 12:31:38 First strikes
09/17/2015 12:39:24 2 videos of hammer on pile 1 WTG 5 2341 and 2344
09/17/2015 12:52:03 They stopped hammering, sounds like hammer stuck 2348
09/17/2015 12:55:17 Resumed piling
09/17/2015 13:22:15 Still hammering, pile about 1/2 way 2349
09/17/2015 13:40:32 Pile 1 is done 2350-2353
09/17/2015 13:48:36 Setting hammer on deck to inspect 2355-2356
09/17/2015 14:09:33 Hammer on deck after piling 1 2357
09/17/2015 14:13:46 DW is inspecting pile, hen move on to next pile
09/17/2015 14:58:24 Top section for jacket 2358-2359
09/17/2015 15:11:17 Setting hammer on 2nd pile 2360-2361
09/17/2015 15:17:18 First strike on 2nd pile
09/17/2015 15:23:11 Video of hammer on 2nd pile 2363
09/17/2015 15:42:28 Hammer on 2nd pile 2365
09/17/2015 16:14:09 Last strike on pile2 2366
09/17/2015 16:31:41 Setting hammer on 3rd pile 2370
09/17/2015 16:39:31 First strike 3rd pile 2371
09/17/2015 16:53:36 WTG 5 hammering 3rd pile 2372-2374
09/17/2015 17:45:04 Hammering 3rd pile on WTG 5 2375-2378
09/17/2015 17:49:14 Sorensen Miller vessel headed to WTG 5 2379
09/17/2015 17:55:17 Finished piling on 3rd pile 2380-2381
09/18/2015 08:30:51 WTG 5, DW drove last pile after we left last night. 2382
09/18/2015 08:32:20 WTG 3 hammer on first pile. this is second set of piles (p2)
2383
09/18/2015 08:34:18 WTG 2 on left and WTG 1, both have 4 piles stabbed. 2384
09/18/2015 08:37:11 First strike
09/18/2015 08:47:08 WTG 3 hammering first pile video
09/18/2015 09:03:35 WTG 3 hammering first pile 2386
09/18/2015 09:23:35 WTG 5 - getting ready to weld second set of piles 2388
09/18/2015 09:25:00 WTG 3 hammering first pile 2389
09/18/2015 09:38:50 Finished 1st pile 2390
09/18/2015 09:50:14 Several tugs and crane arrives onsite between WTG 3 and WTG 5. We think they are preparing to set jacket 3
2391-2397
09/18/2015 09:58:17 WTG 5 setting hammer on second pile 2398
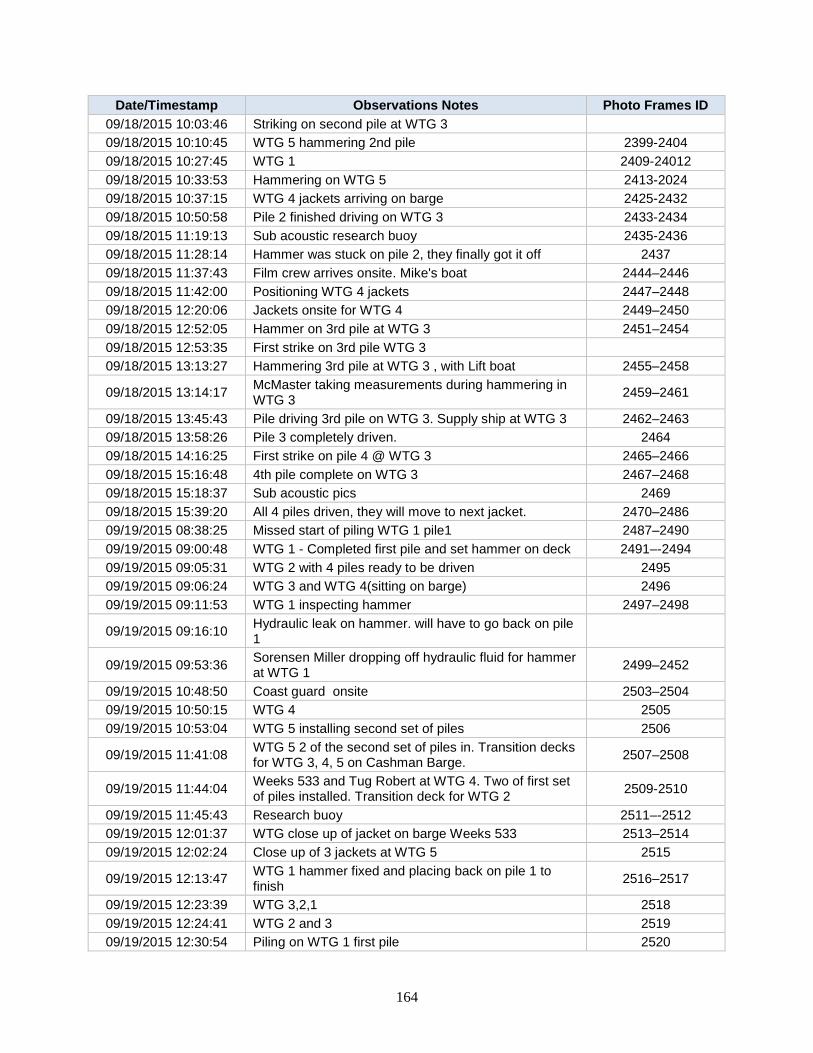
164
Date/Timestamp Observations Notes Photo Frames ID
09/18/2015 10:03:46 Striking on second pile at WTG 3
09/18/2015 10:10:45 WTG 5 hammering 2nd pile 2399-2404
09/18/2015 10:27:45 WTG 1 2409-24012
09/18/2015 10:33:53 Hammering on WTG 5 2413-2024
09/18/2015 10:37:15 WTG 4 jackets arriving on barge 2425-2432
09/18/2015 10:50:58 Pile 2 finished driving on WTG 3 2433-2434
09/18/2015 11:19:13 Sub acoustic research buoy 2435-2436
09/18/2015 11:28:14 Hammer was stuck on pile 2, they finally got it off 2437
09/18/2015 11:37:43 Film crew arrives onsite. Mike's boat 2444–2446
09/18/2015 11:42:00 Positioning WTG 4 jackets 2447–2448
09/18/2015 12:20:06 Jackets onsite for WTG 4 2449–2450
09/18/2015 12:52:05 Hammer on 3rd pile at WTG 3 2451–2454
09/18/2015 12:53:35 First strike on 3rd pile WTG 3
09/18/2015 13:13:27 Hammering 3rd pile at WTG 3 , with Lift boat 2455–2458
09/18/2015 13:14:17 McMaster taking measurements during hammering in WTG 3
2459–2461
09/18/2015 13:45:43 Pile driving 3rd pile on WTG 3. Supply ship at WTG 3 2462–2463
09/18/2015 13:58:26 Pile 3 completely driven. 2464
09/18/2015 14:16:25 First strike on pile 4 @ WTG 3 2465–2466
09/18/2015 15:16:48 4th pile complete on WTG 3 2467–2468
09/18/2015 15:18:37 Sub acoustic pics 2469
09/18/2015 15:39:20 All 4 piles driven, they will move to next jacket. 2470–2486
09/19/2015 08:38:25 Missed start of piling WTG 1 pile1 2487–2490
09/19/2015 09:00:48 WTG 1 - Completed first pile and set hammer on deck 2491–-2494
09/19/2015 09:05:31 WTG 2 with 4 piles ready to be driven 2495
09/19/2015 09:06:24 WTG 3 and WTG 4(sitting on barge) 2496
09/19/2015 09:11:53 WTG 1 inspecting hammer 2497–2498
09/19/2015 09:16:10 Hydraulic leak on hammer. will have to go back on pile 1
09/19/2015 09:53:36 Sorensen Miller dropping off hydraulic fluid for hammer at WTG 1
2499–2452
09/19/2015 10:48:50 Coast guard onsite 2503–2504
09/19/2015 10:50:15 WTG 4 2505
09/19/2015 10:53:04 WTG 5 installing second set of piles 2506
09/19/2015 11:41:08 WTG 5 2 of the second set of piles in. Transition decks for WTG 3, 4, 5 on Cashman Barge.
2507–2508
09/19/2015 11:44:04 Weeks 533 and Tug Robert at WTG 4. Two of first set of piles installed. Transition deck for WTG 2
2509-2510
09/19/2015 11:45:43 Research buoy 2511–-2512
09/19/2015 12:01:37 WTG close up of jacket on barge Weeks 533 2513–2514
09/19/2015 12:02:24 Close up of 3 jackets at WTG 5 2515
09/19/2015 12:13:47 WTG 1 hammer fixed and placing back on pile 1 to finish
2516–2517
09/19/2015 12:23:39 WTG 3,2,1 2518
09/19/2015 12:24:41 WTG 2 and 3 2519
09/19/2015 12:30:54 Piling on WTG 1 first pile 2520

165
Date/Timestamp Observations Notes Photo Frames ID
09/19/2015 12:41:26 Piling on pile 1 complete
09/19/2015 12:55:25 WTG 1 putting hammer on second pile 2521
09/19/2015 12:56:40 Strike did not seem as loud when they finished first pile, may have lowered energy to test hammer repair
09/19/2015 13:01:05 WTG 1 hammer start on pile 2
09/19/2015 13:38:35 Pile 2 done WTG 1 2522
09/19/2015 13:49:27 Placing hammer on 3rd pile WTG 1 2525
09/19/2015 13:57:53 Pile 3 WTG 1 hammer start
09/19/2015 14:30:25 Rosemary Miller just passed our stationary boat extremely close
2526–2531
09/19/2015 14:44:17 3rd pile complete 2532–2533
09/19/2015 14:52:26 Dunking hammer in water to cool it off 2534–2539
09/19/2015 15:11:13 2540–2542
09/19/2015 15:31:38 Stephanie Dann Tug by WTG 3 2543
09/19/2015 15:33:32 Hammer stopped about 1/3 of way through
09/19/2015 15:35:24 Hammer started back
09/19/2015 15:48:50 4th pile at WTG 1 2544–2549
09/19/2015 15:53:56 completed 4th pile WTG 1
09/19/2015 16:00:20 Lifting the hammer and putting back on deck after getting all piles
2550–2558
09/20/2015 08:25:08 Long shots of all WTGs 2559–2569
09/20/2015 08:57:53 We got onsite around 0815 and no hammering occurring. The first pile is about 1/3 of the way down. WTG 4
2574–2578
09/20/2015 08:58:33 Crew pulled hammer off and lowered crane boom, something wrong with crane
09/20/2015 09:03:17 WTG 5 second piles I place, Weeks Barge 526 next to it
2579–2580
09/20/2015 09:44:23 WTG 4 still working on crane 2581–2583
09/20/2015 09:46:35 Area scans 2584–2587

166
Table B-3. Meteorological Data Recorded During Visual Monitoring
Date/Time General Weather
Wind Direction
Beaufort % Cloud
Cover Temperature Humidity
08/18/2015 07:17:46 Hazy SW
20 74 94
08/18/2015 08:06:00 Hazy SW
20 74 94
08/18/2015 08:28:37 Hazy SW
20 73 94
08/18/2015 08:57:44 Hazy SW
15 73 94
08/18/2015 09:49:35 Hazy SW
10 77 83
08/18/2015 10:17:36 Sunny SSW
5 80 75
08/18/2015 10:31:27 Sunny SW
5 79 68
08/18/2015 11:14:41 Sunny WSW
5 82 62
08/18/2015 11:34:47 Sunny WSW
0 82 62
08/18/2015 11:44:22 Sunny WSW
0 79 79
08/18/2015 11:56:52 Sunny WSW
0 82 62
08/18/2015 12:25:41 Sunny WSW
0 79 62
08/18/2015 13:03:04 Hazy SW
0 85 66
08/18/2015 13:13:48 Sunny SW
0 84 62
08/18/2015 13:23:39 Sunny SW
0 81 62
08/18/2015 13:51:45 Hazy WSW
0 81 74
08/18/2015 14:21:06 Sunny SW
0 81 74
08/18/2015 15:12:06 Sunny SW
0 79 83
08/18/2015 15:50:39 Sunny S
0 83 67
08/18/2015 16:08:55 Sunny NNW
0 83 70
08/18/2015 16:29:54 Sunny S
0 81 66
08/18/2015 16:55:07 Sunny S
0 81 66
08/18/2015 17:15:25 Sunny SSW
0 81 72
08/23/2015 11:26:40 Light Rain NE 1 100 76 91
08/23/2015 11:56:55 Light Rain NE 1 100 77 73
08/23/2015 12:02:42 Cloudy NE 1 90 77 73
08/23/2015 12:20:19 Mostly Cloudy NE 1 60 77 73
08/23/2015 12:33:35 Mostly Cloudy NE 1 50 78 90
08/23/2015 12:54:07 Sunny NE 1 20 78 70
08/23/2015 13:14:03 Sunny NE 1 20 80 89
08/23/2015 13:36:27 Sunny NE 1 70 78 73
08/23/2015 14:00:19 Cloudy NE 1 90 77 83
08/23/2015 14:30:48 Sunny NE 1 30 80 68
08/23/2015 14:59:09 Sunny NE 1 30 80 68
08/23/2015 15:35:53 Sunny NE 1 20 79 78
08/23/2015 15:38:04 Sunny SE 2 50 78 75
08/23/2015 16:06:47 Sunny NE 1 10 77 83
08/23/2015 16:34:21 Sunny NE 1 10 77 84
08/24/2015 07:18:58 Light Rain SE 2 100 71 93
08/24/2015 07:47:13 Light Rain SE 2 100 71 93
08/24/2015 07:58:05 Cloudy SE 2 97 71 93
08/24/2015 08:12:50 Cloudy SE 2 97 71 93
08/24/2015 08:47:04 Cloudy SE 2 100 70 97
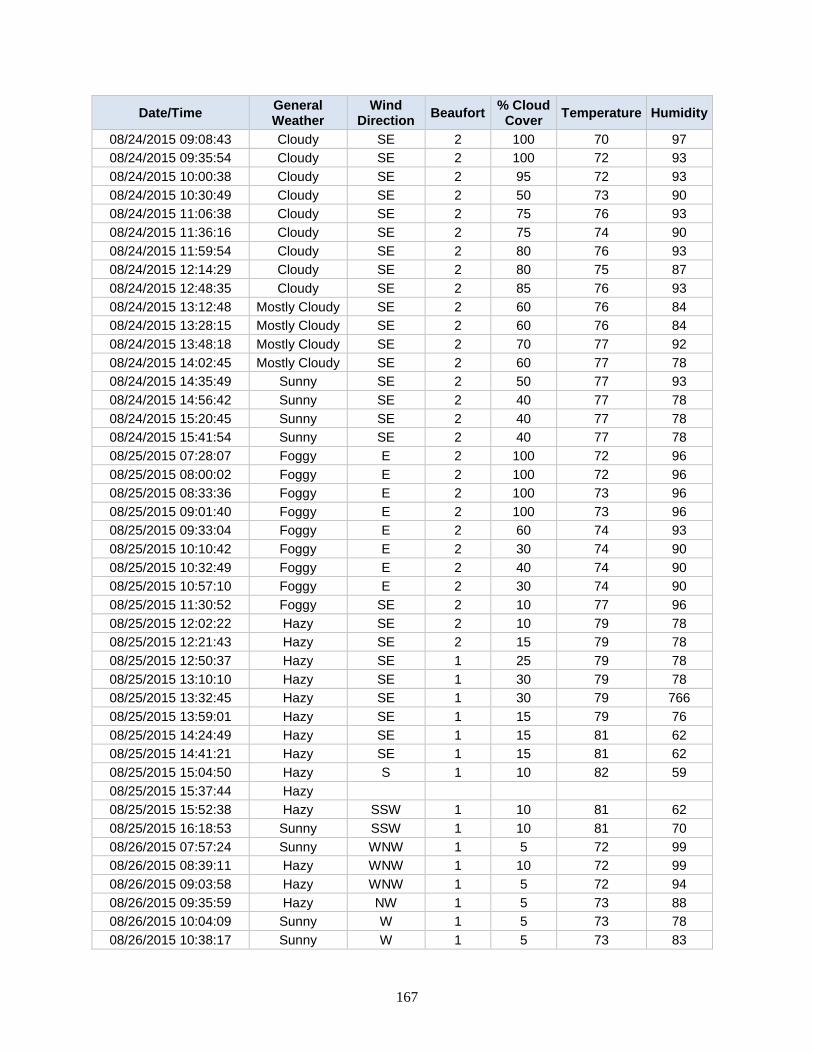
167
Date/Time General Weather
Wind Direction
Beaufort % Cloud
Cover Temperature Humidity
08/24/2015 09:08:43 Cloudy SE 2 100 70 97
08/24/2015 09:35:54 Cloudy SE 2 100 72 93
08/24/2015 10:00:38 Cloudy SE 2 95 72 93
08/24/2015 10:30:49 Cloudy SE 2 50 73 90
08/24/2015 11:06:38 Cloudy SE 2 75 76 93
08/24/2015 11:36:16 Cloudy SE 2 75 74 90
08/24/2015 11:59:54 Cloudy SE 2 80 76 93
08/24/2015 12:14:29 Cloudy SE 2 80 75 87
08/24/2015 12:48:35 Cloudy SE 2 85 76 93
08/24/2015 13:12:48 Mostly Cloudy SE 2 60 76 84
08/24/2015 13:28:15 Mostly Cloudy SE 2 60 76 84
08/24/2015 13:48:18 Mostly Cloudy SE 2 70 77 92
08/24/2015 14:02:45 Mostly Cloudy SE 2 60 77 78
08/24/2015 14:35:49 Sunny SE 2 50 77 93
08/24/2015 14:56:42 Sunny SE 2 40 77 78
08/24/2015 15:20:45 Sunny SE 2 40 77 78
08/24/2015 15:41:54 Sunny SE 2 40 77 78
08/25/2015 07:28:07 Foggy E 2 100 72 96
08/25/2015 08:00:02 Foggy E 2 100 72 96
08/25/2015 08:33:36 Foggy E 2 100 73 96
08/25/2015 09:01:40 Foggy E 2 100 73 96
08/25/2015 09:33:04 Foggy E 2 60 74 93
08/25/2015 10:10:42 Foggy E 2 30 74 90
08/25/2015 10:32:49 Foggy E 2 40 74 90
08/25/2015 10:57:10 Foggy E 2 30 74 90
08/25/2015 11:30:52 Foggy SE 2 10 77 96
08/25/2015 12:02:22 Hazy SE 2 10 79 78
08/25/2015 12:21:43 Hazy SE 2 15 79 78
08/25/2015 12:50:37 Hazy SE 1 25 79 78
08/25/2015 13:10:10 Hazy SE 1 30 79 78
08/25/2015 13:32:45 Hazy SE 1 30 79 766
08/25/2015 13:59:01 Hazy SE 1 15 79 76
08/25/2015 14:24:49 Hazy SE 1 15 81 62
08/25/2015 14:41:21 Hazy SE 1 15 81 62
08/25/2015 15:04:50 Hazy S 1 10 82 59
08/25/2015 15:37:44 Hazy
08/25/2015 15:52:38 Hazy SSW 1 10 81 62
08/25/2015 16:18:53 Sunny SSW 1 10 81 70
08/26/2015 07:57:24 Sunny WNW 1 5 72 99
08/26/2015 08:39:11 Hazy WNW 1 10 72 99
08/26/2015 09:03:58 Hazy WNW 1 5 72 94
08/26/2015 09:35:59 Hazy NW 1 5 73 88
08/26/2015 10:04:09 Sunny W 1 5 73 78
08/26/2015 10:38:17 Sunny W 1 5 73 83

168
Date/Time General Weather
Wind Direction
Beaufort % Cloud
Cover Temperature Humidity
08/26/2015 11:05:09 Sunny W 1 10 75 73
08/26/2015 11:42:20 Sunny W 1 10 75 73
08/26/2015 12:04:51 Sunny W 1 10 75 69
08/26/2015 12:34:05 Sunny W 1 30 75 69
08/26/2015 13:12:03 Sunny W 1 25 75 69
08/26/2015 13:42:22 Sunny W 1 20 75 69
08/26/2015 14:03:17 Sunny W 1 15 77 69
08/26/2015 14:29:54 Sunny SW 1 5 79 58
08/26/2015 14:59:34 Sunny W 1 5 79 54
08/26/2015 15:32:16 Sunny W 1 0 79 54
08/26/2015 16:11:16 Sunny W 1 0 81 42
08/26/2015 16:35:35 Sunny W 1 0 79 57
08/28/2015 13:42:48 Sunny W 0 5 75 61
08/28/2015 14:14:53 Sunny WSW 0 5 75 53
08/28/2015 14:46:47 Sunny WSW 0 0 75 47
08/28/2015 15:13:42 Sunny SW 0 0 75 47
08/28/2015 15:41:06 Sunny WSW 1 0 75 47
08/28/2015 16:05:01 Sunny SSW 1 0 75 50
08/28/2015 16:41:56 Sunny WSW 1 0 75 53
08/28/2015 17:11:21 Sunny WSW 1 0 75 53
08/28/2015 17:39:47 Sunny SW 1 0 75 53
08/28/2015 18:00:40 Sunny SW 1 0 73 57
08/29/2015 07:31:05 Sunny NW 0 5 64 94
08/29/2015 08:01:58 Sunny NW 0 5 64 94
08/29/2015 08:31:54 Sunny
0 5 73 72
08/29/2015 09:04:45 Sunny
0 0 72 69
08/29/2015 09:32:02 Sunny
0 0 72 69
08/29/2015 10:06:55 Sunny
0 0 72 69
08/29/2015 10:35:29 Sunny
0 0 72 69
08/29/2015 11:04:49 Sunny SW 0 5 72 69
08/29/2015 11:36:29 Sunny SW 0 10 72 69
08/29/2015 12:04:22 Sunny SW 0 10 75 62
08/29/2015 12:41:27 Sunny SW 1 10 77 59
08/29/2015 13:00:33 Sunny SW 1 10 77 59
08/29/2015 13:19:01 Sunny W 1 10 79 57
08/29/2015 13:37:10 Sunny W 1 15 79 57
08/29/2015 14:40:47 Sunny SW 1 10 79 51
08/29/2015 15:05:28 Sunny SW 1 10 79 54
08/29/2015 15:30:45 Sunny SW 1 15 77 54
08/29/2015 15:52:54 Sunny SSW 1 25 77 61
08/30/2015 09:03:41 Hazy WSW 1 0 73 88
08/30/2015 09:54:39 Hazy W 1 0 75 78
08/30/2015 10:28:00 Hazy WSW 1 0 79 69
08/30/2015 10:49:15 Hazy WSW 1 0 79 69

169
Date/Time General Weather
Wind Direction
Beaufort % Cloud
Cover Temperature Humidity
08/30/2015 11:14:59 Hazy W 1 0 77 69
08/30/2015 11:34:17 Hazy SW 1 0 79 69
08/30/2015 12:07:35 Hazy SW 1 0 79 69
08/30/2015 12:43:08 Hazy WSW 2 0 82 69
08/30/2015 13:10:17 Hazy WSW 3 5 81 74
08/30/2015 13:39:59 Hazy WSW 4 5 79 74
08/30/2015 14:20:36 Hazy SW 3 15 79 74
08/30/2015 14:57:24 Hazy SW 3 40 79 74
08/30/2015 15:37:03 Hazy WSW 3 55 79 70
08/30/2015 16:08:48 Hazy SW 3 45 79 74
08/30/2015 16:19:53 Hazy SW 2 45 77 74
09/01/2015 13:34:34 Sunny E 2 0 77 65
09/01/2015 13:58:50 Sunny E 2 0 77 69
09/01/2015 14:30:56 Sunny SE 2 0 79 65
09/01/2015 15:11:49 Sunny SE 2 0 79 65
09/01/2015 15:29:40 Sunny SE 2 0 79 61
09/01/2015 15:41:24 Sunny SE 2 0 79 65
09/01/2015 16:01:01 Sunny S 2 0 77 65
09/01/2015 16:24:08 Sunny S 2 0 77 69
09/01/2015 16:56:07 Sunny S 2 0 77 69
09/01/2015 17:26:11 Sunny SE 2 0 77 69
09/01/2015 18:02:59 Sunny SE 2 0 77 69
09/02/2015 08:55:13 Foggy SW 2
73 94
09/02/2015 09:13:00 Foggy SW 2
73 94
09/02/2015 09:46:56 Foggy SW 2
75 83
09/02/2015 10:15:27 Foggy SW 2
73 83
09/02/2015 10:20:05 Foggy SW 2
73 83
09/02/2015 10:42:47 Foggy SW 2
73 94
09/02/2015 11:09:20 Foggy SW 2
77 78
09/02/2015 11:17:51 Foggy SW 2
77 83
09/02/2015 11:23:25 Light fog SW 2
77 78
09/02/2015 11:59:38 Very little fog SW 2 0 79 69
09/02/2015 12:20:53 Hazy SW 3 0 79 74
09/02/2015 12:37:06 Haze SW 3 0 79 74
09/02/2015 12:47:50 Sunny SW 3
79 74
09/02/2015 12:56:31 Sunny SW 3 0 79 74
09/02/2015 13:05:23 Sunny SW 3 0 79 74
09/02/2015 13:15:07 Sunny sw 3 0 79 74
09/02/2015 13:37:54 Sunny SW 3 0 79 74
09/02/2015 14:20:44 Sunny SW 3 0 81 74
09/03/2015 08:49:21 Hazy/Foggy SW 2
73 94
09/03/2015 09:06:08 Hazy/Foggy SW 2
75 89
09/03/2015 09:38:14 Hazy/Foggy SW 2 50 75 89
09/03/2015 09:46:38 Hazy/Foggy SW 2 75 75 89
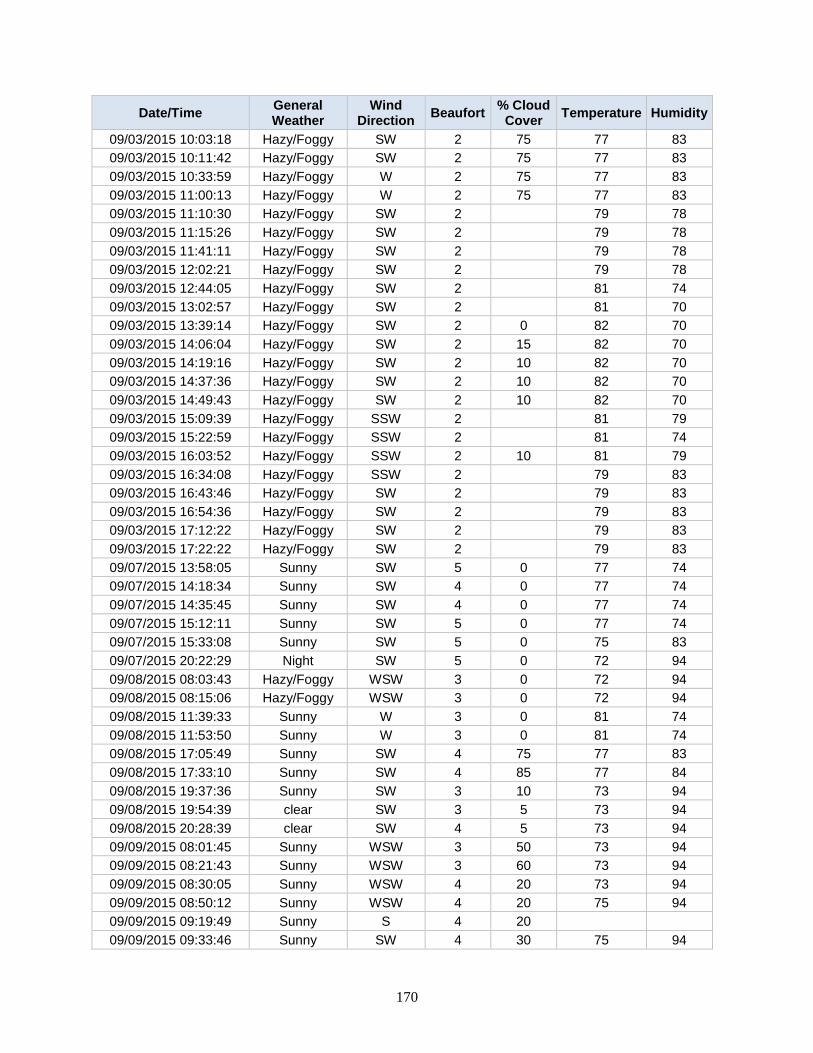
170
Date/Time General Weather
Wind Direction
Beaufort % Cloud
Cover Temperature Humidity
09/03/2015 10:03:18 Hazy/Foggy SW 2 75 77 83
09/03/2015 10:11:42 Hazy/Foggy SW 2 75 77 83
09/03/2015 10:33:59 Hazy/Foggy W 2 75 77 83
09/03/2015 11:00:13 Hazy/Foggy W 2 75 77 83
09/03/2015 11:10:30 Hazy/Foggy SW 2
79 78
09/03/2015 11:15:26 Hazy/Foggy SW 2
79 78
09/03/2015 11:41:11 Hazy/Foggy SW 2
79 78
09/03/2015 12:02:21 Hazy/Foggy SW 2
79 78
09/03/2015 12:44:05 Hazy/Foggy SW 2
81 74
09/03/2015 13:02:57 Hazy/Foggy SW 2
81 70
09/03/2015 13:39:14 Hazy/Foggy SW 2 0 82 70
09/03/2015 14:06:04 Hazy/Foggy SW 2 15 82 70
09/03/2015 14:19:16 Hazy/Foggy SW 2 10 82 70
09/03/2015 14:37:36 Hazy/Foggy SW 2 10 82 70
09/03/2015 14:49:43 Hazy/Foggy SW 2 10 82 70
09/03/2015 15:09:39 Hazy/Foggy SSW 2
81 79
09/03/2015 15:22:59 Hazy/Foggy SSW 2
81 74
09/03/2015 16:03:52 Hazy/Foggy SSW 2 10 81 79
09/03/2015 16:34:08 Hazy/Foggy SSW 2
79 83
09/03/2015 16:43:46 Hazy/Foggy SW 2
79 83
09/03/2015 16:54:36 Hazy/Foggy SW 2
79 83
09/03/2015 17:12:22 Hazy/Foggy SW 2
79 83
09/03/2015 17:22:22 Hazy/Foggy SW 2
79 83
09/07/2015 13:58:05 Sunny SW 5 0 77 74
09/07/2015 14:18:34 Sunny SW 4 0 77 74
09/07/2015 14:35:45 Sunny SW 4 0 77 74
09/07/2015 15:12:11 Sunny SW 5 0 77 74
09/07/2015 15:33:08 Sunny SW 5 0 75 83
09/07/2015 20:22:29 Night SW 5 0 72 94
09/08/2015 08:03:43 Hazy/Foggy WSW 3 0 72 94
09/08/2015 08:15:06 Hazy/Foggy WSW 3 0 72 94
09/08/2015 11:39:33 Sunny W 3 0 81 74
09/08/2015 11:53:50 Sunny W 3 0 81 74
09/08/2015 17:05:49 Sunny SW 4 75 77 83
09/08/2015 17:33:10 Sunny SW 4 85 77 84
09/08/2015 19:37:36 Sunny SW 3 10 73 94
09/08/2015 19:54:39 clear SW 3 5 73 94
09/08/2015 20:28:39 clear SW 4 5 73 94
09/09/2015 08:01:45 Sunny WSW 3 50 73 94
09/09/2015 08:21:43 Sunny WSW 3 60 73 94
09/09/2015 08:30:05 Sunny WSW 4 20 73 94
09/09/2015 08:50:12 Sunny WSW 4 20 75 94
09/09/2015 09:19:49 Sunny S 4 20
09/09/2015 09:33:46 Sunny SW 4 30 75 94

171
Date/Time General Weather
Wind Direction
Beaufort % Cloud
Cover Temperature Humidity
09/17/2015 08:12:25 Sunny S 2 40 60
09/17/2015 08:12:25 Sunny S 2 40 60
09/17/2015 11:20:54 Sunny SW 2 40 74
09/17/2015 17:00:40 Sunny SW 2 40 76
09/18/2015 08:35:27 Sunny S 1 20 60
09/18/2015 10:12:02 Sunny S 2 20 69 92
09/18/2015 11:22:16
S 2 20 76 74
09/18/2015 12:21:54 Sunny S 2 20 76 66
09/19/2015 08:48:24 Sunny
1 15 63 96
09/19/2015 09:54:29 Cloudy
1 50 69 96
09/19/2015 10:53:58 Cloudy N 1 50 73 84
09/19/2015 11:46:02 Sunny WSW 1 40 76 68
09/19/2015 14:01:58 Sunny SE
20 76 68
09/19/2015 16:02:44 Sunny S 2 15 76 63
09/20/2015 08:27:36 Cloudy NW 3 80 71 86
09/20/2015 08:57:37
09/20/2015 09:20:21 Cloudy NW 3 90 69 70

172
Appendix C: Airborne Noise Monitoring Data
Appendix C is available as a separate digital file.

173
Appendix D: Underwater Sound Monitoring Data (Near and Far-
Field)
Appendix D is available as a separate digital file.

174
Appendix E: Seafloor Disturbance and Recovery Monitoring Data
Appendix E is available as a separate digital file.

175
Appendix F: Scour Monitoring Data
Appendix F is available as a separate digital file.

Department of the Interior (DOI)
The Department of the Interior protects and manages the Nation's natural resources
and cultural heritage; provides scientific and other information about those
resources; and honors the Nation’s trust responsibilities or special commitments to
American Indians, Alaska Natives, and affiliated island communities.
Bureau of Ocean Energy Management (BOEM)
The mission of the Bureau of Ocean Energy Management is to manage
development of U.S. Outer Continental Shelf energy and mineral resources in an
environmentally and economically responsible way.
BOEM Environmental Studies Program
The mission of the Environmental Studies Program is to provide the
information needed to predict, assess, and manage impacts from offshore
energy and marine mineral exploration, development, and production
activities on human, marine, and coastal environments. The proposal,
selection, research, review, collaboration, production, and dissemination of
each of BOEM’s Environmental Studies follows the DOI Code of Scientific
and Scholarly Conduct, in support of a culture of scientific and professional
integrity, as set out in the DOI Departmental Manual (305 DM 3).