field techniques used in the study of grizzly bears...
TRANSCRIPT
FIELD TECHNIQUES USED IN THE
STUDY OF GRIZZLY BEARS
By
Bonnie M. Blanchard
INTERAGENCY GRIZZLY BEAR STUDY TEAM Forestry Sciences Lab
Montana State University Bozeman, Montana 59717
September 1985

ii
TABLE OF CONTENTS
Page
POPULATION PARAMETERS, DISTRIBUTION, AND MOVEMENT 1
Radio Telemetry 1
Capture techniques 1 Immobilization 2 Instrumentation 5 Measurements 5 Monitoring 5
Population Parameters 8
Reproduction 8 Sex and age structure 9 Survivorship 9
Observations 10
Mortality 10
HABITAT UTILIZATION 11
FOOD HABITS 13
LITERATURE CITED 15
APPENDIX A - Standard Field Forms 16
iii
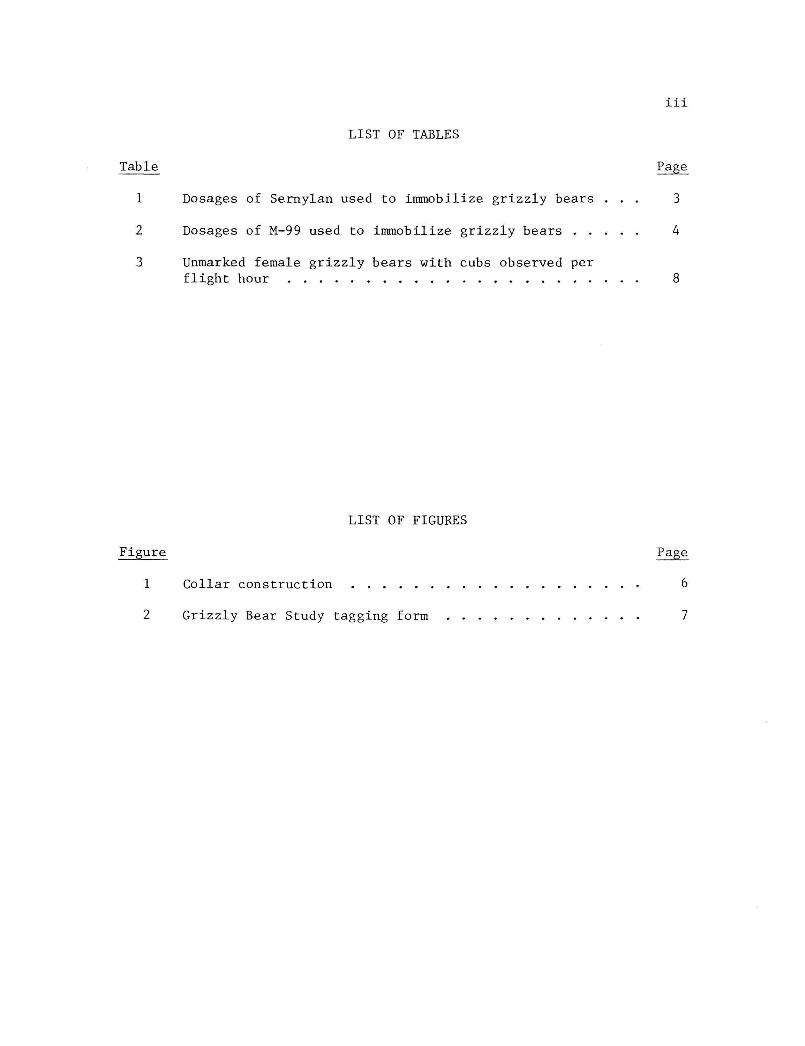
LIST OF TABLES
Table Page
1 Dosages of Sernylan used to immobilize grizzly bears . . . 3
2 Dosages of M-99 used to immobilize grizzly bears 4
3 Unmarked female grizzly bears with cubs observed per
flight hour 8
LIST OF FIGURES
Figure Page
1 Collar construction 6
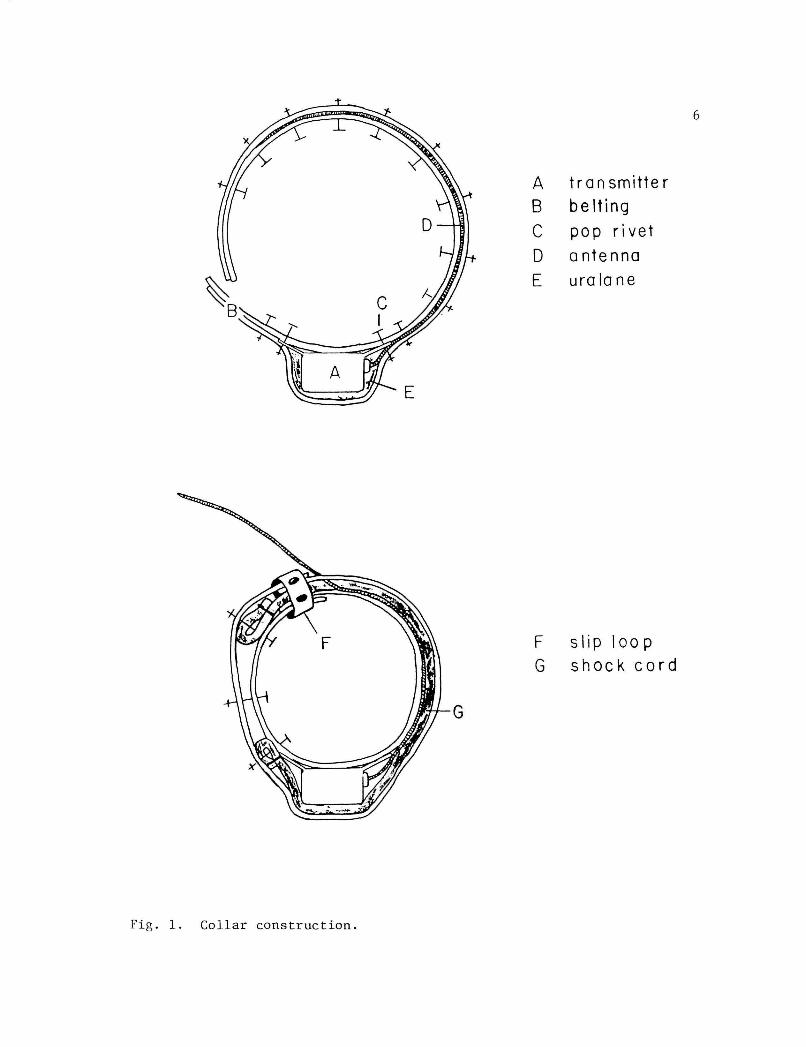
2 Grizzly Bear Study tagging form 7
The Interagency Grizzly Bear Study Team (IGBST) was initiated in 1973 to define and evaluate the habitat requirements and population dynamics of grizzly bears inhabiting the Yellowstone National Park area. The need for specific field techniques developed immediately, and methods were accordingly modified or adapted. The latest and most effective methods used in this study of the Yellowstone grizzly bear are compiled in this report.
POPULATION PARAMETERS, DISTRIBUTION, AND MOVEMENT
Radio Telemetry
Currently, radio telemetry is the only effective method to gather large volumes of quantitative data on the distribution, status, and trend of the grizzly bear population in the Yellowstone area (Blanchard and Knight 1980). Much of our research effort was, therefore, placed on capturing, instrumenting, and tracking individual animals. Supplemental data were obtained by visual observations and mortalities.
Capture techniques.—Grizzly bears were captured in culvert traps and Aldrich foot snares. Free ranging bears were occasionally captured from helicopter or on the ground with long range tranquilizer guns.
Culvert traps were used whenever possible because of the higher safety to bears and trappers. From 1975 to 1984, trapping and immobilization records were obtained for 219 individual grizzly bears during 231 handlings. Four of these bears died as a result of trapping procedures. One serious injury resulting in the eventual death of an adult male bear occurred when a culvert trap was used. Three yearlings died from snare injuries, two from joint disarticulation, and one from strangulation.
Trapping success was generally higher at sites which had been prebaited 1 to 2 weeks before traps were set. In general, meat baits were most effective in spring and fall, while meat/fruit combinations were most effective during the summer. Fish was rarely consumed at bait sites.
Snares were usually set in standard cubbies, described by Johnson and Pelton (1980). A well baited cubby consisted of up to 100 lbs of bait placed in the rear of the cubby with step-logs and jump-sticks positioned to ensure that the bear would step in the snare with a front foot. Other snare sets were occasionally used, including dip sets, blind sets, and barrel sets.
Foot snare loops were constructed from special 5/16-inch-diameter, tlexible, twisted steel cable. Loop cables were approximately 150 cm long, making a loop 30 cm in diameter. Iron right-angled loopkeepers prevented the snare from loosening while on the bear. Rounded edges on the keeper and a 5-cm section of rubber hose on the loop helped prevent abrasion.
Loops were connected to a "tail" cable up to 5 m long with a large swivel 0 prevent the cable from kinking and breaking. Tails were constructed
of standard flexible, twisted steel, 5/16-inch cable. Cables were lap-spliced with oval copper sleeves. Snare tails were fastened with U-bolts to a large live tree. A large extension spring was used as a shock absorber between the snare and anchor tree, as described by Johnson and Pelton (1980). Tails were kept as short as possible depending on the location of the anchor tree.
A steel spring with trigger mechanism was lightly wired to the snare swivel, and the snare loop was placed over and around the trigger. A depression approximately 10 cm deep and the same diameter as the snare loop was dug beneath the trigger and filled in with an easily compressible material such as hair or moss. The hole was extended to allow the spring to be placed below ground level. The hole, loop, trigger, spring, and snare tail were concealed under available ground debris and litter.
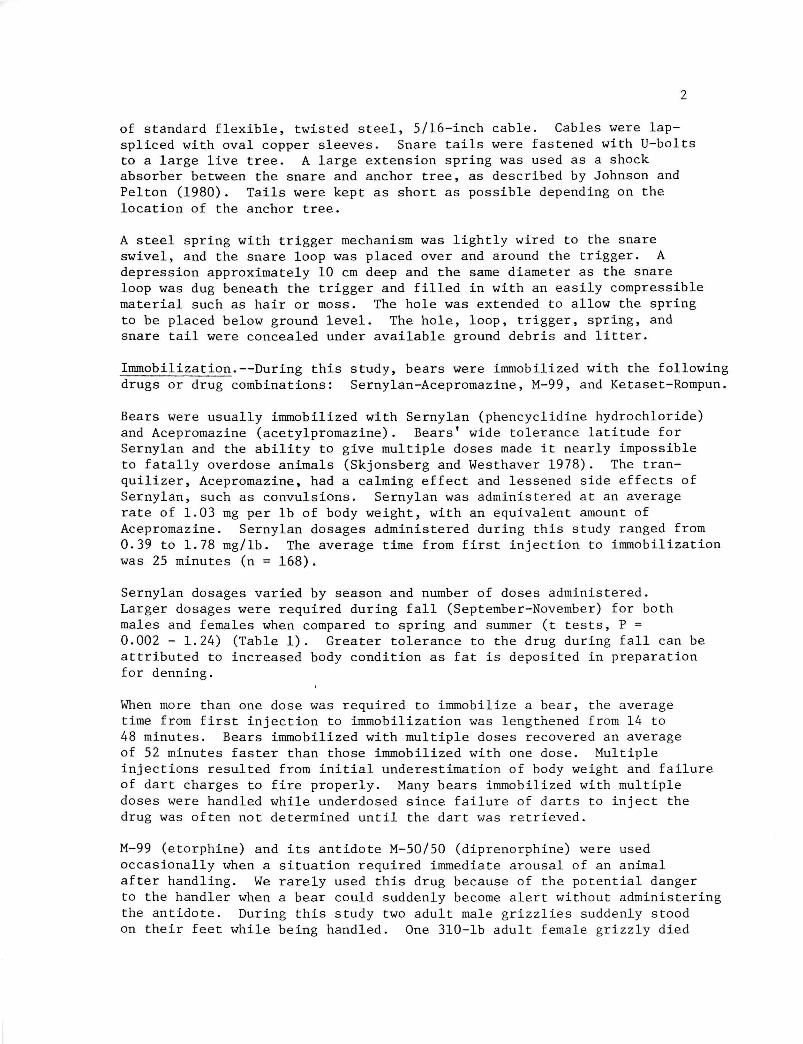
Immobilization.—During this study, bears were immobilized with the following drugs or drug combinations: Sernylan-Acepromazine, M-99, and Ketaset-Rompun.
Bears were usually immobilized with Sernylan (phencyclidine hydrochloride) and Acepromazine (acetylpromazine). Bears' wide tolerance latitude for Sernylan and the ability to give multiple doses made it nearly impossible to fatally overdose animals (Skjonsberg and Westhaver 1978). The tranquilizer, Acepromazine, had a calming effect and lessened side effects of Sernylan, such as convulsions. Sernylan was administered at an average rate of 1.03 mg per lb of body weight, with an equivalent amount of Acepromazine. Sernylan dosages administered during this study ranged from 0.39 to 1.78 mg/lb. The average time from first injection to immobilization was 25 minutes (n = 168).
Sernylan dosages varied by season and number of doses administered. Larger dosages were required during fall (September-November) for both males and females when compared to spring and summer (t tests, P = 0.002 - 1.24) (Table 1). Greater tolerance to the drug during fall can be attributed to increased body condition as fat is deposited in preparation for denning.
When more than one dose was required to immobilize a bear, the average time from first injection to immobilization was lengthened from 14 to 48 minutes. Bears immobilized with multiple doses recovered an average of 52 minutes faster than those immobilized with one dose. Multiple injections resulted from initial underestimation of body weight and failure of dart charges to fire properly. Many bears immobilized with multiple doses were handled while underdosed since failure of darts to inject the drug was often not determined until the dart was retrieved.
M-99 (etorphine) and its antidote M-50/50 (diprenorphine) were used occasionally when a situation required immediate arousal of an animal after handling. We rarely used this drug because of the potential danger to the handler when a bear could suddenly become alert without administering the antidote. During this study two adult male grizzlies suddenly stood on their feet while being handled. One 310-lb adult female grizzly died
2
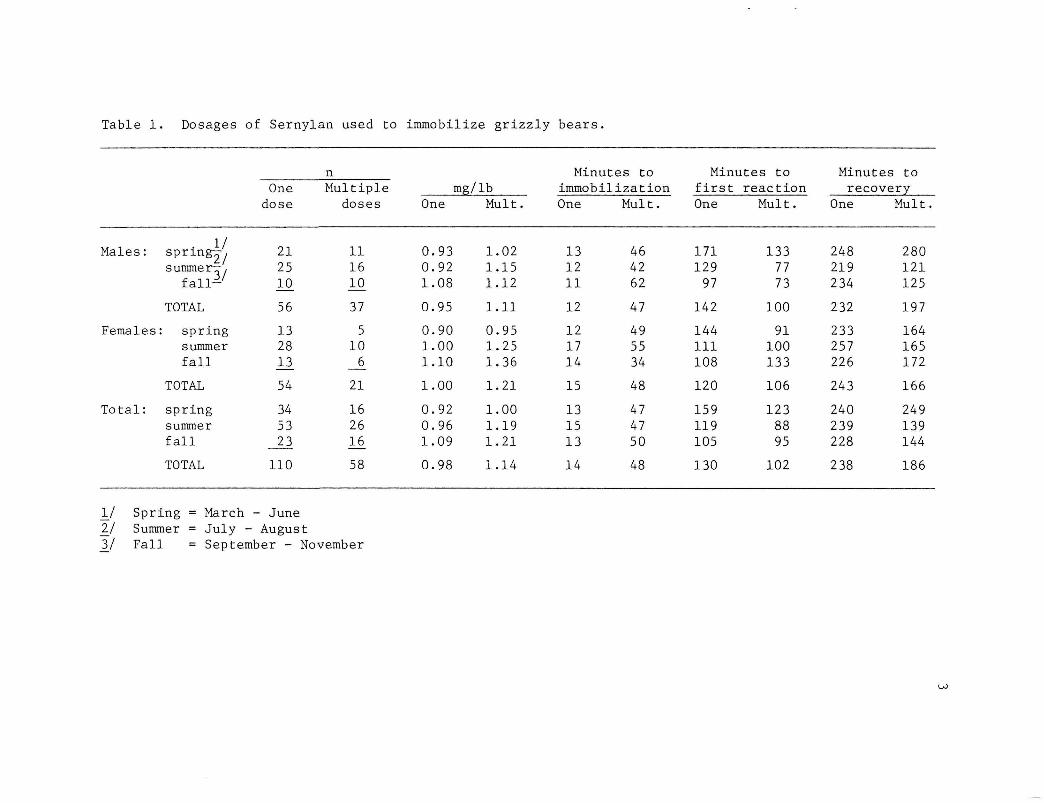
Table 1. Dosages of Sernylan used to immobilize grizzly bears.
t 1 / Males: springy,
summery, fall—
TOTAL
Females: spring summer fall
TOTAL
Total: spring summer fall
TOTAL
One dose
21 25 10
56
13 28 13
54
34 53 23
110
n Multiple doses
11 16 10
37
5 10 _6
21
16 26 16
58
ir
One
0.93 0.92 1.08
0.95
0.90 1.00 1.10
1.00
0.92 0.96 1.09
0.98
ig/lb Mult.
1.02 1.15 1.12
1.11
0.95 1.25 1.36
1.21
1.00 1.19 1.21
1.14
Minutes to immobilization One Mult.
13 12 11
12
12 17 14
15
13 15 13
14
46 42 62
47
49 55 34
48
47 47 50
48
Minutes to first reaction One Mult.
171 129 97
142
144 111 108
120
159 119 105
130
133 77 73
100
91 100 133
106
123 88 95
102
Minut reco
One
248 219 234
232
233 257 226
243
240 239 228
238
es to very Mult.
280 121 125
197
164 165 172
166
249 139 144
186
1/ Spring = March - June 2/ Summer = July - August 3/ Fall = September - November
CO
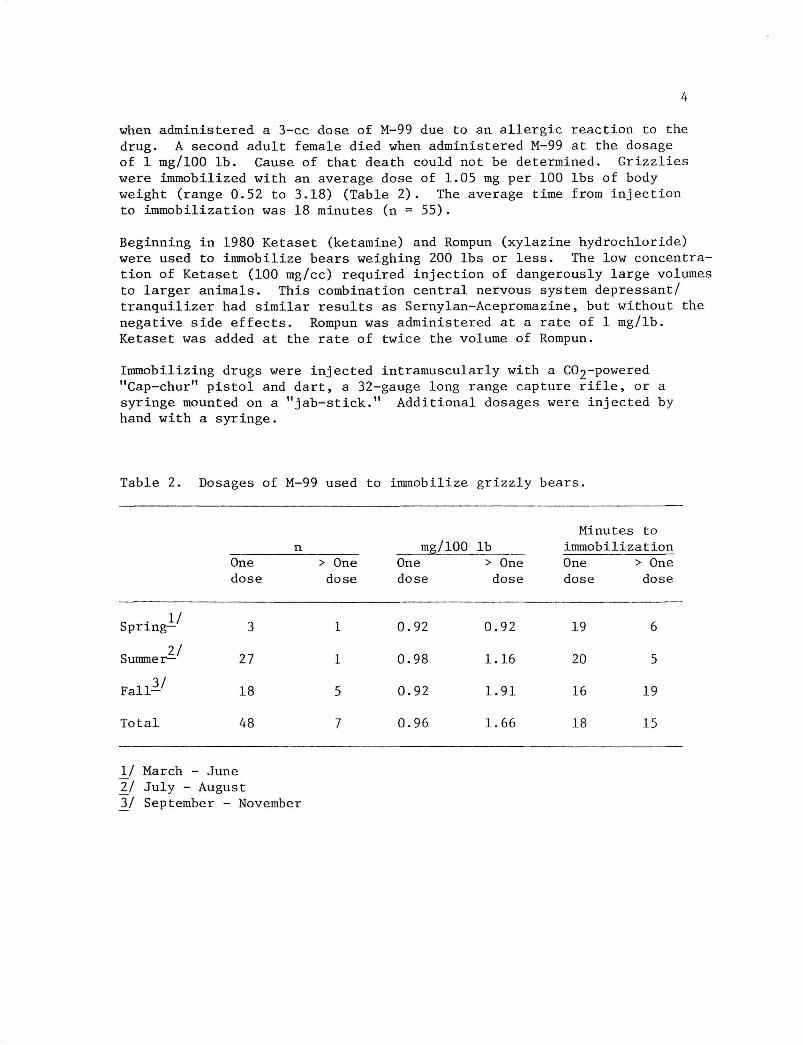
when administered a 3-cc dose of M-99 due to an allergic reaction to the drug. A second adult female died when administered M-99 at the dosage of 1 mg/100 lb. Cause of that death could not be determined. Grizzlies were immobilized with an average dose of 1.05 mg per 100 lbs of body weight (range 0.52 to 3.18) (Table 2). The average time from injection to immobilization was 18 minutes (n = 55).
Beginning in 1980 Ketaset (ketamine) and Rompun (xylazine hydrochloride) were used to immobilize bears weighing 200 lbs or less. The low concentration of Ketaset (100 mg/cc) required injection of dangerously large volumes to larger animals. This combination central nervous system depressant/ tranquilizer had similar results as Sernylan-Acepromazine, but without the negative side effects. Rompun was administered at a rate of 1 mg/lb. Ketaset was added at the rate of twice the volume of Rompun.
Immobilizing drugs were injected intramuscularly with a GT^-powered "Cap-chur" pistol and dart, a 32-gauge long range capture rifle, or a syringe mounted on a "jab-stick." Additional dosages were injected by hand with a syringe.
Table 2. Dosages of M-99 used to immobilize grizzly bears.
Spring-
Summer—
Fall^
Total
One dose
3
27
18
48
n > One dose
1
1
5
7
mg/100 One dose
0.92
0.98
0.92
0.96
lb > One dose
0.92
1.16
1.91
1.66
Minutes to immobilization One > One dose dose
19
20
16
18
6
5
19
15
_1/ March - June 2/ July - August 3/ September - November
4
Instrumentation.—Immobilized bears were fitted with collars containing radio transmitters. We used Telonics transmitters powered by lithium batteries with a 3-year life expectancy and stainless steel whip antennas. Perspiration from certain male grizzlies had been noted to corrode nonstainless steel antennas.
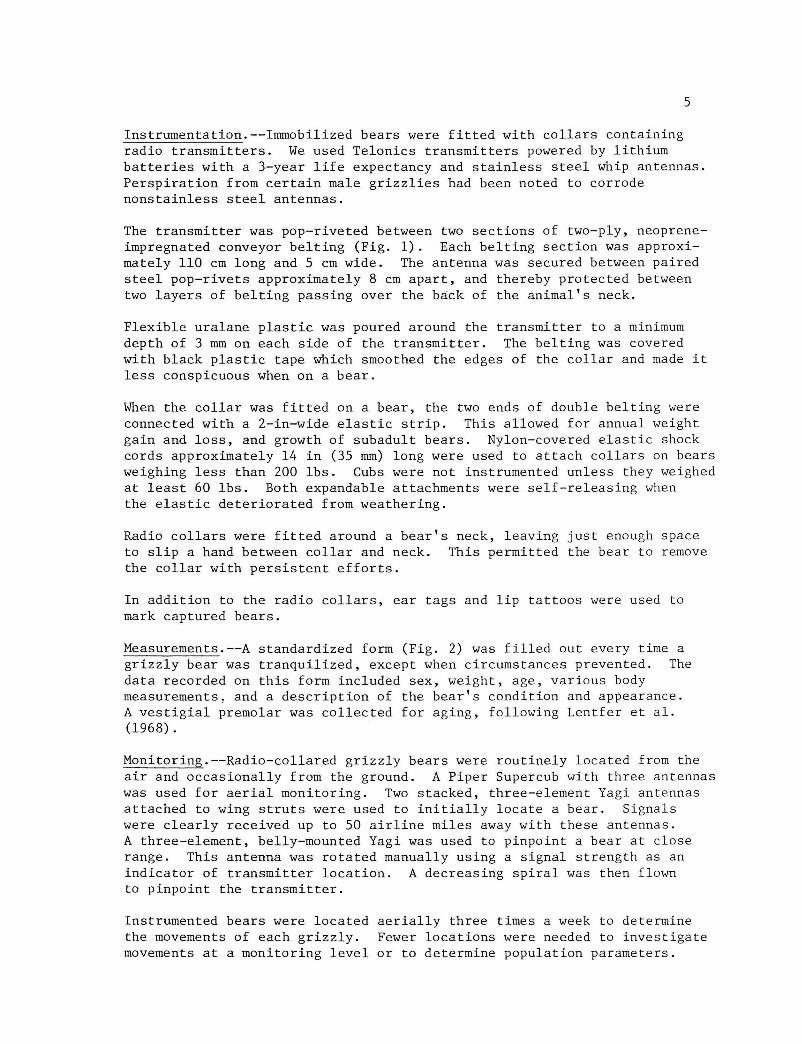
The transmitter was pop-riveted between two sections of two-ply, neoprene-impregnated conveyor belting (Fig. 1). Each belting section was approximately 110 cm long and 5 cm wide. The antenna was secured between paired steel pop-rivets approximately 8 cm apart, and thereby protected between two layers of belting passing over the back of the animal's neck.
Flexible uralane plastic was poured around the transmitter to a minimum depth of 3 mm on each side of the transmitter. The belting was covered with black plastic tape which smoothed the edges of the collar and made it less conspicuous when on a bear.
When the collar was fitted on a bear, the two ends of double belting were connected with a 2-in-wide elastic strip. This allowed for annual weight gain and loss, and growth of subadult bears. Nylon-covered elastic shock cords approximately 14 in (35 mm) long were used to attach collars on bears weighing less than 200 lbs. Cubs were not instrumented unless they weighed at least 60 lbs. Both expandable attachments were self-releasing when the elastic deteriorated from weathering.
Radio collars were fitted around a bear's neck, leaving just enough space to slip a hand between collar and neck. This permitted the bear to remove the collar with persistent efforts.
In addition to the radio collars, ear tags and lip tattoos were used to mark captured bears.
Measurements.—A standardized form (Fig. 2) was filled out every time a grizzly bear was tranquilized, except when circumstances prevented. The data recorded on this form included sex, weight, age, various body measurements, and a description of the bear's condition and appearance. A vestigial premolar was collected for aging, following Lentfer et al. (1968).
Monitoring.—Radio-collared grizzly bears were routinely located from the air and occasionally from the ground. A Piper Supercub with three antennas was used for aerial monitoring. Two stacked, three-element Yagi antennas attached to wing struts were used to initially locate a bear. Signals were clearly received up to 50 airline miles away with these antennas. A three-element, belly-mounted Yagi was used to pinpoint a bear at close range. This antenna was rotated manually using a signal strength as an indicator of transmitter location. A decreasing spiral was then flown to pinpoint the transmitter.
Instrumented bears were located aerially three times a week to determine the movements of each grizzly. Fewer locations were needed to investigate movements at a monitoring level or to determine population parameters.
5
A transmitter B belting C pop rivet D antenna E uralane
F slip loop G shock cord
Fig. 1. Col lar c o n s t r u c t i o n .
6

GRIZZLY BEAR STUDY
TAGGING FORM Method trapped 5ear No.
Date Trapper UTM Forest
Location
Immobilization:
Injection time Method Drug Dosage
Place injected Symptoms & reactions j (time)
1
Complete recovery at:
Briefly describe pelage color and condition; body condition; scars; etc.:
Fig. 2. Tagging form.
7
Immobility time Est. wt. Scale wt. Sex Est. age (circle) C Y SA A Old markers present Eartags: R L Tattoo Photo: Yes No Collar attached with canvas strip; elastic cord. Transmitter No. and frequency
Measurements (in cm): A. Total length Fore foot: Hind foot: Tooth taken: A-l. Contour length G K Yes B. Girth H L No C. Height I M Hair samples: D. Neck circ. J N E. Head length 0 F. Head width
Apparent reproductive status
Recovery reactions:
8
Most ground monitoring was done with a two-element, breakdown Yagi antenna which was handheld. Fixed tower antennas were occasionally used to monitor activity periods. Cast collars and dead bears were located initially with the two-element Yagi until the signal direction became undefinable when the transmitter was close. A paddle antenna or a 1/4 wavelength whip antenna was used in the final location of the transmitter.
Population Parameters
Trapping, observation, and radio telemetry were the primary techniques used in estimating population parameters. Data were gathered from marked animals, including both radio-collared bears and bears which were marked but not radioed, and from unmarked females with cubs of the year.
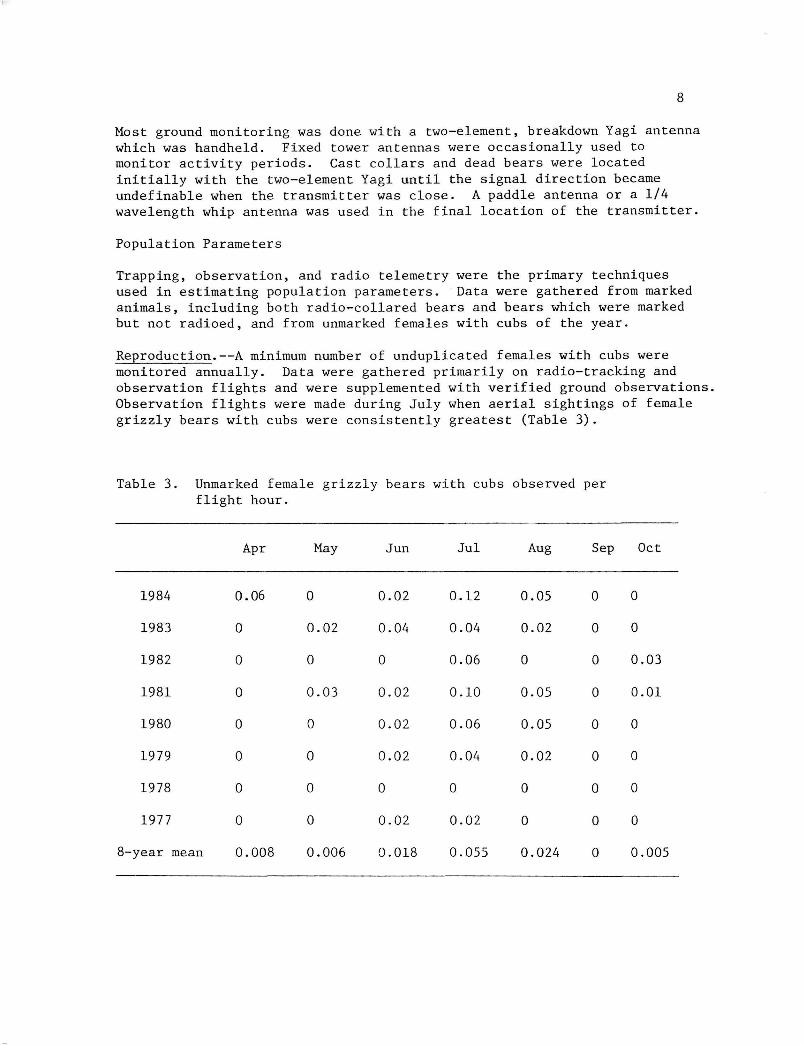
Reproduction.—A minimum number of unduplicated females with cubs were monitored annually. Data were gathered primarily on radio-tracking and observation flights and were supplemented with verified ground observations. Observation flights were made during July when aerial sightings of female grizzly bears with cubs were consistently greatest (Table 3).
Table 3. Unmarked female grizzly bears with cubs observed per flight hour.
1984
1983
1982
1981
1980
1979
1978
1977
8-year mean
Apr
0.06
0
0
0
0
0
0
0
0.008
May
0
0.02
0
0.03
0
0
0
0
0.006
Jun
0.02
0.04
0
0.02
0.02
0.02
0
0.02
0.018
Jul
0.12
0.04
0.06
0.10
0.06
0.04
0
0.02
0.055
Aug
0.05
0.02
0
0.05
0.05
0.02
0
0
0.024
Sep
0
0
0
0
0
0
0
0
0
Oct
0
0
0.03
0.01
0
0
0
0
0.005
Female reproductive rate (number of young produced per breeding female per year) was determined by instrumenting females and monitoring their reproductive status through at least one complete cycle. This type of data accumulated slowly. By 1984 we had monitored nine females through 14 cycles.
Annual reproductive rates were calculated by dividing mean litter size by the mean reproductive cycle. Given an adequate sample, the results should estimate the true reproductive rate. Annual reproductive rates were observed to fluctuate, largely due to food availability. Exceptionally good food years often resulted in early weaning of cubs as yearlings. A poor-to-mediocre food year resulted in lower ratios of young:female for up to 2 years following.
Theoretically, a mean reproductive rate for the population can be obtained by dividing the number of cubs produced by total reproductive years or dividing cubs produced each litter by number of years to the next litter and averaging. Problems arose when attempting to apply data gathered from a small sample of instrumented females to the entire population. Due to the presently widely dispersed population, the high use of timber cover during day time, and the relatively long movements throughout the year (Knight et al. 1980), the proportion of marked animals in the population was not determined.
Age of first reproduction was obtained by instrumenting and monitoring subadult females until cubs were produced. By 1984 we had observed 13 females to first produce cubs at an average of 6.15 years of age.
Age of reproductive senescence appears to be quite variable. The oldest female grizzly bear (Bear 12) observed produced one cub at age 25; the same year she died of old age and malnutrition. Another female (Bear 26) produced one cub at age 17 and died at age 22 without producing again. One female (Bear 13) produced her first young at age 6 but had not produced another litter by age 12.
Sex and age structure.—Population sex and age structures were calculated using only tagged bears and the young of tagged bears. Annual age structures were constructed using bears known to be alive during that year. Survivorship rates were applied to bears not believed to be dead, but not monitored or recaptured during the year of calculation.
Litter sex ratios were calculated using cubs of known litter composition only.
Survivorship.—Survivorship by age class was calculated using tagged bears and the young of tagged bears until weaned. Each tagged bear was entered into the survivorship data set at its age class when trapped. The bear was then kept in the data set as a survivor until it either died or could no longer be monitored.
9

10
Observations
An observation monitoring system was used to gather data supplemental to that achieved through radio telemetry. The system included direct observations of grizzly bears and aerial surveys.
Local residents and field personnel from various agencies were usually cooperative in reporting sightings of grizzly bears. Observations from these sources were recorded and verified as far as possible by IGBST members.
Direct observations of grizzlies were made by IGBST members during field work and aerial surveys. Observations of grizzly tracks, beds, dens, and scats were also recorded. Standard forms were filled out for each type of observation (Appendix A). Ground reconnaissance crews were periodically assigned to portions of the study area where grizzlies had not been observed during aerial surveys.
Aerial surveys were made during periods when grizzlies were active in open areas to obtain a sample of unmarked animals for estimation of the annual number of breeding females. These surveys were usually made during July since females with cubs were generally most visible at that time (Table 3). Predetermined routes which allowed maximum time over open areas were followed for each flight. The routes were consistent from year to year.
Direct observations of unmarked grizzly bears could not be used to estimate population parameters, other than annual cub production. Color patterns had been found to be unreliable for separating individuals; therefore, sightings of unmarked bears were not sex and age specific.
Time lapse cameras were used during 1975 and 1976 to verify that presence of grizzlies in certain areas and as part of a study of bear attractants (Ball 1976). This technique of observing bears was determined to be unproductive. The cameras operated only during daylight hours and required prohibitive amounts of money and effort to maintain.
Mortality
Supplemental data on population parameters, distribution, and movements were obtained through mortalities. Categories of grizzly bear mortalities included known, probable, and possible deaths. A mortality involving a retrieved carcass or parts of a carcass was a known mortality. Reports of a death by a reliable source (as determined by the Team Leader) with no carcass retrieved were counted as probable mortalities. Persistent and repeated rumors of a death were recorded as possible mortalities. Grizzly bear mortality rates were probably underestimated during this study due to the difficulty involved in obtaining volunteer information concerning illegal deaths of a Federally "protected" species. Mortalities were frequently not reported until several years after the death occurred.

11
HABITAT UTILIZATION
Quantitative data from random samples of grizzly bear habitat utilization were gathered through the aid of radio telemetry. Sampling techniques included aerial observation and ground examination.
Major habitat categories were recorded during routine flights to monitor movements of instrumented bears and aerial surveys for unmarked animals. Dominant tree species present, relative overstory density, and distance to the nearest opening at least 100 iri were recorded for locations of bears in the timber. Dominant shrub species present and distance to nearest timber with at least 10% canopy cover were recorded for each bear observed in open habitats.
Teams investigated randomly selected sites where grizzly bears had been aerially located and recorded the plant community present and any evidence of bear activity. Grizzly bears frequently used ecotones, microsites, small openings, and disturbed or serai sites. Therefore, we recorded the vegetation association, or community, the bear was using in addition to the potential climax habitat type.
Individual communities were identified during reconnaissance of the area surrounding the activity site. Differences in canopy coverage of dominant and indicator plant species indicated a community change. A point representative of the community was chosen as plot center, and the observer spiraled out from this point recording all plant species until no new species were added to the list without an inordinate expansion of the sampling area. The plot size was variable from community to community, being large enough to adequately represent the community being described. Plots were rarely bounded by distinct lines. Community types were identified using a combination of Pfister and Arno (1980), Cooper (1975), and Mueggler and Handl (1974).
A standard form was filled in at each site (Appendix A). Location, aspect, elevation, slope, topographic position, and general description of the area physiognomy were recorded. Habitat interspersion was quantified by recording the distance to an opening/timber edge, with the estimated size of the community being recorded. The distance to an opening at least 100 m2 was estimated at location sites in the timber. The distance to timber with at least 10% canopy cover was estimated at location sites in open habitats.
Timber stand characteristics were recorded by establishing three variable plots at each relocation site which occurred in timber. The first plot center was placed at the site of bear activity. Two additional plot centers were located 50 m north and west of the initial plot. For each plot, basal area (sq ft/acre) and heights of included trees were determined with a Spiegel-Relaskop. D.B.H. was measured with a diameter tape. Tree species and whether it was alive or dead were noted.
12
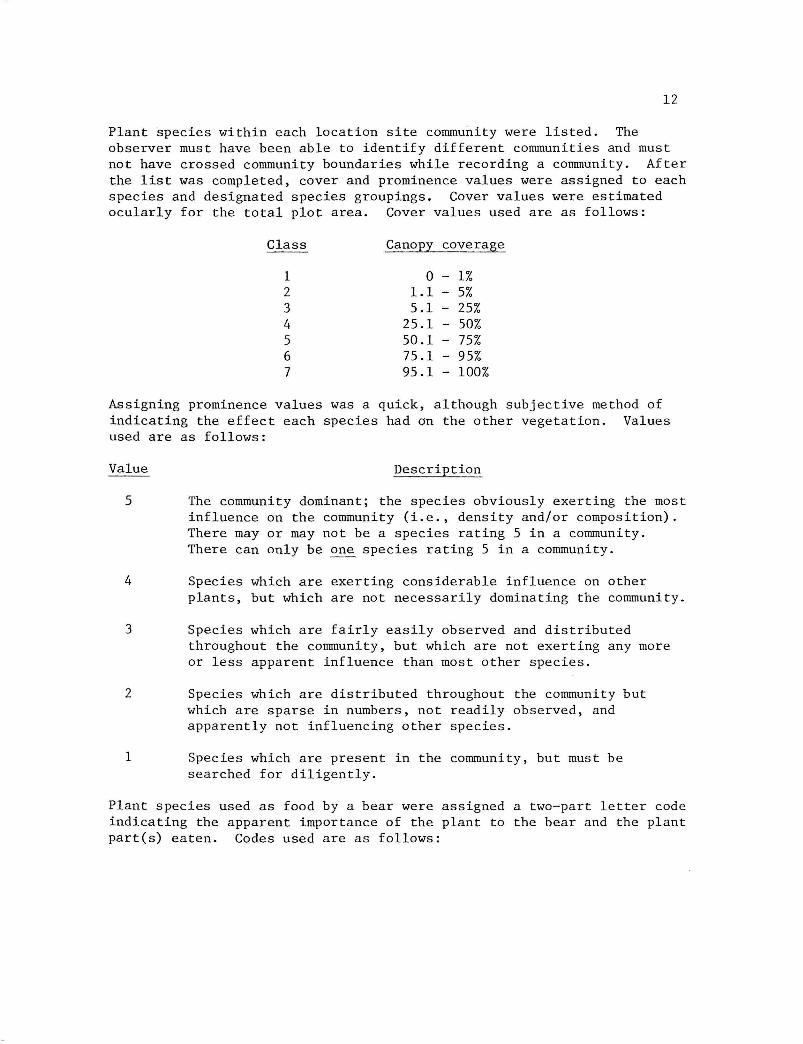
Plant species within each location site community were listed. The observer must have been able to identify different communities and must not have crossed community boundaries while recording a community. After the list was completed, cover and prominence values were assigned to each species and designated species groupings. Cover values were estimated ocularly for the total plot area. Cover values used are as follows:
Class Canopy coverage
1 0 - 1 % 2 1.1 - 5% 3 5.1 - 25% 4 25.1-50% 5 50.1 - 75% 6 75.1 - 95% 7 95.1 - 100%
Assigning prominence values was a quick, although subjective method of indicating the effect each species had on the other vegetation. Values used are as follows:
Value Description
5 The community dominant; the species obviously exerting the most influence on the community (i.e., density and/or composition). There may or may not be a species rating 5 in a community. There can only be one species rating 5 in a community.
4 Species which are exerting considerable influence on other plants, but which are not necessarily dominating the community.
3 Species which are fairly easily observed and distributed throughout the community, but which are not exerting any more or less apparent influence than most other species.
2 Species which are distributed throughout the community but which are sparse in numbers, not readily observed, and apparently not influencing other species.
1 Species which are present in the community, but must be searched for diligently.
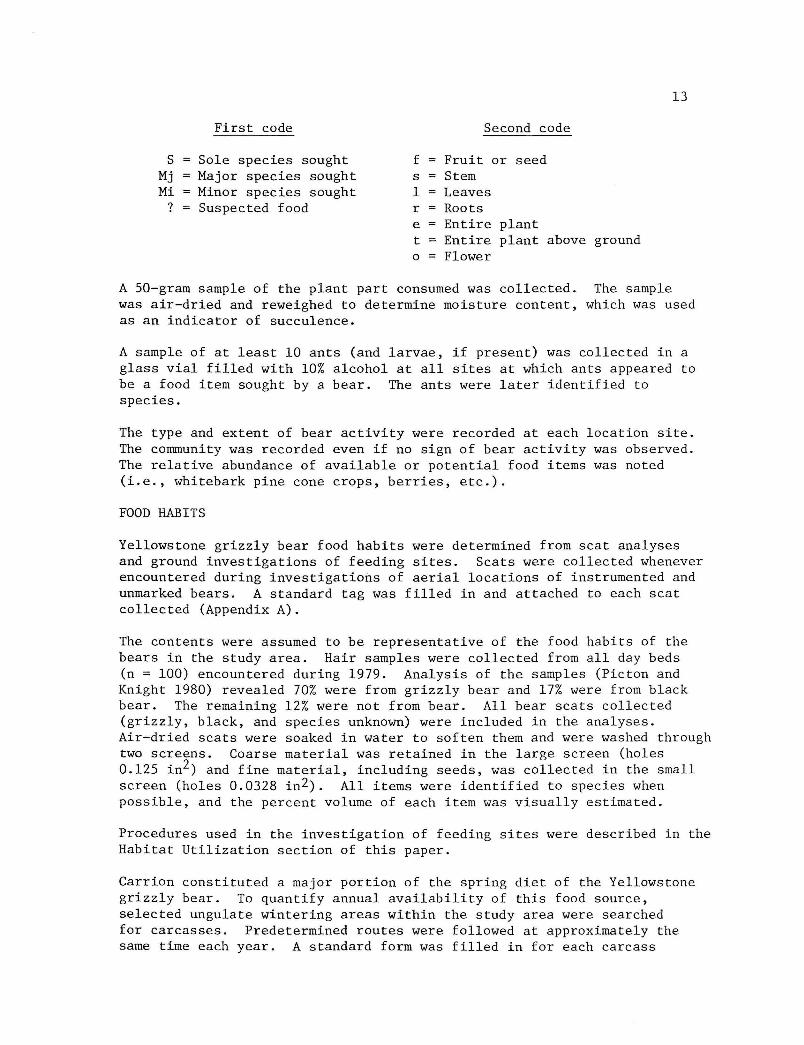
Plant species used as food by a bear were assigned a two-part letter code indicating the apparent importance of the plant to the bear and the plant part(s) eaten. Codes used are as follows:
13
First code Second code
S = Sole species sought f = Fruit or seed Mj = Major species sought s = Stem Mi = Minor species sought 1 = Leaves ? = Suspected food r = Roots
e = Entire plant t = Entire plant above ground o = Flower
A 50-gram sample of the plant part consumed was collected. The sample was air-dried and reweighed to determine moisture content, which was used as an indicator of succulence.
A sample of at least 10 ants (and larvae, if present) was collected in a glass vial filled with 10% alcohol at all sites at which ants appeared to be a food item sought by a bear. The ants were later identified to species.
The type and extent of bear activity were recorded at each location site. The community was recorded even if no sign of bear activity was observed. The relative abundance of available or potential food items was noted (i.e., whitebark pine cone crops, berries, etc.).
FOOD HABITS
Yellowstone grizzly bear food habits were determined from scat analyses and ground investigations of feeding sites. Scats were collected whenever encountered during investigations of aerial locations of instrumented and unmarked bears. A standard tag was filled in and attached to each scat collected (Appendix A).
The contents were assumed to be representative of the food habits of the bears in the study area. Hair samples were collected from all day beds (n = 100) encountered during 1979. Analysis of the samples (Picton and Knight 1980) revealed 70% were from grizzly bear and 17% were from black bear. The remaining 12% were not from bear. All bear scats collected (grizzly, black, and species unknown) were included in the analyses. Air-dried scats were soaked in water to soften them and were washed through two screens. Coarse material was retained in the large screen (holes 0.125 in ) and fine material, including seeds, was collected in the small screen (holes 0.0328 in2). All items were identified to species when possible, and the percent volume of each item was visually estimated.
Procedures used in the investigation of feeding sites were described in the Habitat Utilization section of this paper.
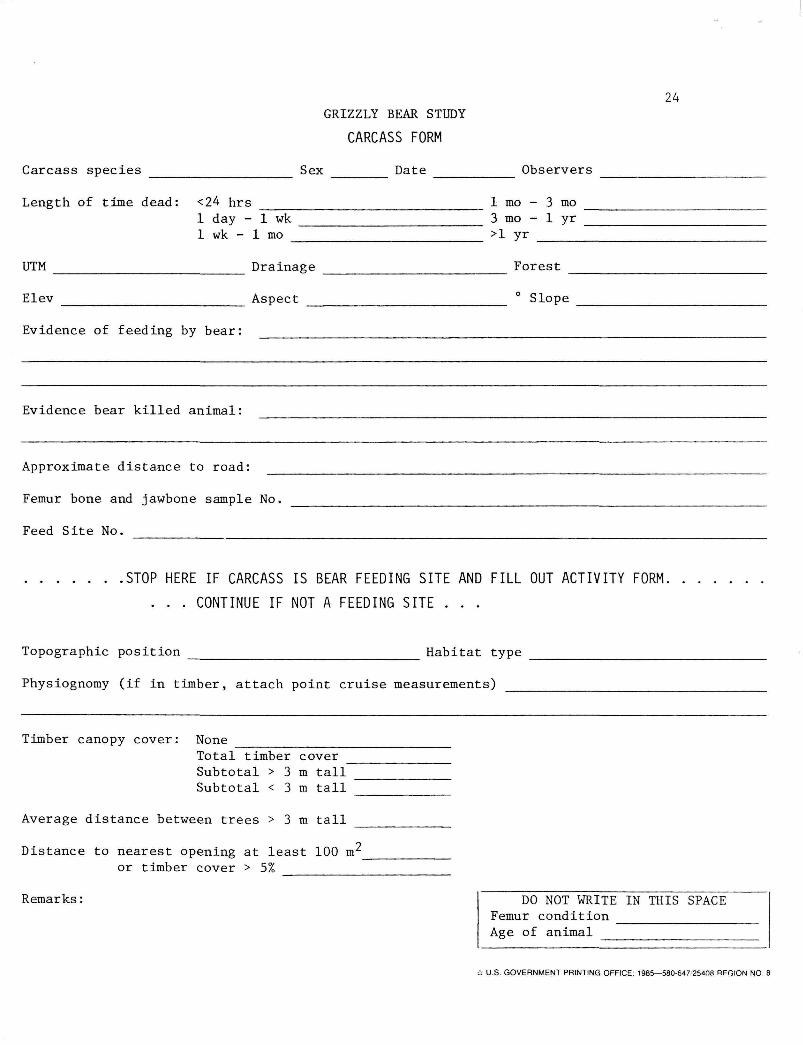
Carrion constituted a major portion of the spring diet of the Yellowstone grizzly bear. To quantify annual availability of this food source, selected ungulate wintering areas within the study area were searched for carcasses. Predetermined routes were followed at approximately the same time each year. A standard form was filled in for each carcass

14
(Appendix A). A mandible and femur were collected to determine the animal's age and physical condition at death. Marrow fat content ratings used were described by Cheatum (1949). Carcasses were examined for evidence that the animal had been killed and/or fed on by bears. The date of death and distance to open or timber were estimated.
whitebark pine nuts constituted a major food for Yellowstone grizzly bears (Kendall 1981). Since the nuts were apparently used in relation to their availability, the size of the cone crop in any year indicated the relative importance of the nuts in the diets of the bears. Beginning in 1980, permanent transects were established at nine sites within the study area. Ten whitebark pine trees were selected along each 90-m transect and marked with a blaze and an aluminum identification tag. The crown of selected trees could be viewed from the ground from at least two angles. All trunks joined at the base were considered one tree. Cones were counted during July before squirrels began harvesting nuts.
Cone production estimates during the summer indicated the availability of whitebark pine nuts to grizzly bears during the late summer, fall, and next spring. Poor cone production during a year indicated that more grizzlies would be seeking alternate food sources, often in association with human activity.
These techniques used to determine food habits had limitations in accuracy. Feeding activities produced evidence of varying preservability and longevity; therefore, site examinations were not used alone to determine food habits. Site examinations provided data on habitat use and preference and feeding behavior which produced long lasting sign. Easily digestible food items, which were rarely revealed through scat analysis (i.e., mushrooms), were often evident at the feeding site. Scat analysis alone did not reflect food habits accurately either. Easily digestible food items, such as meat, mushrooms, and berries, were under-represented in the scats and, therefore, in the analysis of food habits. When feeding site exams, scat analysis, carcass surveys, and whitebark pine transects were analyzed together, more realistic results were obtained.
15
LITERATURE CITED
Blanchard, B., and R. Knight. 1980. Status of grizzly bears in the
Yellowstone system. Trans. North Am. Wildl. and Nat. Resour. Conf. 45:263-267.
Ball, R. E. 1976. The use of time-lapse cameras in the distribution and population studies of grizzly bears (Ursus arctos) in the Shoshone National Forest, Park County, Wyoming. M.S. Thesis, Univ. of Wyoming, Laramie. 34pp.
Cheatum, E. L. 1949. Bone marrow as an index of malnutrition in deer. New York State Conserv. 3(5):19-22.
Cooper, S. V. 1975. Forest habitat types of northwestern Wyoming and contiguous portions of Montana and Idaho. Ph.D. Dissertation, Washington State Univ., Pullman.
Johnson, K. G., and M. R. Pelton. 1980. Prebaiting and snaring techniques for black bears. Wildl. Soc. Bull. 8(l):46-54.
Kendall, K. C. 1981. Bear use of pine nuts. M.S. Thesis, Montana State Univ., Bozeman.
Knight, R., B. Blanchard, K. Kendall, and L. Oldenburg. 1980. Yellowstone grizzly bear investigations. Report of the Interagency Study Team, 1978-1979. Natl. Park Serv. 91pp.
Lentfer, J. W., S. H. Eide, L. H. Miller, and G. N. Bos. 1968. Report on 1967 brown bear studies. Alaska Fed. Aid in Wildl. Res. Rep. Proj. W-15-R-W and 3. 31pp.
Mueggler, W. F., and W. Handl. 1974. Mountain grassland and shrubland habitat types of western Montana. Interim Report, Intermountain For. Range Exp. Stn. and Reg. 1, U.S. For. Serv. Multilith. 89pp.
Pfister, R., and S. F. Arno. 1980. Classifying forest habitat types based on potential climax vegetation. For. Sci. 26(l):52-70.
Picton, H. D., and R. Knight. 1980. Obtaining biological information from grizzly bear (Ursus arctos horribilis) hair. Paper presented at Northwest Sect. Wildl. Soc, April 8-10, 1980, Banff, Alberta. 19pp.
Skjonsberg, T., and A. Westhaver. 1978. A study in the chemical immobilization of animals with suggestions for application in Canada's National Park. Border Grizzly Tech. Comm. Working Paper No. 30. 83pp.

16
A P P E N D I X A
S t a n d a r d F i e l d Forms

Bed No.
Feed Site No.
Date
Observer
Elevation
Topographic Position
GRIZZLY BEAR STUDY
DAY BED FORM
UTM
Drainage
Forest
Aspect
Ground photo No(s)
° Slope
Habitat Type
Physiognomy (if in timber, attach point cruise measurements)
17
Sign: Track Scat Hair
Bed Description:
Length cm Width cm Depth
Lined with
Time last used: < 24 hours 1 day - 1 week 1 week - 1 month
Distance to nearest tree
Immediate cover at bed
1-3 months > 3 months Last year
meters
Bed constructed in:
Open Timber > 3 m tall; canopy cover Timber < 3 m tall; canopy cover
tear at least 10% visible at: N S
m m
E W
Distance from bed to nearest opening at least 190 m^_ or timber cover > 5%
cm
Remarks:
m m

18 GRIZZLY BEAR STUDY
DEN FORM
Bear No. UTM
Year den used Drainage
Date Forest
Observer Ground photo No(s).
Elev. Aspect ° Slope
Topog. position Habitat type
Physiognomy (in in timber, attach point cruise measurement)
Construction: Dug History: New Old Natural cavity Reused
Dimensions (metric measurements):
A. Entrance: Height Width
B. Tunnel: Height Width Length
C. Chamber: Height Width Depth
D. Total length of den: ^
E. Nest: 1. Height at center front edge back edge 2. Width breadth depth 3. Composition
Type of soil den dug in
Distance to opening at least 100 m or timber with > 5% cover
Timber overstory: none canopy cover > 3 m tall canopy cover < 3 m tall
A. List dominant species and canopy cover of each:
B. Avg. distance between trees > 3 m tall C. Avg. height of overstory Avg. DBH
Understory: total shrub cover total herb cover subtotal forb cover subtotal grass/sedge cover
A. List dominant species and cover of each:
Den Sketch: draw a front, top, and side view of den on back.
Remarks: on back
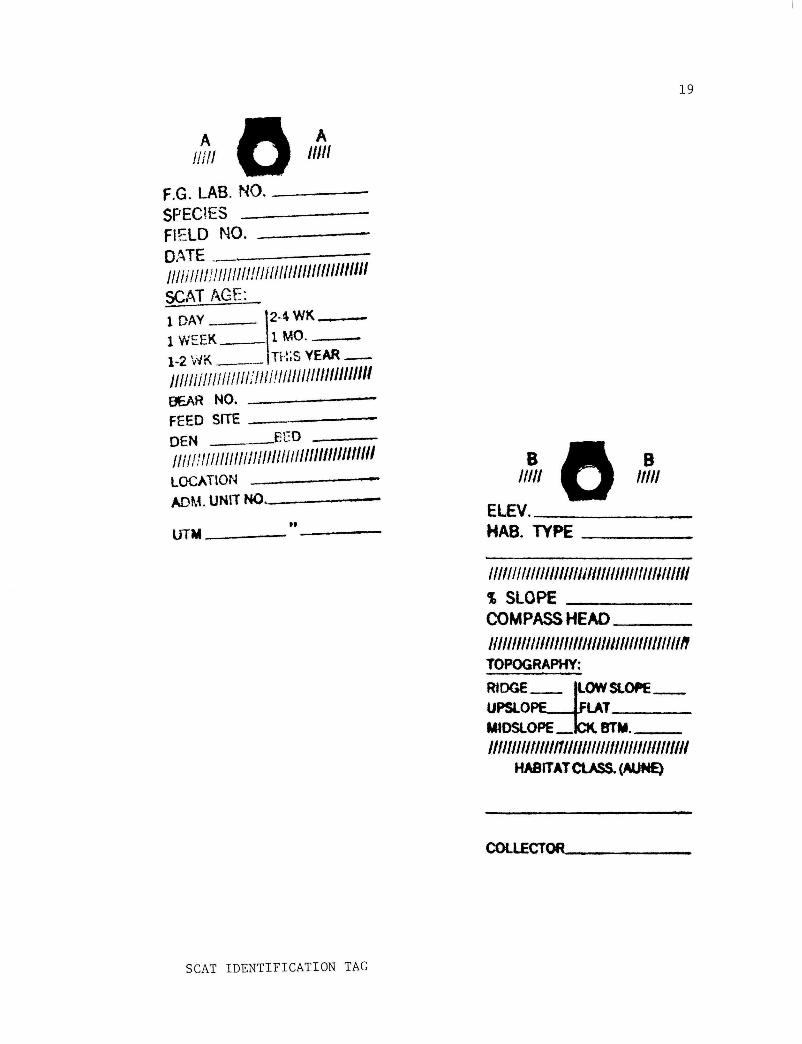
SCAT IDENTIFICATION TAG
19

20
Grizzly Bear
Black Bear
The PALMISCIANO METHOD of bear track identification.

Feed Site No.
UTM
Date
GRIZZLY BEAR STUDY
COMMUNITY SITE ANALYSIS
Observers
21
Drainage
Flight Date
Aspect
Aerial Photo No.
° Slope Topographic Position
Forest
Bear No.
Elevation
Area Physiognomy (if in timber, attach point cruise measurements)
Habitat Type Ground Photo No.
Ave. distance between trees > 3 m tall
Plot size Community size
Distance to open or timber
TREES
Feed Cover Prom.
Subtotal cover > 3 m tall
Species Feed Cover Prom
Subtotal cover < 3 m tall
Species
SHRUBS Total cover
HERBS Total cover Subtotal forbs Subtotal grass/sedge
(over)

Page 2
22 Feed Site No. Ant Vial No. 50 g Sample No.
Type of activity: Scat Carcass Squirrel cache Track Gopher dig Torn log Hair Gopher cache dig Turned rock Bed Root dig Torn anthill Claw Stripped bark Grazing
Unknown dig Mushrooms Other
Age of activity:
Extent and size of feeding site:
Detailed activity in community:
Adjacent or associated activities not in community:
Relative food source abundance (PIAL cones; berries; root foods; carcasses; etc.):
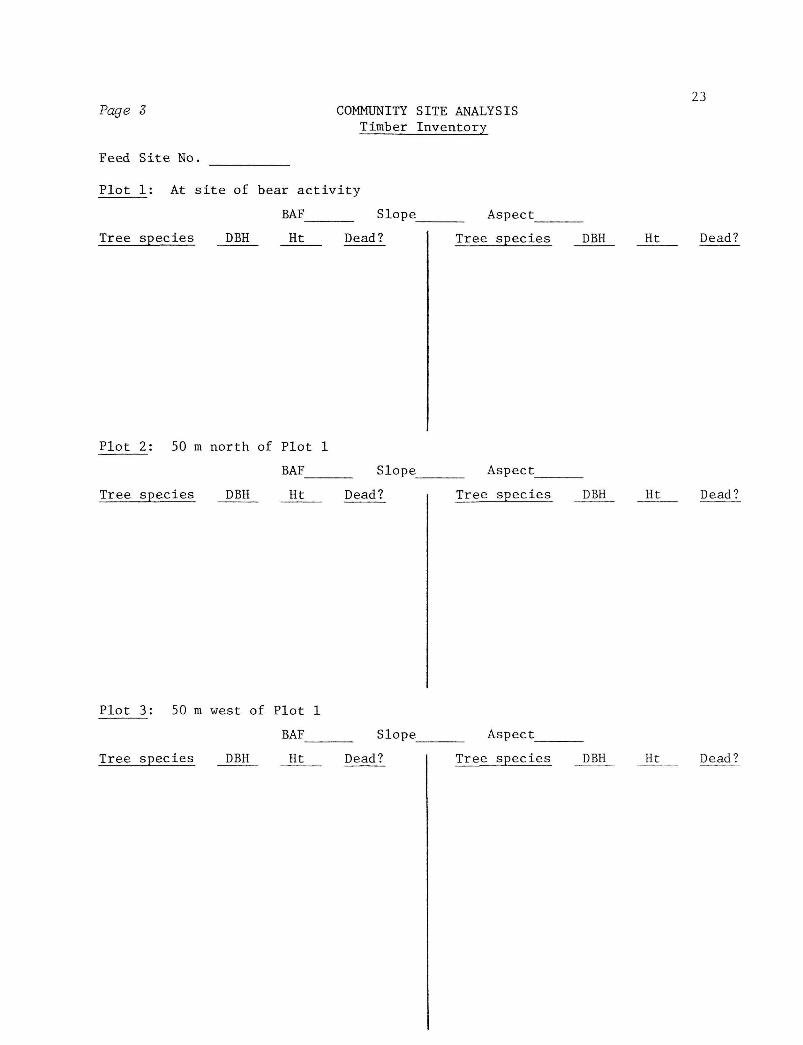
Page 3
Feed Site No.
COMMUNITY SITE ANALYSIS Timber Inventory
Plot 1: At site of bear activity
BAF Slope_
Tree species DBH Ht Dead?
Plot 2: 50 m north of Plot 1
BAF Slope_
Tree species DBH Ht Dead?
Plot 3: 50 m west of Plot 1
BAF Slope
Tree species DBH Ht Dead?
Aspect
Tree species
Aspect_
Tree species
Aspect
Tree species
DBH
DBH
DBH
23
Ht Dead?
Ht Dead?
Ht Dead?
Carcass species
UTM
Elev
GRIZZLY BEAR STUDY
CARCASS FORM
Sex Date
Length of time dead: <24 hrs 1 day - 1 wk 1 wk - 1 mo
Drainage
Aspect
Evidence of feeding by bear:
Observers
1 mo - 3 mo 3 mo - 1 yr >1 yr
Forest
0 Slope
24
Evidence bear killed animal:
Approximate distance to road:
Femur bone and jawbone sample No.
Feed Site No.
.STOP HERE IF CARCASS IS BEAR FEEDING SITE AND FILL OUT ACTIVITY FORM.
. . . CONTINUE IF NOT A FEEDING SITE . . .
Topographic position Habitat type
Physiognomy (if in timber, attach point cruise measurements)
Timber canopy cover: None
Total timber cover Subtotal > 3 m tall Subtotal < 3 m tall
Average distance between trees > 3 m tall
Distance to nearest opening at least 100 m̂ _ or timber cover > 5%
Remarks: DO NOT WRITE IN THIS SPACE Femur condition Age of animal
-.7 U.S. GOVERNMENT PRINTING OFFICE: 1985—580-647;254OB REGION NO


1'. y c x
5 - /< ,,,-/..<.. d* /!"««- <Ki X<r - f y
? . <'< y C <r'S £<-"»*/•<
•>' . Per it. - i j i i ' / u ^ ' fy<c£t'&<£ Cert ^ c«.4^_
% " / / ' t-« /J^? yr.'-^'C-YtU-,\ £>."• & *H/J it/lit 7tc>,tf
'i • A•- ••v- •• t c ^ ' / (y ct̂ A-c A<cA
/ / /) cestui /Lc cA a*- rhe^c^fs /Jt<ttc/<tMOJcttnr/s
//.- y-fac^ - £*.,<? <-*'' ^*-AYc^