field-testing of structure on shallow foundation to...
TRANSCRIPT
DATA PAPER
Field-Testing of Structure on ShallowFoundation to Evaluate Soil-StructureInteraction Effects
Lisa M. Star,a) M.EERI, Michael J. Givens,b) M.EERI,Robert L. Nigbor,c) M.EERI, and Jonathan P. Stewart,c) M.EERI
A simple test structure was designed and constructed to facilitate forced-vibration testing of a shallow foundation experiencing combined base shearand moment demands. The structure consists of a reinforced concrete foundationand top slab separated by steel columns that can be configured with braces. Theslabs have a 2∶1 aspect ratio in plan view to facilitate variable amount of over-turning for shaking in orthogonal directions. The structure was transported to twofield sites with representative shear-wave velocities of approximately VS ¼95 m∕s and 190 m∕s. At each site, the foundation slab was cast-in-place. Forcedvibration testing was conducted over a wide range of frequencies and load levelsto enable the evaluation of foundation-soil stiffness and damping behavior forlinear and nonlinear conditions. The data collected to facilitate such analysesinclude acceleration, displacement, and foundation pressure records (data canbe accessed at DOI: 10.4231/D3NK3658M, DOI: 10.4231/D3HT2GC4G,DOI: 10.4231/D3D21RK0N). [DOI: 10.1193/052414EQS072]
INTRODUCTION
The importance of field-testing to measure soil-structure interaction (SSI) effects is asso-ciatedwith inherent limits of analyticalmodels used to describe foundation stiffness and damp-ing, which have generally been developed for idealized conditions such as rigid foundationsand depth-invariant soil properties. Thus, testing is needed to evaluate model applicability forrealistic field conditions and to guide the selection of input parameters. NIST (2012) sum-marizes existingmodels for predicting the stiffness and damping of foundation-soil interactionand current recommendations for adapting such models to field conditions.
Summaries of past SSI-related testing for the evaluation of foundation stiffness anddamping can be found elsewhere (NIST 2012) and are not repeated here for brevity. How-ever, we do wish to make a few key points to place the value of the present work incontext:
a) California State University, Long Beach, 1250 Bellflower Blvd, Long Beach, CA 90840b) Arup, 12777 West Jefferson Blvd Building D, Los Angeles, CA 90066c) University of California, Los Angeles, Civil & Environ. Eng. Dept., 5731 Boelter Hall, Los Angeles, CA 90095-1593
Earthquake Spectra, Volume 31, No. 4, pages 2511–2534, November 2015; © 2015, Earthquake Engineering Research Institute2511

• First, while both field- and laboratory-scale tests can be used to measure foundationperformance under dynamic loading, field-testing is preferred because radiation ofenergy away from the foundation into the surrounding soil medium is an importantcomponent of foundation-soil interaction, which cannot be adequately capturedwithin the relatively small dimensions of laboratory models.
• Second, while field-testing can involve seismic loading (Tang et al. 1990, Wong andLuco 1990) or controlled forced vibrations (Lin and Jennings 1984, Crouse et al.1990, Luco andWong 1990, de Barros and Luco 1995, among others), forced vibra-tion testing has some distinct advantages with respect to the evaluation of founda-tion stiffness and damping. One principal advantage relates to measurements ofrelative foundation/free-field motions, which comprise an essential test outcome(the desired quantities of foundation stiffness and damping are related to load/displacement ratios, and relative foundation/free-field motions comprise thedenominator). In forced vibration testing, measured foundation motions are (allow-ing for noise effects) the desired differential motion, whereas in seismic loading thedifferential is difficult to establish because of spatial variations in ground motions.
• Third, while there are many cases of seismic loading having produced nonlinearSSI responses (Wong and Luco 1990, Stewart et al. 1999), previous forced vibrationfield tests of shallow foundations have not induced nonlinear soil responses causingsubstantial changes in soil properties relative to those for small strain (elastic)conditions.
In this paper, we describe a sequence of experiments in which the same structure is sub-jected to forced vibrations at multiple sites representing varying degrees of base flexibility.An essentially fixed-base condition is achieved in testing within a structural laboratory,whereas medium-stiff and soft soil conditions are present at the Garner Valley DownholeArray (GVDA) and Wildlife Liquefaction Array (WLA) field test sites, respectively. Atboth field tests sites, the structure was mounted on cast-in-place shallow mat foundations.Forced vibrations were applied on the top slab and foundation mat with two shaker systemsthat impart small and large force demands. Specimen responses were recorded with accel-erometers, pressure cells, and displacement transducers. A data acquisition system was usedwith precise time stamping, which is important for interpretation of damping effects. The teststructures were also instrumented to record earthquakes for several months between tests andfollowing the completion of testing.
The full data set can be found online at https://nees.org/warehouse/project/637. Three testseries are provided on NEEShub (2012a; Experiments 25 to 27) based on test location:(1) fixed-base testing, denoted as LAB; (2) WLA field-testing; and (3) GVDA field-testing.Each experiment included multiple trials with varying test conditions.
The value of the present test sequence is that it comprises field-testing (appropriateboundary conditions at multiple sites) over both a wide range of frequencies and loadingamplitudes. As such, this data set affords the opportunity to evaluate the effects of nonli-nearity on the frequency-dependent foundation responses, which has not been possible pre-viously. In this data paper, we do not interpret the foundation responses, but instead describethe experimental set-up and instrumentation, and illustrate some useful aspects of therecorded data.
2512 STAR ET AL.
TEST STRUCTURE
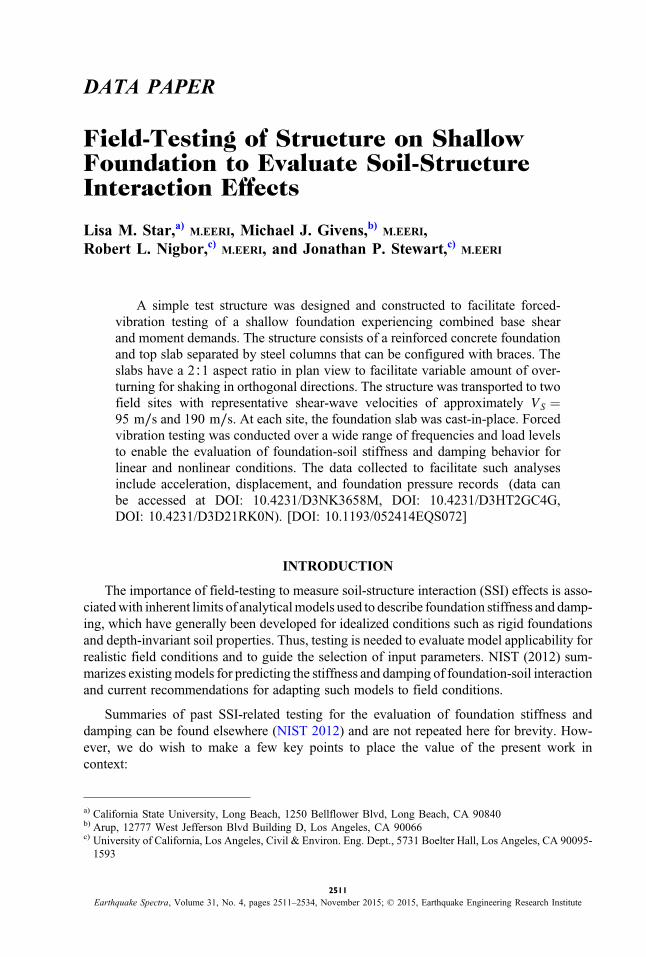
The test superstructure consists of steel columns and braces supporting a concrete topslab, as shown in Figure 1. The steel members have the following attributes: (1) bolted con-nections to facilitate assembly in the field; (2) sufficient member capacity to prevent damageduring testing, thus allowing re-use of the superstructure in multiple tests; (3) transportablefrom site-to-site; and (4) configurable bracing system to allow modification of superstructurestiffness. The top slab was designed to be nearly rigid against moment and shear deforma-tions and to have sufficient mass that the soils underlying the foundation were likely toexperience nonlinear responses during testing. The column-slab system has a high fixed-base natural frequency, between approximately 11 Hz and 35 Hz depending on the config-uration and direction of shaking, to promote a strong effect of soil flexibility and damping onthe system response.
The upper deck is composed of concrete with a nominal strength of 27.6 MPa reinforcedwith #7 grade 60 rebar and is 0.61 m thick, 4.28 m long and 2.13 m wide. The columnswere constructed from four square hollow steel sections HSS 12 0 0 � 12 0 0 � 1∕2 0 0
(30.5 cm� 30.5 cm� 1.3 cm) that are 2.13 m tall and have a mass of approximately250 kg each. The removable cross-braces are constructed from HSS 4 0 0 � 4 0 0 � 1∕2 0 0
Figure 1. Configuration of the UCLA portable SSI test structure.
FIELD-TESTING STRUCTUREON SHALLOWFOUNDN. TO EVALUATE SSI EFFECTS 2513

(10.2 cm� 10.2 cm� 1.3 cm) steel sections. The total mass of the braces is approxi-mately 800 kg.
The foundations of the test structure consisted of simple mats constructed at grade andpoured in place to ensure realistic foundation-soil contact. The foundation of the test structureis sufficiently thick to be nearly rigid, so as to avoid damage during the large-amplitude testsand to ensure compatibility with SSI analytical models. The foundation mat is composed ofconcrete with a nominal strength of 27.6 MPa concrete reinforced with #5 grade 60 rebar. Theconcrete foundations had more than 28 days to cure before testing. Based on the dimensionsand unit weight, the foundation has an estimated mass of 13,340 kg. Nine 2.54 cm diameterthreaded rods were used to anchor the base plate of each column of the super structure to thefoundation. The anchors were pre-drilled and secured using epoxy. The super structure andfoundation together are 3 m tall.
TEST SITES
STRUCTURAL LAB
The UCLA Structural Engineering Laboratory (LAB) is fitted with a 1.5 m thick rein-forced concrete strong floor. As shown in Figure 2, DYWIDAG threaded bars are embeddedin the strong floor on a 0.6 m grid and allow the test structure to be tied directly to the floor,leading to an effectively fixed-base condition.
WILDLFE LIQUEFACTION ARRAY (WLA) TEST SITE
The Wildlife Liquefaction Array (WLA) is maintained by NEES@UCSB (NEEShub2012b; nees.ucsb.edu/facilities/wla). Figure 3 shows a plan view of the site. WLA is located
Figure 2. Test structure connection to the LAB site strong floor.
2514 STAR ET AL.

on the west bank of the Alamo River, 13 km north of Brawley, California. WLA was instru-mented with a vertical array in 1982 to study liquefaction (Youd and Holzer 1994). Severalsignificant earthquakes have been recorded at this site, including the first direct measurementof dynamic pore pressure during liquefaction in 1987 (Youd et al. 2004a). The site wasexpanded and updated in 2004 as a NEES field test site (Steidl et al. 2004). Figure 3shows two general instrument locations marked as the “1982 site” and “2004 site.”
Geotechnical investigations at the WLA site include borings with standard penetrationtesting, cone penetration test (CPT) soundings, and laboratory testing of soil samples(Youd et al. 2004b). As shown in Figure 4, field tests indicate laterally consistent soil con-ditions, with 2.0–3.0 m of silty clay to clayey silt overlying silt, silty sand, and sandy silt thatis 3.0–4.0 m thick. This relatively coarse layer is underlain by silty clay to clayey material.The average moist unit weight of the soil is approximately 17.0 kN∕m3. The water tabledepth varies seasonally from 1–2 m below the ground surface. These measurements arefrom the 2004 site portion of WLA.
Geophysical data for the site has been developed from seismic CPT downhole measure-ments, suspension PS logging (Youd et al. 2004b), and Spectral-Analysis-of-Surface-Waves(SASW) measurements (Stokoe et al. 2010) conducted at the time the NEES@UCSB site wasestablished and supplemental measurements made near the location of the SSI test structure.As shown in Figure 3, the locations of prior measurements are principally at the 2004 siteportion of WLA, which is approximately 70 m from the “1982 site” adjacent to the SSI teststructure. As part of the present work, SASW testing was performed adjacent to the teststructure (Stoke et al. 2010). Seismic crosshole testing was also performed across the struc-ture’s footprint before and after specimen construction. The SASW and crosshole testinglocations are shown in Figure 3. The crosshole survey was conducted in three phases to
Figure 3. Plan view sketch of the WLA site showing locations of the various geophysical sitecharacterization tests.
FIELD-TESTING STRUCTUREON SHALLOWFOUNDN. TO EVALUATE SSI EFFECTS 2515

evaluate the influence of the structural weight on seismic velocities. Initial crosshole testingwas performed on 17 November 2009, before construction, 20 November 2009, followingconstruction of the foundation and on 17 December 2009, and 25May 2011, following instal-lation of the full structure. The crosshole testing was performed at depths of 1 m and 2 m. Asshown in Figure 4, the crosshole testing indicates seismic velocities in the upper 1–2 m ofabout VS ¼ 95 m∕s prior to construction and 108m∕s following construction.
GARNER VALLEY DOWNHOLE ARRAY (GVDA) TEST SITE
The Garner Valley Downhole Array (GVDA) site is also maintained by NEES@UCSB(NEEShub 2012b; nees.ucsb.edu/facilities/gvda). Figure 5 shows a plan view of the site. Asshown in Figure 6, the GVDA site includes a permanent steel moment frame structure with areinforced concrete roof and foundation, referred to here as the UCSB permanently installedSSI structure. Details on the dimensions and mass of this structure are provided in Tileyliogluet al. (2011) and at the NEES@UCSB website. The permanent structure is situated approxi-mately 4.6 m to the south of the portable structure considered in the present work. During thisseries of tests the permanent structure was unbraced.
Geotechnical investigations at the GVDA site include borings with standard penetrationtesting, cone penetration test (CPT) soundings, and laboratory testing of soil samples (Youdet al. 2004b). As shown in Figure 7, the site profile consists of 18–25 m of lake-bed alluviumconsisting principally of silts and clays near the ground surface transitioning to relative coarsesands and silty sands below approximately 6 m. Underlying the alluvium is decomposed
Figure 4. Subsurface characteristics based on site exploration of the WLA site: (a) free-fieldshear wave velocity profile and (b) material profile.
2516 STAR ET AL.

granite, which extends to depths of about 91 m, where competent granodiorite bedrock isencountered. The average moist unit weight of the soil varies from 17.3 kN∕m3 to19.6 kN∕m3. The water table ranges seasonally from 0 m to 3 m below the ground surface.As shown in Figure 7, geophysical data from the site is available from Stokoe et al. (2004;SASW), Youd et al. (2004b; downhole), and Steller (1996; suspension logging).
Figure 5. Plan view of the GVDA site showing the approximate locations of geophysical tests.
Figure 6. Photograph showing the portable test structure (right) and the previously constructedpermanent structure (left) located at GVDA
FIELD-TESTING STRUCTUREON SHALLOWFOUNDN. TO EVALUATE SSI EFFECTS 2517

As part of the present work, a crosshole seismic survey was undertaken on 26 May 2011to evaluate VS within the upper two meters of the soil column below the structural footprint.A direct measurement of the VS of the soil was not performed prior to construction of theconcrete slab foundation. In an effort to back-calculate the Vs with no influence from thestructural weight the survey was performed in two phases. Cross-hole testing was initiallyperformed across the structural footprint with only the weight of the foundation, followed bytesting after the installation of the full structure. As shown in Figure 7, the cross-hole testingindicates seismic velocities in the upper 1–2 m of about VS ¼ 187 m∕swith the foundation inplace and 194 m∕s following the complete structure installation. Based on these results, thescaling of VS with overburden pressure was evaluated using (adapted from Tileylioglu et al.2011):
EQ-TARGET;temp:intralink-;e1;41;231
ðVsÞ1ðVsÞ2
¼�σ 0v0 þ ðΔσvÞ1
σ 0v0 þ ðΔσvÞ2
�n∕2
(1)
where ðVSÞ1 and ðVSÞ2 are the overburden-consistent shear wave velocities for a particulardepth z, σv0 0 is the effective stress from the soil’s self-weight at depth z, and ðΔσvÞ1 andðΔσvÞ2 are the increment of vertical stress at depth z from varying structural weights(e.g., for combined foundation/structure and foundation alone, respectively). The Δσv quan-tities were computed using classical “Boussinesq-type” stress distribution theory (e.g.,Fadum 1948). The n value typically varies from approximately 0.5 for granular soils to1.0 for cohesive soils with plasticity index PI > 6.5 (Yamada et al. 2008). A site-specificn value of 0.6 was back-calculated for a depth of 1.5 m below ground surface from Equation
Figure 7. Subsurface characteristics based on site exploration of the GVDA site: (a) shear wavevelocity profile and (b) material profile.
2518 STAR ET AL.

using the aforementioned cross-hole velocities at a depth where σ 0v0 ¼ 25 kN∕m2, ðΔσvÞ1 ¼
10 kN∕m2 and ðΔσvÞ2 ¼ 6.3 kN∕m2.
The velocity that is expected at the site prior to foundation placement was then derived ina similar manner to Equation 1:
EQ-TARGET;temp:intralink-;e2;62;586VS ≈ VS0
�σ 0v0 þ Δσvσ 0v0
�n∕2
(2)
where VS0 denotes the pre-construction, free-field shear wave velocity. Based on Equation 2we find VS0 ¼ 176 m∕s for a depth of 1.5 m using the site-specific n ¼ 0.6, VS ¼ 194 m∕s,σ 0v0 ¼ 25 kN∕m2 and Δσv ¼ 10 kN∕m2.
INSTRUMENTATION AND SHAKERS
SENSORS
Figure 8 shows the orientations of the coordinate axes relative to the foundations and thelocations of sensors for the GVDA test. Similar diagrams are given in Appendix Figures A1and A2 for LAB and WLA, respectively. Vibration modes for translation are represented byx, y, and z, while rotation about theses axes, respectively, are xx, yy, and zz. The portablestructure was instrumented with eight Kinemetrics EpiSensor ES-T triaxial accelerometers.The accelerometers have a selected output range of�20V, for an amplitude range of�4.0 g.The bandwidth is DC to 200 Hz. Accelerometers have calibrated sensitivities of5.00� 0.02 volts per g. One triaxial accelerometer was bolted in place at each corner ofthe structure top slab and foundation slab. At the GVDA test site, the permanent structurewas instrumented with four triaxial accelerometers, three on the base slab, and one on theroof. At the soil sites, additional triaxial accelerometers were installed in the soil between1.5–4.3 m from the structure in both the positive x and the positive y-directions. Both werelocated at the elevation of the foundation base.
Artificial phase delays are introduced into digital data from sensors, data acquisitionequipment, and data processing. This is particularly a concern when different sensorsand data acquisition systems are used. Unaccounted for, these phase delays could introduceerrors in the evaluation of structural response characteristics, especially the complex dampingbehavior that is part of SSI. A well-designed instrumentation system will have a phaseresponse that is a linear function of frequency. This results in a constant group delay, definedas the derivative of phase delay with frequency. The Kinemetrics ES-T accelerometers aredesigned to have a linear phase response from 0 radians at 0 Hz to about 2 radians at 200 Hz(1;257 rad∕ sec), giving a constant group delay of about 0.0016 rad-sec. Constant group delaywill result in the time delay of the amplitude envelope at various frequencies being equalacross the frequency range, preserving the time domain wave shape. Further, the KinemetricsES-T accelerometers are very closely matched, within 1% for phase and 0.2% for amplitude(Kinemetrics 2005).
During loading with the eccentric mass shaker at the two soil sites, two data acquisitionsystems were required: one for the principal set of instrumentation used in the tests and asecond related to the shakers themselves. To facilitate synchronization of these two datastreams, we installed sets of accelerometers side-by-side, with one set each on the shaker
FIELD-TESTING STRUCTUREON SHALLOWFOUNDN. TO EVALUATE SSI EFFECTS 2519

and main data-acquisition systems. As shown in Figure 8, these are channels 15 and 16 (mainsystem) and 2 and 3 (shaker system). Figure 8 and Appendix Figure A.1 show the locations ofthese two accelerometers in red.
Four Trans-Tek, Inc., model 0244-0000 DC LVDTs (linear variable differential trans-formers) were installed near the corners of the foundation mat during high amplitude loadingto measure the relative displacement between the foundation and surrounding soil. TheLVDTs have a measurement range of up to 5 cm and frequencies ≤ 300Hz.
Eight custom pressure cells were installed under the foundation at the WLA site. Eachcell is approximately 10 cm in diameter and 3 cm high. The pressure cells were arranged in
Figure 8. Sketch showing the structures and sensors for the 2009–2011 GVDA tests.
2520 STAR ET AL.

two concentric rectangles in order to measure pressure at the interior and exterior of thefoundation slab. The interior pressure cells have a maximum capacity of 137 kPa andthe exterior cells have a maximum capacity of 274 kPa.
The permanently installed WLA instrumentation maintained by NEES@UCSB was usedto record ground motions from earthquake loading. The sensors used in this study are shownas 00, 01, and 02 in Figure 3 and discussed at nees.org/warehouse/experiments/353. They areassumed to represent free-field conditions.
Further details about the EpiSensor accelerometers and LVDTs can be found at theNEES@UCLAwebsite (nees.ucla.edu/equipment.html). More details about the pressure sen-sors can be found in Star (2011).
VIBRATION SOURCES
The test structure was subjected to forced vibration testing using two types of shakers,one a linear shaker that provides small-amplitude force demands and a second eccentric massshaker that provides larger-amplitude force demands. Additional vibration at the sites wasprovided using a large Tri-Axial Vibroseis vehicle and naturally occurring earthquakes.Forced vibration testing was performed between September 2009, and August 2011.
The linear mass shaker was a small portable Acoustic Power System “ELECTROSEIS”model 400 long stroke shaker. The shaker mass is 7.3 kg and it can induce a maximum forceof 440 N. The shaker was controlled by an APS Dynamic Inc. dual mode power amplifiermodel 144 and a HP Agilent 33220A, 2 MHz function / arbitrary waveform generator. Wave-forms applied to the specimen included continuous linear frequency sweeps and step fre-quency sweeps. Linear sweep loading consisted of nearly constant amplitude force withvariable frequencies ranging from 4–54 Hz. Frequency step loading also had nearlyconstant-amplitude force and constant frequency loading within short intervals. Frequencieswere increased in 0.5 Hz steps over the same frequency range as the sweep loading. Thelinear mass shaker was used for x- and y-direction and torsional (zz) forced vibration testingat the roof and at the foundation level.
The eccentric mass shaker was a large AFB Engineered Test Systems Model 4600Amaintained and operated by NEES@UCLA. The eccentricity of the circular weightswas adjusted from 0 N-m to 110 N-m and had an operating loading frequency range of0–20 Hz. The shaker force was computed as:
EQ-TARGET;temp:intralink-;e3;62;223F ¼ mrrω2 cos αþ ðmr þ mbÞu (3)
where mr is the rotating mass, mb is the non-rotating mass portion of the shaker, r is theradius from the center of rotation to the centroid of the rotating mass, ω is the angular fre-quency, α is the angular position of the rotating mass, and u is the translational acceleration ofthe shaker base (after Reinert et al. 2012). The first portion of Equation 3 represents shakerforce due to rotation of the eccentric mass and the second component is shaker force due totranslation of the shaker mass center. Forcing frequencies were controlled by a customNational Instruments–based controller. For consistency with the forced vibration testing per-formed with the linear mass shaker, continuous sweeps and frequency steps were performed.Continuous sweep loading frequencies ranged from 0–19 Hz. Step loading was applied using
FIELD-TESTING STRUCTUREON SHALLOWFOUNDN. TO EVALUATE SSI EFFECTS 2521

0.2 Hz steps spanning the same 0–19 Hz frequency range. The eccentric mass shaker wasused for x- and y-direction forced vibration testing at the roof level.
Loading was also provided by a large triaxial Vibroseis vehicle that has a peak force of267 kN in the vertical direction and 134 kN in the horizontal directions. The peak force can bereached over a frequency range from 12–180 Hz in the vertical direction and 5–180 Hz in thehorizontal directions. The Vibroseis vehicle is maintained and operated by [email protected] was located approximately 20 m from the test structure and was used to shake the ground atthe WLA test site. Vibrations as large as about 0.15 g were measured in the soil near the teststructure.
Details about the linear and eccentric mass shakers can be found at nees.ucla.edu/equipment.html. More details about the Vibroseis vehicle are available at nees.utexas.edu/Equipment.shtml.
Earthquake shaking was also recorded on the test structure while it was at the WLA site.Table 1 summarizes the attributes of earthquakes recorded. Using information available onthe USGSwebsite (earthquake.usgs.gov), we identified the earthquake magnitudes and hypo-center locations near the California/ Mexico border, approximately 50 km south of the WLAtest location. These are likely aftershocks of the 4 April 2010 M 7.2 El Mayor Cucapahearthquake.
DATA ACQUISITION
The principal data collection function was performed by eight Kinemetrics QuanterraQ330 wireless data loggers. The Q330s have six analog input channels, global positioningsystem (GPS) receivers for precision timing, and 24-bit digital resolution. Absolute timingaccuracy is <10microsecond, and the sample clocks are slaved to GPS. The Q330 data werecollected on a PC hard drive using Kinemetrics’ Rockhound data acquisition software. Thesampling rate was 200 samples per second per channel. The Q330 digitizer uses a sigma-deltaA/D converter with multiple stages of low-pass filtering and decimating that introduces atime delay. There is no channel-to-channel skew because there is a separate A/D converterfor each channel. We sampled at 200 Hz with a final anti-alias filter at 80 Hz and a linear-phase finite impulse response (FIR) filter for all measurements, which produces a combinedconstant group delay of 0.09 sec in conjunction with the previously mentioned accelerometerconstant group delay. Therefore, as a result of using identical, high precision sensors and
Table 1. Earthquake loading recorded at WLA
Date Local Time Epicenter LocationMagnitude
(M)Epicentral
Distance (km)Depth(km)
8 May 2010 11:31:17 AM 32.728°N 115.835°W 3.4 49.9 10.98 May 2010 11:33:11 AM 32.675°N 115.806°W 5.0 53.5 6.08 May 2010 11:35:12 AM 32.669°N 115.827°W 3.0 55.1 1.38 May 2010 11:41 AM ? 2.4 ? ?8 May 2010 11:46:27 AM 32.675°N 115.811°W 4.9 53.8 14.08 May 2010 11:46 AM ? ? ? ?
2522 STAR ET AL.

identically matched data acquisition (DAQ) channels, the presence of the delay is not evidentin the data files.
Data acquisition channels for each experiment and trial are described in Tables A1–A3 inthe electronic supplement. Data from this acquisition system is referred to as “structuralresponse data.”
During forced vibration testing using the eccentric mass shaker at the two soil sites, pulsedata, which marks in time the beginning of each mass rotation cycle, and accelerometer datafrom two high-frequency uniaxial horizontal accelerometers, were recorded using a separateNational Instruments DAQ system which had a sampling rate of 5,000 Hz. The higher sam-pling rate is necessary in order to determine phasing of the shaker force with adequate pre-cision. The data acquisition channels used for testing with the eccentric mass shaker are givenin Tables A1–A3. In this paper, the data from this acquisition system is referred to as“eccentric mass shaker data.” The correlation method used to match the eccentric mass sha-ker data and the structural response data is described in the “Synchronized StructuralResponse and Eccentric Mass Shaker Data Files” section below.
In addition to these two data acquisition systems, the permanently installed WLA dataacquisition system maintained by NEES@UCSB was used to record ground motionsfrom earthquake loading. More information about the data acquisition system can befound at the NEES@UCSB website. The data from this system is referred to as“free-field earthquake data.”
TRIALS AND DOCUMENTATION
The test series at LAB, WLA, and GVDA are documented as Experiment Nos. 25through 27, respectively. Each experiment consisted of several trials. The loading and struc-tural conditions for each trial are summarized in Table 2. Each trial consisted of multiplerepetitions of loading in multiple directions (x, y, and torsion). Unprocessed data, converteddata, and corrected data files, were created for each trial repetition, as discussed below.
Tables A4 through A6 show field-testing logs for the forced vibration testing performedat LAB from 17–21 September 2009, at WLA 17 December 2009 to 25 May 2010, and atGVDA from 22 June to 2 August 2011.
The highlighted blue rows in Tables A4–A6 represent the unprocessed data files, whichcontain several different forced vibration testing runs. The underlying non-highlighted rowsrepresent the subevents with descriptions of the SSI system, the loading, load frequency andtime length provided. Each subevent was assigned an identification string based on the testlocation, trial number, subevent number, and repetition. The first number in the string refersto the test location. The three test locations have been given the following numbering:1 = LAB, 2 = WLA and 3 = GVDA. At the GVDA test location, the second number inthe string refers to the trial number, at WLA it refers to the trial number minus one (sotrial 3 is listed as 2), and at the LAB location all trials are given the number 0. Thethird number in the string is the subevent order number, which was based on the chronologyof testing within a particular trial. If the subevent number has a letter following the ordernumber, this letter represents the order of repetition of a common type of vibrationforce, duration and frequency range. For example, in Table A5a Exp.2.0.1b represents
FIELD-TESTING STRUCTUREON SHALLOWFOUNDN. TO EVALUATE SSI EFFECTS 2523

experiment at WLA, trial 1, first forced vibration test of the trial, and “b” represents redun-dancy with this test being the second of its type.
Two data acquisition systems were used for WLA Trial 3 (eccentric mass shaker).Table A5c provides logs for the structural response data and the corresponding eccentricmass shaker data. Similarly, for GVDA Trials 2 and 4 (eccentric mass shaker) Tables A6band A6d provide logs for the structural response data and the corresponding eccentric massshaker data.
DATA PROCESSING
Data collected during the experiments can be grouped into three main categories: struc-tural response (SR) data for all trials, eccentric mass shaker (EMS) data, and data from per-manently installed field instrumentation for earthquake loading trials. Each data set requireddifferent processing, which is described here.
UNPROCESSED DATA FILES
Three types of unprocessed data are available: structural response data, eccentric massshaker data, and free-field data files from earthquake loading events.
Table 2. Experiments and trials
Experiment Trial Loading type Structure configuration
25 1 EMS Braced
2 Hammer, EMS Unbraced
3 Hammer Braced
26 1 LMS Braced
2 LMS Braced, unbraced
3 EMS Braced, unbraced
4 VSV Unbraced
5 Earthquake Unbraced
27 1 LMS Braced
2 EMS Braced
3 LMS Unbraced
4 EMS Unbraced
Notes: LMS: Linear Mass Shaker; EMS: Eccentric Mass Shaker;VSV: Vibroseis shaker vehicle; Hammer: hammer impact; Unbraced:unbraced structure; Braced: braced structure.
2524 STAR ET AL.

Unprocessed Structural Response Data Files
The unprocessed structural response data is stamped in Unix time and all other channelsare recorded in machine counts. Unix time is a system describing time as a real number indecimal seconds from 1 January 1970 in the Greenwich Mean Time (GMT) zone. The testingwas performed in California, which is within the Pacific Standard Time (PST) zone, eighthours behind GMT. Testing between March and November used Pacific Daylight Time(PDT), which is seven hours behind GMT.
The unprocessed data is labeled according to the date and GMT (YYYYMMDDGMT)when the recording began. For example, a test recorded with a beginning PDT of 11:40 a.m.and 43 seconds on 20 May 2010 would have a text filename of 20100520184043.txt. Thestructural response unprocessed data files are listed in Tables A4–A6. The recorded datachannels are given in Tables A1–A3 for each trial.
Unprocessed Eccentric Mass Shaker Data Files
The unprocessed eccentric mass shaker data is recorded with respect to relative time inseconds from beginning of file recording. All other channels are recorded in digital counts. AtWLA the unprocessed eccentric mass shaker data is labeled based on designated trial num-bers as shown in Table A5c. At GVDA the unprocessed eccentric mass shaker data is labeledaccording to the date and PST/PDT (GV_YY_MM_DD_PST/PDT) when the recordingbegan, as shown in Tables A6b and A6d).
Unprocessed Free-Field Earthquake Data Files
During earthquake loading, free-field data files were collected from data archived fromthe permanently installed field accelerometers from the NEES@UCSBWildlife LiquefactionArray. Acceleration records from these sensors were not collected following forced vibrationtests. Figure 1 indicates the locations of field instrumentation from which data was collected.The unprocessed free-field earthquake data files were obtained for WLA Trial 5 (earthquakeloading). The data files contain a single directional accelerometer response with a GMT timesignature. The acceleration is in engineering units (cm∕sec2). The files are labeled based on asite code for WLA, description symbols, location identification number, date and recordingstart time. For example, file “5210.HNE_00.2010.127.01.30” can be interpreted for our pro-ject starting at the last letter, with “E” meaning east direction, 00 is the sensor identificationnumber (see Figure 1), 2010 is the year, 127 is the 127 day of the year at 1:30 GMT. The threedirectional of the accelerometers used are N (north), E (east), and Z (vertical).
CONVERTED DATA FILES
Converted data was produced by dividing the unprocessed data into individual subeventsand converting data into engineering units. Raw digital counts were converted to volts bydividing integer counts by 41,9430 (224∕40) counts per volt. Acceleration signals in voltswere converted to “g” using a sensitivity of 5.00 volts per g. The LVDT and pressure cellrecords were converted to engineering units (in. and kPa respectively) using individualinstrument calibrations in conjunction with the battery source voltage. The conversionunits used are provided in Tables A2–A3. Converted structural response data files wereuploaded to NEEShub (2012a). No converted eccentric mass shaker data files were created.
FIELD-TESTING STRUCTUREON SHALLOWFOUNDN. TO EVALUATE SSI EFFECTS 2525

CORRECTED DATA FILES
The GVDA data was further processed into corrected data. The procedure used to obtainthe corrected structural response data was similar for all trials. The time signature of all sube-vent data files were converted from Unix time to relative time, in seconds, from the beginningof the subevent.
Corrected Structural Response Data Files
The corrected structural response data (accelerations and displacements) were created byapplying mean removal to the converted data.
Corrected Eccentric Mass Shaker Data Files
The eccentric mass shaker data files were separated into subevents and acceleration sig-nals were converted to engineering units and baseline corrected. The conversion of the accel-erations to gravity (g) units is the same as for the structural response data. The pulse datamarks in time the beginning of the sine wave, and no conversion was required. The converteddata fields are similar to the unprocessed data, shown in Tables A1–A3.
Synchronized Structural Response and Eccentric Mass Shaker Data Files
During forced vibration testing using the eccentric mass shaker, EMS data includingshaker pulse and structural accelerations were recorded on a distinct data acquisition systemwith no GPS time stamp and a higher frequency-sampling rate than the primary system(Q330 wireless data loggers). The higher sampling rate is necessary to evaluate phasingof the shaker force with adequate precision. It is necessary to synchronize and merge theEMS data with the SR data. In order to synchronize the data, the accelerometer recordsin the direction of shaking from the eccentric mass shaker data were decimated and thencross-correlated to channels 16 or 15 (depending on the direction of shaking) of the structuralresponse data. We identified the time delay Δt between acceleration time series from theeccentric mass shaker and structural response data files by maximizing cross-correlation.This process is illustrated in Figure 9.
The synchronized eccentric mass shaker data was then used to compute shaker forcehistories using Equation 3. The EMS Pulse channel records a number of pulses per revolutionof the eccentric mass. This pulse is recorded when the weight is aligned in the direction ofloading, indicating that the angular position of the rotating mass, α is 0. Angle α at any othertime can be evaluated through interpolation. The angular frequency of the rotating mass, ω, isevaluated at a given time directly from the number of pulses per unit time. With α and ωknown, the shaker force due to rotation of the eccentric mass (first part of Equation 3) can beevaluated. This process is illustrated in Figure 10. The shaker force due to translation of theshaker mass center can be evaluated through the structural response data roof accelerometer.This component of the shaker force was excluded from the shaker force data files saved onNEEShub (2012a).
The corrected synchronized data files are organized in the same way as the correctedstructural response data files, with additional data columns for the shaker angular frequency,shaker force, angular position of the shaker’s rotating mass, and the eccentric mass shakerdata accelerometer that was used for cross-correlation.
2526 STAR ET AL.

DATA USE
EXAMPLE APPLICATIONS
Data sets were developed to enable evaluation of foundation-soil interaction under fieldconditions for a wide range of frequencies and loading levels and also for variable conditionsin the test specimens including: (1) relatively stiff and flexible super-structure (achieved withremovable bracing); (2) variable base flexibility (data from different test locations); and(3) variable levels of relative moment-to-shear demands (shaking applied in long versusshort direction of the oblong structure). Each of these conditions was varied because oftheir anticipated effect on the significance of SSI in the system response. For example,the structure-to-soil stiffness ratio (h∕ðVsTÞ) (where h is the height for a single degree-of-freedom superstructure, VS is the equivalent half-space shear wave velocity, and T isthe fixed-base structure period) is an indicator of when inertial SSI effects are likely tobe significant (typically for h∕ðVsTÞ > 0.1; NIST 2012). This ratio varies from 0.17 to0.45 for the various tests at the GDVA and WLA sites (Givens 2013). The ratios of structure
Figure 9. (a) Acceleration time series on test structure recorded by the structural response (SR)data acquisition system (Q330s); (b) adjacent and parallel acceleration time series recorded by theeccentric mass shaker (EMS) data acquisition system; (c) cross-correlation to identify time lag Δtbetween the two acceleration recordings; and (d) non-lag-corrected responses within a 3-secondwindow with Δt labeled to indicate the lag required to match the two signals.
FIELD-TESTING STRUCTUREON SHALLOWFOUNDN. TO EVALUATE SSI EFFECTS 2527

height to foundation half-width, which control the relative moment-to-shear demands, mea-sured in the two directions of shaking (h∕B) are 1.4 and 2.8.
One application of the data is to apply system identification procedures with appropriaterecorded input-output signals to establish fixed-base and flexible-base modal periods anddamping ratios (e.g., Stewart and Fenves 1998). Data of this sort is useful for validatingmodels for period lengthening (i.e., ratio of flexible- to fixed-base first-mode period) andfoundation damping used in seismic design codes and other applications (e.g., NIST2012). These system identification procedures can operate in either the time or frequencydomains. Time domain procedures track the time variation of modal parameters, whichis useful for identifying nonlinear responses. Frequency domain procedures provide timeinvariant properties for the duration of the signals that are used.
Another major application will involve inference from the data of foundation stiffnessand damping in the form of impedance functions, which are widely used in sub-structuremethods for seismic analysis of soil-foundation-structure systems (e.g., NIST 2012). Fora two-dimensional problem, involving applied shear and moment loading to a foundationin a single horizontal direction (representing the condition in our tests for a given directionof shaking), the impedance function is a matrix that relates the foundation load vector ½V M�Tto the response vector ½uf θf �T as follows (Luco and Westmann 1971, Veletsos and Wei1971):
Figure 10. (a) Eccentric mass shaker pulse data; (b) interpolated angular position of the mass (α);(c) frequency of shaker mass rotation (as specified by control system and as calculated from pulsedata); and (d) calculated eccentric mass shaker force.
2528 STAR ET AL.

EQ-TARGET;temp:intralink-;e4;62;640
�kx kxykyx kyy
��ufθf
�¼
�VM
�(4)
where V andM are base shear and moment, respectively; uf and θf are foundation horizontaltranslation and rotation; and the k terms are elements of the impedance matrix (the overbarindicates these elements are complex valued). For a surface foundation, the off-diagonalterms of the impedance matrix in Equation 4, kxy and kyx, should be zero, which allowsthe real part of kx to be understood (on a conceptual level) as the horizontal foundation stiff-ness (ratio of V to uf ) and the real part of kyy to be understood as the rotational foundationstiffness (ratio of M to θf ). Damping of the foundation-soil system for a given vibrationmode is related to the phase delay between the demand (e.g., base shear) and response(e.g., foundation displacement). This phase delay can be evaluated from the complex-valuedimpedance as:
EQ-TARGET;temp:intralink-;sec7.1;62;480ϕj ¼ arctan
�imagðkjÞrealðkjÞ
�(5)
where j is a generic indicator of vibration mode.
Foundation impedance functions are known to be frequency dependant (Luco andWestmann 1971, Veletsos and Wei 1971). Frequency is typically expressed in dimensionlessform for SSI applications as a0 ¼ ωB∕Vs, where B is the foundation half-width. Values of a0during testing at theWLA and GVDA sites ranged from 0.05 to 5.5. Impedance is also depen-dent on loading amplitude, because increasing shear strains in soil materials produce shearmodulus reductions and soil damping increases. While the available instrumentation does notallow for direct measurements of shear strain, an approximate index of strain can be takenas the ratio of peak horizontal velocity of the foundation to soil VS (used previously forfree-field strains by Trifunac and Lee 1996, Paolucci and Smerzini 2008, and Brandenberget al. 2009):
EQ-TARGET;temp:intralink-;e6;62;292γi ¼ _ufVs
(6)
Superscript i indicates that γi is an index of shear strain (not a true strain). Values of this strainindex ranged from well below the threshold for nonlinear soil behavior (< ∼ 10�4%) to amaximum of approximately 2� 10�2% (Givens 2013 and Star 2011), for which soil non-linearity was pronounced as evidenced by reductions in foundation stiffness.
The inference of impedance functions from forced vibration data is non-trivial, but fun-damentally can be achieved by inverting Equation 4 given known values of the demand andresponse vectors. Coupling terms can be evaluated from the inversion when forced vibrationloading is applied at more than one degree of freedom (e.g., roof and foundation; de Barrosand Luco 1995). Inversions of foundation impedance are typically carried out in thefrequency-domain and have been applied in past work for low-strain (assumed elastic) con-ditions (e.g., Lin and Jennings 1984, Wong et al. 1988, Crouse et al. 1990, Tileylioglu et al.2011). Details regarding the necessary calculations are beyond the scope of this article, butthey are given in de Barros and Luco (1995) and Tileylioglu et al. (2011).
FIELD-TESTING STRUCTUREON SHALLOWFOUNDN. TO EVALUATE SSI EFFECTS 2529

Once impedance functions are developed from forced vibration test data, it is of interestto compare them to predictions of theoretical models, which typically apply for idealizedconditions such as rigid foundations and a uniform soil half-space. The results can be usefulfor the development of procedures for selecting representative half-space velocities givendepth-variable velocities in the field. Deviations between theoretical and experimental resultsare also of interest, as they provide insights into the mechanics of the interaction problem not
Figure 11. SSI test structure with shaker force, total inertia of top slab, inertia of base slab,rotation of base slab, and translational displacement of base slab.
2530 STAR ET AL.
revealed by simplified models. As an example, Tileylioglu et al. (2011) provide examplesof how observed translational and rotational damping of a shallow foundation differsfrom theoretical models, and postulates that the differences may be caused by soilheterogeneity.
FEATURES OF THE DATA SET
Figure 11 illustrates some force-response features of the data set for an example of lowamplitude shaking, where elastic soil behavior is expected. The figure shows time series ofhorizontal force demands (top three frames) and horizontal foundation rotations and displa-cements (bottom two frames) for a forced vibration-loading event. Three time intervals areshown—at a low frequency (average freq. ¼ 3.2Hz), near the resonant frequency of the SSIsystem (average freq. ¼ 5.3Hz), and at a high frequency (average freq. ¼ 10.7Hz). Thehorizontal inertial forces that are shown are (from top to bottom): shaker force, total inertiaof top slab (taken as the product of the mass of top slab, including shaker frame, and hor-izontal acceleration msust), and total inertia of base slab (product of base slab mass and accel-eration, mf uf ). The foundation undergoes cyclic rotation and displacement as a result of themoment and base shear applied by force demands; time series of these responses are shown inthe bottom frames (uf ; θf ).
Information pertaining to the foundation damping can be gleaned from Figure 11, whichshows that at time t1, with low frequency loading (below resonance), the shaker dominatesthe force demand, and its force history is nearly in-phase with the displacement and rotation.This is expected for a system with low levels of damping. At times t2, and t3, with higherfrequency loading (at and above resonance), the top slab inertia dominates the force demandand is out of phase with the displacement and rotation, indicating much larger foundationdamping than at low frequencies.
SUMMARY
Field-testing to measure soil-structure interaction (SSI) effects is useful to evaluate theapplicability of analytical models for realistic field conditions and to guide the selection ofmodel parameters. A test program was designed to provide high quality data for validation ofSSI models under realistic boundary conditions, a wide range of load amplitudes, and a widefrequency range. Forced vibration tests were performed on a portable steel column structure.The test structure was reconfigurable to provide alternate structural stiffnesses and tests wereperformed with shaking applied in both the short and long directions of the oblong structure.The tests were performed at three test sites with different soil conditions including: the UCLAStructures Laboratory (nearly fixed-base conditions), the Wildlife Liquefaction Array (verysoft clays and silts), and the Garner Valley Downhole Array (medium dense sands). TheGarner Valley Downhole Array has an additional permanently installed structure thatwas also instrumented. Forced vibration–loading was provided by two different shakersinstalled on the structure and by a shaker truck. In addition, earthquake-loading eventswere recorded. Acceleration, displacement, and foundation pressure data was recordedand archived at the Network for Earthquake Engineering Simulations Research (NEESR)website, NEEShub, as project NEES-2008-0637.
FIELD-TESTING STRUCTUREON SHALLOWFOUNDN. TO EVALUATE SSI EFFECTS 2531
ACKNOWLEDGMENTS
Support for this work was provided by the National Science Foundation (NSF). Thiswork was completed as part of a multi-institutional NSF grand challenge (NSF 06-504Program) project, “Mitigation of Collapse Risk in Vulnerable Concrete Buildings,” underGrant Number CMMI-0618804, and was documented in the Network for Earthquake Engi-neering Simulations Research (NEESR) website, NEEShub, as project NEES-2008-0637.Support by NEES@UCSB and NEES@UCLA was provided by the George E. Brown, Jr.,Network for Earthquake Engineering Simulation (NEES) Program of the National ScienceFoundation (NSF) under Award Number CMMI-0927178.
This research made use of the field equipment, instrumentation, and technical expertise ofNEES@UCLA and NEES@UCSB staff, including Ben Ferraro, Steve Keowen, Steve Kang,Dr. Alberto Salamanca, and Dr. Jamison Steidl. The NEES@UCSB also provided additionaldata from the permanently installed instrumentation. The NEES@UTexas team provided theuse of their field equipment and performed additional geophysical testing at the field site. Wethank the two anonymous reviewers for their valuable input on our paper.
APPENDIXAdditional information about sensors and experimental logs are available in the electro-
nic supplement to the online version of this paper.
REFERENCES
Brandenberg, S. J., Coe, J., Nigbor, R. L., and Tanksley, K., 2009. Different approaches formeasuring ground strains during piledriving at a buried archeological site, J. Geotech. &Geoenvir. Eng. 135, 1101–1112.
Crouse, C. B., Hushmand, B., Luco, J. E., and Wong, H. L., 1990. Foundation impedancefunctions: Theory versus experiment, J. Geotech. Eng. 116, 432–449.
de Barros, F. C. P., and Luco, J. E., 1995. Identification of foundation impedance functions andsoil properties from vibration tests of the Hualien containment model, Soil Dyn.& Eqk. Eng.14, 229–248.
Fadum, R. E., 1948. Influence values for estimating stresses in elastic foundations, Proc. 2nd Int.Conf. Soil Mechs. and Foundn. Eng., Rotterdam, vol. 3, 77–84.
Givens, M. J., 2013. Dynamic Soil-Structure Interaction of Instrumented Buildings and TestStructures, Ph.D. Thesis, University of California, Los Angeles.
Kinemetrics, Inc., 2005. EpiSensor, Force Balance Accelerometer, Model FBA ES-T, Pasadena,CA.
Lin, A. N., and Jennings, P. C., 1984. Effect of embedment on foundation-soil impedances,J. Eng. Mech. 110, 1060–1075.
Luco, J. E., and Wong, H. L., 1990. Forced vibration of the Lotung containment model: Theoryand observations, J. Eng. Mech. 116, 845–861.
Luco, J. E., and Westmann, R. A., 1971. Dynamic response of circular footings, J. of the Eng.Mech. Div. 97, 1381–1395.
Network for Earthquake Engineering Simulations (NEEShub), 2012a. Mitigation of CollapseRisk in Vulnerable Concrete Buildings, Project NEES-2008-0637, available at https://nees.org/warehouse/project/637.
2532 STAR ET AL.

Network for Earthquake Engineering Simulations (NEEShub), 2012b. Permanently InstrumentedField Sites, Project NEES-2007-0353, available at https://nees.org/warehouse/experiments/353.
Network for Earthquake Engineering Simulations at University of California, Los Angeles(NEES@UCLA), 2012. Equipment, available at http://nees.ucla.edu/equipment.html.
Network for Earthquake Engineering Simulations at University of California, Santa Barbara(NEES@UCSB), 2012. Wildlife Liquefaction Array and Garner Valley Downhole Array,available at http://nees.ucsb.edu/facilities/wla and http://nees.ucsb.edu/facilities/gvda.
Network for Earthquake Engineering Simulations at University of Texas, Austin (NEES@UTexas), 2012. Available at http://nees.utexas.edu/Equipment.shtml.
National Institute of Standards and Technology (NIST), 2012. Soil-structure Interaction forBuilding Structures, Report No. NIST GCR 12-917-21, U.S. Department of Commerce,Washington, D.C.
Paolucci, R., and Smerzini, C., 2008. Earthquake-induced transient ground strains from denseseismic networks, Earthquake Spectra 24, 453–470.
Reinert, E. T., Brandenberg, S. J., Stewart, J. P., and Moss, R. E. S., 2012. Dynamic field test of amodel levee founded on peaty organic soil using an eccentric mass shaker, 15th World Conf. onE.Q. Eng., Lisbon, Portugal.
Star, L. M., 2011. Seismic Vulnerability of Structures: Demand Characteristics and FieldTesting to Evaluated Soil-Structure Interaction Effects, Ph.D. Thesis, University of California,Los Angeles.
Steidl, J. H., Youd, T. L., and Nigbor, R. L., 2004. Research opportunities at the NEES perma-nently instrumented field sites, 13th World Conf. on E.Q. Eng. Vancouver B.C., Canada,1–6 August 2004, Vancouver, BC, Canada.
Steller, R., 1996. New Borehole Geophysical Results at GVDA, available at http://nees.ucsb.edu/facilities/gvda.
Stewart, J. P., and Fenves, G. L., 1998. System identification for evaluating soil-structure inter-action effects in buildings from strong motion recordings, Earthquake Engng. & Struct. Dyn.27, 869–885.
Stewart, J. P., Fenves, G. L., and Seed, R. B., 1999. Seismic soil-structure interaction in buildingsII: Empirical findings, J. Geotech. & Geoenv. Eng. 125, 38–48.
Stokoe, K. H., Kurtulus, A., and Menq, F., 2004.Data Report Measurements at the NEES GarnerValley Test Site, California, University of Texas, Austin.
Stokoe, K. H., Lin, Y., Menq, F., and Cox, B. R., 2010. Wildlife Refuge Liquefaction Field SiteShear Wave Velocity Measurements using Spectral-Analysis of Surface Waves (SASW) Test,NEES@UTexas Equipment Site, Austin, TX.
Tang, H. T., Tang, Y. K., and Stepp, J. C., 1990. Lotung large-scale seismic experiment and soil-structure interaction method validation, Nucl. Eng. & Des. 123, 397–412.
Tileylioglu, S., Stewart, J. P., and Nigbor, R. L., 2011. Dynamic stiffness and damping of shallowfoundation from forced vibration of a field test structure, J. Geotech. & Geoenv. Eng. 137,344–353.
Trifunac, M. D., and Lee, V. W., 1996. Peak surface strains during strong earthquake motion, SoilDyn. & Eqk. Eng, 15, 311–319.
Veletsos, A. S., and Wei, Y. T., 1971. Lateral and rocking vibrations of footings, J. of Soil Mech.& Foundns. Div. 97, 1227–1248.
FIELD-TESTING STRUCTUREON SHALLOWFOUNDN. TO EVALUATE SSI EFFECTS 2533

Wong, H. L., and Luco, J. E., 1990. Seismic response of the Lotung containment model: Theoryand observations, J. of Soil Mech. & Foundns. Div. 116, 1332–1350.
Wong, H. L., Trifunac, M. D., and Luco, J. E., 1988. A comparison of soil-structure interactioncalculations with results of full-scale forced vibration tests, Soil Dyn.& Eqk. Eng. 7, 22–31.
Yamada, S., Hyodo, M., Orense, R. P., Dinesh, S. V., and Hyodo, T., 2008. Strain-dependentdynamic properties of remolded sand-clay mixtures, J. of Geotech. & Geoenv. Eng. 134,972–981.
Youd, T. L., and Holzer, T. L., 1994. Piezometer performance at wildlife liquefaction site,California, J. of Geotech. Eng. 120, 975–995.
Youd, T. L., Steidl, J. H., and Nigbor, R. L., 2004a. Lessons learned and need for instrumentedliquefaction sites, Soil Dyn.& Eqk. Eng. 24, 639–646.
Youd, T. L., Bartholomew, H. A. J., and Proctor, J. S., 2004b. Geotechnical Logs and Data FromPermanently Instrumented Sites: Garner Valley Downhole Array (GVDA) and Wildlife Lique-faction Array (WLA), University of California, Santa Barbara.
(Received 15 May 2014; accepted 18 April 2015)
2534 STAR ET AL.