fifth report - .net framework
TRANSCRIPT

11
November 2020
Fifth ReportGB Cattle Health & Welfare Group
www.chawg.org.uk

2
The work of the GB Cattle Health & Welfare Group (CHAWG) would not be possible without the valued financial support of AHDB, which has kindly funded the secretariat and chair function for this cross-industry group.
The members of CHAWG are:
Agriculture and Horticulture Development Board (AHDB)
Animal and Plant Health Agency (APHA)
Animal Health and Welfare Board for England (AHWBE)
Animal Health and Welfare Framework Group for Wales
Animal Health Distributors Association (AHDA)
British Cattle Veterinary Association (BCVA)
Dairy UK
Department for Environment, Food and Rural Affairs (Defra)
Farmers’ Union of Wales (FUW)
Hybu Cig Cymru – Meat Promotion Wales (HCC)
Holstein UK/Centre for Dairy Information (HUK/CDI)
Livestock Auctioneers’ Association (LAA)
National Beef Association (NBA)
National Milk Records (NMR)
National Office of Animal Health (NOAH)
National Youngstock Association
NFU of England and Wales (NFU)
NFU Scotland (NFUS)
Quality Meat Scotland (QMS)
Red Tractor Assurance (RTA)
Royal Association of British Dairy Farmers (RABDF)
Royal Society for the Prevention of Cruelty to Animals (RSPCA)
Scottish Government
The Dairy Group
University of Nottingham School of Veterinary Science
Welsh Government

32
CVOs’ foreword
The Chief Veterinary Officers (CVO) of England, Wales and Scotland welcome the fifth and final biennial report from the Cattle Health and Welfare Group of Great Britain. We would like to mark the occasion with our thanks and gratitude for the superb work and exceptional commitment of all those involved in CHAWG. Over the years, CHAWG has added great value in driving forward cattle health and welfare improvements, and we look forward to the combined forces of CHAWG and SHAWG (Sheep Health and Welfare Group) leading to further far-reaching improvements across the ruminant sector via the new Ruminant Health and Welfare Group.
The Coronavirus pandemic (COVID-19) has emphasised just how important food supply – and the role of those working farm to fork – is. Animal health and welfare remain an important government priority and we are grateful to the cattle industry for playing its part in meeting social-distancing requirements while feeding the nation.
The global Coronavirus pandemic (COVID-19) has raised awareness and focused attention on the concept of ‘One Health’ (the interconnection between human, animal and plant health). This concept has long been reflected in CHAWG activities and those of its Cattle Antimicrobial Use Working Group. One Health has wider implications in improving productivity and reducing waste, including contributing to the reduction of greenhouse gas (GHG) emissions by being proactive in addressing animal health. Studies have shown the huge impact that endemic diseases such as Bovine Viral Diarrhoea (BVD) and Johne’s disease have on increasing the GHG emissions per unit of beef carcase and per unit of milk produced. The UK has a target of net zero carbon emissions by 2050 and the cattle industry has a part to play in achieving this.
As we move towards the end of the UK transition period post-Brexit, it is more important than ever that our cattle industry maintains high standards of animal health and welfare and can provide assurances and evidence of this to the global community. We recognise the work of CHAWG in supporting farm assurance schemes. Such an example of this is the Farm Assured Welsh Livestock (FAWL) Beef and Lamb Scheme, whose standard includes an annual livestock health and welfare review to be undertaken in conjunction with the farm vet. We are pleased to note that, from June 2020, all members of the FAWL scheme will have antibiotic usage for their sheep and beef farms measured with their vet during the annual vet review.
We commend CHAWG on its ongoing work in support of national-level activities, such as the future post-CAP government financial support to animal health and welfare improvement schemes being developed across administrations in the pig, cattle and sheep sectors. The importance of understanding drivers for behavioural change, ensuring both large and small operators are engaged, and the collation of key data are vital to this. The work of CHAWG in prioritising cattle endemic diseases and steps towards developing a coordinated control strategy for these diseases will have tremendous positive impacts for the cattle industry. Taking the next step from individual control and eradication schemes, it is important to gather GB-level data on endemic diseases, such as BVD, that the industry can access and act upon.
Disease monitoring remains a priority across GB; the UK Surveillance Forum continues to bring together the UK CVOs to steer the UK narrative, demonstrating and verifying our high standards of animal health. The CHAWG report collates key information on GB livestock monitoring, showing the importance of surveillance to the GB cattle sector.
However, surveillance alone does not deliver high health status, only demonstrates it. We need to work in partnership across government, industry, science and academia, using a sound evidence base to agree disease control and eradication strategies. The combined power of the Livestock Information System (soon to replace BCMS), ScotEID and EIDCymru will assist greatly in demonstrating traceability, but it will be the underpinning actions of the cattle sector that will provide the evidence of our high standards in cattle health and welfare.
We want all sectors to be producing high-quality products, with reduced inputs, including a reduction in the use of antimicrobials, which will help slow the spread of antimicrobial resistance (AMR). Over the past six years, the UK livestock industry has secured remarkable progress in voluntarily improving antibiotic stewardship, halving use to achieve some of the lowest sales in Europe of both overall and highest priority

4
critically important antibiotics (HP-CIAs). However, there is more to do, particularly in the ruminant sector. New challenges are emerging all the time, including resistance to other medicines such as anthelmintics. CHAWG has supported a number of ongoing initiatives to drive industry effort in the uptake of preventative measures such as vaccination and training, as well as electronic medicine recording for cattle and benchmarking medicine use on cattle farms. We look forward to future gains in cattle health and welfare and productivity as the industry continues to focus on prevention and strives for best-practice biosecurity and animal husbandry.
We are pleased to see acknowledgement within the report of the announcement, in 2019, of the Scottish Animal Welfare Commission - a new animal welfare advisory body and Scotland’s first independent Animal Welfare Commission. We commend the work of CHAWG in focusing on areas within the cattle industry that impact heavily on animal welfare, in particular noting the GB Dairy Calf Strategy and its priorities: responsible breeding, improving the fate of dairy bull calves, and the industry commitment to rear all calves with care, eliminating the euthanasia of calves by 2023. We further commend positive continuous welfare improvements, such as the increasing take-up of mobility mentors for the AHDB Healthy Feet Programme (HFP), aimed at improving dairy cattle lameness.
CHAWG is well-placed to work across industry to encourage farmers to recognise the value and economic benefits of preventative veterinary input on herd health planning, training and diagnostics. Initiatives such as the Animal Health and Welfare Pathway (England) and the Wales Animal Health and Welfare Framework Group (Wales AHWFG) look to engagement between farmers and their vets to create solutions for that farm and the animals that are kept there.
In summary, we congratulate CHAWG and all of its participants on providing the bridge between individual farm management and the GB cattle health and welfare narrative that is so crucial to the future of the industry. We are optimistic we will see further advances in health and welfare from the new Ruminant Health and Welfare Group and we send our continued thanks to all of those who are transitioning across to the new group.
Christine MiddlemissChief Veterinary Officer
for the UK
Christianne Glossop Chief Veterinary Officer
for Wales
Sheila Voas Chief Veterinary Officer
for Scotland

54
Contents
Introduction . . . . . . . . . . . . . . . . . . . . . . . . . . . . . . . . . . . . . . . . . . . . . . . . . . . . . . . . . . . . . . . . . . . . . . . . . . 6
About CHAWG . . . . . . . . . . . . . . . . . . . . . . . . . . . . . . . . . . . . . . . . . . . . . . . . . . . . . . . . . . . . . . . . . . . . . . . . 8
Top cattle health and welfare issues . . . . . . . . . . . . . . . . . . . . . . . . . . . . . . . . . . . . . . . . . . . . . . . . . . . . . . . 9
Cattle demographic trends . . . . . . . . . . . . . . . . . . . . . . . . . . . . . . . . . . . . . . . . . . . . . . . . . . . . . . . . . . . . . 12
Livestock data and animal identification . . . . . . . . . . . . . . . . . . . . . . . . . . . . . . . . . . . . . . . . . . . . . . . . . . 18
Farm assurance . . . . . . . . . . . . . . . . . . . . . . . . . . . . . . . . . . . . . . . . . . . . . . . . . . . . . . . . . . . . . . . . . . . . . . 20
Cattle welfare . . . . . . . . . . . . . . . . . . . . . . . . . . . . . . . . . . . . . . . . . . . . . . . . . . . . . . . . . . . . . . . . . . . . . . . . 23
Cattle production health . . . . . . . . . . . . . . . . . . . . . . . . . . . . . . . . . . . . . . . . . . . . . . . . . . . . . . . . . . . . . . . 27
Calves . . . . . . . . . . . . . . . . . . . . . . . . . . . . . . . . . . . . . . . . . . . . . . . . . . . . . . . . . . . . . . . . . . . . . . . . . . . . . 49
Infectious disease . . . . . . . . . . . . . . . . . . . . . . . . . . . . . . . . . . . . . . . . . . . . . . . . . . . . . . . . . . . . . . . . . . . . 58
Health surveillance . . . . . . . . . . . . . . . . . . . . . . . . . . . . . . . . . . . . . . . . . . . . . . . . . . . . . . . . . . . . . . . . . . . . 64
Health and welfare at slaughter . . . . . . . . . . . . . . . . . . . . . . . . . . . . . . . . . . . . . . . . . . . . . . . . . . . . . . . . . . 70
Responsible use of medicines . . . . . . . . . . . . . . . . . . . . . . . . . . . . . . . . . . . . . . . . . . . . . . . . . . . . . . . . . . . 72
The changing role of the farm vet . . . . . . . . . . . . . . . . . . . . . . . . . . . . . . . . . . . . . . . . . . . . . . . . . . . . . . . 82
Public engagement on health and welfare . . . . . . . . . . . . . . . . . . . . . . . . . . . . . . . . . . . . . . . . . . . . . . . . . 84
Emerging opportunities . . . . . . . . . . . . . . . . . . . . . . . . . . . . . . . . . . . . . . . . . . . . . . . . . . . . . . . . . . . . . . . . 86
A vision for Ruminant Health and Welfare . . . . . . . . . . . . . . . . . . . . . . . . . . . . . . . . . . . . . . . . . . . . . . . . . 89
Glossary of abbreviations . . . . . . . . . . . . . . . . . . . . . . . . . . . . . . . . . . . . . . . . . . . . . . . . . . . . . . . . . . . . . . 90
Appendix: Dairy bull calf strategy . . . . . . . . . . . . . . . . . . . . . . . . . . . . . . . . . . . . . . . . . . . . . . . . . . . . . . . . 94
Note: Endnotes are hyperlinked where available.
Disclaimer: The data contained in this report has been collated from a range of sources, many of which are linked to CHAWG members. The figures within each data set may contain bias, depending on the size of the data set, how it was sampled, or whether there were weather anomalies or disease outbreaks that year. The very fact that a herd record performance could mean they are more advanced managerially thus have better results than non-recording counterparts. For this reason, caution is urged when extracting, quoting or basing arguments on the data as it is included mainly for illustrative purposes and to provide indications of trends and approximations of performance only.

6
Introduction
Welcome to the fifth and final report from CHAWG on the state of cattle health and welfare in Great Britain.
The Cattle Health and Welfare Group (CHAWG) originally started as an England-only activity in 2010 but very quickly developed into a GB group. It has met quarterly ever since, with various subgroups operating in addition to the core group.
Engagement throughout its time has been excellent, as it grew to encompass all the key organisations involved in cattle health and welfare throughout Great Britain. The support we have had from the three governments and their respective chief veterinary officers has been hugely appreciated.
CHAWG set out to be a facilitation body to make sure that everything concerning cattle health and welfare was as joined-up as possible, and looking back on the biennial reports that we have produced since 2012, we have, in the main, achieved our aim. Perhaps the best evidence of this was the Food and Veterinary Office (FVO) of the European Commission visit to the UK in 2017, along with other major milk-producing member states, to look at dairy cow welfare. Their final report noted how well the UK coordinated activity and – unlike with other member states – they had no recommendations to improve our situation.
Involving the RSPCA throughout the life of CHAWG has been really helpful in ensuring we can hold our head up within Europe. Indeed, a quick glance over the past 10 years shows just how much progress the cattle sector has made in monitoring and reporting on relevant issues and then doing something about them, so that as we leave the EU, we can genuinely say Great Britain is in a good place as far as cattle health and welfare is concerned. There is always more to do, but it’s a continuously improving situation.
Through all of this, the relationship between farmer and vet remains key, and the support CHAWG has had from the NFU and BCVA in particular has been instrumental in promoting this. Effective farm health planning remains the essential building block for success.
Over the years, BVD and Johne’s disease have been frequent items on our agendas, but lameness, mastitis, fertility and respiratory disease remain major issues on many farms and, thus, CHAWG has remained active in these areas.
Antimicrobial resistance (AMR) continues to be a major theme of our work and the importance of effective cross-sectoral liaison via the Responsible Use of Medicines in Agriculture (RUMA) Alliance is highly effective. RUMA is a good example of the industry looking after itself with little government regulation, and no substantive funding from either government or commercial animal health companies, so that it can truly be said to be independent. The CHAWG Antimicrobial Use (AMU) subgroup has specifically looked at data collection and standardising metrics so that we all use the same nomenclature and terminology. The advent of a cattle eMH (electronic medicine hub) to collate data on antibiotic use, then feed this data into the Livestock Information System, when launched, must be the way forward.
Dairy cow welfare continues to be a key issue and one where reputational loss, with all its attendant problems, could easily occur. The handling of economically unviable bull calves is a further difficulty the cattle sector needed to find a sustainable solution to, and I am very pleased to see such a strategy included in this report after a number of years of CHAWG shining a light on the problem.
So, in conclusion, in the 10 years that I have chaired CHAWG, I would like to think we have achieved what we set out to do. Much of CHAWG’s success should be attributed to the group members’ active participation, with everyone willing to contribute when asked, both in meetings and when compiling various publications. It therefore seems invidious to mention individuals, but I would particularly like to thank Gareth Hateley and, before him, Gavin Watkins from APHA, who have not only provided quarterly surveillance updates but also really useful links into both the English and Welsh governments.
Tim Brigstocke Chairman, CHAWG

76
However, the success of CHAWG is ultimately down to its members, and I’m incredibly grateful to all those who have been involved. None of this would have worked without the background administration that was originally provided by Brian Lindsay and, more recently, by Charlotte Bullock. CHAWG meetings would not have been so fruitful or fun without their help and assistance.
Finally, CHAWG could not have existed without the financial support of AHDB. For this, we remain extremely grateful.
All good things have to come to an end and it’s time to hand over the reins to the Ruminant Health and Welfare Group. We wish it the very best in taking our momentum forward.
Tim Brigstocke Chairman, CHAWG

8
About CHAWG
CHAWG’s remit has been to: • Provide an industry forum that will encourage and coordinate a programme of economically focused
improvements to cattle health and welfare across Britain
• Act as a forum to prioritise the research, development and knowledge interaction needs of the GB cattle industry in relation to cattle health and welfare, to ensure knowledge gap identification, coordination and minimal duplication
• Assist in the dissemination of knowledge across the industry through the participating organisations within the group and others, where appropriate
• Liaise closely with all stakeholders, such as levy boards and educational institutions, to promote consistent regional dissemination of national work and encourage the uptake of technological advances and best practice
• Provide guidance and be a resource for the chief veterinary officers across GB and other relevant government bodies on cattle health and welfare matters, including the early stages of policy development and other areas, where appropriate
CHAWG published its first report in 2012 and, with its limited resources, has focused on initiating work not currently being tackled by other bodies or initiatives but with the potential to impact heavily on the cattle industry, namely: Farm Health Planning (FHP); Surveillance and Monitoring; Bovine Viral Diarrhoea (BVD); and Dairy Cow Welfare. CHAWG is responsible for the GB Dairy Cattle Welfare Strategy.1
Over the past three years, CHAWG has operated a Cattle Antimicrobial Use (AMU) working group, which identified measurement metrics for antibiotic use and explored opportunities for national sector-level antimicrobial usage data to be collected and reported for both the beef and dairy sectors. This group worked closely with the Cattle Antimicrobial Stewardship group, which was established to help deliver the targets on antibiotic use, set by RUMA’s Targets Task Force and endorsed by the Veterinary Medicines Agency in October 2017.2
CHAWG took on the legacy of the Beyond Calf Exports Industry Forum, set up jointly by the cattle industry, RSPCA and Compassion in World Farming, in 2013. It has now developed a dairy bull calf strategy, included in the Appendix of this report. CHAWG has also run the annual Farm Health Planning seminars at Dairy Tech, in collaboration with the British Cattle Veterinary Association, and provided a resource for government through the Animal Health and Welfare Board for England and the Wales Animal Health and Welfare Framework Group.
CHAWG does not cover bovine tuberculosis (TB) directly, although activities described in this report will sometimes relate to TB control. The prevalence, spread, impact and control of TB is managed collaboratively and extremely well through other sector organisations. CHAWG supports their efforts and directs any queries primarily to the TB Hub.3
1 AHDB, GB Dairy Cattle Welfare Strategy 2018–20202 Responsible Use of Medicines in Agriculture (RUMA) Alliance, 27 Oct 2017. Industry task force announces new antibiotic targets3 TBhub

98
Top cattle health and welfare issues
Priorities for cattle health and welfare in GB are always a challenge to define, and often depend on who is being asked and when. Many of the issues facing the cattle industry are also multifactorial and have breeding, feeding and on-farm management components.
CHAWG consultationIn 2012 and 2017, CHAWG consulted relevant cattle industry bodies to obtain an understanding of the main health and welfare challenges facing the beef and dairy cattle industries. CHAWG consulted again in 2020 and obtained feedback from a small sample of vets, farmers and NGOs from the beef and dairy sectors. The findings are summarised as:
• Diseases having the biggest economic impact for beef and dairy cattle were TB and lameness respectively. Parasites, scours, fertility and Neospora were also mentioned (Table 1)
Table 1. Top-ranked diseases for economic impact to beef and dairy herds
Rank Beef Dairy
1 TB Lameness
2 Bovine Viral Diarrhoea (BVD) Mastitis
3 Johne’s disease TB
4 Pneumonia Johne’s disease
Source: AHDB
• For both beef and dairy cattle, the top three factors considered to influence levels of endemic disease were: disease prevention, buying practices and biosecurity, and knowledge and skills
• The cow’s environment was the most important issue affecting welfare for both dairy and beef cattle. In addition, lameness and youngstock management were listed as high-priority welfare issues for dairy, and disease prevalence and pain management for beef. Some 13% of respondents did not consider there to be any welfare issues currently for beef cattle
• When asked to identify the type of support that could be most effective in improving health and welfare, half of respondents from both sectors recommended grants for improving housing and infrastructure. There was a view that grants needed to be less restrictive and advice on making low-cost improvements made more available
• Industry-led initiatives were rated very highly as strategies for improving health and welfare. The top recommendation for industry-led initiatives was increasing momentum and aggression of existing schemes through coordination, funding, communication and engagement of veterinary and industry organisations
• Respondents were asked to imagine that they were Defra Secretary of State for the day and could invest a £10 million budget on one initiative (Table 2).
Table 2. Top investment priorities in beef and dairy sectors
Rank Beef Dairy
1 BVD TB
2 TB BVD
3 Improved cattle management Johne’s disease
4 Data capture and decision support Lameness
5 - Data capture
Source: AHDB

10
Study by the University of Edinburgh and Scotland’s Rural College A study published in early 2020 identified the top animal welfare priorities among experts for dairy and beef cattle in the UK4 (Tables 3 and 4). The issue considered to have the greatest impact in terms of severity and duration in dairy cattle was inappropriate nutrition, and in beef cattle, lack of individualised care or treatment. Regarding the most frequently occurring welfare issue, the highest priority in dairy was calf disease and death, including dealing with unwanted male animals, and in beef, unrecognised or untreated pain and ill health.
Table 3. Top welfare priorities for sheep and suckler cows
Rank Prevalence Severity x duration
1Lack of perception of painful conditions and pain managementLack of recognition of underlying poor health status (i.e. not just thin animal)
Neglect
2 Lameness
3 Lack of local veterinary careLack of staff to quickly deal with health issue
Sheep scab Mastitis
4
High neonatal morbidity and mortality LamenessChronic GI parasites Sheep scab
Dystocia
5 Inappropriate nutrition
6 Overstocking/stocking density in housed animals
7
8 Predation/worrying (wildlife and dog attacks)
9 Poor dental health
10 Lack of appropriately trained staff/contractors (e.g. shearers, transporters)
Source: Rioja-Lang et al., 2020
Table 4. Top welfare priorities for dairy cows and dairy goats
Rank Prevalence Severity x duration
1 Neonatal morbidity and mortality Inappropriate nutrition
2 Poor pain management Neonatal morbidity and mortality
3 Inappropriate nutrition Poor stockmanship skills
4 Production diseases, e.g. lameness Social behaviour issues (e.g. mixing animals, aggression, etc.)
5 Poor stockmanship skills Poor pain management
6 Social behaviour issues (e.g. mixing animals, aggression, etc.) Infectious diseases
7 Infectious diseases Euthanasia techniques – specifically for killing goat kids
8 Lack of opportunity to display species-specific behaviours (goats, e.g. browsing/ climbing)
9 Euthanasia techniques – specifically for killing goat kids
Source: Rioja-Lang et al., 2020

1110
Cattle Health Certification Standards survey A survey of 240 veterinary surgeons and advisers across the UK has pinpointed lameness as the top health and welfare challenge facing cattle farmers and vets, with infectious disease second and lack of investment third (Table 5).
The online survey was carried out in June by Cattle Health Certification Standards (CHeCS), which sets standards for infectious disease control and quality-assures UK cattle health schemes, to understand how vets and advisers use the schemes and what their key health and welfare priorities are. Eighty-four per cent of the respondents were vets, with the remainder livestock or animal medicines advisers.
Despite giving participants a free option to identify any challenges they wanted, an overwhelming 36% (87 participants) specified ‘lameness’ as the industry’s biggest health and welfare issue. Infectious disease – the next most popular answer – accounted for 13% (31), of which around half answered ‘TB’. Economic pressures with low margins preventing reinvestment in welfare was third, identified by 9% (22).
Table 5. Top five health and welfare challenges facing cattle farmers and vets, according to vets and advisers
Rank Challenge No. of respondents
1 Lameness 87 (36%)
2 Infectious disease (including TB) 31 (13%)
3 Economics (e.g. low prices and margins) preventing reinvestment in welfare
22 (9%)
4 Calf health and welfare (including mortality, bull calf euthanasia) 20 (8%)
5 Brexit/trade deals impacting farm income and therefore welfare 15 (6%)
Source: CHeCS
4 Rioja-Lang et al., 2020. Prioritization of farm animal welfare issues using expert consensus Frontiers in Veterinary Science

12
Cattle demographic trends
Cattle and premises numbersTable 6. Cattle numbers and premises in GB by purpose – dairy, beef and dual purpose
Source: Defra/Cattle Tracing System (CTS)Note: Premises and cattle where beef/dairy/dual purpose have not been assigned, or were unknown, were excluded from the figures presented in the table; historic numbers may have changed from those included in previous reports due to methodological improvements.
Milk productionTable 7. Average dairy herd size, yield and total milk production in the UK national herd
2019 2018 2017 2016
Cattle Premises Cattle Premises Cattle Premises Cattle Premises
Beef
England 2,710,929 31,908 2,757,770 33,116 2,768,093 33,735 2,745,206 34,039
Scotland 1,215,297 9,372 1,235,760 9,705 1,254,588 9,925 1,270,226 10,106
Wales 560,924 7,817 554,876 7,831 559,476 7,863 562,559 7,986
Total 4,487,150 49,097 4,548,406 50,652 4,582,157 51,523 4,577,991 52,131
Dairy
England 2,297,802 8,391 2,318,078 8,583 2,327,064 8,733 2,323,338 8,794
Scotland 433,644 1,119 436,870 1,146 441,943 1,156 443,693 1,167
Wales 522,769 2,124 520,835 2,124 516,760 2,138 509,100 2,151
Total 3,254,215 11,634 3,275,783 11,853 3,285,767 12,027 3,276,131 12,112
Dual purpose
England 247,039 1,255 250,808 1,299 253,649 1,344 254,011 1,378
Scotland 70,425 233 69,059 237 70,623 239 68,794 240
Wales 35,080 269 36,562 272 36,126 271 35,961 272
Total 352,544 1,757 356,429 1,808 360,398 1,854 358,766 1,890
Grand Total 8,093,909 62,488 8,180,618 64,313 8,228,322 65,404 8,212,888 66,133
Calendar year
Average size of dairy herds in UK
Production year
Average yield in UK (litres/cow/annum)
Total milk production from UK national dairy herd (billion litres/annum)
2019 153 2018/19 7,968 14.99
2018 148 2017/18 7,825 14.84
2017 146 2016/17 7,495 14.22
2016 143 2015/16 7,849 15.96
2015 140 2014/15 7,844 14.64
2014 132 2013/14 7,712 13.92
Source: Defra, DHI, Welsh Government, SEERAD, DARD, Scottish Dairy Cattle AssociationNote: Historic numbers may have changed from those included in previous reports due to methodological improvements.

1312
Beef production
Figure 1. Trends in red meat production for the UK, 1999–2019 Source: Defra
Cattle slaughteringsTable 8. Cattle slaughterings by cattle type (UK) and region, 2013–2019 (‘000 head)
Year Prime cattle
Cows and bulls Calves Total
cattle UK England Wales Scotland Northern Ireland
2019* 2,009 686 132 2,826 2,820 1,774 148 449 449
2018* 1,994 695 121 2,811 2,803 1,758 139 459 447
2017* 1,980 661 113 2,754 2,747 1,711 134 462 440
2016* 1,975 681 124 2,780 2,772 1,729 147 474 422
2015* 1,929 619 101 2,649 2,642 1,617 159 459 407
2014+ 1,960 597 112 2,669 2,659 1,632 151 468 408
2013+ 1,927 607 91 2,625 2,619 1,565 148 474 432
Source: Defra Key: *Data calculated January to December; +Data calculated June to May Note: Historic numbers may have changed from those included in previous reports due to methodological improvements.
0
200
400
600
800
1,200
1,000
1999
2000
2001
2002
2003
2004
2005
2006
2007
2008
2009
2010
2011
2012
2013
2014
2015
2016
2017
2018
2019
‘000
tonn
es (C
WE)
Beef and veal Mutton and lamb Pig meat

14
Cattle importsTable 9. Imported Cattle 2019 – animals imported to GB from main exporting countries
Country
England Wales Scotland
Total animals
Breeding/ production Slaughter Breeding/
productionBreeding/ production Slaughter
Cmts Animals Cmts Animals Cmts Animals Cmts Animals Cmts Animals
Ireland 160 3,498 - - 106 1,538 53 498 1 1 5,855
Germany 167 4,206 - - 27 742 16 501 - - 5,659
N. Ireland 145 1,232 - - 8 75 204 2,972 14 303 4,953
Denmark 80 2,237 - - 11 398 28 970 - - 3,724
Netherlands 67 1,165 - - 10 161 8 135 - - 1,546
Belgium 33 811 1 91 17 425 4 133 - - 1,515
Luxembourg 32 593 - - 3 26 0 0 - - 654
France 31 105 - - 14 56 9 34 - - 249
Others 24 497 - - 9 97 9 267 - - 903
Total 2019 739 14,344 1 91 205 3,518 331 5,510 15 304 25,058
Total 2018 929 17,870 29 931 204 3,701 437 7,115 68 1,513 31,130
Total 2017 1,114 21,044 57 1,564 294 5,980 553 9,828 82 1,869 40,348
Total 2015 1,329 26,158 64 1,997 332 4,873 597 10,693 253 5,337 49,058
Total 2014 1,841 36,804 59 1,700 561 10,365 700 13,086 289 7,915 48,593
Total 2013 1,456 28,008 106 3,538 369 5,836 597 10,085 403 11,366 58,860
Source: APHA Key: Cmts = consignments or numbers of lots in which cattle are imported
Calving patternsThere was a decrease in the number of dairy farmers identifying themselves as ‘all-year-round calving’ in 2019 compared with 20165 (Figure 2), and a corresponding increase in those operating spring or dual (spring and autumn) block calving.
Figure 2. Percentage of GB dairy producers operating to different defined calving patternsSource: AHDB
Dual block
Dual block
Autumn
Spring
All-year-round (AYR) All-year-round (AYR)
2019 Autumn
Spring
2016
72%
11% 7%8%4%
81%
9%8%

1514
Figure 3. Seasonal distribution of registrations of calves sired by dairy (a) and beef breeds (b) in GB from 2015–2019Source: BCMS
0
20,000
40,000
60,000
80,000
100,000
120,000
2015 2016 2017 2018 2019
Janu
ary
Mar
chM
ayJu
lySe
ptem
ber
Nov
embe
rJa
nuar
yM
arch
May
July
Sept
embe
rN
ovem
ber
Janu
ary
Mar
chM
ayJu
lySe
ptem
ber
Nov
embe
rJa
nuar
yM
arch
May
July
Sept
embe
rN
ovem
ber
Janu
ary
Mar
chM
ayJu
lySe
ptem
ber
Nov
embe
r
(a) T
otal
regi
stra
tions
dai
ry
0
50,000
100,000
150,000
200,000
250,000
300,000
350,000
2015 2016 2017 2018 2019
Janu
ary
Mar
chM
ayJu
lySe
ptem
ber
Nov
embe
rJa
nuar
yM
arch
May
July
Sept
embe
rN
ovem
ber
Janu
ary
Mar
chM
ayJu
lySe
ptem
ber
Nov
embe
rJa
nuar
yM
arch
May
July
Sept
embe
rN
ovem
ber
Janu
ary
Mar
chM
ayJu
lySe
ptem
ber
Nov
embe
r
(b) T
otal
regi
stra
tions
non
-dai
ry b
eef a
nd b
eef c
ross
Registrations of dairy-sired calves peak in autumn, but registrations of beef breed-sired calves (dairy cross-beef from the dairy herd, and suckler beef) peak in spring (Figure 3).

16
18,000
16,000
14,000
12,000
10,000
8,000
6,000
4,000
2,000
0
(b) G
B da
iry b
irth
regi
stra
tions
by
smal
ler d
airy
bre
ed
Ayrshire/X BrownSwiss/X
Crossbreeddairy
Kiwi/X Guernsey/X
2015 2016 2017 2018 2019
Predominant breeds
2015 2016 2017 2018 2019
800,000
700,000
600,000
500,000
400,000
300,000
200,000
100,000
0
(a) G
B da
iry b
irth
regi
stra
tions
by
bree
d
Hols
tein/X
Briti
sh Fr
iesian
/X J
ersey
/X
Othe
r A
yrshir
e/X B
rown S
wiss/X
Cros
sbree
d dair
y
Kiw
i/X G
uerns
ey/X
Figure 4a. Predominant cattle breeds in GB for 2015–2019 for (a) dairy and (b) detail on numerically smaller dairy breedsSource: BCMS

1716
600,000
500,000
400,000
300,000
200,000
100,000
0
GB
dairy
birt
h re
gist
ratio
ns b
y br
eed
2015 2016 2017 2018 2019
Abe
rdee
n Ang
us/X
Blon
de D
’Aqu
itaine
/X B
ritish
Blue
/X C
harol
ais/X
Here
ford/
X L
imou
sin/X
Sim
mental
/X S
outh
Devo
n/X
Othe
r
Figure 4b. Predominant cattle breeds in GB for 2015–2019 for beefSource: BCMS
5 AHDB, Dairy Farmer Intentions Survey 2016 & 2019

18
Livestock data and animal identification
Livestock Information Programme Since the last report, there have been significant developments towards establishing a better system for livestock identification, traceability and data exchange. In October 2019, the Livestock Information Programme created a new company, Livestock Information Ltd, to manage the creation and roll-out of a new multispecies Livestock Information Service (LIS). This new service will replace the existing statutory livestock traceability services for cattle, sheep, goats, deer and pigs in England (BCMS, ARAMS and EAML2) and will link into traceability systems in the devolved nations. The new company is a subsidiary of AHDB, established in partnership with Defra – which is a minority 49% shareholder. A premise of the relationship is to be able to use government and industry-held data to drive improvements in productivity, health and welfare. In effect, this brings the original ambitions of the Livestock Industry Data Exchange Hub (LIDEH), for example around knowledge-based trading, into one service provider.
The industry-led Traceability Design User Group continues to advise Defra on the vision and design principles necessary to deliver an integrated, digitally enabled, real-time, industry-facing traceability system. The Government is funding the statutory core element. Added-value features and benefits will require funding from industry sources, although some costs may be shared where there are clear benefits both for government and industry.
Livestock Information Ltd owns the underpinning software and will be responsible for operating and maintaining the service after launch. The main software platform (which will form the core of LIS) is being supplied by Shearwell Data Ltd, following a competitive tender. Shearwell is working with software development company SCISYS to adapt and develop the platform to meet current and future needs of the livestock sector. Data integration software is being supplied by Equine Register Ltd, following a similarly competitive tender. Equine Register already manages the Central Equine Database and the National ChipChecker for Defra.
The new Livestock Information Service will be brought online in stages to reflect the growing functionality of the service and prospective changes in legislation. The first staged ‘release’ is expected during the first half of 2021. Ultimately, LIS will be an important facilitator of data connectivity and will support future work by the new Ruminant Health and Welfare Group and the Defra Animal Health and Welfare Pathway.

1918
IRM and ScotEIDLivestock identification, registration and movements (IRM) is a central component of disease prevention and control in Scotland, which interacts with national regulations and systems assessments through audits and trade missions. ScotEID is the traceability database system developed by Scottish Government to support IRM across sheep, goats and pigs. It is administered by the Scottish Agricultural Organisation Society (SAOS), an independent cooperative development organisation that works in partnership with Scottish Government, and industry partners, including auction markets, abattoirs and farmers; this partnership is referred to as ScotEID.
A period of transition is currently underway to move from the GB Cattle Traceability System (BCMS) to ScotEID for the registration of cattle births, deaths and movements in Scotland. This bespoke system further strengthens disease prevention, control and eradication and the protection of public health through robust livestock traceability. It also delivers added-value projects for the livestock sector, such as provenance checking, non-notifiable disease control and genotyping. While ScotEID will hold all data for Scottish cattle events, it will interact with other systems to ensure information can flow across the UK.
EIDCymruEIDCymru is the electronic movement reporting and traceability system for sheep, goats and deer in Wales, launched in January 2016. EIDCymru is a wholly owned subsidiary company of Hybu Cig Cymru – Meat Promotion Wales (HCC), which administers the service on behalf of the Welsh Government. In February 2020, Welsh Government offered funding to businesses which act as central point recording centres (CPRCs), for example markets, to upgrade their digital infrastructure. This is to support increased use of technology within livestock traceability and in anticipation of the future introduction of bovine electronic identification. EIDCymru will be expanded to accommodate cattle and pigs in a new multispecies traceability system for Wales. It is expected that this will follow similar timelines to the new LIS in England and, as with ScotEID, interact seamlessly, thereby ensuring the continuation of UK-wide traceability once BCMS is disaggregated into the devolved government systems.
Source: Hereford Cattle Society
20
Farm Assurance
Farm Assured Welsh Livestock SchemeWelsh Lamb and Beef Producers Ltd (WLBP) is a cooperative owned by over 7,500 Welsh farmers and provides assurance of farm standards through the Farm Assured Welsh Livestock Beef and Lamb scheme (FAWL).
The FAWL scheme standard was reviewed during 2018. The most significant change is a requirement, from 1 July 2018, for an annual livestock health and welfare review to be undertaken in conjunction with the farm vet.
From June 2020, all members of the FAWL scheme will also have antibiotic usage for their sheep and beef farms measured with their vet during the annual vet review. The measurement metrics recommended by SHAWG and CHAWG and recognised by the Responsible Use of Medicines in Agriculture (RUMA) Alliance6
have been adopted, and a close collaboration with Shearwell and Farmvet Systems was established to deliver this functionality – which will be available to all large animal vets in Wales and scheme members.
WLBP works closely with the veterinary profession in Wales and is part of the veterinary delivery partner group Iechyd Da in Mid and South Wales, which delivers statutory TB testing and Gwaredu BVD (Welsh BVD eradication scheme).
Quality Meat Scotland The Cattle & Sheep Assurance Scheme is an essential element in Quality Meat Scotland’s (QMS) ‘whole chain’ consumer assurance programme and has over 9,500 scheme members. Since 1996, the Scotch Beef and Scotch Lamb brands have held the coveted European ‘Protected Geographical Indication’ (PGI). To be eligible for the Scottish red meat industry’s premium brands and carry the Scotch Beef PGI and Scotch Lamb PGI logos, cattle and sheep must have been born, reared and slaughtered in Scotland and spent their entire life on Quality Meat Scotland Scotch Assured holdings.
QMS carries out a complete review of all standards every two years, with interim reviews held between. The most recent review took place in November 2019, with the standards communicated to members on 1 March 2020. The new standards have been revamped into a more user-friendly document, and key changes relating to animal welfare are:
• A new requirement that the animal health plan be reviewed annually in conjunction with the member’s vet
• Annual vet visit upgraded from ‘should’ to ‘must’
• Recommendation added to use pain relief (analgesia) in addition to anaesthetic for improved animal welfare when castrating, tail docking, disbudding or dehorning
• Pain relief (analgesia) to be recorded in medicine records
• Requirement to record stockperson training upgraded from ‘should’ to ‘must’
• Water supply interruption added into the list of contingency plan events
From 1 January 2019 to 29 February 2020, the top five non-compliances that directly concerned the health and welfare of cattle were:
• Up-to-date medicine administration records
• Relevant animal health plan must be in place for all livestock
• Animal health plan must be reviewed annually
• Documented biosecurity policy must be in place
• Livestock accommodation must be well constructed and effectively ventilated

2120
Red TractorRed Tractor Assurance covers dairy farms across the UK and beef farms in England. Covering food safety, animal welfare, hygiene and environmental protection across the food chain, in recent years a number of changes within the standards has brought about positive developments in farming practices. These changes span data capture at farm level on health and performance trends, additions to herd health plans to reflect the individual nature of different farm systems, and the collation of antibiotic product usage records. All these elements have now come together as part of the annual review overseen by the farm vet.
The performance and usage data are used to provide the farm team (vet, adviser, foot trimmer, nutritionist, etc.) with suggested points to focus on in the short- and longer-term future to benefit the health and performance of the stock; these should also benefit the business long term. By farmers engaging with their vets, a marked reduction has been seen in the use of highest priority critically important antibiotics since the introduction of a standard requiring the justification for use of these products to be recorded by the vet.
Dairy assuranceThe top five non-conformances that directly concerned dairy animal health and welfare from 1 October 2018 to 30 September 2019 were:
• Housing must be constructed and maintained to provide a safe environment for livestock
• Structures within the dairy and milk storage area must be sound, maintained and suitable
• Medicine records must provide an annual collation of total antibiotic use for the unit
• An annual review of antibiotics must be undertaken by the vet
• Milk cooling systems and storage tanks must be maintained to ensure effective cooling and washing
Industry initiative: Red Tractor Dairy Welfare Outcome Assessments In collaboration with AssureWel, Red Tractor introduced welfare outcome assessments as part of the assurance assessment in October 2013. Please see page 25 for more information about the welfare outcome assessments.
Beef assuranceThe top five non-conformances that directly concerned beef animal health and welfare from 1 October 2018 to 30 September 2019 were:
• A written annual livestock health and performance review must be undertaken by the vet
• Health and performance records must be reviewed regularly
• Bait must be used responsibly
• Records of all medicines administered must be kept for five years
• Housing must be constructed and maintained to provide a safe environment for livestock
RSPCA AssuredDairy assuranceWork is underway to review and update the RSPCA welfare standards for dairy cattle and it is expected that the next iteration of these standards will be published late 2020. Welfare outcome assessments continue to be conducted as part of the scheme’s audit of its beef and dairy cattle membership, using the AssureWel welfare outcome assessment protocols for beef cattle and dairy cattle. Both of these protocols have been updated to improve the data collected and make it more reflective of the welfare situation on farm.

226 RUMA, 2020. Measuring antibiotic use7 Godfray, C., 2018. A strategy for achieving Officially Bovine Tuberculosis Free (OTF) status for England
In 2019, the top non-compliances on RSPCA Assured dairy farms, related directly to animal health and welfare, were:
• There must be nothing in the cattle’s environment likely to cause injury or distress
• Body condition scoring must be undertaken at least four times a year and the results recorded in the veterinary health and welfare plan
• Cow brushes must be installed in the cattle’s housing
• All units must have a written veterinary health and welfare plan drawn up in consultation with the vet and other suitably qualified persons
It is worth noting that the most common non-conformance is raised mainly in a preventative capacity rather than as a result of an actual injury. RSPCA takes any welfare issues very seriously and in cases of injury, fear, distress or an animal being caused unnecessary suffering would take immediate further action as appropriate.
Beef assuranceIn February 2020, the latest iteration of the RSPCA welfare standards for beef cattle, which are the standards used by the RSPCA Assured scheme, were published. Similar to the RSPCA welfare standards for dairy cattle, there is a stockperson’s summary at the beginning of the main cattle health and welfare sections, giving an idea of aspirational outcomes if the standards are fully complied with. In line with advice in the Godfray review,7 a specific bovine TB section has also been drawn up to set out more clearly what is best practice on farm, regardless of TB risk. In 2019, the top non-conformance on beef farms, related directly to animal health and welfare, was that ‘All units must have a written veterinary health plan drawn up and regularly updated in conjunction with the vet.’
Welfare outcome assessments have been carried out during assessments and monitoring visits on RSPCA Assured dairy and beef cattle farms since 2013 and 2017, respectively. In 2019, a number of new roles were established at RSPCA Assured to progress this area of work. Throughout 2020, the welfare outcomes team will be evaluating the data collected for the dairy and beef cattle membership to date, and, moving forwards, will use this information to further enhance animal health and welfare on scheme farms.
Soil Association The Soil Association currently has around 250 dairy and 760 beef licensees. A recent standards review has checked and strengthened the evidence underpinning the standards, providing clarity about the impact they achieve, simplifying how they are presented and providing practical guidance. Some new standards have been introduced, for example severely restricting the use of HP-CIAs and banning the use of colistin. Some standards have been brought into line with the EU Organic Regulation where the regulation has improved, or with other legislation, scientific evidence or industry practice where it has developed to a point where the Soil Association standard would make no difference. It is hoped that by harmonising these standards, certification will become more straightforward.
Dairy and beef welfare outcome assessments (as developed by AssureWel) are fully embedded into the inspection process. This has enabled inspectors to be equipped with information that helps them make compliance decisions and give feedback that supports farmers in identifying actions that can lead to welfare improvement. The AssureWel protocols have been successfully adopted by assurance schemes around the world.
From 1 April 2019 to 31 March 2020, the top non-conformances against EU Organic Regulation or Soil Association higher standards that directly concerned beef or dairy animal welfare were:
• Housing and/or pasture kept in a condition that is likely to cause animals injury
• Provide cattle with comfortable, clean and dry bedding/resting area
• Overstocked housing

2322
Cattle welfare
Continuous welfare improvementGrowing public interest and substantial political, environmental and societal pressures now challenge GB’s reputation for having a strong regulation for farm animal welfare. Extensive discussions are ongoing about how industry can best meet or challenge these changing expectations. Following the Health and Harmony consultation in 2018,8 Government announced it would:
• Maintain Britain’s high baseline for animal welfare standards and improve them sustainably over time
• Provide public funds to farmers for meeting higher standards of welfare
Welfare is more important now than ever, with direct payments to farmers being repositioned to increase the amount of production at higher welfare levels.
Government is committed to developing publicly funded schemes for farmers to deliver animal welfare enhancements beyond the regulatory baseline, which are valued by the public but not sufficiently provided by the market. In England, the Animal Health and Welfare Board for England9 is developing an Animal Health and Welfare Pathway in consultation with the farming industry. In Wales, the Wales Animal Health and Welfare Framework Group sets improvement plans in animal health and welfare standards for Wales.10 Read more about this in the Emerging opportunities section.
Dairy improvement programme in Wales As part of the Welsh Government’s £6.5m Dairy Improvement Programme,11 funded through the Rural Development Programme, 500 Welsh dairy farms will receive support to improve health and welfare of their herd through ‘Herd Advance’ and ‘Strategic Farms’.
Through Herd Advance,12 Welsh dairy farmers receive financial and technical support to improve herd health management and disease control. To date, 345 farms have had meetings with their vet to update the farm’s herd health plan and set out three priority areas for the farmer to focus on improving. The farmers also commit to annual data collection. Following these meetings, 47% of farmers have started bulk milk screening for endemic disease (Leptospirosis, Neospora, Infectious Bovine Rhinotracheitis and liver fluke), 52% have started quarterly whole herd testing for Johne’s disease, and 31% have opted for support with lameness, 17% with youngstock and 16% with mastitis. Three Strategic Farms in the Farm Excellence programme13 encourage ‘farmer-to-farmer’ learning through regular on-farm meetings, as well as openly sharing figures against key performance indicators.
Cows’ environment The cow’s environment is critical to her welfare. A diverse range of systems are in place on British dairy farms, with some herds housed all year round, some kept at pasture all year round or – as most commonly occurs – housed during the winter months and kept at pasture during the grass-growing season. The estimate contained in the 2018 CHAWG report that 94% of GB dairy herds have access to pasture at some point in the year, representing 90% of dairy cows, has not changed.14 It is important that wherever the cow spends her time, or for however long, her environment is suitable and optimised for her comfort.

24
Industry initiative: Assessing health and welfare potential on continuously housed farms Full housed systems for dairy cows are often criticised by animal welfare campaign groups as having lower health and welfare potential than pasture-based systems. The concerns range from levels of lameness and mastitis to limitations on cow comfort and behavioural expression. While studies have highlighted risks when housed and at pasture, they often focus on comparative performance with varying quality of facilities rather than examining what is possible. To better understand their potential for good health and welfare, 20 progressive continuously housed herds from across GB were independently audited against a proposed new rigorous health and welfare dairy standard. Measures included levels of disease, antimicrobial usage, mortality and environmental comfort, as well as novel measures of positive welfare, environmental sustainability and social responsibility. The results suggested that levels of health and welfare well in excess of reported average GB levels are achievable on well-managed herds. It is hoped that, once published, the study will provide a resource for other producers and groups to use as a benchmark.15
Research project – ‘Grand Designs’ for cow housing A gap in knowledge around the benefits of cattle housing has meant that consumer concerns – often expressed via the media – cannot currently be addressed from a scientific basis. With 99% of dairy cattle in GB being housed for some point throughout the year, it is important to have a solid scientific foundation for discussion surrounding animal welfare in the housed environment. How the cow interacts with her housing has a big impact on production and economics but also on her health and well-being.
A new on-farm measurement for dairy cow buildings has been developed to provide a better understanding of space allowances in milking cows. All of the information around space is very ambiguous and there are lots of recommendations, but none are based on published evidence. AHDB-funded research, led by the University of Nottingham, enrolled 50 dairy farms across GB to investigate how much space – including loafing space – cows were given. The majority of farmers felt loafing space was essential for cow welfare, but the amount of loafing space varied greatly between farms, ranging from 0.5 m2 to 6.43 m2.
From this study, the team of researchers advise that ‘living space’ is a better measurement for the dairy industry to use because it makes it easier for farmers to benchmark themselves across farms with different cubicle housing set-ups. To help farmers and their advisers, a living space calculator is being designed. The next stage is to ascertain how living space influences cow health, well-being and performance. A year-long trial has compared two groups of cows: one group with 3m2 living space per cow and the other with double this space. This trial has explored the impact of space on cow health, welfare, productivity and profitability, and the results are due shortly.
Research project – space or surface?With almost all dairy cows housed at some point in the year, it is important to ensure that cow lying comfort – a behaviour contributing to health and welfare – is not compromised when housed. Previous studies have identified space and surface type as two qualities of a lying area that appear to be important to cows. An AHDB-funded trade-off study conducted at SRUC found that cows value lying space over surface choices of straw or a mattress when given the option of a cubicle or bigger pen.16
A subsequent study conducted at Harper Adams University, also funded by AHDB, measured the motivation of cows to access an open lying space where there were two different lying surfaces, using walking distance as a motivation indicator. The 25 Holstein-Friesian dairy cows were housed in a robotic milking unit, given free access to a milking robot, ad-libitum feed and water, and access to six mattress cubicles bedded with sawdust. After a short familiarisation period in the trial area, cows were given access to a one-way indoor raceway at a short distance (around 30 m), medium distance (~67 m) or long distance (~112 m) leading to an open lying area (9 m x 5 m) of either deep-bedded straw or a mattress bedded with sawdust. The study found that cows spent more time lying down when the raceway was the short or medium distance, in contrast to the long distance. Open lying surface type also had an effect on lying time, with cows lying down longer on the straw yard as opposed to a large open mattress. Cows were still motivated at the long distance to lie down on the open lying surfaces for around one third of their day, highlighting the importance of an open lying space to cows.

2524
Government and industry initiatives: New centres of excellence for dairy cows Funded as part of the Agri-Tech Strategy set out by UK Government, a number of state-of-the-art, world-leading dairy cow housing facilities have been built.
The South West Dairy Development Centre (Figure 5) is a cutting-edge, 180-cow dairy unit in Somerset. The centre is a fresh vision for the UK dairy industry and provides a truly innovative environment for the development, testing and demonstration of new technologies and techniques to support sustainable, efficient and high health and welfare milk production. The housing design, which reflects the best of the natural environment, while providing automated protection from changing weather conditions, optimises the well-being of the cattle and includes enrichment elements, such as rotary brushes and state-of-the-art lighting.
The Centre for Dairy Science Innovation at the University of Nottingham (Figure 6) has a unique flexible housing facility for two groups of 30 cows to enable exact evaluations of the impact of the environment on the health, welfare and physiology of housed dairy cows. For example, it can test the effect of building layout, stocking rate, access to indoor and outdoor loafing space, feed space and bedding on cow physiology, production, health, welfare and economics.
Figure 5. Cow brush at South West Dairy Development Centre
Figure 6. Centre for Dairy Science at University of Nottingham
Dairy cow welfare outcomes In order to assess the welfare of dairy cattle in all environments, a tool to provide welfare outcome assessments was launched across the UK in 2012. This tool was developed as part of the AssureWel project,17 led by the RSPCA, the Soil Association and the University of Bristol. The Soil Association and RSPCA Assured were the first to roll out welfare assessments on dairy farms.
In 2013, Red Tractor, which assures 95% of the milk produced in Great Britain, introduced a number of the welfare measures into all its on-farm dairy assessments. The assessors follow a protocol to select 10 random cows on each farm, and during the assessment, cows are observed by the assessor and scored for mobility, body condition, hair loss, lesions, swellings and cleanliness. This provides insight into how the cows interact with their environment. All assessors have been trained on assessment protocols and complete annual training to standardise the assessment.
These welfare outcome assessments on Red Tractor farms have now yielded the largest data set of its kind anywhere in the world. The inclusion of these measures in the assessment process has achieved a number of goals: it has brought welfare outcomes into the vocabulary of farmers and their teams, which in turn has aided the adoption of measures on farm; and it provides a unique data set to give an indication of the prevalence of different issues and to map progress.
These results are now published for the first time for the first three years of the scheme (2013–2016) in this report (Figures 7–9). The data set holds information on around 190,000 cows, individually assessed in 19,000 audits, representing 7% of all dairy cows on the Red Tractor-assured farms in the UK. While this

26
data provides useful scheme-level prevalence of lameness across Red Tractor-assured farms, it does not provide an indication of prevalence on individual farms.
On average, across the three years of data:
• 9% of cows were reported as lame • 8% of cows had a patch of hair loss, lesion or swelling identified on their body• 10% of cows were classified as dirty
Improvements in all measures were seen in year three compared with the first year. Welfare outcomes continue to be recorded on dairy farms every day.
14
12
10
8
6
4
2
0 Pre
vale
nce
(%) o
f lam
e co
ws
mob
ility
scor
e 2
+3
2013
108.4 8.1
2014
Year (Oct–September)
2015
14
12
10
8
6
4
2
0 Pre
vale
nce
(%) o
f cow
s sc
ored
as d
irty
2013
12.1
9.1 9.3
2014
Year (Oct–September)
2015
14
12
10
8
6
4
2
0 Pre
vale
nce
(%) o
f cow
s w
ithha
irlos
s, le
sions
and
sw
ellin
gs
2013
9.3
7.1 6.4
2014
Year (Oct–September)
2015
Figure 7. The percentage of lame cows was lower in 2014 and 2015 compared with 2013Source: Red Tractor Assurance
Figure 9. There were fewer dirty cows in 2014 and 2015 compared with 2013Source: Red Tractor Assurance
Figure 8. The percentage of cows with hair loss, lesions and swellings declined from 2013 to 2015Source: Red Tractor Assurance
8 Defra, 2018 Health and Harmony: the future for food, farming and the environment in a Green Brexit 9 Defra, Animal Health and Welfare Board for England10 Welsh Government, Wales Animal Health and Welfare Framework Group11 AHDB, Dairy Improvement Programme – Wales12 AHDB, Herd Advance13 AHDB, Farm Excellence14 AHDB, estimate based on available industry data15 Bell, N. J. et al., 2020. Assessing health and welfare potential on 20 housed dairy herds. AHDB, University of Nottingham and University of Bristol. Manuscript in preparation16 Shewbridge-Carter et al., 2020. Dairy cow motivation for access to open lying space ISAE 2020 Global Virtual Meeting
Online Abstract Book17 AssureWel

2726
10
8
6
4
2
0
Pre
vale
nce
(%)
Year (Oct–September)
Thin cows Fat cows
2013 2014 2015
43.3 2.8 3.3
2.3 2.4
Figure 10. Trend in the percentage of thin and fat cows 2013–2015Source: Red Tractor Assurance
Cattle production health
Body conditionBody condition scoring is a tool that helps farmers better manage their cattle by matching their nutritional programme to the needs of the cows. Adequate body condition is a critical aspect of cattle health and, consequently, welfare, but one which is often overlooked by public, media and campaign groups. Appropriate body condition and nutrition helps to optimise health, welfare and fertility, while minimising calving difficulties and production costs. There are a number of initiatives to support cattle farmers and their advisers to improve feed planning on farm; one example is the Tried & Tested ‘Feed planning for cattle and sheep’.18
As part of the Red Tractor assurance for dairy farms welfare assessment, described on page 24, on average, 94% of cows assessed across the UK were in an acceptable condition (between score of 2 and 4 on a 5-point scale). Of those not in acceptable condition, 3.5% were too thin and 2.5% were too fat. This provides a snapshot of the condition of the national dairy herd, but it is the change in body condition score that is more important than the absolute value, therefore scoring should be undertaken regularly. There was an increase in the percentage of cows assessed as thin in 2015 compared with the two previous years. There was a reduction in the percentage of cows assessed as fat in 2014 and 2015, compared with 2013 (Figure 10).
Industry initiative: AIC Feed Adviser Register (FAR)The Feed Adviser Register (FAR) was set up by the Agriculture Industries Confederation (AIC) to provide professional feeding advice on livestock farms. Since its launch in 2013, around 1,100 feed advisers from all over the UK have been approved, of which 85% specialise in cattle.
FAR has strict entry criteria to join, based upon training and experience. Advisers complete initial training and competency tests in all species on which they advise to become a full member of the register. To maintain their membership, advisers must complete specific training to demonstrate continuous professional development each year, which in 2019 covered the subjects of feed additives and compliance with maximum permitted levels.
In June 2020, the ‘Find a Feed Adviser’ tool was launched on the FAR website to enable farmers to search for a registered adviser within their area. Further information on FAR and the Find a Feed Adviser tool can be found on the website.19

28
Culling and mortalityDairy cowsSince 2015, the percentage of dairy cows culled or dying 100 days after calving has remained stable, at around 5% (Table 10). On average, cows are exiting the herd at six years of age. The number of lactations achieved when exiting the herd has remained static, at 3.6 for the last four consecutive years, even though this is down slightly from 2010. In general, reasons for leaving the herd are less likely to be cell-count- or mastitis-related, and more likely to be for reproductive reasons and infectious disease control (Table 11).
Table 10. A selection of key performance indicators (KPIs) for the UK national herd 2010–2019
ParameterTarget ‘Best 25%’ Median
2019 2018 2017 2010 2019 2018 2017 2010
Culling rate (%) 22 22 21 18 27 27 26 24
Culling/death rate in first 100 days of lactation (%) 3 4 3 4 5 6 5 7
Age at exit (years) 6.7 6.7 6.7 7.4 6.0 6.0 6.0 6.6
Age at exit by lactations 4.0 4.1 4.0 4.5 3.6 3.6 3.6 3.9
305-day yield (kg) 10,040 9,925 9,856 8,300 9,078 8,967 8,845 7,400
Source: NMR/VEERU
Table 11. Dairy cow culling/leaving reasons – health-related
Reason for cows leaving herd (% of leavers) Kingshay (March 2020)+ Kite Health (March 2020)
Year ending 2019 2018 2017 2011 2019+ 2018+ 2017+ 2011*
Mastitis/High SCC 11.5 10.8 12.6 15.4 13.4 13.2 14.4 17.6
Not in calf/not seen bulling/out of calving pattern 25.0 25.5 28.5 25.5 30.6 29.5 26.7 25.4
Lameness/Legs & Feet 10.2 10.3 9.8 10.4 11.4 12.5 11.7 9.4
Aborted 2.4 2.6 2.4 2.1 2.4 2.4 2.5 1.7
Accident/Trauma/Injury 5.5 5.7 5.5 5.6 3.7 3.6 3.6 4.4
Metabolic disorder 2.6 2.6 2.2 3.0 1.9 1.8 2.0 2.6
Calving Injury/Downer cows 3.7 3.3 3.4 4.2 3.0 3.7 3.4 4.4
Infectious disease, including Johne’s and TB reactors
10.3 11.5 8.0 7.2 4.7 4.4 5.1 3.2
Leaving % of total herd 29.0 27.0 27.0 27.0 25.5 22.9 24.0 25.0
Mortality % of total herd 1.9 1.8 1.6 1.7 1.2 2.3 2.8 3.1
Source: The Kite Health Monitor and Kingshay Dairy Costings Focus Annual Reports Note: *Data calculated Jan–Dec; +Data calculated Apr–Mar.
2928
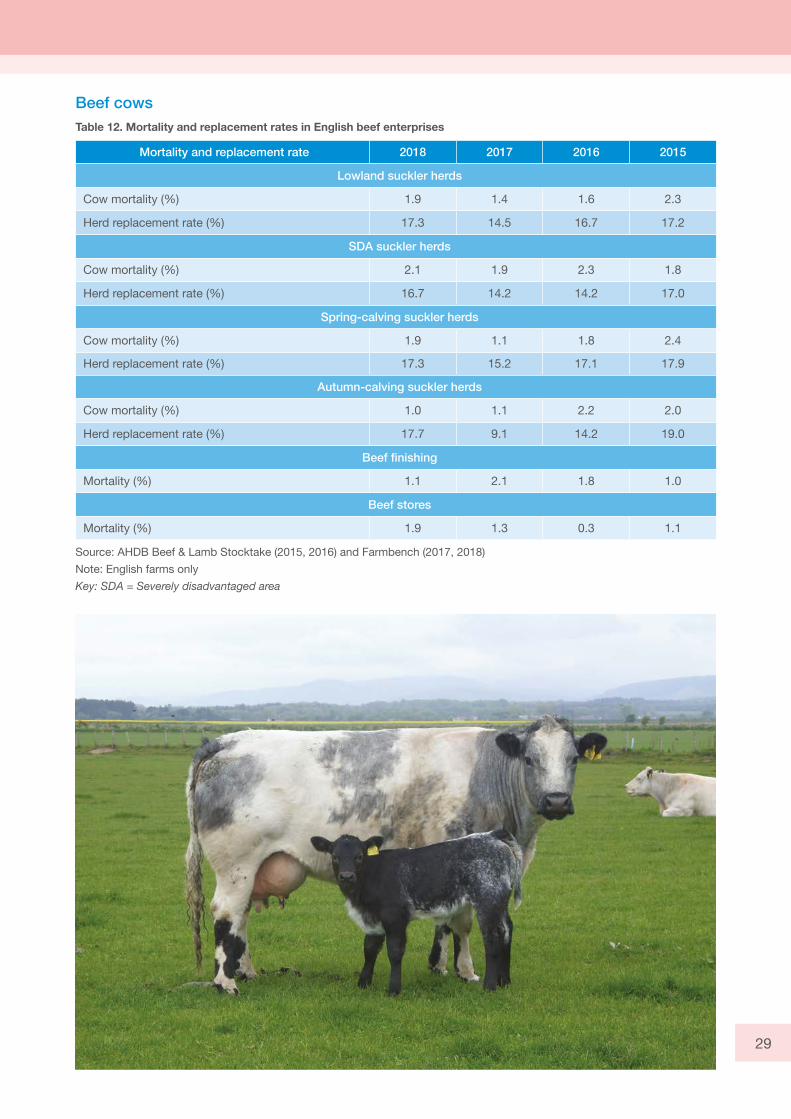
Beef cows Table 12. Mortality and replacement rates in English beef enterprises
Mortality and replacement rate 2018 2017 2016 2015
Lowland suckler herds
Cow mortality (%) 1.9 1.4 1.6 2.3
Herd replacement rate (%) 17.3 14.5 16.7 17.2
SDA suckler herds
Cow mortality (%) 2.1 1.9 2.3 1.8
Herd replacement rate (%) 16.7 14.2 14.2 17.0
Spring-calving suckler herds
Cow mortality (%) 1.9 1.1 1.8 2.4
Herd replacement rate (%) 17.3 15.2 17.1 17.9
Autumn-calving suckler herds
Cow mortality (%) 1.0 1.1 2.2 2.0
Herd replacement rate (%) 17.7 9.1 14.2 19.0
Beef finishing
Mortality (%) 1.1 2.1 1.8 1.0
Beef stores
Mortality (%) 1.9 1.3 0.3 1.1
Source: AHDB Beef & Lamb Stocktake (2015, 2016) and Farmbench (2017, 2018)Note: English farms onlyKey: SDA = Severely disadvantaged area
30
2017
2016
2015
2010
2017
2016
2015
2010
2017
2016
2015
2010
2017
2016
2015
2010
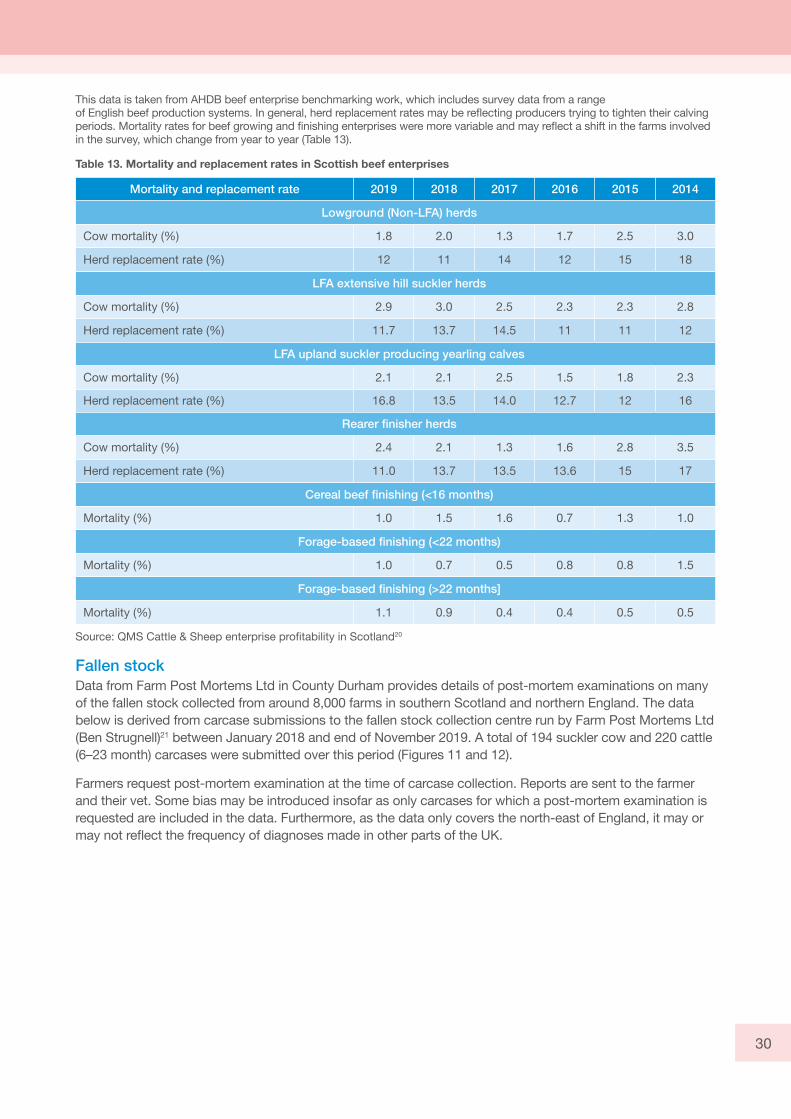
This data is taken from AHDB beef enterprise benchmarking work, which includes survey data from a range of English beef production systems. In general, herd replacement rates may be reflecting producers trying to tighten their calving periods. Mortality rates for beef growing and finishing enterprises were more variable and may reflect a shift in the farms involved in the survey, which change from year to year (Table 13).
Table 13. Mortality and replacement rates in Scottish beef enterprises
Mortality and replacement rate 2019 2018 2017 2016 2015 2014
Lowground (Non-LFA) herds
Cow mortality (%) 1.8 2.0 1.3 1.7 2.5 3.0
Herd replacement rate (%) 12 11 14 12 15 18
LFA extensive hill suckler herds
Cow mortality (%) 2.9 3.0 2.5 2.3 2.3 2.8
Herd replacement rate (%) 11.7 13.7 14.5 11 11 12
LFA upland suckler producing yearling calves
Cow mortality (%) 2.1 2.1 2.5 1.5 1.8 2.3
Herd replacement rate (%) 16.8 13.5 14.0 12.7 12 16
Rearer finisher herds
Cow mortality (%) 2.4 2.1 1.3 1.6 2.8 3.5
Herd replacement rate (%) 11.0 13.7 13.5 13.6 15 17
Cereal beef finishing (<16 months)
Mortality (%) 1.0 1.5 1.6 0.7 1.3 1.0
Forage-based finishing (<22 months)
Mortality (%) 1.0 0.7 0.5 0.8 0.8 1.5
Forage-based finishing (>22 months]
Mortality (%) 1.1 0.9 0.4 0.4 0.5 0.5
Source: QMS Cattle & Sheep enterprise profitability in Scotland20
Fallen stockData from Farm Post Mortems Ltd in County Durham provides details of post-mortem examinations on many of the fallen stock collected from around 8,000 farms in southern Scotland and northern England. The data below is derived from carcase submissions to the fallen stock collection centre run by Farm Post Mortems Ltd (Ben Strugnell)21 between January 2018 and end of November 2019. A total of 194 suckler cow and 220 cattle (6–23 month) carcases were submitted over this period (Figures 11 and 12).
Farmers request post-mortem examination at the time of carcase collection. Reports are sent to the farmer and their vet. Some bias may be introduced insofar as only carcases for which a post-mortem examination is requested are included in the data. Furthermore, as the data only covers the north-east of England, it may or may not reflect the frequency of diagnoses made in other parts of the UK.

3130
Rum
inal a
cidos
isPn
eum
onia
– pos
t vira
l
IBR
No d
iagno
sis
Blac
kleg
Pneu
mon
ia – e
nd st
age
Trau
ma
Copp
er d
eficie
ncy
PGE
(Oste
rtagia
sis)
Pneu
mon
ia – p
rimar
y bac
teria
l
35302520151050
Freq
uenc
y
302520151050
Freq
uenc
y
Wire
Stra
w im
pact
ionGr
ass s
tagg
ers
No d
iagno
sisOb
stetri
cal c
ompli
catio
nsPn
eum
onia
Pyelo
neph
ritis
Mas
titis
Clos
tridia
l dise
ase
Othe
r
Figure 11. Ten most common diagnoses in cattle 6–23 months of age, January 2018–November 2019Source: Farm Post Mortems Ltd Key: IBR = Infectious bovine rhinotracheitis; PGE = Parasitic gastroenteritis
Figure 12. Ten most common diagnoses in suckler cows, January 2018–November 2019Source: Farm Post Mortems Ltd
Detailed diagnostic criteria are available, but, fundamentally, if a diagnosis can be made on gross post-mortem findings, then generally this is done because any further testing is at the expense of the producer. Therefore, detailed laboratory confirmation of every diagnosis may not be performed. Nevertheless, it is worth noting that many of the common diagnoses can be made with minimal further diagnostic testing (e.g. IBR, traumatic reticulitis).

32
MastitisIndividual cow indicatorsIndividual cow udder health parameters taken from a number of different data sources illustrate a clear improvement in udder health since 2010 (Table 14).
Table 14. Percentage of somatic cell count (SCC) samples from recorded dairy herds, by different criteria
Parameter
NMR QMMS TotalVet CIS20
19
2018
2017
2010
2019
2018
2017
2010
2019
2018
2017
2010
2019
2018
2017
2010
Milk samples SCC ≥ 200,000 cells/ml (%) 17 18 19 24 16 17 17 - 17 17 16 25 19 18 17 24
Dry period new infection rate (%) 15 15 14 16 16 16 15 - 15 15 14 16 14 13 14 10
Dry period cure rate (%) 77 76 77 74 72 71 80 - 71 72 77 72 71 72 75 75
Lactating period new infection rate (%) 6 7 7 - 8 9 8 - 8 8 7 9 7 7 8 8
Lactating period chronic infections (%) 9 10 10 14 9 9 8 - 9 9 8 16 15 15 10 18
Average SCC (‘000 cells/ml) 171 178 179 210 164 154 - - - - - - 210 198 184 238
Source: 500 National Milk Record (NMR) data sets,22 selected as representative of milk recording herds, analysed by the Veterinary Epidemiology and Economics Research Unit (VEERU) at University of Reading; 140 herds using Quality Milk Management Services Ltd; 650 herds benchmarked using the Total Vet analysis software; and 2,500 herds recorded by CIS. Note: Some differences will be due to subtle variations in how each parameter is calculated, so the trend is of more relevance than absolute numbers. Key: SCC = somatic cell count. Dry period new infection rate = % of new infections across the dry period. Dry period cure rate = % of cures during the dry period. Lactating period new infection rate = % of new infections at any recording during lactation. Lactating period chronic infections = % of cows remaining above 200,000 cells/ml for more than one recording during lactation.
3332
2006
2005
2008
2007
2009
2010
2011
2012
2013
2014
2015
2016
2017
2018
2019
230
220
210
200
190
180
170
160
212 215221 221
216210 208
199 197
189 189185 184 183
218
Som
atic
cel
l cou
nt ‘0
00 c
ells/
ml m
ilk
2005
2006
2007
2008
2009
2010
2011
2012
2013
2014
2015
2016
2017
2018
2019
82
80
78
76
74
72
70
68
81.581.180.779.979.8
78.678.2
76.876.1
75.274.273.8
73.273.673.9
% o
f all N
MR
milk
reco
rdin
gs th
at h
ave
SCC
be
low
200
,000
cel
ls/m
l milk
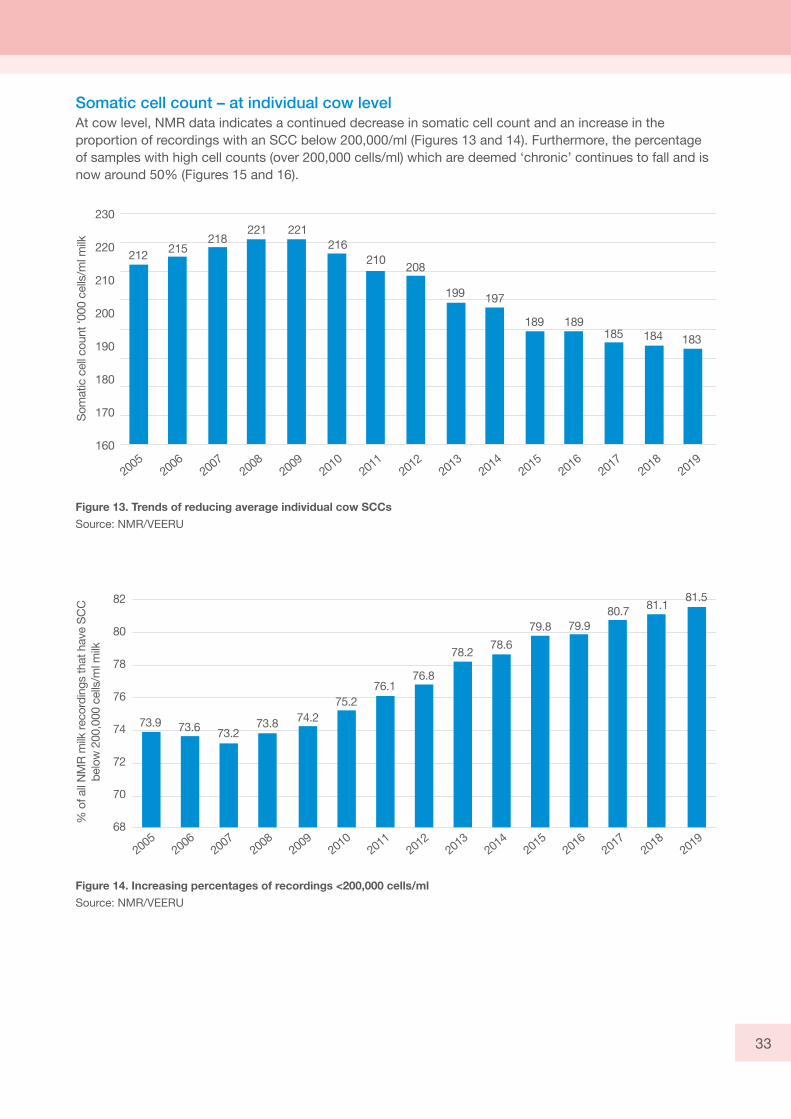
Somatic cell count – at individual cow level At cow level, NMR data indicates a continued decrease in somatic cell count and an increase in the proportion of recordings with an SCC below 200,000/ml (Figures 13 and 14). Furthermore, the percentage of samples with high cell counts (over 200,000 cells/ml) which are deemed ‘chronic’ continues to fall and is now around 50% (Figures 15 and 16).
Figure 13. Trends of reducing average individual cow SCCsSource: NMR/VEERU
Figure 14. Increasing percentages of recordings <200,000 cells/mlSource: NMR/VEERU

34
2006
2005
2008
2007
2009
2010
2011
2012
2013
2014
2015
2016
2017
2018
2019
60
58
56
54
52
50
48
46
44
42
40
56.3 56.8 56.9 56.4 56.7 56.2 55.554.4 54.8
53.9 53.552.5
51.7 51.249.7
% o
f all h
igh
NM
R m
ilk s
ampl
es w
ith
≥ 20
0,00
0 ce
lls/m
l milk
Figure 15. Percentage of all high NMR milk samples that are chronic high cell count category+
Source: NMR/VEERUKey: +In this data set, chronic indicates a milk sample with ≥200,000 cells/ml milk
Figure 16. Distribution of high SCC categories from all NMR milk samples taken in 2019Source: NMR/VEERU
New
Repeat
FirstChronic
23%
11%
16%
50%
Somatic cell counts – at herd level The data from 2018 and 2019 also shows an improving trend in milk quality in terms of herd somatic cell count (SCC). The proportion of herds with fewer than 10% chronic high SCC cows has increased from 24% of herds in 2010 to 62% of herds in 2019 (Figure 17).

3534
2010 2011 2012 2013 2014 2015 2016 2017 2018 2019
High (>15% chronic cows)Medium (10–15% chronic cows)Low (<10% chronic cows)
41%
24%
34%
35%
32%
33%
30%
34%
36%
29%
36%
35%
24%
42%
35%
21%
44%
35%
18%
51%
31%
17%
51%
33%
12%
55%
33%
13%
62%
25%
Jan Feb Mar Apr May Jun Jul Aug Sep Oct Nov Dec2010
210
200
190
180
170
160
150
140
2017 2018 2019
Som
atic
cel
l cou
nt (‘
000
per m
l)
Figure 17. Change over time in the distribution of chronically infected cows (with more than one SCC >200,000 cells/ml) in 500 NMR herdsSource: NMR/VEERU
Figure 18. Mean herd bulk milk somatic cell counts 2010 and 2017–2019Source: AHDB
National bulk milk somatic cell count figures, collated by AHDB (Figure 18), are consistent with the trends described above and indicate substantial improvement since 2010, but with a slight increase in the summer months of 2018 and 2019 compared with 2017, possibly related to increased nationally recorded temperatures during these summers.

36
600
500
400
300
200
100
0
£/co
w in
her
d/ye
ar
Farm no.
Subclinical mastitis costClinical mastitis cost
Results from farm surveys conducted by Kite Consulting and Kingshay also show a year-on-year decline in the herd average incidence rate of clinical mastitis (Table 15).
Table 15. Herd health data on mastitis incidence, cases/100 cows/year
Year ending Kite Kingshay*
2020 26* 36
2019 28* 39
2018 31* 39
2017 31+ 41
2016 36* 49
2015 36* 50
2014 42+ 52
2013 43+ 58
Source: The Kite Health Monitor and Kingshay Dairy Costings Focus Annual Reports Note: +Data calculated January to December. *Data calculated April to March.
Clinical mastitis AHDB funding has supported the collation and analysis of udder health data from a group of 113 ‘Sentinel’ herds, which are being followed to assess changes in udder health parameters over time. All of these herds have reliable clinical mastitis data, with a wide range of performance. A summary is presented in Table 16. Farm-specific estimates of the cost of clinical and subclinical mastitis are illustrated in Figure 19. Sentinel herds is an ongoing project, at present funded to 2021.23
Figure 19. Costs of mastitis for 107 sentinel herds in 2018Source: AHDBNotes: Assumptions – Milk price 29.3 ppl; Feed & fertiliser cost 1 ppl/1,000 litres; BMSCC penalty 2 ppl above 300,000 cells/ml; % mastitis cases severe 5%; cows culled for SCC 25% of chronic cows/year.

3736
Table 16. Key farm indices and udder health indicators in 113 sentinel herds for 2018
Variable Number of farms Mean Median
PercentileMin Max
% herds improving since 201725th 75th
Herd size 113 312 255 162 344 63 1,683
Annual rolling 305-day yield (litres) 108 8,681 8,825 7,607 10,018 4,365 12,020
Calculated bulk milk SCC (‘000/ml) 108 159 149 123 191 52 415 54
Clinical mastitis (CM) rate (cows affected/ 100 cows/year) 113 30.3 26.0 19 36 2 96 61
Quarter CM rate (100 cows/year) 113 33.0 28.0 21 43 2 109 64
Dry period origin CM rate (cows in 12) 113 0.7 0.6 0.40 1.01 0 2.91 60
Lactation origin CM rate (cows in 12) 113 1.8 1.7 1.11 2.41 0.11 5.73 61
Lactation new infection rate (%) 111 6.7 6.4 4.7 7.9 2.4 20.2 58
Dry period new infection rate (%) 108 16.0 15.1 10.7 19.4 2.1 40.8 46
Dry period cure rate (%) 107 78.8 79.1 72.9 85.6 42.9 100 50
Fresh calver infection rate (%) 108 17.4 17.3 12.5 21.2 2.8 44.4 47
% chronically infected 111 8.9 8.3 6.6 11.9 0 32.7 54
% > 200,000 cells/ml 111 15.9 14.9 11.4 18.8 5.2 45.6 51
Source: AHDBNote: Data is rolling 12-month figures as of 31 Dec 2018. Key: CM = clinical mastitis. Dry period origin CM rate target: ≤1 in 12 cows get clinical mastitis in first 30 days of lactation (<1/cow year at risk). Lactation origin CM rate target: ≤2 in 12 cows get clinical mastitis in lactation (approx. <0.167/month of risk).
Industry initiative: AHDB Dairy Mastitis Control Plan The AHDB Dairy Mastitis Control Plan (DMCP), developed in GB, is an effective, evidence-based, nationwide plan for mastitis control that has been shown to have excellent clinical efficacy.24 The scheme continues to receive funding from AHDB, enhanced by payment of annual subscriptions by plan deliverers (vets and consultants qualified to deliver the DMCP). At the end of 2019, there were 97 registered plan deliverers in 60 separate subscribing organisations, plus four academic (training) memberships. Twenty-one new plan deliverers were trained in 2019, adding to the well-distributed network of support for farms across the country. A survey of plan deliverers suggests that the principles of the DMCP have been used in practices/businesses that work with approximately 45% of the national dairy herd.
Industry-supported campaign to improve udder health – the QuarterPRO initiative A new initiative, QuarterPRO,25 was launched in Spring 2020 by AHDB and aims to help farmers achieve continuous improvement in mastitis and udder health on farm. QuarterPRO is a three-step process for dairy farmers, their vets and advisers to track mastitis and cell count information, implement a targeted plan and ultimately reduce and control the rate of new infection and cases on farm. QuarterPRO’s ability to identify whether mastitis is environmental or contagious, and a dry or milking cow issue, helps farmers and vets narrow down the cause. Repeating the QuarterPRO process every three months will further highlight the route of the mastitis and allow the farm team to refine the management approach.

38
Fertility and breedingDairy overviewThe National Bovine Data Centre (NBDC)26 collates completed lactation results recorded in the UK by a range of organisations approved by the International Committee for Animal Recording (ICAR). The data gathered is exclusively for animals registered with different dairy cattle breed societies, namely Ayrshire, British Friesian, Brown Swiss, Guernsey, Holstein, Island Jersey, Montbeliardes and UK Jerseys. The data provides an indication of trends overall, and for that breed in the UK, in areas such as lactation information (including total yield, fat and protein), somatic cell counts, calving intervals and genetic value (as indicated by average £PLI – Profitable Lifetime Index – of the animals). Collated national data across all breeds shows that reproductive performance, as indicated in this case by calving interval, has continued to improve since 2010 (Figure 20). The average age at first calving of pedigree Holsteins continues to decrease. It is currently at 26.6 months, in comparison with 29.2 months in 2007 (Table 17).
2006
2007
2009
2008
2010
2011
2012
2013
2014
2015
2016
2017
2018
2019
435
430
425
420
415
410
405
400
395
Cal
ving
inte
rval
(day
s)
Figure 20. Mean calving interval for lactations ending in the years shown (all breeds)Source: National Bovine Data Centre

3938
Table 17. Mean age at first calving of pedigree Holstein females by year of birth
Year of birth Mean age at first calving (days) Mean age at first calving (months)
2016 810 26.6
2015 822 27
2014 825 27.1
2013 835 27.5
2012 851 28
2011 863 28.3
2010 859 28.2
2009 869 28.6
2008 878 28.8
2007 890 29.2
Source: National Bovine Data Centre
Industry initiative: The InCalf guide for GB farmers In 2019, AHDB published two new guides on dairy herd fertility management. The InCalf guide for herds calving all-year-round (AYR)27 or block calving28 combine best practice from research and resources from AHDB and industry experts, to provide detailed information on dairy herd fertility management.
The guides are designed to help farmers, vets and advisers assess current practices, and to consider the potential for fertility performance improvement. The guides prompt consideration of the business implications and technical challenges, so aiding farmers in strategic decisions about the optimum system for their farm.
Calving interval and conception ratesTwo smaller but more detailed data sets (the NMR 500 herds KPI report29 and the TotalVet user benchmarking data set30) have been analysed to provide an indication of trends in fertility. Both of these suggest previous improvements in reproductive performance have slowed or levelled off during 2019, with the NMR herds showing relatively stable overall fertility performance (as measured by both calving interval and percentage conceived at 100 days after calving, Table 18) over the past few years. The TotalVet data (Figure 21) shows a modest decline in the median calving interval, but an increase in the range covering the middle 50% of herds.

40
Table 18. A selection of key performance indicators (KPIs) for the UK national dairy herd 2019 (Holstein Friesians)
ParameterTarget ‘Best 25%’ Median
2019 2018 2017 2010 2019 2018 2017 2010
Percentage conceived 100 days after calving 41 41 41 33 34 34 35 26
Calving to first service interval (days) 71 71 69 87 81 81 81 105
Calving interval (days) 387 388 389 409 401 400 402 424
Age at first calving (years) 2.1 2.1 2.1 2.3 2.3 2.3 2.3 2.4
Conception rate (%) 42 42 41 40 35 35 34 32
Percentage eligible for service that were served 51 49 49 37 39 37 38 27
Percentage eligible for service that conceived 18 17 18 13 14 13 14 9
Source: NMR/VEERU29
Calving interval (days)
350 360 370 380 390 400 410 420 430 440 450 460
2018 2019
Figure 21. Distribution of mean calving interval within a data set of 153 UK dairy herds for 2018 and 2019 Source: TotalVet user benchmarking data30
Note: Boxes show the interquartile range (i.e. the range for the ‘middle’ 50% of the herds), with the horizontal line within the box showing the median (typical) herd and the vertical bars showing the full range of values.
AHDB’s dairy performance results provide costs and margins from GB dairy herds across the two optimal systems – all-year-round (AYR) and block calving (autumn and spring). This allows producers to compare their figures with farms operating the same calving system. In the latest report,31 as expected, block-calving herds have shorter intervals than all-year-round calving herds. Age at first calving was also lower in block-calving herds by over two months, with spring block-calving herds calving down heifers at just under two years of age (Table 19).

4140
Table 19. Calving interval and age at first calving from 258 all-year-round calving (AYR), 29 autumn-calving and 29 spring-calving herds in GB during 2018/19
Top 25% Middle 50%
AYR Autumn Spring AYR Autumn Spring
Calving interval (days) 400 388 376 399 390 377
Age at first calving (months) 26.5 24.3 23.9 26.6 24.3 23.9
Source: AHDB
Beef overviewSuckler fertility metrics are monitored as part of AHDB’s benchmarking system Farmbench (and formerly Stocktake). Farmbench32 is designed to help farmers measure and manage multiple enterprises on a single platform.
Beef fertility metrics In general, the fertility performance of suckler herds is very similar to previous years (Tables 20 and 21). However, data recorded for English herds also shows a consistent trend to more compact calving periods – as denoted by a steady increase in the number of cows and heifers calving in the first three weeks of the calving period.
Table 20. Comparison of fertility performance in English beef suckler herds
Fertility performance 2018 2017 2016 2015
Lowland
Percentage of cows & heifers scanned in calf (%) 94 92 91 91
Calves born alive/100 cows or heifers to bull 88 88 88 89
Calving period (first to last calf – weeks) 17.8 12.9 15.2 18.2
Cows & heifers calving in first 3 weeks (%) 41.8 40.7 35.1 33.4
Empty cows or heifers (%) 7.6 5.6 9.7 7.8
SDA
Percentage of cows & heifers scanned in calf (%) 90 90 94 86
Calves born alive/100 cows or heifers to bull 89 87 90 86
Calving period (first to last calf – weeks) 11.0 17.6 14.1 17.6
Cows & heifers calving in first 3 weeks (%) 55.8 36.7 32.1 31.9
Empty cows or heifers (%) 8.0 10 7.8 12
Spring calving
Percentage of cows & heifers scanned in calf (%) 93 91 91 90
Calves born alive/100 cows or heifers to bull 89 87 88 88
Calving period (first to last calf – weeks) 14.3 14.2 15.3 18.6
Cows & heifers calving in first 3 weeks (%) 47.1 39 36.6 35.3
Empty cows or heifers (%) 6.8 7.1 10.4 8.7
Autumn calving
Percentage of cows & heifers scanned in calf (%) 88 89 90 95
Calves born alive/100 cows or heifers to bull 85 86 89 92
Calving period (first to last calf – weeks) 19.9 14.6 11.9 14.3
Cows & heifers calving in first 3 weeks (%) 42.7 41.2 33.2 34.6
Empty cows or heifers (%) 12.8 11 9.1 5
Source: AHDB Beef & Lamb Stocktake 2015, 2016 and Farmbench 2017, 2018English farms onlyKey: SDA = severely disadvantaged area

42
Table 21. Comparison of fertility performance in Scottish beef suckler herds
Fertility performance 2019 2018 2017 2016 2015 2014
Lowground (Non-LFA) suckler herds
Calves born alive/100 cows or heifers to bull 91 93 91 89 91 86
Empty cows or heifers (%) 9 5 8 10 7 10
LFA extensive hill suckler herds
Calves born alive/100 cows or heifers to bull 91 92 91 90 90 92
Empty cows or heifers (%) 7 5 6 7 5 5
LFA upland suckler producing yearling calves
Calves born alive/100 cows or heifers to bull 90 92 91 92 90 88
Empty cows or heifers (%) 8 7 7 7 6 9
Rearer finisher herds
Calves born alive/100 cows or heifers to bull 92 92 90 89 90 89
Source: Quality Meat Scotland Key: LFA = less favoured area
National suckler herd fertility metrics providing average age at first calving and calving interval in England and Wales have been provided by BCMS and are based on calf birth registration dates. This data set does not capture calvings where calves die before they are registered, but it provides a useful guide to trends in suckler herd fertility, which is showing a shift since 2015 towards a younger age at first calving for heifers (Table 22).
Table 22. Average age at first calving and calving interval, England and Wales
Year of first calvingAverage age at first calving (months)
England Wales
2019 32.8 33.3
2018 32.2 32.9
2017 32.8 33.2
2016 32.6 33.5
2015 33.4 33.6
Year of last calvingAverage calving interval (days)
England Wales
2019 419 427
2018 418 422
2017 420 426
2016 422 428
2015 424 428
Source: BCMS

4342
MobilityDairy cattle mobilityLameness prevalence in dairy cattle still shows wide ranges, as illustrated in Table 23. Lame cows are not inevitable, and the problem can be both prevented and controlled. Reducing the prevalence of lameness on farm is a priority area in the 2018 Dairy Cattle Welfare Strategy and a long-term objective of the Dairy Cattle Mobility Steering Group.
Table 23. Estimates of lameness prevalence in different research studies
YearLameness
prevalence (%) NumbersLocation Reference
Average (Min–Max) Dairy herds Dairy cows
1989–91 20.6 (2–53.9) 37 11,399 NW & SW England, Wales Clarkson et al., 199633
2000–01 22.1 (0–50) 53 7,407 SW England & Midlands Whay et al., 200334
2002–04 24.2 (6.8–74.2) 28 N/A SW England Huxley et al., 200535
2004–06 18 (4–42) 80 28,698 Scotland, England, Wales Rutherford et al., 200936
2000–03 15-39 37 2,724 Scotland, England, Wales Haskell et al., 200637
2006–07 36.8 (0–79) 205 28,277 SW & Midlands England, Wales Barker et al., 201038
2010–14 26.7 (3–77) 207 26,289 SW England Shepherd, 201639
2011 18.2 (0–53.5) 92 N/A England, Wales Heath et al., 201440
2012–13 32 (0–50) 44 11,800 NW England RDPE Report, 201341*
2013–14 22 (7–42) 51 10,899 South & Midlands England Collins, 201642
2014 30.1 (7.3–60.6) 43 5,620 Midlands England Randall et al., 201943
2015–16 31.6 (6–65) 61 14,700 England, Wales Griffiths et al., 201844
2019 10.5 (6.6–35) 20 19,240 Scotland, England, Wales Bell et al., 202045
Source: Compiled by AHDB, based on various sources Key: N/A = Not available*Note: Part of a lameness intervention study and lameness prevalence reported are prior to intervention on farm
The table illustrates that prevalence estimates in UK dairy cattle have remained high over the past decade. The wide ranges observed demonstrate that some manage to control lameness better than others through improved prevention, detection and treatment. Reducing the prevalence of lameness on farm continues to be a priority area and is a long-term objective of the Dairy Cattle Mobility Steering Group.
Industry initiative: Healthy Feet Programme Lite The AHDB Healthy Feet Programme (HFP)46 is the industry’s main vehicle through which a targeted and planned approach to lameness reduction can be applied on individual farms, with the support of experienced and qualified advisers or mobility mentors. In 2020, there were 130 mobility mentors across GB.47 AHDB also launched the first phase of ‘HFPLite’ in 2020, a streamlined version of the full HFP, to registered foot trimmers. HFPLite is expected to be launched to farmers in early 2021 and is suitable for farms with specific problems or for those that want to take a small first step towards improvement.

44
Industry initiative: Register of Mobility Scorers There have been many initiatives to improve the mobility of the British dairy herd, but the lack of reliable and consistent scoring has hampered progress. The AHDB dairy mobility score is the accepted industry standard for monitoring lameness on farm. In 2017, the Register of Mobility Scorers (RoMS)48 was set up. This is an independent, self-regulated body which encourages the widespread use of standardised, independent mobility scoring conducted by trained and accredited scorers on British dairy farms. Now with 482 registered members – more than double the numbers of two years ago – and 12 approved trainers, RoMS aims to improve the mobility of the British national dairy herd by improving the quality and accuracy of mobility score data provided to producers and their advisers.
Industry initiative: Digital dermatitis Digital dermatitis data has been collected as part of the National Bovine Data Centre’s dairy breed societies’ classification process for many years and has been used as part of the Lameness Advantage49 calculation since 2018. However, many producers are keen to know which bulls specifically transmit better resistance to digital dermatitis to their daughters, so from April 2020, it has been made available to producers as a standalone index. The Digital Dermatitis Index (DD)50 is expressed on a scale of about -2% to +2%, with positive figures being desirable. Daughters of a bull with a +2% DD are expected to have 2% fewer cases of digital dermatitis than daughters of a bull whose DD is zero.
Industry research on the treatment of foot lesionsHoof horn lesions such as sole ulcer, white line disease and sole bruising are the most common causes of lameness on many farms, but causes and prevention of these lesions are poorly understood. To protect the foot, the cow has a fat pad called the digital cushion. Its job is to dissipate force during foot strike when the cow walks. AHDB-funded research conducted by the University of Nottingham shows that cows that lose body condition score to peak yield are mobilising fat, which thins the fat pad and interferes with its ability to perform its cushioning role when the cow walks (Figure 22).
Since then, a separate trial has investigated treatment methods for hoof lesions. Mildly lame and chronically lame cows were randomly treated with one of four treatments, which included a foot trim, a block and a course of anti-inflammatory drug ketoprofen for three days. The results found that mildly lame cows who received a trim, plus block and the anti-inflammatory were significantly more likely to be non-lame five weeks later. However, the cure rate dropped significantly in chronically lame cows, regardless of the treatment method. This highlights that irreversible damage to the bone in the foot can occur and make an individual cow more susceptible to future lameness incidence. These findings have now paved the way for a long-term, three-year trial on a commercial farm to evaluate the impact of targeted treatment with anti-inflammatories.
Figure 22. MRI Images of the feet of dairy cattle with a low volume (left) and high volume (right) of digital cushionSource: ©University of Nottingham Note: Yellow denotes the location of the digital cushion within the claw capsule.

4544
Genetic impact on foot lesionsGenetic differences have been found between individual animal susceptibility to hoof horn lesions development. Through a project funded by BBSRC and AHDB, researchers from SRUC, the University of Liverpool, and the Royal Veterinary College are studying susceptibility factors in 2,700 Holstein cows from four British commercial farms. As a result, the project will (i) determine and quantify the impact of different factors affecting the development of hoof horn lesions; (ii) identify and quantify the genetic background of resistance to the development of hoof horn lesions; and (iii) develop practical breeding strategies and tools to reduce the incidence of hoof horn lesions while maintaining improvement in other important animal traits (fertility, resistance to other diseases and productivity).
Industry research on the effect of trimmingA risk factor in lameness is over-trimming, but there is relatively little up-to-date information available on best practice. A current study is collating and evaluating GB claw-trimming practices to identify current variations in foot-trimming technique within a group of qualified foot trimmers and how these may influence trimming outcome. This will better inform recommendations to on-farm foot trimmers conducting routine preventative trimming.
Breeding and geneticsNew economic index specific to autumn block-calving dairy herdsTo assist farmers in making the most appropriate breeding choices suited to their farming system, a new economic ranking index, specifically geared towards autumn block-calving herds, was introduced by AHDB. This new index sits alongside the existing Spring Calving Index (£SCI) and the long-standing Profitable Lifetime Index (£PLI) for all-year-round calving herds. The Autumn Calving Index (£ACI) is an across-breed genetic ranking index developed in consultation with industry partners specifically for autumn block-calving herds and expressed as a financial value (Figure 23).
The £ACI: • Promotes milk quality with more weight on volume than the £SCI
• Places strong emphasis on fertility
• Selects for reduced maintenance cost
• Improves udder and leg health
• Places strong emphasis on longevity
• Promotes easier calving
• Improves functional type – Feet & Legs and Udders
Figure 23. Weightings of traits within the new Autumn Calving Index (£ACI) Source: AHDB
Production
Survival
Udder health
Leg health
Calving ability
Efficiency
Fertility
10.9
30.4
1821.4
14.1
Weightings of traits within the £ACI (%)
3.31.9

46
New health traits for dairy breedersCalf Survival, Lameness Advantage and Mastitis Indexes have not only been released as stand-alone indexes for farmers to use, they have also been incorporated into the Profitable Lifetime Index (£PLI), Spring Calving Index (£SCI) and Autumn Calving Index (£ACI), which will influence bull semen purchases and thereby drive industry genetic improvements. The Calf Survival Index,51 published in April 2018, is available for all bulls evaluated in the UK and genomically evaluated Holsteins. It means bulls can now be selected for progeny which stand a better chance of survival from tagging to 10 months of age. Lameness Advantage,52 also launched in April 2018, enables dairy farmers to reduce the incidence of lameness in their herd through direct genetic selection. Released in April 2017, the Mastitis Index53 allows farmers to breed cows with improved resistance to mastitis. Although there is a strong link between the Somatic Cell Count (SCC) Index and a reduction in mastitis cases, there is a small number of bulls who reduce SCC but not necessarily cases of mastitis – this index will help to identify those bulls and allow farmers to make more informed breeding decisions for their herd.
Beef estimated breeding valuesGenetic evaluations for beef cattle continue to be administered by the beef breed societies and delivered through Breedplan, SRUC and Signet Breeding Services.54 Table 24 shows the difference in estimated breeding values (EBVs) between the top 10% and bottom 10% of animals for calving traits within each of the six most popular UK beef breeds. The level of variation between the animals of highest and lowest genetic merit shows there is scope for further improvement by selecting animals of high genetic merit for breeding. Across all six breeds in the table, the average calving ease direct difference is 8%, which translates to a 4% difference in the number of unassisted calvings that could be expected in bulls purchased between the top and bottom 10% of the breed.
Table 24. Calving-related EBVs from the top and bottom 10% of 2018-born animals for the six most popular UK beef breeds
BreedEBV difference
Calving ease direct (%)
Calving ease daughters (%)
Gestation length (days) Birth weight (kg)
Limousin 4.2 1.7 -4.0 -3.3
Angus 8.7 5.5 -2.6 -3.8
Charolais 16.9 10.8 -2.2 -3.4
British Blue 2.1 1.6 -1.6 -2.7
Simmental 9.6 5.8 -2.1 -3.5
Hereford 8.8 6.7 -2.3 -1.5
Average 8.4 5.4 -2.5 -3.0
Source: British Limousin Cattle Society and ABRI BreedplanNote: Lower values are desirable for gestation length and birth weight traits.
Harnessing commercial data sources for genetic evaluationsWhile the dairy industry has successfully utilised the wealth of phenotypic data available through milk-recording schemes, there is no equivalent data source for beef cattle. However, there are still opportunities to harness commercial data sources for beef genetic evaluations. In late 2018, AHDB launched AHDB National Beef Evaluations, the first phase of which includes EBVs for commercial carcase traits, based on data supplied by UK abattoirs, BCMS and pedigree breed societies. AHDB National Beef Evaluations are the only source of EBV information to allow beef producers to compare figures between breeds, with data available for all beef breeds.
As a result of work carried out by AHDB in conjunction with SRUC, it is anticipated that five new EBVs will be added to the current national beef evaluation offering in 2020, two of which are directly linked to cattle health and welfare.

4746
Figure 24. Using AHDB National Beef Evaluations when making breeding decisions will help breed efficient cattle that meet the needs of the target marketSource: AHDB
Industry initiative: TB Advantage for beef herdsBuilding on the work carried out by SRUC and AHDB to produce the TB Advantage Index55, the beef TB Advantage EBV is to be launched in 2020, using the same data sources to provide an estimate of genetic merit for TB resistance in beef cattle. The heritability of TB resistance in beef cattle has been estimated at approximately 10%, providing a good opportunity for producers to tackle the issue of TB through improved breeding as well as management practices. As the beef TB Advantage phenotype has no relationship with slaughter traits, selecting bulls with high genetic merit for TB resistance will not impact on productivity.
Take our industry higher Shout about the sire
Don’t know who the sire is? AHDB Beef & Lamb have tools to help you record breeding information more accurately, making it easier to record the sire when registering calves.
ahdb.org.uk/shout-about-the-sire
There are now carcase trait EBVs that will help you choose a bull based on the things you
get paid for
These EBVs can only be
generated if you record the
ear tag number of the sire when
registering a calf with BCMS
The more sires that are registered, the more
accurate the EBVs will be
SIRES OF DAIRY BRED CALVES MATTER TOO!
Did you know?
But it’s not all about EBVs By naming the sire at calf registration, you will be• Generating data to make decisions about your herd breeding strategy
• Elevating the industry to be more competitive in changing times
• Making your livestock more attractive to potential buyers
• Creating consumer trust through traceability
of all prime beef in England is a product of the dairy herd
CURRENTLY, ONLY
30%OF SIRES ARE
REGISTERED ON BCMS

48
18 Tried & Tested, Feed Planning for Cattle and Sheep 19 AIC, Feed Adviser Register20 QMS, Cattle & Sheep Enterprise Profitability in Scotland data 21 Farm Post Mortems Ltd22 NMR reports 2018 and 201923 AHDB funding has supported the collation and analysis of udder health data from 218 ‘sentinel herds’; the Sentinel Herds project is part of the AHDB Dairy Research Partnership24 Mastitis Control Plan, Green et al., 200725 AHDB, QuarterPRO26 National Bovine Data Centre27 AHDB, 2019. The InCalf guide for GB farmers calving all year round28 AHDB, 2019. The InCalf guide for GB farmers with block-calving herds29 NMR/VEERU, 2019. Key Performance Indicators for the UK national dairy herd: A study of herd performance in 500 Holstein/Friesian herds for the year ending 31st August 201930 TotalVet, User benchmarking31 AHDB, 2020. Dairy performance results 2018/1932 AHDB, Farmbench33 Clarkson et al., 1996. Veterinary Record, 138, 563–567 34 Whay et al., 2003. Veterinary Record, 153, 197–20235 Huxley et al., 2005. Dissertation for the RCVS Cattle Health and Production Diploma36 Rutherford et al., 2009. Veterinary Record, 180, 95–109 37 Haskell et al., 2006. Journal of dairy science, 89, 4259–426638 Barker et al., 2010. Journal of dairy science, 93, 932–94139 Shepherd, 2016. ResM Thesis. Duchy College working with University of Plymouth40 Heath et al., 2014. Welfare Quality 23, 95–10741 RDPE Report, 2013. Reaseheath College42 Collins, 2016. PhD Thesis. Royal Veterinary College, University of London43 Randall et al., 2019. Veterinary Record, 184, 35044 Griffiths et al., 2018. Frontiers in Veterinary Science, 5, 6545 Bell, N. J. et al., 2020. Assessing health and welfare potential on 20 housed dairy herds. AHDB,
University of Nottingham and Royal Agricultural University. Manuscript in preparation46 AHDB Healthy Feet47 AHDB, Mobility Mentors48 Register of Mobility Scorers49 AHDB, Lameness Advantage50 Digital Dermatitis Index51 AHDB, Calf Survival Index52 AHDB, Lameness Advantage53 AHDB, Mastitis Index54 AHDB, National Beef Evaluations55 AHDB, TB Advantage

4948
Calves
Calf registrationsThe number of all female and male, dairy and beef calves registered in Great Britain is shown in Figure 25. In 2019, over 2.6 million calves were born in GB. Data shows a 0.56% decrease in the number of calves registered in 2019 compared with 2011.
1,200,000
1,000,000
800,000
600,000
400,000
200,000
02011 2012 2013
Dairy female Dairy male Beef female Beef male
2014 2015 2016 2017 2018 2019
All c
alf r
egist
ratio
ns
Figure 25. All calves registered from beef and dairy herds in GB between 2011 and 2019 Source: AHDB
Dairy calf registrationsIn 2019, 746,005 calves were registered as a dairy breed in Great Britain. Dairy female registrations have remained similar since 2011, with 471,296 female dairy calves being registered in 2019, having risen to a peak in 2015 at 519,641, before falling steadily again following a drop in milk price. Overall, dairy male registrations have slowly declined from 2012 to 2019 (also Figure 25).
Registration of beef-sired calves from a dairy-bred dam The number of beef-sired calves in the dairy herd has increased by 39.3% since 2011. These numbers suggest that dairy producers are actively using beef semen to breed from cows that are not going to produce replacement heifers. This follows on from the 2015 drop in milk price and suggests that dairy producers may have also begun using more sexed and beef semen to reduce numbers of excess dairy-sired bull calves (Figure 26). Industry breeding strategies have also helped to promote the use of sexed and beef semen in the dairy industry.

50
350,000
300,000
250,000
200,000
150,000
100,000
50,000
0
Beef
cal
ves
from
dai
ry h
erd
2011 2012 2013
Beef female Beef male
2014 2015 2016 2017 2018
Figure 26. Number of beef-sired male and female calves born from a dairy-registered dam in GB Source: AHDB
Industry initiative: #Breed4Better To assist dairy farmers moving towards breeding programmes that use sexed semen and beef semen, AHDB launched an online semen usage calculator56 that can help run different semen usage scenarios. As well as the semen usage calculator, herds that milk-record can identify the best heifers to breed from by using the AHDB Herd Genetic Report. This allows farmers to not only identify the most productive cow genetically, it also helps to select those that have positive fertility traits to ensure the best chance of conception to sexed semen. Throughout 2019, AHDB ran a social media campaign to highlight the benefits of sexed semen called #Breed4Better.57
Dairy-sired bull calves In 2013, the number of unregistered dairy-sired bull calves (i.e. estimation of calves euthanised assuming a 50:50 birth ratio with dairy-sired females) was at an all-time low due to high beef prices, meaning there was more demand for calves, thus they were registered and reared. This was helped by the high price for dairy-sired bull calves in auction markets in 2012. The horsemeat scandal58 in 2013 also resulted in an increased demand for manufacturing beef, as provided by dairy-sired bulls and steers.
These markets spiked at unnaturally high levels in 2013 and beef prices crashed in 2014. The result of this is that estimated numbers of unregistered dairy-sired bull calves have risen steadily since 2013. Estimates from 2016, 2017 and 2018 data show that, on average, 395,000 dairy-sired bull calves are born in GB. From this, approximately 280,000 enter the beef supply chain and 60,000 are euthanised on farm. This is a move in a positive direction, with numbers reducing again to reach levels similar to those in 2012 and 2013 when demand for dairy-sired beef was strong.
Sexed semenIncreased usage of sexed semen is one way of reducing the numbers of bull calves born in the dairy herd. Data collected by AHDB indicates a steady increase in purchases of sexed semen over the past eight years, from 12.3% of semen sales in 2012 to 51.3% in 2020 (Table 25). Sexed semen usage will continue to rise as confidence in the technology grows, more semen is sexed and the premium over unsexed semen reduces.

5150
Table 25. Sexed semen sales as a percentage of total national semen sales
Year Sexed semen sales as % of national total
2020 51.3
2019 31.9
2018 24.1
2017 17.9
2016 15.9
2015 16.6
2014 15.4
2013 14.4
2012 12.3
Source: AHDB
Industry initiative: Ultimate breeding strategy With industry changes geared towards reducing the number of dairy bull calves conceived, Cogent launched its ultimate breeding strategy in 2019.59 In this strategy, Cogent will provide breeding tools to farmers to ensure they can breed the best heifer replacements for their herd while producing consistent and quality calves for the beef supply chain.
Supply-chain initiatives to reduce euthanasiaAs part of their contract, a number of retailers do not permit farmers to euthanise or export dairy-sired bull calves. Some of these retailers protect their farmers from market volatility by providing a pricing mechanism that is decoupled from the calf market.
There are other positive examples of how the supply chain is trying to develop markets for dairy-sired bull calves. Retailers including M&S, Co-operative, Waitrose and Morrisons now have calf schemes in place to help ensure rearing dairy-sired bull calves is economically possible.
In 2019, Arla UK 360, a programme through which Arla farmers and their whole supply chain quality-assure food production from cow to consumer, announced that from Jan 2021 no healthy calf will be shot or slaughtered before eight weeks of age. Retailer Morrisons has been working with beef-rearing partner Buitelaar since 2009 to develop the dairy-sired beef market, and in 2019, Morrisons announced a dairy-sired bull calf supply deal with Arla. The supermarket chain will be accepting dairy-sired bull calves from farmers participating in Arla UK 360, and Arla UK 360 producers will be able to sell dairy-sired bull and beef-bred calves into the calf-rearing units of Buitelaar.60
Industry initiative: Dairy bull calf strategyIn 2019, a cross-industry coalition outlined a vision for the dairy industry to rear all calves with care and eliminate the euthanasia of calves by 2023. As a top priority for the industry, a national dairy-sired bull calf strategy, launched in 2020, is turning the vision into a commitment. Industry collaboration across the supply chain is vital to deliver against the priorities set out in the strategy61 – see Appendix 1. At the time of publishing, a new Red Tractor assurance standard was being proposed to deliver on this commitment. The first of these standards focuses on reducing the number of calves born without a market through responsible breeding strategies. Every Red Tractor-assured farmer will have to have a written breeding and management policy in place, which is implemented to eliminate routine euthanasia of calves.

52
Calf mortalityCalf mortalityA significant proportion of on-farm mortality occurs before three months of age. BCMS data shows mortality rate of calves less than one month of age reduced from 2.41% in 2018 to 2.3% in 2019. On-farm mortality of calves less than one month was at its lowest level for dairy heifer calves in nine years, and the second lowest for dairy bull calves, although differences between years are relatively small (Figure 27).
4.5
4
3.5
3
2.5
2
1.5
1
0.5
02011 2012 2013 2014 2015 2016 2017 2018 2019
Dairy female Dairy male Non-dairy female Non-dairy male
Mor
tality
rate
(%of
regi
ster
ed c
alf
birth
s dy
ing
with
in o
ne m
onth
)
Figure 27. On-farm mortality of calves that died on farm less than one month of age in GB between 2011–2019 Source: BCMS, compiled by the University of Nottingham
Pre-weaning calf mortality is an important determinant of dairy enterprise profitability and an indicator of animal welfare. While there is published evidence of the range of pre-weaning mortality rates across different countries and farms, little is known about the causes of mortality. A farmer in receipt of this information could theoretically allow targeted control measures to be put in place to reduce losses.
A review was carried out of all diagnostic carcase and viscera submissions submitted to SRUC Veterinary Services (SRUC VS) between 2014 and 2018. Standardised post-mortem and sampling techniques were used for each case. This review sought to provide information on the major causes of mortality in pre-weaned calves in Scottish dairy herds.
A total of 614 submissions were analysed, and a definitive diagnosis was reached in 603. This highlights the value of a post-mortem examination in this age of calf. Overall, 1,017 diagnoses were made, with infectious disease responsible for 69% of deaths. Nutritional problems accounted for a further 25% and the final 6% represented individual calf issues, such as congenital deformities or bovine neonatal pancytopaenia. When suitable samples were available, calves less than seven days of age were screened to assess colostral antibody transfer. Where hypogammaglobulinaemia was detected, it was considered to predispose calves to ‘deaths from other causes’.
The most common causes of mortality are shown in Table 26. Pneumonias made up approximately 34% of the diagnoses, with Mycoplasma bovis the most common cause of pneumonia-related deaths. Enteric pathogens resulting in diarrhoea made up 34% of the diagnoses, with cryptosporidia the most frequently diagnosed.

5352
Table 26. Most common causes of pre-weaning dairy calf mortality in Scottish dairy herds between 2014–2018
Cause Percentage of calves affected (%)
Cryptosporidia 21
Rumen drinking 16
Rotavirus 11
Salmonellosis due to S. Dublin 10
Colisepticaemia 8
Navel ill 7
Pneumonia due to Mycoplasma bovis 7
Pneumonia due to Mannheimia haemolytica 6
Pneumonia due to Trueperella pyogenes 6
Pneumonia due to Pasteurella multocida 5
Source: SRUC VSAcknowledgements: SRUC VS receives financial support from the Scottish Government for farm animal disease surveillance activities.
It was considered that a nutritional component had played a role in the death of 26% of calves, with rumen drinking accounting for the majority. Cases of suspected underfeeding were not included in this total as feeding volumes were not known for all calves. Rumen drinking occurs when the rumeno-reticular groove fails to divert milk from the oesophagus to the abomasum. Fermentation of milk deposited in the rumen results in acid accumulation and predisposes to yeast colonisation. It is often a result of management practices, such as bucket feeding, irregular feeding times or feeding milk at the incorrect temperature or height. Neonatal diarrhoea and stressful events, such as transport or mixing of calves, can play a role.
Industry research: Rumen drinkingIn one research study, the feeding history of calves with rumen drinking was compared with that of control calves that had died of non-nutritional causes, where the feeding method was not considered to have impacted on the cause of death. Rumen drinkers were more likely to be fed from an open bucket with no teat (odds ratio 4.35, 95% confidence intervals 1.91–9.87); less likely to be fed from an automatic feeder (odds ratio 0.13, 95% confidence intervals 0.05–0.31); and more likely to be fed a low volume of milk (≤4 litres a day, odds ratio 4.5, 95% confidence intervals 1.01–20.11). Notably, only rumen drinkers had been fed waste milk.
These findings confirm much of the previous research on factors that predispose to rumen drinking and illustrate that changes to management can reduce the risk. The data was obtained as a result of passive surveillance, so may not be fully representative of calf mortality on all dairy farms, but it nonetheless highlights the contribution post-mortem examinations can make when building up a comprehensive picture of calf health. The fact that 26% of deaths had a significant nutritional component demonstrates the importance of feeding management in ensuring the health and welfare of dairy calves.
Highlighting the causes of suckler calf lossThe following results are from a two-year study into the causes of calf loss from suckler herds. The project, funded by Livestock Health Scotland and run by SRUC Veterinary Services, monitored ‘calves weaned per cow to the bull’ for around 1,800 cows in 14 herds over two consecutive seasons. All calf deaths (abortions, stillbirths, or older calf losses) were submitted for post-mortem examination to determine the cause.

54
In 2019, 83% of cows produced a weaned calf – a slight improvement on the 82.4% of 2018 (Figure 28). Fertility in 2019 was poorer, however 2% fewer calves were conceived, and abortion rate stayed steady at around 3%. The improvement in performance was all from reduced stillbirths and neonatal and older calf losses, which halved from 7% to 3.6%. Across the 14 herds, seven weaned more calves in 2019 versus 2018.
2018
94.0%
92.0%
90.0%
88.0%
86.0%
84.0%
82.0%
80.0%
78.0%
76.0%2019
Neonatal Abortion Cow deathStillbirthOlderWeaned
Per 1
00 c
ows
to th
e bu
ll
Figure 28. Calf loss per 100 cows to the bull; data from 1,800 cows across 14 herds Source: SRUC Veterinary ServicesAcknowledgements: SRUC VS receives financial support from the Scottish Government for farm animal disease surveillance activities.
Other key findings in the study are summarised below:
• Fertility is the bedrock of achieving a high weaning rate. Subfertile bulls caused problems in both years. One herd saw fertility drop by over 15% in 2019 due to a subfertile bull. Infectious diseases, including Campylobacter, also reduced fertility and increased abortions in the study. Pre-breeding bull fertility examinations are essential for consistently achieving a high weaning rate
• Abortion rate remained high in both years of the study. Six herds had abortion levels below ~2% in both years, indicating that risk of abortion is not even across herds. The primary known cause is exposure to feedborne or environmental infections from poor silage, mouldy bedding or dirty water troughs. Attention to feed quality, clean bedding and clean water can reduce the risk of abortion
• Stillbirth rate reduced to 1.7% on average in 2019, with three herds consistently achieving less than 1% stillbirth. The major cause of stillbirth was delayed or difficult calvings. Stillbirth rate dropped from over 3% to less than 1.5% after installing calving cameras in one herd. Very low stillbirth rates (<1%) are consistently achievable and higher rates should be investigated
• Neonatal deaths (in the first week of life) reduced to 0.9% in 2019. Poor colostrum intake was the primary cause of losses. One herd reduced losses from over 6% to around 1% by paying closer attention to colostrum uptake in the first 4 hours after birth (also eliminating older deaths through better colostrum). Colostrum uptake is vital and can be a ‘quick win’ for improving weaning rates in some herds
• Older calf deaths reduced to 1% in 2019, and most herds (9/14) averaged less than 1%. Pneumonia is the biggest cause of death at this stage. Colostrum can be vital at this stage too, but in problem herds, vaccination programmes and general immunity (e.g. vitamin E/selenium status) should also be considered. Losses over 1% in older calves should be investigated, with a focus on pneumonia causes and risk factors

5554
Young fallen stock Data from Farm Post Mortems Ltd in County Durham provides details of post-mortem examinations on many of the fallen stock collected from around 8,000 farms in southern Scotland and northern England. This data is derived from a carcase-based post-mortem service operating in the north-east of England at a fallen stock collection centre, run by Farm Post-Mortems Ltd (Ben Strugnell).62
Farmers request post-mortem examination at the time of carcase collection. Reports are sent to the farmer and their vet. Some bias may be introduced, insofar as only carcases for which a post-mortem examination is requested are included in the data. Furthermore, as the data only covers the north-east of England, it may or may not reflect the frequency of diagnoses made in other parts of the UK.
This data is derived from carcase submissions to Farm Post Mortems Ltd between January 2018 and the end of November 2019, and so covers almost two years. A total of 328 suckler calf carcases were submitted over this period, and the top 10 most common diagnoses are shown in Figure 29.
50454035302520151050
Freq
uenc
y
Nave
l Ill
Pneu
mon
ia – b
acte
rial
Pneu
mon
ia (ch
ronic
)
Colis
eptic
aem
ia
Inte
stina
l tors
ion
None
Selen
ium d
efici
ency
Abso
mas
al ulc
erat
ion
Copp
er d
efici
ency
Dyst
ocia/
stillb
irth
Diagnosis
Figure 29. Ten most common diagnoses in suckler calves January 2018 – November 2019 Source: Farm Post Mortems Ltd
Detailed diagnostic criteria are available, but, fundamentally, if a diagnosis can be made on gross post-mortem findings, then generally this is done, because any further testing is at the expense of the farmer or producer. Therefore, detailed laboratory confirmation of every diagnosis may not be performed. Nevertheless, it is worth noting that many of the common diagnoses can be made with minimal further diagnostic testing (e.g. IBR, traumatic reticulitis).
Industry initiative: Beef Calf Survival The calf survival EBV allows producers to select for progeny which stand a better chance of survival from tagging to 10 months of age (equivalent to the Dairy Calf Survival Index). Calf survival EBVs were released for Limousin animals in 2018 through the British Limousin Cattle Society, and inclusion of this trait into the national beef evaluation will allow producers to select for improved survival across all beef breeds.

56
Industry research into dairy calf rearingFunded by AHDB, Scotland’s Rural College (SRUC) is conducting a project investigating the use of a range of monitoring tools to aid early disease detection in calves and inform the development of alternative health management options.63
The project tested a number of monitoring techniques that target different physiological functions, including core body temperature, activity, feeding behaviour and feed intake. In each case, the equipment has been assessed against the stockman’s assessment of visual symptoms and a full health score taken daily by trained technicians.
The technologies being tested include:
• Automatic calf feeders to provide data on total milk intake per day and feeding behaviour
• Activity data from individual calves using leg-mounted sensors
• Thermal imagery to measure temperature at the inner corner of the eye, in order to predict deep body temperature
• Temperature-sensing ‘fever’ ear tags fitted to each calf on entry to the group pens and removed at the start of weaning
Behavioural information from both the automatic calf feeders and activity sensors proved to be the best predictors of calf health status. Body temperature is an important indicator of disease; however, thermal imagery did not estimate core body temperature sufficiently accurately. The fever tag provided promising results in the ability to predict calf disease status, however refinements are necessary (size, weight, attachment mechanism) for optimal use on farm.
Based on these results, the automatic-calf-feeder data and the activity data have been combined and used in commercial trials, in partnership with Blade Farming Ltd/ABP Food Group. Calf activity and lying behaviour were recorded, as well as calf weights from weigh scales behind milk feeders, and milk machine data, including:
• Total number of visits to the machine
• Number of visits to the machine where milk was consumed
• Total amount of milk consumed
• Average amount of milk consumed on each visit
This data has been incorporated into an algorithm that sends an alert to the stockperson, alerting them to potentially ill calves, allowing the calves to be treated sooner. Calves from the commercial trials will also be followed through to slaughter to assess the implications of disease in early life on lifelong production efficiency, with results expected in autumn 2020.
Figure 30. Leg-mounted sensors and automatic feeders used to monitor calf healthSource: SRUC

5756
56 AHDB, Semen usage calculator57 #Breed4Better58 BBC, 10 April 2013. Q&A: Horsemeat scandal59 The Ultimate Breeding Strategy60 Arla Foods, 30 July 2019. Morrisons opens up beef supply chain to help farmers transitioning to Arla UK 360 standard 61 GB Dairy calf strategy; also see Appendix 162 Farm Post Mortems Ltd63 AHDB, Monitoring calf health

58
Infectious disease
Cattle Health Certification StandardsCattle Health Certification Standards (CHeCS) – the industry-owned and run organisation that regulates, standardises and quality-controls cattle health schemes in the UK and Ireland – has developed a set of standards for the control or elimination of a number of infectious cattle diseases. It audits and licenses a number of cattle health schemes to ensure they are adhering to these standards. The diseases it includes are Bovine Viral Diarrhoea (BVD), Infectious Bovine Rhinotracheitis (IBR), Johne’s disease, Leptospirosis and Neospora.
Disease control programmes operate at a herd level and involve working with the herd vet to systematically test animals through the schemes’ laboratory facilities. Elevated biosecurity on farm, inspected and signed off by the vet, is also an integral principle of CHeCS and is a concept that works across all infectious diseases. For this reason, TB was added to CHeCS’ disease ‘portfolio’ in 2016, with the development of TB Herd Accreditation – a points-based programme which recognises adherence to specific biosecurity measures (TB testing remains a statutory activity managed centrally by government). This development was supported by Defra and the Welsh Government, with minor derogations to TB rules awarded to participating farmers.64 In 2020, Defra announced it intended to increase its recognition for participating farmers by increasing the derogations and also rewarding farmers who adopt an ‘entry-level’ form of TB Herd Accreditation which includes a ‘no regrets’ set of biosecurity measures to reduce risk of the spread of TB.65
In late 2019, the CHeCS technical document66 was revised by its technical board; one key addition is a stipulation that farms participating in CHeCS-licensed health schemes will be subject to random audit-based visits by CHeCS representatives to ensure that the CHeCS standards are being maintained.
Bovine Viral DiarrhoeaBVDFree EnglandThe voluntary programme to eliminate Bovine Viral Diarrhoea (BVD) virus from all cattle herds in England, BVDFree, was launched on 1 July 2016. At the end of March 2020, after almost four years of operation, BVDFree was working with 5,800 registered cattle holdings in England and 700,000 cattle were covered by the scheme (over 35% of the English breeding herd). More than 250,500 individual BVD statuses were online at this point, all of which are searchable by UK tag number. There were also 507 CHeCS-accredited BVD herd statuses which had been uploaded to the database.
BVDFree launched a ‘BVDFree Test Negative’ herd status in March 2018. A farmer and vet login function was added in October 2018, allowing farmers to access the BVDFree database and track their herd’s progress towards BVD elimination. Also, a quarterly reporting system was launched in October 2019, sending updates and reminders out to farmers and vets about the test results held on the database and what steps to take next in their journey. The aim is to add further value for those farmers who have joined and are participating in the voluntary scheme.
At individual farm level, a growing number of herds exist where BVD elimination and/or accreditation has been undertaken, but as many of these are yet to join BVDFree, determining numbers and realising the full benefits offered by a coordinated approach remains a challenge. The longer-term aim is that with more widespread industry engagement and promotion, BVDFree can make information on BVD status more easily available to buyers and develop market demand for animals free of BVD, thus providing value and tangible benefits for participants.
In June 2018, Defra made £5.7 million of funding available in England through the Rural Development Programme for England (RDPE) for the ‘Stamp out BVD’ programme. The programme, delivered by SAC Consulting, has pulled together ‘clusters’ of cattle keepers to work together against BVD, using vet practices, by sharing best practice and tackling BVD as a group who share the goal of eradicating the virus from their herds. The funding has also enabled farmers to access farm advisory visits by a veterinary practitioner to investigate BVD at farm level, to carry out appropriate testing and to propose action plans to control and eliminate BVD from their farms.

5958
The aim of the ‘Stamp out BVD’ programme is to engage 50% of breeding herds in England (dairy and beef) in BVD control by 2021; they are currently well on their way, with 34% now participating and all funding currently allocated.
BVD eradication in ScotlandScotland’s industry-led BVD eradication scheme started as a voluntary programme in 2010 and became mandatory in 2013. The scheme focuses on breeding herds, as the source of new persistently infected (PI) animals. The scheme continues to have strong support from cattle keepers and their vets.
The national eradication plan in Scotland has advanced through five phases to date. Phase 5 aims to ‘Protect negative herds at all costs’ and has increased controls on herds with BVD-positive animals in order to protect neighbours and potential purchasers. Phase 5 implemented new controls from 1 December 2019,67 introducing a PI locator, implementing compulsory BVD investigations and adding further movement restrictions. The changes reward keepers who are fully engaged by protecting their status and limiting the likelihood of infection and by giving them valuable information and holding other keepers accountable for non-action.
Phase 5 also established stricter conditions for BVD-positive herds (those with one or more PIs) and increased the obligations of long-term BVD not-negative herds. It is now illegal to retain a BVD-positive animal unless it is housed separately from cattle of negative or no BVD status and illegal to bring animals in to a BVD-positive herd. The measures are in place to protect neighbouring herds and reduce the amount of disease in circulation, and it is anticipated that the additional inconvenience of retaining BVD-positive animals on farm may help keepers to make the decision to remove them from the herd.
The industry has responded well to Phase 5 and an increase in testing has been observed, with identification of more BVD-positive animals that were previously undisclosed. The rate of removal of positive animals has also increased, as keepers take the best-practice approach of removing them promptly.
Gwaredu BVD In September 2017, Gwaredu BVD (Eradicating BVD) was launched to eradicate BVD from the Welsh national herd.68 The voluntary scheme, funded by the Welsh Government’s Rural Development Programme, is managed by Coleg Sir Gâr’s Agriculture Research Centre, in partnership with the Royal Veterinary College (RVC). It delivers on one of the main priorities in the Wales Animal Health and Welfare Framework Group. The key approach of Gwaredu BVD is youngstock screening – the blood sampling of five youngstock in each management group within the herd. This can be done at any visit by the farm vet but typically happens during the annual TB test. Samples are sent to a laboratory and the results are ready with the reading of the TB test. By testing youngstock, the programme aims to identify herds that have BVD antibodies present on the farm. If the herd test is positive, the farmer can access further support through Gwaredu BVD to find the persistently infected (PI) animals in the herd.
Gwaredu BVD was originally available to all 11,500 farms in Wales for three years, but in July 2020, the Welsh Government announced that funding for youngstock screening has been extended from 31 August 2020 to the 31 March 2021, with financial support now available to hunt PIs until the end of 2022.69 Currently, over 7,500 herds have been tested and approximately 70% of these herds had negative BVD test results. In autumn 2019, a paper was submitted to Welsh Government detailing a three-phased approach for legislation to eradicate BVD in Wales; this was due for consultation in early 2020.70

60
Johne’s disease Johne’s disease is a chronic, progressive, wasting condition of cattle caused by the organism Mycobacterium avium subspecies paratuberculosis (MAP) and is endemic in the UK. The infectious agent is shed in large numbers in faeces, can cross the placenta and can be found in colostrum and milk. Animals are generally infected by ingesting the agent and young animals are considered to be the most susceptible to infection.
ResearchResearch to improve understanding of the epidemiology of Johne’s disease at the Royal Veterinary College has been funded through the AHDB research partnerships to help underpin control strategies.
Calves born to MAP-positive dams are thought to be at a higher risk of becoming infected, as their dams are expected to be excreting high quantities of MAP in colostrum and faeces, which may contaminate the calf during parturition or suckling. Findings from an RVC longitudinal study that followed a cohort of 440 UK dairy cows in six herds found evidence to support the current understanding that MAP-positive dams are more likely to have MAP-positive offspring than MAP-negative dams but have also shown that offspring are more likely to seroconvert if the dam herself seroconverts later in life (i.e. even if they are negative at the time of calving). These findings may help explain some of the current difficulties in eliminating Johne’s disease from infected herds and is valuable information for future management of the disease on farms.71
One of the challenges with Johne’s disease is the uncertainty related to the diagnostic tests. Using a data set built through a large quarterly screening programme, the mean specificity and sensitivity of the milk ELISA test were estimated at 99.5% and 61.8%, respectively. The results also showed there is considerable potential for more targeted use of serological testing, including adjusting the testing frequency and implementing a posterior probability approach.72
There have been concerns the single intradermal cervical comparative test (SICCT) used to determine bovine tuberculosis (TB) status in the TB eradication scheme in the UK may interfere with the milk enzyme-linked immunosorbent assay (ELISA) results for Johne’s disease. Johne’s disease milk ELISA test results from a cohort of 466,374 cows in the UK were used in a study of the association between Johne’s disease milk ELISA test results and time interval between TB testing and Johne’s disease testing. The results provided strong evidence that TB testing (SICCT) affects the serological response of cows against MAP in different ways depending on whether the cow is infected or not. The probability of infected cows testing positive increases immediately after TB testing, while the probability of non-infected cows falsely testing as positive during the same time window is not increased. To increase the accuracy of Johne’s disease milk ELISA testing, immediate Johne’s disease testing after TB testing (1–5 days) could be of potential benefit, especially in higher-prevalence herds.73 To reduce the risk of false-positive results of the milk ELISA affecting culling decisions in low-prevalence herds, Johne’s disease testing should be interpreted with care in the 6–50 days post-TB testing.
Industry initiative: Action Group on Johne’sThe Action Group on Johne’s is an open forum for industry stakeholders interested in tackling Johne’s disease and is jointly funded by the Agriculture and Horticulture Development Board (AHDB) and milk-purchaser members. It was set up in 2010 to encourage the surveillance and awareness of Johne’s disease and, in 2015, launched the National Johne’s Management Plan (NJMP).
The National Johne’s Management PlanThe National Johne’s Management Plan (NJMP) was developed by the Action Group on Johne’s74 as the approach to be taken by the dairy industry of Great Britain to control and reduce the incidence of Johne’s disease in the dairy herd. The focus for Phase 275 of the NJMP, which started in 2018, is to secure engagement, enthusiasm and compliance with robust Johne’s disease control. The guiding principles of the NJMP are outlined in Figure 31.

6160
Ensure all peopleinvolved understandhow Johne’s diseaseis spread and thecritical control points
Agree an appropriatesurveillance plan forthe herd, for example,30-cow, whole herdor cull screen
Perform a credible riskassessment of diseaseentry and spread withinthe herd
Select the right control plan based on prevalence,aspirations and resources
Education
NJMP – Guiding principles
RiskAssessment
Surveillance StrategicControls
Figure 31. NJMP guiding principlesSource: Action Group on Johne’s
The primary method of control depends largely on husbandry to block direct and indirect transmission from infectious animals to animals and environments where susceptible youngstock are reared. In Phase 2, the milk-purchaser members of the NJMP require their associated farmers to obtain annually a signed declaration to confirm that, in conjunction with a BCVA Accredited Johne’s Veterinary Adviser (BAJVA), they have completed:
• An annual structured risk assessment to understand the Johne’s disease risks on the farm
• Testing within the last 12 months to understand the herd’s Johne’s disease status
• A written Johne’s disease management plan has been produced, reviewed and agreed with the farm that one of the six NJMP control strategies is understood and will be implemented
The operational requirements are demonstrated in Figure 32.
Figure 32. Operational requirements of the NJMPSource: Action Group on Johne’s
Know your Johne’s disease risks
Carry out a structured risk assessment with your BCVA Accredited Johne’s
Veterinary Adviser
Know your Johne’s disease status
Discuss with your herd vet, the best option for your farm: 30-cow screen,
whole-herd screen, clinical history or cull screen
Create a written Johne’s disease management plan
Create a bespoke management plan based
on one of the NJMP six strategies

62
The following control strategies were adopted throughout 2019 (Table 27).
Table 27. Selected control strategies by associated farmers of milk-purchaser members throughout 2019
Strategy Adoption (%)
1. Biosecurity protect and monitor 9.32
2. Improved farm management 4.04
3. Improved farm management and strategic testing 49.97
4. Improved farm management test and cull 28.99
5. Breed to terminal sire 7.43
6. Firebreak vaccination 0.25
Source: Action Group on Johne’s
In 2019, over three quarters of milk volume in GB was covered by the 22 milk-purchaser members of the NJMP. Annual compliance rates for each milk-purchaser member are published on the Action Group on Johne’s website.74
In 2019, all milk-purchaser members of the Action Group on Johne’s obtained declarations from most of their supplying dairy farmers, with the majority achieving over 80% compliance and almost half achieving 100% compliance. The success of the scheme in winning industry engagement was a significant factor in the decision to make participation, by both farmers and purchasers, a mandatory part of the Red Tractor scheme from October 2019. Milk-purchaser members of Red Tractor will be required to join the NJMP from 2020. The stage has been set for concerted action over the next decade to improve the control of Johne’s disease on dairy farms and secure better cow health and welfare, improve productivity and reduce the costs of milk production.
CHeCS Johne’s disease programmesCHeCS has two programmes for tackling Johne’s disease:
1. Johne’s Disease Risk-Level Certification Programme (beef and dairy)
The objectives of this programme are to provide an assessment of the risk of Johne’s disease being present in the herd, to provide a control programme that achieves a reduction in the risk of Johne’s disease within the herd, and to allow the marketing of cattle with an accredited risk level.
2. Johne’s Disease Risk-Level Reduction Programme (dairy)
The objective here is to implement a control programme to reduce the detrimental effects on herd productivity caused by Johne’s disease and to reduce disease prevalence over time. The ultimate long-term goal is to achieve freedom from the disease, but the removal of test-positive animals is not a strict requirement. However, in order to achieve certification for Johne’s disease, participating herds are required to join the Johne’s Disease Risk-Level Certification Programme (beef and dairy).
In 2019, 6,994 herds in the UK were participating in one or other of CHeCS’ cattle health scheme programmes for Johne’s disease.

6362
64 CHeCS Bovine TB Herd Accreditation: Earned recognition from Government65 Defra, March 2020 A strategy for achieving Bovine Tuberculosis Free Status for England: 2018 review - government response 66 CHeCS Technical Document67 BVD eradication in Scotland68 Gwaredu BVD69 Gwaredu BVD, 3 July. Additional funding now available under Gwaredu BVD Programme70 Gwaredu BVD, Autumn 2019 Bulletin71 Patterson et al., 2019. Mycobacterium avium paratuberculosis infection of calves – The impact of dam infection status Preventative Veterinary Medicine72 Meyer et al., 2018. A probabilistic approach to the interpretation of milk antibody results for diagnosis of Johne’s disease in dairy cattle Preventative Veterinary Medicine 73 RVC, Effect of tuberculin skin testing on serological results against Johne’s disease: evidence of distinct effects in cows classified with and without Johne’s disease. Manuscript in preparation74 Action Group on Johne’s 75 National Johne’s Management Plan

64
Health surveillance
Livestock Demographic Data GroupsAPHA’s Livestock Demographic Data Groups (LDDGs) are livestock species-specific multidisciplinary groups for each of the main farmed species (cattle, sheep, goats, pigs and poultry) and comprise data science, epidemiology, species and mapping expertise. Each of the LDDGs have key outcomes:
• To provide regularly updated population estimates for the main livestock species in order to inform policy development and outbreak response
• To build understanding, expertise and capacity in livestock demographic data
• To establish criteria to enable monitoring of changes in livestock demographics that could indicate a change in the likelihood of disease introduction and/or spread, or that could affect the probability of effective detection and control
New enhanced demographics reports76 for cattle, sheep and goats, pigs and poultry were published this year, along with 2019 population reports for these livestock species. The cattle report77 identifies 46 ‘indicators’, which are population-associated statistical parameters, and groups these into four main types: denominators and herd sizes; herd structure and calving; import; cattle movement. The list of indicators was prioritised to identify those considered to be of greatest value in understanding and informing assessments of disease entry, transmission, detection and control.
Cattle population mapsBoth cattle population density and holding maps reflect widespread understanding of the cattle industry demographic, with the greatest density of cattle population and holding densities towards the west of Great Britain (example map in Figure 33). These maps are important for response planning in the event of a disease outbreak. In an enhancement to previous population reporting, maps have been produced that show the cattle population and holding density split into beef and dairy.78 Areas with the highest dairy population density all coincide with either the highest or moderate densities of beef cattle. No areas of high dairy population density are coincident with low beef population density. For example, the north-east of Scotland and eastern Scottish Borders all show areas of high beef population density and low dairy population density. This can also be seen in north-east England.
For the production of beef/dairy-holding density maps, a beef holding was defined as a cattle holding with at least one beef breed cattle present on 1 July 2019. Similarly, a dairy holding was defined as a cattle holding with at least one dairy breed cattle present on 1 July 2019. Beef and dairy breeds were defined as in CTS.79

6564
Figure 33. Bivariate map of GB beef and dairy population density with holding density insetSource: APHA
APHA vet support APHA’s Vet Gateway80 provides a one-stop shop for scanning surveillance information. It links to all of APHA’s scanning surveillance publications and offers open-access links to monthly surveillance and disease focus articles in the Veterinary Record, species-specific emerging trends and disease surveillance reports. It also provides disease information notes and links to disease surveillance dashboards, including the VIDA annual report. In addition to this, the Gateway pages provide an overview of APHA’s expertise and scanning surveillance network and information about submitting samples to APHA and the services offered.
Other services to support vets include the 2019 VIDA annual report,81 which has recently been published in an interactive dashboard format.
Lastly, APHA has published guidance which explores potential medium- and longer-term livestock endemic disease risks associated with flooding events in Great Britain. This was also supported by a follow-up article in the Veterinary Record,82 which is available as open access.

66
Centre of Expertise for Extensively Managed LivestockThe Centre of Expertise for Extensively Managed Livestock, based at Carmarthen, continues to be developed to support England and Wales. Its work to date has been publicised via a focus article in the Veterinary Record via the open-access link.83
Veterinary surveillance update The GB scanning surveillance network comprises diagnostic post-mortem laboratories and is supported by Species Expert Groups (SEGs) that are part of APHA’s Surveillance Intelligence Unit. In Scotland, this role is performed by SRUC Veterinary Services, and in England and Wales by APHA and its partner post-mortem providers. All contribute to the common Veterinary Investigation Diagnosis Analysis (VIDA) database, which ensures diagnoses of consistently high quality across the whole network. The data collected allows the Expert Groups to monitor trends (but not prevalence) in known diseases and to identify potential new and re-emerging threats to the livestock industry. It should be noted that data is based on submissions to the surveillance network and is not representative of the whole disease picture. An example of the value of identifying trends in endemic disease is presented below.
Mycoplasma bovis and bovine respiratory diseaseThe contribution of Mycoplasma bovis (M. bovis) as a pathogen involved in bovine respiratory disease has increased over recent years. Figure 34 illustrates GB incidents of pneumonia as a percentage of all respiratory submissions to the surveillance network in which M. bovis was diagnosed, over the years 2006–2019.
10
9
8
7
6
5
4
3
2
1
02006 2007 2008 2009 2010 2011 2012 2013 2014 2015 2016 2017 2018 2019
Figure 34. GB incidents of pneumonia involving Mycoplasma bovis as % of respiratory submissions, 2006–2019 Source: VIDA
There has been a consistent increase in the proportion involving M. bovis for the past six years. Figure 35 shows the most common pneumonia diagnoses in cattle, also as a percentage of all respiratory cases, in two years, 2014 and 2019.

6766
Fog fever 0.1%
2014
Isolation of Bibersteinia trehalosi in association with respiratory disease 0.3%Diagnosis not listed – respiratory disease 0.8%
Pneumonia dt PI3 1.1%Pneumonia dt Histophilus somni 2.0%
Pneumonia dt Trueperella pyogenes (formerly Arcanobacterium pyogenes) 2.9%Pneumonia dt Mycoplasma bovis 3.3%
Pneumonia dt RSV 3.5%Pneumonia dt Pasteurella multocida 4.1%
Pneumonia dt Mannheimia spp 3.9%Parasitic pneumonia 4.5%IBR 4.5%
Pneumonia NOS 6.4%
Fog fever 0.1%
2019
Isolation of Bibersteinia trehalosi in association with respiratory disease 0.7%Interstitial pneumonia NOS 0.8%
Diagnosis not listed – respiratory disease 1.0%Pneumonia dt PI3 1.9%
Pneumonia dt Trueperella pyogenes (formerly Arcanobacterium pyogenes) 3.2%Parasitic pneumonia 3.6%
IBR 4.8%Pneumonia dt Histophilus somni 4.8%
Pneumonia dt RSV 5.4%Pneumonia NOS 7.2%
Pneumonia dt Pasteurella multocida 8.0%Pneumonia dt Mannheimia spp 8.5%
Pneumonia dt Mycoplasma bovis 8.8%
Figure 35. The most common respiratory diagnoses in cattle as a % of all respiratory cases for the years 2014 (top) and 2019 (bottom) Source: VIDAKey: DNR: ‘Diagnosis not reached’. NOS: ‘Not otherwise specified’. dt: ‘Due to’.
From this it can also be seen that the contribution of M. bovis to bovine respiratory disease has increased such that in 2019 it was the most common respiratory diagnosis. Figure 36 illustrates the same data for 2019 separated into adult and post-weaned animals.

68
Interstitial pneumonia NOS 0.3%
Adult cattle
Fog fever 0.3%Isolation of Bibersteinia trehalosi in association with respiratory disease 0.3%
Pneumonia dt PI3 0.8%Pneumonia dt RSV 1.6%
Diagnosis not listed – respiratory disease 1.9%Pneumonia dt Histophilus somni 1.9%
Pneumonia dt Mycoplasma bovis 3.0%Pneumonia dt Trueperella pyogenes (formerly Arcanobacterium pyogenes) 3.0%
Pneumonia dt Pasteurella multocida 4.1%Pneumonia dt Mannheimia spp 5.4%
Pneumonia NOS 6.3%Parasitic pneumonia 7.6%
IBR 8.4%
Fog fever 0.2%
Post-weaned cattle
Diagnosis not listed – respiratory disease 0.7%Interstitial pneumonia NOS 0.7%
Isolation of Bibersteinia trehalosi in association with respiratory disease 1.0%Pneumonia dt PI3 1.7%
Pneumonia dt Trueperella pyogenes (formerly Arcanobacterium pyogenes) 2.5%Parasitic pneumonia 4.0%
IBR 4.2%Pneumonia NOS 6.9%Pneumonia dt Histophilus somni 6.9%
Pneumonia dt Mannheimia spp 8.9%Pneumonia dt RSV 8.9%
Pneumonia dt Pasteurella multocida 12.1%Pneumonia dt Mycoplasma bovis 13.1%
Figure 36. The most common respiratory diagnoses in cattle as a % of all respiratory cases for the year 2019 in adult (top) and post-weaned (bottom) cattle Source: VIDA
This shows that M. bovis contributes mostly to respiratory disease of post-weaned cattle, and much less so to that of adults. Although this cannot be interpreted as indicating its prevalence, it gives a very strong indication that M. bovis plays a significant role in post-weaned bovine respiratory disease (BRD), and that this role has increased in recent years. Further information on M. bovis may be found in an information note produced by CHAWG.84 The APHA Cattle Expert Group recognised the importance of M. bovis and its potential role in BRD and produced an information note85 to help define the knowledge gaps within the GB cattle industry context. Some research is underway to close these gaps, but there is a need to ensure a comprehensive approach is taken to bear down on this pathogen.

6968
76 APHA, APHA’s Livestock Demographic Data Groups publish new reports77 APHA, January 2020. Cattle Enhanced Demographic Report 2019 – To inform assessment of disease: entry/spread/ detection, 2018–201978 APHA, June 2020. Livestock Demographic Data Group: Cattle population report Livestock population density maps for GB79 Cattle Tracing System Online80 APHA Vet Gateway81 APHA, Veterinary Investigation Diagnosis Analysis (VIDA)82 Veterinary Record, Medium- to long-term endemic disease risks associated with flooding events 83 Veterinary Record, Surveillance for disease in extensively managed livestock 84 CHAWG, December 2014. Information note 85 APHA, October 2018. Mycoplasma bovis: current knowledge, industry challenges and knowledge gaps for the UK cattle industry

70
Health and welfare at slaughter
Ante- and post-mortem inspections at slaughterTable 28 provides a summary of health issues recorded for beef and dairy cattle ante-mortem and their carcases post-mortem at abattoirs across England and Wales during 2019. Cattle conditions are recorded by Food Standards Agency (FSA) meat inspectors before and after slaughter. Legislation requires the official veterinarian (OV) to carry out an ante-mortem inspection of all animals before slaughter to determine whether there is any sign that welfare has been compromised or of any condition which might adversely affect human or animal health. Similarly, post-mortem inspections are made to minimise any possible risks to public health, animal health or animal welfare.
Table 28. Health issues recorded for cattle ante-mortem and carcases post-mortem at abattoirs across England and Wales during 2019
Condition Number of conditions Throughput (%)
Ante-mortem
Lameness 13,896 0.88
Emergency slaughter on farm 6,137 0.39
Mastitis 4,774 0.30
Abnormal respiratory signs 4,179 0.27
Emaciation/poor condition 3,642 0.23
Diarrhoea 2,785 0.18
Abnormal/localised swelling 2,626 0.17
Dermatitis 1,461 0.09
Eye conditions 1,161 0.07
Ringworm 983 0.06
Papilloma 899 0.06
Dead on arrival/slaughtered in lairage 716 0.05
Trauma 630 0.04
Post-mortem
Fluke 173,612 11.03
Contamination 151,057 9.60
Hepatic damage (scarring or abscesses) 103,330 6.56
Pneumonia/pleurisy 78,031 4.96
Bruising/trauma 20,775 1.32
Abscesses 9,929 0.63
Traumatic pericarditis 6,576 0.42
Joint lesions (including Arthritis) 5,093 0.32
Hydatid cyst 1,037 0.07
Lungworm 1,162 0.07
Cysticercus bovis 379 0.02
Total throughput 1,573,982
Source: Food Standards Agency

7170
CCTV in English abattoirsFunding for welfare activities carried out on behalf of Defra and Welsh Government has increased by 22% in 2018/19 to reflect the ongoing work involving animal welfare controls and the recent successful implementation of legislative changes in relation to mandatory installation of CCTV in slaughterhouses in England.
As of 4 May 2018, it became mandatory for all abattoirs in England to install and operate a CCTV system, in all areas where there are live animals, and to provide unrestricted access to the footage by official veterinarians. Footage must be kept for a minimum of 90 days after the date taken and be available to FSA inspectors.
In November 2018, the legislation to make CCTV cameras mandatory to safeguard animal welfare in slaughterhouses in England was fully implemented after an initial transitional period. The FSA worked closely with Defra on the implementation period, developing guidance and holding workshops, as well as liaising with industry stakeholders to ensure proportionality and consistency. All slaughterhouses in England were confirmed as compliant with CCTV requirements by the end of February 2019.
From April 2018 to March 2019, 14 Freedom of Information requests related to welfare matters were received and dealt with by the FSA welfare team. Around 28% of all welfare-related requests involved religious slaughter practices and over 21% referred to compliance with the implementation of CCTV requirements.
From the 5 November 2018 to the end of June 2019:
• Nine critical welfare incidents attributable to slaughterhouse controls (out of a total of 151 in the period) were identified solely by the viewing of CCTV footage during verification tasks carried out by official veterinarians (OV)
• An added 30 critical incidents were confirmed by the viewing of CCTV footage when the OV was informed of issues but had not witnessed them directly or a finding indicated a potential welfare non-compliance that could only be verified through CCTV
• A further 26 critical welfare incidents were supported by CCTV evidence
A full review of the implementation of CCTV requirements in English abattoirs will be carried out within two years of the implementation date and led by Defra, with FSA support. More information can be found in the FSA’s Animal Welfare Update86.
CCTV in Welsh abattoirsIn March 2018, the Welsh Government announced a £1.1 million Food Business Investment Scheme package of grant aid specifically for small and medium-sized slaughterhouses in Wales. The grant covers both capital investment and the provision of advice on animal welfare and may be used in the installation and upgrading of CCTV monitoring systems. The Welsh Government continues to explore the possibility for future legislation, but in the meantime, the voluntary joint CCTV protocol, which was adopted in 2017 between FSA and industry, will remain in place and field staff were requested to review its use and encourage business operators to participate during June 2019. At time of publishing, fewer than a dozen slaughterhouses in Wales, mostly processing a small number of animals, do not have CCTV.
CCTV in Scottish abattoirsThe Scottish Government announced in January 2019 that legislation would be brought forward requiring abattoirs to record on CCTV all areas where live animals are present87. The proposal was backed by the vast majority of respondents to a recent consultation carried out by the Scottish Government88.The Minister for Rural Affairs and the Natural Environment said at the time that more than 8 out of 10 slaughterhouses in Scotland already had installed CCTV coverage in their premises voluntarily, and over 95% of all animals slaughtered in Scotland were covered by some form of CCTV. The standards of that coverage did, however, differ from location to location.
86 Food Standards Agency, 18 September 2019. Animal Welfare Update 87 Scottish Government, 9 January 2019. Animal welfare improved 88 Scottish Government, 9 January 2019. Compulsory closed-circuit TV recording at abattoirs consultation: summary
of responses

72
Responsible use of medicines
The RUMA AllianceThe Responsible Use of Medicines in Agriculture (RUMA) Alliance was established in November 1997 to promote the highest standards of food safety, animal health and animal welfare in the UK livestock industry.89
It is a unique, independent, non-profit group involving organisations that represent all stages of the food chain from ‘farm to fork’. This reflects the importance of traceability, transparency and accountability at all stages in the chain: from primary food production, through processing, manufacturing and retailing to the final consumer. Its membership includes organisations operating in agriculture, veterinary practice, animal medicines, farm assurance, training, retail and animal welfare.
RUMA aims to produce a coordinated and integrated approach to best practice in animal medicine use, including vaccines, anthelmintics and parasiticides, and antibiotics. It has an established communications network with government departments and many non-governmental organisations.
Vaccine useIn the UK, more than 40 vaccines are authorised for use to control or prevent disease in cattle. Farmers are legally required to keep a record of the administration of all vaccines in a medicine book, which must be available for inspection. However, there is currently no national system for collating data on how many animals have been vaccinated.
Data on the number of doses of vaccines authorised for use in cattle and sheep sold in the UK each year between 2011 and 2018 are based on wholesaler data collated by Kynetec. MSD Animal Health has made this data available for an annual report on vaccine uptake, published by AHDB.90
Pneumonia vaccineIn summary, the uptake of vaccines for pneumonia rose steadily, from 29% in 2011 to 40% in 2018 – an increase of 35%. The proportion of cattle vaccinated in 2019 (36%) was 9% lower than in 2018 but was close to the average uptake between 2013 and 2019 (Figure 37).
1009080706050403020100
2011 2012 2013
% cattle vaccinated for pneumonia Number of cattle <1 year
2014 2015 2016 2017 2018 2019
29 31 35 36 36 37 38 40 36
Num
ber of cattle
5,000,0004,500,0004,000,0003,500,0003,000,0002,500,0002,000,0001,500,0001,000,000500,0000
Vacc
inat
ion
upta
ke%
Figure 37. Pneumonia vaccine uptake Source: Kynetec, collated by AHDB
Infectious Bovine Rhinotracheitis (IBR) vaccineInfectious Bovine Rhinotracheitis (IBR) vaccine uptake has steadily increased, from 17% in 2011 to a high of 26% in 2018 and 2019 (Figure 38). The proportion of the cattle herd vaccinated and the number of IBR vaccine doses sold have increased by nearly half since 2011. Since 2017, it has been estimated that one in four of all cattle in the UK are being vaccinated against IBR.

7372
IBR 1 dose/cattle <1 year; >1year - 60% 1 dose, 40% 2 dose Total cattle and calves
2011 2012 2013 2014 2015 2016 2017 2018 2019
17 19 22 23 22 22 25 26 26
Num
ber of cattle and calves10,000,0009,000,0008,000,0007,000,0006,000,0005,000,0004,000,0003,000,0002,000,0001,000,0000
1009080706050403020100
Vacc
inat
ion
upta
ke%
42 44 45 48 45 43 45 42 43
Num
ber of cattle
5,000,000
4,500,000
4,000,000
3,500,000
3,000,000
2,500,000
2,000,000
1,500,000
1,000,000
500,000
0
100
90
80
70
60
50
40
30
20
10
0
Vacc
inat
ion
upta
ke%
% cattle vaccinated for BVD Total breeding herd + female cattle 1–2 year
2011 2012 2013 2014 2015 2016 2017 2018 2019
Figure 38. IBR vaccine uptake Source: Kynetec, collated by AHDB
Bovine Viral Diarrhoea vaccineBVD vaccine uptake has been fairly steady since 2011, fluctuating between a low of 42% in 2018 and a high of 48% in 2014 (Figure 39). In the last five years, sufficient doses of vaccine were sold to vaccinate between 42% and 45% of the total breeding herd over the age of two years and all female cattle between one and two years of age – 43% in 2019.
Figure 39. BVD vaccine uptake Source: Kynetec, collated by AHDB
Vaccine uptake summaryVaccines are important in helping both the beef and dairy cattle sectors to meet industry targets to use antibiotics more responsibly. Vaccine sales were highest in 2014 and 2017 and the total doses sold was 7% lower in 2019 than in 2017 (Table 29). The majority of this reduction is associated with supply issues and changes in vaccine course regimes. With the exception of Leptospirosis, where there was a known supply issue, the estimated proportions of eligible animals vaccinated with the other vaccines in the report were close to the average for recent years.

74
Table 29. Summary of vaccine uptake in cattle 2011–2019
Vaccine uptake in cattle 2019 2018 2017 2016 2015 2014 2013 2012 2011
Total number cattle <1 year (‘000) 2,859 2,888 2,948 2,971 2,939 2,822 2,806 2,925 2,882
Calf pneumonia vaccines (%) 36 40 38 37 36 36 35 31 29
Total cattle and calves (‘000) 9,599 9,751 9,895 9,919 9,867 9,765 9,763 9,851 9,840
IBR (%) 26 26 25 22 22 23 22 19 17
Total number of breeding females >1 year (‘000) 4,788 4,847 4,909 4,912 4,861 4,785 4,787 4,820 4,809
BVD (%) 43 42 45 43 45 48 45 44 42
Leptospirosis (%) 27 31 33 31 32 37 33 36 32
Total number of breeding females (>2 years) (‘000) 3,390 3,412 3,462 3,472 3,470 3,415 3,382 3,426 3,447
Calf enteritis (%) 17 19 18 16 17 17 12 18 15
Total doses of vaccine sold (‘000) 9,414 9,839 10,134 9,558 9,695 10,135 9,326 9,349 8,463
Source: Kynetec, collated by AHDB
Anthelmintics and parasiticides Stewardship of anthelmintics through COWSFor most adult cattle, there is no need to use routine anthelmintics as the animals acquire resistance, with exposure to most worms when grazing in the first couple of years of life. However, calves – and sometimes cows too – can succumb to parasites. The Control of Worms Sustainably in cattle (COWS) group91 provides guidelines to ensure anthelmintics are used responsibly and the chance of resistance to treatments developing is minimised.
COWS published the final chapter in its updated guide to integrated parasite control in summer 2020.92 The new guide brings together key technical messages from other new chapters on roundworm, lungworm, liver and rumen fluke and ectoparasites. It also contains five scenarios, such as a beef suckler farm with calves born in spring and dairy herds with weaned calves and youngstock kept at a separate unit. For each scenario, a control plan for the grazing season is outlined, including possible tests that can be carried out and a summary of the key points at the end.
The economic impact of parasitic worm infections across 18 European and neighbouring countries has been highlighted in a recent study,93 outlining that roundworm, liver fluke and lungworm in cattle are costing UK livestock producers £270 million every year. Moreover, losses due to wormer resistance are estimated at £3.5 million. The study accounted for production losses and treatment costs, estimating that dairy cattle account for the majority of the UK total (55%), followed by beef cattle (29%) and sheep (16%) (Table 30). Comparing the cost of parasitic worm burdens across Europe, France was estimated to have the highest costs overall (£418 million), with the UK second and Ireland third (£214 million). The heavy impact in these three countries was thought to be related to their high levels of grazing. In the group of countries of which the UK was part, it was calculated that Fasciola hepatica (liver fluke) was responsible for 39% of the impact, gastrointestinal nematodes 37%, lungworm 8% and treatments costs 16%. The study found that research funding for control of worm infections accounted for only 0.18% of the annual disease cost.

7574
Table 30. The estimated annual costs (£ million) of worm infections to the UK ruminant industry
Dairy cattle Beef cattle Meat sheep
Loss of production cost 133 53 15
Treatment cost 16 25 28
Total 149 78 43
% of total UK cost £270,536,504 55% 29% 16%
Source: COWS
FlukicidesWhile adult cattle tend not to be afflicted with worms, liver fluke is different and, depending on exposure, there will be a need to treat adult cattle. The choice of treatment is limited by the milk withdrawal time and whether the product can be used in a lactating cow or even a heifer expected to go into the milking herd.
BCVA has highlighted to members that residues can be detected in milk (bulk and individual cow) and there is a need for a fluke treatment plan within the Red Tractor guidelines. Almost all (99%) anthelmintic and ectoparasite treatments are dispensed through the SQP94 route, but it is hoped that Red Tractor’s focus on this area will increase the oversight of fluke treatment plans and medicine reviews.
Recent findings from a study carried out by Queen’s University Belfast, and funded by AHDB,95 showed that in all geographical areas sampled in the UK, rumen fluke were more abundant than liver fluke. This finding supports the anecdotal evidence that rumen fluke is gradually replacing liver fluke as the major endemic trematode infection in the UK. However, the results from this project also demonstrated that in a well-managed cattle herd there was no adverse production effect due to rumen fluke infection. A test to identify rumen fluke infection is being developed, but further testing is required to assess its usefulness under field conditions.
With limited options for treatment of rumen fluke, it is suggested that producers discuss rumen fluke control with their vet to identify the best control strategy to avoid unintended consequences, such as anthelmintic resistance. The final report will be available from AHDB upon publication of the project results.
NOAH and the Veterinary Medicines Directorate recently updated the advice on milk withdrawal periods for the various dairy cattle flukicidal products on the market.96 In it, they advise that vets, suitably qualified persons (SQPs) and farmers should read the instructions on the product labels carefully. The prescribing decision rests with the vet or the SQP and when prescribing it is important for them to be aware of withdrawal period requirements specified on the labels and to highlight the required withdrawal period to the farmer. The farmer should then follow the advice given by the vet or the SQP.
It also notes that some of the milk withdrawal periods for flukicidal products in dairy animals place restrictions on the use of the product depending on the stage of pregnancy, so it is important that prescribers and users carefully consider this information when treating animals.
Antibiotic use in the cattle sectorsAntibiotic use in the UKThe concept of a Targets Task Force97 to identify sector-specific responsible antibiotic use targets for the UK farming industry was first announced by RUMA in May 2016, in response to the release of the O’Neill report.98 Since then, there has been considerable progress in reducing, refining or replacing antibiotic use across all sectors in UK farming, guided by the specific targets each sector has set itself to reach by 2020. At time of publishing, overall sales met the Government’s most recent target for UK farming, as laid out in its five-year national action plan99, of 33 mg/kg annual sales of antibiotics for food-producing animals (Figure 40). According to the latest EU figures (2017) available at time of going to press, the UK also had the fifth-lowest sales of antibiotics for farm animal use in Europe, and the lowest of the agriculturally productive countries.100

76
62.556.8
39.3
32.529.5
70
60
50
40
30
20
10
0
Sale
s in
mg/
kg
Comparedwith 20179%
2014 2015 2016 2017 2018
Comparedwith 201453%
Figure 40. Antibiotics sales for food-producing animals in the UK 2014–2018 Source: VMD101
Sector-specific targets 2017–2020Meeting specific targets set out for the dairy and beef sectors102 has been more challenging than for many other sectors, mainly because a lack of data means that it is not possible to know whether overarching targets to reduce usage by 20% in the dairy sector and 10% in beef have been met. Where it has been possible to collect data or gauge progress in a more qualitative way, progress has been good (Table 31).
Table 31. Summary of progress against 2017 responsible antibiotic use targets
Target Progress
Beef sector
10 mg/kg overall use Cannot be determined due to lack of baseline and current data
Dairy sector
21.5 mg/kg overall use Cannot be determined due to lack of baseline and current data
Intramammary LC tube reduction of 10% Achieved (2019 sales)
Intramammary DC tube reduction of 20% Achieved (2019 sales)
Sealant tube use increased from 0.5 to 0.7 2018 (latest) data shows 0.5 – no change
Intramammary HP-CIA tube reduction by 50% Achieved (2018 sales)
Dairy and Beef sectors
Injectable HP-CIAs reduced 50% Achieved (2019 sales)
Vaccine uptake (monitor) IBR and pneumonia No target but fell marginally in 2019
Monitor health and welfare (H&W) metrics CHAWG report summarises state of H&W
Develop measurement metrics Dairy metrics developed in 2018, Beef in 2019
Development of database Electronic medicine hub launch at end of 2020
Farmer and vet training Training taking place and uptake rising
Responsible use messages Active messaging in media and via initiatives
Source: RUMA

7776
The challenge with obtaining data on overall antibiotic use stems from the large number of producers in the beef and dairy sectors and the lack of integration in the supply chain, which means communication is more fragmented and data is harder to collect and collate. Various attempts have been made to set up a centralised database, as has been done for the pig sector with eMB-Pigs.103 The result is the e-medicine hub (eMH) for ruminants, which is due to come online at the end of 2020, with the aim of accommodating a widescale data collection effort for dairy and beef in 2021 and 2022. Funded by AHDB, it is hoped the eMH will be able to capture large data sets as well as individual farm records.
Metrics, so use of antibiotics can be captured in a standardised way on farm, were developed by a CHAWG Antimicrobial Use group. Dairy metrics were signed off in 2018, and beef in 2019.104 In recognition that calves from the dairy sector are generally hand-reared – whether dairy replacement females or destined for the beef sector – and face specific challenges which can lead to elevated use of antibiotics, a separate ‘calf’ sector has been created. The CHAWG Antimicrobial Use group is in the process of signing off measurement metrics for calves from the dairy herd from birth to six months.
Table 32. Measurement metrics for antibiotic use in cattle
Sector Metrics
Beef mg (total weight of antibiotic active ingredient used)kg (average liveweight of animal population on the farm)
DairyCore Metric One = mg/Population correction unit (PCU – 425 kg for a dairy cow)Core Metric Two = Average number of antibiotic courses per dairy cow for dry cow therapyCore Metric Three = Average number of antibiotic courses per dairy cow for lactating cow therapy
Calves mg (total weight of antibiotic active ingredient used)kg (average liveweight of animal at time of treatment
Source: CHAWG AMU Group/RUMA
While overall use has been difficult to measure, there has been an extremely positive response within the cattle sectors to the call to reduce use of highest priority critically important antibiotics (HP-CIAs) and intramammary antibiotic products (Table 33). However, the target to see use of sealant tubes rise has not been met. This target is being dropped for future targets, as with some farmers choosing to use neither antibiotics nor sealant tubes at drying off, it is not thought to provide a representative indication of changing behaviours.
Table 33. Sales targets for cattle 2015–2019
CategoryTarget Active ingredient in mg/kg
(course doses)Change mg/kg
(%)
2020 2019 2018 2017 2016 2015(baseline) 2015–2019
Injectable HP-CIA products licensed for cattle (mg/kg) 0.46 0.26 0.50 0.70 0.92 1.1 -0.8
(-73%)
Intramammary HP-CIA products (DCDvet) 0.17 0.03 0.12 0.17 0.24 0.33 -0.30
(-91%)
Intramammary lactating cow course doses 0.73 0.60 0.78 0.69 0.82 0.80 -0.20
(-25%)
Intramammary dry cow course doses 0.58 0.58 0.64 0.54 0.61 0.73 -0.15
(-20%)
Sealant tube sales (courses/dairy cow) 0.70 N/A 0.51 N/A N/A 0.5 +0.01
(+2%)
Source: VMD

78
Industry initiative: Westpoint Vets and Kingshay, Kingshay chart Red Tractor effect on HP-CIAsWestpoint Farm Vets carried out a study in conjunction with Kingshay examining whether changes made to the Red Tractor assurance standard in June 2018 were driving further reductions in use of HP-CIAs. Prescription data for 2,764 dairy, beef and sheep farms from across the UK was analysed, looking at sales of all antibiotics and HP-CIAs. In the six months leading up to May 2018, the average monthly volume of HP-CIAs sold was 1,833,832 mg. In June 2018, requirements to use HP-CIAs only as a last resort under vet direction guided by sensitivity or diagnostic testing were introduced. From June 2018 to December 2018, the average monthly volume of HP-CIAs sold fell to 147,357 mg. The reduction in HP-CIA prescriptions from January to December represented a fall of 92% (Table 34).
Table 34. Sales of HP-CIAs from Westpoint Vets105 study post-Red Tractor standard changes
Mean monthly sales
Jan–May 2018
Mean monthly sales
Jun–Dec 2018Difference % Reduction
HP-CIAs active ingredient (mg) 1,833,832 147,357 1,686,475 92
Total antibiotic active ingredient use (mg) 110,831,696 86,918,562 23,913,134 22
Source: Action Group on Johne’s
Antibiotic targets 2020–2024The new targets for the responsible use of antibiotics 2021–2024 identified by the Targets Task Force are being published in November 2020. For cattle, there are three ‘sectors’ – beef, dairy, and – in recognition of their particular needs and potential vulnerabilities – calves under six months old from the dairy herd. Table 35 summarises the provisional list of target activities on farm and with veterinary surgeons, and Table 36 provides the provisional list of ‘indicator’ outcomes that should be achieved as a result of the on-farm activities. Please note that at the time of going to press these targets and indicators were the latest versions available, therefore there may have been minor changes before final release. For final targets and indicators, and more detailed descriptions of the activities and outcomes, please access the full report on the RUMA website.106

7978
Farmer & Vet Targets Dairy Beef Calves
DATA
Target 1: Drive calculation of on-farm use and submission of data to central hub
On-farm calculation of use, benchmarking, and direct or indirect capture of on-farm or veterinary practice data centrally
Data from 2,000 dairy farms captured centrally in 2021; 95% of UK herds captured centrally by 2024
Data from 1,000 beef farms captured centrally in 2021, doubling each year to reach 8,000 UK herds by 2024
Data from 200 UK calf rearing units captured centrally in 2021; data from 50% of all UK calf-rearing units by 2024
ENGAGEMENT
Target 2: Create ‘Vet Champion’ network
Creation of network of Farm Vet Champions in veterinary practices
Farm Vet Champions in 900 veterinary practices across the UK by 2024 in addition to those set up as part of Arwain Vet Cymru107
Target 3: Increase training uptake
Increase training uptake among vets Specify appropriate training including changing behaviour (e.g. motivational interviewing) within Farm Vet Champion plan
Increase uptake of medicines best practice training among farmers
Reducing non-compliances annually for medicines training in Red Tractor
Medicines training becomes a requirement in farm assurance schemes across all four nations (as is already in FQAS in Northern Ireland) starting with Red Tractor in Oct 2021 (following public consultation); reducing non-compliances annually once this becomes a requirement
Increase uptake of medicines best practice training among vet/agriculture students
All agriculture and vet courses include antibiotic use best practice content by 2024 as monitored through Landex and via vet school survey
HEALTH & WELFARE; RESPONSIBLE ANTIBIOTIC USE
Target 4: Farmer and Vet plan development
Farmer and vet develop a bespoke plan for each farm and review indicators annually:- key health and welfare issues - responsible reductions in use- proactive health planning- reducing use of HP-CIAs- reducing and replacing prophylaxis - supporting risk-aware purchasing for
health status
Reducing non-compliances annually in Red Tractor against requirements to develop a herd health plan with the vet and for the vet to conduct an annual health and performance review
Falling non-compliances annually in Red Tractor Beef & Lamb assurance, FAWL Beef and Lamb Scheme, QMS Cattle and Sheep Assurance Scheme, and NI Beef & Lamb Farm Quality Assurance Scheme where there is requirement to develop a herd health plan and for the vet to conduct an annual health and performance review
The impact of BVD is reduced through better disease management in calf enterprises
Calves entering rearing facilities come from farms engaged in BVD eradication OR Calves entering a rearing facility are screened for BVD and PIs are removed.
Source: RUMA Targets Task Force
Table 35. Provisional responsible antibiotic use targets for cattle 2021-2024
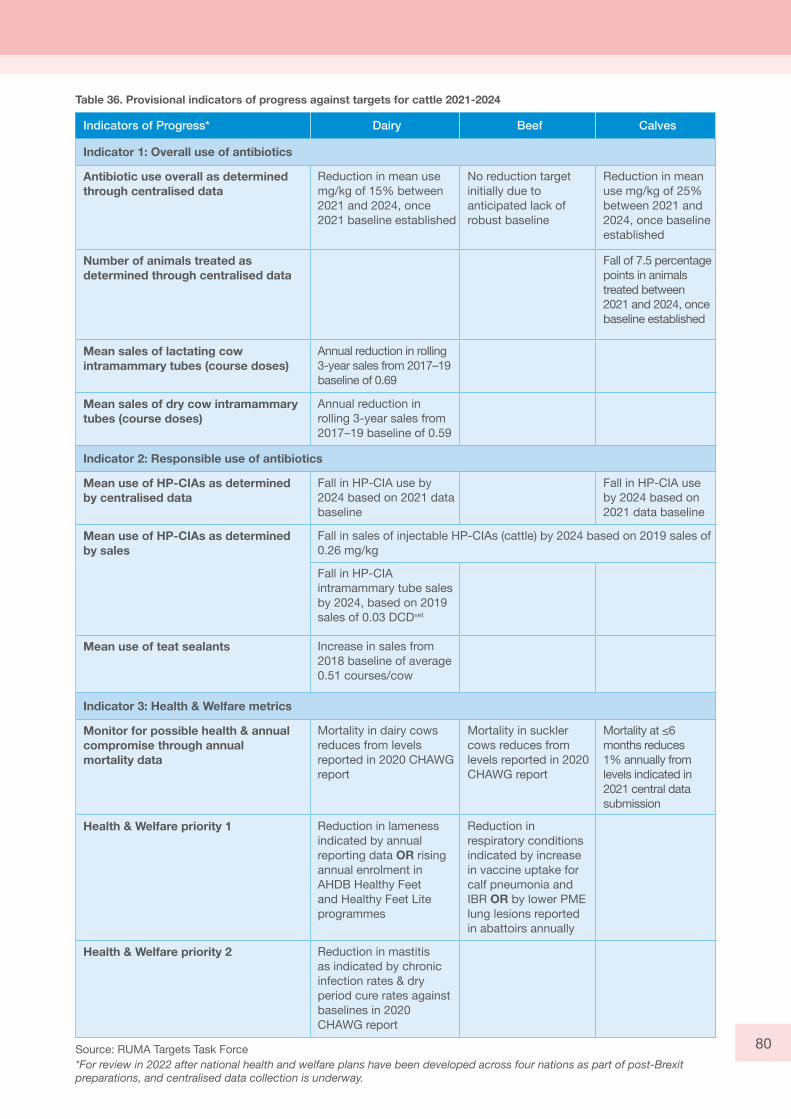
80
Indicators of Progress* Dairy Beef Calves
Indicator 1: Overall use of antibiotics
Antibiotic use overall as determined through centralised data
Reduction in mean use mg/kg of 15% between 2021 and 2024, once 2021 baseline established
No reduction target initially due to anticipated lack of robust baseline
Reduction in mean use mg/kg of 25% between 2021 and 2024, once baseline established
Number of animals treated as determined through centralised data
Fall of 7.5 percentage points in animals treated between 2021 and 2024, once baseline established
Mean sales of lactating cow intramammary tubes (course doses)
Annual reduction in rolling 3-year sales from 2017–19 baseline of 0.69
Mean sales of dry cow intramammary tubes (course doses)
Annual reduction in rolling 3-year sales from 2017–19 baseline of 0.59
Indicator 2: Responsible use of antibiotics
Mean use of HP-CIAs as determined by centralised data
Fall in HP-CIA use by 2024 based on 2021 data baseline
Fall in HP-CIA use by 2024 based on 2021 data baseline
Mean use of HP-CIAs as determined by sales
Fall in sales of injectable HP-CIAs (cattle) by 2024 based on 2019 sales of 0.26 mg/kg
Fall in HP-CIA intramammary tube sales by 2024, based on 2019 sales of 0.03 DCDvet
Mean use of teat sealants Increase in sales from 2018 baseline of average 0.51 courses/cow
Indicator 3: Health & Welfare metrics
Monitor for possible health & annual compromise through annual mortality data
Mortality in dairy cows reduces from levels reported in 2020 CHAWG report
Mortality in suckler cows reduces from levels reported in 2020 CHAWG report
Mortality at ≤6 months reduces 1% annually from levels indicated in 2021 central data submission
Health & Welfare priority 1 Reduction in lameness indicated by annual reporting data OR rising annual enrolment in AHDB Healthy Feet and Healthy Feet Lite programmes
Reduction in respiratory conditions indicated by increase in vaccine uptake for calf pneumonia and IBR OR by lower PME lung lesions reported in abattoirs annually
Health & Welfare priority 2 Reduction in mastitis as indicated by chronic infection rates & dry period cure rates against baselines in 2020 CHAWG report
Source: RUMA Targets Task Force*For review in 2022 after national health and welfare plans have been developed across four nations as part of post-Brexit preparations, and centralised data collection is underway.
Table 36. Provisional indicators of progress against targets for cattle 2021-2024

8180
89 RUMA90 AHDB, Use of vaccines in cattle and sheep production91 COWS 92 COWS, May 2020. Integrated parasite control on cattle farms 93 Charlier et al., 2020. Initial assessment of the economic burden of major parasitic helminth infections to the ruminant livestock industry in Europe Preventative Veterinary Medicine94 Veterinary Medicines Directorate, What is a Suitably Qualified Person (SQP)?95 AHDB, Rumen fluke in cattle and sheep96 VMD NOAH, 12 May 2020 97 RUMA Targets Task Force98 RUMA, May 2019. RUMA welcomes O’Neill findings with announcement of targets ‘task force’99 HM Government 2019. Tackling antimicrobial resistance 2019–2024: The UK’s five-year national action plan100 European Medicines Agency. Sales of veterinary antimicrobial agents in 31 European countries in 2017: Trends from 2010 to 2017, Ninth ESVAC report101 Veterinary Medicines Directorate 2019. Veterinary Antimicrobial Resistance and Sales Surveillance 2018102 RUMA, 27 October 2017. Targets Task Force Report 103 AHDB, eMB-Pigs104 RUMA, Measuring antibiotic use105 Westpoint Farm Vets106 RUMA, November 2020. Targets for responsible antibiotic use in the UK livestock sectors 2021-2024107 Arwain Vet Cymru

82
The changing role of the farm vet
The landscape and role of the farm animal veterinary surgeon is still very much evolving, and having now left the EU, there will be significant changes in the years to come. Major events and reforms, such as the Agricultural Bill, and proposals like the Animal Health Pathway (England only), should continue to shape and consolidate the role of the farm animal vet in herd-preventative medicine, advice and data collection. Farm subsidy systems that are no longer based on CAP payments will likely mean that efficiency, profitability and margins will become more important to individual farmers and the advisory role of the farm vet in improving these for the clients will become ever more important.
The changes in dairy farm assurance schemes over the last year have cemented the vet’s role in providing compulsory herd health planning, ensuring engagement in national disease eradication schemes, such as the National Johne’s Management Plan and BVDFree (devolved administrations each have their own BVD schemes), and the industry is taking steps to tackle lameness by introducing mobility scoring to dairy farms. The veterinary profession also has to now show commitment to national eradication schemes by undertaking training provided by the BCVA before they can become trained advisers for the clients on these schemes, and this is likely to grow into other areas, such as lameness, mastitis and TB. Many practices now provide their own medicine training to farmers, to ensure that food safety remains a priority.
It is still the case that many veterinary business models rely on the sale of medicines to complement professional fees, particularly to supplement and support 24-hour emergency cover and out-of-hours services. As farm practices grow ever larger, increased travel times at night to farm calls and emergencies are becoming more normal and acceptable, in order to ensure that each farm client has access to 24-hour emergency cover and care.
There is still an increasing issue with the recruitment and retention of veterinary surgeons into farm animal practice. Various studies have highlighted that once they have joined and remain in the farm animal profession, vets tend to be happier and have more job satisfaction than those in comparative species-sector job roles. Other studies have shown that after five years, vets are likely to reassess their chosen career path and often leave the farm animal vet profession at this crucial point. Salaries, work-life balance, juggling on-call rotas with family commitments and the risk of injury are all cited as reasons why vets leave the farm animal profession.
The coronavirus pandemic has inevitably impacted on cattle vets’ current ability to carry out face-to-face farmer interactions and meetings. At time of publishing, remote prescribing and telemedicine had temporarily increased in order to ensure human safety as a priority, while still maintaining a standard of animal welfare. While it is predicted that some digital methods of communicating with clients may become more popular in the future in order to increase time efficiency and reduce travel, a survey of practitioners on the BCVA board predicts that face-to-face vet–farmer communications are still heavily regarded as being the most important and can’t be permanently replaced by technology. The social aspects and benefits of face-to-face meetings for farmers should not be underestimated, especially in what is a relatively isolated profession.
Routine fertility work and proactive beef herd health planning in suckler herds is increasing, with farmers recognising the role of their vet in ensuring a successful calving period. Routine bull fertility, EBVs, pelvic measuring of heifers, and the ability to introduce and improve genetics via AI are now becoming frequent inclusions in the calendar of the beef farm vet.
Farm vets have made significant steps in educating clients on sensible and appropriate reduction of antibiotics on farms. There has been a voluntary 50% reduction in antibiotic use in the farm animal sector in the past five years. Much of this has centred on vet advice around good herd management and improving on-farm systems. There is still much work to be done in this area and much improvement needs to be made in accurate data collection. In light of a post-Brexit world, with imports from countries who rear beef in systems with lower minimum standards and using products that are illegal in the UK, food security may be under threat. It is essential to maintain and increase consumer confidence in UK meat and dairy; farm animal vets, as custodians of animal welfare, are integral to this, along with ensuring and promoting food safety.

8382
The role of sustainability and the carbon footprint in the current and future role of the farm practitioner is also beginning to cement the role of the vet in herd health management and advice. Areas of involvement include advice and active roles in decreasing calf mortality rates on farm, improved fertility, lameness, mastitis and infectious disease status. The key message is to increase productivity and efficiency so that fewer animals need to be reared in order to produce the same kg of milk or beef. The vet’s involvement in improving all areas related to increased productivity is integral to success.
A successful TB session at BCVA Congress 2019 has highlighted the appetite for farm vets to become more involved in the control of this disease on their clients’ farms and to perceive its management as another endemic infectious disease, rather than a separate government-controlled disease. This change in perception and views is a significant step forward, and the Defra response to the Godfray review108 has also highlighted the huge importance of the role of the trusted private veterinary surgeon and for farm practitioners to be at the very heart of TB control.
The British Cattle Veterinary Association (BCVA)
108 Godfray, C., 2018. A strategy for achieving Bovine Tuberculosis Free Status for England

84
Public engagement on health and welfare
One of the challenges facing modern farming is the separation most members of the public have from animal production and, therefore, a lack of understanding of the practices involved. However, the cattle sectors acknowledge the growing influence citizens have in cattle health and welfare issues through retailer contact, welfare charities and petitioning, irrespective of the scientific basis for their wishes.
For this reason, understanding citizens’ concerns and engaging – rather than ‘educating’ – the public is of growing importance, and a number of studies are in progress to understand the views of UK citizens to livestock farming and how the farming industry and its public can be brought closer together through mutual understanding.
Industry initiative: LEAF Education, FaceTime a Farmer and Open Farm SundayIn addition to coordinating the annual Open Farm Sunday, Linking Environment and Farming (LEAF)109 also links work with schools to educate about food production and farming. In 2019, LEAF reached over 16,000 young people, educating on animal welfare and sustainability, among other topics. LEAF is involved with a number of other activities, including FaceTime a Farmer, Countryside Classroom and Farming Fortnight. Feedback following the 2019 Open Farm Sunday revealed that 97% of visitors said they had greater appreciation of the work farmers do.
On Sunday 7 June 2020, farmers across the UK took to social media for the first ever LEAF Online Farm Sunday, with thousands of consumers joining them on tours of their farms to see and hear directly from the farmers themselves about what they do for the environment and how they produce food.
Research project – Understanding public perceptionsDairy consumers have different priorities when it comes to the way dairy cows are managed and milk is produced, and grazing cows is not a priority for everyone, a study has revealed. A survey asked 2,054 consumers to rank 17 attributes concerning milk production and dairy cow management in order of most to least important when they are thinking about milk. Overall, participants prioritised cows grazing for most of the year, cow comfort and cow health and welfare. However, this only told part of the story. Six underlying groups of participants (Figure 41) were found to have ranked the aspects very differently from each other. While access to grazing for dairy cows is often promoted as the key priority for the public, the survey found five of the six groups placed significantly higher importance on other attributes, such as cow comfort, cow welfare, the taste of milk and even the price paid to farmers for their milk. The people within the six groups expressing different preferences were also found to have a number of common characteristics, such as age, how rural they were, and their education, diet and values.110

8584
People in the six ‘citizen’ groups, each identified by their top priority for dairy farming, were likely to have the following characteristics
109 LEAF110 Jackson et al., 2020. Is it just about grazing? UK citizens have diverse preferences for how dairy cows should be
managed Journal of Dairy Science
Figure 41. The six ‘citizen groups’ and their preferences Source: Jackson et al., 2020
WELFARE 18.3%
University-educated Broad-minded and tolerant in outlook
Has visited farms Unrestricted diet
FAIR PRICE 18.9%
Older Traditional
Rural Knowledgeable about dairy farming
GRAZING 15.6%
Urban or suburban Older
More traditional
COMFORT 14.8%
Vegan or vegetarian Consumes plant-based milk
Not university-educated Strongly believes in cow’s ‘mind’
TASTE OF MILK 15.2%
High-achieving Knowledgeable about dairy farming
Inexperienced with animals
NO PREFERENCE 17.2%
Male Narrow focus on self
Inexperienced with animals & farming Highly rates own dairy knowledge!

86
Emerging opportunities
Animal Health and Welfare Board for EnglandThe Government has published its plans for improved health and welfare in its recent Animal Health and Welfare Board for England (AHWBE) Policy Statement.111 Its aim is to establish an Animal Health & Welfare Pathway, working in partnership with farmers and animal keepers of all species, to create an opportunity for uniform action across sectors, delivering improved health and welfare. The pathway will operate in a similar way to cross-compliance in the Common Agriculture Policy, where farmers need to achieve a set of requirements to qualify for grant funding, and will consist of three significant strands.
1. Starting with small grants based on welfare improvement on farm, this will, over time, move to a larger, capital grants system to improve welfare outcomes on farms. These grants will be based on a list system, with a maximum of £30,000 in the first stage and government support of between 40–60%. The intention is that a farmer would engage with their vet and other experts to design a solution for their farm from within the available grants.
2. The Health Pathway will be co-designed, species-specific projects intended to incrementally improve health over time, with a mixture of endemic disease eradication programmes and baseline health scanning. This pathway is intended to apply to all producers and will be supported by government. Unlike previous schemes, this is proposed to consist of on-farm help, using the farmer’s own vet to create solutions for that farm and the animals that are kept there. This project has been underway for some time and is being coordinated through a steering group under the AHWBE, with representatives from major stakeholders working in a co-design way.
3. The final strand is Animal Welfare by Results, a proposed scheme whereby government will support various means of production that the market cannot support but which deliver improved welfare outcomes. This project is working towards pilot schemes that can inform wider policy-making.
When delivered, the aim is that this shared vision of cross-industry high standards will significantly improve both health and welfare, and deliver coordinated actions across whole sectors. At the same time, it is aimed to enable an orderly transition by the industry from the EU’s system of extensive direct support towards enabling the industry to enhance its prospect of international trade and become more productive, resilient and independent, in partnership with government.
Ongoing Visionfor High Welfare &
Healthy Animals
WorldLeadershipin AH&W
ImprovedProductivity
Competitiveness& Trade
SurveillanceEnforcementBiosecurity
InternationalRecognition
Food Security
ImprovedEnvironmentFood SafetyTraceability
ReducedAntibiotic
Use throughDisease
Reduction
Figure 42. Vision for the Animal Health and Welfare Pathway in England Source: Animal Health and Welfare Board for England

8786
Welsh Animal Health and Welfare Framework GroupThe Welsh Animal Health and Welfare Framework Group published its Implementation Plan in summer 2019. The plan centres around the importance and encouragement of animal health planning, and using it as an active tool to improve productivity, with the key principle of ‘prevention is better than cure’. The plans are intended to be outcome-driven to show clear benefits to all livestock keepers.
Delivering these recommendations relies heavily on collaboration with numerous bodies, such as CHAWG, Farming Connect, HCC, AHDB and others, to help raise awareness of the benefits of keeping healthier animals. It also fits with Welsh Government’s Well-being of Future Generations Act, making Wales a more prosperous, resilient, healthier place which is globally responsible.
Prevention is critical to success in keeping infection out, according to the plan: identifying it earlier, stopping it spreading and stamping it out. Responsible ownership is also an important part of the strategy across all sectors, including companion animals and the impact dog walking can have on the health of cattle, sheep and other species, for example through Neospora infection.
There must also be a positive relationship of trust and respect between the livestock keeper and their veterinary surgeon, recognising that both have valuable skills to bring to the process. Other professionals, such as nutritionists, and animal housing and genetics experts, can add to the success. Record-keeping is vital to analyse performance, so records must be easily accessed. Working with the vet, a small number of improvement areas can be identified, particularly those with the biggest potential to drive improvements, and an action plan devised for each. These should be regularly reviewed and revised, if needed, until the desired outcome is achieved and maintained. The process of performance analysis, identification of measures to improve, implementation and review then starts again. The cycle could take from weeks to years, depending on the measure that is being addressed.
Biosecurity is another vital component of disease control, particularly bringing new animals on to farm, therefore safe sourcing, risk assessment, quarantine, testing and treatment are key to prevention. Farm boundaries, vehicles, equipment and people can be other sources of potential infection. Recognising that wildlife can also be a source of infection is vital and an effective management policy should be adopted.
The other critical part of the Welsh Implementation Plan is the sustainable use of medicines and its impact on antimicrobial resistance and anthelmintics. Medicines play an important role in animal welfare, but their responsible use is key and illustrates Wales’ global responsibility. The health plan should reduce the initial infection and therefore create less need for interventions. The use of blanket treatments, such as sometimes adopted with dry cow therapy, should be discouraged. Biosecurity plays a vital role here so everything overlaps.
Finally, one Welsh-specific project, which is in its third year, is ‘Gwaredu BVD’112 (see the Infectious disease section). In this RDP-funded programme, the farm vet blood-tests a youngstock group of five animals which have not been vaccinated against BVD, usually at the annual TB test. This is then tested for BVD antibodies and the result, if positive, triggers a £500 grant to help trace the persistently infected (PI) animals behind the problem. Well over two-thirds of Welsh farms have been tested already and good progress has been made to eradicate this damaging disease.
Scottish updateChanges to Animal Health and Welfare Act 1981The Scottish Government is committed to upholding and seeking improvements in its legislation and enforcement framework to benefit animals. Following analysis of consultation responses on proposals to amend the Animal Health and Welfare Act 1981,113 fixed penalty notice (FPN) regimes are being introduced for a wide range of animal health offences.
These new powers will be enacted through the Animals and Wildlife (Penalties, Protections and Powers) (Scotland) Bill and will be subject to strict limits but will also allow for sufficient flexibility to take account of future changes to animal health.

88
FPNs will be introduced via subsequent regulations for offences that might not impact directly on the health of individual animals, but where widespread non-compliance may put the wider animal population at risk – for example, complying with movement restrictions during a disease outbreak.
The Animals and Wildlife (Penalties, Protections and Powers) (Scotland) Bill will also:
• Increase the maximum available penalties for the worst cases of animal welfare and wildlife crimes
• Increase the protection for service animals (Finn’s Law) by requiring courts to disregard protection of an individual when considering if unnecessary suffering has been caused, thereby making it easier for these offences to be prosecuted
• Introduce powers to produce future regulations on fixed penalty notices to improve compliance with animal welfare and wildlife legislation
• Speed up the process for making permanent arrangements for animals taken into possession to protect their welfare, refining the existing arrangements by introducing a robust administrative process that does not require valuable court time
Scottish Animal Welfare CommissionThe Scottish Animal Welfare Commission (SAWC) is a new animal welfare advisory body and is Scotland’s first independent Animal Welfare Commission.114 The Commission, which will be chaired by Professor Cathy Dwyer, will specifically look at:
• How the welfare needs of sentient animals are being met by devolved policy
• Possible legislative and non-legislative routes to further protect the welfare of sentient animals
• The research requirements to provide an evidence base for future policy developmentA total of 12 commissioners have been recruited by open advertisement and sit on the Commission in an individual capacity, not as representatives of particular groups or organisations.
SAWC has a wide remit and develops a work plan each year, published on its website, as well as reporting to ministers on the impact of policy on animal welfare in Scotland. SAWC’s main focus is on the welfare of wildlife and companion animals, but it liaises closely with the Animal Welfare Committee in the UK, particularly with respect to the welfare of farmed animals. Areas of welfare policy for farmed animals that may have a specific focus or impact on Scottish livestock will also be considered by SAWC.
111 Defra, 2018 Health and Harmony: the future for food, farming and the environment in a Green Brexit112 Gwaredu BVD113 Scottish Government, March 2020 Amendments to the Animal Health Act 1981 Analysis of Consultation Responses114 Scottish Government, 24 September 2019. Animal Welfare Commission

8988115 Ruminant Health and Welfare Group
A vision for Ruminant Health and Welfare
First, I must congratulate CHAWG on its activities over the past 10 years and on producing yet another superb report.
Collating such wide-ranging information into a single document serves several crucial purposes. It is a reminder of what has been achieved through CHAWG. It is also a prompt for what we still have ahead of us to do. And it is an invaluable reference library of information to ensure we in the industry, as well as government, media and the public, are accessing the same rigorously compiled facts and figures. The transparency of such a report shows we are not afraid to be accountable and can own our challenges as well as our successes.
Where do we go from here? The new Ruminant Health and Welfare115 organisation has, by necessity, ambitious aims. We are facing the most radical changes to agriculture and the rural economy since the 1947 Agriculture Act, and the cattle and sheep sectors across our four nations need to be ready. At the same time, the coronavirus pandemic that first hit the UK in March 2020 has underlined the value of a secure supply of quality, domestically produced food. We are all, of course, aware of the challenges and opportunities Brexit presents in terms of competition and export trade. Furthermore, the issues of climate change, resource use and sustainability have only receded temporarily – these challenges will re-emerge post-pandemic to demand urgent attention.
Such unprecedented times demand healthier, more productive animals, a strong and positive reputation and a resilient industry. We have all benefited from the coordination and expertise CHAWG has brought cattle health and welfare activities over the past 10 years. We now need to build on this with more resources and momentum so we can accelerate progress on endemic disease and the broader health and welfare challenges. In a UK where animal health powers are devolved across the four nations, there is real value in sharing best practice and our priorities, to identify where collaboration adds value to progress on animal health.
To build the foundations of a changed agenda, we will consult with those working on the ground to identify the disease challenges they face. The survey process will be designed not only to reach across the sheep and cattle sectors but to recognise particular regional issues. That baseline work with the farming community will then be developed into a portfolio of priorities, with the input of stakeholders, such as farm veterinarians, with the support of scientific expertise.
A key focus will be productivity, as addressing the barriers to production efficiency means tackling endemic disease, suboptimal management practices, welfare challenges and waste. Genetics will play an increasing part in underpinning not only production goals but countering the risk of animal welfare being compromised. By improving production efficiency, we can also reduce our greenhouse gas emissions and improve our reputation. Considering endemic diseases and reputational challenges cost the UK cattle and sheep sectors at least £500 million per year, there has never been a more pressing need to address these.
Sheep, beef and dairy production share a multitude of challenges, hence it makes absolute sense to combine forces with each other to increase access to resources and provide a stronger voice. But I want to emphasise that, as this happens, I remain committed to each sector retaining a strong, independent voice within Ruminant Health and Welfare. This is especially the case for the sheep sector, which brings important learnings and expertise to the table, and for other species such as goats and deer, which we hope to work with in the future.
A last point is around the benefits of adopting a UK-wide approach where that collaboration can add value. Many of our challenges respect neither country borders nor political boundaries. Ruminant Health and Welfare will work with partners across the four nations to bring industry and governments together to work collaboratively and speed progress. I am committed to making this work for both sheep and cattle producers and excited to be part of a group that is focused on positive change.
Nigel Miller Chair, Ruminant Health and Welfare Group

90
Glossary of abbreviations
AFU Approved finishing unit (for cattle under TB restrictions)
AHDA Animal Health Distributors’ Association
AHDB Agriculture and Horticulture Development Board (AHDB) – a Levy Board that represents cattle, sheep, pigs, milk, potatoes, cereals, oilseeds and horticulture
AHWBE Animal Health and Welfare Board England
AIMS Association of Independent Meat Suppliers
AMR Antimicrobial resistance
AMU Antimicrobial use
Antibiotic A medicine used to prevent and treat bacterial infections specifically. This report is primarily focused on the use of antibiotics, as a subset of wider antimicrobials
Antimicrobial A product that kills or slows the spread of a range of microorganisms including bacteria, viruses, protozoans, and fungi. Antibiotics are antimicrobials
APHA Animal and Plant Health Agency, formerly AHVLA
ARAMS Animal Reporting and Movement Service for details on movement reporting for sheep, goats and deer within England
AssureWel The initiative undertaken by University of Bristol, RSPCA and the Soil Association to establish farm animal welfare outcome measures
Average The same as ‘mean’ – the total divided by the number of records
BAJVA BCVA Accredited Johne’s Veterinary Adviser
BCMS British Cattle Movement Service
BCVA British Cattle Veterinary Association
BMPA British Meat Processors’ Association
BVA British Veterinary Association
BVD Bovine Viral Diarrhoea
CHAWG Cattle Health and Welfare Group of Great Britain
BBSRC Biotechnology and Biological Sciences Research Council, the lead funding agency for academic research and training in the biosciences at universities and institutes throughout the UK
BMSCC Bulk milk somatic cell count
Breedplan An Australian genetic evaluation system for beef cattle breeders that supplies services to some breed societies in GB
CDI The Centre for Dairy Information
CHCSB Cattle Hoof Care Standards Board
CHeCS The Cattle Health Certification Standards, a non-trading organisation established by the cattle industry in UK and Ireland for the control and eradication of non-statutory diseases

9190
CIS The Cattle Information Service
COWS Control of Worms Sustainably – an industry stakeholder group that aims to promote best practice in the control of cattle parasites
CTS Cattle Tracing System
CVO Chief Veterinary Officer
Dairy UK The trade association for the British dairy supply chain
Defra The UK Government’s Department for Environment, Food and Rural Affairs
DCDvet Defined Course Dose for animals – the assumed average dose per kg animal per species per treatment
DDDvet Defined Daily Dose for animals – the assumed average dose per kg animal per species per day
DMCP Dairy Mastitis Control Plan
DSC Disease Surveillance Centres
eAML2 The electronic version of the pig movement licence (AML2) which combines the AML2 and Food Chain Information (FCI) paper forms required when moving pigs to slaughter
EBV Estimated breeding value
EFSA European Food Safety Authority
EMA European Medicines Agency
EMA AMEG European Medicines Agency’s Antimicrobial Expert Group
eMB The electronic Medicine Book, designed by AHDB to electronically collate antibiotic usage data from the UK pig sector
ESVAC European Surveillance of Veterinary Antimicrobial Consumption
FSA Food Standards Agency
FAWL Farm Assured Welsh Lamb
FUW Farmers Union of Wales
HCC Hybu Cig Cymru – Meat Promotion Wales, responsible for the development, promotion and marketing of Welsh red meat
HP-CIA Highest Priority Critically Important Antibiotic (for human medical purposes), as defined by the EMA
IAAS Institute of Auctioneers and Appraisers for Scotland
IBR Infectious Bovine Rhinotracheitis
LAA Livestock Auctioneers Association
LDA Left Displaced Abomasum
LDDG Livestock Demographic Data Groups
LFA and Referring to land that is classified as Less Favoured Area and non-Less Favoured Area non-LFA according to its inherent challenges to productivity and the subsidy support for which it
may be eligible. Also refers to herds kept on one area or the other

92
Mean The same as ‘average’ – the total divided by the number of records
Median The value lying at the midpoint of a distribution, such that there is an equal probability of falling above or below it
mg/PCU Milligrams per PCU – the unit of measurement developed by the EMA to monitor antibiotic use and sales across Europe, which has also been adopted by the UK in its national reports
NBA National Beef Association
NBDC National Bovine Data Centre
NFU National Farmers’ Union
NFU Cymru The National Farmers’ Union’s Welsh arm
NFUS National Farmers’ Union of Scotland
NJMP National Johne’s Management Plan
NMR National Milk Records
NPTC City & Guilds land-based services, the UK’s largest awarding body in the land-based sector, encompassing agriculture, horticulture, forestry, animal care, conservation and machinery
OV Official Veterinarian, the term used to describe private practice veterinarians who perform work on behalf of an EU member state
PCR Polymerase Chain Reaction or PCR is a test that reproduces (amplifies) selected sections of DNA or RNA for analysis
PCU Population Correction Unit, which is used to help measure antibiotic use. PCU takes into account the animal population as well as the estimated weight of each animal at the time of treatment with antibiotics
PI Persistently infected (with BVD)
QMS Quality Meat Scotland, the levy board representing the red meat industry in Scotland
RABDF Royal Association of British Dairy Farmers
RADAR Rapid Analysis and Detection of Animal-related Risks – captures and processes data from a range of sources including the BCMS Cattle Tracing System (CTS)
RAMA Registered animal medicines adviser is the name AMTRA gives to those people described as SQPs (suitably qualified persons) by the Veterinary Medicines Regulations
RDA Right displaced abomasum
RDPE Rural Development Programme for England
Red Tractor A food assurance scheme that covers production standards on safety, hygiene, animal welfare and environment
RFM Retained foetal membranes
ROCFT Register of Cattle Foot Trimmers
RoMS Register of Mobility Scorers
RUMA Responsible Use of Medicines in Agriculture Alliance
SAC Consulting Part of SRUC

9392
SARS Suspected Adverse Reaction Surveillance Scheme
SBV Schmallenberg Virus
Signet Signet Breeding Services provides genetic evaluations to sheep and cattle breeders and is funded by AHDB, HCC in Wales and QMS in Scotland
SQP Suitably qualified person – a category of professionally qualified persons who are entitled to prescribe and/or supply certain veterinary medicinal products under the Veterinary Medicines Regulations
SRUC Scotland’s Rural University
TMR Total mixed ration – a method of feeding cattle that combines all forages, grains, protein feeds, minerals, vitamins and feed additives into a feed
VARSS Veterinary Antimicrobial Resistance and Sales Surveillance – a collection of reports from the VMD providing the details of UK veterinary antibiotic resistance and sales surveillance
VEERU Veterinary Epidemiology and Economics Research Unit, University of Reading
VIDA Veterinary Investigation Diagnosis Analysis
VIO Veterinary Investigation Officer
VMD Veterinary Medicines Directorate
WLBP Welsh Lamb & Beef Producers Ltd
WHO World Health Organisation

94
Appendix: Dairy bull calf strategy
Priority Aspiration Actions Coordinated by By when
Rear all calves with care
All people working across the calf supply chain must deliver on their responsibilities for good calf health and welfare
• Rear dairy bull calves with as much care for welfare as other calves• Dairy farmers and the wider supply chain to work together to achieve best practice to
ensure all calves get the best start to life and are viable for the beef sector• Milk purchasers commitment to encourage farmers to ensure that no healthy calf shall be
euthanised on farm• Minimise mortality through the use of best calf management and rearing protocols• Work with training providers to offer vocational qualifications on calf rearing as part
of apprenticeship programmes
Encourage responsible breeding strategies through farm assurance
Breed calves that are economically attractive to potential beef buyers/rearers
• Dairy farmers to demonstrate commitment to reduce the number of economically unviable calves through responsible breeding strategies
• Promote better breeding tools and techniques such as the use of sexed semen• Maximise the use of beef cross-breeding in the dairy herd to increase the potential value
of the resulting calves • Encourage the recording of sire ID when registering a calf with BCMS
Better communication of market requirements
Better communication of the market requirements to ensure suitable beef animals are being produced for the market
• Ensure calf specifications are known and communicated to dairy farmers so they can breed suitable calves for the beef supply chain
• Promote efficiency throughout the dairy and beef industry via benchmarking• Encourage feedback from finishers to calf producers on the performance of their calves
and their carcase weight and quality• Milk purchasers commitment to support dairy farmers by working with the supply chain
Supply chain
Increase the number of biosecure routes for TB-affected herds
Through an industry-led forum with government participation, achieve an increase in the number of Approved Finishing Units (AFUs), Licensed Finishing Units (LFUs), alongside an increase in Isolation Units (IUs) to create robust supply chains in England and Wales
• Improve uptake and use of AFUs and increase the number of suitable premises to set-up IUs
• Government policy on IS and AFU is driven by measures that will eventually lead to TB eradication. Units housing cattle from TB restricted herds must have biosecurity as their main protection against the spread of TB locally and must have operational and licencing conditions that reflect their primary role
• Government policy requires flexibility to determine, whether AFUs and IUs remain appropriate for areas with changing TB incident to protect the TB status of the local area
• IU are only applicable to a single keeper at any one time • The forum needs to consider how AFUs can be set up that do not financially disadvantage
TB restricted keepers in favour of the profitability of the unit
Supporting Britain’s beef sector
Commitment from food businesses to support Britain’s farmers to move away from euthanasia of dairy bred bull calves and back British beef
• A firm commitment to sourcing beef from the nations and regions of Britain• Identify the opportunities within the foodservice sector to source more British beef• Communicate plans for any new policies with suppliers, to allow them to plan ahead
and phase in any changes• Promote high welfare rose-veal/dairy bull beef, to increase demand
Retailers, food service and processors
Opening up new pathways and supply chain opportunities for dairy bred calves
Develop robust supply chains for high-quality, farm assured dairy beef and veal
• Collaboration across supply chains to develop new opportunities for dairy and beef bred calves, linking milk and beef supply chains
• Encourage model supply chain contracts with agreed pricing, standards and requirements• Encourage new entrants into dairy-beef calf rearing, explore the potential of grants
for new entrants and expansion of established dairy beef farms • Encourage dairy and beef farmer partnerships• Update regulatory definition, to reduce the age where beef is classified as beef from
12 months to 8 months of age • Identify new market outlets for British beef and explore the growth of alternative markets
for 8- to 12-month-old cattle
Supply chain
Innovation and supporting R&D
Prioritise innovation and R&D, which will improve technical efficiency, reduce costs of production and retain positive consumer perceptions
• Ensure practices and standards for calf management are underpinned by contemporary science and research
• Develop a process that helps farmers choose the most appropriate bull for their farming system or target market
• Develop outcome measurements for higher welfare assessment of calves • Develop cost-effective penside tests to assess whether colostrum has been given and
absorbed effectively • Research best practice to optimise the cost-efficiency of sexed semen• Develop a genetic index to help farmers make informed sire selection decisions• Establish an improved traceability platform that will allow enhanced tracking and
monitoring of health and welfare across the lifetime of the animal • Track and monitor consumers’ perception of dairy bull calves• Research and develop innovative rearing and finishing systems with lower cost
of production and potential environmental benefits
Government and industry
Key Short-term deliverable (1–2 years)
Medium-term deliverable (2–4 years)GB Dairy Calf Strategy 2020–23
This strategy is supported by the following organisations: ABP BeefAnimal Health Distributors Association (AHDA)Aldi UK & IrelandArlaAsda British Cattle Veterinary Association (BCVA)British Retail Consortium Buitelaar Production Ltd.Cogent Co-op FoodDairyUKDunbiaDepartment for Environment, Food and Rural Affairs (Defra)
First Milk GenusHybu Cig Cymru (HCC) LidlMarks & SpencerMcDonald’sMeadow FoodsMeadow Quality MorrisonsMullerNational Beef Association (NBA)National Farmers Union CymruNational Farmers Union Scotland (NFUS)National Milk Records (NMR) National Youngstock AssociationQuality Meat Scotland (QMS) Royal Association of British Dairy Farmers (RABDF)
Red Tractor Assurance Royal Society for the Prevention for Cruelty to Animals (RSPCA)Ruminant Health and Welfare GroupSainsbury’sSellMyLivestockScottish Agricultural Organisation Society (SAOS)Scottish GovernmentTesco University of Nottingham Ruminant Population Health GroupWelsh GovernmentWestpoint
Input gratefully received from: Rob Drysdale
Contact: [email protected]
The full strategy is available at: ahdb.org.uk/GB-calf-strategy

9594www.chawg.org.uk
© Cattle Health and Welfare Group of Great Britain 2020.All rights reserved.