fig. 1. shimmer meter - university of maine...
TRANSCRIPT
UNIVERSITY OF CALIFORNIA, SAN DIEGO
SCRIPPS INSTITUTION OF OCEANOGRAPHY
VISIBILITY LABORATORY
SAN DIEGO, CALIFORNIA 92152
AN APPARATUS FOR THE MEASUREMENT OF
AN EFFECT OF ATMOSPHERIC BOIL
(The Shimmer Meter)
S. Q. Duntley, J. L. Harris, R. W. Austin
DISTRIBUTION OF THIS DOCUMENT IS UNLIMITED
SIO Ref. 68-15
July 1968
Naval Ship Systems Command
Contract NObs-84075
Assignment 9
Final Report
Approved:
^<&.fll **»***'
Seibert Q. Duntley, Director Visibili ty Laboratory
M ^
Approved for Distribution:
William A. Nierenberg, Director Scripps Institution of Oceanography
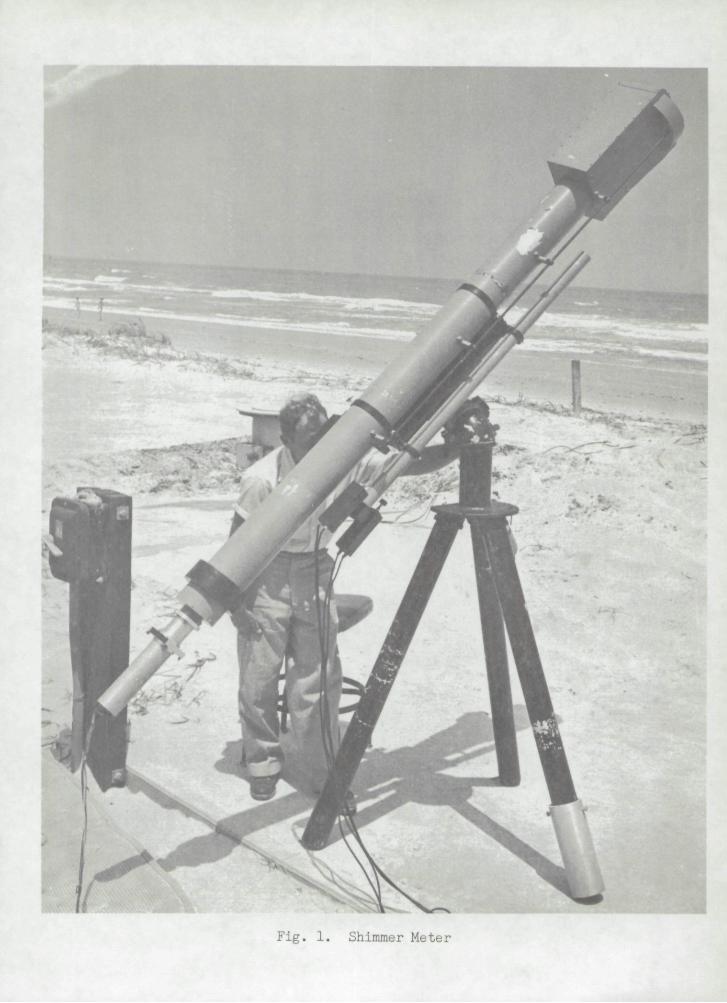
Fig. 1. Shimmer Meter

-i-
POREWORD
This report describes many previously unpublished details concerning
an instrument which was constructed, used briefly, and dismantled during
1957. The device was for the measurement of the blurring of fine details
by atmospheric boil in the case of images formed by telescopic or
photographic objectives of long focal length. A recent resurgence of
interest in this topic has resulted from current research on the res
toration of atmospherically distorted images by means of image process
ing. This has prompted certain former work on effects due to atmospheric
boil to be reviewed.
Most of this report has been lifted almost verbatim from internal
memoranda or letters written in 1957. Almost no effort has been made
tu update the concepts expressed in those writings. Thus, with minor
exceptions, the report is exactly as it might have been issued in 1957.
The concepts contained in the sections entitled "INTRODUCTION AND
SUMMARY" and "TilE ;,ATUR»: OF ATMOSPHERIC BOIL" (except for the short sub
section called "Soft Snimmer a m Hard Shimmer") do not conform completely
with tnose held by the authors in 1968, but it has been decided to issue
these sections jus':, as they were written in 1957 because in no other
way can the background against which the "shimmer meter" was conceived,
designed, and usee bo made clear.
The work described by this report was performed in 1957 under
riureau of Ships contract A'Lbs-7209 '. The report has been prepared and
issued as the final report under assignment 9 of contract NObs-84075.
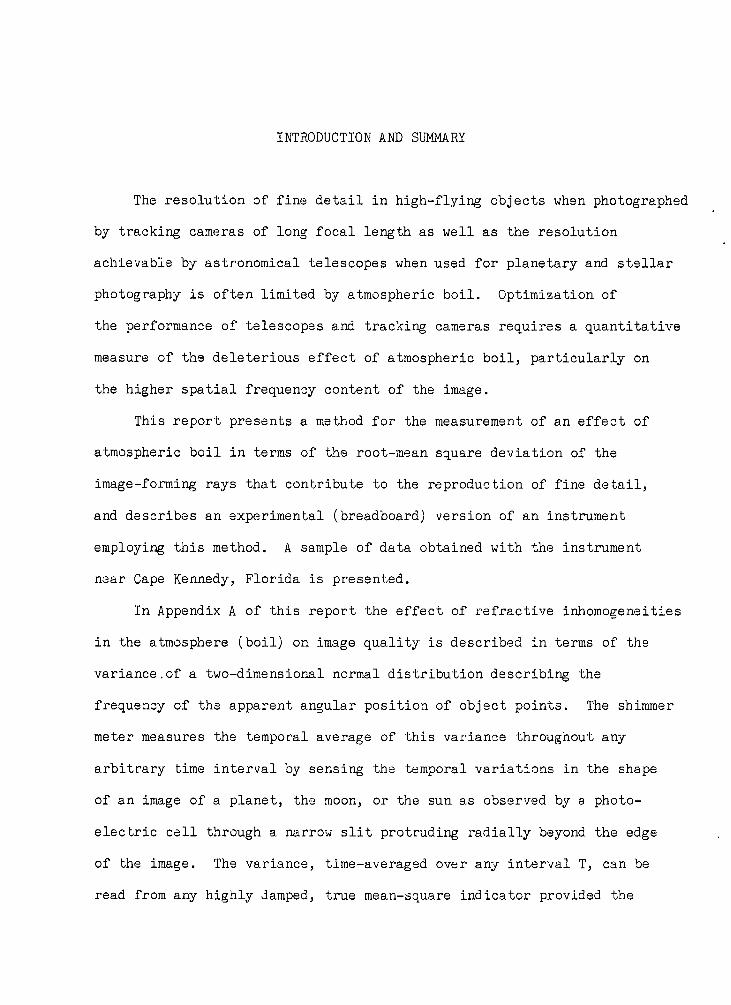
INTRODUCTION AND SUMMARY
The resolution of fine detail in high-flying objects when photographed
by tracking cameras of long focal length as well as the resolution
achievable by astronomical telescopes when used for planetary and stellar
photography is often limited by atmospheric boil. Optimization of
the performance of telescopes and tracking cameras requires a quantitative
measure of the deleterious effect of atmospheric boil, particularly on
the higher spatial frequency content of the image.
This report presents a method for the measurement of an effect of
atmospheric boil in terms of the root-mean square deviation of the
image-forming rays that contribute to the reproduction of fine detail,
and describes an experimental (breadboard) version of an instrument
employing this method. A sample of data obtained with the instrument
near Cape Kennedy, Florida is presented.
In Appendix A of this report the effect of refractive inhomogeneities
in the atmosphere (boil) on image quality is described in terms of the
variance.of a two-dimensional normal distribution describing the
frequency of the apparent angular position of object points. The shimmer
meter measures the temporal average of this variance throughout any
arbitrary time interval by sensing the temporal variations in the shape
of an image of a planet, the moon, or the sun as observed by a photo
electric cell through a narrow slit protruding radially beyond the edge
of the image. The variance, time-averaged over any interval T, can be
read from any highly damped, true mean-square indicator provided the
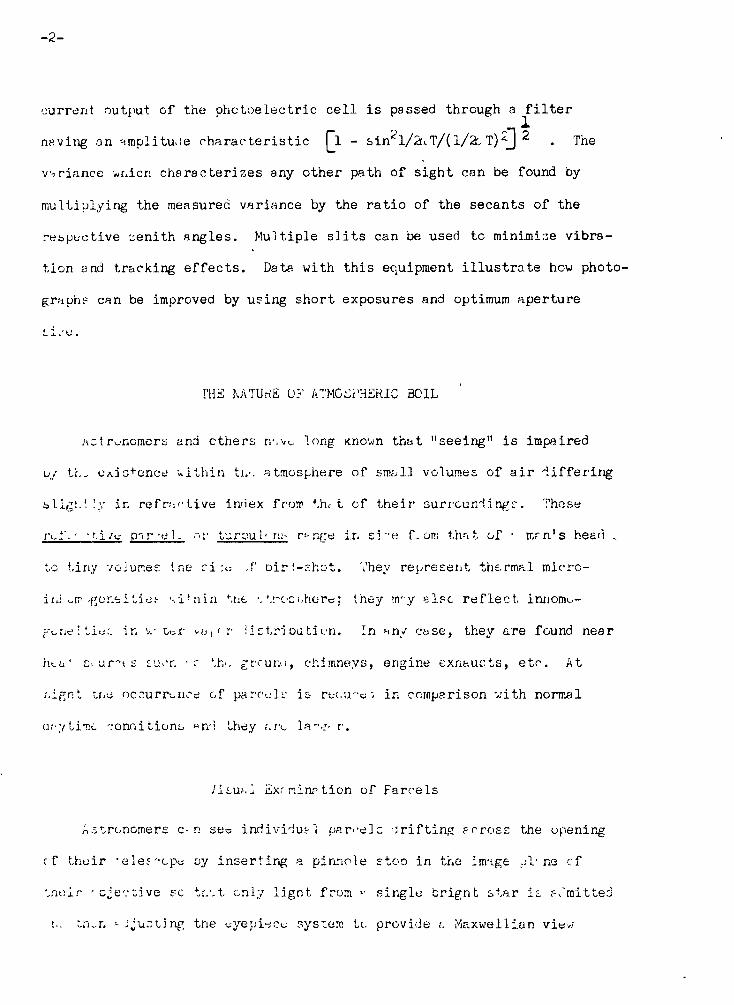
- 2 -
cu rrer.it output of the photoelectric ce l l i s passed through a f i l t e r
naving on nmplitu>ie charac ter i s t ic (~1 - sin l/2:/,T/(l/2:, T^J 2 . The
variance wnicn characterizes any other path of sight can be found by
multiplying the measured variance by the r a t i o of the secants of the
respective zenith angles. Multiple s l i t s can be used to minimise vibra
tion and tracking ef fec ts . Data with th i s equipment i l l u s t r a t e how photo
graph? can be improved by using short exposures and optimum aperture
i . i . 'u .
THE NATUrtE 01-' ATMOSPHERIC BOIL
.Hctr^norncrs and e t h e r s n'.v<_ long Known t h a t "see ing" i s impaired
u/ th - OAJG+ence wi th in tu-. atmosphere of small volumes of a i r d i f f e r i n g
faligi.'. ly in r e f r a c t i v e index fron1 the t of t h e i r sur roundings . Those
rif.,- T.i^o pnr -el .. .-,r turoui- n;- r>-r42e in s i - e f. on; t h a t of • mrn 's head _
tc t iny voiur.es tne r i w. A' o i r l -~ .hot . Vhey represen t thermal micrc -
i i j i-p .gone i tie.•• '-.i^ain tn t •. t roci .horc: they rrry e l fc r e f l e c t innonK--
^enc'i ti«r. in w tor «,-j,f r i i c t r i o u t i o n . In iny case , they a re found near
ht.ii' E. a r t E £Ui'r. - r \h*. grouno, chimneys, engine exnaur.ts, e t c . At
r.ignt UiM occurrence of parcel;.- i s rec.u~<s; in comparison with normal
anytime '.'onnitionij «nd they ?.re la"-/- r .
litu-c. 1 Exrp.inrtion of Parce l s
Astronomers c-r. sec ind iv idua l pan-el c d r i f t i n g pcross the opening
cf t h e i r ' e lef ' -epe oy i n s e r t i n g a pinhole s too in the irmge .;!• ne cf
t h e i r ' c j ev t ive so t r . t t only l i g n t from <•< s i ng l e b r ign t s t a r i t ?Emitted
r._ Lh-r. -^jur . t inp tne eyepiece system tc. provide ;. Maxwelliun view
- - > -
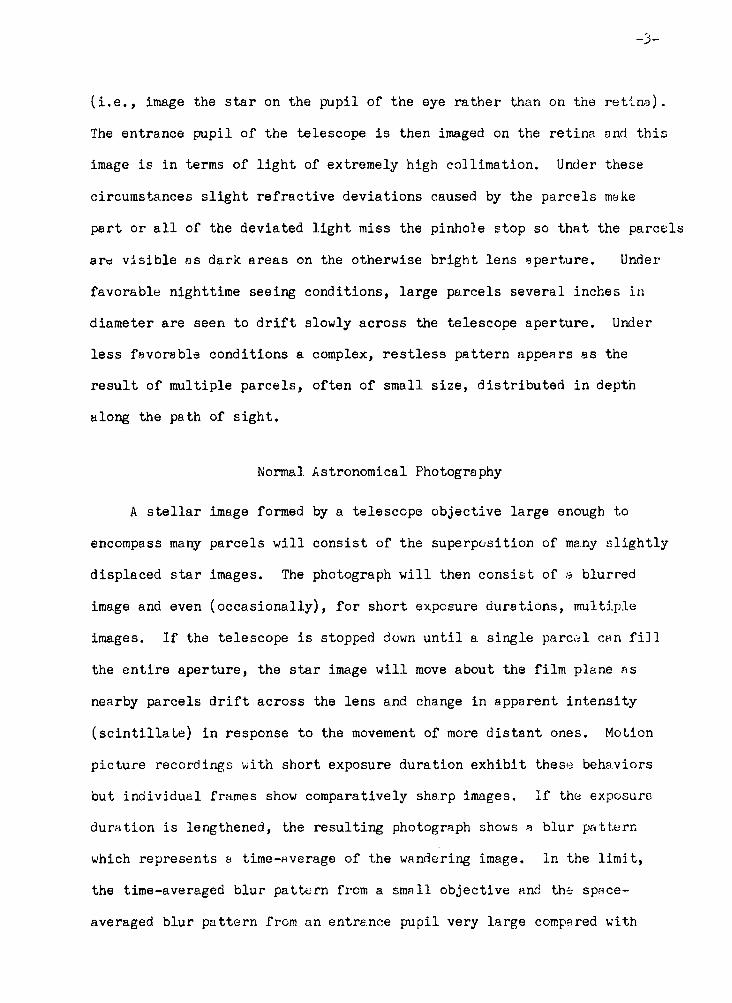
(i.e., image the star on the pupil of the eye rather than on the retina).
The entrance pupil of the telescope is then imaged on the retina and this
image is in terms of light of extremely high collimation. Under these
circumstances slight refractive deviations caused by the parcels make
part or all of the deviated light miss the pinhole stop so that the parcels
are visible as dark areas on the otherwise bright lens aperture. Under
favorable nighttime seeing conditions, large parcels several inches in
diameter are seen to drift slowly across the telescope aperture. Under
less favorable conditions a complex, restless pattern appears as the
result of multiple parcels, often of small size, distributed in depth
along the path of sight.
Normal Astronomical Photography
A stellar image formed by a telescope objective large enough to
encompass many parcels will consist of the superposition of many slightly
displaced star images. The photograph will then consist of a blurred
image and even (occasionally), for short exposure durations, multiple
images. If the telescope is stopped down until a. single parcel can fill
the entire aperture, the star image will move about the film plane as
nearby parcels drift across the lens and change in apparent intensity
(scintillate) in response to the movement of more distant ones. Motion
picture recordings with short exposure duration exhibit these behaviors
but individual frames show comparatively sharp images. If the exposure
duration is lengthened, the resulting photograph shows a blur pattern
which represents a time-average of the wandering image. In the limit,
the time-averaged blur pattern from a small objective and the space-
averaged blur pattern from an entrance pupil very large compared with
-u-
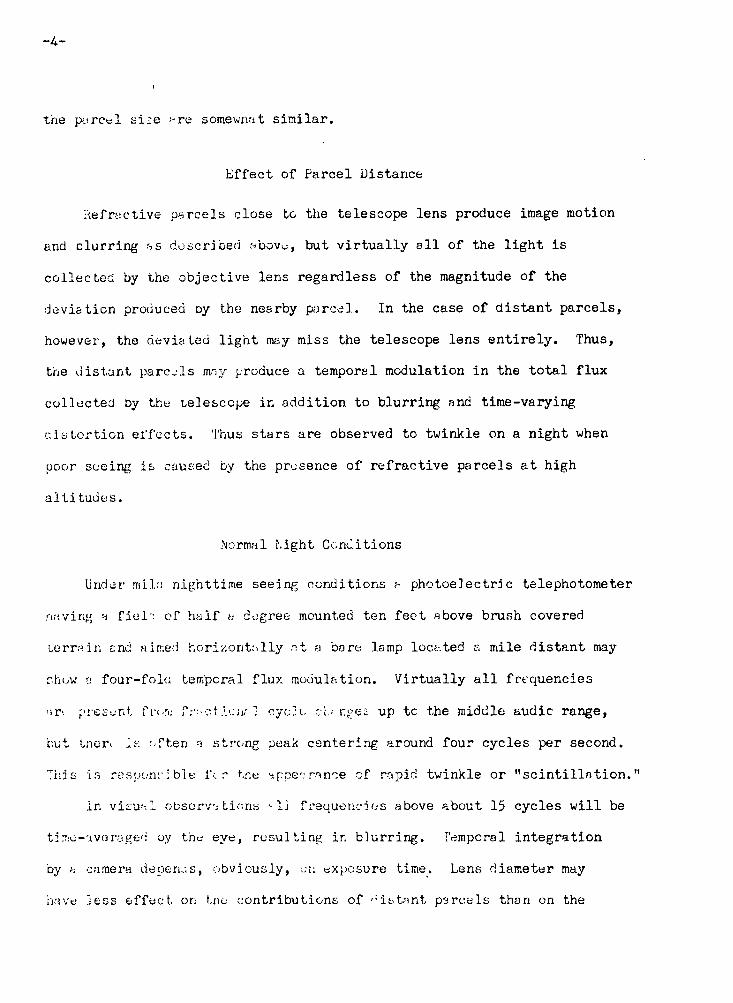
the parcel s i ; e >-re somewnat s imilar .
Effect of Parcel Distance
Refractive parcels close to the telescope lens produce image motion
and clurring as described above, but v i r t ua l ly a l l of the l igh t i s
collected by the objective lens regardless of the magnitude of the
deviation produced oy the nearby parcel . In the case of d i s t an t parcels ,
however, the deviated l igh t may miss the telescope lens en t i r e ly . Thus,
the d is tan t parcels may produce a temporal modulation in the t o t a l flux
collected Oy the telescope in addition to blurring and time-varying
c i s to r t ion effects . Thus s ta rs are observed to twinkle on a night when
poor seeing is caused by the presence of refract ive parcels a t high
a l t i t u d e s .
Normal Light Conditions
Under miln nighttime seeing conditions a photoelectric te le photometer
navirig -i f iel ' : of half a degree mounted ten feet above brush covered
terrain tnd aimed horizontally a t a bare lamp located a mile d is tant may
r.how v. four-folu temporal flux modulation. Virtually a l l frequencies
an present fn-ru f;-:-ctAeij/1 cyc.li. r.-b rget up tc the middle audic range,
but tnon IK r,ften a strong peak centering around four cycles per second.
This io responsible i\ r tr.e -lppea ronce cf rapid twinkle or " s c i n t i l l a t i o n . "
in visual observations •-li frequencies above about 15 cycles wil l be
t i Trie-averaged oy the eye, result ing ir. blurr ing. Temporal integrat ion
by a camera depends, obviously, en exposure time. Lens diameter may
have less effect on trie contributions of ' ' ib tant parcels than on the

- 5 -
ef facts, "uc to parcels close to the objective.
In aeJi t ion tc tne flux modulation, d is tant parcels cause image
wander , nd multiple image formation. Most of the observed deviations
are prooably tne resu l t of many small deviations due to the passage
of lis 'nt tnrough parcel after parcel along the path of the ray. Parcels
oonotimes occur in layers wr.ioh move a t different ve loc i t i e s . Strange
appe-Tir^ effects may resu l t , such as the i l lus ion of waves of shimmering
a i r oriftiiig opposite to the direct ion of the wind.
Day Conditions
Jr.y conditions a re , obviously, of concern in the operation of
tmcKXTk' cameras. The effects caused by refract ive parcels increase
fiftor sunrise and may become severe during the middle of the day. The
parcels become smaller anc tne i r motions due to convection become more
rapid as the ground grows w irrner. Tnere i s , therefore, greater emphasis
on tne higher temporal frequencies, resul t ing in greater temporal in tegra
tion octn visually and photographically. Thun, resolution i s decreased.
Tne refractive Aviations remain quite sna i l , however, rarely
exceeding a minute of arc . ViKei eye receiving power and the resolution
of snort foc-il-length cameras are , therefore, not -appreciably affected,
althcugr. tne L-u-t'er, slower -Juvi-itions are seen as d i s to r t ion and
" shimmer." Tne resolving power t f teles'.-ouic visual systems and of
loiv foe; 1-lenptn cwneras, however, i s nravedly reduced and i t i s a
rare lay /mn .systems inherently capable of resolving - second of arc
ire -Able to 'io oo qiong noriiontal paths of sight close to the ground.
-6-
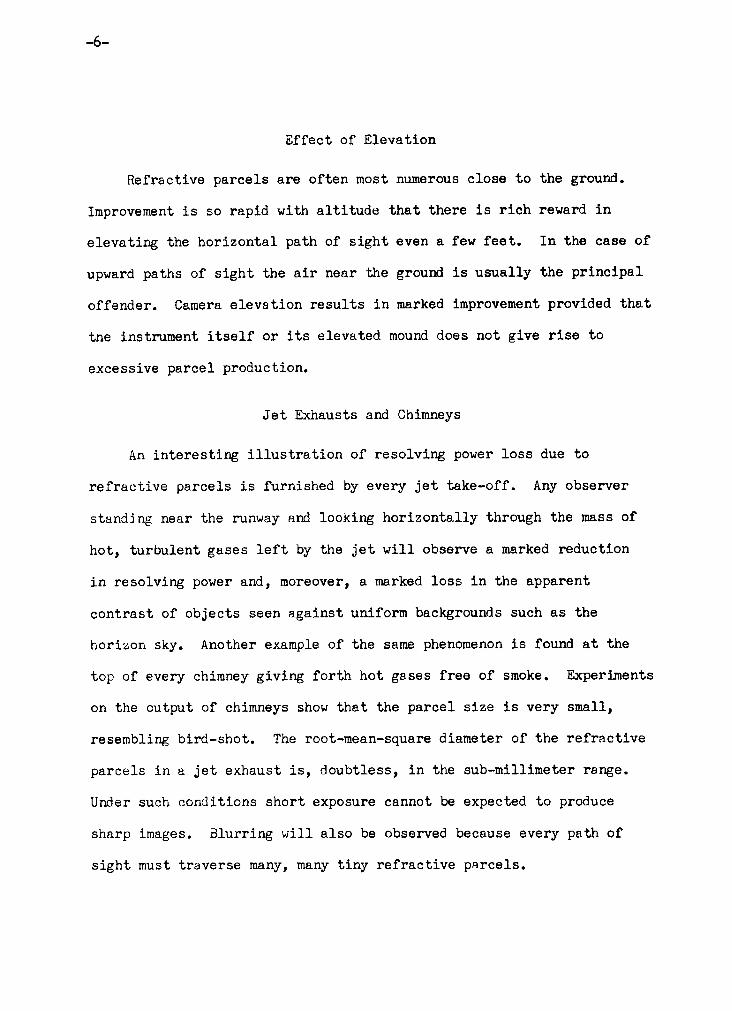
Effect of Elevation
Refractive parcels are often most numerous close to the ground.
Improvement is so rapid with altitude that there is rich reward in
elevating the horizontal path of sight even a few feet. In the case of
upward paths of sight the air near the ground is usually the principal
offender. Camera elevation results in marked improvement provided that
tne instrument itself or its elevated mound does not give rise to
excessive parcel production.
Jet Exhausts and Chimneys
An interesting illustration of resolving power loss due to
refractive parcels is furnished by every jet take-off. Any observer
standing near the runway and looking horizontally through the mass of
hot, turbulent gases left by the jet will observe a marked reduction
in resolving power and, moreover, a marked loss in the apparent
contrast of objects seen against uniform backgrounds such as the
horizon sky. Another example of the same phenomenon is found at the
top of every chimney giving forth hot gases free of smoke. Experiments
on the output of chimneys show that the parcel size is very small,
resembling bird-shot. The root-raean-square diameter of the refractive
parcels in a jet exhaust is, doubtless, in the sub-millimeter range.
Under such conditions short exposure cannot be expected to produce
sharp images. Blurring will also be observed because every path of
sight must traverse many, many tiny refractive parcels.
-7-
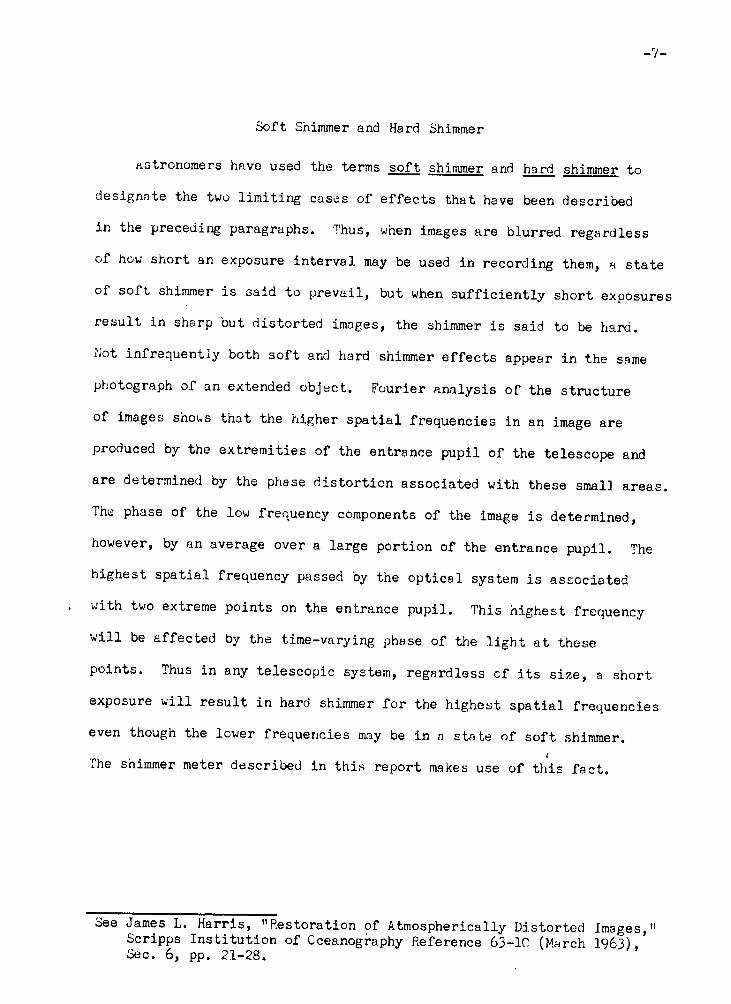
Soft Shimmer and Hard Shimmer
astronomers have used the terms soft shimmer and hard shimmer to
designate the two limiting cases of effects that have been described
in the preceding paragraphs. Thus, when images are blurred regardless
of how short an exposure interval may be used in recording them, a state
of soft shimmer is said to prevail, but when sufficiently short exposures
result in sharp but distorted images, the shimmer is said to be hard.
Not infrequently both soft and hard shimmer effects appear in the same
photograph of an extended object. Fourier analysis of the structure
of images shows that the higher spatial frequencies in an image are
produced by the extremities of the entrance pupil of the telescope and
are determined by the phase distortion associated with these small areas.
The phase of the low frequency components of the image is determined,
however, by an average over a large portion of the entrance pupil. The
highest spatial frequency passed by the optical system is associated
. with two extreme points on the entrance pupil. This highest frequency
will be affected by the time-varying phase of the light at these
points. Thus in any telescopic system, regardless cf its size, a short
exposure will result in hard shimmer for the highest spatial frequencies
even though the lower frequencies may be in a state of soft shimmer.
The shimmer meter described in this report makes use of this fact.
See James L. Harris, "Restoration of Atmospherically Distorted Images," Scripps Institution of Oceanography Reference 63-10 (March 1963), Sec. 6, pp. 21-28.

-8-
QUANTITATIVE RELATIONS
Appendix A of this report is a reprint of a paper entitled "Reduction
of Contrast by Atmospheric Boil" in which equations are developed for
the time-averaged radiance distributions observable by a camera when
looking at objects of circular, square, rectangular, and other shapes
seen against a uniform background such as the sky. In deriving these
equations, use is made of random-walk statistics to develop the theorem
that the time-averaged blur pattern from any point of the object is
Gaussian and describable by a variance or mean-square deviation for the
rays whicn form the fine details of the object. Thus, as shown on
page 357 of Appendix A, the time-averaged absolute apparent contrast
C (z,9,0) at the center of a uniform circular object having an angular
radius ty and an absolute apparent contrast C (z,9,0) in the absence
of shimmer is:
( ICVVAr] Cr(<,9,(ZQ = Cr(a,O,0)ll - e
2 L 7
By replacing the product Ar with the path variance To (/,9,0)J
and considering tne case of an object outside the atmosphere o'.' the
earth, Eq. (1) can be written:
-in,/ / ' ^12
2
0^2,0,0) = Cro(z,0,^) 11 - P '
The notation Cr(z,9,0) denotes the apparent contrast of an object at distance r from an observer at altitude z looking along a path of sight having a zenith angle 9, and ai azimuth angle 0. Correspondingly, ror(z,9,0)i^ refers to the variance of a path of sight of length r terminating at altitude z and having zenith angle 9 and azimuth angle 0.
_Q_
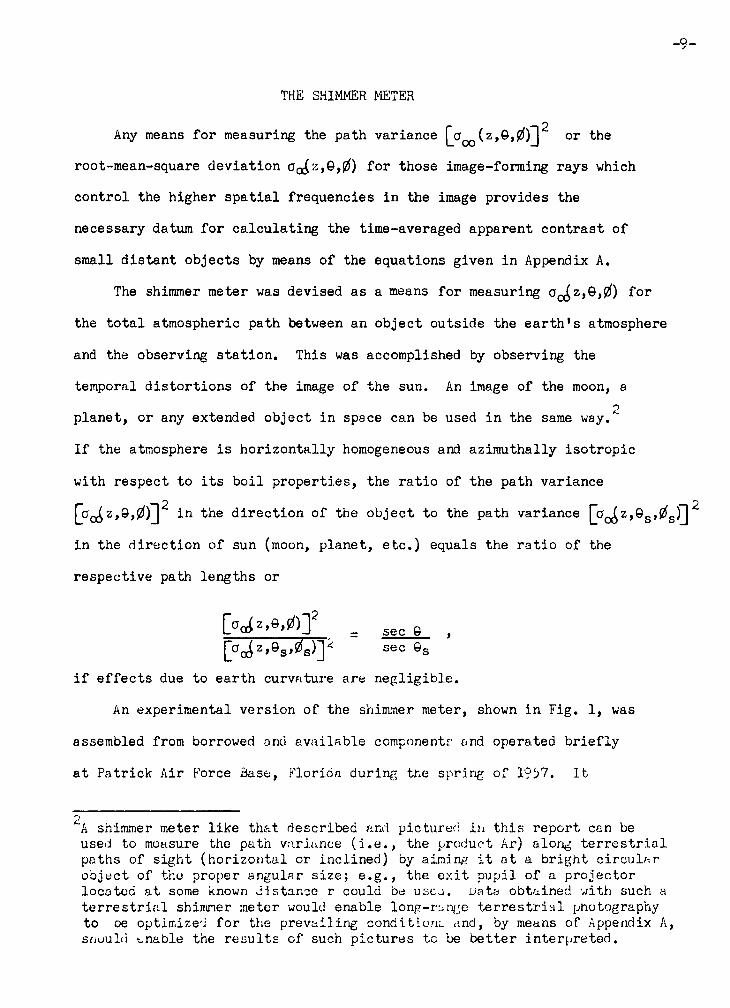
THE SHIMMER METER
Any means for measuring the path variance To* (z,9,0) J or the
root-mean-square deviation 0*0^,9,0) for those image-forming rays which
control the higher spatial frequencies in the image provides the
necessary datum for calculating the time-averaged apparent contrast of
small distant objects by means of the equations given in Appendix A.
The shimmer meter was devised as a means for measuring 0o z,9,(2f) for
the total atmospheric path between an object outside the earth's atmosphere
and the observing station. This was accomplished by observing the
temporal distortions of the image of the sun. An image of the moon, a
planet, or any extended object in space can be used in the same way.'"
If the atmosphere is horizontally homogeneous and azimuthally isotropic
with respect to its boil properties, the ratio of the path variance
rcQ^z^,^)"] in the direction of the object to the path variance ("crcizj©^^)"]
in the direction of sun (moon, planet, etc.) equals the ratio of the
respective path lengths or
[°c^.Q»rt]2 = se^9_ , [aoriz»es»^s)]'i s e c Gs
if effects due to earth curvature are negligible.
An experimental version of the shimmer meter, shown in Fig. 1, was
assembled from borrowed and available componentr and operated briefly
at Patrick Air Force Base, Florida during the spring of 1957. It
'~h shimmer meter like that described and pictured in this report can be used to measure the path va.ria.nce (i.e., the product Ar) along terrestrial paths of sight (horizontal or inclined) by aiming it at a bright circular-object of the proper angular size; e.g., the exit pupil of a projector located at some known distance r could be USCJ. Data obtained with such a terrestrial shimmer meter would enable long-range terrestrial photography to oe optimize'] for the prevailing conditions and, by means of Appendix A, snouLi enable the results of such pictures tc be better interpreted.

-10-
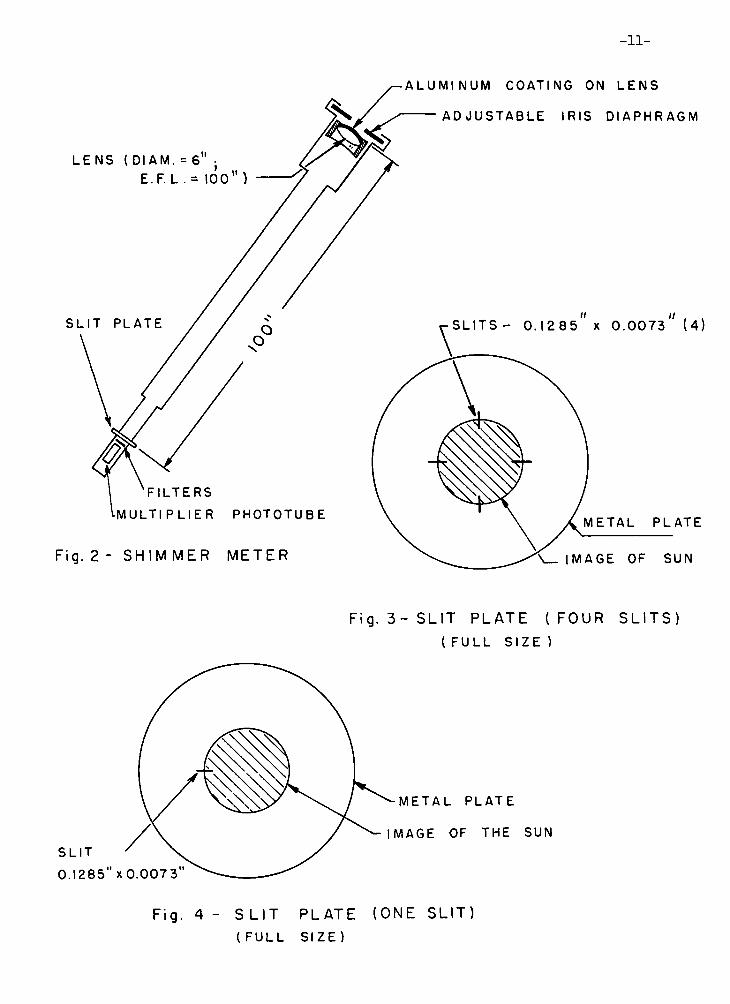
was subsequently dismantled. The optical system of that instrument is
shown schematically in Fig. 2 and a photograph of it appears as a
frontispiece (Fig. 1) of this report. An image of the sun was formed
on a pattern of slits behind which was a multiplier phototube. An
available astronomical objective 6 inches in diameter and 100 inches
in focal length was mounted in an internally blackened and baffled
metal tube and attached to an available crude but rugged equatorial
tripod mounting which carried an aiming telescope. The sun was tracked
manually by means of a hand-operated tangent screw, which is not visible
in Fig. 1. The front surface of the telescope objective was given a
nearly opaque aluminum coating in order to reflect most of the incident
sunlight and, thereby, avoid heating of the internal parts of the
shimmer meter and the air within its tubing. An adjustable iris
diaphragm was mounted in front of the objective lens in order to provide
an easy means for altering the diameter of the entrance pupil of the
system. The solar image was formed on a metal plate containing the
pattern of four radial slits shown in Fig. 3. The only light able to
.reach the cathode of the multiplier phototube passed through these slits.
Only a single radial slit would have been used in the shimmer meter
if the instrument could have tracked the sun perfectly; the four-slit
pattern was adopted only to render the readings of the shimmer meter
immune to tracking imperfections, including vibration of the mount. For
simplicity, consider first the case of perfect tracking. The slit plate
would then appear as in Fig. 4, with the solar image filling half the
slit. Atmospheric boil would then cause the image of the limb of the
sun to move left and right, thereby modulating the flux transmitted by
- 1 1 -
LE
SLI
ALUMINUM COATING ON LENS
ADJUSTABLE IRIS DIAPHRAGM
^MULTIPLIER PHOTOTUBE
Fig. 2 - SHIM MER METER
S L I T S - 0 . 1 2 8 5 x 0 . 0 0 7 3 " (4 )
METAL PLATE
IMAGE OF SUN
Fig. 3 - SLIT PLATE (FOUR SLITS)
( FULL SIZE )
SLIT
O . I 2 8 5 " x 0 . 0 0 7 3
METAL PLATE
MAGE OF THE SUN
Fig. 4 - S L I T PLATE (ONE SLIT) ( F U L L S I Z E )

-12
the slit. The photoelectric photometer measures the modulation of the
flux transmitted by the slit.
Appendix B shows that it is essential for the interpretation of
shimmer meter readings that the motion of the solar limb be almost
completely correlated across the width of the slit. Experiments on
time-varying characteristics of optical transmission through atmospheric
boil have been described by Riggs, Mueller, Graham, and Mote, who
found that for a horizontal path length of several hundred meters the
instantaneous displacement of points separated by one-half minute of
arc were 50 per cent correlated, whereas those of points separated by
more than 5 minutes "of arc were uncorrelated. Based upon the curves
published by Riggs, Mueller, Graham, and Mote, the slits of the shimmer
meter were made l/4 minute of arc in width (i.e., 0.00727 inches) in
the belief that the average correlation of the solar image within slits
of this width is greater than 80 per cent. Light from the sun is so
plentiful that even finer slits could have been used, and an even
greater degree of correlation obtained.
In the absence of tracking errors, the length of the slit could
and should be made short enough to cause the atmospheric displacements
of the image of the solar limb to produce a high percentage of
modulation, thereby relaxing the requirements to be met by the electronic
system. In the case of the experimental shimmer meter, however, the
tangent-screw tracking left much to be desired and the mounting, although
Riggs, Mueller, Graham, and Mote, J. Opt. Soc. Am. 21, 4.15(1947).
The solar image also moves up and down in Fig. 4 hut this component of motion is negligible because of the narrowness of the slit.
-13-
rugged by ordinary standards, did undergo small oscillations whenever
wind was present. Although these tracking defects were eliminated by
the use of the four-slit pattern shown in Fig. 3, it was necessary,
nevertheless, to make the slits long enough to insure that the solar
image would never come to the end of the slit. The slits in the only
slit plate ever prepared were 0.1285 inches in length, corresponding to
265 seconds of arc. Thus, the slits were nearly 18 times as long as
tneir width. Altnough the percentage modulation of the photocell
current was often considerably less tnan 1 per cent when these long
slits were used, the electrical system had no difficulty in successfully
dealing with this signal input and, during the snort course of the
experiments, no other slit plate was maae.
The shimmer meter would have been hopelessly inoperative because
of the manual tracking errors if only a single slit had been used. The
four-slit pattern, however, shown in Fig. 3, eliminated the effect of
manual tracking faults by making the effective fractional length of
the slit filled by solar image always one-half. This was important
since it established the dc level against which the modulation was
measured.
Because the angular diameter of the sun is approximately 30
minutes, the electrical modulation components due tc each of the four
slits were completely uncorrelated. They combine.:, therefore, in the
manner of random events sc tnat the signal-to-noise ratio of the four-
slit shimmer meter *as less oy -. factor of V 4 than tnat which would
have resulted fro* the use of a. single olit, assuming tne average flux
to have been adjusted tc ? selectee level. 1'rds trivia! penalty was
acceptea in order to obtain the vitally needea freedom frc, vibration
and tracking defects.

-u-
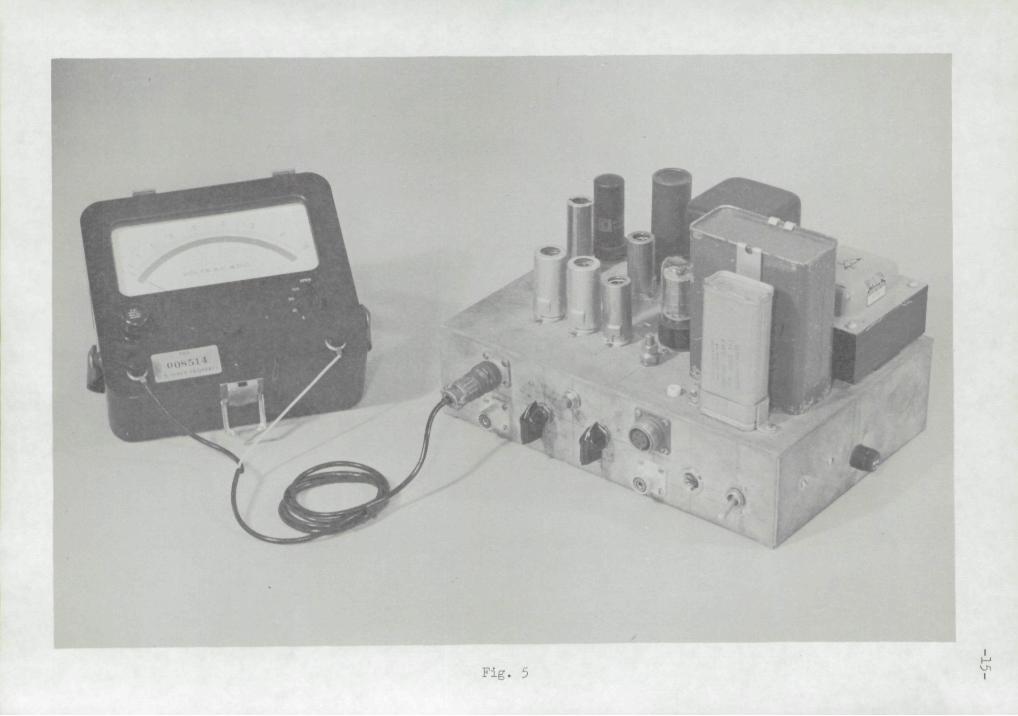
The Electronic System of the Shimmer Meter
The electronic system of the shimmer meter, in addition to the
multiplier phototube, consisted of a single electronic package and a
thermal voltmeter. These units are shown in Fig. 5. The only controls
requiring attention by the operator were the two rotary switches
which appear as black knobs in the photograph. The right rotary switch
controlled the electrical filter and was marked in terras of equivalent
photographic exposure duration, the positions of the switch being
marked respectively, l/lOtn, l/50th, l/lOOth, l/^50th, l/500th, and
l/lOOOth second.
The rotary switcn at the left was an attenuator which controlled the
gain of the amplifier. Its positions corresponded with amplifier
gains of 100, 50, 20, and 10. The circuit employed is shown in Fig. 6.
In the upper right-hand corner of this figure is shown the multiplier
pnototuoe whicn, together with its 6AV6 cathode follower, was mounted
behind the slit plate in the shimmer meter (see Figs. 1 and 2). A
cable connected tne output of this cathode follower tc the chassis shown
in Fig. 5. This contained a high voltage supply and a control circuit
of tne Sweet type designed to operate tne multiplier phototube at a
voltage such that its anode current wus nearly independent of light
level insofar as slow variations in lignt were concerned. Tnis was an
important feature ut-cause, -is a modulation meter, constant dc current
level is esse-ntial tc riirect-reading operation. I'ne success «ith wnic-n
current constancy ub3 t-enievo.: »as ^ernonrtinted whenever thin wisps of
cloud passes acrocs ti.e .:u:.. 1'ner.e ricuds vure sufficiently tenuous
tri t trie sc 1 • r .i k *as alw-.yc visible-, cut tr.c-v »er^ ;jr.Et enougr. tc
M. K. .Tiseet, J. .o~. .ictior, rictur '.n-.'i.'-crc '^Lt 35(1950*
Fie . 5 i

Fig. 6. Circuit Diagram
-17-
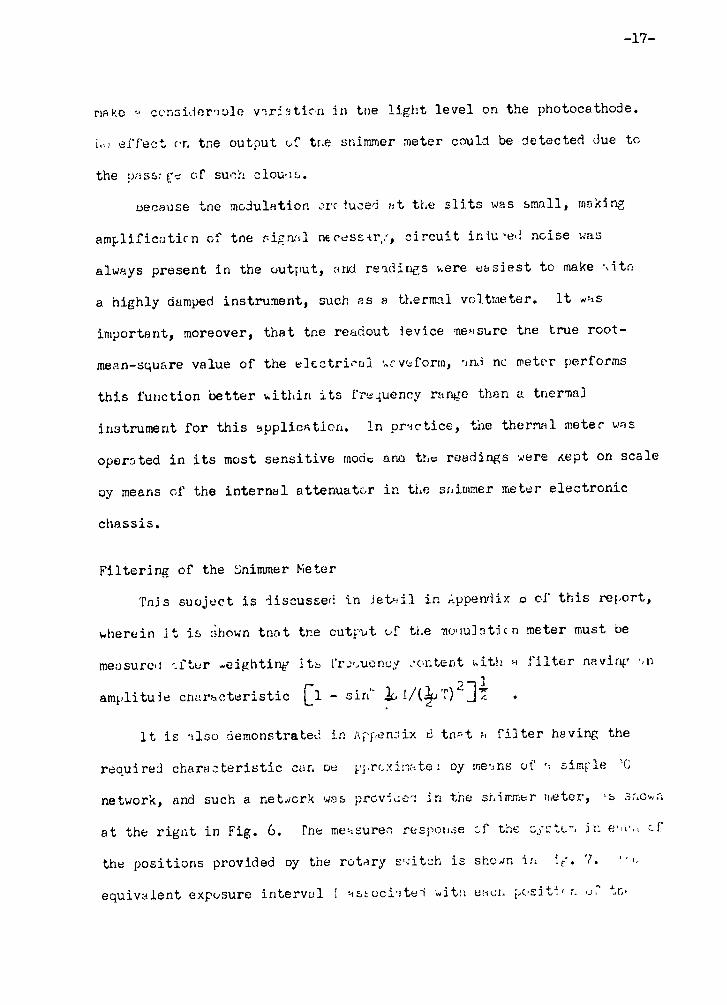
nskc •-> considerable variat ion in tne l ight level on the photocathode.
i-i effect f-n tne output of tr.e snimmer meter could be detected due to
the pass: ge of suoh clou-u,.
uecause tne modulation oi-Huced a t the s l i t s was small, making
amplificatirn of tne signal necessary, c i r cu i t iniu-ed noise was
always present in the output, and readings were eas ies t to make \ i t n
a highly damped instrument, such as a thermal voltmeter. I t was
important, moreover, that tne readout device <neasure tne true root-
mean-square value of the electr i . -al wrveform, a. rid nc meter performs
th is function bet ter within i t s frequency range than a tne ma]
instrument for th i s application. In pract ice , the thermal meter was
operated in i t s most sensi t ive mode ana the readings were Aept on scale
oy means of the in ternal attenuator in the snimmer meter electronic
chassis .
Fi l ter ing of the Snimmer Meter
Tnis suoject i s discussed in detail in Appendix o of th i s report,
wherein i t i& :shown tna t the output of the -nonulaticn meter must be
measured t f t e r weighting i tb frequency .-or.tent with a f i l t e r naving an
amplitude charac te r i s t ic \_1 - sin" i . i/(Jp T)" J l
I t i s also demonstrated in Appendix 6 tn-"-t a f i l t e r having the
required charac te r i s t ic can oe pj.rbxir.ate: oy means of a simple 'C
network, and such a network was provide-: in the shimmer meter, -s sr.cwri
a t the r ignt in Fig. 6. Tne measure." response cf the cycte-. in e-.v.i cf
the positions provided oy the rotary switch is shovn in V« 7. " e
equivalent exposure interval I as tocia te l wit:i uaon pos i t i ' r. uT tn>

100
90
80
70 —
60-Xo
7. 100 NOMINAL EXPOSURE DUR
(SEE TABLE I)
/ 2 5 0
500 'A
i ' / .
0& I
1000
10 100
F R E Q U E N C Y ( C Y C L E s / S E C O N D )
0 0 0 10,000
Fig . 7
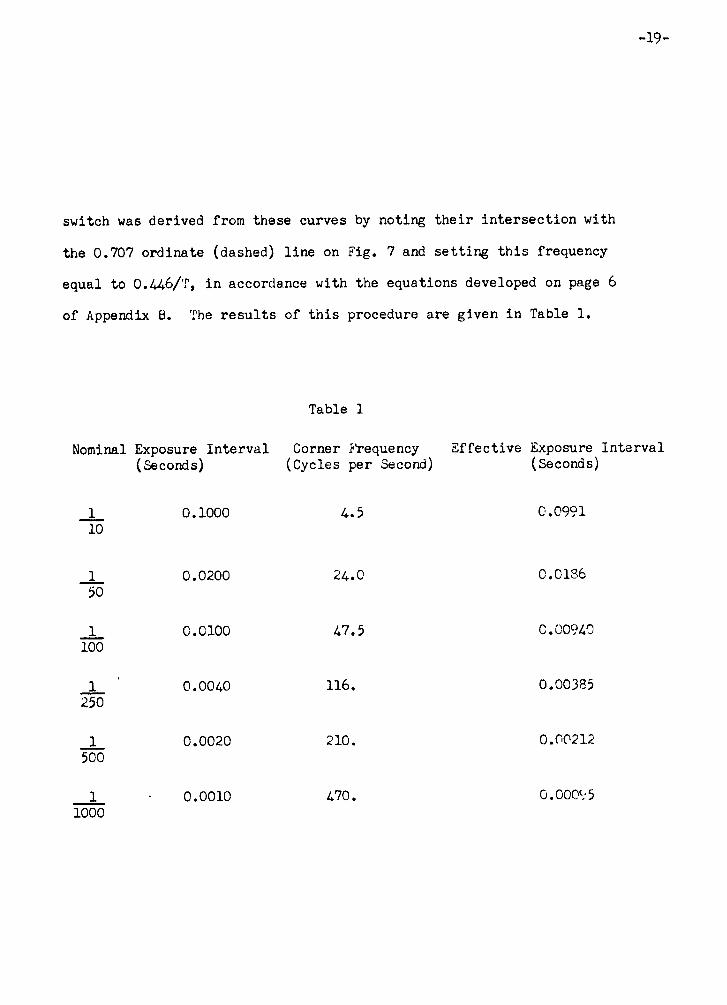
switch was derived from these curves by noting their intersection with
the 0.707 ordinate (dashed) line on Fig. 7 and setting this frequency
equal to 0.44.6/T, in accordance with the equations developed on page 6
of Appendix B. The results of this procedure are given in Table 1.
Table 1
Nominal Exposure Interval Corner Frequency Effective Exposure Inte (Seconds) (Cycles per Second) (Seconds)
1 10
0.1000 4.5 0.0991
_1_ 50
0.0200 24.0 C.0186
1 100
0.0100 47.5 C. 00940
1 250
0.0040 116. 0.00385
1 500
0.0020 210. 0.00212
1 1000
0.0010 470. 0.00095
-20-
Perforraance of the Snimmer Meter Electronic System
Tests of tne constancy of the multiplier phototube anode current
for various dynode voltages shewed the characteristics plotted in Fig. 8.
This is an amazing constancy inasmuch as the dynode voltage range
corresponds to more tnan 1000 to one in light level at the photocathode.
The small residual variation in anode current was of marginal importance
in its effect on the absolute magnitude of the signal indication of
the instrument but was reflected in the noise output of the system.
This was sometimes sufficient to require corrections to be made in the
data. It was important, moreover, to restrict the light level at the
photocathode by means of fixed filters attached to the phototube in
oraer to keep the dynode voltage from having too high a value and
producing, thereby, excess circuit noise. This is illustrated by
Fig. 9, which shows measurements of rms noise output from the system
for various dynode voltages. Typical operating conditions with one
fixed neutral filter attached to the phototube are indicated by the
vertical lines drawn through these curves. Ideally a variable density
neutral filter should be used at the phototube in order that all
measurements can be made at that dynode voltage which yields the smallest
noise-and-ripple; from Fig. 9 this is seen to be approximately 475 volts.
A servo-operated variable density neutral filter could have been
incorporated in the instrument for this purpose.
Corrections of the data for noise can be made in terms of the
curves in Fig. 9 if the dynode voltage is measured. A test point was
provided on the chassis for connecting an external voltmeter for this
puroose. It snould be noted that the noise and signal currents combine
as tne square root of the sum of the squares of their separate values.

<
a: 3 O
UJ Q O
400 500 600 700 DYNODE VOLTAGE
800 900 1000
Fig . 8
TO
I

-22-
R M S NOISE OUTPUT ( V O L T S )
F ig . 9

-23-
C a l i o r a t i o n of the Shimmer Meter
The shimmer meter measures root-mean-square modulation (M) of the
l i g h t a r r i v i n g a t the photocathode of the m u l t i p l i e r phototube . This ,
in t u r n , depends upon the product of the rms dev ia t ion of image-forming
rays ( c ) , the average f r a c t i o n a l length of s l i t covered by the so l a r
image (B), the angular length of the s l i t s ( s l i t length L divided oy
l ens focal length F) and the square roo t of the number of s l i t s used
in tne p a t t e r n W). Thus,
M = cJ,,9,0)/B^j\/r
From an e l e c t r i c a l s t andpoin t , the measured modulation i s the
r a t i o of the rms output voltage diminished oy the gain of tne amplifier-
to tne average dc vol tage c-cross the loan r e s i s t o r of trie m u l t i p l i e r
{Phototube. Thus
where V i s tne rms vol tage indicated oy the tnerrul rr.etor, J i c t-.e
gain s e t t i n g of tr.e a t t e n u a t o r switch, 1 i~ ti.e -'icve - r r e i . t '*'.' tu-
m u l t i p l i e r phototuoe, ano 'i i s tne r e s i s t live t f u.i. ",.: .'• r;.;- !.-< < : .
Combining tnese two equat ions for r-.-£. io. ,ul-. tI H V. u:r ..civ!:«.. f- ••
a {?.,$,$) there r e s u l t s

-24-
Ir. trie ox-perimental shimmer meter, the cons tan t s in the above equat ion
i.a ' tbe following v a l u e s :
J = \/<L
L = 0.1285 inches (L/F = 265 seconds of a rc )
i- = 10C.C inches
i\ = U
1 = 5.70 x 1C amperes, i f the dynode vo l tage i s 4-75 v o l t s
h = 20.0 x 10° ohms
"hus,
i * -5 n j . . 9 . f i t e *. (0.1285) ( 4 ) " V = 1.13 x 10 ^ V rad ians
(1CC.C) (5 .70 x 10"6) (2C.0 x 1C6)G G
or
c (^ ,9 ,^ ) = «-.3«-V/G seconds of a r c .
Aitr, s K i l l f u l t r ack ing of the sun, the shimmer meter could have
oeen ma ie d i r e c t reading by using s l i t s 0.1285/2.3." = 0.0554." long,
s ince tneii o (.'.,9,0) = 1.00 \//G seconds of a r c .
I t Is i n t e r e s t i n g and s i g n i f i c a n t t n a t tne c a l i b r a t i o n of the
.rii~.ier -..eter is e n t i r e l y specific*" by i t s geometry and by measurable
e l e c t r i c 1 o l r . -u i t j - r r . e t e r s . fhe c a l i b r a t i o n i s va l i d , however,
cr.ly i f ti.e motion cf Lr.e image of trie s o l a r limb i s completely
cor ra l - to? ac ross tne wi i th of trie s l i t . This requirement i s examined
ana ly t i c - l l y In Appendix G of ti i s r e p o r t .

-25-
EXPERIMENTS WITH THE SHIMMER METER
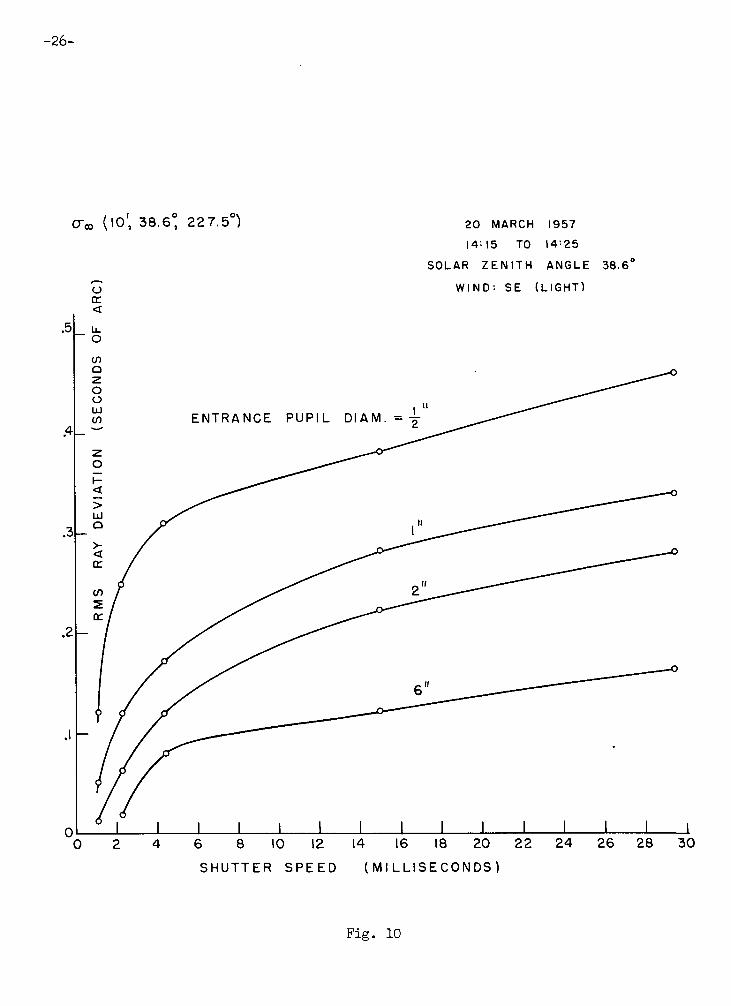
All of the data obtained with the shimmer meter were collected near
Cape Kennedy, Florida, during the spring of 1957. The instrument
was located at tracking camera stations along the beach overlooking
the Atlantic Ocean. Figure 10 depicts a series of measurements on
20 March 1957. The rms deviation of image-forming rays associated with
the solar image is seen to increase with exposure duration and to
decrease as lens diameter is made progressively larger.
The effect of shimmer was less pronounced at the same location
and at the same hour on the afternoon of 27 March 1957, as shown by
Fig. 11. The same trends are seen in the data although the magnitudes
of the readings were less.
APPLICATIONS OF SHIMMER METER DATA
The performance of diffraction limited telescopic systems in the
presence of atmospheric boil is affected and controlled by both the
soft and the hard components of shimmer as well as by diffraction. The
instrument described in this report yields no information concerning
the effects of soft shirmer, but this was believed, in 1957, to have
negligible effect upon the uses to which tracking cameras were then
being put. Optimization of telescope and camera aperture size unde-
prevailing atmospheric conditions and assessment of the reward for
reductions in exposure duration were among the envisioned applications
of the instrument. It was intended also for use in selecting sites
for large telescopes and cameras.
-26-
CTco (10', 38.6° 22 7.5°)
o rr <
en o z o o LU if)
> LU Q
>-< rr
(/)
rr . 2 -
_L J L
20 MARCH 1957
I4M5 TO I4 '25
SOLAR ZENITH ANGLE 38.6°
WIND: SE (LIGHT)
ENTRANCE PUPIL D I A M . = 4 "
1 _L 1 1 i 6 8 10 12
SHUTTER SPEED
14 16 18 20 22
( M I L L I S E C O N D S )
24 26 28 30
Fig . 10

-27-
0 - ^ ( 1 0 , 3 7 . 0 , 2 2 4 . 5 )
27 MARCH 1957
14:05 TO 14: 14
SOLAR ZENITH ANGLE 37.0°
WIND: NE (BRISK)
HIGH THIN CLOUDS
2 3 4 5
E N T R A N C E P U P I L D I A M E T E R ( I N C H E S )
Fig . 11

-28-
Data from the shimmer meter, when combined with other measurable
input information, were used to predict the limiting range to which
telescopes and cameras could track aerial objects; this topic may be
the subject of a subsequent report.
PRESENTATIONS
Demonstrations of the shimmer meter and presentations concerning
its principles and the data secured with it were made to military and
civilian personnel at the Air Force Missile Test Center, Patrick Air
Force Base, Florida, during March and April 1957, at Eglin Air Force
Base during May 1957, and at ether times and places to representatives
of the Air Force Cambridge Research Laboratory, the U. S. Naval
Ordnance Test Station, the U. S. Navy Bureau of Ships, and other
military agencies. Following these demonstrations and presentations
the shimmer meter was dismantled. There has been no subsequent work
on this topic by the Visibility Laboratory.

13 February 1957
SHIMMER MfcJTER CALIBRATION
J. L. Harris
Two cases will be considered. The first is the case of high angular corre
lation where the sun effectively moves as a unit.
The parameter, A, is the variance of a two dimensional normal distribution
describing the frequency of the angular position of a point source. Sample values
-8 -8
of interest supplied by Dr. Duntley are 0.2x10 sq. rad. to 1.4x10 sq. rad.
This means the standard deviations range from .44-7x10 radians to 1.183x10
radians. In terms of minutes of arc
(T- = .447x10"4x57.3x60 = .1535 min. O" =1.183x10~^x57.3x60 = .4-07 min.
The sun is approximately 30 minutes of arc. A slit which is 1 min. x 10
min. has a smaller dimension which is small compared to the 30 minutes. A
rough scale might be as follows:
c
-2- Shimmer Meter Analysis
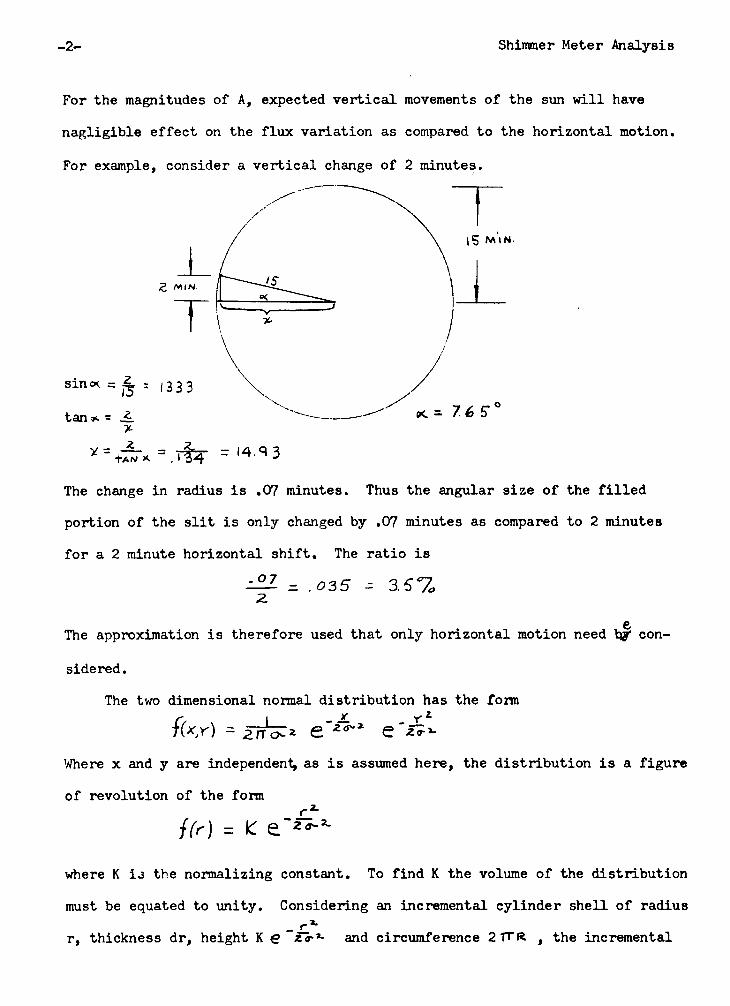
For the magnitudes of A, expected vertical movements of the sun will have
nagligible effect on the flux variation as compared to the horizontal motion.
For example, consider a vertical change of 2 minutes.
Z MIN.
\5 MIN.
1333 sin** = %
tan* = -fL x
*= 7.65
The change in radius is .07 minutes. Thus the angular size of the filled
portion of the slit is only changed by .07 minutes as compared to 2 minutes
for a 2 minute horizontal shift. The ratio is
^ 1 =L .035 -= 3.57* 2.
e
The approximation is therefore used that only horizontal motion need tjy con
sidered. The two dimensional normal distribution has the form
- * , . Yl
f(*X) = zfh
Where x and y are independent, as is assumed here, the distribution is a figure
of revolution of the form
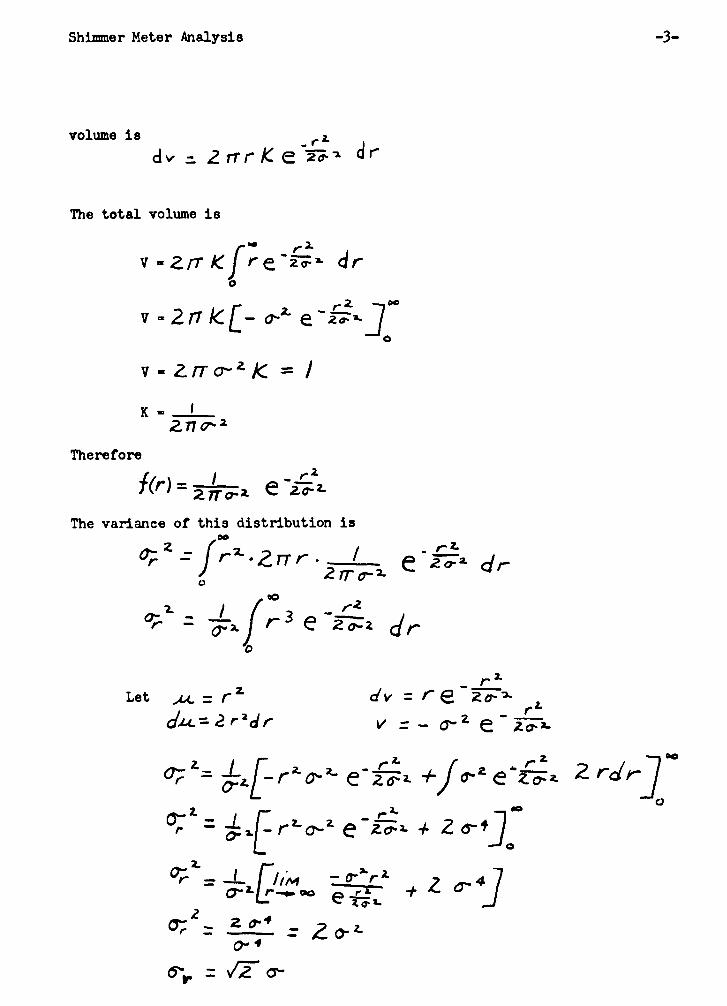
where K ±3 the normalizing constant. To find K the volume of the distribution
must be equated to unity. Considering an incremental cylinder shell of radius
r, thickness dr, height K Q~zo-*- and circumference 2TTR. , the incremental
Shimmer Meter Analysis
volume i s - r i J
dv - Zrrr K. e 2^'x d r
The total volume i s
Zrr K f re~2^*- dr o
2n\c[- <?•*• e~h:*~J z —,<">
v - zrro~z /c = /
K - _ L
Therefore
The variance of this distribution is
^-'fr^Zrrr./^ e'&dr
0-* r
Let ju. - r z dv ^ r Q~ 2. rx
if •3.
^*= ^-r*-*9- e"f£* ^ / ^ ' e*f£
r
* • * •
-4- Shimmer Meter Analysis
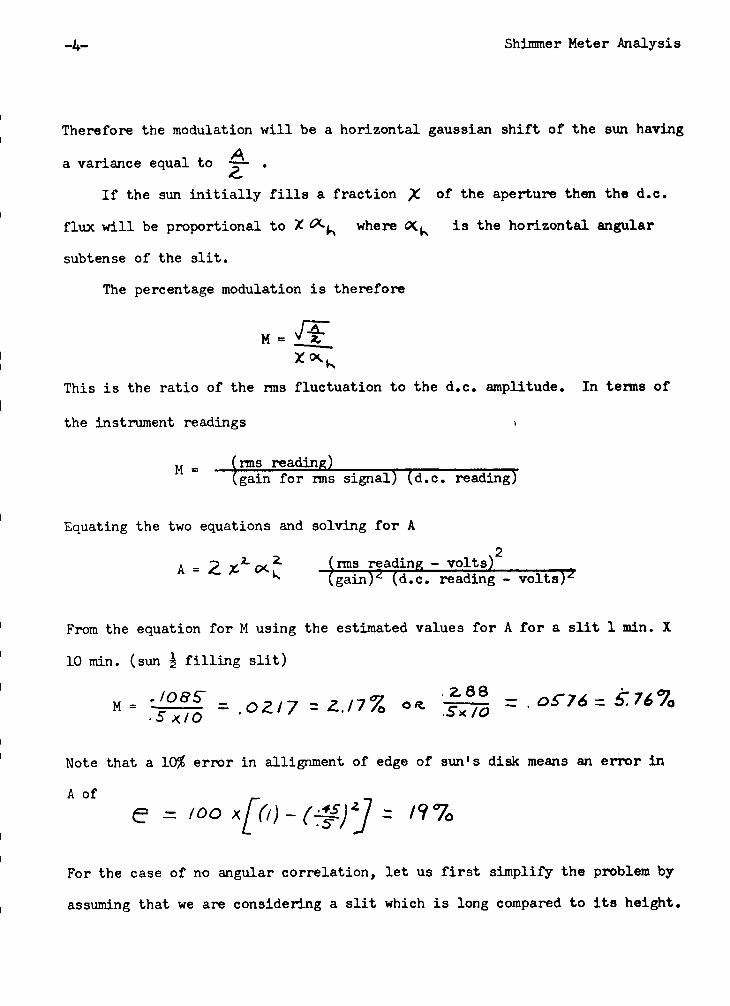
Therefore the modulation will be a horizontal gaussian shift of the sun having
a variance equal to —— .
If the sun initially fills a fraction X °? t n e aperture then the d.c.
flux will be proportional to X &*^ where <X^ is the horizontal angular
subtense of the slit.
The percentage modulation is therefore
This is the ratio of the rms fluctuation to the d.c. amplitude. In terms of
the instrument readings >
M _ (rms reading) (gain for rms signal) (d.c. reading)
Equating the two equations and solving for A
A = 2 ^ * J (rms reading. - volts) ^ ^ K (gain) ' ' ( d . c . reading - vo l t s )*
From the equation for M using the estimated values for A for a s l i t 1 min. X
10 min. (sun ^ f i l l i n g s l i t )
Note that a 10$ error in allignment of edge of sun's disk means an e r ro r in
A of
e - IOO *[(!)-(*f)*] - /?7o
For the case of no angular correlation, let us first simplify the problem by
assuming that we are considering a slit which is long compared to its height.
Shimmer Meter Analysis -5-
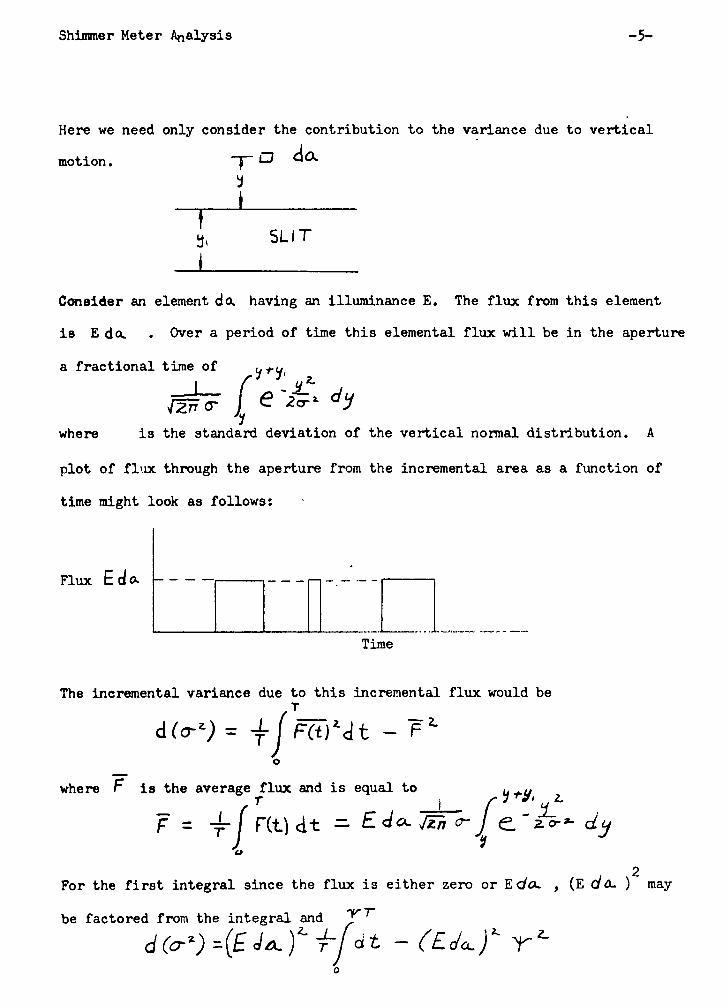
Here we need only consider the contribution to the variance due to vertical
yD da
J
motion.
T SLIT
Consider an element da. having an illuminance E. The flux from this element
is E da. • Over a period of time this elemental flux will be in the aperture
a fractional time of
_J {ZTT
where is the standard deviation of the vertical normal distribution. A
plot of flux through the aperture from the incremental area as a function of
time might look as follows:
Flux E d o.
Time
The incremental variance due to this incremental flux would be T
o
where F is the average flux and is equal to u .u
rT , —i— f i! f _ -L\ r ( t ) d t =• E.da-JTnvJ ^~z<r*- dy
o 2
For the first integral since the flux is either zero or Eafa. , (E c/—• ) may
be factored from the integral and y '

- 6 - Shimmer Meter Analysis
where ~W~ - —-_ / ___ /
Since y" is finite the total variance would be equal to zero because of the
existence of the term ( da. ) . Physically this is true because any statistics
applied to the case of zero correlation means that we are treating a case
where there exists an infinite number of independent actions and therefore we
are sampling from an infinite population.
The shimmer meter can only be calibrated for the high correlation case
unless the correlation is known. When so calibrated the value of A obtained
represents a lower limit to the true value.
13 February 1957
FILTERING FOR THE SHIMMER METER
J. L. Harris
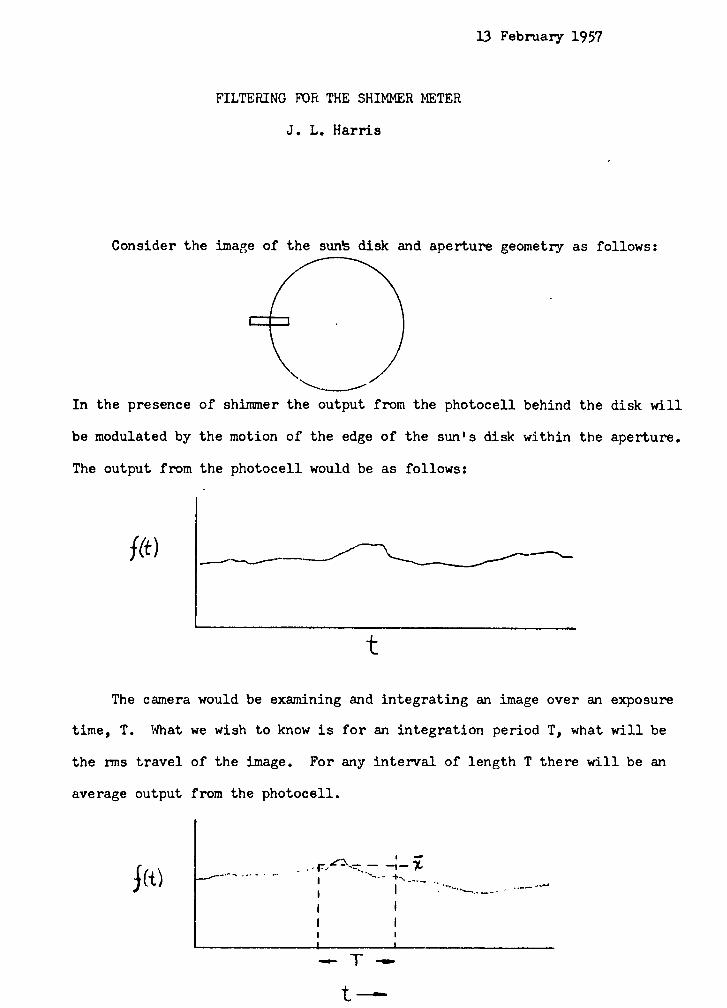
Consider the image of the sunte disk and aperture geometry as follows:
In the presence of shimmer the output from the photocell behind the disk will
be modulated by the motion of the edge of the sun's disk within the aperture.
The output from the photocell would be as follows:
t
The camera would be examining and integrating an image over an exposure
time, T. What we wish to know is for an integration period T, what will be
the rms travel of the image. For any interval of length T there will be an
average output from the photocell.

-2- Filtering For the Shimmer Meter
We wish to determine the rms value of the fluctuation about this average. The
waveform /'( i.) may be considered to consist of an infinite number of fre
quency components. By considering a component, CO , we can determine the
filter which will allow us to perform the desired measurement. For the general
case C - E w SIN (oi t -r- <(>)
where <p is a random phase angle
Each frequency component will, in general, contribute to the d.c. level over
the time interval T. Since we are only interested in the fluctuations about
the mean we must first find the average value of the component over the time
interval T. ^T
* = ~f s/"(^t + 4>)_-t ' o
-cosf^t + $) ~| *-_£ -4 . T L X
x =. — - cos<f> - c os (coT + <t>
We are interested inCT', the rms fluctuation about the mean. This may be
>2 found as -T
cr^-rjrJJEu, swfw± + *)-J^rcos*-co5f<MT+^)J . i t
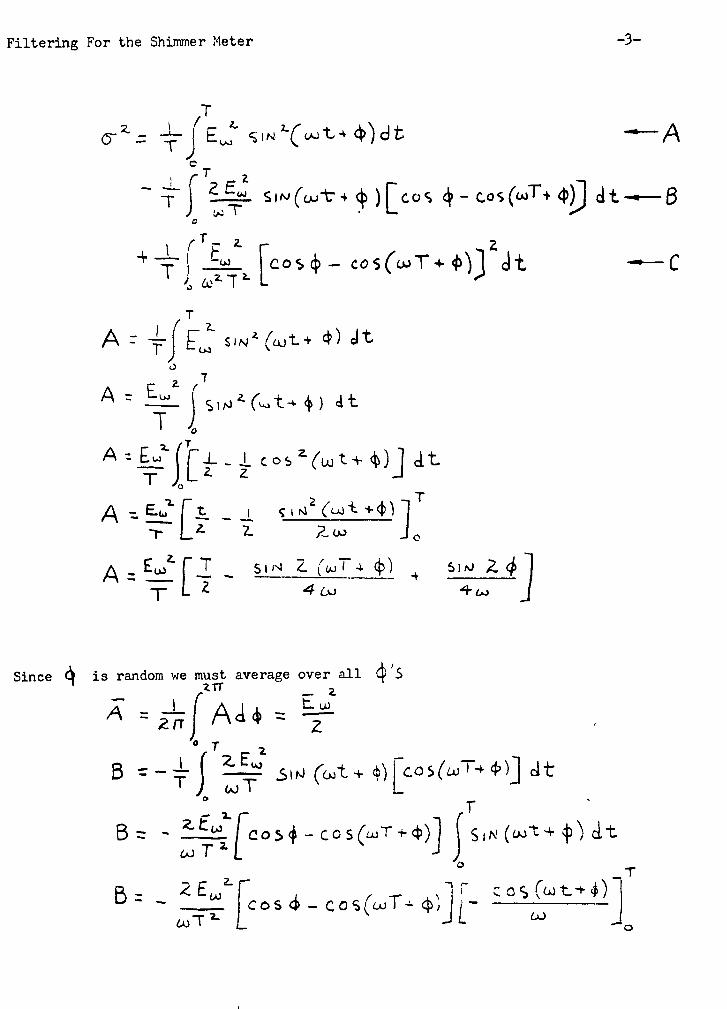
Filtering For the Shimmer Meter -3-
•2 \ r r i.
<r - T
T
J
4-LfTF *• T - - - -
£<! <Si"*"C <*>"-•-* 4>)dt - — A
cosc|> - c o s ( w T + $ } l d t - — C
rT_ _z
T
A - ~ E"2" siN*f_jt+ 4) J t T j - o -o
7
A -___"/"£ -J. li^l(WLli)]
A - ^U>2> f — S lN Z (UJTA <(>) ^ SIM Z <j» 1
Since 6 is random we must average over all <$ S
0 T z
B r-^ f _JLf .s^Coot+^rcoS^T^*)] Jt
B - - -l-_i / CO5 4-C0S(aiTr0>)l S l N ^ ^ + ^ ^ d t
,- 2.
00
_ cosci-cos^T^J^ J

-4- Fi l te r ing For the Shimmer Meter
B^ -t _»7"-£ COS <p - c o s (ojT+fy Cos4>-co^(wT+<t))l
8 = - j r f Z j c o s 4> - cos (a/T - H 4 ) 1
Averaging with respect to <p
2 £ ^ 6 =
UJ t-T2- ) ZV
zrr 2.n
J •ZTT
ZJT COS^(^T-h
V
*)<**] B = -
6u
-*-
2. r sZrr zrr
"e> o
/
Z.TT
Cob 6 SIN 4 S/AJ cuTci 4 + ^._/r
£77 *>»**["+i]
13 = -^o *• r2-
T
« z ^ Y r J ^ -£,* *""W) • W e_-r; c = - — ' ^ f tos 4 - Co%(uT+$\Y~Jt T t 7 l ^ 7
Filtering For the Shimmer Meter -5-
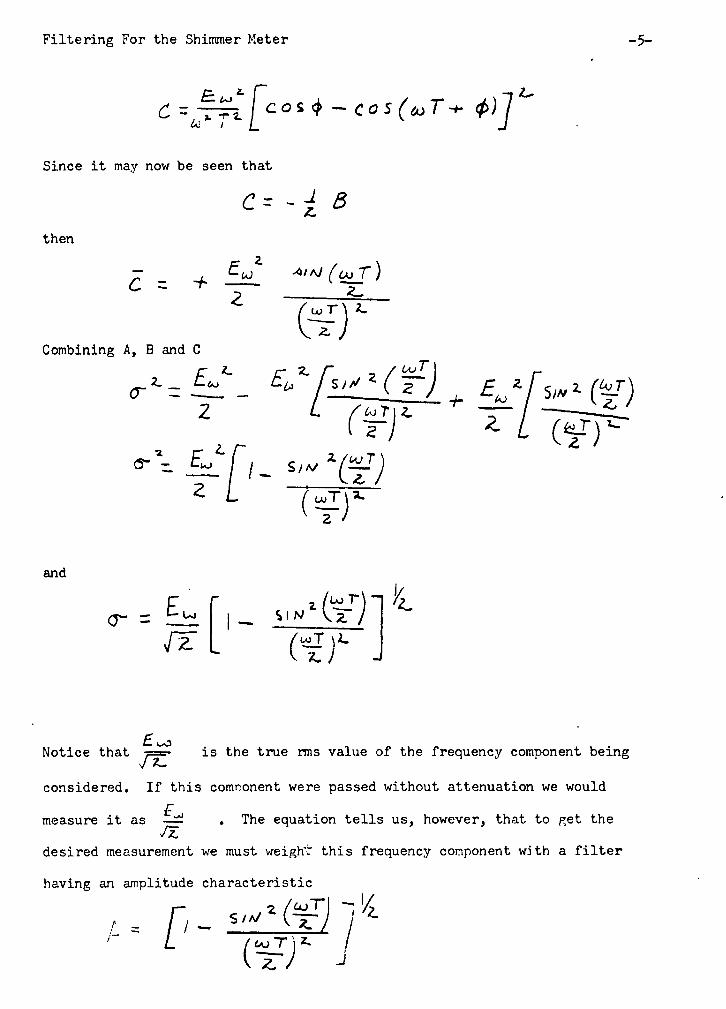
C = -T^L] ccs4 - cos(<oT+ <f>)l
Since i t may now be seen that
then
C-.-i B
~ _ , EQO *l*J foot) C- — r* y
Combining A, B and C
<T
© z L ^ZTTT- + -r — ~ * d
2 L (^r and
E r
c_r J
Notice that is the true rms value of the frequency component being
considered. If this component were passed without attenuation we would
measure it as —— . The equation tells us, however, that to get the
desired measurement we must weight" this frequency component with a filter
having an amplitude characteristic
!• _ l- m J

-6- Filtering For the Shimmer Meter
The attached graph shows a plot of this function.
C o | | , o
The highpass RC circuit
has a t ransfer function
L-ouT
— IN
60 R.C
>/I>(l_C)x4-| The 3 db point of the RC filter occurs where
•OUT
E - 0.101 -
OJK RC
From the Dlot of
the half power point appears to occur when 60T __ 1.4
*~ki =• —
Matching the two functions at the half power point then
1 = __! RC . -p
or T - Ot35 7 T £ C = 2,8

Filtering For the Shimmer Meter
This is the value of RC which would be selected to approximate the correct
filter characteristic. Since
60 fc C
/^(fcCf+i
- £_L£Z____ / IZSuo^TM
Uo 1 U J T * > Eoor
E i*/ ~~z U J T 0/iS7ajT (0.3S7_T) fa3i7wT)+l / Eoor
E i*/
0 0 0 O 1.0 \.o O
1 Z 0.114 O.SI ISI / .z3 o.SQ
2 A I4Z8 7L.04 3.04 A74-" 0.8/Q
3 6 7..142. 46 S.6 Z.37 O.<*0$
4 a 2.866 8>l %IZ 3.CZ 0.946"
5 to 3.570 I2..1 IS. 7 3.7 0.96S
The match is quite good. The maximum error of 10$ would only exist if
s concentrated at
- 3 OR. UJ - __.
r
the shimmer frequencies were concentrated at
The measurement could be made as follows:
1. Depending on the amplitude of the expected fluctuations some
amplification will be required. The low frequency response of
this amplification must be good enough so that the frequency
response of the system will be determined by the RC filter only.
2. An RC highpass filter may be placed in the circuit at any stage
of the amplification. This could be either fixed RC's with a

Filtering For the Shimmer Meter
switch, each RC corresponding to a desired exposure time T or a
fixed C, variable R calibrated in terms of T.
A low pass filter passing only that portion of the spectrum where
shimmer is expected should be inserted. This will serve to
minimize shot noise.


UNCLASSIFIED Security Classification
DOCUMENT CONTROL DATA • R&D (Security olaeelllcatlon at title, body ol abstract and indexing annotation must be entered when the overall report le claeaitlad)
I. ORIGINATING ACTIVITY (Corporate author)
Visibility Laboratory University of California San Diego. California 92152
2a REPORT SECURITY CLASSIFICATION
UNCLASSIFIED 26 GROUP
3. REPORT TITLE
AN APPARATUS FOR THE MEASUREMENT OF AN EFFECT OF ATMOSPHERIC BOIL (The.Shimmer Meter)
4. DESCRIPTIVE NOTES (Type ol report and Inclusive datea)
Final Report 5 AUTHORfSJ (Laat name, IIret name, Initial)
Duntley, Seibert Q., Harris, James L., and Austin, Roswell W.
a. REPO RT DATE
May 1968 7* . TOTAL NO. OF P A O I I
43 76. NO. OP R E M
8 - . CONTRACT OR GRANT NO.
NObs-84075 6 PROJECT NO.
c- Assignment 9
9a. ORIGINATOR'S REPORT NUMBCRfS.)
SIO Ref. 68-15
»b. OTHER REPORT NOfSJ (Any other numbers that may be assigned tflf. report)
10 A V A I L ABILITY/LIMITATION NOTICES
Distribution of this document is unlimited.
11 SUPPLEMENTARY NOTES 12. SPONSORING MILITARY ACTIVITY
Naval Ship Systems Command Department of the Navy Washington, D. C. 20360
i . 3. ABSTRACT
This report presents a method for the measurement of an effect of atmospheric boil in terms of the root-mean square deviation of the image-forming rays that contribute to the reproduction of fine detail, and describes an experimental (breadboard) version of an instrument near Cape Kennedy, Florida is presented. The effect of refractive inhomogeneities in the atmosphere (boil) on image quality is described in terms of the variance of a two-dimensional normal distribution describing the frequency of the apparent angular position of object points.
DD FORM .1473 UNCLASSIFIED Security Classification
UNCLASSIFIED S e c u r i t y C l a s s i f i c a t i o n
K E Y WOROS L I N K A
Shimmer Boil Atmospheric Optics Tracking Cameras Telescopes
UNCLASSIFIED Security Classification