fighting inequalities in the access to health...
TRANSCRIPT

TEXTO PARA DISCUSSÃO Nº 010/2010 ISSN 2177-9015
Fighting inequalities in
the access to health services: A study of the role of
decentralization and participation
Vera Schattan P. Coelho Marcelo F. Dias
Fabiola Fanti

CENTRO DE ESTUDOS DA METRÓPOLE SÉRIE TEXTOS PARA DISCUSSÃO CEM
ISSN: 2177-9015
Centro de Estudos da Metrópole Diretora Marta Arretche
Conselho Diretor do CEM Adrian Gurza Lavalle Alvaro Augusto Comin Antonio Sérgio Guimarães Charles Kirschbaum Eduardo Marques Fernando Limongi Gabriel Feltran Nadya Araújo Guimarães Márcia Lima Marta Arretche Henri Gervaiseau Paula Montero Ronaldo de Almeida Sandra Gomes Vera Schattan Coelho
Comissão Coordenadora do INCT Antônio Sérgio Guimarães Celi Scalon Eduardo Marques Elisa Reis Fernando Limongi Marta Arretche Nadya Araújo Guimarães Paula Montero
Editor de Textos para Discussão CEM Rogerio Schlegel
Publicação online cujo objetivo é divulgar resultados de estudos direta ou indiretamente desenvolvidos como parte da pesquisa do Centro de Estudos da Metrópole, de forma a favorecer a difusão de informações para pesquisadores, estudantes e profissionais especializados e estabelecer espaço para troca de idéias e sugestões. Os textos desta série estão disponíveis em: www.centrodametropole.org.br As opiniões emitidas nesta publicação são de inteira responsabilidade de seus autores, não exprimindo necessariamente o ponto de vista do Centro de Estudos da Metrópole. É permitida a reprodução dos textos e dados neles contidos, desde que citada a fonte e que não haja restrição expressa pelos autores. Reproduções para fins comerciais são proibidas.
www.centrodametropole.org.br Rua Morgado de Mateus 615
Vila Mariana 04015 902 São Paulo SP Brasil Fone 55 11 – 5574 0399 Fax 55 11 – 5574 5928
2
Draft – Please do not quote or cite Fighting inequalities in the Access to Health Services: a study of the role of decentralization and participation1 Vera Schattan P. Coelho, Marcelo F. Diasand Fabiola Fanti One of the promises of the SUS, was to mitigate well‐known inequalities in access to healthcare. To tackle these inequalities, a decentralization program was implemented, significant incentives for basic care and for public participation have been provided, and substantial additional funds became available. The effects of these initiatives have been analyzed from an inter‐regional and/or inter‐municipal perspective. In this paper we take a step further in analyzing the evolution of the supply and consumption of public healthcare services within the municipality of São Paulo between 2000 and 2008. We show that while there has been a reduction in the disparity between the offer and consumption of public health services across the areas with the best and worst indices of income, education and health, there was also a small increase in the inequality in the distribution of basic consultations within the poorest areas. These distributive results are discussed in the light of two dynamics: decentralization and public participation.
The Unified Health System (SUS), a public health system with universal and
unconditional coverage, was enacted by the 1988 so‐called 'Citizen Constitution'. One
of the great promises of the SUS, was to mitigate well‐known inequalities in access to
healthcare. Many studies, between 1970 and 1980, had highlighted distortions in the
funding for and access to healthcare services. Complex medical procedures and
wealthier regions received significantly more funds than basic procedures and poorer
regions (Akerman 1994; Coelho 1996). These distortions resulted in skewed access to
the public healthcare system, in many cases favoring the middle and upper‐middle
classes to the detriment of poor populations.
Starting in the 1990s, the SUS, in an effort to solve these problems,
implemented an aggressive decentralization program and provided significant
incentives for basic care and for public involvement, as well as reforming management
1 This chapter presents results from the ‘Participation and Health Policy in the City of São Paulo’ research program carried out by Centro de Estudos da Metrópole (CEM, Center for Metropolitan Studies), funded by Fundação de Amparo à Pesquisa do Estado de São Paulo (São Paulo State Foundation for Research Support), Centro Brasileiro de Analise e Planejamento (CEBRAP, Brazilian Center for Analysis and Planning) and Citizenship Development Research Center/IDS with support from DFID. We would like to thank Felipe Szabzon for helping with background material.

3
of these services and substantially increasing available funding2. The creation within
the SUS of two levels of management, the full management of basic care and the full
management of the municipal system, has contributed to reinforcing the role of the
municipality in managing the healthcare system. Also important was that since 1998
federal fiscal transfers for basic care have been automatic and calculated in per capita
terms. In the case of public participation, health councils were implemented as a
mechanism responsible for bringing civil society organizations (CSOs), service
providers, and public officials together addressing core issues of priority‐setting and
accountability. This led to the creation of a national health council, of health councils in
all twenty‐six states and in nearly all the 5,561 municipalities.
In the early 2000s, when we started the “Social Participation and Distribution of
Public Health Services in the City of Sao Paulo” project, many studies had already
shown the impact of the aforementioned initiatives, suggesting that while the situation
was a far from being ideal, it was possible to identify significant increased access to
health services. However, these analyses were not conclusive regarding the ability of
these initiatives to promote greater equality in the distribution of resources. Medici
(2001), Ugá et al. (2003), and Marques and Arretche (2004) drew attention to the fact
that the improvements found reflected increased resource invested rather than
changes in the distributive profile; that they said remained skewed in favor of more
prosperous regions. Souza (2003) and Melamed and Costa (2003), on the other hand,
stated that these measures had increased equality in the distribution of resources and
the access to services across Brazil’s regions, states and municipalities. Regarding
participation, the authors who had analyzed the health councils have also reached
ambivalent conclusions, identifying grey areas with many cases of relatively little
achievement and a few successful cases (Carvalho 1995; Boschi 1999; Pozzoni 2002;).
From our perspective, the fact that these evaluations did not consider what
went on in municipalities was worthy of attention. In other words, we still lacked more
2 Table 1 in the Annex shows the evolution of healthcare expenditures between 1995 and 2006. In 1995, public expenditures reached US$17 billion, going to US$28 billion in 2006 (figures restated to reflect the worth of a dollar in 2000). In 2006, total expenditures were equal to 7.5% of the GDP (US$ 58.5 billion), of which 48% were public expenditures and 51% were private expenditures.

4
information about how these new resources and programs were being distributed
inside the municipalities, a relevant issue, especially in mid‐sized and large cities. Thus,
the effects of these new policies were usually analyzed from an inter‐regional and/or
inter‐municipal perspective, but the literature still lacked analyses that showed how
these factors were affecting access to healthcare from an intra‐municipal perspective.
Therefore, at that time and following CEM’s research agenda, which called
attention to the importance of inequality within the metropolitan region, we tried to
take a step further in analyzing the evolution of the supply and consumption of public
healthcare services at an intra‐municipal level. Were the differences decreasing
between the poor and rich areas of São Paulo in terms of access to public health
services?
In addition, we were interested in evaluating and analytically integrating the
drivers of change mentioned above, which had been systematically highlighted in the
literature to be capable of contributing to mitigating the inequalities created by the
previous healthcare system. They were: (i) greater autonomy of the city halls in
managing decentralized federal funds, and (iii) public participation.
This article presents the results of this work and is organized into 5 sections in
addition to this introduction. In the following section we briefly outline the
methodology used to analyze both the evolution of the intra‐municipal distributive
profile of public health services and the performance of the local health councils. In
the third section, information is presented on the evolution of the SUS infrastructure
within the Municipality of Sao Paulo, (analyzing the distribution of the Basic Healthcare
Units (UBSs), Clinical Medical Assistance Units (AMA)3, and hospitals) as well as the
supply and consumption of basic consultations and hospital admissions. These data
point to the fact that the number of health facilities and the consumption of services
are increasing at a faster rate in the poorest areas. They also point to the fact that
there has been a reduction in the disparity between the consumption of services
3 Created in 2005 by the Municipal Secretariat of Health, the Clinical Medical Assistance Units (AMAs) are units for non‐appointment, low to medium complexity services in the medical clinic, pediatrics, general surgery, and gynecology areas.

5
across the areas with the best and worst indices of income, education and health,
while inequalities slightly grew in the distribution of basic consultations within the
poorest areas. In the fourth section we discuss these results. Finally, in the fifth section
we summarize the contribution of this research to the discussion about the role of
decentralization and social participation in increasing equality in access to healthcare.
Research methodology
To analyze the intra‐municipal distribution of health services we ranked the
city’s 31 submunicipalities according to their Municipal Human Development Index
(MHDI). For each sub municipality, the percentages of SUS users were calculated4 and
thereafter the consumption rates for primary appointments and for hospital
admissions in the 31 submunicipalities. In order to facilitate the description the
submunicipalities were grouped into four quartiles according to the same index
(MHDI).
Map 1 shows the Municipal Human Development Index (MHDI) figure calculated
for each of these sub‐municipalities. As shown by the information, central districts had
better human development indicators. Map 2 illustrates the health conditions and
needs of the population:5 the city outskirts present the worst epidemiologic indicators
and greatest need.
4 The calculation of the SUS population is a statistical inference based on data from the National Household Sample Survey – PNAD 2003 and the 2000 Demographic Census, both from the IBGE – Brazilian Institute of Geography and Statistics. This is done by obtaining, from the PNAD, the percentage of the population that does not have health insurance (SUS users) by family income stratum in the Metropolitan Region of Sao Paulo; using this information, the SUS population of each sub‐municipality is calculated using the product of this percentage and the distribution of family income in each of these locations according to the census. 5 The Healthcare Index is a synthetic indicator calculated using: the infant mortality coefficient, the tuberculosis index coefficient, early mortality from non‐transmissible chronic diseases, and the coefficient of mortality from external causes.

6
Map 3 shows the distribution of the population that uses the SUS. As we can
see, this population is concentrated in the outskirts of the city.6 These maps show that
sub‐municipalities with the worst socio‐economic and health indicators have the
highest concentration of SUS users.7 It is important to clarify that the SUS‐user is a
citizen without a private health insurance, who uses the public health system.
According to Neri and Soares (2002), in Brazil, among the poorest 10% of the
population, around 2.8% have some kind of private health plan, a figure that reaches 6 As can be seen in Table 2 in the Appendix, areas in the outskirts of the cities are not only where most of the SUS users are located, but also where there is greater population growth. Between 2003 and 2008, the population of all of the 17 sub‐municipalities with the lowest MHDI, except for Vila Prudente/Sapopemba, grew faster than the municipal average of 2.9% (See Table 1). In some regions, like Parelheiros, Perus and Capela do Socorro, the number of SUS users increased by more than 10% in only 5 years, considerably increasing the demand for healthcare equipment and services in these regions. 7 The proportion of SUS users is negatively correlated with the sub‐municipalities MHDI. Pearson’s correlation: 0.967**.
Map 1 – São Paulo’s Sub‐municipalities by Municipal Human Development Index, 2000
0.600 to 0.7990.800 to 0.8400.841 to 0.9180.919 to 0.9410.942 to 1.0
MHDI
kilometers
Cidade TiradentesVila Prudente
/ Sapopemba
São Miguel
Casa Verde
M´BoiMirim
Parelheiros
Source: Atlas do Trabalho e Desenvolvimento (SMT). Map: CEM/Cebrap
Map 2 – São Paulo’s Sub‐municipalities by rank in Heatlh Index, 2001
Health Index 2001 –Rank
1º to 8º9 º to 16º17º to 24º25º to 31º
kilometers
Source: SMS – Ceinfo

7
74% for the wealthiest 10%. In São Paulo’s case 48% of the total population exclusively
uses SUS services.
Map 3 – São Paulo’s Sub‐municipalities by Population of SUS users, 2000
Population of SUS Users 2000
To 99.999From 100.000 to 149.999From 150.000 to 199.999From 200.000 to 249.999More than 250.000
kilometers Map: CEM/Cebrap
In the next section we present data about the distribution of health facilities,
basic appointments and hospital admissions in the city’s 31 sub municipalities. Since
there is no information to allow identification of the beneficiary of a given
appointment, we have assumed a plausible premise that this kind of service tends to
be produced in a decentralized fashion and consumed locally. From the absolute
number, provided by the Health Secretariat, we built a rate of appointments, which is
the ratio between these appointments and the population that uses the SUS in each
sub‐municipality. In the case of hospital admissions it is possible to identify the address
of those admitted, thereby confirming that the procedures were consumed by the
residents of a particular sub‐municipality. From the absolute number, provided by the
Health Secretariat, we built a rate of hospitalizations, which is the ratio between these
8
authorizations and the population that uses the SUS in each sub‐municipality (per
10,000 users).
To research the local health councils (LHC) we selected six of them located in
poor areas of the city. We initially listed eleven possible sub‐prefeituras with a
Municipal Human Development Index of between 0.74 and 0.83.8 From these, we
selected six. Three of these ‐ São Miguel, Cidade Tiradentes, and M’Boi Mirim ‐ had a
strong history of social mobilization over health demands, whilst in the other three ‐
Casa Verde, Vila Prudente/Sapopemba, and Parelheiros ‐ there had been fewer of
these mobilizations9. The LHC in each of these sub‐municipalities has a different
associational trajectory. Map 1 show the six selected areas. To analyze the councils’
performance we developed a model that differentiates between inclusion, connections
and participation. We also followed the debates that took place in these LHCs. This
analysis allowed us to present a set of indicators that summarizes and made possible
the comparison of the performance of the LHCs.
We now turn to the description of the distributive tendencies of the
consumption of public health services in the Municipality of São Paulo between 2000
and 2008.
Changes in the distribution of healthcare services and equipment in Sao
Paulo, 2001‐2008
In 2000, when a mayor from the Worker’s Party (PT) was elected, there were a
number of changes made to municipal health policies, starting with the creation of 41
health districts.10 These districts were later incorporated into the 31 sub‐municipalities
that currently make up the municipality. Today, each sub‐municipality has a Technical
Health Supervision Unit (each unit is under one of the five regional coordinators' offices at
8 The MHDI varies from 0.74 to 0.95 across all the subprefeituras of São Paulo. 9 This classification, based on secondary research, was checked in interviews with Carlos Neder, ex‐councillor, state deputy, and a specialist on social health movements in the city of São Paulo, and Nabil Bonduki, an ex‐municipal councillor and a research specialist on social movements in São Paulo. 10 These districts had populations ranging from 180,908 to 418,440 inhabitants.

9
the Municipal Secretariat of Health11) and a Local Health Council made up of users (50%),
health managers (25%), and service providers (25%), whose function is to contribute to
defining and monitoring health policies in the region. These local health councils are
similar to the municipal ones, but without decision‐making powers since they lack a
Constitutional mandate.
Based on this context and analyzing available data on the supply and
consumption of public healthcare services in the city of Sao Paulo for 2001, Coelho and
Pedroso (2002) described a situation where despite the fact that the SUS population
was concentrated in the outskirts, equipment and services were concentrated in the
central and oldest areas of the city of Sao Paulo.12 This meant that the populations
who lived in areas with better socioeconomic indicators were privileged compared to
populations living in the outskirts of the city. In this sense, it is important to note that
the differences in distribution measured there and in the present work are between
the poor that live in different areas of the city, rather than between poor and non‐poor
as such.
In a more recent study Coelho e Silva (2007) pointed out that whilst the
distributive profile remained inequitable, with the highest levels of use to be found in
the richest areas with the best epidemiological indicators in the municipality of São
Paulo, it should be noted that there was some evidence, feeble at that point, that this
pattern was changing. A higher increase in the consumption in the poorest sub‐
municipalities and a narrowing of the consumption gap across sub‐municipalities with
the highest and lowest MHDIs, could result in the reversal of the distributive trend
observed. As it will be shown bellow, this tendency seem to be confirmed by the more
recent data analyzed in this paper.
Equipment supply
11 The five regional Coordinators’ offices are: Center‐west, East, North, Southeast and South. 12 For more details see maps 1,2 and 3 in section 2

10
As noted above, this bias in favor of central areas was partially reverted in more
recent years and this was made possible at least in terms through heavy investment in
infrastructure. This investment was made mainly by expanding or opening Basic
Healthcare Units (UBSs) and AMAs (OHU) in the regions on the outskirts of the city.
Table 1 shows the increase in the amount of available equipment.
Table 1 – Public Health Equipment, São Paulo, 2000 ‐ 2008
2000 2001 2002 2003 2004 2005 2006 2007 2008
Hospitals 51 50 53 51 51 52 53 55 55
BHU (UBS)13 135 234 244 250 382 392 407 407 416
OHU (AMA) ‐ ‐ ‐ ‐ ‐ 10 33 52 116
Source: Municipal Secretariat for Planning. Created by: CEM/Cebrap
As can be seen in Table 1, the number of public hospitals – municipal, state and
federal – went from 51 to 55 in the period. Along with this expansion there was a shift
in the distribution of hospital beds: in 2000, the 9 sub‐municipalities with the smallest
Municipal Human Development Index supplied 6.6% of the public hospital beds in the
municipality, while 8 years later this percentage had increased to 16.0%.
Charts 1 and 2 show the evolution in the distribution of BHU (UBSs) and OHU
(AMAs) in the municipality.
13 Some of the UBSs that started operating were previously healthcare centers or medical service centers.

11
MHDI MHDI Sub-municipalities Sub-municipalities
2008 2000
Chart 1. Basic Health Unit by 20.000 SUS users, São Paulo, 31 Sub‐municipalities,
2000 and 2008
Source: Municipal Secretariat for Planning. Created by: CEM/Cebrap
Chart 1 shows that the number of BHU (UBSs) not only tripled in this period,
but that there was also considerable progress in the distribution of this equipment to
areas in the outskirts of the city. Chart 2 shows the expansion of OHU (AMAs), which
went from 10 units in 2005 to 116 in 2008, thus reflecting the priority that the party in
charge of the municipal government gave to increasing low and medium complexity
emergency care services.
Chart 2. Outpatient Health Unit, São Paulo, 31 Sub‐municipalities, 2008
Source: Municipal Secretariat for Planning. Created by: CEM/Cebrap
It is worth noting that the first AMAs opened in 2005, with most of them being
placed in the same physical spaces as the existing UBSs, therefore making it
unnecessary to build new units.
0123456789
10
Uni
tys
median
1 BHU / 20.000 SUS
users

12
Supply of services
An analysis of the distribution of services provided with this equipment also
shows encouraging data. Chart 3 shows the distribution of basic appointments among
the 31 sub‐municipalities.
Chart 3. Primary appointments per SUS user/year , São Paulo, 31 Sub‐municipalities,
2002 and 2008
Source: Municipal Secretariat of Health. Created by: CEM/Cebrap
The number of primary appointments increased by 68.1% between 2002 and
2008 and the average rate of basic appointments per SUS user per year went from
2.02 to 3.39. In 2002, 17 sub‐municipalities (9 out of the 10 with the worst Municipal
Human Development Indexes) had lower rates to that recommended by the World
Health Organization (WHO), which is 2 appointments per person/year; in 2008, only 2
had inferior rates. Rates fell for 6 of the 8 sub‐municipalities with the greatest
Municipal Human Development Indexes, suggesting that in some of these regions the
rate was artificially high; or rather, part of the appointments made at these units were
for users from other areas. In other words, this data may indicate that SUS patients
sought care in these sub‐municipalities due to a lack of supply of such services in the
regions where they live.
MHDI MHDI Sub-municipalities Sub-municipalities
2008 2002
2 appointments appointments
by SUS user/year
13
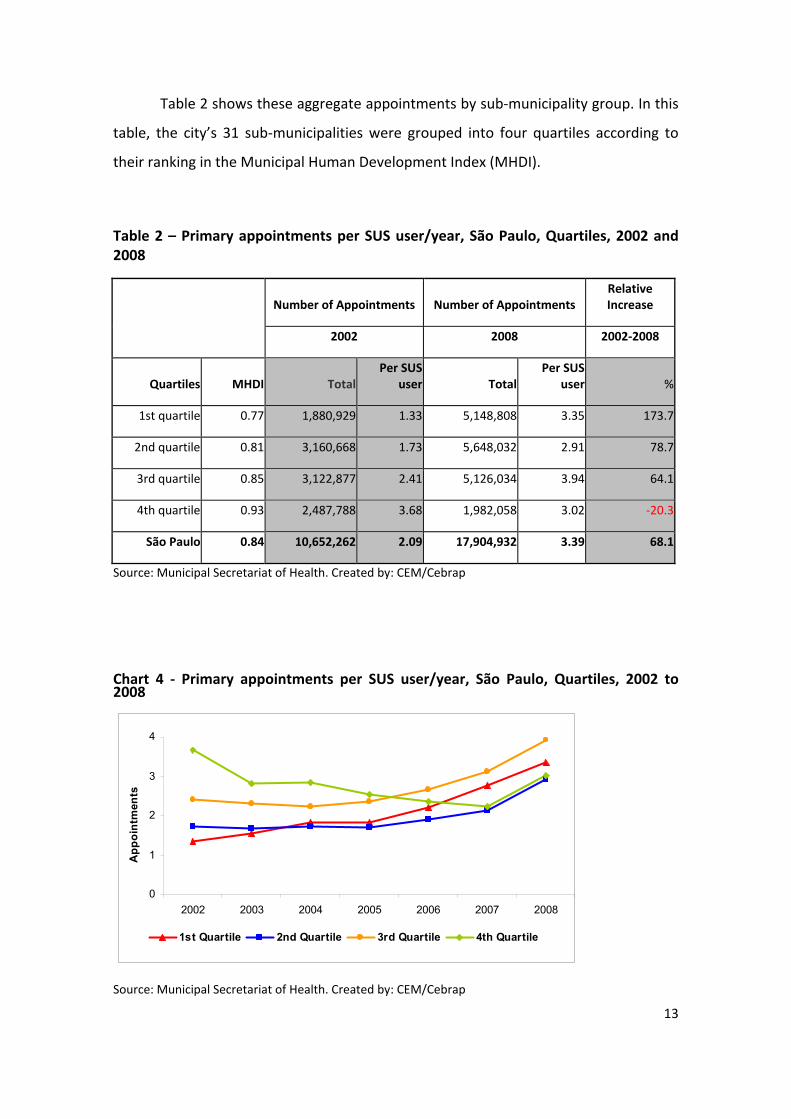
Table 2 shows these aggregate appointments by sub‐municipality group. In this
table, the city’s 31 sub‐municipalities were grouped into four quartiles according to
their ranking in the Municipal Human Development Index (MHDI).
Table 2 – Primary appointments per SUS user/year, São Paulo, Quartiles, 2002 and 2008
Number of Appointments Number of Appointments
Relative Increase
2002 2008 2002‐2008
Quartiles MHDI TotalPer SUS
user TotalPer SUS
user %
1st quartile 0.77 1,880,929 1.33 5,148,808 3.35 173.7
2nd quartile 0.81 3,160,668 1.73 5,648,032 2.91 78.7
3rd quartile 0.85 3,122,877 2.41 5,126,034 3.94 64.1
4th quartile 0.93 2,487,788 3.68 1,982,058 3.02 ‐20.3
São Paulo 0.84 10,652,262 2.09 17,904,932 3.39 68.1
Source: Municipal Secretariat of Health. Created by: CEM/Cebrap
Chart 4 ‐ Primary appointments per SUS user/year, São Paulo, Quartiles, 2002 to 2008
0
1
2
3
4
2002 2003 2004 2005 2006 2007 2008
1st Quartile 2nd Quartile 3rd Quartile 4th Quartile
App
oint
men
ts
Source: Municipal Secretariat of Health. Created by: CEM/Cebrap

14
Chart 4 and Table 2 show a significant reduction in disparities in access to
appointments with the standard deviation decreasing from 1.19 to 0.94. Comparing
the distribution within the quartiles, the standard deviation in the fourth quartile (the
wealthiest) dropped from 1.70 in 2002 to 1.14 in 2008, and within the first quartile
(poorest) it increased from 0.58 to 0.64. If we divide the city into 2 groups according to
their MHDI, the standard deviation in the distribution of basic appointments among
the poorer sub‐municipalities rose from 0.52 to 0.79 and in the richer half it dropped
from 1.36 to 1.08.
It is worth noting that there is a huge jump in the number of appointments in
2006, at the same time that the OHU (AMAs) were implemented. Even though it is not
possible to precisely identify the impact of these units in the network because most of
them were implemented in existing BHU (UBSs) and the table of procedures does not
have specific codes to denote their existence, it is possible to divide appointments into
two types: emergency appointments or services and scheduled appointments. The
former is available at OHU (AMAs) as well as BHU (UBSs), whereas scheduled
appointments can only be made at the UBSs. Table 3 shows that, while there was a
reduction in the number of scheduled appointments made in recent years, emergency
appointments/services increased by 1.186%, which shows us the impact the OHU
(AMAs) had on the municipal public healthcare system.

15
Table 3 – Primary appointments by type, São Paulo, 2002 to 2007
0123456789
10
2002 2003 2004 2005 2006 2007
In mi l l ions
Appointment in Family´s Health Medic
Emergency Appointment (BHU and AHU)Scheduled Appointment (only BHU)
Source: Municipal Secretariat of Health. Created by: CEM/Cebrap
Finally, it is worth mentioning the indicators related to output by hospitals.
Chart 5 shows the distribution of Hospital Admissions.14
Chart 5 – Hospital Admission Rate, São Paulo, 31 Sub‐municipalities, 2000 and 2008
Source: Datasus – Ministry of Health. Created by: CEM/Cebrap
14 The Authorization for Hospitalization (AIH) is the means through which healthcare service providers in Brazil are reimbursed. Each of the procedures carried out at a center are reimbursed according to a payment chart. The number of AIHs has been used to oversee the distribution of the SUS’s supply of hospital beds. AIH records indicate an address for those who used the SUS service, which allows for mapping of the consumption of hospitalizations in the 31 sub‐municipalities. From the absolute number, provided by the Health Secretariat, we built a rate of hospitalizations, which is the ratio between these authorizations and the population that uses the SUS (per 10,000 users).
MHDI MHDI Sub-municipalities Sub-municipalities
20082000
Median (2000)
= 639

16
In 2000, 6 sub‐municipalities had a rate of up to 499 hospitalizations per 10,000 users and 7 had a rate greater than 1,000. In 2008, only 1 sub‐municipality had a rate of under 499 (Parelheiros) and only 1 was over 1,000 (Sé). Table 4 shows the
authorization rates for the municipal quartiles.
Table 4 – Hospital Admission Rate, São Paulo, Quartiles, 2000 and 2008
Admissions Admissions
Relative Increase
2000 2008 2002‐2008
Quartiles MHDI TotalPer 10,000 SUS users Total
Per 10,000 SUS users %
1st quartile 0.77 76,752 561 106,565 642 14.4
2nd quartile 0.81 126,613 710 153,373 731 3.0
3rd quartile 0.85 100,064 774 115,507 802 3.6
4th quartile 0.93 71,941 1,052 62,375 851 ‐19.1
São Paulo 0.84 375,370 745 437,820 74415 ‐0.1
Source: Datasus – Ministry of Health. Created by: CEM/Cebrap
15In 2008, the rate of authorizations in the network covering health insurance was 1,318 hospitalizations per 10,000 people

17
Chart 6 ‐ Ratio of Consumption of Hospital Admissions per year per quartile per 10
thousand SUS users, São Paulo, 2002 to 2007
500
600
700
800
900
1 000
1 100
2000 2001 2002 2003 2004 2005 2006 2007
1st quartile 2nd quartile 3rd quartile 4th quartile
Adm
issi
ons
Charts 5, 6 and Table 4 show a significant reduction in disparities in hospital
admissions. The standard deviation in the distribution of Hospital Admissions dropped
from 297 to 131. In a comparison of the distribution among the quartiles, the standard
deviation in the first quartile (poorest) went from 120 in 2000 to 73 in 2008, and within
the 4th quartile (wealthiest) it fell from 309 to 163. If we divide the city into 2 groups
according to MHDI, the standard deviation in the distribution of Authorizations for
Hospitalization among the poorest sub‐municipalities decreased from 270 to 103 and
in the richer half it went from 281 to 128.
In short, the data collected here clearly shows that the distribution of public
healthcare services in Sao Paulo became more equitable. There was significant
expansion in the supply as well in the consumption of services in the regions that
present the worst socio‐economic and health indicators. There are more healthcare
units, clinics and hospitals and, as a result, more services are being offered to the poor
populations living in these regions. An analysis of the distribution of these resources
also showed that we now have a more equitable distribution pattern of public health
services between locations with a reduction in the geographic inequalities hindering
access to the public health system. What is not in line with this scenario are the
increased differences (reflected in the rise in standard deviation) in the rates of basic

18
appointments recorded in the sub‐municipalities that have the worst socio‐economic
and health indicators.
Analyzing the results
In this section, we will discuss aspects related to the health policies implemented
in the 1990s and 2000s with the aim of identifying factors that have contributed to the
development of the distributive pattern described in the previous section. This pattern
shows a reduction in inequalities in the supply of services among areas that have the
best and the worst socio‐economic and health indicators, as well as a slight increase in
inequalities in distribution in areas with the worst indicators. We will explore two
assumptions that underscore different dynamics that, according to our argument,
have been acting in tandem.
The first explores the inductive power of federal policies. Arretche 2004, Médici
2001 and others highlighted the extent to which federal programs and rules of fiscal
transfers play an important strategic induction role in promoting greater balance
between the offer of basic and complex services while also providing greater access to
resources for the poorest municipalities. Following these authors our assumption
suggest that municipal officials played a proactive role in coordinating the municipal
system and used criteria for municipal allocation inspired by federal criteria, which
would have contributed to making the supply more equal.
The second assumption explores the process of intra‐municipal decentralization
of healthcare policies. This decentralization was implemented through the creation, at
the sub‐municipality level, of the Technical Health Supervision Units and of the Local
Health Councils (Sobrinho and Capucci 2003; Teixeira, Kayano and Tatagiba 2007;
Coelho et al. 2010). The assumption is that, in areas of the city where there is a
stronger history of social mobilization (which is usually connected to the healthcare
movement16 in areas located in the outskirts of the city), successful alliances were
16 Since the early 1980s, this movement had defended profound health policy reforms and was a key player in the creation of the SUS.

19
formed between the Local Health Councils (LHC) and the Technical Supervision Units,
which would have ensured the power to pressure the Municipal Secretariat and would
have contributed to increasing the amount of resources allocated for these areas.
Next we discuss these two assumptions.
Discussing the first assumption
Since 1998, federal fiscal transfers for basic care have been automatic and
calculated in per capita terms. The automatic transfers, for their part, afforded a
greater degree of autonomy to the municipalities and promoted the decentralization
of health resources. This system enabled the implementation of various federal
programs by the municipal governments, such as: the Family Health Program and the
Outreach Agents’ Program. As noted in the previous section, the results of these
programs can be clearly seen in the municipality of São Paulo, with an increase in the
number of basic health facilities and primary appointments.
The creation within the SUS of two levels of management, the full management
of basic care and the full management of the municipal system, has also contributed to
reinforcing the role of the municipality in managing the healthcare system. In 2003,
when the municipality of Sao Paulo adopted full management, it began to receive all of
the resources earmarked for basic care and it had the autonomy to use them. It also
gained autonomy over the set of medium and high complexity hospital procedures.
With this, the amount of resources available to the Municipal Secretariat as well as its
autonomy in managing these resources increased.17
In order to understand how these resources were allocated, we then analyzed
the municipal strategy of implementing the Basic Healthcare Units (UBSs) in the period
ranging from 2000 to 2008. It is worth remembering that the UBSs are the most
important instruments in basic care, because they are the basis for the organization of
the Family Healthcare Program (PSF) and the Community Agents Program (PACS)
17 In the case of resources distributed from fund (national) to fund (municipal), transfers to municipalities grew from 25.15% of the total funds made available by the Ministry of Health in 1997 to 66.9% in 2001 (Melamed and Costa 2003).

20
teams, and theoretically are the door into the healthcare system. Chart 6 shows a
strong link between the UBSs' distribution and the size of the population of SUS users
in the sub‐municipalities, which suggests that a per capita criterion was used to
calculate the units to be implemented or expanded.18, 19
Chart 6 – BHUs implanted between 2000 and 2008, São Paulo, 31 Sub‐municipalities
350.000300.000250.000200.000150.000100.00050.000
Popoulation of Sus Users 2000
25
20
15
10
5
0
BH
U Im
plan
ted
(200
0-20
08)
Source: Municipal Secretariat for Planning; IBGE (2000 Census). Created by: CEM/Cebrap
With respect to the hospital system, it should be noted that with the “full
management” modality greater authority was given to the municipal authorities over
the management and administration of municipal public hospitals as they gained the
prerogative to hire, audit, determine production caps, and pay the providers of private
and public hospitals. This increased autonomy and especially its ability to determine
maximum caps for the payment of procedures executed and to grant and revoke
accreditation of hospitals has contributed to enforcing their authority in adjusting the
distribution of hospital admissions (see Table 4 and Chart 5).
The analysis of the UBSs’ distribution as well as the systematics of determining
caps for payment of the Hospital Admissions and granting and revoking accreditation
18 The Pearson correlation is 0.734 19 This ratio has remained steady, albeit with less strength when the calculation is done for the total population. See Chart 1 in the Attachment

21
for hospitals suggests that municipal managers, according to the rationale set forth at
the federal level, used technical criteria to make sure that the new resources were
distributed in a manner that would serve the population living in the municipality in a
more equitable way. In this case, however, it seem reasonable to guess that, unlike
federal managers, who use per capita criterion, municipal managers tried to prioritize
those areas where the population of SUS users was greater, which are the poorest
areas and those with worse health indicators. In this sense, the Municipal Secretariat
of Health assumed a strong role in organizing the process and in defining the norms for
the intra‐municipal transfer of resources.
Discussing the second assumption
An element of the decentralization process that should be highlighted is the
creation of Technical Health Supervision Units and Local Health Councils in the sub‐
municipalities. The creation of these supervisions and councils followed the agenda of
the Brazilian health reform program, which saw decentralization as part of a wider
strategy of democratization and the incorporation of new social actors in the
management of the health system (Levcovtiz, et al., 2001). In this way, in each sub‐
municipality, a local health council as well as a large number of unit health councils has
been created. They were set up over two years, involving the mobilization of over
4,000 people to participate in at least one monthly meeting (Sobrinho and Capucci
2003).
The local health council of the sub‐municipality consists of 24 effective and 24
substitute councilors. These councils were expected to make more democratic the
discussions over what to fund with public money and for whom, as well as discussing
the quality and adequacy of the services being provided (Coelho et al., 2005). The
councilors that represent civil society self‐identified themselves as representatives of:
popular health movements; health units; religious associations; neighborhood
associations; Unions; civil rights groups; participatory fora; homelessness movements;
landless peasants movements; community or philanthropic groups; disabled persons

22
associations; or as non‐affiliated representatives (Coelho, 2006). From this process
emerged a network of councils distributed throughout the municipality, covering both
central and peripheral areas, as well as rich and poor ones.
In this subsection we will explore the impact of these processes on the
distribution of health services. Unlike in the previous subsection’s discussion, in this
case we do not have data that allows for a more comprehensive discussion of these
impacts and we will use more specific information collected by the CEM/CEBRAP team,
as described in section 2. Thus it is worthwhile to proceed with caution bearing in mind
that the evidence presented below is more indicative than conclusive in nature. The
analysis developed in this section builds upon previous research carried out between
2006 and 2008 on the dynamics of six Local Health Councils (LHCs) located in poor
areas of the city. Three of these ‐ São Miguel, Cidade Tiradentes, and M’Boi Mirim‐ had
a strong history of social mobilization over health demands, while in the other three ‐
Casa Verde, Vila Prudente/Sapopemba, and Parelheiros ‐ there had been fewer of
these mobilizations.20
In this context, in the sub‐municipalities with a stronger history of mobilization,
the LHC discussions were marked by more conflict and confrontation, but had better
outcomes in the variables related to monitoring healthcare services and innovative
proposals. The organizations and the councils for these areas also present a greater
number of connections with socio‐political and institutional actors and have links to
segments of bureaucracy, service providers, politicians and the civil society. We also
noted that this dynamic has contributed to promoting greater integration between the
councils and the Technical Health Supervision Units for their respective areas (Coelho
et al. 2010). In a situation of heated disputes over resources between sub‐
municipalities, this integration with councils has been welcomed by supervisors of the
Technical Units. After all, those with the support and endorsement of civil society will
be in a better position to negotiate their demands to the Municipal Secretariat of
Health. 20 This classification, based on secondary research, was checked in interviews with Carlos Neder, an ex‐councilor, state deputy, and specialist on social health movements in the city of São Paulo, and with Nabil Bonduki, an ex‐municipal councilor and a research specialist on social movements in São Paulo.
23
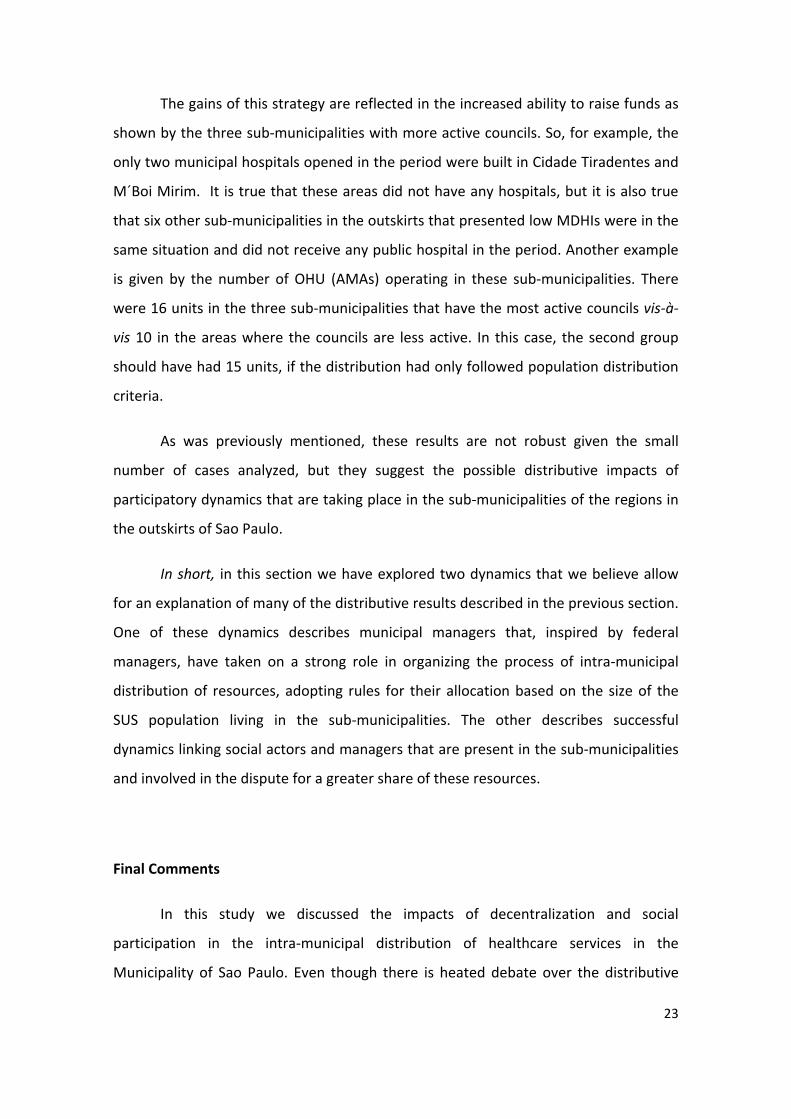
The gains of this strategy are reflected in the increased ability to raise funds as
shown by the three sub‐municipalities with more active councils. So, for example, the
only two municipal hospitals opened in the period were built in Cidade Tiradentes and
M´Boi Mirim. It is true that these areas did not have any hospitals, but it is also true
that six other sub‐municipalities in the outskirts that presented low MDHIs were in the
same situation and did not receive any public hospital in the period. Another example
is given by the number of OHU (AMAs) operating in these sub‐municipalities. There
were 16 units in the three sub‐municipalities that have the most active councils vis‐à‐
vis 10 in the areas where the councils are less active. In this case, the second group
should have had 15 units, if the distribution had only followed population distribution
criteria.
As was previously mentioned, these results are not robust given the small
number of cases analyzed, but they suggest the possible distributive impacts of
participatory dynamics that are taking place in the sub‐municipalities of the regions in
the outskirts of Sao Paulo.
In short, in this section we have explored two dynamics that we believe allow
for an explanation of many of the distributive results described in the previous section.
One of these dynamics describes municipal managers that, inspired by federal
managers, have taken on a strong role in organizing the process of intra‐municipal
distribution of resources, adopting rules for their allocation based on the size of the
SUS population living in the sub‐municipalities. The other describes successful
dynamics linking social actors and managers that are present in the sub‐municipalities
and involved in the dispute for a greater share of these resources.
Final Comments
In this study we discussed the impacts of decentralization and social
participation in the intra‐municipal distribution of healthcare services in the
Municipality of Sao Paulo. Even though there is heated debate over the distributive

24
consequences of the programs and funding rules adopted from the 1990s on by the
federal government, as well as about the influence of social participation in health
policies, the truth is that we still know very little about how resources are allocated
within large and mid‐sized municipalities, as well as about how participatory processes
may be able to bring about distributive changes.
In this study we discussed these two issues, describing changes that occurred
within the profile of the distribution of healthcare equipment and services in the city
of Sao Paulo between 2000 and 2008, and tried to identify the mechanisms associated
to federal policies and to participation that may be contributing to the definition of
this profile.
As was described in previous sections, a significant increase has been noted in
the amount of financial resources made available to healthcare along with a
concomitant increase in the physical structure, especially regarding BHU (UBSs) and
OHU (AMAs), as well as in the rate of basic appointments and hospital admissions
offered by the SUS in the municipality. A reduction was also found in inequalities in the
supply of services among areas that have the best and the worst socio‐economic and
health indicators, as well as a slight increase in inequalities in distribution of basic
appointments in areas with the worst indicators.
We suggest that these results can be explained by two dynamics put in motion
by the process of decentralization and democratization of healthcare policies. In one of
them, the municipal manager, in line with federal policies, has taken on a strong role in
organizing the process of intra‐municipal distribution of resources by adopting rules
for resource allocation based on the size of the population of SUS users living in the
sub‐municipalities. In the other, the municipal manager has met the demands made by
sub‐municipality managers that, along with healthcare council representatives, fight
for priority allocation, especially of new resources. We have furthermore highlighted
that these results have changed according to the location and dynamics of the
councils, as we only noticed this successful alliance between managers and more
active councilors in sub‐municipalities whit a stronger history of social mobilization.

25
These dynamics paint a rich picture of how top down and button up dynamics are
interacting to shape the municipal health policy. In doing so, they call for greater
attention to be paid to the crucial role that institutional rules together with the politics
of public participation are playing in building the SUS.
Bibliography
Akerman, M. 1994. Avaliação de procedimentos de alto custo em nefrologia e oncologia. Brasiília : Ministério da Saúde.
Arretche, M., 2004. “Federalismo e Políticas Sociais no Brasil: problemas de coordenação e autonomia”, São Paulo em Perspectiva, vol. 18, no. 2, pp. 17‐26.
Coelho, V. and M. Pedroso, 2002. “Distribuição de Serviços Públicos de Saúde no Município de São Paulo”, Novos Estudos–Cebrap, no. 64, pp. 141‐154.
Coelho, V. S. & N. Silva2007. “Has the distribution of public health services become more equitable? Reflecting on the case of São Paulo”. In S. Shantayanan & I. Widlund The Politics of Service Delivery in Democracies. Better Services for the Poor. EGDI. Ministry for Foreign Affairs. Stockholm.
Coelho, Vera, 2006, “Brazilian Health Councils: including the excluded?”, in Vera Coelho and Andrea Cornwall (eds.), Spaces for Change? The Politics of Participation in New Democratic Arenas. London: Zed Books.
Coelho, V. S.; A. Ferraz; F. Fanti and M. Ribeiro 2010. Participation and Mobilization: A win‐win game? In: V. S. Coelho and B. von Lieres Mobilizing for Democracy: Citizen Involvement and the Politics of Public Participation. London: Zed Books.
Kayano, J.; L. Tatagiba; A. C. Teixeira, 2007. “Saúde: controle social e política pública”, Observatório dos Direitos do Cidadão, Caderno 29.
Levcovitz, E., L. D. Lima and C, Machado, 2001. “Política de saúde nos anos 90: relações intergovernamentais e o papel das Normas Operacionais Básicas”, Ciência & Saúde Coletiva, vol. 6, no. 2, pp. 269‐291.
Médici A 2001. Financiamiento y gasto público en salud en los años noventa. División de Programas Sociales 1 del Banco Interamericano de Desarrollo, (BR‐009). Marques, Eduardo and Arretche, Marta, 2004, “Condicionantes Locais da Descentralização das Políticas de Saúde”, Cadernos do CRH, vol. 39, pp. 55‐81.
Melamed, Clarice and Costa, Nilson do Rosário, 2003, “Inovações no financiamento federal à Atenção Básica”, Ciência & Saúde Coletiva, vol.8, no. 2, pp.393‐401.
Neri, Marcelo and Wagner. Soares, 2002, “Desigualdade social e saúde no Brasil”, Cadernos de
Saúde Pública, vol. 18, pp. 67‐76.

26
M.A. Ugá, S.F. Piola, S.M. Porto, and S.M. Vianna, "Descentralização e alocação de recursos no
âmbito do Sistema Único de Saúde (SUS)" Ciência & Saúde Coletiva, vol. 8, 2003, pp. 417‐437.
Annex
TABLE 1 – Health Expenditure by Sector, Brazil, 1995 a 2006
(1) In billions
Health Expenditure (constant US$ 2000) 1
Health Expenditure (in %)
Year GDP
(constant US$ 2000)1
Total Public Private % of GDP Public (% of total)
Private (% of total)
1995 583.2 39.1 16.8 22.3 6.7 43.0 57.0 1996 594.3 40.4 16.4 24.0 6.8 40.5 59.5 1997 617.9 42.0 18.1 23.9 6.8 43.0 57.0 1998 615.9 41.3 17.6 23.7 6.7 42.6 57.4 1999 619.2 44.0 18.8 25.2 7.1 42.7 57.3 2000 644.5 46.4 18.6 27.8 7.2 40.0 60.0 2001 654.3 49.7 20.1 29.6 7.6 40.5 59.5 2002 671.7 51.7 21.7 30.1 7.7 41.9 58.1 2003 677.3 50.8 21.0 29.8 7.5 41.3 58.7 2004 716.4 55.2 23.9 31.3 7.7 43.3 56.7 2005 737.9 58.3 25.7 32.6 7.9 44.1 55.9 2006 779.4 58.5 28.0 30.5 7.5 47.9 52.1
Sources: Who, World Bank. Chart: Cebrap/CEM.
Table 2 – Total Population and SUS users, 2003 and 2008
2003 2008 Relative Increase
(%) MHDI %
SUS users
Population SUS Users Population SUS Users
MSP 0.84 48.3 10 629 245 5 131 194 10 940 311 5 281 874 2.9
Parelheiros 0.74 64.7 123 891 80 115 146 812 94 938 18.5Guaianases 0.76 62.3 269 263 167 771 289 214 180 202 7.4Itaim Paulista 0.76 61.4 373 878 229 652 395 729 243 073 5.8Cidade Tiradentes 0.77 61.6 199 533 122 999 214 397 132 162 7.4M'Boi Mirim 0.77 59.0 506 759 299 200 540 741 319 263 6.7Perus 0.77 59.0 118 758 70 092 133 300 78 675 12.2São Miguel 0.78 59.4 389 500 231 271 407 721 242 090 4.7São Mateus 0.78 58.2 398 727 232 140 425 948 247 988 6.8

27
Capela do Socorro 0.79 56.8 602 407 342 306 669 552 380 460 11.1Cidade Ademar 0.79 55.6 381 941 212 327 399 970 222 350 4.7Freguesia/Brasilândia 0.80 54.2 401 326 217 688 413 908 224 513 3.1Itaquera 0.80 53.8 502 620 270 185 521 760 280 474 3.8Campo Limpo 0.81 54.2 532 854 288 729 574 916 311 521 7.9Ermelino Matarazzo 0.82 52.3 206 691 108 089 209 276 109 441 1.3Vila Prudente 0.82 51.8 525 718 272 544 527 949 273 701 0.4Jaçanã/Tremembé 0.82 50.5 263 523 133 076 274 746 138 743 4.3Pirituba 0.83 50.6 409 650 207 091 439 318 222 089 7.2Casa Verde 0.83 49.2 313 777 154 498 313 795 154 507 0.0Vila Maria 0.84 49.0 296 897 145 499 287 344 140 818 ‐3.2Penha 0.85 48.3 475 283 229 350 473 242 228 365 ‐0.4Jabaquara 0.86 43.6 213 049 92 932 212 406 92 652 ‐0.3Ipiranga 0.86 44.9 428 440 192 345 426 378 191 419 ‐0.5Aricanduva 0.87 45.2 263 064 118 875 256 446 115 884 ‐2.5Butantã 0.89 41.0 379 968 155 827 382 420 156 833 0.6Santana/Tucuruvi 0.90 36.6 316 238 115 856 306 656 112 346 ‐3.0Mooca 0.90 38.5 304 618 117 127 298 453 114 756 ‐2.0Sé 0.93 37.0 364 874 135 111 351 192 130 045 ‐3.7Lapa 0.93 32.9 269 336 88 517 266 597 87 617 ‐1.0Santo Amaro 0.94 31.3 219 440 68 584 219 743 68 679 0.1Vila Mariana 0.95 26.3 308 143 80 954 299 264 78 621 ‐2.9Pinheiros 0.96 24.9 269 079 66 934 261 118 64 954 ‐3.0
Note: Numbers in blue are for growth above the municipality average; those in red are below the average.
Sources: IBGE; Fundação Seade; Municipal Secretariat of Labor; Municipal Secretariat for Planning. Created by: CEM/Cebrap

28
Chart 1 – BHU implanted between 2000 and 2008, São Paulo, 31 Sub‐municipalities
(Total Population)
600.000500.000400.000300.000200.000100.000
Total Population 2000
25
20
15
10
5
0
BH
U Im
plan
ted
(200
0-20
08)
Source: Municipal Secretariat for Planning. Created by: CEM/Cebrap
Table 3 – SUS hospital beds, 2000 and 2008
2000 2008
Territorial Units MHDI Public hosp.
beds
Acumul.
%.
Public hosp. beds
Acumul.
%.
Municipality of Sao Paulo 0.84 14,882 13,956
Parelheiros 0.74 ‐ 0.0 ‐ 0.0 Guaianases 0.76 226 1.5 305 2.2 Itaim Paulista 0.76 ‐ 1.5 289 4.3 Cidade Tiradentes 0.77 ‐ 1.5 228 5.9 M'Boi Mirim 0.77 316 3.6 524 9.6 Perus 0.77 ‐ 3.6 ‐ 9.6 São Miguel 0.78 196 5.0 189 11.0 São Mateus 0.78 146 5.9 262 12.9 Capela do Socorro 0.79 100 6.6 431 16.0 Cidade Ademar 0.79 ‐ 6.6 ‐ 16.0 Freguesia/Brasilândia 0.80 171 7.8 198 17.4 Itaquera 0.80 878 13.7 194 18.8

29
Campo Limpo 0.81 ‐ 13.7 ‐ 18.8 Ermelino Matarazzo 0.82 278 15.5 302 20.9 Vila Prudente/Sapopemba 0.82 89 16.1 448 24.1 Jaçanã/Tremembé 0.82 331 18.4 ‐ 24.1 Pirituba 0.83 462 21.5 482 27.6 Casa Verde/Cachoeirinha 0.83 371 23.9 411 30.5 Vila Maria/Vila Guilherme 0.84 233 25.5 222 32.1 Penha 0.85 68 26.0 52 32.5 Jabaquara 0.86 217 27.4 400 35.4 Ipiranga 0.86 592 31.4 624 39.8 Aricanduva/Formosa 0.87 ‐ 31.4 ‐ 39.8 Butantã 0.89 540 35.0 465 43.2 Santana/Tucuruvi 0.90 867 40.9 690 48.1 Mooca 0.90 956 47.3 830 54.1 Sé 0.93 3 218 68.9 625 58.5 Lapa 0.93 ‐ 68.9 130 59.5 Santo Amaro 0.94 200 70.3 515 63.2 Vila Mariana 0.95 1 869 82.8 2 299 79.6 Pinheiros 0.96 2 558 100.0 2 841 100.0
Source: Municipal Secretariat for Planning. Created by: CEM/Cebrap


www.centrodametropole.org.br