figure: 16-01 graph of linear equation.. figure: 16-02 computer printout of the hearing data
TRANSCRIPT

Figure: 16-01
Graph of linear equation.

Figure: 16-02
Computer printout of the hearing data.

Figure: 16-03
Two lines fit to the four data points.

Figure: 16-04
Difference between y and y.
ˆ
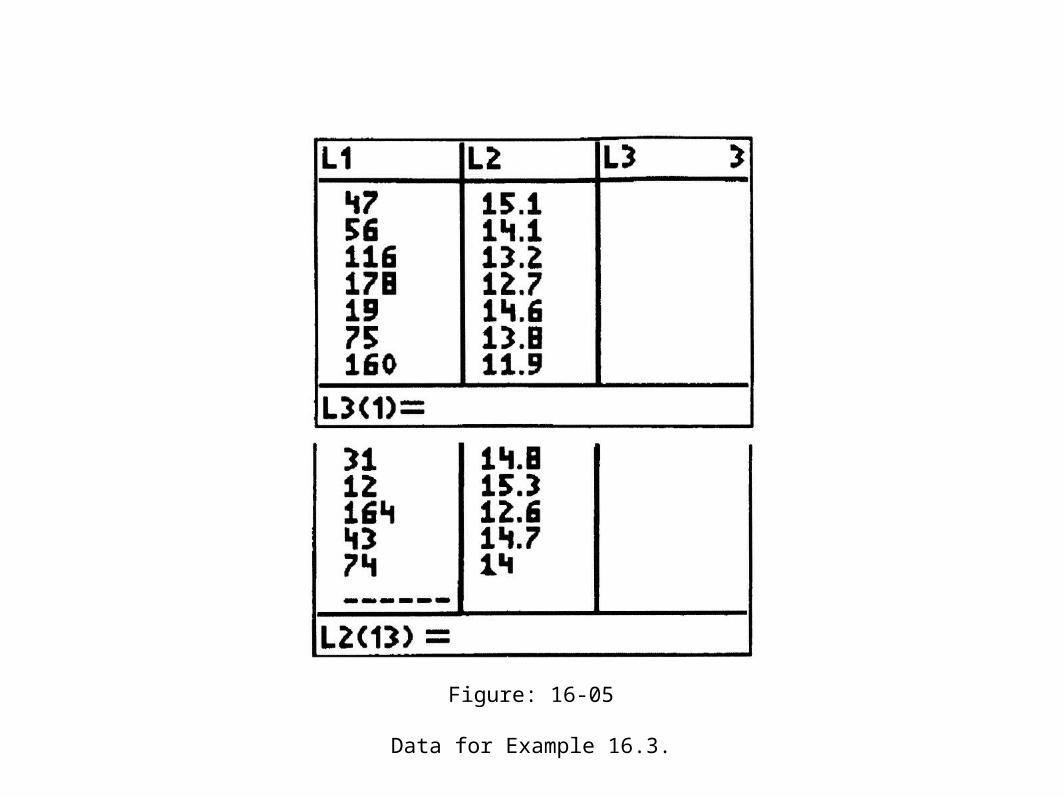
Figure: 16-05
Data for Example 16.3.

Figure: 16-06
Solution for Example 16.3.

Figure: 16-07
MINITAB printout for Example16.3.

Figure: 16-08
Distributions of y for given values of x.

Figure: 16-09
MINITAB printout for Example16.7.

Figure: 16-10
MINITAB printout for Example 16.9.
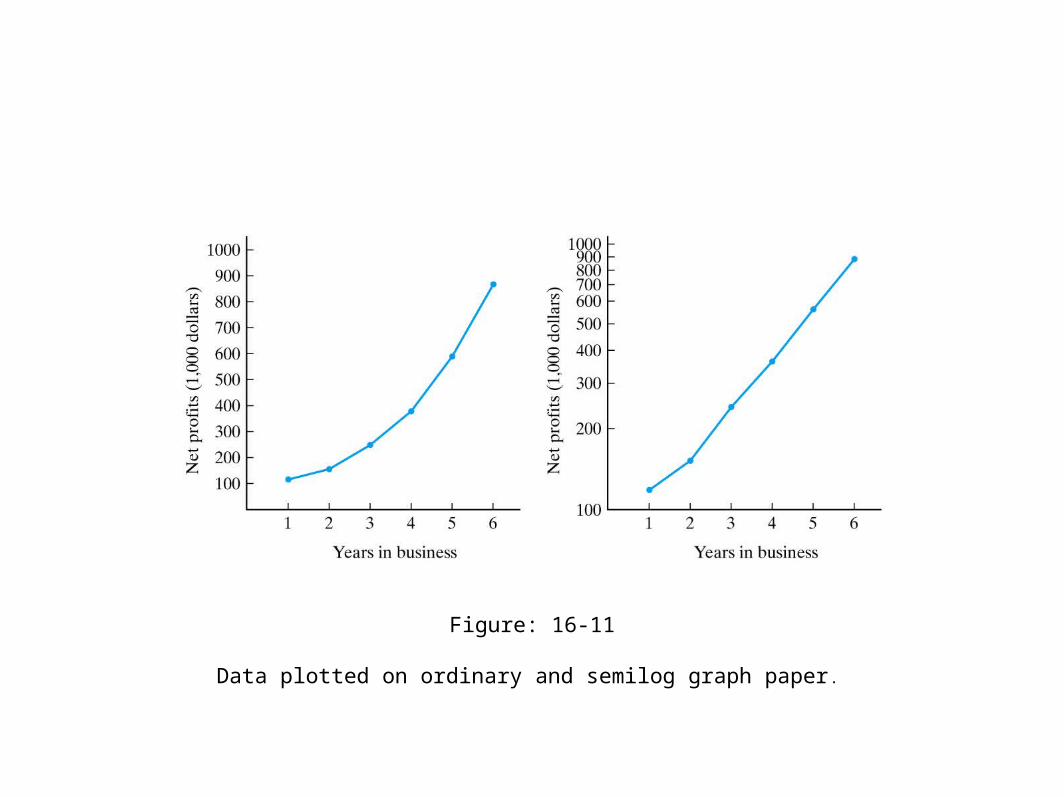
Figure: 16-11
Data plotted on ordinary and semilog graph paper.
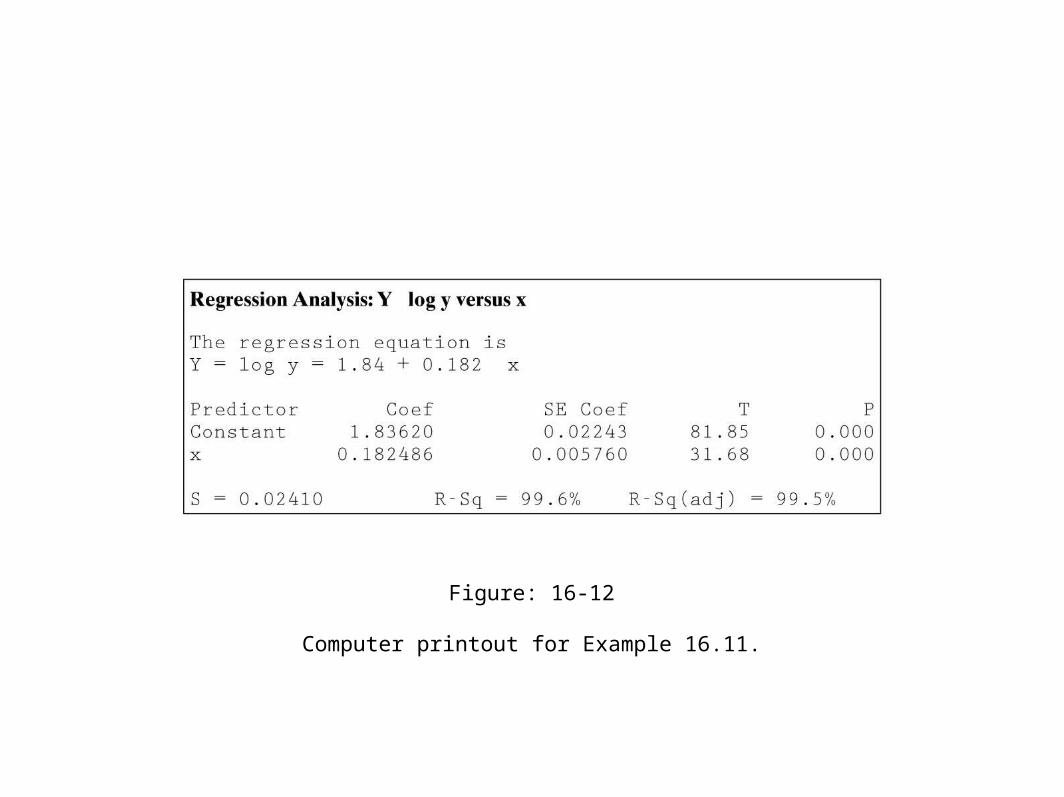
Figure: 16-12
Computer printout for Example 16.11.

Figure: 16-13
Values of a and b reproduced from display screen of TI-83 graphing calculator.

Figure: 16-14
Scattergram of the varnish-drying-time data.

Figure: 16-15
Computer printout for fitting parabola.
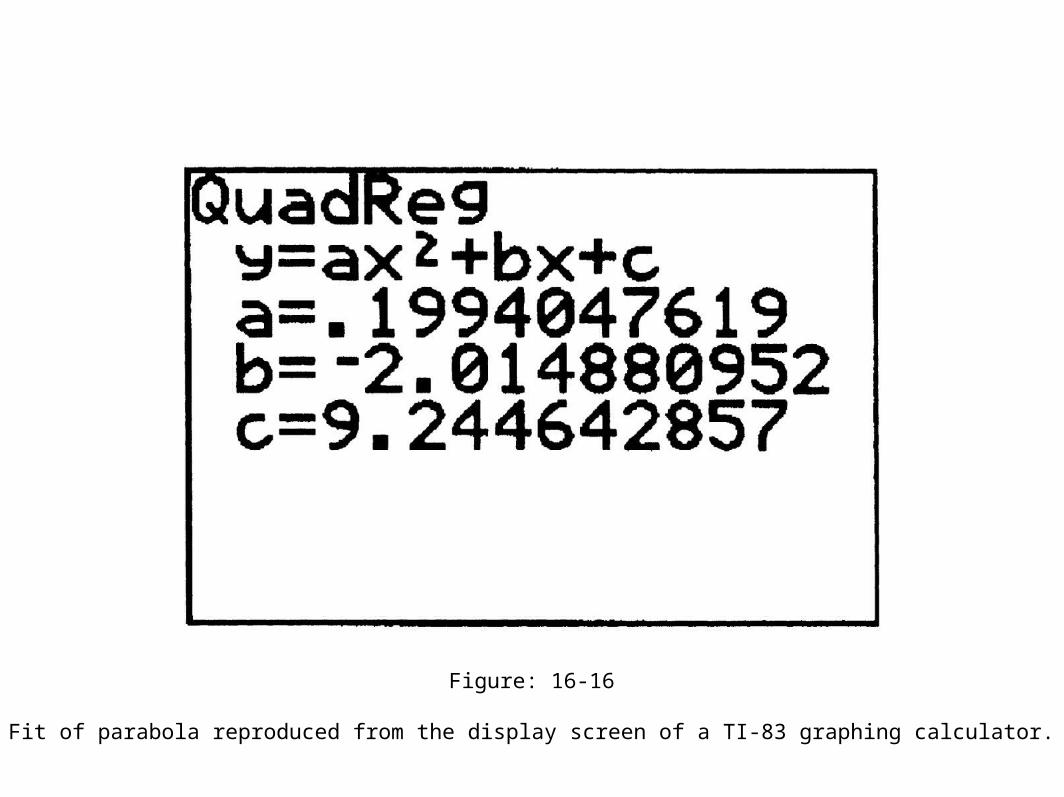
Figure: 16-16
Fit of parabola reproduced from the display screen of a TI-83 graphing calculator.