figure 2-1 typical digital signal processing system. joyce van de vegte fundamentals of digital...
TRANSCRIPT

FIGURE 2-1 Typical digital signal processing system.
Joyce Van de VegteFundamentals of Digital Signal Processing
Copyright ©2002 by Pearson Education, Inc.Upper Saddle River, New Jersey 07458
All rights reserved.

FIGURE 2-2 Analog signal.
Joyce Van de VegteFundamentals of Digital Signal Processing
Copyright ©2002 by Pearson Education, Inc.Upper Saddle River, New Jersey 07458
All rights reserved.

FIGURE 2-3 Sample-and-hold signal (shown with analog signal).
Joyce Van de VegteFundamentals of Digital Signal Processing
Copyright ©2002 by Pearson Education, Inc.Upper Saddle River, New Jersey 07458
All rights reserved.

FIGURE 2-4 Digital signal (shown with sample-and-hold signal).
Joyce Van de VegteFundamentals of Digital Signal Processing
Copyright ©2002 by Pearson Education, Inc.Upper Saddle River, New Jersey 07458
All rights reserved.

FIGURE 2-5 Undersampled analog signals.
Joyce Van de VegteFundamentals of Digital Signal Processing
Copyright ©2002 by Pearson Education, Inc.Upper Saddle River, New Jersey 07458
All rights reserved.

FIGURE 2-6 Aliasing in the time domain with 40 kHz sampling (adapted from Pohlmann, 1994).
Joyce Van de VegteFundamentals of Digital Signal Processing
Copyright ©2002 by Pearson Education, Inc.Upper Saddle River, New Jersey 07458
All rights reserved.

FIGURE 2-7 Antialiasing Filter.
Joyce Van de VegteFundamentals of Digital Signal Processing
Copyright ©2002 by Pearson Education, Inc.Upper Saddle River, New Jersey 07458
All rights reserved.

FIGURE 2-7 Antialiasing Filter.
Joyce Van de VegteFundamentals of Digital Signal Processing
Copyright ©2002 by Pearson Education, Inc.Upper Saddle River, New Jersey 07458
All rights reserved.

FIGURE 2-7 Antialiasing Filter.
Joyce Van de VegteFundamentals of Digital Signal Processing
Copyright ©2002 by Pearson Education, Inc.Upper Saddle River, New Jersey 07458
All rights reserved.

FIGURE 2-8 Signal and its spectrum.
Joyce Van de VegteFundamentals of Digital Signal Processing
Copyright ©2002 by Pearson Education, Inc.Upper Saddle River, New Jersey 07458
All rights reserved.

FIGURE 2-8 Signal and its spectrum.
Joyce Van de VegteFundamentals of Digital Signal Processing
Copyright ©2002 by Pearson Education, Inc.Upper Saddle River, New Jersey 07458
All rights reserved.
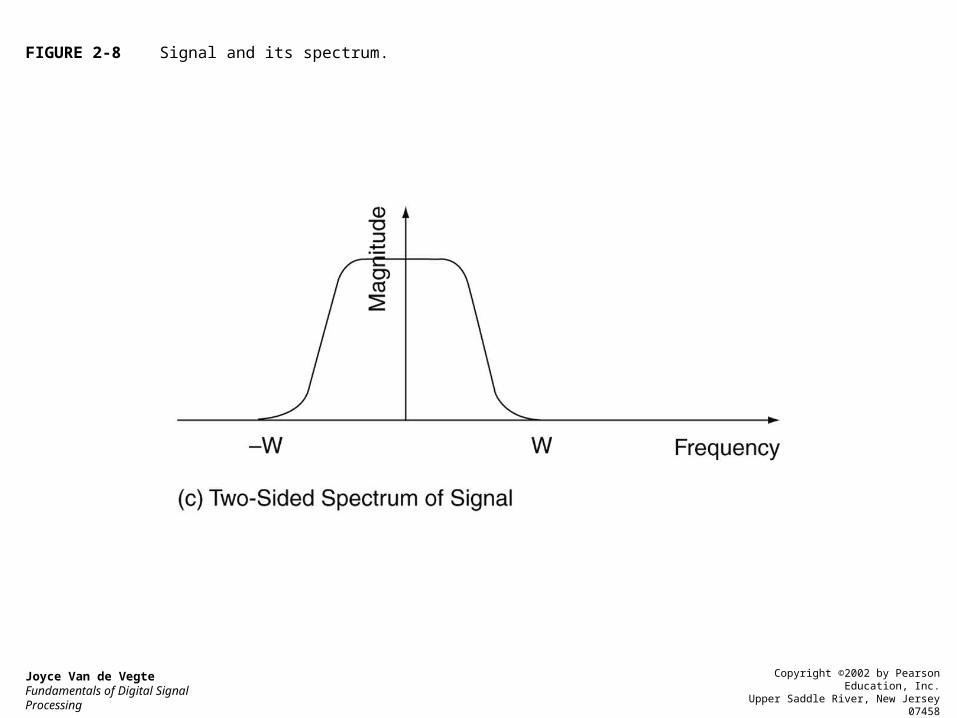
FIGURE 2-8 Signal and its spectrum.
Joyce Van de VegteFundamentals of Digital Signal Processing
Copyright ©2002 by Pearson Education, Inc.Upper Saddle River, New Jersey 07458
All rights reserved.

FIGURE 2-9 Spectra of original and sampled signals.
Joyce Van de VegteFundamentals of Digital Signal Processing
Copyright ©2002 by Pearson Education, Inc.Upper Saddle River, New Jersey 07458
All rights reserved.

FIGURE 2-9 Spectra of original and sampled signals.
Joyce Van de VegteFundamentals of Digital Signal Processing
Copyright ©2002 by Pearson Education, Inc.Upper Saddle River, New Jersey 07458
All rights reserved.

FIGURE 2-10 Sine wave sampled at Nyquist rate.
Joyce Van de VegteFundamentals of Digital Signal Processing
Copyright ©2002 by Pearson Education, Inc.Upper Saddle River, New Jersey 07458
All rights reserved.

FIGURE 2-11 Spectra of sampled sine waves.
Joyce Van de VegteFundamentals of Digital Signal Processing
Copyright ©2002 by Pearson Education, Inc.Upper Saddle River, New Jersey 07458
All rights reserved.

FIGURE 2-11 Spectra of sampled sine waves.
Joyce Van de VegteFundamentals of Digital Signal Processing
Copyright ©2002 by Pearson Education, Inc.Upper Saddle River, New Jersey 07458
All rights reserved.

FIGURE 2-12 Sampling band-limited signals.
Joyce Van de VegteFundamentals of Digital Signal Processing
Copyright ©2002 by Pearson Education, Inc.Upper Saddle River, New Jersey 07458
All rights reserved.

FIGURE 2-12 Sampling band-limited signals.
Joyce Van de VegteFundamentals of Digital Signal Processing
Copyright ©2002 by Pearson Education, Inc.Upper Saddle River, New Jersey 07458
All rights reserved.

FIGURE 2-12 Sampling band-limited signals.
Joyce Van de VegteFundamentals of Digital Signal Processing
Copyright ©2002 by Pearson Education, Inc.Upper Saddle River, New Jersey 07458
All rights reserved.

FIGURE 2-13 Undersampling in target detection.
Joyce Van de VegteFundamentals of Digital Signal Processing
Copyright ©2002 by Pearson Education, Inc.Upper Saddle River, New Jersey 07458
All rights reserved.

FIGURE 2-14 Oversampling.
Joyce Van de VegteFundamentals of Digital Signal Processing
Copyright ©2002 by Pearson Education, Inc.Upper Saddle River, New Jersey 07458
All rights reserved.

FIGURE 2-14 Oversampling.
Joyce Van de VegteFundamentals of Digital Signal Processing
Copyright ©2002 by Pearson Education, Inc.Upper Saddle River, New Jersey 07458
All rights reserved.

FIGURE 2-15 Quantization of unipolar data (maximum error = full step).
Joyce Van de VegteFundamentals of Digital Signal Processing
Copyright ©2002 by Pearson Education, Inc.Upper Saddle River, New Jersey 07458
All rights reserved.
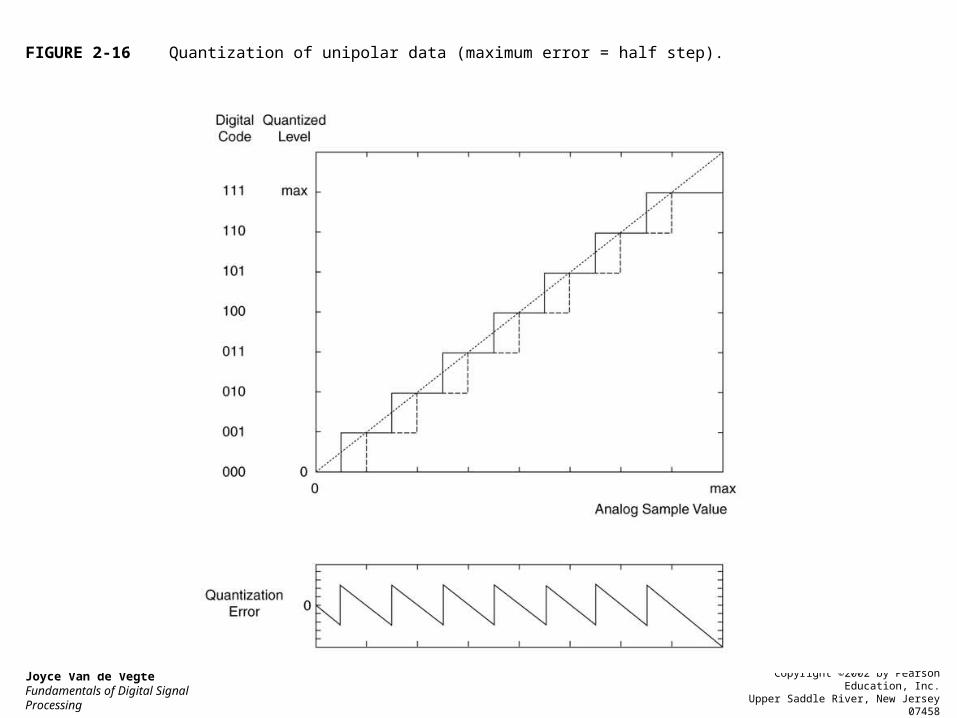
FIGURE 2-16 Quantization of unipolar data (maximum error = half step).
Joyce Van de VegteFundamentals of Digital Signal Processing
Copyright ©2002 by Pearson Education, Inc.Upper Saddle River, New Jersey 07458
All rights reserved.

FIGURE 2-17 Quantization diagram for Example 2.2.
Joyce Van de VegteFundamentals of Digital Signal Processing
Copyright ©2002 by Pearson Education, Inc.Upper Saddle River, New Jersey 07458
All rights reserved.

FIGURE 2-18 Quantization of bipolar data (maximum error = half step).
Joyce Van de VegteFundamentals of Digital Signal Processing
Copyright ©2002 by Pearson Education, Inc.Upper Saddle River, New Jersey 07458
All rights reserved.

FIGURE 2-19 Analog-to-digital conversion.
Joyce Van de VegteFundamentals of Digital Signal Processing
Copyright ©2002 by Pearson Education, Inc.Upper Saddle River, New Jersey 07458
All rights reserved.

FIGURE 2-20 A/D.
Joyce Van de VegteFundamentals of Digital Signal Processing
Copyright ©2002 by Pearson Education, Inc.Upper Saddle River, New Jersey 07458
All rights reserved.

FIGURE 2-21 Three-bit A/D conversion.
Joyce Van de VegteFundamentals of Digital Signal Processing
Copyright ©2002 by Pearson Education, Inc.Upper Saddle River, New Jersey 07458
All rights reserved.

FIGURE 2-22 Serial digital bitstream.
Joyce Van de VegteFundamentals of Digital Signal Processing
Copyright ©2002 by Pearson Education, Inc.Upper Saddle River, New Jersey 07458
All rights reserved.

FIGURE 2-23 Digital-to-analog conversion.
Joyce Van de VegteFundamentals of Digital Signal Processing
Copyright ©2002 by Pearson Education, Inc.Upper Saddle River, New Jersey 07458
All rights reserved.
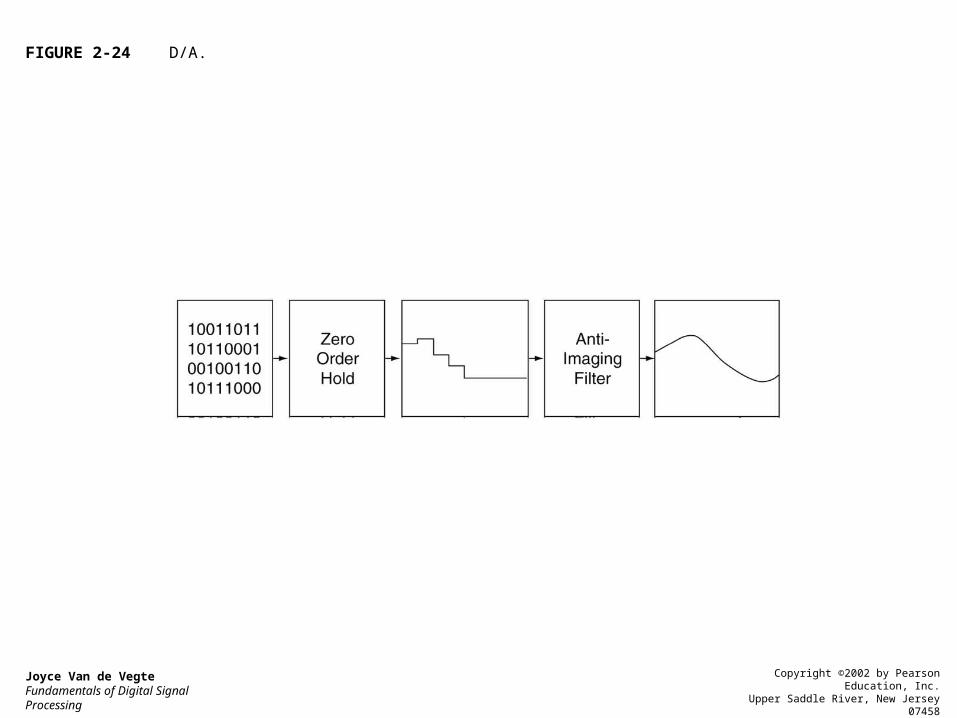
FIGURE 2-24 D/A.
Joyce Van de VegteFundamentals of Digital Signal Processing
Copyright ©2002 by Pearson Education, Inc.Upper Saddle River, New Jersey 07458
All rights reserved.

FIGURE 2-25 Three-Bit D/A conversion.
Joyce Van de VegteFundamentals of Digital Signal Processing
Copyright ©2002 by Pearson Education, Inc.Upper Saddle River, New Jersey 07458
All rights reserved.

FIGURE 2-26 Comparing signals in the A/D/D/A chain.
Joyce Van de VegteFundamentals of Digital Signal Processing
Copyright ©2002 by Pearson Education, Inc.Upper Saddle River, New Jersey 07458
All rights reserved.

FIGURE 2-26 Comparing signals in the A/D/D/A chain.
Joyce Van de VegteFundamentals of Digital Signal Processing
Copyright ©2002 by Pearson Education, Inc.Upper Saddle River, New Jersey 07458
All rights reserved.

FIGURE 2-26 Comparing signals in the A/D/D/A chain.
Joyce Van de VegteFundamentals of Digital Signal Processing
Copyright ©2002 by Pearson Education, Inc.Upper Saddle River, New Jersey 07458
All rights reserved.

FIGURE 2-26 Comparing signals in the A/D/D/A chain.
Joyce Van de VegteFundamentals of Digital Signal Processing
Copyright ©2002 by Pearson Education, Inc.Upper Saddle River, New Jersey 07458
All rights reserved.

FIGURE 2-27 Spectrum for Question 2.6.
Joyce Van de VegteFundamentals of Digital Signal Processing
Copyright ©2002 by Pearson Education, Inc.Upper Saddle River, New Jersey 07458
All rights reserved.

FIGURE 2-28 Magnitude spectrum for Question 2.7.
Joyce Van de VegteFundamentals of Digital Signal Processing
Copyright ©2002 by Pearson Education, Inc.Upper Saddle River, New Jersey 07458
All rights reserved.

FIGURE 2-29 Spectrum for Question 2.10(a).
Joyce Van de VegteFundamentals of Digital Signal Processing
Copyright ©2002 by Pearson Education, Inc.Upper Saddle River, New Jersey 07458
All rights reserved.

FIGURE 2-30 Spectrum for Question 2.1(b).
Joyce Van de VegteFundamentals of Digital Signal Processing
Copyright ©2002 by Pearson Education, Inc.Upper Saddle River, New Jersey 07458
All rights reserved.

FIGURE 2-31 Signals for Question 2.19.
Joyce Van de VegteFundamentals of Digital Signal Processing
Copyright ©2002 by Pearson Education, Inc.Upper Saddle River, New Jersey 07458
All rights reserved.