figure 3 if the 6.02 x 10²³ atoms in 12 g of carbon were...
TRANSCRIPT

Figure 3 If the 6.02 x 10 23 atoms in 12 g ofcarbon were turned into marbles, the marblescould cover Great Britain to a depth of 1500 km!

Figure 3 The mass spectrometer.
Figure 3 The mass spectrometer.
Figure 7 Variation of first ionisation enthalpywith atomic number for elements with atomicnumbers 1 to 56.
Figure 8 Successive ionisation enthalpies for aluminium.
sample inlet
electron gun
magnetic field
(at right angles
to paper)
ion detector
ionisation chamber
accelerating electric field
heavy particles
intermediate
particles
lighter particles
pump maintains
low pressure
He
Li
Ne
Na
Ar
K
Kr
Rb
Xe
Cs
2500
2000
1500
1000
500
Atomic number
50403010 200Io
nis
ation e
nth
alp
y/
kJ m
ol–
1
Ionisation1st 2nd 3rd 4th 5th 6th 7th 8th
20 000
10 000
0Ionis
ation e
nth
alp
y/k
J m
ol–
1

Figure 9 Successive ionisation enthalpies for phosphorus.
Energy
Shell Sub-shell
n = 4
n = 3
n = 2
n = 1
4443433
22
1
fdpdsps
sp
s
Figure 10 Energies of electron sub-shells from n = 1 to n = 4 in a typical many-electron atom.The energy of a sub-shell is not fixed, but falls asthe charge on the nucleus increases as you gofrom one element to the next in the PeriodicTable. The order shown in the diagram is correctfor the elements in Period 3 and up to nickel inPeriod 4. After nickel the 3d sub-shell has lowerenergy than 4s.
1s
2s
3s
3p
2p
3d
Energy
Figure 13 Arrangement of electrons in atomicorbitals in a ground state sodium atom.
Ionisation1st 2nd 3rd 4th 5th 6th 7th 8th
20 000
10 000
0Ion
isa
tio
n e
nth
alp
y/k
J m
ol–
1
30 000

Figu
re 1
4 Bu
ildin
g up
the
Peri
odic
Tab
le.
sym
bo
l
ele
ctr
onic
configura
tion
(oute
r sub-s
hell(
s)
only
)
ato
mic
num
ber
KE
Y O8
2p
4
Actinid
es
Lanth
anid
es
Pa
Np
Pr
Th
U
Ce
Nd
Pm
Ac
Fr
Ra
58
59
60
61
90
91
92
93
87
88
89
4 5 6 7
3d
14s
23d
34s
2
4d
15s
24d
35s
2
5d
16s
25d
36s
2
3d
24s
23d
54s
1
4d
25s
24d
55s
2
5d
26s
25d
46s
2
4s
1
5s
1
6s
1
7s
1
4s
2
5s
2
6s
2
7s
2
4d
55s
1
3d
54s
2
5d
56s
2
3 11
19
4 12
20
37 55
38
56
23
25
21
39
57
24
41
22
40
72
43
42
73
75
74
Li
Be
Na
Mg
KC
a
Rb
Sr
Cs
Ba
LaS
c Y
Hf
Ti
Zr
TaV Nb
WCr
Mo
Re
Mn
Tc
filli
ng d
sub-s
hells
filli
ng 4
f su
b-s
he
ll
filli
ng 5
f su
b-s
he
ll
3d
64s
2
4d
75s
1
5d
66s
2
3d
74s
2
4d
85s
1
5d
76s
2
3d
84
s2
5d
96
s1
3d
104
s1
4d
105
s1
5d
106
s1
3d
104
s2
4d
105
s2
5d
106
s2
27
29
28
45
26
44
76
47
46
77
79
78
30
48
80
63
62
94
65
64
95
97
96
66
98
Am
Bk
Eu
Pu
Cm
Sm
Gd
Tb
Os
Fe
Ru
IrCo
Rh
Pt
Ni
Pd
Au
Cu
Ag
Cf
Dy
Hg
Zn
Cd
4d
105
s0
4p
1
5p
1
6p
1
4p
2
5p
2
6p
2
4p
2
6p
3
4p
4
5p
4
6p
4
4p
5
5p
5
6p
5
32
34
33
50
31
49
81
52
51
82
84
83
35
53
85
68
67
99
70
69
10
01
02
10
1
71
10
3
Fm
No
Er
Es
Md
Ho
Tm
Yb
Tl
Ga
In
Pb
Ge
Sn
Bi
As
Sb
Po
Se
Te
Lr
Lu
At
Br I
5p
3
4p
6
5p
6
6p
6
36
54
86R
n
Kr
Xe
filli
ng
p s
ub
-sh
ells
34
56
70
2p
1
3p
1
2p
2
3p
23
p3
2p
4
3p
4
2p
5
3p
5
65 1
3
87
14
16
15
9 17
Tl
B
Si
C
PN
SO
Cl
F2
p3
1s
2
2p
6
3p
6
2 10
18
Ar
He
Ne
1s
1
1
H
2s
1
3s
1
2s
2
3s
2
Period
1 2 3
filli
ng s
sub-s
hells
12
Gro
up

Figure 15 Dividing up the Periodic Table.
s block
d block
p block
metals non-metalsf block

Cl– ion
Na+ ion
‘Pool’ of delocalised
electrons
attraction
nucleus
+ +–
–
shared electrons
Figure 9 In a hydrogen molecule, the atoms areheld together because their nuclei are bothattracted to the shared electrons.
Li1.0
Be1.6
B2.0
C2.6
N3.0
O3.4
F4.0
Na0.9
Mg1.3
K0.8
Ca1.0
Rb0.8
Sr1.0
Al1.6
Si1.9
P2.2
S2.6
Cl3.2
Br3.0
I2.7
H2.2
Li1.0
Period
symbol
electronegativity
KEY
Group
2
1
1 2 3 4 5 6 7
3
4
5
Figure 2 The sodium chloride lattice, built upfrom oppositely charged sodium ions andchloride ions.
Figure 15 A model of metallic bonding.
Figure 13 Pauling electronegativity values forsome main group elements in the Periodic Table.

Figure 17 The relative sizes of atoms and ions.
Figure 18 Ions with higher charge densitiesattract more water molecules (ions are only shown in two dimensions).
Na+ ion (charge 1+, radius 0.098nm)
On average, each Na+ ion is surrounded by
5 water molecules
Mg 2+ ion (charge 2+, radius 0.078nm)
On average, each Mg 2+ ion has 15
water molecules around it
+ 2+
Figure 19 Hydrated ions are much bigger thanisolated ions.
Li+ (g)
isolated Li+ ion(radius = 0.078nm)
Li+ (aq)
hydrated Li+ ion (radius = 1.00nm)
Na+ (g)
Na+ (aq)
isolated Na+ ion(radius = 0.098nm)
Figure 36 Two isomers of alanine.
H
CHOOC NH2
CH3
H
CCOOHH2N
H3C
Figure 38 The CORN rule. Look down the H—C bond from hydrogen towards the centralcarbon atom.
COOH COOH
C
H
CORNL isomer
H2N
R
C
H
CORND isomer NH2
R
hydrated Na+ ion (radius = 0.79nm)
Li Li+
Li atom
ratom = 0.152 nm
Li+ ion
rion = 0.078 nm
Na Na+
Na atom
ratom = 0.186 nm
Na+ ion
rion = 0.098 nm
Mg Mg2+
Mg atom
ratom = 0.160 nm
Mg2+ ion
rion = 0.078 nm
F F–
F atom
ratom = 0.071 nm
F– ion
rion = 0.133 nm
O O2–
F atom
ratom = 0.073 nm
F– ion
rion = 0.132 nm

Ent
halp
y
reactants productsProgress of reaction
chemicalreactants
energy given outto surroundings∆H negative
eg CH4+2O2
productseg CO2+2H2O
Figure 1 Enthalpy level diagram for anexothermic reaction, eg burning methane:CH4 +2O
2 g CO
2 + 2H
2O.
thermometer
water
electrically heatedwire to ignite sample
air jacket
oxygen under pressure
crucible containingsample under test
stirrer
Figure 3 A bomb calorimeter for makingaccurate measurements of energy changes. Thefuel is ignited electrically and burns in theoxygen inside the pressurised vessel. Energy istransferred to the surrounding water, whosetemperature rise is measured.Note that the experiment is done at constantvolume in a closed container. Enthalpy changesare for reactions carried out at constant pressure ,so the result needs to be modified accordingly.
energy taken infrom surroundings∆H positive
chemicalreactantseg CaCO3
Ent
halp
y
reactants productsProgress of reaction
productseg CaO+CO2
Figure 2 Enthalpy level diagram for anendothermic reaction, eg decomposing calciumcarbonate: CaCO
3 g CaO + CO
2.
∆H going this way...
... is the same as ∆H going
this way
CH4(g)
CO2(g) + 2H2O(I)
C(s) + 2H2(g)
Figure 4 An enthalpy cycle for finding the enthalpychange of formation of methane, CH4 .

Ene
rgy +
breaking bonds(takes in energy)
making new bonds(gives out energy)
H
H
O O
O O
C H
O O O O
H H H
C OOO
HH
O
HH
C
H H
Figure 9 Breaking and making bonds in the reaction between methane and oxygen.
Solid Liquid Gas
particles in fixed positions particles moving aroundregular lattice pattern random arrangement
particles close together particles widely separatedvolume depends only slightly on pressure and temperature
volume depends strongly ontemperature and pressure
Figure 14 A comparison of solids, liquids andgases.
Increasing energy
each rotationallevel has its own
translational levels
each vibrationallevel has its own
rotational levels
each electroniclevel has its own
vibrational levels
ground electronicenergy level
vibrationalenergylevels
rotationalenergylevels
translationalenergylevels
Figure 15 Each electronic energylevel has within it severalvibrational, rotational andtranslational energy levels. Notethat the levels are not to scale.
‘stack’ of ‘stack’ of ‘stack’ of

ionic lattice + solvent solution
gaseous ions+
solvent
∆Hsolution
∆HLE ∆Hhyd(cation)
+∆Hhyd(anion)
Figure 21 An enthalpy cycle to show thedissolving of an ionic solid.
Figure 26 Born–Haber cycle for sodiumchloride.
NaCI(s)Na(s) + ½CI2(g)
Na+(g) + CI-(g)Na(g) + CI(g)
∆H2
∆H1
∆H3
∆H4

Figure 27 Born–Haber cycles for sodium chloride and potassium chloride.
Enthalpy/kJmol–1
Na+(g) + Cl(g)
+800
+700
+600
+500
+400
∆Hi (1)(Na)
∆HEA(1)(Cl)
Na+(g) + Cl(g)
K+(g) + Cl(g)
∆Hi (1)(K)
K+(g) + Cl(g)
K+(g) + Cl–(g)
∆HEA(1)(Cl)
+400
+200
+100
0
+300
–100
–200
–300
–400
–500
Na(g) + Cl(g)
∆Hat (Cl)
Na+(g) + 12 Cl2(g)
∆Hat (Na)
Na(s) + 12 Cl2(g)
∆Hf (NaCl)
NaCl(s)
∆HLE(NaCl)
∆Hat (Cl)
K(g) + 12 Cl2(g)
∆Hat (K)
K(s) + 12 Cl2(g)
∆Hf
(KCl) ∆HLE(KCl)
KCl(s)

Figure 27 Born–Haber cycles for sodium chloride and potassium chloride.
Enthalpy/kJmol–1
Na+(g) + Cl(g)
+800
+700
+600
+500
+400
Na+(g) + Cl(g)
K+(g) + Cl(g)
K+(g) + Cl(g)
K+(g) + Cl–(g)
+400
+200
+100
0
+300
–100
–200
–300
–400
–500
Na(g) + Cl(g)
Na+(g) + 12 Cl2(g)
Na(s) + 12 Cl2(g)
NaCl(s)
K(g) + 12 Cl2(g)
K(s) + 12 Cl2(g)
KCl(s)

Figure 2 What happens when an ionic substancesuch as sodium chloride dissolves in water.
Figure 5 Polar water molecules attract the ions ina solid lattice.
Figure 11 (a) The structure of diamond and (b)the structure of graphite.
(a) (b)
Figure 12 Imagine you are inside a diamond. Theregular network structure would repeat in alldirections – as far as the edge of the diamond.
Figure 13 The fullerenes are a recently discoveredmolecular form of carbon. (a) shows C60 , named buckminsterfullerene. It is made up of a mixture of 5-membered and 6-membered rings and looks like a football(b) is another way of presenting C60 , showing thepositions of the carbon atoms(c) shows C70 , which is shaped like a rugby ball.
(a) (b) (c)
– + –
– –
– –
– –
––
–
–
+
+ +
+ +
+ +
+
+
+
+
Solid sodium chloridea retular ionic lattice
Cl– Na+ Cl–(aq) Na+(aq) water molecule
Sodium chloridedissolved in water
δ−δ+
solid lattice
polar water molecule
hydrated ions
+
–
+
+
+ +
+ +
+ + +
+ + +
–
– –
– –
– –
– – –
δ−
δ−δ−
δ−
δ−
δ−
δ−
δ−
δ−
δ−
δ−δ−
δ−
δ−δ+
δ+
δ+δ+
δ+ δ+
δ+
δ+δ+
δ+δ+
δ+
δ+δ+

Figure 14 On heating, the molecular substance(represented by ) changes from a solid to aliquid and then to a gas. Energy must be suppliedto overcome the intermolecular forces. Note thatthe covalent bonds within the molecules remainintact.
heatm.p.
heatb.p.
Solid Liquid Gas
δ+ δ –
At some instant, more of the electroncloud happens to be at one end of themolecule than the other; moleculehas an instantaneous dipole.
Electron cloud evenly distributed; no dipole.
Cl Cl Cl Cl
Figure 15 How a dipole forms in a chlorinemolecule.
This atom is not yet polarised, but its electrons are repelled by the dipole next to it ...
Xe
This atom is instantaneouslypolarised
Xeδ+ δ – Xeδ+ δ –
... so it becomespolarised
Xeδ+ δ –
Figure 18 How an induced dipole is formed in aXe atom.
Boi
ling
poin
t/K
400
300
200
100
Period2 3 4 5
H2TeSbH3HISnH4
H2O
HF
NH3
CH4
Group 4Group 5Group 6Group 7
Figure 20 Variation in the boiling points of thehydrides of some Group 4, 5, 6 and 7 elements.
Ent
halp
y ch
ange
of
vapo
risat
ion/
kJ
mol
-1 l
40
20
0
Period2 3 4 5
H2TeSbH3HISnH4
H2O
HFNH3
CH4
Group 4Group 5Group 6Group 7
Figure 21 Variation in the enthalpy changes ofvaporisation of some Group 4, 5, 6 and 7elements.

Lone pair; concentratednegative charge
FH
Hδ+
Fδ–
Figure 23 The positively charged H atom linesup with the lone pair on an F atom.
H
HHHO
Hydrogen bond
Lone pair
O
HHO
Figure 25 The positively charged H atoms lineup with the lone pairs on the O atoms.
Key
oxygenhydrogenhydrogen bond
Figure 28 The arrangement of water moleculesin ice.

HEA T
easily broken by heating; polymer canbe moulded into new shape.
chains cannot be easily broken; polymerkeeps shape on heating.
polymer chain
cross–link
Figure 29 Thermoplastics and thermosets.
crystalline region
amorphous region
Figure 32 Crystalline and amorphous regions ofa polymer.
GIANTLATTICEgoes on
indefinitely
STRUCTURES
MOLECULARmade of groups of atoms
COVALENTMOLECULAR
COVALENTNETWORK
METALLICIONIC MACROMOLECULAR(eg polymers)
Figure 36 A summary of the structures ofsubstances.
(a) Thermoplastic: no cross–linking
HEAT
Weak forces between polymer chains
(b) Thermoset: extensive cross–linking Strong covalent bonds between polymer

Figure 3 Obtaining a line emission spectrum.
Figure 4 Obtaining a line absorptionspectrum.
electron hasbeen excitedto level 5,drops back tolevel 1
etclevel 5level 4
level 3
level 2
level 1ground
state
Lyman series
this line correspondsto electrons droppingfrom level 5 1
1
21
3
1 5
2 1 3 1 4 1
1 4
Frequency
Figure 6 How the Lyman series in theemission spectrum is related to energylevels in the H atom.
wire with sampleof element
excited atomsin hot flameemit light
slit
prism
line emission spectrum(bright lines on a blackbackground)
source ofwhite light
wire with sampleof element
cool flame:most atoms in vapour are in theirground state line absorption spectrum (black lines
on a bright coloured background)
slit
prism

Increasingenergy
Cl H
ELECTRONICENERGY
VIBRATIONALENERGY
ROTATIONALENERGY
TRANSLATIONALENERGY
Cl H
Cl H
Cl H
Cl HFigure 7 An HCl molecule has energy associatedwith different aspects of its behaviour.
Figure 16 The basic parts of a double beaminfrared spectrometer.
3000 2000 1000Wavenumber/cm –1
Tran
smitt
ance
/%
100
80
60
40
20
Figure 21 Infrared spectrum of butane.
Absorption/cm–1 Bond2970 C—H (alkane)
CH3 CH2 CH2 CH3
sample cell forsolution of sample
infrared source(electrically heatedfilament)
reference cellfor solvent only
NaCl prism(or diffraction
grating)
infrareddetector
chart recorder

3000 2000 1000Wavenumber/cm–1
Tran
smitt
ance
/%
100
80
60
40
20
Figure 23 Infrared spectrum of benzoic acid.
Absorption/cm–1 Bond3580 O−H3080 C−H (arene)1760 C=O
COHO
Figure 22 Infrared spectrum of methylbenzene.
Absorption/cm–1 Bond3050 C−H (arene)2940 C−H (alkane)
CH3
powerfulmagnet
sample
RF signal generator detector
recorder
SN
Figure 37 A simplified diagram of an n.m.r.spectrometer.
N S
N S
E2
E1
∆Ealigned againstmagnetic field
aligned withmagnetic field
N S
NS
Figure 36 The principle of n.m.r.: a smallmagnet in a strong magnetic field can have twodifferent energies.
100
80
60
40
20
3000 2000 1000
Wavenumber/cm–1
Tra
nsm
itta
nce/%

Chemical Relative Type ofshift no. protons proton0.9 3 CH31.3 4 CH2
CH3 CH2 CH2 CH2 CH2 CH3
Abs
orpt
ion
012345Chemical shift
8H6H
TMS
678910
Figure 43 N.m.r. spectrum of hexane.
Chemical Relative Type ofshift no. protons proton1.6 3 CH3
5.6 1
C C
H
CH3
H3C
H
H C C H
Figure 44 N.m.r. spectrum of trans-but-2-ene.
Abs
orpt
ion
012345Chemical shift
3H
2H
2H
1H
TMS
678910
Chemical Relative Type ofshift no. protons proton0.9 3 CH3
1.6 2
2.3 1 OH
3.6 2
CH3 CH2 CH2 OH
C CH2 C
C CH2 OFigure 45 N.m.r. spectrum of propan-1-ol.
transparent object,glass or a solution
all wavelengths ofvisible light transmitted:appears colourless
all wavelengthsof visible lightreflected:appears white
opaque object,eg a piece of chalk
Figure 52 How light behaves with transparentand opaque objects.
Chemical shift
Ab
so
rptio
n
6H
TMS2H
10 9 8 7 6 5 4 3 2 1 0

transparent object
absorbsred
transmits wavelengths correspondingto other colours: appears green
reflects wavelengths corresponding toother colours: appears orange
opaqueobject absorbs blue
Figure 53 How colours arise from absorption oflight.
Inte
nsity
of a
bsor
ptio
n
ultra violet visible infra red
260 300 340 380 420 460 500 540 580 620 660 700Wavelength/nm
ultra violet visibleviolet blue green yellow red
infra red
Figure 57 The absorption spectrum of carotene(in solution in hexane).
λ/nm
blue light istransmitted
blue light isreflected(Reflectancespectrumshown below)
opaque, colouredobject, eg painting
Inte
nsity
of a
bsor
ptio
n
absorption spectrum
Ref
lect
ance
reflectance spectrum
red and yellow lightis absorbed. (Absorptionspectrum shown below)
transparentcolouredobject, eg solution
600 700500400 600 700500400
paint layer absorbsred and yellowlight
100
0
λ/nm
Figure 59 Absorption and reflectance spectra ofMonastral Blue.

excitationenergy excited electronic state
energy absorbedcorresponds toultraviolet light
excitation energies inthis region correspondto visible radiation
energy absorbedcorresponds tovisible light
excited electronic state
ground electronic states
COLOUREDCOMPOUND
COLOURLESSCOMPOUND
Figure 63 The energy needed to excite anelectron in a coloured compound and in acolourless compound.

–
–
–
–
–
‘hard’ water
‘soft’ water
Ca2+
–Ca2+
Na+
Na+
Na+
Na+
Na+
Ca2+
Figure 10 Ion-exchange columns are used tosoften water. The ion-exchange resin removescalcium ions from the ‘hard’ water, and replacesthem with sodium ions to form ‘soft’ water.
separatedcomponentsof mixture
sample spotcontainingmixture of Aand B
B
A
thin-layer platecoated with silicagel (stationaryphase)
solvent (mobile phase)
lid solvent front
Figure 11 Thin-layer chromatography.
separatedcomponentsof mixture
and B
B
A
phase)
solvent
Figure 11 Thin-layer chromatography.
recorderdetector
outlet tube
syringecontainingsample
inert carrier gas
thermostaticallycontrolled oven
column
Figure 15 A gas–liquid chromatograph.
Figure 15 A gas–liquid chromatograph.

Figure 5 The pH scale.
H+ (aq) +stays roughlyconstantbecause
plenty of HA to make more H+ (aq) if some used up by alkali that gets added
plenty of A– to combinewith any H+(aq) that getsadded
A–HA
Figure 6 How a buffer solution keeps the pHconstant.
pH [H+(aq)]/mol dm–3
Moreacidic
Neutral
Morealkaline
0
1
2
3
4
5
6
7
8
9
10
11
12
13
1
10–1
10–2
10–3
10–4
10–5
10–6
10–7
10–8
10–9
10–10
10–11
10–12
10–13
14 10–14
–
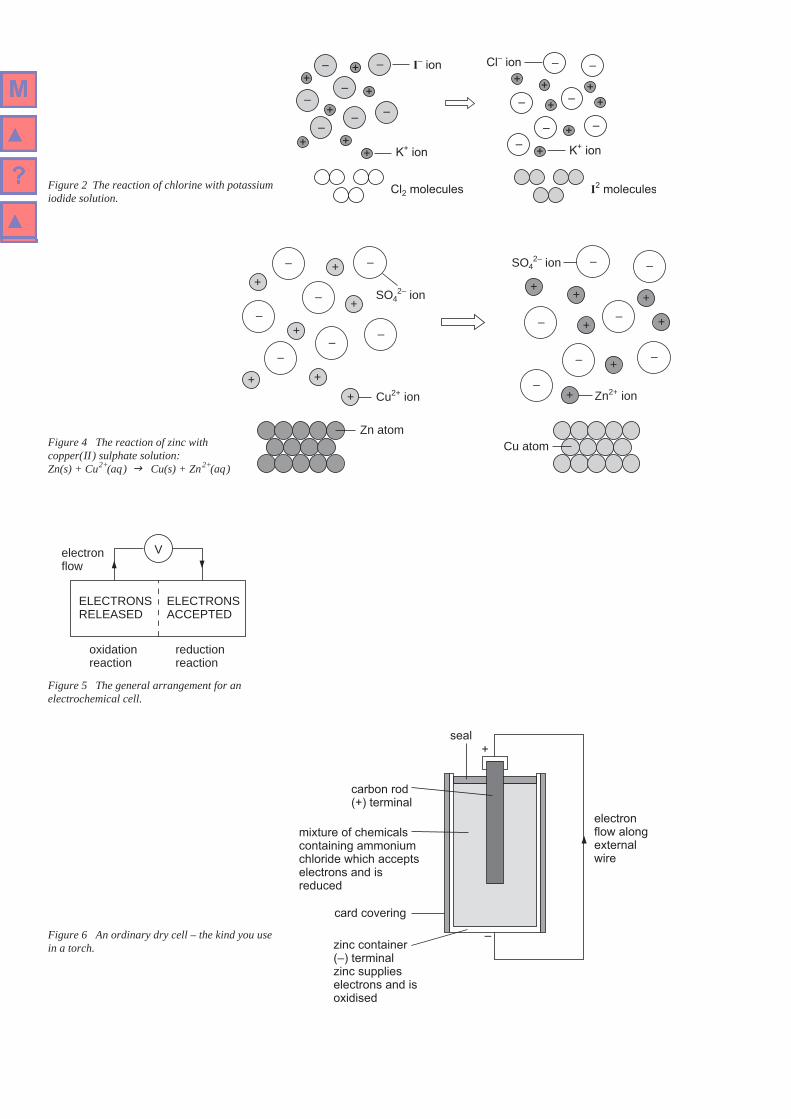
Figure 2 The reaction of chlorine with potassiumiodide solution.
+
––
Cu2+ ion+
–
–
–
+
–+
+
+
+
SO42– ion
–
Zn atomCu atom
– –
–
––
–
+
+
+ +
+
SO42– ion –
+
Zn2+ ion+
Figure 4 The reaction of zinc withcopper(II) sulphate solution: Zn(s) + Cu2+(aq) g Cu(s) + Zn2+(aq)
Figure 5 The general arrangement for anelectrochemical cell.
Velectron flow
ELECTRONSRELEASED
ELECTRONSACCEPTED
oxidationreaction
reductionreaction
Figure 6 An ordinary dry cell – the kind you usein a torch.
– + I– ion
I2 molecules
Cl– ion
K+ ionK+ ion
Cl2 molecules
–
––
––
–
– –
– –
– –
–
++
+
+ ++
++ +
++
+
+
seal+
electronflow alongexternalwire
mixture of chemicalscontaining ammoniumchloride which acceptselectrons and isreduced
card covering
zinc container(–) terminalzinc supplieselectrons and isoxidised
carbon rod(+) terminal
–

high-resistance voltmeter
copperstrip
salt bridge
zinc strip
solution ofZn2+ (aq)(1 mol dm–3)
solution ofCu2+ (aq)(1 mol dm–3)
V
Figure 9 A copper–zinc cell.
Figure 9 A copper–zinc cell.
Figure 11 The standard hydrogen half-cell(sometimes called a standard hydrogenelectrode).
glass tubewith holesin to allowbubbles ofH2(g) to escape
acid solutioncontaining 1.0 mol dm–3
H+ (aq)
H2(g) at 298K and 1atm
platinum electrode
Figure 11 The standard hydrogen half-cell(sometimes called a standard hydrogenelectrode).

platinum electrode
solution containingequal concentrationsof Fe2+(aq) and Fe3+ (aq)
Figure 12 A standard half-cell for theFe3+(aq)/Fe2+(aq) half-reaction.

Figure 2 Enthalpy profile for an exothermicreaction.
Num
ber o
f mol
ecul
es w
ithki
netic
ene
rgy
E
Kinetic energy (E)
300 K
310 K
Figure 4 Distribution curves for molecularkinetic energies in a gas at 300 K and 310 K.
Figure 5 Distribution curve showing collisionswith energy 50 kJ mol–1 and above.
Figure 6 Distribution curves showing the effecton the proportion of collisions with energy50 kJ mol–1 and above of changing thetemperature from 300 K to 310 K.
X
Activation enthalpy
Reactants ∆H
Products
Progress of reaction
En
tha
lpy
Activation enthalpyEa= 50 kJ mol–1
Kinetic energy (E)
Num
ber
of
colli
sio
ns w
ith
kin
etic e
nerg
y E
300 K
310 K
Number of collisions with energy greater than 50 kJ mol–1 at 310 K
Number of collisions withenergy greater than 50kJ mol–1 at 300 K
Kinetic energy (E)
Activation enthalpyEa= 50 kJ mol–1
Num
ber
of
colli
sio
ns w
ith
kin
etic e
nerg
y E

invertedburette
water
yeast suspension+ hydrogen peroxidesolution
Figure 8 Apparatus for investigating the rate ofdecomposition of hydrogen peroxide. The yeastprovides the enzyme catalase.
Figure 10 The decomposition of hydrogenperoxide solutions of differing concentrations.
Figure 11 The initial rate of decomposition ofhydrogen peroxide plotted against concentrationof hydrogen peroxide.
[H2O2] =0.40 mol dm–3
[H2O2] =0.40 mol dm–3
[H2O2] =0.40 mol dm–3
[H2O2] =0.40 mol dm–3
[H2O2] =0.40 mol dm–3
Vo
lum
e O
2/
cm
3
Time /s
26
2422
2018
16
14
1210
86
42
0 20 40 60 80 100 120 140 160 180
Rate
of re
action/c
m3(O
2)s
–1
0.5
0.4
0.3
0.2
0.1
0 0.1 0.2 0.3 0.4
Concentration of hydrogenperoxide/mol dm–3

240
220
200
180
160
140
120
100
80
60
40
20
20 Time/s
100 0 40 60 80 120 140 160 180
Am
ount
of H
2O2
rem
aini
ng/1
0–5 m
ol
to go from200 × 10–5 mol to100 × 10–5 moltakes 27 s
to go from 50 × 10–5 mol to25 × 10–5 mol takes 26 s
to go from100 × 10–5 mol to50 × 10–5 moltakes 27 s
27 s 26 s27 s
Figure 13 Finding half-lives, t½ , for thedecomposition of hydrogen peroxide.
20 Time/s
100 0 40 60 80 120 140 160 180
0.40
0.35
0.30
0.25
0.20
0.15
0.10
0.05
Con
cent
ratio
n of
H
2O2/
mol
dm
–3
concentration = 0.3 mol dm–3
rate = gradient = 0.0068 mol dm–3 s–1
concentration = 0.1 mol dm–3
rate = gradient = 0.0023 mol dm–3 s–1
Figure 14 Using a progress curve to find the rateof a reaction at different concentrations, bydrawing tangents.
Ent
halp
y
Progress of reaction
reactants
product
activation enthalpyfor Step 1
intermediates
Step 1 Step 2
activation enthalpyfor Step 2
Figure 17 For a reaction involving two steps,there are two activation enthalpies.

Second bond forms, and product diffuses away from catalyst surface, leaving it free to adsorb fresh reactants.
4
H HHC
HC
H
H
H
H
New bond forms.
HC
HC
H
3
HH HH
H
CH
CH
H
HHH HH
Bonds break.2
Reactants get adsorbed onto catalyst surface.Bonds are weakened.
1
HH CH
CH
H
HHH
catalyst surface
HH
C
HC
HH
HC HC
H
H
H
HH
Figure 18 An example of heterogeneouscatalysis. The diagrams show a possiblemechanism for nickel catalysing the reactionbetween ethene and hydrogen to form ethane.
activation enthalpyuncatalysed reaction
activation enthalpycatalysed reaction
uncatalysedreaction
catalysedreaction
reactants
products
∆H
Ent
halp
y
Progress of reaction
Figure 19 The effect of a catalyst on the enthalpyprofile for a reaction.
Ent
halp
y
Progress of reaction
Figure 19 The effect of a catalyst on the enthalpyprofile for a reaction.

Den
sity
/ g
cm–3 2
1
3
0Li Be B C N O F Ne Na Mg Al Si P S Cl Ar
Figure 3 Densities of elements in Periods 2 and 3.
Figure 4 Melting and boiling points of elementsin Period 3.
Mel
ting
and
boili
ngpo
ints
/ K
Na Mg Al Si P S Cl Ar
m.p.
Key
b.p.
1000
0
2000
3000
Figure 5 Variation in atomic size across Period 3.
Ato
mic
radi
us /
nm
Na Mg Al Si P S Cl Ar
0.2
0.1
0
Firs
t ion
isat
ion
enth
alpy
/ kJ
moI
–1
1000
0H He Li Be B C N O F Ne Na Mg Al Si P S Cl Ar K Ca
2000
Figure 6 First ionisation enthalpies of elements1–20.

Element Atomic number Electronic arrangement3d
Sc
Ti
V
Cr
Mn
Fe
Co
Ni
Cu
Zn
21
22
23
24
25
26
27
28
29
30
[Ar]
[Ar]
[Ar]
[Ar]
[Ar]
[Ar]
[Ar]
[Ar]
[Ar]
[Ar]
building up of inner 3d sub-shell
outer shell
4s
Figure 20 Arrangement of electrons in theground state of elements of the first row of the dblock. [Ar] represents the electronicconfiguration of argon.
force
(a) (b)
force The open circles representatoms of iron. The blackcircles are the larger atomsof a metal added to make analloy.
Figure 22 The arrangement of metalatoms in a crystal (a) before and (b) afterslip has taken place. The shaded circlesrepresent the end row of atoms.
Figure 23 The arrangement of metal atoms in an alloy.
Sc Ti V Cr Mn Fe Co Ni Cu Zn+1
+5
+7
+4 +4 +4
+2 only+2+2 +2 +2 +2 +2 +2
+6 +6 +6
+3 only +3 +3 +3 +3 +3 +3 +3 +3
Figure 24 Oxidation states shown by elements inthe first row of the d block. The most importantoxidation states are in boxes.

Figure 27 An octahedral complex of Fe(III). Coordination number 6.
Figure 28 A tetrahedral complex of Ni(II). Coordination number 4.
Figure 29 A square planar complex of Ni(II). Coordination number 4.
Figure 30 A linear complex of Ag(I).Coordination number 2.
Figure 32(a) Edta4–, a hexadentate ligand.(b) The nickel–edta complex ion [Ni(edta)]2 –.
octahedral complex of FE(III)
coordination number 6
CN
CN
CN
CN
NC
NC
Fe
3–
shape
CN
NC
Fe
NC
NC
NC
Fe
CN
CN
CN
CN
CN
CN
CN
ClCl
ClCl
Cl Cl
ClCl
Cl Cl Cl
Cl
NiNiNi
tetrahedral complex of Ni(II)
coordination number 5shape
2–
Ni Ni Ni
NC
NC
NC
NC NC
NC
CN
CN
CN
CN
CN
CN
2–
square planar complex of Ni(II)
coordination number 4shape
H3N Ag NH3
+
O
CO
O O
O
OO
O
O
O
O
O
O
O
O
C
C
CH2
C
C
C
C
C
CH2 CH2
CH2
CH2
CH2
CH2 CH2
CH2
CH2
H2C
H2C
2–
Ni
(a)
(b)

Figure 33 Relative energy levels for the five 3dorbitals of the hydrated Ti3+ ion.
Figure 36 The cis and trans isomers of[Co(NH3)4Cl2]+ have different colours.
energy
Average energy
of 3d orbitals in
[Ti(H2O)6]3+
if there was no
splitting [Ti(H2O)6]3+
ground state
3d level split
[Ti(H2O)6]3+
excited state
light
hv ∆E
cis isomer: violet trans isomer: green
NH3
NH3
NH3
H3N
NH3 NH3
NH3
NH3
Cl
Cl
Cl
Cl
Co Co
++
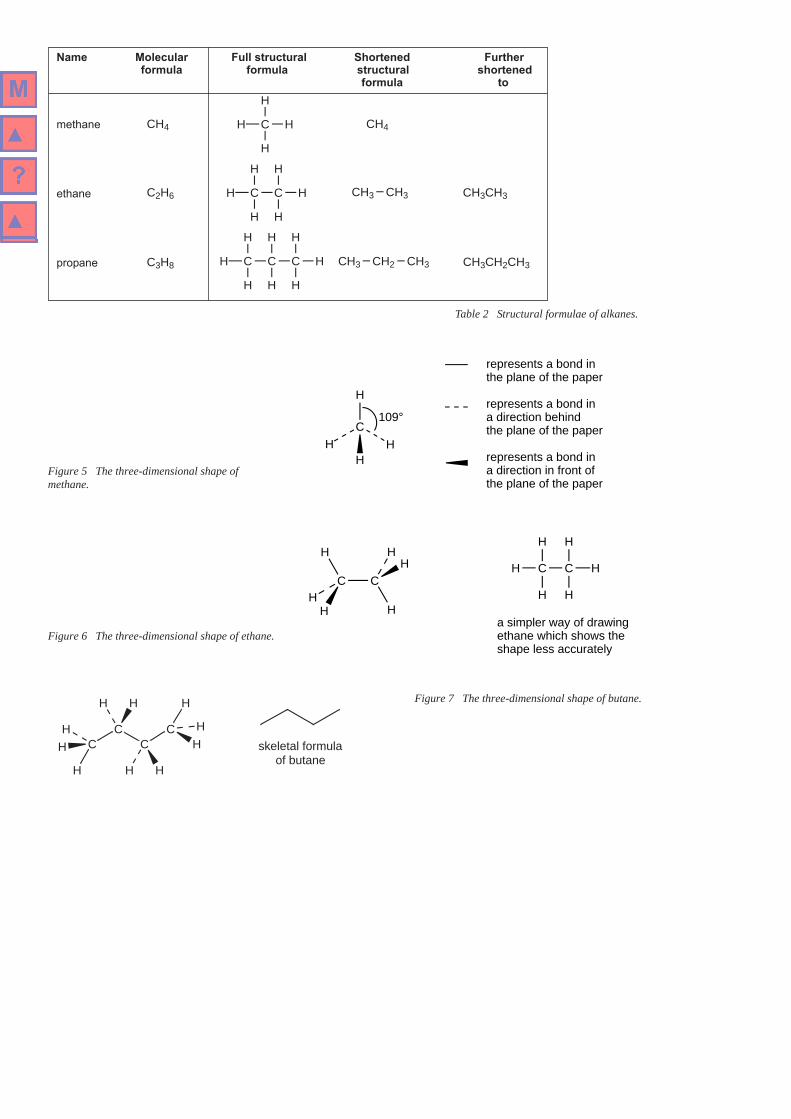
Name Molecular Full structural Shortened Furtherformula formula structural shortened
formula to
methane
ethane
propane
Table 2 Structural formulae of alkanes.
CH4CH4 H C H
H
H
C2H6 H C C
H
H
H
H
H
CH3CH3CH3 CH3
C3H8 H C C C
H
H H H
H H
H CH3CH2CH3CH3 CH2 CH3
109°
represents a bond in the plane of the paper
represents a bond in a direction behindthe plane of the paper
represents a bond ina direction in front ofthe plane of the paper
H
C
H HH
Figure 5 The three-dimensional shape ofmethane.
a simpler way of drawingethane which shows theshape less accurately
C C
H
H
H
H
H
H
Figure 6 The three-dimensional shape of ethane.
C C
H
HH
HH
H
Figure 7 The three-dimensional shape of butane.
CC
CC
H
HH
HH
H
H
H
H
H
skeletal formulaof butane

ALK
AN
ESIs
omer
isat
ion
Ref
orm
ing
Cra
ckin
gSt
eam
cra
ckin
g C
atal
ytic
cra
ckin
gFe
edst
ock
C4
– C
6al
kane
sna
phth
ana
phth
a/ke
rose
nega
s oi
l
Pro
duct
sam
e m
olec
ular
form
ula
assa
me
num
ber o
f C a
tom
s as
reac
tant
s;m
ore
mol
ecul
es;
mor
e m
olec
ules
;m
olec
ules
reac
tant
s;cy
clic
few
er C
ato
ms
than
reac
tant
s;
few
er C
ato
ms
than
reac
tant
s;
bran
ched
smal
l mol
ecul
es, s
uch
asso
me
unsa
tura
ted;
C
2H4,
C2H
6, C
3H6,
C3H
8,so
me
bran
ched
; C
4an
d C
5al
kene
s an
d so
me
cycl
ical
kane
s
Con
ditio
nsP
t/Al 2
O3;
P
t/Al 2
O3;
no
cat
alys
t; ze
olite
; 15
0 °C
500
°C;
900
°C;
500
°Chy
drog
en is
recy
cled
thro
ugh
mix
ture
to
shor
t res
iden
ce ti
me;
redu
ce ‘c
okin
g’st
eam
is a
dilu
tent
to p
reve
nt‘c
okin
g’
Exa
mpl
e
Use
s of
to im
prov
e oc
tane
ratin
g of
pet
rol
to im
prov
e oc
tane
ratin
g of
pet
rol
to m
anuf
actu
re p
olym
ers
to im
prov
e oc
tane
ratin
g of
pet
rol
prod
ucts
Furth
er
Dev
elop
ing
Fuel
ls s
tory
line,
Dev
elop
ing
Fuel
s st
oryl
ine,
Th
e Po
lym
er R
evol
utio
n D
evel
opin
g Fu
ells
sto
rylin
e,de
tails
S
ectio
n D
F4
Sec
tion
DF4
st
oryl
ine,
Sec
tions
PR
3 S
ectio
n D
F4C
hem
ical
Idea
s 15
.2 an
d PR
4 C
hem
ical
Idea
s 15
.2C
hem
ical
Idea
s 15
.2
Tabl
e 5
The
actio
n of
hea
t on
alka
nes.
Skel
etal
form
ulae
are
use
d in
the
exam
ples
.
is th
e sk
elet
al fo
rmul
a fo
r a b
enze
ne ri
ng.
++
+
H2
+
3H
2

C–C bond length0.139 nm
120°
C
CC
C
CCH
H
H
H
H
H
Figure 11 The structure of the benzene ring.
Scale 0.1nm0
Figure 14 An electron density map for benzeneat –3 °C. The lines are like contour lines on amap: they show parts of the molecule with equalelectron density.
Figure 15 Enthalpy changes for thehydrogenation of benzene and the hypotheticalKekulé structure.
regions of higher electrondensity above and belowthe benzene ring
Figure 16 The regions of higher electron densityabove and below the benzene ring.
Enth
alp
y
Progress of reaction
∆H = –360 kJ mol–1
(estimated enthalpy change
for Kekulé’s benzane)
C6H12 cyclohexane
+ 3H2
+ 3H2
∆H = –208 kJ mol–1
measured enthalpy
change for benzane)

Full structural Skeletal Nameformula formula
1-chloropropane
1,2-dichloropropane
3-bromo-1-chlorobutane
Table 1 Naming halogenoalkanes.
Cl
H
C
H
H C C
H
H
Cl
H
H
Cl
ClH
C
H
H C C
Cl
H
Cl
H
H
Cl
BrH
C
H
H C C
Br
H
C
H
H
Cl
H
H
Table 3 Some common nucleophiles.
Full structural Skeletal Nameformula formula
propan-1-ol
propan-2-ol
pentan-3-ol
Table 4 Naming alcohols.
H
C
H
H C C OH
H
H
H
H
OH
H
C
H
H C C H
OH
H
H
H
OH
H
C
H
H C C C
H
H
OH
H
C H
H
H H
H
OH
Name and Structure, showingformula lone pairs
hydroxide ion, OH–
cyanide ion, CN–
ethanoate ion, CH3COO–
ethoxide ion, C2H5O–
water molecule, H2O
ammoniamolecule, NH3
H
H H
H HH
O
O
O
O
O
N
CH3
CH3CH2
N C
C

Table 6 Some examples of acid derivatives.
Acid derivative Dealt with in Section(s) Example
13.5 and 14.2
13.5 and 14.2
13.8
13.5 and 14.2
ester
acyl chloride
amide
acid anhydride
C
O
OR
C
O
Cl
C
O
NH2
C
O
O
C
O
ethyl ethanoate
ethanoyl chloride
ethanamide
ethanoic anhydride
CH3 C
O
O
CH3 C
O
Cl
CH3 C
O
NH2
CH3 C
O
O
CCH3
O
CH2CH3
Type of alcohol Position of —OH Examplegroup
primary at end of chain: propan-1-ol
secondary in middle of chain: propan-2-ol
tertiary attached to a carbonatom which carriesno H atoms: 2-methylpropan-2-ol
CH3CH2 C OH
H
H
CH3 C CH3
H
OH
CH3 C CH3
CH3
OH
Table 7 Primary, secondary and tertiary alcohols.
H
C
H
R OH
H
C
OH
R R'
R'
C
OH
R R''
Figure 6 How to name an ester.
ethyl ethanoate
This part comes fromthe alcohol and is
named after it
This part comesfrom the acid andis named after it
O
OCH3
CH3
CH2
C

H
CH O C
C
O
H
C
O
H
H
O
C
C
O
O
R1 (long carbon chain)
R2
R3
glycerol part −always the same
fatty acid parts − R1, R2 and R3
may be different or the same
Figure 7 The general structure of the triestersfound in fats and oils.
O
O
O
O
O
Unsaturated triglyceride
O
O
O
O
O
O
O
Saturated triglyceride
Figure 9 Representations of triglycerides.

carboxylic acid amine amide group
CO
N C
O
H
+ H2ONO
H
H
H
Figure 18 Making a secondary amide.
acid groupamino group
α-carbon: the first carbon atomattached to the –COOH group
H
R
H2N C COOH
Figure 20 The generalised structure of an α-amino acid.
Figure 21 How an amino acid forms a zwitterion.
C
R
H
C
O
OH
N
H
H
C
R
H
C
O
O−
N
H
H
H
receives H+ froma COOH group
H+ donated toan NH2 group
a zwitterion
+
+
azo compound
N + H+N
diazonium ion
NN+
coupling agent
H
Figure 22 A generalised coupling reaction.

+ HCl(g)sunlight
Cl2(g)
room temp alkene
n
addition polymer
trace O2(g)
200 oC and1500 atm.
H2O(g)phosphoric
acid catalyst 300 oC and
60 atm.
HBr
conc H2SO4followedby H2O
or
organic solvent
Br2
organic solvent
H2(g)
finely divided Niat 150 oC and 5 atm.(or Pt at room tempand 1 atm.)
HC CH
CH2 CH2
HC CH
H Br
HC CHHC CH
H OH
HC CH
Br Br
CH2 CH
Cl
Figure 2 Reactions of alkenes.
Figure 3 Reactions of halogenoalkanes.
alcohol
heat in asealed tube
halogenoalkane
c. NH3(aq)
H2O(l)
NaOH(aq)amine
alcohol
slow
reflux
R OH
R HalR NH2
R OH
R CH2 O C R'
O
R CH2 OH
R CHO R COOH
R CH2 Br
R CH2 Cl
R CH CH2
ester
bromoalkane
chloroalkane
carboxylic acidaldehyde
alkeneprimary alcohol
R'−COClor (R'CO)2O
anhydrousconditions
R'−COOHc. H2SO4 catalystreflux
c. HCl
HBr(aq)(NaBr(s) + c. H2SO4)
reflux
Cr2O72−/H+(aq)
reflux
Cr2O72−/H+(aq)
refluxNaBH4
Al2O3(s), 300 °C
or c. H2SO4
reflux
Figure 4 Reactions of primary alcohols.
room temp

R
O
C
H
carboxylate ion
carboxylic acid
NaOH(aq) HCl(aq)
R'
O–
O
R
O
C
OHc. H2SO4 catalyst
reflux with
aqueous acid or alkali*
R
O
C
O
R C
O
acid anhydride
R' OH
anhydrous
conditions
reflux
R
O
C
O R'
ester
R' OHroom
temperature
acyl chloride
R
O
C
Cl
R' NH2
room
temperature
room
temperature
primary amide
R
O
C
NH2
c. NH3(aq)
R
O
C
NH R'
secondary amide
R C
O
H
aldehyde
C
OH
H
CN
RC
OH
H
H
R
primary alcohol a cyanohydrin
R C
O
OH
carboxylic acid
HCN
(+ alkali)
NaBH4
Cr2O72−/H+(aq)
refluxor heat withFehling'ssolution
R C
O
R'
ketone
C
OH
R'
CN
RC
OH
R'
H
R
secondary alcohol a cyanohydrin
HCN
(+ alkali)
NaBH4
Figure 6 Reactions of ketones.
Figure 5 Reactions of aldehydes.
Figure 7 The reactions of carboxylic acids and some related compounds.
Note Esters and amides are both hydrolysed by heating with aqueous acid or aqueousalkali. Alkaline hydrolysis gives the salt of the corresponding carboxylic acid. The freecarboxylic acid is formed on acidification of the solution.

Figure 8 Reactions of arenes.
Cl
Cl2(g)AlCl3 room
temperature
NO2 c. HNO3c. H2SO4< 55 °C
alkylation
R
R Cl AICI3
reflux
Friedel-Craftsreactions
R COCl or(RCO)2O
acylation
O
CR
finely divided NiH2(g)
300 °C, 30 atm.
Br2(l) FeBr3 (or FE)room
temperature
Br
SO2OH
c. H2SO4reflux
AICI3reflux

Feedstock(reactants)
Feedstockpreparation
Energy in or out
REACTION
Temperature, pressure, catalystSeparation
Products
Co-products
Recycle loop Unused feedstockInput or removal of energy may be required at any stage
(and by-products)
Figure 1 Sequence of unit operations in achemical plant.
Starting mixture
Batch reactorAt start Reactants in Some time later
Product mixture
Continuous (stirred tank) reactor
Stirrer
Product mixture continuously removed
Reactants added continuously(a) (b)
Figure 2 Comparison of (a) batch and (b) continuous tank reactors.
LiverpoolManchester
Castner/KellnerWorks
Lancaster
Durham
Newcastle
SunderlandCarlisle
Annan
Dumfries
Selkirk
Jedburgh
PeeblesLanark
Stirling
Kelso
Hawick
GlasgowEdinburgh
STRATHCLYDE
DUMFRIES &GALLOWAY
Kendal
Chester
Hillhouse Works
CLWYD CHESHIRE
LANCASHIRE
CUMBRIA
NORTH WESTERNETHENE PIPELINE
SOLWAY FIRTH
WILTONGRANGEMOUTH
TRANS PENNINEETHENE PIPELINE
NORTHYORKSHIRE
NORTHUMBERLAND
FIRTH OF FORTH
ETHENEPIPELINE
Wilton Works
MOSSMORRANGRANGEMOUTH
Figure 3 Pipelines from BP, Grangemouth, andExxon, Mossmorran, for the distribution ofethene.

OIL
Fractionaldistillation
LPG Naphtha
Steamcracking
Ethene,propene
Steamcracking
Ethene,propene
Reforming
Branched alkanes, cycloalkanesand aromatic hydrocarbons
for high-grade petrol
Catalyticcracking
Gas Oil
Ethene, propene,high-grade petrol
ResidueKerosene
Figure 5 Feedstocks from oil.
Figure 4 Feedstocks from natural gas.
NATURAL GAS
Fractionaldistillation
Steamcracking
Methane Ethane
Ethene,propene
Steamcracking
Propane
Ethene,propene
Steamcracking
Butane
Ethene,propene
Figure 6 (a) An example of how energy can be used in a chemical process. (b) A diagram to illustrate a heat exchanger.
(a)
Reactants
at 20°C
(a)
Heat exchanger
Reactants
at 20°C
Reactants
at 180°C
Reactor
at 200°C
Products at 200°C
Products at about 60°C
(b) Steam
in
Steam
out
Hot
feed out
Cold
feed in
Cross section:Condensed
steamSteam pipe
A single-pass tubular heat exchanger