figure 5.3. gross foreign capital and gross - imf · pdf filehas become substantially more...
TRANSCRIPT

5chapter
This chapter examines the role of soaring commod-ity prices in contributing to emerging and developing economies’ growing trade and financial integration into the global economy. It finds that improvements in institutions and policy frameworks help explain why the current commodity price boom is proving more favorable to developing economies than previous booms, bringing rapid growth in exports (especially manufacturing exports), investment (both domestic and foreign), and output. Continued progress in trade and financial integration will require sustained efforts to further strengthen institutions and economic policies in developing countries.
Over the past couple of decades, and in particular over the past few years, many developing and emerging economies have become steadily more
integrated into the world economy. International trade, in both manufactures and commodities, has become substantially more important to most of these economies (Figures 5.1 and 5.2). At the same time, they have become more open to international capital flows, in particular through foreign direct investment (FDI) (Figure 5.3). This chapter discusses some characteristics and causes of this growing integration, with a view to assessing its sustainability. More specifically, the chapter focuses on the following issues.
First, have the extent and the pace of trade and financial integration differed among developing economies and regions? Have these countries diversified their production between commodities and manufactures? Have they diversified their export destinations between
��
Globalization, Commodity PriCes, and develoPinG Countries
Note: The main authors of this chapter are Nikola Spatafora and Irina Tytell, with support from Patrick Het-tinger and Ercument Tulun. The project was supervised by Jonathan Ostry. Arvind Subramanian and Shang-Jin Wei provided consultancy support. We also thank Tim Callen, Paul Cashin, Paul Collier, Gian Maria Milesi-Fer-retti, and Alessandro Prati for their comments.
0
10
20
30
40
50
Figure 5.1. Trade in Goods and Services
Sources: World Bank, World Development Indicators database; and IMF staff calculations. Central and eastern Europe, and Commonwealth of Independent States.
Latin America
CEE and CIS
75 85 90
Advanced economies
Middle East and north Africa
Sub-Saharan Africa
20000
20
40
60
80
100
1970 80 95 05
Developing Asia
Over the past two decades, international trade has become substantially more important to most developing economies.
< 0 0–15
Developing Asia
Middle East and north Africa
Sub-Saharan Africa
Latin America
Trade in Goods and Services(percent of regional GDP)
Trade Growth, 1970–2007
Advanced economies
15–30 30–45 > 45Percentage point change in trade-to-GDP ratio
Num
ber o
f cou
ntrie
s
1
1

ChaPter 5 Globalization, Commodity PriCes, and develoPinG Countries
�
advanced and other developing economies? Has the emergence of China and India as major players in the global marketplace helped pull other developing economies into the interna-tional markets, or has it displaced them?
Second, the surge of globalization across developing economies has coincided with boom-ing prices for oil and other primary commodi-ties. To what extent have increased trade and capital flows to these countries been driven by rising prices for the commodities they export? Have other, potentially more permanent factors, such as improved domestic institutions and policy frameworks, played a role in fostering these countries’ economic integration? Has ris-ing trade openness in nearby economies contrib-uted to their export growth?
The existing literature on the determinants of international trade and capital flows empha-sizes the role of institutional and political factors within countries (including direct restrictions on current and capital account transactions), as well as historical, cultural, and geographical links across countries (including bilateral or multilateral agreements).1 This literature has paid far less attention to the terms of trade or to commodity prices. This stands in sharp contrast to, say, the literature on economic growth, in which the role of commodity prices has been hotly debated, with some studies linking com-modity booms and increased growth and others suggesting the existence of a “resource curse” that undercuts sustainable growth.2
This chapter takes a closer look at the role of commodity market developments in driving globalization in developing economies. Price fluctuations have direct effects on the values of commodity exports and imports and can also encourage changes in the volume of such trade. Furthermore, there can be indirect effects on
1See, for example, Baier and Bergstrand (2007) and Dell’Ariccia and others (2007).
2See Deaton (1999) for Africa’s experience, and Blatt-man, Hwang, and Williamson (2007) for a historical account. On the resource curse more particularly, see Collier and Goderis (2007), as well as a literature survey by van der Ploeg (2006).
1984 87 90 93 96 99 2002 050
5
10
15
20
25
30
35
40
Figure 5.2. Merchandise Exports of Emerging and Developing Economies
Manufacturing exports have been growing especially fast, particularly in volume terms.
Total
Manufactures
Commodities
Nonfuel commodities Fuel
Export Values(percent of GDP)
Sources: World Bank, World Development Indicators database; and IMF staff calculations.
Export Volumes(percent of GDP, in 2000 U.S. dollars)
1984 87 90 93 96 99 2002 050
5
10
15
20
25
30
35

�
investment (both domestic and foreign) in commodity-related and other export sectors. In addition, commodity price movements can affect real exchange rates and competitiveness, especially in non-resource-exporting sectors (Dutch disease), and thereby can affect the extent of trade integration.3 In a similar vein, commodity price booms may promote public spending and external borrowing by commod-ity exporters, potentially setting the stage for subsequent crises, which could negatively affect trade and financial globalization. Moreover, any change in trade and capital flows associated with commodity market developments could motivate policymakers to extend or curtail their econo-mies’ external openness. Through all these channels, changes in commodity prices may have lasting effects on the degree to which com-modity-dependent economies integrate further into the global economy.
The rest of the chapter is organized as fol-lows. The first section presents key stylized facts concerning developing economies’ trade and financial integration. Then, an event-study meth-odology is used to assess how specific variables of interest behaved during previous commodity price booms and busts and whether the cur-rent boom differs significantly from previous episodes. Finally, formal econometric techniques are used to analyze the historical evidence on the determinants of developing economies’ inte-gration into the global economy, with an empha-sis on the respective roles of evolving institutions and policies versus developments in commodity markets. While the focus throughout is on those factors driving integration, it is also important to recognize the impact of globalization, and in particular trade integration and FDI, on growth and welfare in developing economies (Box 5.1).
Overall, this chapter finds that, in important ways, the current commodity price boom is
3Dutch disease occurs when increased revenues from natural resources raise the real exchange rate and thereby make other exports, particularly manufactures, less competitive. See Corden and Neary (1982) and Cor-den (1984) for classic discussions of Dutch disease. See also Ostry (1988) and Edwards and Ostry (1990).
1980 85 90 95 2000 050
50
100
150
200
250
300
350
400
Figure 5.3. Gross Foreign Capital and Gross Foreign Liabilities(Percent of regional GDP)
Developing economies have become more open to international capital flows, in particular through foreign direct investment (FDI).
Gross Foreign Capital
Sources: Lane and Milesi-Ferretti (2006); and IMF staff calculations. Total assets and liabilities of FDI, portfolio equity, and debt. Central and eastern Europe, and Commonwealth of Independent States.
1
Gross Foreign Liabilities of Emerging and Developing Economies
1980 85 90 95 2000 050
20
40
60
80
Latin America
CEE and CIS
Advanced economies
Middle East and north Africa Sub-Saharan
Africa
Developing Asia
Total liabilities
Debt liabilities
FDI liabilitiesPortfolio equity
liabilities
1
2
2
Globalization, Commodity PriCes, and develoPinG Countries
ChaPter 5 Globalization, Commodity PriCes, and develoPinG Countries
�
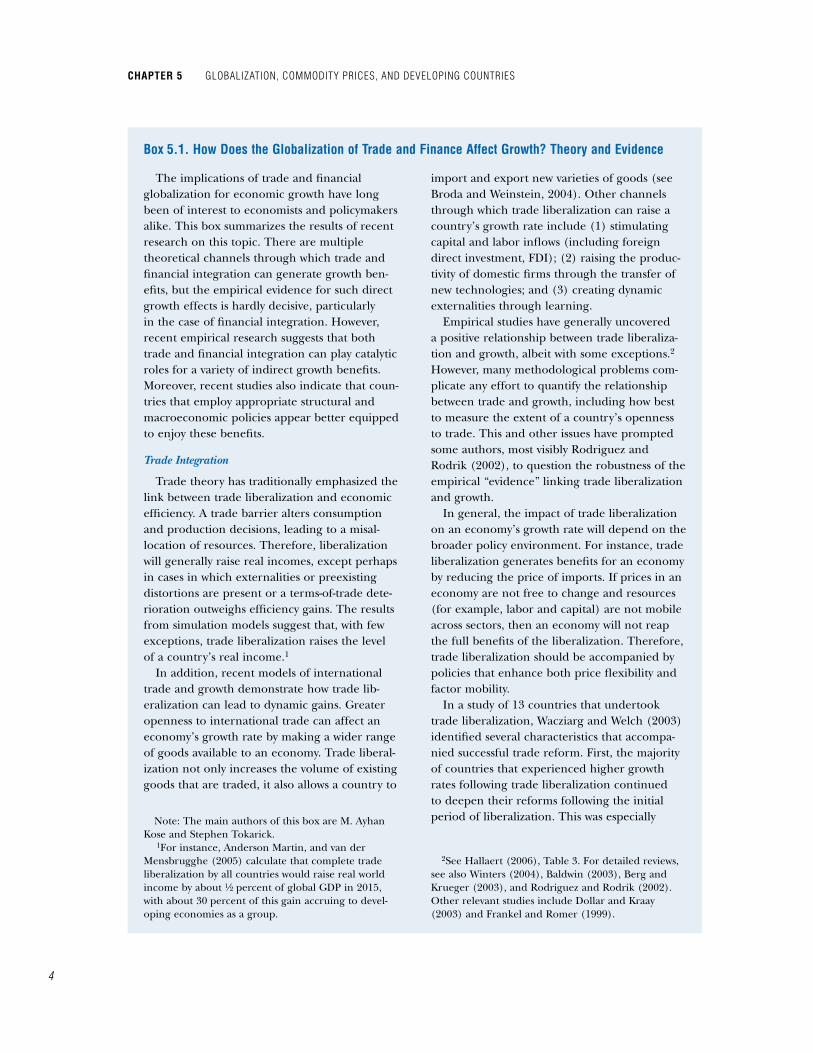
The implications of trade and financial globalization for economic growth have long been of interest to economists and policymakers alike. This box summarizes the results of recent research on this topic. There are multiple theoretical channels through which trade and financial integration can generate growth ben-efits, but the empirical evidence for such direct growth effects is hardly decisive, particularly in the case of financial integration. However, recent empirical research suggests that both trade and financial integration can play catalytic roles for a variety of indirect growth benefits. Moreover, recent studies also indicate that coun-tries that employ appropriate structural and macroeconomic policies appear better equipped to enjoy these benefits.
Trade Integration
Trade theory has traditionally emphasized the link between trade liberalization and economic efficiency. A trade barrier alters consumption and production decisions, leading to a misal-location of resources. Therefore, liberalization will generally raise real incomes, except perhaps in cases in which externalities or preexisting distortions are present or a terms-of-trade dete-rioration outweighs efficiency gains. The results from simulation models suggest that, with few exceptions, trade liberalization raises the level of a country’s real income.1
In addition, recent models of international trade and growth demonstrate how trade lib-eralization can lead to dynamic gains. Greater openness to international trade can affect an economy’s growth rate by making a wider range of goods available to an economy. Trade liberal-ization not only increases the volume of existing goods that are traded, it also allows a country to
Note: The main authors of this box are M. Ayhan Kose and Stephen Tokarick.
1For instance, Anderson Martin, and van der Mensbrugghe (2005) calculate that complete trade liberalization by all countries would raise real world income by about ½ percent of global GDP in 2015, with about 30 percent of this gain accruing to devel-oping economies as a group.
import and export new varieties of goods (see Broda and Weinstein, 2004). Other channels through which trade liberalization can raise a country’s growth rate include (1) stimulating capital and labor inflows (including foreign direct investment, FDI); (2) raising the produc-tivity of domestic firms through the transfer of new technologies; and (3) creating dynamic externalities through learning.
Empirical studies have generally uncovered a positive relationship between trade liberaliza-tion and growth, albeit with some exceptions.2 However, many methodological problems com-plicate any effort to quantify the relationship between trade and growth, including how best to measure the extent of a country’s openness to trade. This and other issues have prompted some authors, most visibly Rodriguez and Rodrik (2002), to question the robustness of the empirical “evidence” linking trade liberalization and growth.
In general, the impact of trade liberalization on an economy’s growth rate will depend on the broader policy environment. For instance, trade liberalization generates benefits for an economy by reducing the price of imports. If prices in an economy are not free to change and resources (for example, labor and capital) are not mobile across sectors, then an economy will not reap the full benefits of the liberalization. Therefore, trade liberalization should be accompanied by policies that enhance both price flexibility and factor mobility.
In a study of 13 countries that undertook trade liberalization, Wacziarg and Welch (2003) identified several characteristics that accompa-nied successful trade reform. First, the majority of countries that experienced higher growth rates following trade liberalization continued to deepen their reforms following the initial period of liberalization. This was especially
2See Hallaert (2006), Table 3. For detailed reviews, see also Winters (2004), Baldwin (2003), Berg and Krueger (2003), and Rodriguez and Rodrik (2002). Other relevant studies include Dollar and Kraay (2003) and Frankel and Romer (1999).
box 5.1. how does the Globalization of trade and Finance affect Growth? theory and evidence

�
true for Taiwan Province of China, Republic of Korea, Chile, and Uganda. Second, some of the countries where trade liberalization was unsuccessful implemented policies that counter-acted the trade reform. For instance, in Israel, coalitions of labor, government, and industry set guidelines for prices, wages, and the exchange rate in ways that offset the benefits of trade reform. Third, macroeconomic stability, and particularly an appropriate exchange rate policy, greatly enhances the efficacy of trade liberaliza-tion.3 Johnson, Ostry, and Subramanian (2007) have emphasized the importance of avoiding overvaluation in order to sustain growth.
Financial Globalization
There are a number of channels through which financial globalization—the phenom-enon of rising cross-border financial flows—can generate growth benefits. For instance, theory predicts that international financial flows can complement domestic savings in capital-poor developing economies, and, by reducing the cost of capital, foster increased investment. Certain types of financial flows can also gener-ate technology spillovers and serve as a conduit for transferring managerial and other forms of organizational expertise to developing economies.
However, the empirical literature about the existence of such benefits has been incon-clusive (see Kose and others, 2006). On the surface, there appears to be a positive associa-tion between embracing financial globalization and attaining rapid economic growth (see figure). For example, the group of developing economies that have participated most actively in financial globalization has clearly achieved better growth outcomes on average than other developing economies. However, the majority of studies using cross-country growth regres-
3See, for instance, Harrison and Tang (2005), Wacziarg and Welch (2003) on Mexico’s trade lib-eralizations between the 1970s and the early 1990s, Krueger (1998), and Edwards (1993) on Chile’s trade liberalizations between 1950 and 1970.
1970 75 80 85 90 95 2000 0550
100
150
200
250
300
350
400
-100 0 100 200 300 400-0.03
-0.02
-0.01
0.00
0.01
0.02
0.03
0.04
0.05
Financial Openness and GDP Growth
Source: IMF staff calculations. Change in financial openness is defined as the change over the same period in the ratio of gross stocks of foreign assets and liabilities to GDP. The conditional relationship uses residuals from a cross-section regression of growth on initial income, population growth, human capital, and the investment rate. PPP = purchasing power parity.
Box 5.1 Figure
Change in Financial Openness and GDP Growth,Conditional Relationship
-100 0 100 200 300 400-0.02
0.00
0.02
0.04
0.06
0.08Change in Financial Openness and GDP Growth,Unconditional Relationship
Grow
th ra
te o
f per
cap
ita G
DP
Mean financial openness
1
Mean financial openness
Evolution of GDP(per capita, PPP weighted)
Advanced economies
Emerging Asia (excluding China
and India)
Emerging markets
1
Other developing economies
Grow
th ra
te o
f per
cap
ita G
DP1
2
2
Globalization, Commodity PriCes, and develoPinG Countries

ChaPter 5 Globalization, Commodity PriCes, and develoPinG Countries
�
proving more beneficial to developing econo-mies than previous booms. Exports (including manufacturing exports), FDI, and domestic investment have all risen relatively rapidly, government borrowing has slowed, and output
growth has accelerated. A key factor behind this robust performance, and a crucial reason why a large majority of developing economies are enjoying rapid trade and financial integration into the global economy, is the general improve-
sions to analyze the relationship between growth and financial openness have been unable to show that capital account liberaliza-tion produces measurable growth benefits after accounting for other determinants of growth (see figure).
Several factors explain the inconclusive nature of these empirical studies. One major reason is the difficulty of measuring financial openness.4 Recent studies that are based on improved measures of financial integration are beginning to find evidence of positive growth effects of financial integration (see Quinn and Toyoda, 2006). An alternative line of inquiry is based on the notion that not all types of capital flows are created equal (see Dell’Ariccia and others, 2007). This notion is particularly rel-evant because the composition of financial flows has shifted markedly over time, from riskier debt flows to more stable flows of FDI and portfolio equity. Studies examining the growth effects of equity market liberalization gener-ally suggest that it has a significant, positive impact on output growth (see Henry, 2007). An expanding body of evidence based on industry- and firm-level data supports the growth benefits of equity liberalization and FDI inflows.
Recent studies also argue that successful financial globalization does not simply enhance access to financing for domestic investment, but that its benefits are catalytic and indirect (see Kose and others, 2006; and Dell’Ariccia and oth-ers, 2007). Far more important than the direct
4Kose and others (2006) argue that widely used de jure measures of capital controls (restrictions on capi-tal account transactions) fail to capture how effectively countries enforce those controls and do not always reflect the actual (de facto) degree of an economy’s financial integration.
growth effects of access to more capital is how capital flows generate potential collateral ben-efits. For example, a growing number of studies are finding that financial openness can promote development of the domestic financial sector, impose discipline on macroeconomic policies, generate efficiency gains among domestic firms by exposing them to competition from foreign entrants, and unleash forces that result in better government and corporate governance. These collateral benefits could enhance efficiency and, by extension, total factor productivity growth.
There is also a growing number of studies on a range of supporting conditions associated with structural and policy-related factors (thresholds) that appear to play an important role in the relationship between growth and financial open-ness (see Kose and others, 2007). For instance, structural policies that promote financial sector development, improve institutional quality, and increase trade openness are important not only in their own right, but also because they help developing economies realize the potential benefits of globalization. Similarly, sound mac-roeconomic policies appear to be an important prerequisite for ensuring that financial integra-tion is beneficial.5
5Ishii and others (2001) and Dell’Ariccia and others (2007) document a number of country cases showing that the implementation of prudent macroeconomic policies has been an important factor in improving the growth benefits of financial integration while minimizing the potential risks. For instance, Austria was successful in maintaining policies consistent with its exchange rate regime during the process of financial integration and thereby protected itself from a crisis. However, Mexico, Sweden, and Turkey, while opening up their capital accounts, employed expan-sionary policies incompatible with their exchange rate regimes and experienced financial crises.
box 5.1 (concluded)

�
ment in their institutional and policy environ-ments, including greater fiscal restraint as well as trade liberalization (both domestically and in their trading partners). As a corollary, contin-ued progress toward integration will require sus-tained efforts to further improve institutions and policy frameworks in order to help minimize the risks associated with abrupt future changes in commodity prices.
Commodity Prices and Patterns of integration
The global level of commodity prices (rela-tive to manufactures unit values) had been on the decline for a couple of decades, but has been rising since the turn of the 21st century (Figure 5.4).4 The current boom in the prices of energy and industrial inputs, including agricul-tural raw materials and metals, is particularly notable. The prices of food and beverages have also increased, although somewhat less dramati-cally until recently. Overall, the current boom seems largely associated with increased demand for commodities on the part of China and other fast-growing economies in Asia, which is out-pacing the increases in supply, including from Russia and other countries of the former Soviet bloc (see Appendix 1.2). Box 5.2 compares the current boom to previous episodes of rising commodity prices and shows that this boom has been notable for both its broad coverage and its duration. Nonetheless, risks remain that the cur-rent boom, like its predecessors, eventually will be reversed as supply responses gain momen-tum, particularly in the food and metals sectors, where long-term supply elasticities should be substantial, albeit less so in energy (see Chap-ter 4 of the September 2006 World Economic Outlook).
Movements in commodity prices affect coun-tries differently depending on the composition
4The behavior of commodity prices has remained a sub-ject of controversy in the literature, ever since Prebisch (1950) and Singer (1950) found a downward trend in the data. See, among others, Cashin and McDermott (2002).
1970 75 80 85 90 95 2000 055060708090
100110120130140150
80
85
90
95
100
105
110
115
120
1970 75 80 85 90 95 2000 050
20
40
60
80
100
120
140
160
180
1970 75 80 85 90 95 2000 050
50
100
150
200
250
300
350
Figure 5.4. Commodity Prices
Commodity prices, especially for energy and industrial inputs, have been rising sharply since the turn of the century. The Middle East and north Africa, and to a somewhat lesser extent sub-Saharan Africa and Latin America, have been the main beneficiaries of the current boom.
Commodity Price Aggregates(index, 2000 = 100; deflated by manufactures unit value)
Sources: UNCTAD, Handbook of Statistics database; and IMF staff calculations. Central and eastern Europe, and Commonwealth of Independent States.
Commodity Terms of Trade(index, 2000 = 100; unweighted averages)
Industrial inputs
Overall commodity
Food and beverage
Energy
Nonfuel commodity exporters
Fuel exporters
Commodity Terms of Trade(index, 2000 = 100; unweighted averages) Latin America
(right scale)
Advanced economies(right scale)Middle East and north Africa
(left scale)
Sub-Saharan Africa(right scale)
Developing Asia
(right scale)
CEE and CIS(right scale)
1
1
Commodity PriCes and Patterns of inteGration

ChaPter 5 Globalization, Commodity PriCes, and develoPinG Countries
�
Commodity markets have been booming, and the prices of many commodities have reached new record highs in recent months. Buoyant global growth has been only one of the reasons behind high commodity prices, but the expectation that global activity will slow noticeably in 2008–09 has nevertheless prompted concerns about the prospects for commodity markets. Against this backdrop, this box compares key features of the current boom with those of earlier booms.
At the general (global) market level, a com-modity price boom is defined as a period of at least 12 months during which the spot price of a commodity or a group of similar commodities increases in real terms.1 Accordingly, the booms
Note: The main author of this box is Thomas Helbling. 1This approach follows the example of Pagan and
Sossounov (2003) for the case of equity price booms. The restriction of using a minimum phase duration of 12 months follows Cashin, McDermott, and Scott (2002). While a minimum restriction of 6 months is
and slumps in commodity prices are identified here on the basis of peaks and troughs in infla-tion-adjusted commodity prices.2 In contrast with the analysis in the rest of Chapter 5, in this box booms are considered to be commodity- rather than country-specific.3
On the basis of this definition, the table com-pares the current boom with earlier booms using the monthly price indices of four major
typically used in business-cycle analysis, these authors argue that for commodities, a longer minimum is needed because harvest seasons for major crops tend to be 12 months apart. A unit value index for the exports of manufactures by industrial economies is used to make the inflation adjustment.
2The analysis is based on a business-cycle-dating pro-cedure developed by the National Bureau of Economic Research (NBER). See Chapter 3 in both the April 2002 and April 2003 World Economic Outlook.
3The rest of Chapter 5 identifies booms and busts using the annual commodity terms of trade of each country, rather than monthly global prices of indi-vidual commodities or commodity groups.
box 5.2. the Current Commodity Price boom in Perspective
Properties of Commodity Price booms, 1960–20071
Price Changes (percent) Duration (months)
Currentphase
Latestturning point2
From latestturning point
Average of past booms3
From latestturning point
Average of past booms4
Synchronizationwith industrialproduction5
Crude oil (IMF APSP)6 Boom December 2001 T 210.1 54.0 73 18 0.189***Metals Boom March 2003 T 104.8 43.0 58 22 0.236***
Aluminum Boom April 2003 T 29 41.0 57 22 0.025Copper Boom October 2001 T 212.5 61.0 75 21 0.259***Nickel Boom October 2005 T 74.9 84.0 19 29 0.301***
Food Boom November 2004 30.4 21.0 38 18 0.103Maize (corn) Boom November 2004 T 62.2 39.0 38 19 –0.139Wheat Boom April 2005 T 124.1 38.0 32 20 –0.103Soybeans Boom January 2005 T 83.9 42.0 36 18 0.11Palm oil Boom January 2005 T 116.8 61.0 36 20 –0.015Soybean oil Boom January 2005 T 100.9 50.0 36 18 0.066Beef Slump September 2004 P –25.1 35.0 . . . 20 0.091
Beverages Slump February 2006 P 0.0 47.0 . . . 19 0.109Agricultural raw materials Boom December 2004 T 2.2 28.0 37 20 0.128
Rubber Boom January 2005 T 77.2 56.0 36 21 0.07
Sources: IMF commodity price database; and current IMF staff calculations.1See text for details.2T stands for trough, P for peak.3Average price increase during past booms (excluding the current boom).4Average duration of past booms (excluding the current boom).5Coefficient of a regression of the cyclical state in the commodity price on the cyclical state in global industrial production (see
Harding and Pagan, 2006, for details); *** denotes significance at the 1 percent level.6IMF average petroleum spot price.

�
commodity groups and prices of a number of individual commodities, based on data for the period 1960–2007. As a caveat, the prices for some commodities began to fall in 2007, and therefore a slump—that is, a period of falling prices lasting at least 12 months—cannot yet be identified. The main results are as follows.• The current commodity price boom has been
broadly based and includes oil, metals, major food crops, and some beverages. Within these groups, price increases during the current boom have typically been well above average, and the period of sustained price increases has been longer than usual. In contrast, prices for some meats and many agricultural raw materials have remained relatively weak (with the notable exception of natural rubber, a sub-stitute for petroleum-based synthetic rubber). This weakness is surprising, given that prices of these commodities have tended to boom in tandem with those of metals.
• The current boom also has been unusual in that oil prices and the price indices of three major commodity groups—metals, foods, and agricultural raw materials—have been jointly booming since early 2005 (beverages were booming in 2005 and early 2006). Although broad-based booms have occurred previously, they have typically been much shorter than the current one (see figure). Indeed, out of 74 months of broad-based boom periods since 1960, almost one-half have been recorded since 2005. Crude oil and metals prices have been booming for even longer—since 2003—which is also unusual.
• Previous broad-based booms have emerged toward the end of relatively long periods of expansion in global industrial activity— especially in 1973 and 2000—and have ended with a subsequent downturn in activity. In con-trast, the current boom started earlier in the cycle. In all cases, however, broad-based booms have emerged during times of very strong global growth.
• More generally, although slumps in commod-ity prices have been more frequent than global industrial downturns, the prices of many com-
modities tend to be in sync with global indus-trial activity, in particular crude oil, metals, and some agricultural raw materials.In sum, the comparison of the current commod-
ity price boom with earlier ones suggests that the current boom has been more broad-based and lon-ger lasting and that prices have risen by more than usual. This suggests that the current boom reflects a confluence of mutually reinforcing demand and supply factors, as well as the effects both of increasingly important links among commodity markets (such as between the prices for oil and food and the production of biofuels) and of sup-portive financial conditions, including U.S. dollar depreciation and low real interest rates (see Appen-dix 1.2 for details). Some of these factors obviously played a role in earlier booms as well. In the 1973 boom, for example, commodity prices were pushed up by the combination of very strong global growth and U.S. dollar depreciation. However, the current boom is characterized by the extended period during which these factors have interacted. As a result, the prospects for global commodity markets depend importantly on how long these underlying, mutually reinforcing forces continue to prevail.
Number of Major Commodity Groups in Boom Phase and Global Industrial Production
Sources: IMF, Commodity Price System; IMF, International Financial Statistics; and IMF staff calculations. Major commodity groups are defined as oil, metals, food, beverages, and agricultural raw materials.
Box 5.2 Figure 1
1960 65 70 75 80 85 90 95 2000 050
1
2
3
4
5
6
-15.0
-10.0
-5.0
0.0
5.0
10.0
15.0
Number of commodity groups in boom (left scale)
Global industrial production, annual growth in percent (right scale)
1
1
Commodity PriCes and Patterns of inteGration
ChaPter 5 Globalization, Commodity PriCes, and develoPinG Countries
�0
of their exports and imports. Because many developing economies export nonfuel primary commodities but import energy, booms in commodity prices do not translate directly into terms-of-trade booms for all commodity export-ers. It is useful to consider the country-specific commodity terms of trade: the ratio of commod-ity export prices to commodity import prices, with each price weighted by the (time-averaged) share of the relevant commodity in the country’s (average) total trade.5 It is also useful at this stage to draw a distinction between countries exporting primarily fuel and those exporting other primary commodities.6 Commodity terms of trade have moved in different ways in fuel exporters and nonfuel commodity exporters over the past decades (see Figure 5.4, middle panel). The current boom in energy prices gave a sizable boost to the commodity terms of trade of fuel exporters. Those of nonfuel commodity exporters have also risen, but more modestly.
At a regional level, the Middle East and north Africa and, to a somewhat lesser extent, sub-Saharan Africa and Latin America have been the main beneficiaries of the current commodity price boom (see Figure 5.4, lower panel).7 Dif-ferences in trade composition are behind these regional patterns. Fuel exports play the most critical role in the Middle East and north Africa, where they now account for more than one-
5Deaton and Miller (1996) and Cashin, Céspedes, and Sahay (2004) construct country-specific commodity export prices in a similar way. The terms-of-trade measure used here takes into account both commodity export and import prices, and also adjusts for the importance of commodities in the overall trade of each country. A similar terms-of-trade measure is used in Lee and others (2008). See Appendix 5.1 for more details.
6Fuel exporters are defined as countries for which fuel constitutes more than 50 percent of total exports. Non-fuel primary commodity exporters are similarly defined as countries for which other primary commodities constitute more than 50 percent of total exports. Finally, commodity exporters are defined to include both fuel and nonfuel primary commodity exporters.
7It is important to note that terms-of-trade effects vary within regions. Because the current boom benefits fuel exporters more than nonfuel commodity exporters, not all countries in sub-Saharan Africa and Latin America have gained from it. See, for example, IMF (2007a).
1984 87 90 93 96 99 2002 050
8
16
24
32
40
0
4
8
12
16
20
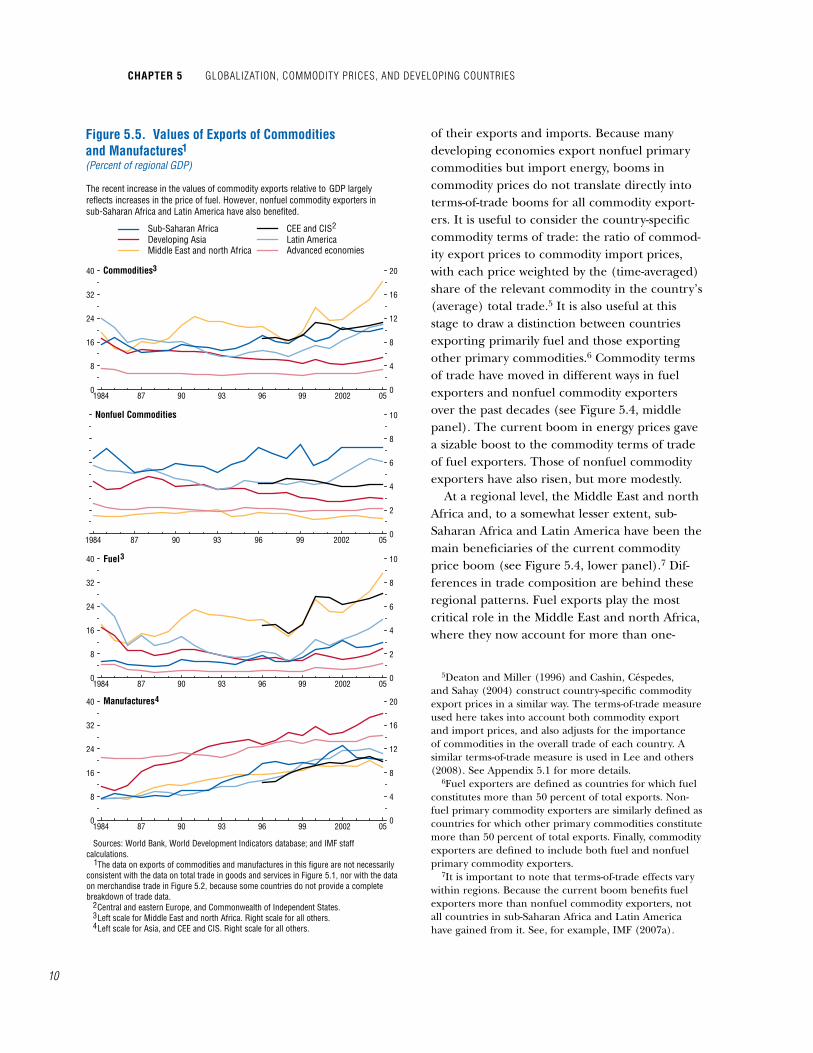
Figure 5.5. Values of Exports of Commodities and Manufactures(Percent of regional GDP)
The recent increase in the values of commodity exports relative to GDP largely reflects increases in the price of fuel. However, nonfuel commodity exporters in sub-Saharan Africa and Latin America have also benefited.
Sub-Saharan Africa Developing Asia
CEE and CISLatin America
Middle East and north Africa
Commodities
Sources: World Bank, World Development Indicators database; and IMF staff calculations. The data on exports of commodities and manufactures in this figure are not necessarily consistent with the data on total trade in goods and services in Figure 5.1, nor with the data on merchandise trade in Figure 5.2, because some countries do not provide a complete breakdown of trade data. Central and eastern Europe, and Commonwealth of Independent States. Left scale for Middle East and north Africa. Right scale for all others. Left scale for Asia, and CEE and CIS. Right scale for all others.
1
1984 87 90 93 96 99 2002 050
2
4
6
8
10Nonfuel Commodities
1984 87 90 93 96 99 2002 050
8
16
24
32
40
0
2
4
6
8
10Fuel
1984 87 90 93 96 99 2002 050
8
16
24
32
40
0
4
8
12
16
20Manufactures
Advanced economies
1
3
3
4
23
2
4

��
third of regional GDP. Latin America depends on both fuel and nonfuel commodities to broadly similar degrees, whereas nonfuel com-modities are especially important in sub-Saharan Africa (although fuels also account for a signifi-cant share of the regional economy). Globally, the recent increase in the value of commodity exports relative to GDP reflects trade in fuel more so than nonfuel commodities, although the value shares of nonfuel commodities also rose in sub-Saharan Africa and Latin America (Figure 5.5). The current commodity price boom has had a comparatively limited impact on the volume of commodity exports relative to GDP (Figure 5.6). The volume share of fuel has increased in central and eastern Europe and the Commonwealth of Independent States (CIS),8 and in Latin America, but it has declined some-what in the Middle East and north Africa.
Importantly, the recent growth in trade across emerging and developing economies has not been limited to commodities. Manufacturing exports relative to GDP have grown steadily in both value and volume terms (see Figures 5.5 and 5.6). Asia saw an especially dramatic rise in the share of manufacturing exports over the past couple of decades, but a significant upsurge occurred also in central and eastern Europe and the CIS, and other regions have experienced steady growth too. Even commodity exporters have significantly stepped up their manufactur-ing trade (Figure 5.7). Some of this may reflect commodity-related manufacturing, such as relatively low-value-added metal or mineral prod-ucts.9 Nonetheless, for commodity-dependent nations, a move from exports of unprocessed
8This finding reflects fuel-exporting countries in the CIS. The CIS includes large fuel and nonfuel commodity exporters, while countries of central and eastern Europe tend to be net importers of primary commodities.
9For instance, in sub-Saharan Africa nonmetallic min-eral manufactures (mainly diamonds) account for a sub-stantial share of manufacturing exports, although exports of transport equipment and clothing are currently grow-ing fast (see IMF, 2007a). Clothing exports are also rising rapidly in Latin America and in the Middle East and north Africa, although natural-resource-related manufac-tures are an important export category in the latter.
1984 87 90 93 96 99 2002 050
8
16
24
32
40
0
4
8
12
16
20
Figure 5.6. Volumes of Exports of Commodities and Manufactures(Percent of regional GDP in 2000 U.S. dollars)
Commodities
Sources: World Bank, World Development Indicators database; and IMF staff calculations. Export volume indices are divided by real GDP indices; the values in 2000 are set equal to export shares of regional GDP in current U.S. dollars. Central and eastern Europe, and Commonwealth of Independent States. Left scale for Middle East and north Africa. Right scale for all others. Left scale for Asia, and CEE and CIS. Right scale for all others.
1984 87 90 93 96 99 2002 050
2
4
6
8
10Nonfuel Commodities
1984 87 90 93 96 99 2002 050
8
16
24
32
40
0
2
4
6
8
10Fuel
1984 87 90 93 96 99 2002 050
8
16
24
32
40
0
4
8
12
16
20Manufactures
Volumes of commodity exports relative to GDP have remained broadly stable, whilethose of manufacturing exports have risen steadily, especially in Asia, as well asin central and eastern Europe and the Commonwealth of Independent States.
Sub-Saharan Africa Developing Asia
CEE and CISLatin America
Middle East and north Africa Advanced economies
1
3
3
4
1
23
2
4
Commodity PriCes and Patterns of inteGration

ChaPter 5 Globalization, Commodity PriCes, and develoPinG Countries
��
1990 95 2000 050
100
200
300
400
500
600
700
75 80 85 90 95 2000 05
Figure 5.7. Patterns of Regional Trade
The export destinations of developing economies have become more diversified over time. Although advanced economies remain the most important market, trade with other developing economies, especially China and other countries in Asia, has grown rapidly. Manufacturing trade has risen substantially more than commodity trade, with manufacturing exports to advanced economies tripling in real terms since the early 1990s. Commodity exporters have also stepped up their trade, not just in commodities but also in manufactures.
Exports from Emerging and Developing Economies
Sources: IMF, Commodity Price System; IMF, Direction of Trade Statistics; UNCOMTRADE; and IMF staff calculations. Sources of exports are defined as emerging and developing economies excluding China and India. Values are shown only if data are available for at least 80 percent of all countries. Nominal dollar values deflated by manufactures unit value. Nominal dollar values deflated by overall commodity price index.
Exports from Emerging and Developing Economies
Exports from Commodity Exporters
Advanced economies China Other developing Asia India Other developing economies
Total Goods Exports(exports to areas in percent of total exports)
1990 95 2000 050
5
10
15
20Exports from Commodity Exporters
1990 95 2000 050
50
100
150
200
250
300
1990 95 2000 050
20
40
60
80
100
120
140
160
Manufacturing Exports(exports to areas in billions of 2000 U.S. dollars )
Exports from Emerging and Developing Economies Exports from Commodity Exporters
Commodities Exports(exports to areas in billions of 2000 U.S. dollars )
23
1
1
3
2
1970 1976
100
75
50
25
0
100
75
50
25
080 85 90 95 2000 05

��
raw materials to those of somewhat higher-value-added products is a natural and important first step toward broader-based industrialization, even though it does not eliminate these economies’ vulnerability to commodity price shocks.
The export destinations of developing econo-mies have become more diversified over time. Advanced economies remain the most important markets for developing economies, which con-tinue to penetrate these markets with both com-modities and manufactures. However, there has been rapid growth in trade with other develop-ing economies, especially in Asia (see Figure 5.7; see also Akin and Kose, 2007).10 Commodity exports to China and other Asian economies have risen substantially. Perhaps less well known, growth in China and elsewhere in Asia has also significantly expanded the developing econo-mies’ markets for manufactures. Indeed, while manufacturing exports to advanced economies have tripled in real terms since the early 1990s, those to China have grown even more dramati-cally, albeit from a very low initial level.11
Developing economies have attracted substan-tially more FDI in recent years in all economic sectors (Figure 5.8). While the largest increase has occurred in services, manufacturing and commodity sectors have also enjoyed a sizable inflow of FDI. The stock of FDI in developing economies’ manufacturing has been consistently greater and has recently grown by a somewhat larger amount than the stock of FDI in commod-ities. Developing economies have also become a significantly more important source of FDI for advanced and other developing economies, especially in services. Although the role of these economies as providers of global investment is still relatively small, it is clearly on the rise.
10Intraregional trade in Asia has been an important component of the broad-based rise in trade among devel-oping countries (see IMF, 2007b).
11The implications of China’s and India’s emergence for the integration of other developing economies into the global economy are the subject of a growing and, as yet, not fully conclusive literature. See, among others, Lederman, Olarreaga, and Soloaga (2007) and Cravino, Lederman, and Olarreaga (2007) for Latin America and Goldstein and others (2006) for Africa.
Sources: UNCTAD (2007) ; and IMF staff calculations. Sectoral aggregations are based on different classifications than those used elsewhere in the chapter; thus the sectors are not fully comparable with those elsewhere. Commodities include the primary sector; food, beverages, and tobacco; and coke, petroleum products, and nuclear fuel.
Figure 5.8. Foreign Direct Investment in Emerging and Developing Economies(Share of GDP in percent)
Commodities Manufacturing Services Total0
5
10
15
20
25
Emerging and developing economies have attracted greater amounts of foreign direct investment in all sectors. They have also become a much more important source of foreign direct investment.
1990 2005
1
1
Inward Stock of Foreign Direct Investment
Commodities Manufacturing Services Total0
2
4
6
8
10
12Outward Stock of Foreign Direct Investment
Commodity PriCes and Patterns of inteGration

ChaPter 5 Globalization, Commodity PriCes, and develoPinG Countries
��
The rising integration of developing econo-mies into the world economy has been accom-panied by significant improvements in domestic policies and institutions (Figure 5.9). Emerging and developing economies—both those that export commodities and those that export other goods and services—have pursued external lib-eralization by reducing trade tariffs and restric-tions on current and capital account transactions (although about 80 percent of all countries still maintain restrictions on FDI). Macroeconomic policies also have improved, with fewer large gov-ernment and current account deficits, as has the overall quality of institutions and the depth of financial systems (see Appendix 5.1 for details). Compared with other countries, commodity exporters have achieved larger government and current account surpluses, but they have lagged in terms of broad institutional quality and finan-cial development.12
In sum, commodity prices continue to play an important role in developing economies, with the current boom benefiting predominantly fuel exporters. However, the importance of manufacturing exports to developing economies has increased, with an especially dramatic rise in Asia and, on a somewhat smaller scale, in central and eastern Europe and the CIS. Both commodity and noncommodity exporters have stepped up their manufacturing exports both to advanced economies, which remain their most important export destinations, and to China and other Asian countries. Commodity exports to China and elsewhere in Asia have also risen sharply, although less so than manufacturing exports. Developing economies have attracted more FDI, including in their manufacturing sectors, and have become more important as a source for FDI. External liberalization has con-tinued unabated across the developing world, and macroeconomic policies and institutions
12Clearly, improvements in government and current-account balances among commodity exporters may in part reflect the direct impact of commodity exports, as opposed to more structural changes. See below for a more direct comparison of the current commodity boom with previous booms.
85 90 95 2000 050
10
20
30
40
50
-15
-10
-5
0
5
10
85 90 95 2000 050
5
10
15
20
25
30
35
-0.4
-0.2
0.0
0.2
0.4
0.6
0.8
1.0
85 90 95 2000 050
5
10
15
20
25
30
35
-0.4
-0.2
0.0
0.2
0.4
0.6
0.8
1.0
Figure 5.9. Policy and Institutional Environment(Mean; all variables on right scale unless indicated otherwise)
Capital account restrictions Export repatriation and surrender requirements
Capital account restrictionsControls on FDI and liquidation of FDITariff restrictions (left scale)
Emerging and Developing Economies
Sources: Beck,Demirgüç-Kunt, and Levine (2007); Chinn and Ito (2006); Grilli and Milesi-Ferretti (1995); Marshall, Jaggers, and Gurr (2004); World Bank, World Development Indicators database; and IMF staff calculations. Grilli and Milesi-Ferretti measure. Chinn and Ito measure; 1993–95 data interpolated owing to irregularities in the underlying data. Percent of GDP. Institutional quality is measured by the Marshall, Jaggers, and Gurr “executive constraints” variable (see Appendix 5.1 for details). Financial development is measured using the ratio of private sector credit by banks and other financial institutions to GDP (see Appendix 5.1 for details).
Commodity Exporters
85 90 95 2000 050
10
20
30
40
50
-15
-10
-5
0
5
10Emerging and Developing Economies
Commodity Exporters
1
Policy Barriers to Globalization
General government balance Institutional quality
Current account balance
Institutions and Macro Policies
2
1 2
Developing economies have pursued external liberalization by reducing trade tariffsand restrictions on current and capital account transactions. Macroeconomic policieshave also improved, with fewer large government and current account deficits, stronger overall institutions, and deeper financial systems.
34
3
34
1980
1980
1980
1980
Financial development (left scale)5
5
��
have improved steadily, including in commodity exporters.
Globalization and Commodity Price Cycles
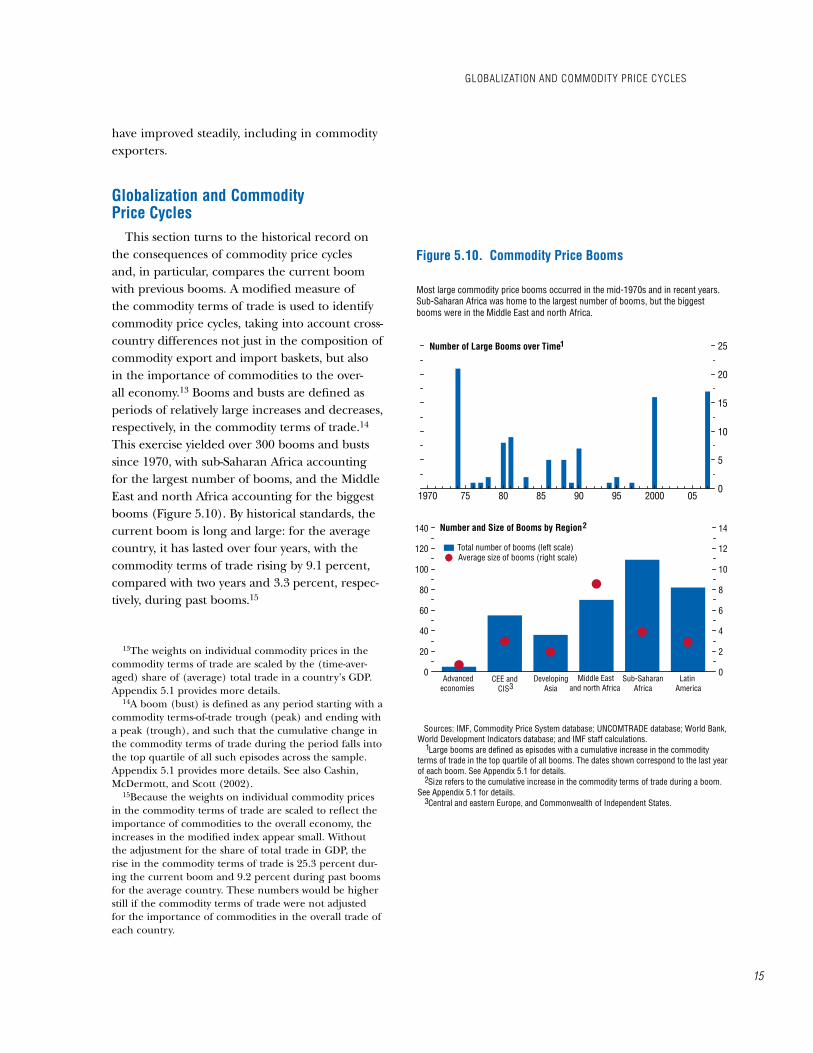
This section turns to the historical record on the consequences of commodity price cycles and, in particular, compares the current boom with previous booms. A modified measure of the commodity terms of trade is used to identify commodity price cycles, taking into account cross-country differences not just in the composition of commodity export and import baskets, but also in the importance of commodities to the over-all economy.13 Booms and busts are defined as periods of relatively large increases and decreases, respectively, in the commodity terms of trade.14 This exercise yielded over 300 booms and busts since 1970, with sub-Saharan Africa accounting for the largest number of booms, and the Middle East and north Africa accounting for the biggest booms (Figure 5.10). By historical standards, the current boom is long and large: for the average country, it has lasted over four years, with the commodity terms of trade rising by 9.1 percent, compared with two years and 3.3 percent, respec-tively, during past booms.15
13The weights on individual commodity prices in the commodity terms of trade are scaled by the (time-aver-aged) share of (average) total trade in a country’s GDP. Appendix 5.1 provides more details.
14A boom (bust) is defined as any period starting with a commodity terms-of-trade trough (peak) and ending with a peak (trough), and such that the cumulative change in the commodity terms of trade during the period falls into the top quartile of all such episodes across the sample. Appendix 5.1 provides more details. See also Cashin, McDermott, and Scott (2002).
15Because the weights on individual commodity prices in the commodity terms of trade are scaled to reflect the importance of commodities to the overall economy, the increases in the modified index appear small. Without the adjustment for the share of total trade in GDP, the rise in the commodity terms of trade is 25.3 percent dur-ing the current boom and 9.2 percent during past booms for the average country. These numbers would be higher still if the commodity terms of trade were not adjusted for the importance of commodities in the overall trade of each country.
0
20
40
60
80
100
120
140
0
2
4
6
8
10
12
14
Figure 5.10. Commodity Price Booms
Sources: IMF, Commodity Price System database; UNCOMTRADE database; World Bank, World Development Indicators database; and IMF staff calculations. Large booms are defined as episodes with a cumulative increase in the commodity terms of trade in the top quartile of all booms. The dates shown correspond to the last year of each boom. See Appendix 5.1 for details. Size refers to the cumulative increase in the commodity terms of trade during a boom. See Appendix 5.1 for details. Central and eastern Europe, and Commonwealth of Independent States.
Most large commodity price booms occurred in the mid-1970s and in recent years. Sub-Saharan Africa was home to the largest number of booms, but the biggest booms were in the Middle East and north Africa.
1
Number and Size of Booms by Region
1
2
Average size of booms (right scale)Total number of booms (left scale)
1970 75 80 85 90 95 2000 050
5
10
15
20
25Number of Large Booms over Time
Advanced economies
DevelopingAsia
CEE and CIS
Sub-Saharan Africa
Middle Eastand north Africa
Latin America
2
3
3
Globalization and Commodity PriCe CyCles

ChaPter 5 Globalization, Commodity PriCes, and develoPinG Countries
��
An event study was then conducted to exam-ine how trade and capital flows, exchange rates, investment, government spending and borrow-ing, and other important variables responded to booms in commodity terms of trade and whether the current boom appears to be significantly different. Specifically, the event study compares (1) average annual percentage changes in the indicators of interest during past booms with changes during past busts and (2) changes dur-ing the current boom with changes during past booms. To account for the likely heterogeneity of responses across different events and different countries, the analysis focuses separately on large commodity price events and on fuel and nonfuel commodity exporters.16 To keep the focus on developing economies, advanced economies are excluded from the study.
As expected, the total value of exports grew much faster during terms-of-trade booms than during busts (Figure 5.11). The difference in growth rates was especially marked (exceeding 40 percentage points a year) during large booms and among fuel exporters. As for the current boom, export value growth has been faster than during past booms for the full sample (by about 18 percentage points a year), although it has been somewhat slower than during past large booms. During the present boom, total export volumes, except for fuel exports, have responded much more strongly than in the past, when the impact on export volumes was substan-tially smaller in magnitude than the impact on export values.
The improvement in export performance during the current boom reflects differences in the growth of commodities versus manu-factures exports. In the past, real commodity exports grew faster during booms than busts, but manufacturing exports changed little in the
16Appendix 5.1 provides more details on the calcula-tions behind this event study, as well as precise definitions of the relevant subsets of events and countries. Because the current boom is concentrated in fuel exporters, the comparison with past booms in nonfuel commodity exporters is based on few observations and should be treated with some caution.
full sample. During past booms, manufacturing exports tended to rise faster for fuel export-ers and more slowly for nonfuel commodity exporters. During the current boom, commod-ity exports have generally grown more slowly than during previous booms, but manufacturing exports have grown faster, producing higher real export growth overall.17
A look at relative changes in real effective exchange rates and tariff rates provides further insights into these trade patterns.18 During past booms, nonfuel commodity exporters expe-rienced relatively strong real exchange rate appreciations, with adverse effects for their man-ufacturing exports and import-competing sec-tors owing to Dutch disease (see Figure 5.11). Probably related to this, their tariff rates fell relatively less. Conversely, during busts, these countries had relatively weaker real exchange rates, which allowed them to undertake rela-tively larger tariff reductions. The picture is very different for fuel exporters. These countries experienced less nominal and real appreciation during commodity price booms than during busts. This largely reflected the widespread ten-dency of these countries to peg their exchange rates to the dollar,19 which tends to depreciate when commodity prices rise.20
17The shift in real export growth from commodities to manufactures has not been sufficiently strong in the case of fuel exporters (where the composition of exports is more heavily skewed toward commodities) to yield faster increases in total export volumes.
18The links between commodity prices and real exchange rates in commodity-dependent countries are explored in the “commodity currencies” literature (see Chen and Rogoff, 2003; and Cashin, Céspedes, and Sahay, 2004). This literature finds that commodity export prices tend to have a strong influence on real exchange rates for many commodity producers, although in coun-tries with pegged nominal exchange rates the relation-ship is subject to structural shifts and may be weakened.
19In fuel exporters, half of all booms occurred in coun-tries with dollar pegs. In contrast, none of the nonfuel commodity exporters that experienced booms had dollar pegs.
20The correlation between the nominal effective exchange rate of the United States and the overall index of commodity prices in real terms is negative and over 40 percent in absolute value.

��
Full sampleLarge events
Fuel exporters-20
0
20
40
60
Figure 5.11. Event Study of the Commodity Terms of Trade, 1970–2007(Median differences in average annual percent change in selected variables; advanced economies excluded)
During past booms (compared with busts) stronger export growth tended to reflect prices much more than volumes. Commodity exports rose, whereas manufacturing exports showed mixed patterns consistent with Dutch disease and protectionist pressures. In the current boom, export volumes have responded more and manufacturing exports have grown significantly faster, reflecting in part less real appreciation in fuel exporters and greater tariff reduction in nonfuel commodity exporters .
Dollar Exports of Goods and Services
Past events (booms relative to busts) Current boom (relative to past booms)
Full sampleLarge events
Fuel exporters-4
-2
0
2
4
6
8
10Real Exports of Goods and Services
Full sampleLarge events
Fuel exporters-30
-20
-10
0
10
20
30
40 Real Exports of Commodities
Full sampleLarge events
Fuel exporters-15
-10
-5
0
5
10
15
20Real Exports of Manufactures
Full sampleLarge events
Fuel exporters-8
-6
-4
-2
0
2
4
6Average Tariff Rate
Full sampleLarge events
Fuel exporters-5-4-3-2-1012345 Real Effective Exchange Rate
(deviation from trend)
Full sampleLarge events
Fuel exporters-5-4-3-2-1012345 Nominal Effective Exchange Rate
(deviation from trend)
1,2
Nonfuel commodity exporters
Full sampleLarge events
Fuel exporters-3
-2
-1
0
1
2
3
4Neighbors' Average Tariff Rate(distance and GDP weighted)
Nonfuel commodity exporters
Nonfuel commodity exporters
Nonfuel commodity exporters
Nonfuel commodity exporters
Nonfuel commodity exporters
Nonfuel commodity exporters
Nonfuel commodity exporters
Globalization and Commodity PriCe CyCles

ChaPter 5 Globalization, Commodity PriCes, and develoPinG Countries
��
Full sampleLarge events
Fuel exporters-5
0
5
10
15
Figure 5.11 (concluded)
During past booms (compared with busts) foreign investment accelerated, reflecting primarily portfolio inflows, while domestic investment responded weakly. Governments tended to pursue procyclical fiscal policies and not to engage in consumption smoothing. In the current boom, FDI and domestic investment have grown substantially more. Government borrowing has slowed, and government consumption has moderated slightly relative to private consumption. Finally, real economic growth has accelerated.
FDI Liabilities
Past events (booms relative to busts) Current boom (relative to past booms)
Full sampleLarge events
Fuel exporters-20
0
20
40
60
80
100Portfolio Equity Liabilities
Full sampleLarge events
Fuel exporters-20
-15
-10
-5
0
5
10
15 Private External Debt
Full sampleLarge events
Fuel exporters-20
-15
-10
-5
0
5
10
15Public External Debt
Full sampleLarge events
Fuel exporters-4
-2
0
2
4
6
8
10 Real Private Consumption
Full sampleLarge events
Fuel exporters-4
-2
0
2
4
6
8
10Real Public Consumption
Full sampleLarge events
Fuel exporters-5
0
5
10
15
20 Real Domestic Investment
Full sampleLarge events
Fuel exporters-2-10123456Real GDP
Sources: IMF, Commodity Price System; UNCOMTRADE; World Bank, World Development Indicators database; and IMF staff calculations. Some of the series are not available after 2005 or 2006; effective exchange rates are available starting in the late 1970s; tariff rates are available starting in 1980. Because the current boom is concentrated in fuel exporters, its comparison to past booms in nonfuel commodity exporters is based on few observations and should be treated with caution.
1
2
Nonfuel commodity exporters
Nonfuel commodity exporters
Nonfuel commodity exporters
Nonfuel commodity exporters
Nonfuel commodity exporters
Nonfuel commodity exporters
Nonfuel commodity exporters
Nonfuel commodity exporters

��
By way of comparison, during the current boom, real exchange rates have appreciated less for fuel exporters, but more for nonfuel exporters, in part reflecting the differential effects on these two groups of the recent dollar plunge.21 This may provide one reason why manufacturing exports have increased sub-stantially faster for fuel exporters. In nonfuel commodity exporters, the recent rise in manu-facturing exports may reflect a greater commit-ment to trade liberalization. For example, in Chile, since the beginning of the current boom in 2002 and compared with the average of past booms, trade tariffs have decreased more than 6 percentage points a year faster, and manufac-turing exports have grown more than 6 per-centage points a year faster. In addition, tariff reductions in neighboring countries may have played a positive role, creating broader opportu-nities for intraregional trade.22
Turning to foreign capital inflows, portfolio equity liabilities responded markedly more than FDI during past commodity price booms, relative to busts.23 However, during the current boom, inward FDI has increased much faster than during past booms. The rise in FDI is especially apparent among fuel exporters, for which it has grown by over 14 percentage points a year faster than in previous booms (for a median country).
Foreign borrowing exhibited mixed patterns. In nonfuel commodity exporters, private debt grew less during booms than during busts. In fuel exporters, both governmental and private entities tended to borrow more during booms. In the full sample, the dynamics of public debt were similar in booms and in busts, whereas private debt
21While many fuel exporters have continued to peg their currencies to the dollar, nonfuel commodity export-ers (such as Chile) suffered from currency depreciation in their trading partners, including the United States.
22It is important to note that buoyant global demand of the recent years has contributed to stronger growth in manufacturing exports during the current commodity price boom.
23While FDI flowed into a wide range of developing economies, portfolio investment was narrower in scope. Accordingly, the country coverage is more limited for portfolio equity.
tended to grow somewhat more during busts. These patterns suggest that fuel exporters have been more successful in attracting foreign capital during booms than nonfuel commodity export-ers, which suffered more from protectionism and Dutch disease, as noted. Also, governments did not generally use borrowing to smooth consump-tion during busts, though private borrowing was used to some extent for this purpose. During the current boom, external debt has risen more slowly than during past booms, with government borrowing showing considerably slower growth than private borrowing. Such fiscal restraint dur-ing the current boom is likely to have reduced these economies’ vulnerability to Dutch disease and contributed to stronger manufacturing and overall export growth.
Both private and public consumption increased more during past booms than dur-ing past busts, suggesting that fiscal policies were procyclical in many countries. However, during the present boom, public consumption has tended to grow somewhat more slowly than private consumption, when compared with past booms, although this tendency has been less pronounced among nonfuel commodity export-ers than among fuel exporters. For example, in Chile both types of consumption have grown faster than in previous booms (with public consumption lagging only slightly behind private consumption), whereas in Saudi Arabia govern-ment consumption has grown by 3 percentage points a year more slowly, but private consump-tion has grown by more than 7 percentage points a year faster than in previous booms.
Both domestic investment and output growth increased during past large booms relative to busts, but the response was weak in the full sample. Slower investment and growth in non-fuel commodity exporters likely reflected their weaker export performance and contributed to their difficulty in attracting foreign capital (except FDI), as discussed. During the current boom, investment has risen at a dramatically faster rate (especially in fuel exporters), and GDP has grown significantly more than during past booms.
Globalization and Commodity PriCe CyCles

ChaPter 5 Globalization, Commodity PriCes, and develoPinG Countries
�0
In sum, during past commodity price booms (compared with busts) stronger export growth tended to reflect export prices much more than export volumes. Still, real commodity exports rose, whereas manufacturing exports showed mixed patterns consistent with Dutch disease and protectionist pressures. Foreign investment accelerated, reflecting primarily portfolio inflows, while domestic investment responded weakly. Governments tended to pursue procyclical fiscal policies and to forgo consumption smoothing. Along several dimen-sions, the current boom appears quite differ-ent. Export volumes have responded more strongly and manufacturing exports have grown at a significantly faster rate, reflecting in part less real exchange rate appreciation in fuel exporters and more tariff reduction in nonfuel commodity exporters. Increasing trade openness in neighboring countries, as well as improved fiscal management and better policies and institutions more generally, likely contributed to stronger performance. FDI and domestic investment have grown at substantially higher rates than during past booms. Foreign borrowing, especially by governments, has slowed, and government spending has moder-ated slightly. Finally, real economic growth has accelerated.
explaining the PatternsThis section takes a longer-term view to ana-
lyze the determinants of the success by develop-ing economies in integrating into the global economy. It focuses on the contribution of domestic institutions and policies, as compared with the terms of trade or geographic location. A key question is whether, over the long run, the dynamics of the terms of trade and commodity endowments account for a significant share of cross-country and cross-regional differences in globalization.
To a lesser extent, this analysis also assesses the importance of spillover effects from other countries’ openness to trade and capital flows, as well as from their institutions and policies.
In other words, is a given country more likely to liberalize internally and/or externally when other nearby countries do? In this sense, does globalization help developing countries create a basis for sustainable growth?
In turn, the above analyses are used to exam-ine whether developing economies’ increasing integration into the global economy is likely to be sustained in the future, even in the face of adverse movements in the terms of trade. Put differently, because globalization has proven to be an important driver of growth in developing economies, it is important to know what factors can hold it back.
Specifically, the analysis considers a broad sample of about 80 countries, including both advanced and developing economies, over the period 1970–2005. It examines the determinants of several aspects of integration, including in particular total trade, exports, imports, and FDI. It analyzes trade both of merchandise as a whole and of commodities alone, in both value and volume terms. The econometric framework consists of both cross-sectional and (five-year-average) panel regressions.
Building on the existing literature, the analy-sis encompasses a broad range of variables that could explain integration, including institutions, policies, commodity prices, and geographic factors. Specifically, the variables include the fol-lowing (see Appendix 5.1 for details).• Quality of domestic institutions: As is well
understood, this can have major effects on a country’s productivity and output across all sectors (see, for instance, Chapter 3 of the April 2003 World Economic Outlook). The effects may be disproportionately large in tradable sectors; for instance, production for export may require large, visible, up-front invest-ments, which may be particularly susceptible to expropriation. Likewise, financial invest-ments by foreign residents may be particularly vulnerable to perceptions of a poor invest-ment climate (see also Dell’Ariccia and oth-ers, 2007).
• Structural features: A better-developed finan-cial infrastructure (measured using the ratio

��
of private sector credit to GDP) may boost output across all sectors. Tradable sectors may derive particular benefits to the extent that they are either relatively capital intensive or else involve relatively large-scale plants and firms that find it harder to rely on informal credit markets. In addition, some specifica-tions also consider the role of exchange-regime flexibility (based on Reinhart and Rogoff, 2004).
• Quality of domestic macroeconomic policies: This is assessed (as in Chapter 5 of the Octo-ber 2007 World Economic Outlook) through an index measuring the success of the monetary framework in maintaining low inflation, as well as through a measure of the stability of fiscal policy (the volatility of cyclically adjusted government expenditures).
• Direct policy barriers to integration: The role of three separate policy variables is consid-ered. These are (1) “trade openness,” an index of (both tariff and nontariff) barriers to international trade; (2) “exchange restric-tions,” a measure of overall current- and capital-account exchange restrictions; and (3) exchange rate “overvaluation” (measured by the deviation of a country’s real exchange rate from its trend value, calculated using the Hodrick-Prescott filter). This third variable aims to capture any Dutch disease effects on an economy’s tradables sector.
• Commodity prices: The country-specific indi-ces of commodity export and import prices are included separately, to test for differential effects. To control for cross-country differ-ences in the importance of commodity trade, commodity prices are weighted by the aver-age share of the relevant commodity in the country’s GDP.
• Location and external spillover effects: Depending on the specification, these are captured through a mixture of the follow-ing variables: (1) “neighbors’ trade open-ness,” a distance- and size-weighted average of neighboring countries’ policy barriers to trade; (2) an index of geographical remote-ness; (3) a trade-weighted measure of external
demand; and (4) a measure of world interest rates.Overall, both the cross-sectional analysis
(Tables 5.1 and 5.2) and the panel regressions (Tables 5.3 and 5.4) suggest the following broad findings (subject to the usual caveats about the direction of causality).• Greater institutional quality is significantly
associated with greater overall trade, in both value and volume terms. Institutional quality is also associated with greater FDI.
• Financial deepening is also significantly associ-ated with increased trade and FDI. There is also evidence that the impact diminishes beyond a threshold level of financial devel-opment, which is greater however than the values observed in emerging and developing economies.
• The quality of domestic monetary and fiscal policy does not have a statistically significant impact on integration. Put differently, any impact on trade and FDI is no larger than the overall impact on GDP.
• As for direct policy barriers to integration, the impact of the different measures is often hard to disentangle, but there is some evidence that exchange restrictions in particular are significantly correlated with lower overall trade and FDI.
table 5.1. Cross-sectional regressions: overall trade
Trade to GDP
NetExports to GDP
Exportsto GDP
Importsto GDP
Broad institutions 6.9** –0.56 3.2* 3.7**Financial development1 1.2*** –0.4 0.67*** 0.54***Trade openness 10.1 2.92 6.5 3.6Exchange restrictions –47** –2.09 –25** –23**Overvaluation 4.3 –0.79 1.8 2.5Neighbors’ trade openness 1.7* 0.38** 1.0** 0.66R-squared 0.61 0.47 0.57 0.64
Note: Statistically significant coefficients are in boldface; *, **, and *** denote significance at, respectively, the 10, 5, and 1 percent level (based on robust standard errors). Other controls include monetary policy quality and fiscal policy volatility (always insignificant); exchange-rate-regime flexibility; initial GDP; landlocked status; land size; population; distance. Number of countries = 81.
1In order to allow for nonlinearities, regressions employ both the level and the square of financial development; the joint coefficient presented represents the marginal value, evaluated at the sample mean.
exPlaininG the Patterns

ChaPter 5 Globalization, Commodity PriCes, and develoPinG Countries
��
• Trade barriers in neighboring countries are associated with lower exports and trade, con-firming the importance of external spillover effects. This effect is more statistically signifi-cant in the panel.
• Commodity prices do not exert a statistically significant impact either on overall trade volumes or on commodity trade volumes. Put differently, and in line with the earlier event analysis, the impact, if any, of commod-ity prices on trade volumes (as opposed to values) is not a dominant feature of the data. The limited impact on commodity trade vol-umes likely reflects both the inelastic demand for many commodities, especially in the short run, and the presence of significant con-straints to expanding supply.
These results can be applied to explain the large increase in trade and FDI over time, both for the world as a whole and for advanced and developing economies separately.24 In light of these results, as well as the previously illus-trated improvements over time in domestic institutions and policies, it may not be surpris-ing that most of the explained variation in trade and financial integration reflects the impact of institutions, financial development,
24Formally, for any given integration variable of inter-est, the economic significance of the results may be gauged by splitting the sample into two subperiods. Given the coefficient estimates based on the overall sample, it can then be calculated which regressors explain most of the variation in the dependent variable between the subperiods.
table 5.3. Panel regressions: overall tradeTrade
Volume to GDPNet Export
Volume to GDPExport
Volume to GDPImport
Volume to GDP
Broad institutions 0.019** –0.038 0.028*** 0.022*Financial development1 0.07* 0.01 0.13** 0.13*Trade openness –0.03* –1.7* –0.09* 0.002Exchange restrictions –0.15*** –2.5*** –0.14*** –0.13**Overvaluation –0.0033 –0.27 –0.025** 0.0032Neighbors’ trade openness 0.20*** 0.7*** 0.33*** 0.20*Commodity export prices 5.4 –1.4 0.02 1.8Commodity import prices –2.0 1.8 6.1 12.0R-squared 0.46 0.07 0.52 0.35
Note: Statistically significant coefficients are in boldface; *, **, and *** denote significance at, respectively, the 10, 5, and 1 percent level (based on robust standard errors). Other controls include monetary policy quality and fiscal policy volatility (always insignificant); exchange-rate-regime flexibility; initial GDP; country effects; time trend; trade-weighted world real GDP growth; London interbank offered rate. Number of countries = 79; number of observations = 342.
1In order to allow for nonlinearities, regressions employ both the level and the square of financial development; the joint coefficient presented represents the marginal value, evaluated at the sample mean.
table 5.2. Cross-sectional regressions: Commodity trade, Foreign direct investment (Fdi)Trade to GDP Net Exports to GDP Exports to GDP Imports to GDP FDI to GDP
Broad institutions 3*** –0.32 1.8** 1.5*** 0.16Financial development1 4** –0.79 –0.1 0.81** 1.9*Trade openness 7.3 –0.29 3.7 3.3 0.8Exchange restrictions –3.5 –0.33 –2.1 –2.2 –2.5** Overvaluation –1.3 1.8 1.5 0.16 0.51Neighbors’ trade openness 244 49 156 93 41R-squared 0.48 0.32 0.30 0.65 0.4
Note: Statistically significant coefficients are in boldface; *, **, and *** denote significance at, respectively, the 10, 5, and 1 percent level (based on robust standard errors). Other controls include monetary policy quality and fiscal policy volatility (always insignificant); exchange-rate-regime flexibility; initial GDP; landlocked status; land size; population; distance. Number of countries = 81.
1In order to allow for nonlinearities, regressions employ both the level and the square of financial development; the joint coefficient presented represents the marginal value, evaluated at the sample mean.

��
policy distortions, and exogenous factors such as geography, rather than the direct impact of commodity prices. For instance, export volumes (relative to real GDP) grew in the sample by an average 30 percent between the 1980s and 2000s. Institutions and financial development accounted for almost one-quarter of this overall increase (Figure 5.12). Reduced policy distortions, including fewer exchange restrictions, lower tariffs, and diminished over-valuation, accounted for another quarter. In contrast, commodity export and import prices accounted for very little of the increase in export volumes, in either advanced or develop-ing economies.
A broader issue concerns the relationship between the various explanatory variables. In particular, there may be important politi-cal-economy links between institutions and policy distortions, on the one hand, and commodity prices on the other. A full discus-sion lies beyond the scope of this chapter. Nevertheless, simple correlation analysis brings up one interesting finding: increases in commodity export prices have historically been associated with increased trade barriers (Table 5.5). One interpretation of this response, largely driven by nonfuel commodity export-ers (as shown in the event analysis), is that it reflected policymakers’ past concerns about the potential Dutch disease effects of positive
terms-of-trade shocks on noncommodity trad-able sectors.
ConclusionsThe analysis in this chapter suggests that,
along several dimensions, the current com-modity price boom is proving more favorable to developing economies than previous booms. Exports are rising faster, reflecting substan-tially higher growth in manufacturing exports. Strikingly, even commodity exporters have increased their manufacturing exports, includ-ing to Asia. This observed acceleration has coincided with less real exchange rate apprecia-tion in fuel exporters and more tariff reduc-tion in nonfuel commodity exporters, which in previous booms tended to increase their trade barriers. FDI and domestic investment are increasing at a substantially faster rate than during past booms, and government borrowing has slowed at the same time that government spending has moderated somewhat. Against this background, real economic growth has accel-erated across the developing world, and large majorities of countries in all regions are enjoy-ing rapid trade and financial integration into the global economy.
That said, the analysis also suggests that commodity prices are a relatively minor con-tributor to the long-run trend toward globaliza-
ConClusions
table 5.4. Panel regressions: Commodity trade, Foreign direct investment (Fdi)Trade
Volume to GDPNet Export
Volume to GDPExport
Volume to GDPImport
Volume to GDP FDI to GDP
Broad institutions 0.0011 1.0 0.07 0.02 0.6*Financial development1 0.8* 1.2 0.2 0.3 0.2*Trade openness 0.012 –1.5 –0.18* 0.3 0.19Exchange restrictions –0.18** –9.9 –0.18* –0.15** –1.5***Overvaluation 0.01 0.62 0.014 0.001 –0.03Neighbors’ trade openness 0.23** –4.3 0.55 0.17 3.1***Commodity export prices 0.03 0.7 0.0 2.1* 4.0Commodity import prices –0.0002 5.1 0.12 –1.1* 0.3R-squared 0.19 0.02 0.18 0.22 0.33
Note: Statistically significant coefficients are in boldface; *, **, and *** denote significance at, respectively, the 10, 5, and 1 percent level (based on robust standard errors). Other controls include monetary policy quality and fiscal policy volatility (always insignificant); exchange-rate-regime flexibility; initial GDP; country effects; time trend; trade-weighted world real GDP growth; London interbank offered rate. Number of countries = 79; number of observations = 363.
1In order to allow for nonlinearities, regressions employ both the level and the square of financial development; the joint coefficient presented represents the marginal value, evaluated at the sample mean.

ChaPter 5 Globalization, Commodity PriCes, and develoPinG Countries
��
tion. Linked to this, one key reason developing economies have performed relatively well during the current commodity price boom has been the general improvement in their institutional and policy environments, including greater financial development, trade liberalization, and fiscal restraint. Many developing economies also have benefited from liberalization and rapid growth in their neighbors, including through the effects on demand for their exports (of both commodi-ties and manufactures). All this has two main implications.• Even if commodity prices were to lose their
buoyancy, such a development would be unlikely on its own to reverse many develop-ing economies’ growing integration into the global economy. This is significant, because the favorable changes in commodity export-ers’ terms of trade observed over the past few years should not necessarily be regarded as a permanent feature of the economic landscape.
• Continued progress toward trade and finan-cial integration will require sustained ongoing efforts by policymakers to further improve institutions and policy frameworks. For instance, it will be important to extend prog-ress toward trade liberalization and ensure that observed improvements in fiscal positions do not turn out to be purely cyclical.More generally, it should be emphasized
that the increased participation of low-income countries in the world economy has created new challenges for policymakers. Many econo-mies remain heavily dependent on commodity
Figure 5.12. Explaining the Increase in Integration from the 1980s to the 2000s(Dependent variable and total difference in percentage points on the x-axis; share of total difference on the y-axis; based on panel regressions)
World Advanced Economies Developing Economies-0.2
0.0
0.2
0.4
0.6
0.8
volumes [30 p.p.] export volumes [41 p.p.] export volumes [26 p.p.]
Financial development
Selected contributions:
External liberalization
Quality of institutions
Commodity prices
1
4
Sources: Beck, Demirgüç-Kunt, and Levine (2007); Heston, Summers, and Aten (2006); Marshall, Jaggers, and Gurr (2004); Reinhart and Rogoff (2004); Wacziarg and Welch (2003); World Bank, World Development Indicators database; and IMF staff calculations (see Appendix 5.1 for details). Combines contributions of financial development and its square. Combines contributions of trade openness, exchange restrictions, and overvaluation. Combines contributions of commodity export prices and import prices. Throughout, export volumes are deflated by a real GDP index; p.p. = percentage points.
123
2 3
44
4
Most of the explained variation over time reflects the impact of institutions, financial development, policy distortions, and exogenous factors such as geography, rather than the direct impact of commodity prices. Institutions and financial development accounted for almost one-quarter of the overall increase.
table 5.5. Panel regressions: institutions and PoliciesBroad
InstitutionsTrade
OpennessExchange
RestrictionsOver-
valuation
Commodity export prices 19 –19** 1.2 9.3Commodity import prices 1.6 2.3*** –0.84 –4.8R-squared 0.05 . . . 0.11 0.05
Note: Results for “trade openness” are based on a probit regression. Statistically significant coefficients are in boldface; *, **, and *** denote significance at, respectively, the 10, 5, and 1 percent level (based on robust standard errors). Other controls include initial GDP; country effects; time trend; trade-weighted world real GDP growth; London interbank offered rate. Number of countries = 89; number of observations = 801.

��
exports and could prove significantly vulnerable to commodity price shocks. This provides an important motivation to increase diversification over time, and many developing economies are moving in this direction. Continued reforms that serve this end also will help cushion these economies against abrupt changes in the external environment, including in commodity prices.
appendix 5.1. data and methodologyThe main authors of this appendix are Patrick Hettinger, Nikola Spatafora, Ercument Tulun, and Irina Tytell.
Country Coverage and Country Groupings
Chapter 5 covers 171 advanced and develop-ing economies (subject to data availability). Country coverage is held constant across time in each figure, although it may differ from fig-ure to figure depending on data availability. The countries are grouped as follows (the number of countries is in parentheses).
Advanced Economies (23)
Australia, Austria, Belgium, Canada, Den-mark, Finland, France, Germany, Greece, Iceland, Ireland, Italy, Japan, Luxembourg, Netherlands, New Zealand, Norway, Portugal, Spain, Sweden, Switzerland, United Kingdom, and United States.
Emerging and Developing Economies (148)
Sub-Saharan Africa (45)
Angola, Benin, Botswana, Burkina Faso, Burundi, Cameroon, Cape Verde, Central African Republic, Chad, Comoros, Democratic Republic of Congo, Republic of Congo, Côte d’Ivoire, Djibouti, Equatorial Guinea, Ethiopia, Gabon, The Gambia, Ghana, Guinea, Guinea-Bissau, Kenya, Lesotho, Madagascar, Malawi, Mali, Mauritania, Mauritius, Republic of Mozam-bique, Namibia, Niger, Nigeria, Rwanda, São Tomé and Príncipe, Senegal, Seychelles, Sierra Leone, South Africa, Sudan, Swaziland, Tanza-nia, Togo, Uganda, Zambia, and Zimbabwe.
Central and Eastern Europe and Commonwealth of Independent States (27)
Albania, Armenia, Azerbaijan, Belarus, Bul-garia, Croatia, Cyprus, Czech Republic, Estonia, Georgia, Hungary, Kazakhstan, Kyrgyz Republic, Latvia, Lithuania, former Yugoslav Republic of Macedonia, Moldova, Poland, Romania, Russia, Slovak Republic, Slovenia, Tajikistan, Turkey, Turkmenistan, Ukraine, and Uzbekistan.
Developing Asia (27)
Bangladesh, Bhutan, Cambodia, China, Fiji, Hong Kong SAR, India, Indonesia, Kiribati, Republic of Korea, Lao People’s Democratic Republic, Malaysia, Maldives, Myanmar, Nepal, Pakistan, Papua New Guinea, Philippines, Samoa, Singapore, Solomon Islands, Sri Lanka, Taiwan Province of China, Thailand, Tonga, Vanuatu, and Vietnam.
Latin America (32)
Antigua and Barbuda, Argentina, The Baha-mas, Barbados, Belize, Bolivia, Brazil, Chile, Colombia, Costa Rica, Dominica, Dominican Republic, Ecuador, El Salvador, Grenada, Guate-mala, Guyana, Haiti, Honduras, Jamaica, Mexico, Nicaragua, Panama, Paraguay, Peru, St. Kitts and Nevis, St. Lucia, St. Vincent and the Grenadines, Suriname, Trinidad and Tobago, Uruguay, and República Bolivariana de Venezuela.
Middle East and North Africa (17)
Algeria, Bahrain, Egypt, Islamic Republic of Iran, Israel, Jordan, Kuwait, Lebanon, Libya, Morocco, Oman, Qatar, Saudi Arabia, Syrian Arab Republic, Tunisia, United Arab Emirates, and Republic of Yemen.
Fuel Exporters (24)25
Algeria, Angola, Azerbaijan, Bahrain, Repub-lic of Congo, Ecuador, Equatorial Guinea, Gabon, Islamic Republic of Iran, Kazakhstan, Kuwait, Libya, Nigeria, Oman, Qatar, Russia,
25Countries are classified as fuel exporters if fuels con-stitute more than 50 percent of their exports.
aPPendix 5.1. data and methodoloGy

ChaPter 5 Globalization, Commodity PriCes, and develoPinG Countries
��
Saudi Arabia, Sudan, Syrian Arab Republic, Trinidad and Tobago, Turkmenistan, United Arab Emirates, República Bolivariana de Venezu-ela, and Republic of Yemen.
Nonfuel Primary Commodity Exporters (21)26
Botswana, Burkina Faso, Burundi, Chad, Chile, Democratic Republic of Congo, Guinea, Guinea-Bissau, Guyana, Malawi, Mauritania, Mongolia, Republic of Mozambique, Papua New Guinea, Sierra Leone, Solomon Islands, Suriname, Tajikistan, Uzbekistan, Zambia, and Zimbabwe.
data sources and definitions of variables
Trade Flows
The overall trade data (and the GDP data used to obtain ratios) are from World Development Indicators (World Bank, 2007)27 and the IMF’s World Economic Outlook database. Data from these sources are combined and spliced to pro-duce the best possible coverage across countries and over time. The data on manufacturing and commodity trade (including fuel and nonfuel) are from the World Bank’s World Development Indicators database; missing values in these data are interpolated. Volumes of exports and imports of manufactures and commodities are created, respectively, by deflating the nominal values by the manufacturing unit value index and by the corresponding commodity price index (see below).
Foreign Capital
The data on the stocks of foreign direct investment (FDI), portfolio equity, and debt are from Lane and Milesi-Ferretti (2006).28 These data are extended back in time for several coun-
26Countries are classified as nonfuel commodity export-ers if nonfuel primary commodities constitute more than 50 percent of their exports.
27For more details on the World Development Indicators data, see http://go.worldbank.org/3JU2HA60D0.
28See www.imf.org/external/pubs/ft/wp/2006/wp0669.pdf for more information.
tries. The GDP data are from the World Bank’s World Development Indicators database and the IMF’s World Economic Outlook database, as above. Public and private external debt used in the event study are from the World Bank’s World Development Indicators database.
Manufacturing Unit Value
The United Nations’ Manufacturing Unit Value index (MUV) measures the unit values of exports of manufacturing goods (Standard Industrial Trade Classification, SITC, 5–8) by 24 developed market economies. The data are from UNCTAD’s Handbook of Statistics data-base29 and the IMF’s World Economic Outlook database.
Commodity Prices
Commodity price indices (overall, food and beverage, energy, and industrial inputs) are from the IMF’s Commodity Price System database.30 These price aggregates are available starting in 1980 and are extended back in time using available data on individual commod-ity prices and their weights in the aggregates. Country-specific export and import prices used in the regressions are 32 individual real com-modity prices geometrically weighted by the respective shares of exports and imports of these commodities in GDP, averaged over 1980–2006 (see the description of the commodity terms of trade below).
Commodity Terms of Trade
The country-specific commodity terms of trade are defined as a ratio of commodity export prices to commodity import prices, as follows:
TOTjt = ∏i (Pit/MUVt)Xij/∏
i (Pit/MUVt)Mij,
where Pit are individual commodity prices, MUVt is the manufacturing unit value index, Xij is the share of exports of commodity i in country j’s
29See www.unctad.org/Templates/Page.asp?intItemID=1890&lang=1 for more information.
30See www.imf.org/external/np/res/commod/index.asp for more information.

��
(average) total trade, and Mij is the share of imports of commodity i in country j’s (average) total trade.31
This terms-of-trade index uses prices of 32 individual commodities from the IMF’s Com-modity Price System database: shrimp, beef, lamb, wheat, rice, corn (maize), bananas, sugar, coffee, cocoa, tea, soybean meal, fish meal, hides, soybeans, natural rubber, hardlog, cotton, wool, iron ore, copper, nickel, aluminum, lead, zinc, tin, soy oil, sunflower oil, palm oil, coconut oil, gold, and crude oil.
Exports and imports of the individual com-modities are obtained from the United Nations’ COMTRADE database. These exports and imports are divided by total (average) trade, and the resultant shares are averaged over 1980–2006. For use in the event study and the regressions, the weights are further scaled by the share of (average) total trade in each country’s GDP (averaged over 1980–2006) from the World Bank’s World Development Indicators data-bases and the IMF’s World Economic Outlook database.
Bilateral Trade
Bilateral goods trade data are from the IMF’s Direction of Trade Statistics database. The data by sector are from the UNCOMTRADE database and use SITC Revision 3. The manufacturing sector combines SITC 5–8, excluding group 68 (nonferrous metals). The commodities sec-tor combines SITC 0–4, including 68. Missing values are interpolated. Volumes are obtained by deflating the nominal values by, respectively, the manufacturing unit value index and by the overall commodity price index, as above.
Trade Restrictions
Export repatriation, surrender require-ments, controls on FDI, and liquidation of FDI are from the IMF’s Annual Report on Exchange Arrangements and Exchange Restrictions (various years). Average tariff rate is the average of the
31See also Lee and others (2008), which uses a similar measure.
effective rate (the ratio of tariff revenues to import values) and the average unweighted tar-iff rates from a database prepared by IMF staff. In some cases, this series is based on either the effective rate or the average unweighted rate, depending on data availability; missing values are interpolated. The regressions use the Wacziarg and Welch (2003) index of trade openness, based on average tariff rates, average nontariff barriers, the average parallel market premium for foreign exchange, the presence of export marketing boards, and the presence of a socialist economic system (the index is equal to zero prior to liberalization and to unity from the beginning of liberalization).32
Capital Account Restrictions
One measure is from Chinn and Ito (2006)33 and is based on principal components extracted from several capital and current account restric-tion measures from the IMF’s Annual Report on Exchange Arrangements and Exchange Restrictions. Another measure is an updated version of Grilli and Milesi-Ferretti (1995) and includes restric-tions on capital account transactions from the IMF’s Annual Report on Exchange Arrangements and Exchange Restrictions.
Effective Exchange Rates and Overvaluation
The real and nominal effective exchange rates are from the IMF’s Information Notice System. The data are spliced with data from the World Bank’s World Development Indi-cators database to produce the best possible coverage across countries and over time. In the event study, effective exchange rates are measured as percent deviations from trend, based on the Hodrick-Prescott filter. In the regressions, the overvaluation measure uses the log difference of the real effective exchange rate from trend, calculated using the Hodrick-Prescott filter.
32For more details on the openness variable, see http://papers.nber.org/papers/w10152.pdf.
33For more information about this measure, see www.ssc.wisc.edu/~mchinn/Readme_kaopen163.pdf.
aPPendix 5.1. data and methodoloGy

ChaPter 5 Globalization, Commodity PriCes, and develoPinG Countries
��
Exchange Rate Flexibility
This is measured using the Reinhart-Rogoff coarse index of de facto exchange rate flex-ibility, collapsed to a three-value indicator (where 1 denotes a fixed or pegged exchange rate regime, 2 denotes an intermediate regime, and 3 denotes free float). The Reinhart-Rogoff classification takes into account the existence in some economies of dual rates or parallel markets, and uses the volatility of market-deter-mined exchange rates to classify an exchange rate regime statistically.34
Macroeconomic Policies and Institutions
Institutional quality is measured using the “executive constraint” variable from Marshall, Jag-gers, and Gurr’s Polity IV data set (2004).35 The variable follows a seven-category scale, with higher values denoting better checks and balances in place on the executive branch of the government. A score of 1 indicates that the executive branch has unlimited authority in decision making, and a score of 7 represents the highest possible degree of accountability to another group of at least equal power, such as a legislature. The general government balance and the current account balance are from the World Bank’s World Development Indicators database and the IMF’s World Economic Outlook database.
Key Macroeconomic Indicators
Real GDP, domestic investment, and public and private consumption are from the World Bank’s World Development Indicators database
and the IMF’s World Economic Outlook data-base. Data from these sources are combined and spliced to produce the best possible coverage across countries and over time.
Financial Development
This is measured using the ratio of private sector credit by banks and other financial
34For more details on the Reinhart-Rogoff index, see www.wam.umd.edu/~creinhar/Links.html.
35For more details on the Polity IV data set, see www.cidcm.umd.edu/polity.
institutions to GDP. The data are from Beck, Demirgüç-Kunt, and Levine’s Financial Develop-ment and Structure database (2007).36 In order to allow for nonlinearities, regressions employ both the level and the square of this variable.
Neighbors’ Trade Openness and Average Tariff Rate
The regressions use neighbors’ trade openness measured by the weighted average of the Waczi-arg and Welch (2003) index of trade openness (see above) in other countries. The event study uses neighbors’ average tariff rate measured by the weighted average of the average tariff rates (see above) in other countries. In both cases, the weights are related to other countries’ GDP in 2000 U.S. dollars and to the inverse of their distance from the country in question. Distances are great circle distances, computed using the geographic coordinates provided in the Central Intelligence Agency (CIA) World Factbook.37
Economic Remoteness
This is measured by (log) distances from a given country to other countries, weighted by other countries’ GDP in 2000 U.S. dollars rela-tive to total GDP of all other countries in 2000 U.S. dollars. The distances are great circle dis-tances computed using geographic coordinates provided in the CIA World Factbook.
Landlocked Status and Land Size
Landlocked status equals unity if a country has no coastline and zero otherwise. Land size is the area in square kilometers. These data are from the CIA World Factbook.
event study methodology
The event study of commodity price booms and busts uses the commodity terms of trade
36For more details on the Financial Development and Structure database, see http://go.worldbank.org/X23UD9QUX0.
37For more information, see https://www.cia.gov/library/publications/the-world-factbook/index.html.

��
described above. This measure is used to identify country-specific booms and busts during the period from 1970 to 2007. The dating procedure largely follows Cashin, McDermott, and Scott (2002) and is based on finding turning points (peaks and troughs) in the series.38 These turn-ing points are determined using annual coun-try-specific data, which means that the cycles cannot be too short and that their timing may differ from country to country. Once the turning points are found, their duration and amplitude (the cumulative change in the commodity terms of trade) from trough to peak and from peak to trough are computed. Then booms and busts are identified as periods of increases or decreases, respectively, in the commodity terms of trade with amplitudes that fall into the top quartile of all such episodes across the sample. This proce-dure yields 327 booms and 321 busts.
The current episode is treated in a similar manner although, because it is still ongoing, 2007 is taken as the peak year for all the coun-tries involved. Several peaks that occurred in 2006 are also considered part of the current boom. Its beginning is dated as the most recent country-specific trough that comes after the most recent peak. Then the associated coun-try-specific amplitudes are computed, and the booms are selected as episodes with the cumula-tive increases in the commodity terms of trade above the top quartile threshold, as described above. The result is 30 booms, of which 19 are happening in fuel exporters and 6 in nonfuel commodity exporters.
These country-specific booms and busts are the basis of the event study, the results of which are shown in Figure 5.11. For each variable of interest, the average annual percent change (average annual change in the case of effective exchange rates measured as percentage devia-tions from trend) is computed during each boom and each bust, subject to data availabil-ity. Then the medians of all such changes are obtained separately for past booms, past busts,
38See also Pagan and Sossounov (2003), who use a simi-lar approach to date equity price booms and busts.
and the current boom. Finally, the differences between the medians of past booms and busts and of the current and past booms are found and reported.
The event study focuses on three separate subsamples, in addition to the full sample of booms and busts: large booms, fuel exporters, and nonfuel commodity exporters. Large booms (busts) are defined as booms (busts) with ampli-tudes that fall into the top quartile of all booms (busts). By this definition, 17 of the current booms qualify as large. The definitions of fuel exporters and nonfuel commodity exporters are given above.
econometric analysis
The econometric analysis (see Tables 5.1–5.5) considers the following dependent variables.• Trade to GDP, Net Exports to GDP, Exports
to GDP, and Imports to GDP, in value terms (Table 5.1)
• Commodity Trade to GDP, Commodity Net Exports to GDP, Commodity Exports to GDP, and Commodity Imports to GDP, in value terms (Table 5.2)
• Trade to GDP, Net Exports to GDP, Exports to GDP, and Imports to GDP, in volume terms (Table 5.3)
• Commodity Trade to GDP, Commodity Net Exports to GDP, Commodity Exports to GDP, and Commodity Imports to GDP, in volume terms (Table 5.4)
• Broad Institutions, measured using the “exec-utive constraint” variable described above (Table 5.5)
• Trade Openness, measured using the Welch and Wacziarg (2003) index of trade openness (Table 5.5)
• Exchange Restrictions, measured using the mean of the restrictions on current and on capital account transactions, from the IMF’s Annual Report on Exchange Arrangements and Exchange Restrictions (Table 5.5)
• Exchange Rate Overvaluation (Table 5.5)Explanatory variables employed in the analysis
are as discussed above.
aPPendix 5.1. data and methodoloGy

ChaPter 5 Globalization, Commodity PriCes, and develoPinG Countries
�0
All cross-sectional regressions are estimated using average values over the period 1970–2005. Panel regressions are estimated using all avail-able five-year-average observations, starting in 1970, and use country-fixed effects.
Figure 5.12 is constructed as follows. First, each regression is estimated using the whole sample. Then, the sample is split into the 1980s and the 2000s, and mean values of the dependent and explanatory variables are calculated for each subsample. For each explanatory variable, the difference in its mean value across subsamples is multiplied by the relevant coefficient (estimated using the whole sample). This yields the contribution of the relevant explanatory variable to the (mean) difference of the dependent variable between decades.
referencesAkin, Çigdem, and M. Ayhan Kose, 2007, “Changing
Nature of North-South Linkages: Stylized Facts and Explanations,” IMF Working Paper 07/280 (Wash-ington: International Monetary Fund).
Anderson, Kym, Will Martin, and Dominique van der Mensbrugghe, 2006, “Market and Welfare Implica-tions of Doha Reform Scenarios,” in Agricultural Trade Reform and the Doha Development Agenda, ed. by Kym Anderson and Will Martin (New York: Palgrave Macmillan).
Baier, Scott L., and Jeffrey H. Bergstrand, 2007, “Do Free Trade Agreements Actually Increase Mem-bers’ International Trade?” Journal of International Economics, Vol. 71 (March), pp. 72–95.
Baldwin, Robert E., 2003, “Openness and Growth: What’s the Empirical Relationship?” NBER Work-ing Paper No. 9578 (Cambridge, Massachusetts: National Bureau of Economic Research).
Beck, Thorsten, Asli Demirgüç-Kunt, and Ross Levine, 2000 (revised: October 17, 2007), “A New Data-base on Financial Development and Structure,” World Bank Economic Review, Vol. 14 (September), pp. 597–605. Available via the Internet: www.econ.worldbank.org/staff/tbeck.
Berg, Andrew, and Anne Krueger, 2003, “Trade, Growth, and Poverty: A Selective Survey,” IMF Working Paper 03/30 (Washington: International Monetary Fund).
Blattman, Christopher, Jason Hwang, and Jeffrey G. Williamson, 2007, “Winners and Losers in the Commodity Lottery: The Impact of Terms of Trade Growth and Volatility in the Periphery 1870–1939,” Journal of Development Economics, Vol. 82 (January), pp. 156–79.
Broda, Christian, and David Weinstein, 2004, “Global-ization and the Gains from Variety,” NBER Working Paper No. 10314 (Cambridge, Massachusetts: National Bureau of Economic Research).
Cashin, Paul, and C. John McDermott, 2002, “The Long-Run Behavior of Commodity Prices: Small Trends and Big Variability,” IMF Staff Papers, Vol. 49 (July), pp. 175–99.
———, and Alasdair Scott, 2002, “Booms and Slumps in World Commodity Prices,” Journal of Development Economics, Vol. 69 (October 1), pp. 277–96.
Cashin, Paul, Luis F. Céspedes, and Ratna Sahay, 2004, “Commodity Currencies and the Real Exchange Rate,” Journal of Development Economics, Vol. 75 (October), pp. 239–68.
Chen, Yu-chin, and Kenneth Rogoff, 2003, “Commod-ity Currencies,” Journal of International Economics, Vol. 60 (May), pp. 133–60.
Chinn, Menzie, and Hiro Ito, 2006, “What Matters for Financial Development? Capital Controls, Institu-tions, and Interactions,” Journal of Development Economics, Vol. 81 (October), pp. 163–92. Available via the Internet: www.web.pdx.edu/~ito.
Collier, Paul, and Benedikt Goderis, 2007, “Commod-ity Prices, Growth, and the Natural Resource Curse: Reconciling a Conundrum,” CSAE Working Paper No. 2007-15 (Oxford: University of Oxford, Center for the Study of African Economies). Available via the Internet: www.csae.ox.ac.uk/workingpapers/pdfs/2007-15text.pdf.
Corden, W. Max, 1984, “Booming Sector and Dutch Disease Economics: Survey and Consolidation,” Oxford Economic Papers, Vol. 36 (November), pp. 359–80.
———, and J. Peter Neary, 1982, “Booming Sec-tor and De-Industrialisation in a Small Open Economy,” Economic Journal, Vol. 92 (December), pp. 825–48.
Cravino, Javier, Daniel Lederman, and Marcelo Olarreaga, 2007, “Substitution Between Foreign Capital in China, India, the Rest of the World, and Latin America: Much Ado about Nothing?” Policy Research Working Paper No. 4361 (Washington: World Bank).

��
Deaton, Angus, 1999, “Commodity Prices and Growth in Africa,” Journal of Economic Perspectives, Vol. 13 (Summer), pp. 23–40.
———, and Ronald Miller, 1996, “International Commodity Prices, Macroeconomic Performance, and Politics in Sub-Saharan Africa,” Journal of African Economies, Vol. 5 (October), pp. 99–191.
Dell’Ariccia, Giovanni, Julian di Giovanni, André Faria, M. Ayhan Kose, Paolo Mauro, Jonathan Ostry, Martin Schindler, and Marco Terrones, 2007, “Reaping the Benefits of Financial Globalization” (Washington: International Monetary Fund). Avail-able via the Internet: www.imf.org/external/np/res/docs/2007/0607.htm.
Dollar, David, and Aart Kraay, 2003, “Institutions, Trade, and Growth,” Journal of Monetary Economics, Vol. 50 (January), pp. 133–62.
———, 2004, “Trade, Growth, and Poverty,” Economic Journal, Vol. 114 (February), pp. F22–F49.
Edwards, Sebastian, 1993, “Openness, Trade Liber-alization, and Growth in Developing Countries,” Journal of Economic Literature, Vol. 31 (September), pp. 1358–93.
———, and Jonathan Ostry, 1990, “Anticipated Pro-tectionist Policies, Real Exchange Rates, and the Current Account: The Case of Rigid Wages,” Journal of International Money and Finance, Vol. 9 (June), pp. 206–19.
Frankel, Jeffrey A., and David Romer, 1999, “Does Trade Cause Growth?” American Economic Review, Vol. 89 (June), pp. 379–99.
Goldstein, Andrea, Nicolas Pinaud, Helmut Reisen, and Xiaobao Chen, 2006, “The Rise of China and India: What’s in It for Africa?” OECD Development Center Study (Paris: Organization for Economic Cooperation and Development).
Grilli, Vittorio, and Gian Maria Milesi-Ferretti, 1995, “Economic Effects and Structural Deter-minants of Capital Controls,” Staff Papers, Inter-national Monetary Fund, Vol. 42 (September), pp. 517–51.
Hallaert, Jean-Jacques, 2006, “A History of Empirical Literature on the Relationship Between Trade and Growth,” Mondes en Développement, Vol. 34 (March), pp. 63–77.
Harding, Don, and Adrian Pagan, 2006, “Synchroni-zation of Cycles,” Journal of Econometrics, Vol. 132, No. 1, pp. 59–79.
Harrison, Ann, and Helena Tang, 2005, “Trade Liber-alization: Why So Much Controversy?” in Economic Growth in the 1990s: Learning from a Decade of Reform,
ed. by N. Roberto Zagha (Washington: World Bank), pp. 131–56.
Henry, Peter B., 2007, “Capital Account Liberalization: Theory, Evidence, and Speculation,” Journal of Eco-nomic Literature, Vol. 45 (December), pp. 887–935.
Heston, Alan, Robert Summers, and Bettina Aten, 2006, “Penn World Table Version 6.2,” Center for International Comparisons of Production, Income and Prices at the University of Pennsylvania (Philadelphia: University of Pennsylvania, Septem-ber). Available via the Internet: pwt.econ.upenn.edu/php_site/pwt_index.php.
International Monetary Fund (IMF), 2007a, Regional Economic Outlook: Sub-Saharan Africa, April (Washington).
———, 2007b, Regional Economic Outlook: Asia and Pacific, October (Washington).
Ishii, Shogo, Karl Habermeier, and others, 2002, “Cap-ital Account Liberalization and Financial Sector Sta-bility,” IMF Occasional Paper No. 211 (Washington: International Monetary Fund).
Johnson, Simon, Jonathan D. Ostry, and Arvind Subramanian, 2007, “The Prospects for Sustained Growth in Africa: Benchmarking the Constraints,” NBER Working Paper No. 13120 (Cambridge, Massachusetts: National Bureau of Economic Research).
Kose, M. Ayhan, Eswar S. Prasad, Kenneth Rogoff, and Shang-Jin Wei, 2006, “Financial Globalization: A Reappraisal,” IMF Working Paper 06/189 (Washing-ton: International Monetary Fund).
———, 2008, “Financial Globalization and Economic Policies,” forthcoming IMF Working Paper (Wash-ington: International Monetary Fund).
Krueger, Anne, 1998, “Why Trade Liberalisation Is Good for Growth,” Economic Journal, Vol. 108 (Sep-tember), pp. 1513–22.
Lane, Philip R., and Gian Maria Milesi-Ferretti, 2006, “The External Wealth of Nations Mark II: Revised and Extended Estimates of Foreign Assets and Liabilities, 1970–2004,” IMF Working Paper 06/69 (Washington: International Monetary Fund).
Lederman, Daniel, Marcelo Olarreaga, and Isidro Soloaga, 2007, “The Growth of China and India in World Trade: Opportunity or Threat for Latin America and the Caribbean?” Policy Research Working Paper No. 4320 (Washington: World Bank).
Lee, Jaewoo, Gian Maria Milesi-Ferretti, Jonathan Ostry, Alessandro Prati, and Luca Antonio Ricci, 2008, Exchange Rate Assessments: CGER Methodologies,
referenCes

ChaPter 5 Globalization, Commodity PriCes, and develoPinG Countries
��
IMF Occasional Paper No. 261 (Washington: Inter-national Monetary Fund).
Marshall, Monty, Keith Jaggers, and Ted Gurr, 2004, “Polity IV Project: Political Regime Characteris-tics and Transitions, 1800–2004” (College Park, Maryland: University of Maryland, Center for International Development and Conflict Manage-ment). Available via the Internet: www.cidcm.umd.edu/polity.
Ostry, Jonathan, 1988, “Balance of Trade, Terms of Trade, and Real Exchange Rate: An Intertemporal Optimizing Framework,” Staff Papers, International Monetary Fund, Vol. 35, pp. 541–73.
———, and Andrew Rose, 1992, “An Empirical Evalu-ation of the Macroeconomic Effects of Tariffs,” Journal of International Money and Finance, Vol. 11 (February), pp. 63–79.
Pagan, Adrian R., and Kirill A. Sossounov, 2003, “A Simple Framework for Analysing Bull and Bear Markets,” Journal of Applied Econometrics, Vol. 18 (January/February), pp. 23–46.
Prebisch, Raul, 1950, “The Economic Development of Latin America and Its Principal Problems” (New York: United Nations).
Quinn, Dennis, and A. Maria Toyoda, 2006, “Does Capital Account Liberalization Lead to Growth?” (unpublished; Washington: Georgetown Uni-versity). Available via the Internet: faculty.msb.edu/quinnd/papers/capital_liberalization_growth_Dec2006.pdf.
Reinhart, Carmen, and Kenneth Rogoff, 2004, “The Modern History of Exchange Rate Arrangements: A Reinterpretation,” Quarterly Journal of Economics, Vol. 119 (February), pp. 1–48.
Rodriguez, Francisco, and Dani Rodrik, 2002, “Trade Policy and Economic Growth: A Skeptic’s Guide to the Cross-National Evidence,” in NBER Macro-economics Annual 2000, ed. by Ben S. Bernanke and Kenneth Rogoff (Cambridge, Massachusetts: MIT Press).
Singer, Hans W., 1950, “The Distribution of Gains between Investing and Borrowing Countries,” American Economic Review, Papers and Proceedings, Vol. 40 (May), pp. 473–85.
United Nations Conference on Trade and Develop-ment (UNCTAD), 2007, World Investment Report 2007: Transnational Corporations, Extractive Industries and Development (New York).
van der Ploeg, Frederick, 2006, “Challenges and Opportunities for Resource Rich Economies,” CEPR Discussion Paper No. 5688 (London: Centre for Economic Policy Research).
Wacziarg, Romain, and Karen Horn Welch, 2003, “Trade Liberalization and Growth: New Evidence,” NBER Working Paper No. 10152 (Cambridge, Massachusetts: National Bureau of Economic Research).
Winters, L. Alan, 2004, “Trade Liberalisation and Economic Performance: An Overview,” Economic Journal, Vol. 114 (February), pp. F4–F21.