figures for chapter 7 advanced signal processing dillon (2001) hearing aids
TRANSCRIPT

Figures for Chapter 7
Advanced signal processing
Dillon (2001)
Hearing Aids

Front(a)
Output
+ -T
Figure 7.1 (a) Block diagram of a subtractive directional microphone comprised of either a single microphone with two ports, or two separate microphones with one port each. The negative sign next to one of the inputs of the summer indicates that the two signals are subtracted. (b) A delay-and-add directional microphone array with four ports.
Source: Dillon (2001): Hearing Aids
Fixed directional arrays
Subtractive array
Front
(b) + T ++Output
TT
Additive array
-40
-30
-20
-10
0
10
100 1000 10000
Frequency (Hz)
Fro
ntal
res
pons
e (d
B)
300 300
20 mm
8 mm
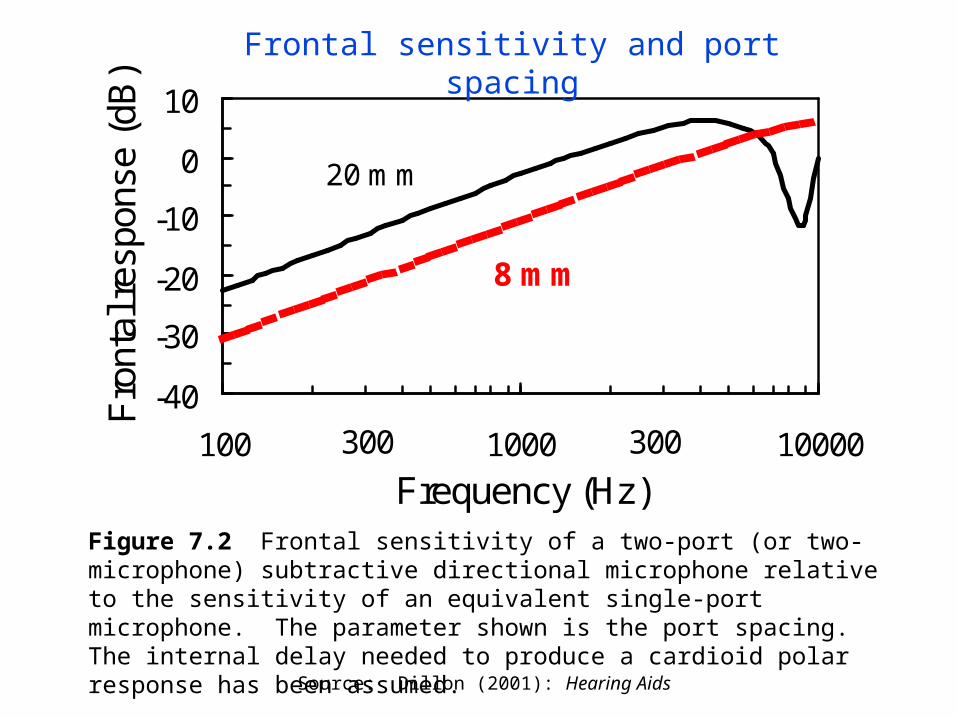
Figure 7.2 Frontal sensitivity of a two-port (or two-microphone) subtractive directional microphone relative to the sensitivity of an equivalent single-port microphone. The parameter shown is the port spacing. The internal delay needed to produce a cardioid polar response has been assumed.
Source: Dillon (2001): Hearing Aids
Frontal sensitivity and port spacing

Figure 7.3 End-fire and broadside microphone arrays.
SourceArray
electronics
Output
Broadsidearray
Source
Array electronicsOutput
Endfire array
Source: Dillon (2001): Hearing Aids

Adapter
Front
Output
+ -T
Figure 7.4 A simple adaptive directional microphone with steerable nulls.
Source: Dillon (2001): Hearing Aids
Adaptive directional microphone

Figure 7.5 The Widrow Least Mean Squares adaptive noise reduction scheme, based on a reference microphone that picks up only the noise. The fixed delay compensates for the delay inherent in the adaptive filter.
Speech+
Noise
-
+
Noise
Delay
Source: Dillon (2001): Hearing Aids
Widrow LMS noise reduction

Figure 7.6 A Griffiths-Jim adaptive noise canceller, whereby the two microphone outputs are added in the top chain but subtracted in the bottom chain.
+
+
-
+Front
Left
Right
-
+Delay
Source: Dillon (2001): Hearing Aids
Griffiths Jim adaptive noise reduction

0
5
10
15
20
25
30
Conf room Living room Anechoic
SR
T im
pro
vem
en
t (d
B)
3 mics
7 mics
Figure 7.7 Improvement in speech reception threshold for an adaptive array relative to a single microphone. The experiment used frontal speech and a single noise masker at 45 degrees from the front in three simulated environments that differed in the amount of reverberant sound relative to the direct sound. From Hoffman et al (1994).
Source: Dillon (2001): Hearing Aids
Microphone array benefit

Figure 7.8 Blind source separation of two sources, S1 and S2, occurs when the two adaptive filters, G1 and G2, adapt to the response shapes that compensate for the room transmission characteristics, R1, R2, R3 and R4, from each source to each microphone. Note that everything to the right of the dotted line is in the hearing aid, whereas the blocks to the left are the transfer functions of the transmission paths within the room. When properly adapted, the response of G1 = R3/R1 and G2 = R4/R2. The output Y1 then does not contain any components of S2. The blocks G1 and G2 can alternatively be feed-forward blocks rather than feed-back blocks.
+S1
S2
+
+
AdaptorG
2
G1
R1
R4
R3+
+
+R2
Y1
Y2
Source: Dillon (2001): Hearing Aids
Blind source separation

Figure 7.9 A Wiener Filter incorporating a Fourier Transform (F.T) to calculate the spectrum of the combined speech and noise. A speech/non-speech detector classifies the spectrum as noise or speech plus noise, and thus enables the average spectral power of the speech to be estimated.
Averager
F.T.
Speech/non-speechdetector
Averager
-
+
Avg speech
Spectrum
Avg speechplus noisespectrum
Speechplusnoise
Switch
Input
÷
Noise
Source: Dillon (2001): Hearing Aids
Wiener filter noise reduction

Figure 7.10 A Spectral Subtraction noise reduction system incorporating a Fourier Transform to calculate the power spectrum, a speech/non-speech detector to enable the average spectral power of the noise to be estimated, and an Inverse Fourier Transform to turn the corrected spectrum back into a
waveform.
Speech/non-speechdetector
Switch Averager-
+F.T.
Avg noiseSpectrum
Phase
I.F.T.Magnitude
Source: Dillon (2001): Hearing Aids
Spectral Subtraction

0
10
20
30
40
Frequency (Hz)
He
arin
g a
id g
ain
(d
B)
8000400020001000500250125
Figure 7.11 The gain-frequency response of a (hypothetical) four-channel hearing aid, where feedback oscillationhas been avoided by decreasing the gain of the band from 2 kHz to 4 kHz (solid line) from the original response (dotted line).
Source: Dillon (2001): Hearing Aids
Feedback management

-40
-30
-20
-10
0
100 1000 10000Frequency (Hz)
Loop
gai
n (d
B)
300 3000
-180
-90
0
90
180
100 1000 10000Frequency (Hz)
Loop
pha
se (
degr
ees)
300 3000
Figure 7.12 Gain-frequency and phase-frequency response of the complete feedback loop for an ITE hearing aid. Redrawn from Hellgren et al., (1999).
Source: Dillon (2001): Hearing Aids
Feedback-loop response

Figure 7.13 Internal feedback path added to cancel the effects of the external, unintentional leakage path.
Internal feedback path
-
External leakage path
+
Source: Dillon (2001): Hearing Aids

Frequency
Inte
nsity
Frequency
Inte
nsity
1000250 4000
1000250 4000
Figure 7.14 Input and output spectra for a frequency transposition scheme in which the output frequency equals half the input frequency. The amplifier also provides some high frequency pre-emphasis. The arrows show the reduction in frequency of each formant.
Source: Dillon (2001): Hearing Aids
Transposition

Time (seconds)
Spectral enhancement
Figure 7.15 Spectrograms of the syllable /ata/ (a) unprocessed and (b) spectrally enhanced, showing more pronounced formants (Fisher, Dillon & Storey, in preparation).
Fre
quen
cy (
kHz)
(b)
Time (ms)
0
2
4
0
2
4
0 200 400 600 800
(a)
Source: Dillon (2001): Hearing Aids