file copy memorandum on the current economic position...
TRANSCRIPT
Report No. 1315-AL FILE COPYMemorandum on the Current EconomicPosition and Prospects of Algeria(In Two Volumes)
Vol. 1: Main ReportJanuary 25, 1977
EMENA RegionCountry Programs Department II
FOR OFFICIAL USE ONLY
Document of the World Bank
This document has a restricted distribution and may be used by recipientsonly in the performance of their official duties. Its contents may nototherwise be disclosed without World Bank authorization.
Pub
lic D
iscl
osur
e A
utho
rized
Pub
lic D
iscl
osur
e A
utho
rized
Pub
lic D
iscl
osur
e A
utho
rized
Pub
lic D
iscl
osur
e A
utho
rized
Pub
lic D
iscl
osur
e A
utho
rized
Pub
lic D
iscl
osur
e A
utho
rized
Pub
lic D
iscl
osur
e A
utho
rized
Pub
lic D
iscl
osur
e A
utho
rized

CURRENCY EQUIVALENTS
(Algerian Dinars per US dollar)
Official TradeExchange conversion
Period Rate 1/ Factor 2/
1970 4.937 4.937
1971 4.644 4.913
1972 4.556 4.484
1973 4.185 3.959
1974 3.997 4.181
1975 4.125 3.949
October. 1976 4.183 4.162
1/ End of period
2/ Average of period
Source: IMF, International Financial Statistics, December 1976.

FOR OFFICIAL USE ONLY
MEMORANDUM ON THE
CURRENT ECONOMIC SITUATION AND PROSPECTS OF ALGERIA
Table of Contents
Page No.
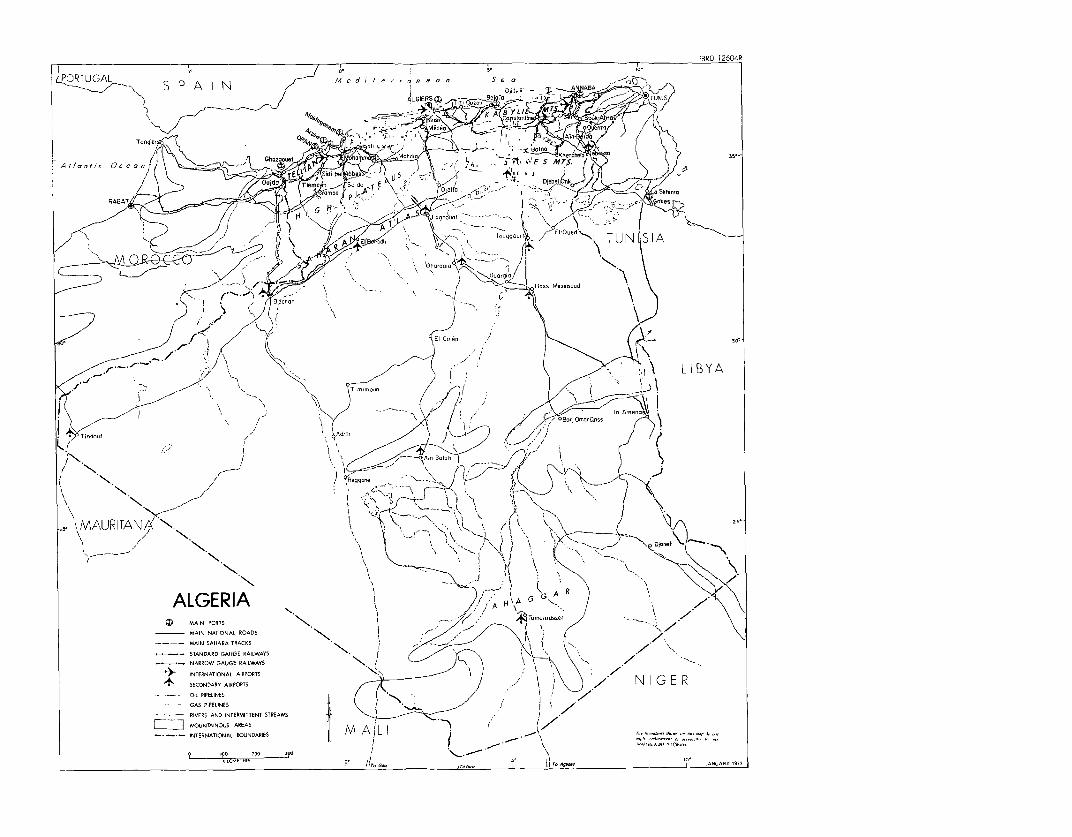
MAP
BASIC DATA
SUMMARY AND CONCLUSIONS
I. INTRODUCTION ............................................. 1
II. ECONOMIC PERFORMANCE IN 1974-75 AND THE SITUATION IN 1976. 2
Investment and Production. . . 2Population and Employment. . . 9Savings and External Deficit .. .11
Balance of Payments . . .12External Debt and Debt Service . . .16Public Finances . . .17Money, Credit and Prices . . .21
The Situation in 1976 . . .22
III. DEVELOPMENT OBJECTIVES AND PROSPECTS. ... .. 27
Development Objectives .. 27Economic Prospects ......... 30Financial Prospects .. 38
ANNEX I Estimate of National Accounts at Constant Prices
ANNEX II Recent Progress and Prospects of Industrialization
STATISTICAL ANNEX
This report is based on the findings of an economic mission which visitedAlgeria in April 1976. The mission was composed of Messrs. Christian Merat(chief), Francois Laporte (general economist), and Marc Ollivier (industrialeconomist).
This document has a restricted distribution and may be used by recipients only in the performanceof their official duties. Its contents may not otherwise be disckeed without Wofid Bank authorization.

EBRD 12604R
PORTUGAL Me ite rian so o Seo
f. N. X z 9 t - > i ' TU 51Ad-d
MAIN NATT bNA
ROADS
v f o/~~~~~~MAN SHARA TRACKS7
INTRRNATIONAL ARPORTS~ ~ ~ ~ ~ ~ ~~~~~~~~~L BY MAURRIV T AN INTER STM a
ALGERIA RR i; A R
1Z MA N PORTS \8; ', O rasrv* MAIN NATONAL ROARS [ | ,
-- -MAIN SAHARA TRACKS ' w / _ /\
b | E STANDARD GAUGE RAlLWAYI \. OTT..NARROW GAU)GE RAILWAYS \ / ~ }R\ \
* INTERNATIONAt AIRPORTS N. G F R\ \ + SECONDARY AIRPORTS ~
_- OIL PPELINES i * .
-- GAS PIPELINES t' t> | ] \ ,
- RIVERS AND INTERMITTENT STREAMS -F>. / ,
MoUNTANouS AREAS AA AI) K;--- INTERNATIONAL EOUNDARIES /V|f g>lh .srd
-METIR~~ <1.15 1 ... <,,


Page I of 2 pages
COUNTRY DATA ALGERIA
AREA (1,000 Km2): 2,381.7 POPULATION: 15.7 million DENSITY: 6.6 per Km2
POPULATION CHARACTERISTICS (1975) EDUCATION (1972)Crude Birth Rate (per 1,000) 48.7 Adjusted primary school enrollment ratio 85.0Crude Death Rate (per 1,000) 15.4 Adjusted secondary school enrollment ratio i/ 15.0Gross Reproduction Rate 3.5 Vocational enrollment (% of secondary) 19.0
Adult Literacy rate (%) (1970) 26.0Population growth rate, total (1970-75) 3.2
urban (1970-75) 6.7Urban Popuilation (% of total) 50.4 HOUSING AND CONSUMPTION (1973)
Persons per room (average)Age structure (%) 0 to 14 years 48.0 Occupied dwellings without piped water (%)
15 to 64 years 48.8 Access to electricity (% of all dwellings)65 years and over 3.2 Electricity (Kwh/yr per capita) (1974) 200.0
Radio receivers (per 1,000 pop.) 46.0Passenger cars (per 1,000 pop.) 12.0
HEALTH AND NUTRITION (1972)Population per physician 7,809.0Population per hospital bedPer capita calorie supply as % of
requirements 72.0Per capita protein supply (grams per day) 46.0
GNP PER CAPITA IN 1975 : US$ 780
US dollar millions - 1975 prices andNATIONAL ACCOUNTS exchange rates Annual Growth Rates
19197 73~ 1975 AGDP-1975 1971-73 1974 1975Gross domestic product 9,387 12,039 13,067 100.0 13.2 4.0 4-3Gains from terms of trade -1,734 - 1,572Gross domestic income 7,653 10,467 13,067 100.0 17.0 29.5 -3.6
Imports 3,120 4,532 6,802 52.0 20.5 24.5 20.6Exports (import capacity) 2,091 3,081 4,938 37.8 21.6 91.8 -16.4Resource gap 1,029 1,451 1,864 14.2
Consumption expenditures 5,324 6,460 7,587 58.o 10.2 5.9 10.9Investment (mncl. stocks) 3,115 4,802 7,344 56.2 24.3 31.0 16.8
Domestic savings 2,086 3,351 5,480 41.9 26.8 95.6 -16.4National savings 2,387 3,786 5,569 42.6 25.8 70.3 -13.6
OUTPUT. LABOR FORCE ANDPRODUCTIVITY IN 1975
Value Added Labor Force V.A. per worker(USS Mln.) % Thousand us$
Agriculture i/ 937 7.5 1,510 49.6 620 A9Industry 7,318 58.0 435 14.3 16,822 406.2- Hydrocarbons 3,975 31.5 35 1.2 113,571 2,742.6- Others 3,343 26.5 400 13.1 8,357 201.8Services 4 356 34.5 901 29.6 4,834 116.7Unemployed / . . 199 6.5
Total 12,611 100.0 3,045 100.0 4,141 100.0
GOVERNMENT FINANCECentral Government
(Dinar Mln.) of GOP
1974 1975 19274 1975 1971-73
Current revenue 23,417 25,372 49.0 49.2 33.7- Petroleum (13,402) (13,462) (28.1) (26.1) (11.1)- Other (10,015) (11,910) (20.9) (23.1) (22.7)Current expenditure 8.501 13,231 17.8 25.6 19.9Current surplus 14,916 12,141 3T12 23.5 13Capital expenditure 13,016 18,578 27.2 36.0 22.3- Central government investment (4,130) (5,505) (8.6) (10-7) (10.9)- Capital transfer to public (8,886) (13,073) (18.6) (25.3) (11.4)
Enterprises j/
External borrowing (net) - 159 18 -0.3 - -0.4
1/ 12-18 years of age
! The per capita GNP estimate is that of the World Bank Atlas:/ Data at 1975 prices and exchange rates are Bank estimates| Includes part-time workers5/ Includes only non-agricultural unemployed./ Includes investment loan disbursement allocations for the working capital of enterprise, and enterprises'debt rescheduling.

Page 2 of 2 Pages
COUNTRY DATA ALGERIA
MONEY, CREDIT AND PRICES 1971 1972 1973 1974 1975(Millions Dinar, end of period)
Money and Quasi Money 13,925 18,139 20,362 24,955 32,357
Claims on Government (net) 5,974 5,236 5,198 3,941 7,314
Claims on the Economy 8,068 13,611 15,897 21,851 29,009
(percentage or index numbers)
Money and Quasi Money as % of GDP 62.2 67.9 64.6 52.2 62.7
General Price Index 1/ 100.0 98.0 109.8 159.9 165.6
Retail Price Index 100.0 103.7 110.0 117.2 130.0
Annual percentage change in:
General Price Index .. -2.0 12.0 45.6 3.6
Retail Price Index 9.6 3.7 6.1 6.5 10.9
Claims on Government (net) - -12.4 -0.7 -26.1 90.4
Claims on the Economy 25.0 68.7 16.8 37.5 32.8
BALANCE OF PAYMENTS 1971 1972 1973 1974 1975(US$ Millions)
Exports of Goods, NFS 973 1,361 2,108 4,935 4,936
Imports of Goods, NFS 1,274 1.672 2.713 4,477 6560
Resource Gap (deficit = -) -301 -311 -605 458 -1,624
Interest Payments (net) -16 -30 -63 -70 -161
Workers' Remittances (net) 157 184 176 156 201
Other Factor Payments (net) -40 -3 -2 -383 -
Net Transfers 139 38 50 -1 24
Balance on Current Account -61 -122 -444 160 -1,560
Direct Foreign Investment -46 18 51 360 50
Net MLT Borrowing 153 182 960 165 1,538
Disbursements 225 293 1,122 632 1,893
Amortization -72 -111 -162 -467 -355
Other Capital (net) -42 71 37 -524 -246
Increase in Reserves (+) 4 149 604 160 -128
Net Reserves (end of year) 329 482 1,096 1,315 1,066
MERCHANDISE EXPORTS Average 1971-73 1974 1975
US$ Mln. % US$ Mln. % US$ Mln. %
Crtude Oil 1,021 75.4 3,645 85.6 3,495 83.7
Refined Oil Products 36 2.7 237 5.6 277 6.6
Gas 38 2.8 57 1.3 82 2.0
Wine 101 7.5 113 2.7 56 1.3
Fruits, citrus fruits & vegetables 21 1.6 31 0.7 43 1.0
Iron, ore, phosphate and other
minerals 32 2.3 50 1.2 53 1.3
Metal and Metal Products 17 1.3 33 0.7 54 1.3
Others 87 6.4 92 2.2 115 2.8
Total Merchandise Exports 1,353 100.0 4,258 100.0 4,175 100.0
IBRD Lending, Sept. 30, 1976 (Mln. US$) EXTERNAL DEBT, December 31, 1975 (Mln. US$)
Outstanding and Disbursed 73.1 Public Debt, Incl. Guaranteed 9,003
Undisbursed 307.4 Total Outstanding and disbursed 4,527
Outstanding incl. Undisbursed 380.5 DEBT SERVICE RATIO 1973 1974 1975
In % of Exports of Goods, NFS 14.4 14.5 11.9
In % of Exports of Goods, NFS 13.3 14.0 11.4
and workers remittances
In % of Government Revenues 10.9 12.7 9.1
1/ GDP deflator, Bank estimate. December, 1976~~~~~~~~ ~~~~~~~- nil or negligible
not availablenot applicable
SUMMARY AND CONCLUSIONS
i. In 1974 and 1975, Algeria continued to execute the second four-yearPlan, 1974-77, which aims at a sharp acceleration in the implementation ofthe country's long-term development strategy. Based on the increased receiptsderiving from the new relative prices for oil and gas, the Plan calls for aconsiderable acceleration in investment growth to broaden the productive baseof the economy, a marked shift in investment composition in favor of sectorsother than industry, and a substantial improvement in the employment ofunskilled workers and in the living standards and consumption of the dis-advantaged social groups, especially the agricultural population. Moreover,the Plan provides for the vigorous and systematic implementation of thepolicies that have been introduced since 1971 to decentralize and improveeconomic management at all levels.
ii. Mid-way through the Plan period at the end of 1975, the country hadscored solid successes for investment and employment by comparison with thePlan objectives. Investment doubled from US$3.3 billion in 1973 to US$6.4billion in 1975 at current prices, reflecting the dynamism of the Governmentand public enterprises. Employment creation has also been substantial. Inthe nonagricultural sectors, it exceeded the increase in the labor force,and the unemployment rate dropped 4 points (11 percent in 1975 and 9 percentexpected in 1976, as compared with 15 percent in 1973). In the agriculturalsector, the Agrarian Revolution cooperatives now provide permanent new jobs tosome 100,000 beneficiaries. Although precise data are lacking, it seems thatthe increase in permanent employment, coupled with the tax and budget measurestaken by the Government in 1974 and 1975 (especially the tax relief measures,the higher producer prices for agricultural products, the price subsidisationof basic commodities, and the expenditures on rural public services) havegreatly helped to raise, as planned, the living standards and consumptionlevels of the least privileged population groups.
iii. Of perhaps even greater importance for the country's long-termdevelopment prospects, initial measures to decentralize and improve economicmanagement have been implemented with vigour, as envisaged in the Plan.Although much remains to be done, there is clear evidence of this policy inthe productive sectors and at local government level. The National Charterapproved by referendum in June 1976 gives this policy quasi-constitutionalstatus. With the rapid growth of the number of technicians and middle levelmanagers graduating from educational and training institutions, the improve-ments already made in the institutional framework of the economy seem toindicate that Algeria may gradually gain a satisfactory command of its invest-ments, which should enable it to attain a rate of rapid economic growth.
iv. Some less favorable economic developments should also be noted.For technical and commercial reasons, receipts from oil and gas exports didnot reach the level expected in the Plan. The rate of investment in sectorsother than industry proved insufficient. Consequently, some of the imbalancesthat have affected Algeria's development, persisted. Investment became very

- ii -
high in relation to GDP (49 percent in 1975) and, especially, to the availabil-ity of skilled labor. In conjunction with the shortfall in oil and gas re-ceipts and the expansion of private consumption, pressure on the country'sfinancial resources increased sharply. After a surplus in 1974, the balanceof payments current account showed a deficit of US$1.6 billion in 1975, morethan 12 percent of GDP. Despite increased external borrowing, the country'snet reserves fell by US$250 million in 1975. Government transactions alsoshowed a deficit in 1975. Industrial development continued at a very rapidpace, compared with that of most other sectors, and bottlenecks persisted,especially in infrastructure, housing and urban public services. Finally, out-put growth was rather slow in relation to investment and employment creation.
v. Aware of the consequences of these imbalances, the Governmentdecided to stabilize investment in 1976 and begin redressing its compositionin favor of the lagging sectors. Industrial investment was to be held at thesame level as in 1975, while investment in other sectors would be stepped upmore rapidly. In addition, the Government has undertaken to reduce theoverall budget deficit. These decisions, combined with the marked accelera-tion of output growth and exports since the last quarter of 1975 (particularlyin the oil and gas sector), are enabling Algeria to keep the domestic andexternal financial situation under control. Import requirements have beenslowing down in 1976, and external borrowing needs have been diminishingsomewhat.
vi. After 1976, this report foresees a relatively rapid grQwth of theeconomy (by about 8.5 percent yearly on average during the 1976-80 period),which would be accompanied by relatively large needs for external financing.This forecast is based on a conservative appraisal of the prospects open tothe oil and gas sector and the results that can be expected from the develop-ment policies pursued by Algeria.
vii. The prospects for the oil and gas sector, which accounted for 84 per-cent of exports and 30 percent of GDP in 1975, seem assured in both quantitiesand prices. The sector's export receipts may reach the following amounts (inbillions of US dollars):
Actuals Projections1973 1975 1976 1980 1985
Constant 1975 prices 4.4 4.0 4.4 5.9 7.0
Current prices 2.7 4.0 4.7 9.5 17.6
Price index (1975 - 1.0) 0.6 1.0 1.1 1.6 2.5
The share of liquefied natural gas in total export receipts at current priceswould rise due to projected increases in export quantities and prices for thisproduct, based on the sales contracts recently signed by Algeria.
- iii -
viii. Investment requirements of the Algerian economy are expected toremain large. Considerable amounts will be needed to develop hydrocarbonexports, particularly gas. In other economic sectors, investments would alsoneed to be substantial, partly because of the Algerian planners' choice ofcapital intensive production processes, and especially because of investments(in physical infrastructure, water development, housing and urban publicservices, for example) which must be made to ease the constraints on the useof existing or planned production capacities. In view of these investmentneeds, the Government is expected to pursue a dynamic investment policy. Atthe same time, however, the policy of overall and sectoral balance developedin 1976 would be maintained. Projected investments would rise moderately inthe years ahead, while representing an optimum in relation to expected devel-opments in the country's financial resources and absorptive capacity (in termsof acceptable economic efficiency). They would grow yearly by 7% in 1976-80,with most of the increase allocated for development of gas exports. From 1980to 1985, investment requirements for gas development would diminish so thattotal investment would grow only slowly (about 3 percent p.a.), while therewould be room for satisfactory increases in other sectors. Fixed investmentwould gradually decline from 49 percent of GDP in 1975 to 34 percent in1985.
ix. The policies aimed at improving economic efficiency refer inparticular to the following areas:
- training of technicians and middle level management staff,where very substantial efforts are being made but willprobably leave unsatisfied needs throughout the periodunder review;
- preparation, implementation and initial operation of projects,where recent efforts indicate that a generally improvingsituation should emerge in the years to come;
- intersectoral and intrasectoral coordination of projects,where balancing investment needs may be considerable, buthave not yet been systematically identified;
- price policy and its impact on the financial situation ofenterprises;
- detailed preparation of the procedures for decentralization,which involves shifting the focus of central supervisionfrom day-to-day management to programming and follow-up ofthe operations of decentralized-enterprises and institutions;
- the role to be played by financial institutions in the de-centralized management structures.
On the basis of a qualitative appraisal of these factors, a relatively highincremental capital-output ratio (5.3 in 1976-80 and 5.7 in 1981-85) isprojected.
- iv -
x. Financially, the projection implies a required sustained effort tomobilize domestic and external savings. Budgetary savings, which do notoriginate in the hydrocarbon sector, would be increased, and the mechanismsfor mobilizing individuals' financial savings would be strengthened. Externalloans would be sought to cover the projected external deficit and keep reservesat an adequate level. External borrowings would be considerable in absoluteterms--of the order of US$2.7 billion per year on average in 1976-80 and US$4.6billion in 1981-85--but reasonable in relative terms, in view of the borrowingcapacity which Algeria derives from its prospective oil and gas receipts andits well-controlled economic development, overall. Most borrowings wouldprobably come from private commercial sources offering rather short repaymentperiods in relation to the gestation periods of the investments financed(especially in gas). Roll-over of these borrowings would become substantialfrom 1979 onwards, and this will entail an intensification of relationsbetween the commercial sources concerned and Algeria.
xi. Algeria's external debt and debt service would increase. Debtoutstanding and disbursed would rise from an estimated 35 percent of GDPin 1975 to about 46 percent in 1980, but decline thereafter. Debt service,which would rise from an estimated 12 percent of exports in 1975 to nearly 25percent in 1982, and like the outstanding debt, would tend to decline there-after. As projected, the debt burden would therefore be important during thereview period, but this should not be cause for undue concern, in view of theconservative assessment of the country's prospects adopted here, especiallythe hydrocarbon projections. It is possible, however, that Algeria may eitherwish to adjust its economic policy in order to reduce its external borrowingrequirements, or find some financing on more favorable terms than thoseassumed in this report.

I. INTRODUCTION
1. The framework for the recent development and prospects of theAlgerian economy is set by the country's long-term development objectives andstrategy (1967-80) and by the second four-year Plan (1974-77). A descriptionand a detailed assessment of the long-term strategy and of the 1974-77 Plan aregiven in the last IBRD economic report (No. 900-AL, dated October 20, 1975),which also analyzes the country's economic performance during the 1967-73period and attempts to quantify its economic and financial prospects up to theearly 1980's. The National Charter, approved by referendum of June 27, 1976,provides further details as to the institutional context in which the country'seconomy will henceforth develop. The most important aspects of the Charter,from an economic and financial point of view, are described and taken intoconsideration in the analysis of future prospects in Section III.
2. The decision taken by the Government at the beginning of 1974 tospeed up implementation of the long-term development strategy to the maximumis reflected in the proposed policies and investments of the 1974-77 Plan,introduced in 1974. This decision was based on the results of the 1967-73planning period. It also took into account the improved financial prospectsresulting from the new oil and gas prices. In brief, the objectives of the1974-77 Plan are as follows:
(a) To increase sharply investments (at least 2.3 times the1970-73 totals) with a view to speeding up constructionof the country's productive base and economic infrastruc-tures, and expansion of the urban and social services;
(b) To shift the balance of resources allocated to investmentin favor of sectors other than industry, and of regionsother than the coastal plains and Northern valleys, and
(c) To improve substantially the employment of unskilled labor,individual consumption levels and the distribution of growthbenefits.
The Plan also calls for vigorous implementation of the measures which theGovernment has introduced since 1971 with the aim of both decentralizing andimproving the management of the economy at all levels.
3. The rest of the report consists of two sections. Section II analyzeseconomic performance during the first two years of the 1974-77 Plan and thesituation in 1976. It points out the successes which the speeding up of thedevelopment strategy has made possible in investment and employment. It alsodraws attention to imbalances which became apparent in 1975 and which the Gov-ernment tried to correct in 1976. These imbalances mainly derived from theexcessive acceleration of investment, particularly in industry, as comparedwith the development of the country's financial and human resources. SectionIII examines the overall prospects of the economy in the years immediatelyahead, on the basis of the data available at the time the report was finalized(December 1976). This review confirms the need for Algeria to pursue the policy,
- 2 -
implemented in 1976, of adjusting further the total amount and the sectoralbreakdown of investment to resources. This policy should facilitate themanagement improvements expected from economic decentralization. It shouldalso enable the country to ensure satisfactorily the servicing of externalborrowings which will still be required to develop its productive base overthe years ahead in conformity with its objectives.
II. ECONOMIC PERFORMANCE IN 1974-75 AND THE SITUATION IN 1976
Investment and Production
4. Since the end of 1973, two factors have dominated Algeria's economicperformance which were the major changes in hydrocarbon export prices and themarked increase in investment. These two factors acted in the same directionin 1974, but in conflicting directions in 1975, thus bringing about spectacularvariations in the main economic magnitudes (Table 1). In 1974, GDP at currentprices increased by 52 percent while domestic demand rose by 33 percent andthe economy produced a substantial resource surplus. In 1975, domestic demandincreased by a further 25 percent, mainly because of investment growth, butGDP growth was only 8 percent in current terms; this led to a considerableresource gap (13.4 percent of GDP) which was covered by external borrowing.As a result primarily of changed oil and gas prices, the terms of trade indexalmost doubled in 1974, but declined by about 20 percent in 1975.- The effectsof changes in the terms of trade on the real flow of resources, the importcapacity of exports 1/, and savings are analyzed in Annex I, which givesestimates of the national accounts at constant prices.
1/ The import capacity of exports is measured by dividing exports atcurrent prices by the import price index; an equivalent expressionwould be the international purchasing power of exports.

- 3 -
Table 1: CHANGES IN, AND STRUCTURE OF, RESOURCES AND USES
(calculated on data in dinars and in current prices)
Annual Growth (%) Percent of GDpItem 1973 1974 1975 1973 1974 1975
Gross Domestic product 18.1 51.5 8.0 100.0 100.0 100.0
Imports 39.5 65.2 33.0 36.9 40.3 49.6Exports 20.9 154.5 -7.2 25.1 42.2 36.2
Resource gap - - - 11.8 -1.9 13.4
Fixed investment 36.9 43.2 34.9 41.5 39.2 49.0
Changes in stocks 25.0 281.8 -12.0 3.5 8.8 7.2Private consumption 16.9 12.1 20.7 53.9 39.9 44.6Government consumption 15.6 19.2 34.0 12.9 10.2 12.6
Total uses 23.7 32.9 24.8 111.8 98.1 113.4
Memoranda
Import prices /1 12.0 32.7 15.7Export prices /1 34.7 142.9 -4.7Terms of trade /1 20.2 83.1 -21.2
/1 Indices calculated by the mission on the basis of Customs data and inter-
national prices.
Source: Table 2.2 and Tables 8 and 9, Annex I.
5. As called for by the 1974-77 Plan, fixed investment rose by 43percent in current terms in 1974 and by 35 percent in 1975. Deducting invest-ment cost increases, real investment growth averaged about 20 percent per year(Annex I, Table 7). Fixed investment therefore reached the extremely highlevel of 49 percent of GDP in 1975. Since there was also a considerable build-up of stocks, mainly of capital goods, intermediate goods and foodstuffs,total investment absorbed the same proportion of' resources as did consump-tion. Overall, investment increased at the rate set in the Plan for 1974-77,since midway through that period it had reached 32 percent of the maximumtarget and 42 percent of the minimum target (Table 2.5).
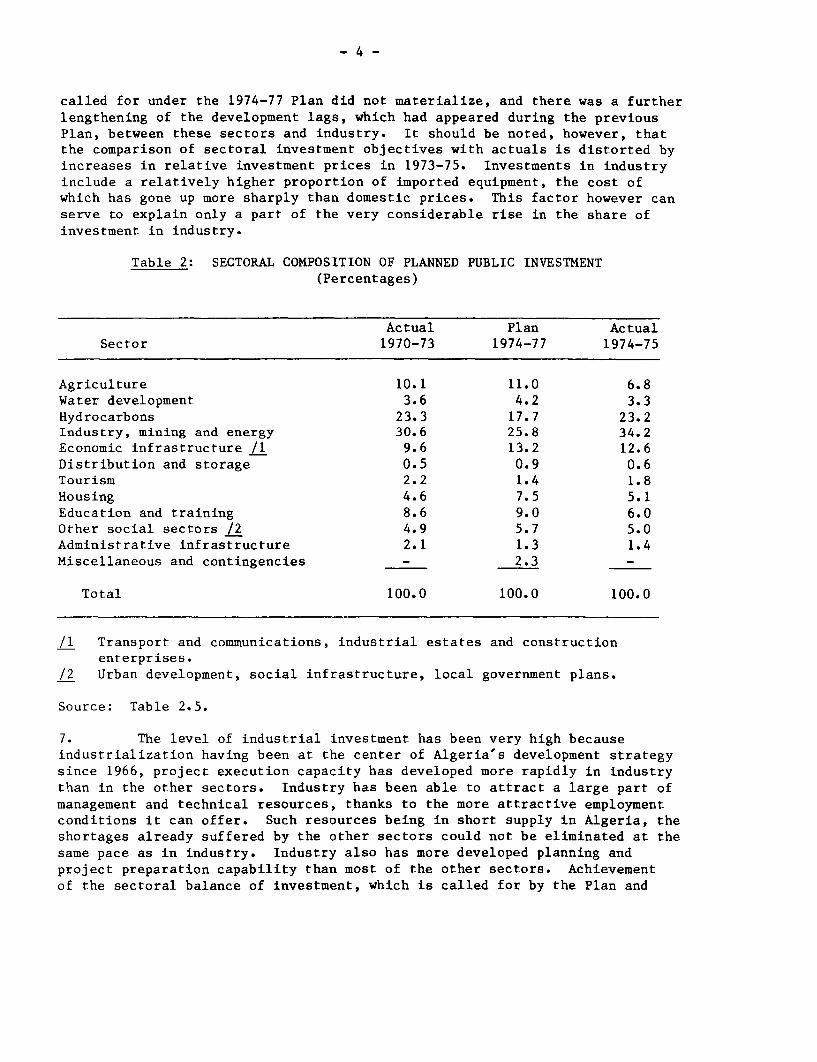
6. The sectoral distribution of investments was not however entirely inline with the Plan. In 1974 and 1975, the industrial sector received a shareof planned investment which was substantially larger than that envisaged inthe Plan and well above that of the preceding Plan (Table 2). On the otherhand, the proportion of investment in other sectors, particularly agriculture,economic infrastructure, housing, and education and training, was below thatplanned. The increased emphasis on non-industrial sectors and infrastructure
- 4 -
called for under the 1974-77 Plan did not materialize, and there was a furtherlengthening of the development lags, which had appeared during the previousPlan, between these sectors and industry. It should be noted, however, thatthe comparison of sectoral investment objectives with actuals is distorted byincreases in relative investment prices in 1973-75. Investments in industryinclude a relatively higher proportion of imported equipment, the cost ofwhich has gone up more sharply than domestic prices. This factor however canserve to explain only a part of the very considerable rise in the share ofinvestment in industry.
Table 2: SECTORAL COMPOSITION OF PLANNED PUBLIC INVESTMENT(Percentages)
Actual Plan ActualSector 1970-73 1974-77 1974-75
Agriculture 10.1 11.0 6.8Water development 3.6 4.2 3.3Hydrocarbons 23.3 17.7 23.2Industry, mining and energy 30.6 25.8 34.2Economic infrastructure /1 9.6 13.2 12.6Distribution and storage 0.5 0.9 0.6Tourism 2.2 1.4 1.8Housing 4.6 7.5 5.1Education and training 8.6 9.0 6.0Other social sectors /2 4.9 5.7 5.0Administrative infrastructure 2.1 1.3 1.4Miscellaneous and contingencies - 2.3 -
Total 100.0 100.0 100.0
/1 Transport and communications, industrial estates and constructionenterprises.
/2 Urban development, social infrastructure, local government plans.
Source: Table 2.5.
7. The level of industrial investment has been very high becauseindustrialization having been at the center of Algeria's development strategysince 1966, project execution capacity has developed more rapidly in industrythan in the other sectors. Industry has been able to attract a large part ofmanagement and technical resources, thanks to the more attractive employmentconditions it can offer. Such resources being in short supply in Algeria, theshortages already suffered by the other sectors could not be eliminated at thesame pace as in industry. Industry also has more developed planning andproject preparation capability than most of the other sectors. Achievementof the sectoral balance of investment, which is called for by the Plan and

- 5 -
essential to ensure the efficiency of industrial investment, will therefore
depend not simply on reallocating financial resources. It will also depend
on strengthening the absorptive capacity of non-industrial sectors, includingplanning, implementation and management.
8. Within the industrial sector, the growth of investment variedgreatly from branch to branch. In steel and construction materials, which
received 51 percent of all investment in industry, excluding hydrocarbons, it
was exceptional moving ahead of schedule. Investment growth has also beenstrong in hydrocarbons, energy and in heavy industry in general. In light
and small industries, however, it remained below planned levels. As regardslocal industries of small and medium sizes, the program instituted by thewilawate (provinces) is still at the design or study stage in most cases.
Its implementation should however gain momentum in 1976 and 1977.
9. In the non-industrial sectors, investment has generally remained
below Plan targets, although there are differences among sectors. In relative
terms, targets were nearly reached in economic infrastructure, which includes
transport and communications, industrial estates and construction enterprises.Investment in the latter was particularly significant at the national andregional levels, but the sector's capacity remained insufficient in relation
to demand. The delays in implementing the Plan in the social sectors are a
cause for concern, especially as regards urban services. In these sectors,
investment expenditures halfway through the Plan period represented only 30
percent of the minimum objectives in current terms, and an even lower percent-
age in real terms. The greatest delays were experienced in agriculture, where
investments after two years stand at only 25 percent of the target for the
four years, in current terms. Key agricultural investments have been for the
establishment of the Agrarian Revolution cooperatives and for agriculturaland rural infrastructure. In view of the rapid progress in the implementationof the Agrarian Revolution, the Plan might have over-estimated the sector's
initial absorptive capacity since its investment was very low up to 1974.Specific data are not available for private investment. It appears to have
increased in 1974 and 1975, especially in construction enterprises, certainbranches of industry such as textiles and leather, and especially in housing.
10. GDP at current prices grew by an average of 27 percent per year
in the first two years of the Plan, but if hydrocarbons are excluded valueadded by the other sectors grew annually by 17 percent. This marked differ-
ence should be seen in the light of marked changes in relative prices over
the period. Reflecting the changes in average export prices, hydrocarbonstripled their value added in 1974 and registered a 10 percent decline in 1975.
As regards the other sectors, the various price indices prepared by the
Secretariat of State for Planning show an average annual increase in produc-
tion prices of 11 percent since 1973 (Annex 1). Real GDP growth, excluding
hydrocarbons, was about 6.7 percent p.a. in 1974-75--a rate higher than the
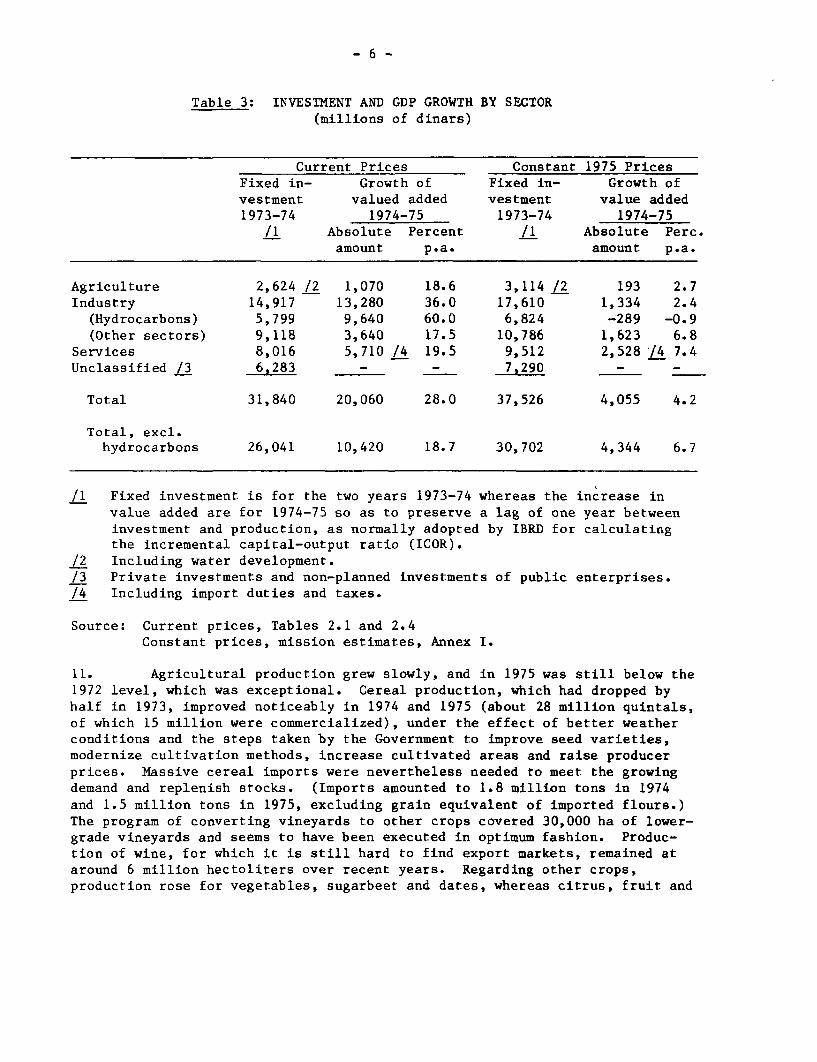
5.3 percent achieved in the 1970-73 period. Table 3 compares investment and
GDP growth in the main economic sectors..
-6-
Table 3: INVESTMENT AND GDP GROWTH BY SECTOR(millions of dinars)
Current Prices Constant 1975 PricesFixed in- Growth of Fixed in- Growth ofvestment valued added vestment value added1973-74 1974-75 1973-74 1974-75
/1 Absolute Percent /1 Absolute Perc.amount p.a. amount p.a.
Agriculture 2,624 /2 1,070 18.6 3,114 /2 193 2.7Industry 14,917 13,280 36.0 17,610 1,334 2.4
(Hydrocarbons) 5,799 9,640 60.0 6,824 -289 -0.9(Other sectors) 9,118 3,640 17.5 10,786 1,623 6.8
Services 8,016 5,710 /4 19.5 9,512 2,528 -4 7.4Unclassified /3 6,283 - - 7,290 - -
Total 31,840 20,060 28.0 37,526 4,055 4.2
Total, excl.hydrocarbons 26,041 10,420 18.7 30,702 4,344 6.7
/1 Fixed investment is for the two years 1973-74 whereas the increase invalue added are for 1974-75 so as to preserve a lag of one year betweeninvestment and production, as normally adopted by IBRD for calculatingthe incremental capital-output ratio (ICOR).
/2 Including water development./3 Private investments and non-planned investments of public enterprises.14 Including import duties and taxes.
Source: Current prices, Tables 2.1 and 2.4Constant prices, mission estimates, Annex I.
11. Agricultural production grew slowly, and in 1975 was still below the1972 level, which was exceptional. Cereal production, which had dropped byhalf in 1973, improved noticeably in 1974 and 1975 (about 28 million quintals,of which 15 million were commercialized), under the effect of better weatherconditions and the steps taken by the Government to improve seed varieties,modernize cultivation methods, increase cultivated areas and raise producerprices. Massive cereal imports were nevertheless needed to meet the growingdemand and replenish stocks. (Imports amounted to 1.8 million tons in 1974and 1.5 million tons in 1975, excluding grain equivalent of imported flours.)The program of converting vineyards to other crops covered 30,000 ha of lower-grade vineyards and seems to have been executed in optimum fashion. Produc-tion of wine, for which it is still hard to find export markets, remained ataround 6 million hectoliters over recent years. Regarding other crops,production rose for vegetables, sugarbeet and dates, whereas citrus, fruit and

-7 -
tree crops (mainly olive oil) tended to stagnate owing to aging of thevarieties. Livestock production has increased but is still below domesticdemand, with the result that in spite of growing imports there have beenstrong upward pressures on meat prices. The implementation of the AgrarianRevolution and agricultural policies are examined in Section III.
12. In the hydrocarbon sector, price increases were accompanied by areduction in crude oil production since 1973 and a drop in value added in realterms. For technical and commercial reasons, production of crude oil andcondensate went down from 50.8 million tons in 1973 to 47.1 million tons in1974 and 45.4 million tons in 1975. Natural gas production has howeverrisen rapidly, reaching 7.4 billion m3 in 1975 compared to 5.6 billion m3in 1973. Half of the gas output has gone to the two liquefaction plants forexport. Data on the hydrocarbon sector are given in Tables 10.1 to 10.7.
13. Developments in industry apart from hydrocarbons are analyzed inAnnex II. The real increase in manufacturing value added is estimated at anaverage of 5 percent p.a. in the first two years of the Plan, but with markedvariations within the sector. Value added rose sharply in heavy industriesproducing capital and intermediate goods, steel, mechanical and electricalengineering, and construction materials industries, as several large plantscame into operation. Value added showed by contrast little increase in lightindustry, textiles and leather, agricultural and food industries and themiscellaneous industries category. The energy sector's value added continuedto grow at a sustained rate of 20 percent p.a. .on average, in response tooverall economic development and thanks to the good operating capability ithas acquired. The real increase in value added in the construction sectorwas also high, in response to demand for industrial investment.
14. For the services sector, real value added increased by over 7 per-cent p.a. on average. Growth was particularly rapid in transportation andpublic services, the latter specifically reflecting the effort made todevelop education and training.
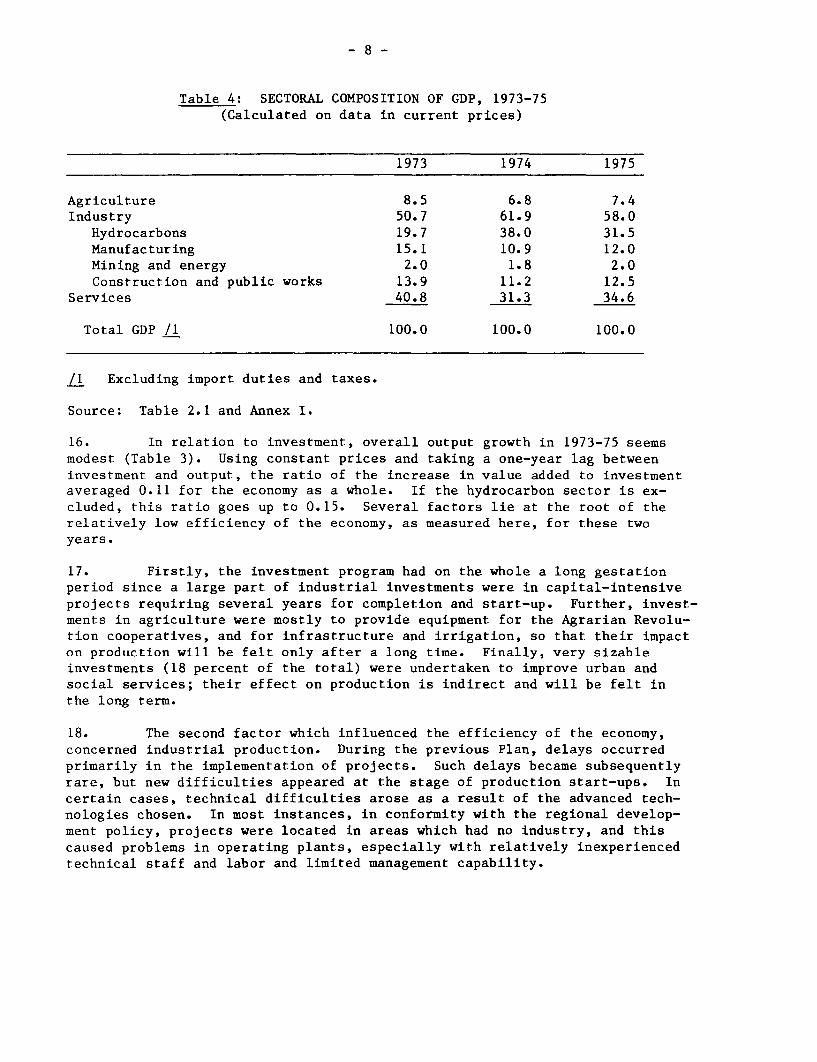
15. The composition of GDP at current prices was substantially changedbetween 1973 and 1975 (Table 4). The share of the hydrocarbon sector rosefrom one-fifth in 1973 to nearly one-third in 1975 solely as a result ofprice changes. Of the other sectors, manufacturing industry and servicessaw their shares of GDP decline mostly because of smaller price increases.It should be noted however, that the full impact of increases in oil and gasprices and other external prices on the economy has not yet been fully feltand that the composition of GDP will probably undergo further changes on thisaccount in 1976 and subsequent years.
- 8 -
Table 4: SECTORAL COMPOSITION OF GDP, 1973-75(Calculated on data in current prices)
1973 1974 1975
Agriculture 8.5 6.8 7.4Industry 50.7 61.9 58.0
Hydrocarbons 19.7 38.0 31.5Manufacturing 15.1 10.9 12.0Mining and energy 2.0 1.8 2.0Construction and public works 13.9 11.2 12.5
Services 40.8 31.3 34.6
Total GDP /1 100.0 100.0 100.0
/1 Excluding import duties and taxes.
Source: Table 2.1 and Annex I.
16. In relation to investment, overall output growth in 1973-75 seemsmodest (Table 3). Using constant prices and taking a one-year lag betweeninvestment and output, the ratio of the increase in value added to investmentaveraged 0.11 for the economy as a whole. If the hydrocarbon sector is ex-cluded, this ratio goes up to 0.15. Several factors lie at the root of therelatively low efficiency of the economy, as measured here, for these twoyears.
17. Firstly, the investment program had on the whole a long gestationperiod since a large part of industrial investments were in capital-intensiveprojects requiring several years for completion and start-up. Further, invest-ments in agriculture were mostly to provide equipment for the Agrarian Revolu-tion cooperatives, and for infrastructure and irrigation, so that their impacton production will be felt only after a long time. Finally, very sizableinvestments (18 percent of the total) were undertaken to improve urban andsocial services; their effect on production is indirect and will be felt inthe long term.
18. The second factor which influenced the efficiency of the economy,concerned industrial production. During the previous Plan, delays occurredprimarily in the implementation of projects. Such delays became subsequentlyrare, but new difficulties appeared at the stage of production start-ups. Incertain cases, technical difficulties arose as a result of the advanced tech-nologies chosen. In most instances, in conformity with the regional develop-ment policy, projects were located in areas which had no industry, and thiscaused problems in operating plants, especially with relatively inexperiencedtechnical staff and labor and limited management capability.
- 9 -
19. Finally, another by no means negligible factor accounting for the
problems in industrial production derived from the noted intrasectoral and
intersectoral imbalances. Slippages occurred in the planning, executionand entry into production of complementary industrial projects upstream and
downstream, and these have led to supply or marketing difficulties for certain
industrial units. There have also been delays in the development of sectors
accompanying industrialization--economic infrastructure, housing and social
infrastructure--which have become an increasingly felt constraint on the
efficiency of industry. Moreover, the relatively slower growth in agriculture
and light industry has limited the market for industrial goods. Insufficient
output growth for certain agricultural products also resulted in supply
problems for some food industries (sugar mills and canneries, for instance).
Population and Employment
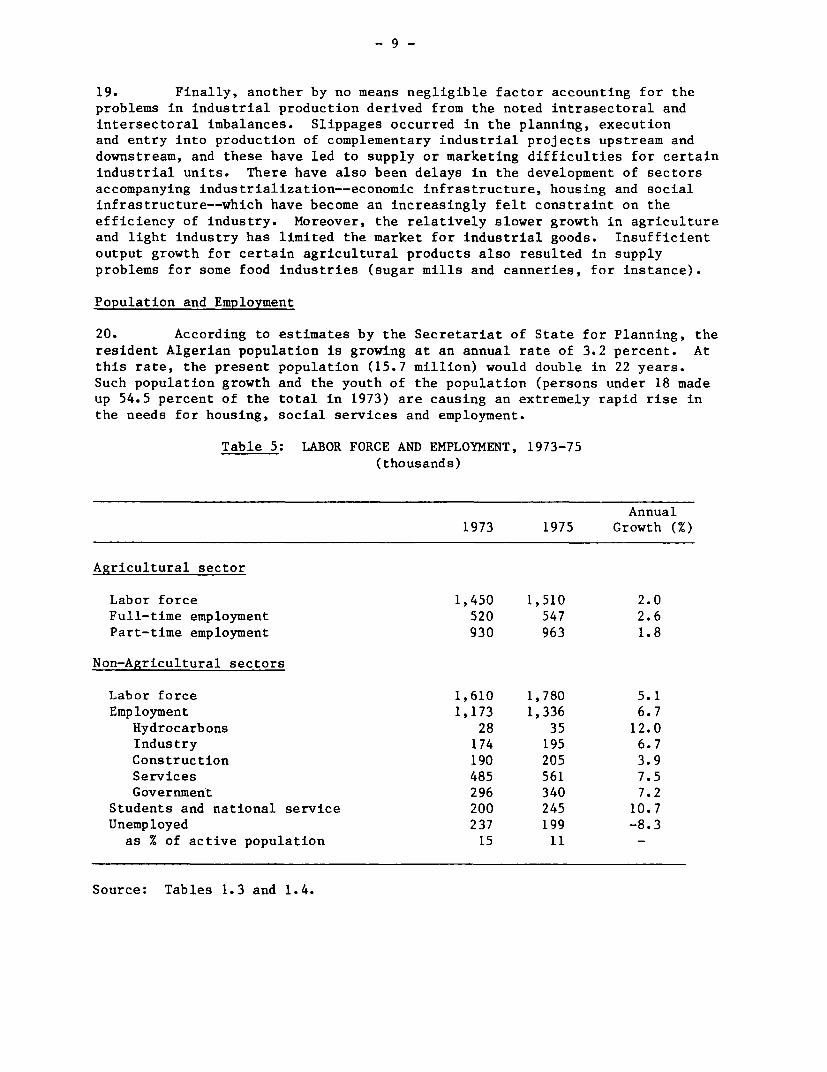
20. According to estimates by the Secretariat of State for Planning, the
resident Algerian population is growing at an annual rate of 3.2 percent. At
this rate, the present population (15.7 million) would double in 22 years.
Such population growth and the youth of the population (persons under 18 made
up 54.5 percent of the total in 1973) are causing an extremely rapid rise in
the needs for housing, social services and employment.
Table 5: LABOR FORCE AND EMPLOYMENT, 1973-75
(thousands)
Annual1973 1975 Growth (%)
Agricultural sector
Labor force 1,450 1,510 2.0Full-time employment 520 547 2.6Part-time employment 930 963 1.8
Non-Agricultural sectors
Labor force 1,610 1,780 5.1
Employment 1,173 1,336 6.7
Hydrocarbons 28 35 12.0Industry 174 195 6.7
Construction 190 205 3.9Services 485 561 7.5Government 296 340 7.2
Students and national service 200 245 10.7Unemployed 237 199 -8.3
as % of active population 15 11 -
Source: Tables 1.3 and 1.4.

- 10 -
21. The high employment creation targets set in the 1974-77 Plan havebeen achieved in the first two years of its implementation thanks above allto the considerable investment made. For analyzing employment, Algeria'slabor force is divided into two categories: agricultural and non-agricultural.The employment statistics are relatively reliable for the non-agriculturalsectors, but are less so for agriculture where underemployment is difficult tomeasure. Changes in employment from 1973 to 1975 are summarized in Table 5.According to preliminary estimates, some 163,000 jobs were created in thenon-agricultural sectors, but the final and yet non-published results of theannual survey of non-agricultural employment indicate that the actual figurecould be higher. Despite the rapid increase (5.1 percent p.a.) in the non-agricultural labor force, unemployment has lessened appreciably in bothabsolute and relative terms. Full-time employment in agriculture has alsocontinued to increase, thanks particularly to the expansion of the AgrarianRevolution sector, where nearly 100,000 jobs had been created by the end of1975. Moreover, a large number of the non-agricultural jobs were created inthe interior of the country as a result of the considerable regional develop-ment efforts made by the Government, and this made it possible to absorb apart of the surplus agricultural labor force. The number of workers employedpart-time in agriculture nevertheless remained very high.
22. Algeria stopped the emigration of its workers in 1973. A net returnof about 10,000 emigrant workers per year has since been registered. Of theworker returns, about 4,000 were initiated by enterprises and local govern-ments looking for skilled workers. According to provisional estimates bythe Secretariat of State for Planning, it is likely that in 1976 the numberof workers in industry will, for the first time, exceed that of emigrantworkers.
23. Some major imbalances nevertheless subsist with respect to employ-ment by sector and level of qualification. In the non-agricultural sectors,the new jobs have gone for the greater part to skilled workers, in linewith the considerable training effort made by Algeria. However, many skilledpositions are still open, especially in the middle technical and managerialcategories and in the training system. Unemployment affects almost solelythe unskilled. These imbalances have been accompanied by marked stresses inthe sectoral distribution of skilled workers, owing to variations acrosssectors in wages, salaries and fringe benefits. There has been competitionon employee compensation between the private and public sectors, between thecivil service and the national enterprises in the public sector, and evenamong the public enterprises. Housing availability has also played a veryimportant role in the distribution of the labor force. In a situation char-acterized by shortages, employers have tended to train and retain skilledworkers ahead of the completion of the projects for which they were recruited.This behavior explains partly the approximately 5 percent drop in real valueadded per worker in the industrial sector between 1973 and 1975. It alsoexplains the better investment capability noted in industry as compared withthe other sectors.

Savings and External Deficit
24. Whereas in 1974 national savings exceeded investment, a sizabledeficit appeared in 1975. The investment for 1975 was programmed in thecontext of the 1974-77 Plan and based on levels of oil revenues and savingssimilar to those of 1974. The 1975 decline in hydrocarbon prices and produc-tion brought about a gap of over 20 percent between national savings and in-vestment, which was covered by higher external borrowing.
Table 6: SAVINGS AND EXTERNAL DEFICIT, 1973-75(Based on data in dinars and in current prices)
Item 1973 1974 1975
As percentage of GDP
Gross domestic savings 33.2 50.0 42.0Gross national savings 37.1 49.1 43.4Government current surplus 14.6 31.2 23.5Government oil revenue 13.1 28.1 26.1Emigrant workers' remittances 2.8 1.8 2.0Interest on external debt 1.0 1.9 1.8
As percentage of investment
Gross national savings 82.4 102.3 77.2External deficit 12.4 -3.0 21.2
Source: Tables 2.2, 3.1, 5.1 and 5.2.
25. The savings effort in 1975 did not match the exceptional levelachieved in 1974 but, viewed over the two years it was nonetheless high.Gross domestic savings moved from 33 percent of GDP in 1973 to 50 percent in1974, and to 42 percent in 1975. The marginal domestic saving rate reached56 percent, which means that the greater part of the increase in resourcesresulting from higher domestic production and increased oil and gas priceswas saved. The increase in national savings was less than that in domesticsavings, however, owing to the rapid rise in interest payments on externalloans and the slower growth in emigrant workers' remittances. The Governmentcurrent surplus (budgetary savings) almost tripled in current prices between1973 and 1975 and became the country's main source of savings. This was duefirstly to the rise in the Government's oil revenues, which went from 13percent to 26 percent of GDP, and also to the relatively moderate increasein current public expenditures (see paragraph 40).
26. The Government continued the austerity policy towards private in-comes and consumption. While it keeps closely in check the overall increasein private incomes and consumption, this policy is designed in such a way as
- 12 -
to improve relatively the real incomes of the least privileged social groups.Private consumption rose by about 17 percent a year at current prices since1973, which corresponded to a real annual increase of 7 percent, taking intoaccount the consumer price rises. Public consumption increased by about 9percent a year in real terms over the same period, due mainly to the growth ofpriority expenditures on education and other social sectors such as health.The increase in private consumption was substantially higher than during theprevious Plan period and was attributable chiefly to the rise in employmentand to the steps taken to improve the situation of low-income groups. Wageincreases were kept strictly in line with prior price rises, and the controlson non-essential consumer goods were maintained. The measures to assist low-income groups consisted primarily of the government price subsidies for basicconsumer goods (to offset the higher import prices), the abolition of agricul-tural taxes and the exemption of lower incomes from taxation. In addition,the Government's social expenditures were sharply stepped up.
Balance of Payments
27. During 1974-75, the balance of payments was greatly influenced byhydrocarbon exports and by the national investment program, and it experiencedsharp changes. In 1974, the tripling of oil and gas export receipts produceda sizeable current balance of payments surplus, despite a relatively largeincrease in imports. In 1975, the lower oil and gas export volumes coupledwith the deterioration in the terms of trade and the continuing increase inimports, especially of capital goods, resulted in a considerable currentdeficit. The overall deficit on the balance of payments was, however, rela-tively small because of high inflows of external capital.

- 13 -
Table 7: BALANCE OF PAYMENTS, CURRENT ACCOUNT, 1973-75
Millions of Dinars Millions of US Dollars
1973 1974 1975 1973 1974 1975
Exports of goods andNFS /1 8,345 20,634 19,494 2,108 4,935 4,936
(Hydrocarbons) (6,700) (18,117) (15,938) (1,692) (4,333) (4,036)
Imports of goods andNFS /1 -10,741 -18,718 -25,901 -2,713 -4,477 -6,559
(Capital goods) (-3,163) (-5,580) (-9,503) (-799)(-1,335) (-2,406)
(Foodstuffs) (-1,208) (-2,827) (-4,534) (-305) (-676) (-1,148)
Resource balance -2,396 1,916 -6,407 -605 458 -1,623
Interest payments -330 -910 -930 -83 -218 -231
Interest receipts 80 617 276 20 148 70
Workers' remittances (net) 698 654 795 176 156 201
Other services andtransfers (net) 190 -1,609 108 48 -384 23
Net factor servicesand transfers 638 -1,248 249 161 -298 63
Current accountbalance -1,758 668 -6,158 -444 160 -1,560
Memo items
Terms of trade index(1973=100) 100 183 151
Exchange Rate(Dinars per US dollar) 3.96 4.18 3.95
/1 The import statistics are taken from financial settlement data prepared
by the Central Bank; it should be noted that imports of capital goods
against supplier credit have been included only since 1974. The export
statistics are based on Customs data.
Source: Tables 3.1, 3.4, 3.5 and 3.9 and Annex I.
28. From 1973 to 1975, the rise in export receipts was accompanied by
a reduction in total export quantities. In quantity, crude oil exports de-
clined by 12 percent during the two years, but exports of refined products
and liquefied gas went up. Export of agricultural products declined by more
than half in quantity, mainly because of the lower wine exports and the grow-
ing domestic demand for the other products that are exported (particularly
- 14 -
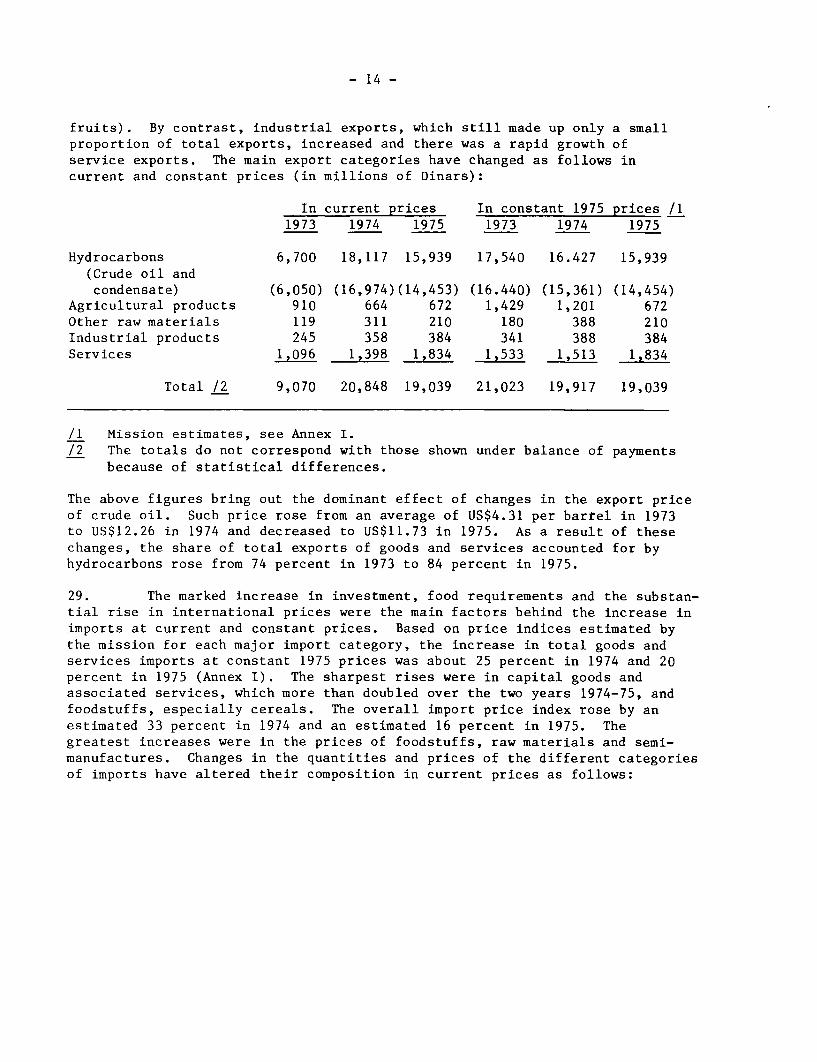
fruits). By contrast, industrial exports, which still made up only a smallproportion of total exports, increased and there was a rapid growth ofservice exports. The main export categories have changed as follows incurrent and constant prices (in millions of Dinars):
In current prices In constant 1975 prices /11973 1974 1975 1973 1974 1975
Hydrocarbons 6,700 18,117 15,939 17,540 16.427 15,939(Crude oil andcondensate) (6,050) (16,974)(14,453) (16.440) (15,361) (14,454)
Agricultural products 910 664 672 1,429 1,201 672Other raw materials 119 311 210 180 388 210Industrial products 245 358 384 341 388 384Services 1,096 1,398 1,834 1,533 1,513 1,834
Total /2 9,070 20,848 19,039 21,023 19,917 19,039
/1 Mission estimates, see Annex I./2 The totals do not correspond with those shown under balance of payments
because of statistical differences.
The above figures bring out the dominant effect of changes in the export priceof crude oil. Such price rose from an average of US$4.31 per barrel in 1973to US$12.26 in 1974 and decreased to US$11.73 in 1975. As a result of thesechanges, the share of total exports of goods and services accounted for byhydrocarbons rose from 74 percent in 1973 to 84 percent in 1975.
29. The marked increase in investment, food requirements and the substan-tial rise in international prices were the main factors behind the increase inimports at current and constant prices. Based on price indices estimated bythe mission for each major import category, the increase in total goods andservices imports at constant 1975 prices was about 25 percent in 1974 and 20percent in 1975 (Annex I). The sharpest rises were in capital goods andassociated services, which more than doubled over the two years 1974-75, andfoodstuffs, especially cereals. The overall import price index rose by anestimated 33 percent in 1974 and an estimated 16 percent in 1975. Thegreatest increases were in the prices of foodstuffs, raw materials and semi-manufactures. Changes in the quantities and prices of the different categoriesof imports have altered their composition in current prices as follows:

- 15 -
Percentages1973 1974 1975
Capital goods and associated services /2 34.5 34.1 41.8Food products 16.5 20.8 16.9Raw materials and semi-manufactures 31.4 31.7 27.1Consumer goods 13.4 10.1 10.4Services 4.2 3.3 3.8
100.0 100.0 100.0
/1 Based on Customs data./2 These services comprise technical assistance and major civil works
by foreign enterprises.
As a result of the considerable investment effort, the share of capital goodsand associated services in total imports rose to more than 40 percent in 1975.After an exceptional peak of 21 percent of the total in 1974, the share offoodstuffs dropped back to 17 percent in 1975, which was still a considerableburden for the country. The relative importance of the other categories,especially consumer goods, declined appreciably.
30. Despite the reversal in external price trends in 1975, the termsof trade in that year were still some 50 percent above their 1973 level.Algeria used this gain however largely to step up imports. Over the two years1974-75, the increase in export receipts represented US$189 per capita whilethe rise in import expenditures amounted to US$256 per capita.
31. The balance of factor services and transfers, which had been posi-tive since 1970, showed a large deficit in 1974 and returned to a slightsurplus in 1975. The 1974 deficit was due mainly to Government transfers forcontributions to international cooperation (DA 1,785 million or US$427 mil-lion). At the same time, interest payments increased rapidly as a result ofincreased borrowing from private external sources, while net workers' remit-tances tended to level out following the interruption of worker emigrationto Europe and the increase in transfers of foreign workers in Algeria.
- 16 -
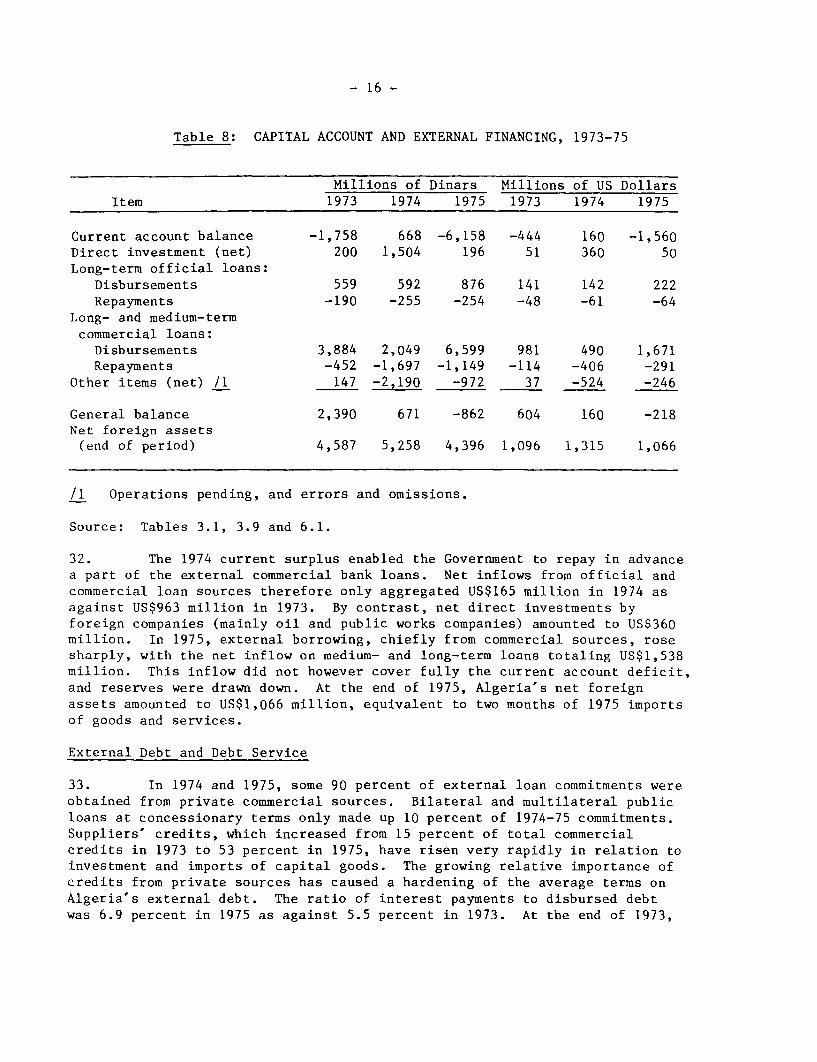
Table 8: CAPITAL ACCOUNT AND EXTERNAL FINANCING, 1973-75
Millions of Dinars Millions of US DollarsItem 1973 1974 1975 1973 1974 1975
Current account balance -1,758 668 -6,158 -444 160 -1,560Direct investment (net) 200 1,504 196 51 360 50Long-term official loans:
Disbursements 559 592 876 141 142 222Repayments -190 -255 -254 -48 -61 -64
Long- and medium-termcommercial loans:Disbursements 3,884 2,049 6,599 981 490 1,671Repayments -452 -1,697 -1,149 -114 -406 -291
Other items (net) /1 147 -2,190 -972 37 -524 -246
General balance 2,390 671 -862 604 160 -218Net foreign assets(end of period) 4,587 5,258 4,396 1,096 1,315 1,066
/1 Operations pending, and errors and omissions.
Source: Tables 3.1, 3.9 and 6.1.
32. The 1974 current surplus enabled the Government to repay in advancea part of the external commercial bank loans. Net inflows from official andcommercial loan sources therefore only aggregated US$165 million in 1974 asagainst US$963 million in 1973. By contrast, net direct investments byforeign companies (mainly oil and public works companies) amounted to US$360million. In 1975, external borrowing, chiefly from commercial sources, rosesharply, with the net inflow on medium- and long-term loans totaling US$1,538million. This inflow did not however cover fully the current account deficit,and reserves were drawn down. At the end of 1975, Algeria's net foreignassets amounted to US$1,066 million, equivalent to two months of 1975 importsof goods and services.
External Debt and Debt Service
33. In 1974 and 1975, some 90 percent of external loan commitments wereobtained from private commercial sources. Bilateral and multilateral publicloans at concessionary terms only made up 10 percent of 1974-75 commitments.Suppliers' credits, which increased from 15 percent of total commercialcredits in 1973 to 53 percent in 1975, have risen very rapidly in relation toinvestment and imports of capital goods. The growing relative importance ofcredits from private sources has caused a hardening of the average terms onAlgeria's external debt. The ratio of interest payments to disbursed debtwas 6.9 percent in 1975 as against 5.5 percent in 1973. At the end of 1973,

- 17 -
maturities on Algeria's external debts ranged up to 5 years for 43 percentof the total, between 5 and 10 years for 40 percent, between 10 and 15 yearsfor 14 percent, and 15 years and longer for 3 percent. The shortening ofthe average maturity of external loans implies a rapid rise in roll-overneeds in the years ahead.
Table 9: EXTERNAL DEBT AND DEBT SERVICE, 1973-75
Millions of US Dollars1973 1974 1975
Commitments 2,304 1,458 3,255
Official sources 399 327 184Private commercial sources 1,905 1,131 3,071
(Commercial banks) 1,613 466 1,453(Suppliers' credits) 292 665 1,618
Total debt outstanding (year's end) 4,942 6,031 8,764
Total debt disbursed only (year's end) 2,955 3,330 4,518- as percentage of GDP 37.1 29.1 34.6
Debt service 304 714 586- as percentage of exports 14.4 14.5 11.9- as percentage of Government
revenues 10.9 12.7 9.1
Source: External debt report; provisional estimates for 1975.
34. Provisional Government and IBRD estimates indicate that as of theend of 1975, external debt outstanding and disbursed reached US$4.5 billion,to which should be added an almost equal amount of undisbursed debts. Theratio of disbursed debt to GDP diminished substantially in 1974, due to therapid rise in GDP at current prices and the advance repayments made by theGovernment. This ratio however moved back up to nearly 35 percent in 1975following the sharp increase in external borrowing. Debt service remained at14.5 percent of exports of goods and services in 1974 as a result of advanceloan repayments made in that year, and then dropped to less than 12 percentin 1975, a level which left Algeria with a sizable capacity to incur furtherindebtedness.
Public Finances
35. The reforms introduced in the financial system in 1971 and 1972assign the Government a preponderant role in the mobilization and allocationof the country's financial resources. The Government taps the greater partof national savings through taxation and Treasury operations designed to

- 18 -
mobilize liquid funds. In 1973-75, the amounts mobilized by the Treasury--inthe form of budgetary savings, deposits by correspondents and bond issues--represented three-quarters of national savings. Regarding the allocation ofthese resources to investment, the Government exercises particularly closecontrol through the central planning system. Some 81 percent of fixed invest-ment made in 1973-75 was authorized through individual approvals 1/ given bythe Government for each development project or program included in the annualand multi-year plans. The Government further strongly influenced the alloca-tion of the remaining 19 percent (unplanned and private investments) throughthe various regulations in force, particularly those governing bank credit.
36. The financing of projects and programs is effected through thefinancing plans laid down in individual approvals and revised subsequently ifneed be. Government capital expenditures are financed from the budget and theTreasury assumes responsibility for any foreign loans that are allocated tothe financing of such expenditures. The capital expenditures of public enter-prises are financed with loans from the Treasury, the banking system andforeign sources. All funds pass through the banking system, which controlstheir use as directed by individual approvals. The banks involved are eitherthe Banque Algerienne de Development (BAD), the Caisse Nationale d'Epargneet de Prevoyance (CNEP) or one of the three primary banks (BNA, BEA or CPA).Some changes were made in the financial system in 1976 with a view to intro-duce some decentralization. These changes are described in Section III.
37. The accounts of local governments, certain public institutionsand public enterprises are not yet consolidated in Algeria. An overall viewof public sector finances, particularly with respect to current operations,cannot therefore be taken. The Treasury's accounts are however available(Tables 10 and 5.1), and they closely follow developments in the economy dueto the importance, just described, of the role played by the Government.
38. Treasury accounts showed sharp changes during the first twoyears of the 1973-77 Plan. In 1974, budgetary savings more than tripled,primarily as a result of higher oil revenues. Despite a very marked expan-sion in the Government's funding of investment and debt rescheduling ofpublic enterprises 2/, there was an overall budget surplus. In 1975, bycontrast, budgetary savings declined somewhat, whereas investment growthaccelerated and debt rescheduling of enterprises remained at a high level.As a result, a relatively sizable overall budget deficit was experienced.
1/ These individual approvals are officially known as "decisionsd'individualisation et de financement" in Algeria.
2/ Debt rescheduling of public enterprises is officially called inAlgeria "assainissement financier" or "re-structuration financiere".

- 19 -
Table 10: SUMMARIZED TREASURY ACCOUNTS, 1973-75
Millions of Dinars Percentage of GDPItem 1973 1974 1975 1973 1974 1975
Oil revenue 4,116 13,402 13,462 13.1 28.1 26.1Ordinary tax revenue 5,701 7,976 9,891 18.1 16.7 19.2
Other current revenue 1,195 2,036 2,019 3.8 4.3 3.9Current expenditures -6,415 -8,501 -13,231 -20.3 -17.8 -25.6
Budgetary savings 4,597 14,916 12,141 14.6 31.2 23.5
Investment -7,353 -9,363 -14,724 -23.3 -19.6 -28.5(Investment expenditures) (3,719) (4,130) (5,505) (11.8) (8.6) (10.7)(Investment loan dis-bursements) (3,634) (5,263) (9,219) (11,5) (11.0) (17.8)
Enterprises' debt re-scheduling -784 -3,623 -3,854 -2.5 -7.6 -7.5
Miscellaneous capital,net 142 28 968 0.5 0.1 1.9
General balance -3,398 1,958 -5,469 -10.8 4.1 -10.6
/1 Details may not add up to totals due to rounding.
Source: Tables 5.1, 5.2 and 2.1.
39. Already high in 1973 and preceding years, tax revenue increased in1974 (44.8 percent of GDP) and in 1975 (45.3 percent of GDP). Oil revenueaccounted for the bulk of this increase, the Government having capturedvirtually the full amount of additional receipts from higher hydrocarbonprices. Oil tax revenue was equivalent to 61 percent of the current valueof hydrocarbon exports in 1973, to 74 percent in 1974 and to 84 percent in1975, thanks partly to improvements in collection procedures. It should bestressed, however, that in 1975 revenue from ordinary taxation exceeded therelative level reached in 1973, after a slight drop in 1974. This increasewas accounted for by receipts from indirect ordinary taxation on importedgoods and services (see Table 5.2). Receipts from direct ordinary taxationalso increased but did not keep pace with GDP. The absolute value of thecontributions of the public enterprises to the Government's budget declinedin 1975.
40. The ratio of Government current expenditure to GDP showed a sharpincrease in 1975 after dropping in 1974. The normal current expenditures(personnel, materials, maintenance and miscellaneous; Table 5.3) remained ina constant proportion to GDP (13 percent) in 1974 and 1975, notwithstandingwage and salary increases in 1975 of 30 percent for teachers and 20 percent
- 20 -
for other government personnel. On the other hand, current transfers, par-ticularly those benefiting the less privileged social groups, showed a verymarked increase. Transfers to individuals (family allowances, student grants,etc.) rose from DA 0.9 billion in 1973 to more than DA 2 billion in 1975.More importantly, price subsidies to staple foodstuffs (cereals, sugar andedible oil) amounted to DA 3.4 billion in 1975, or 6.6 percent of GDP, com-pared to nil in 1973 and only a very small amount in 1974. These subsidiesmade it possible to maintain the consumers' purchasing power while ensuringavailability of supplies through imports that had to be made at 1975's highprices. They were nonetheless one of the causes of the budget deficit in thatyear. Algeria pursued a policy of modest defense spending (2.3 percent of GDPin 1974 and 2.5 percent in 1975). It also continued giving priority toeducation and training. For reasons connected with their absorptive capacity,the two education ministries' expenditures declined somewhat in relation toGDP (6.9 percent in 1975 as against 8.3 percent in 1973), but it should benoted that these expenditures do not cover the training effort made by thetechnical ministries (Industry, Agriculture and Public Works) and the enter-prises reporting to these. Systematic records have not been kept of thiseffort, but it is known to have been stepped up very rapidly.
41. Government investment expenditure (Table 5.5) favored the sectorsthat lagged behind industry in 1974 and 1975, especially rural development,water development, communications and social infrastructure. However, theauthorities responsible for these sectors had difficulty raising theirimplementation capacities to the levels set in the Plan for 1974-77. In 1975,the Government's investment expenditure increased by 38 percent from the 1974level, but was one third below budget allocations.
42. Government loans for investment and debt rescheduling of publicenterprises increased spectacularly. Loans for investment were in 1975some 2.5 times larger than in 1973, most of the increase having gone toindustry (see paras 6 to 8). Loans for debt rescheduling nearly quintupled,reaching about US$870 million in 1974 and US$970 million in 1975. The re-scheduling operations made it possible to clear cumulative deficits and torestructure the debts of public enterprises that had been in growing financialdifficulties for several years for a variety of reasons (inappropriate initialfinancing of investments, unfavorable cost/price relationships, managementshortcomings, etc.). They were an essential step for implementation of thedecentralization policy (see paras 59 to 63).
43. The overall budget surplus in 1974 enabled the Treasury to reduceits net indebtedness to the banking system (see Table 6.1). By the endof 1974, it had built up a healthy credit balance with the Central Bank whilereducing its indebtedness to the primary banks by over DA 1 billion over theyear (see Tables 6.2 and 6.3). The overall deficit in 1975 was covered for alarge part (61 percent) by the increase in deposits by Treasury correspondents(including the Postal Checking Accounts) and drawing down the Treasury accountwith the Central Bank, as well as, to a lesser extent, by net proceeds fromequipment bonds issues. The net position vis-a-vis the Central Bank neverthe-less moved slightly into debit as of the year's end.
- 21 -
Money, Credit and Prices
44. The causative factors of money supply behaved as follows during 1974and 1975 (variations during the year computed from the figures given in Tables6.1 and 6.2):
In millions of Dinars As percentages1974 1975 1974 1975
Gross credit to Treasury 219 2,283 4 39Treasury deposits 1,577 -1,190 350 -59Net credit to Treasury -1,357 3,473 -26 90Credit to economy 5,954 7,158 37 33Net foreign assets 871 -862 19 -16Money supply 4,593 7,402 23 30
As shown by the above data, credit to the economy was the main factor behindthe expansion of money supply in 1974 and 1975. In Algeria, such credit ismade up primarily of credit to the public and collective enterprises. Thegrowth of money supply was distinctly slower than that of GDP at currentprices in 1974 (23 percent as against 51 percent) and it can be concluded thatthe upward pressure on prices in that year came entirely from abroad, i.e.through import and export price increases. In 1975 the reverse occurred;money supply expanded more rapidly than GDP (30 percent against 8 percent) andnet foreign assets diminished, which would appear to indicate that pressureson prices were mainly of domestic origin, although there was also the effect,deferred by controls, of some 1974 external price increases.
45. Indeed, it may be seen (Table 9.1) that the growth of the consumerprice index accelerated in 1975--it was 6.5 percent in 1974 and 10.9 percentin 1975. Price subsidization made it possible to moderate somewhat food priceincreases, which nonetheless were 10 percent in 1974 and 13.4 percent in 1975.Meat and vegetable prices increased sharply for a while in the winter of1975/76 owing to problems in supplying the main urban areas following thereform of trade channels in these commodities which was introduced two yearsago. By the beginning of the summer of 1976, these problems appeared howeverto have been solved for the greater part (see para 60). Production priceshave changed in line with consumer prices. Agricultural prices have beenraised substantially to encourage production; they rose 12 percent in 1974and 19 percent in 1975 (Table 9.2). Industrial prices have also been raised,particularly those of strategic products (cement, steel products, etc.) toestablish more realistic cost/price relationships; industrial prices went up8 percent in 1975 and 12.5 percent in 1975. Overall, the extremely compre-hensive price regulations were applied in 1974 and 1975 with much greaterflexibility than in the past, and this made it possible to absorb a large partof the accumulated and new pressures on prices in Algeria and to establishmore adequate relationships between domestic prices.and factor costs.

- 22 -
46. To preserve the real purchasing power of the wage-earning population,the Government authorized sizable wage increases, especially for the lower-paid groups. Minimum wage increases were as follows:
Agriculture Other sectorsAs of: Dinars/day Dinars/hour
May 1, 1972 9.80 1.73January 4, 1974 12.25 2.08January 1, 1976 15.30 2.40
Family allowances and other social transfers were also increased. Steps weretaken to ease the tax burden on farmers and the lower-income groups. Publicsalaries were increased as of the end of 1974 (see para 40). The ceiling onthe taxable income of individuals was raised in 1975 from DA 2,000 to DA2,500/month. A national commission set up in 1974 continued the studiesneeded for reform of the regulations governing individual wages and otherincomes called for under the 1974-77 Plan.
The Situation in 1976
47. The economic situation appears to have been consolidated in 1976.Based on the data available as of this writing and on indications regardingdevelopments during the year, there have been an appreciable acceleration ofGDP growth and an increase in hydrocarbon exports in both quantity and price.There has been also a stabilization of investment. In combination, these twofactors have reduced the resource gap and enabled the Government to keep thedomestic and external financial situation under control. Further, investmentsmoved towards a more balanced sectoral distribution.
48. An investment stabilization program was put into effect in 1976to bring the economy back into real and financial balance. The Governmentdecided, when drawing up the budget and annual plan for 1976, to maintain theinvestment of public enterprises in industry at the same level as in 1975,in nominal terms. In addition, the budget allocations for Government andpublic-enterprise investment in other sectors were kept at practically thesame nominal level as in the 1975 budget. The figures below illustrate thesedecisions (Millions of Dinars):
Fixed Investment1975 1976
Budget Actual Budget
Public enterprises, industry 12,000 11,970 12,000
Government and public enter-prises, other sectors 13,670 8,960 14,020
- 23 -
Assuming the public enterprise program in industry has been carried out in itsentirety, as in 1975, and that the implementation rate of the Government andpublic-enterprise program in the other sectors will move up to about 80 per-cent in 1976 (against 65 percent in 1975), an increase in total public-sectorinvestment of the order of 10-12 percent in nominal terms would result.Taking into consideration the expected rise in prices of capital goods, thecorresponding real increase would be 4-6 percent. The public-investmentstabilization program should therefore bring about a reduction in the ratioof total investment to GDP, which reached a very high level in 1975.
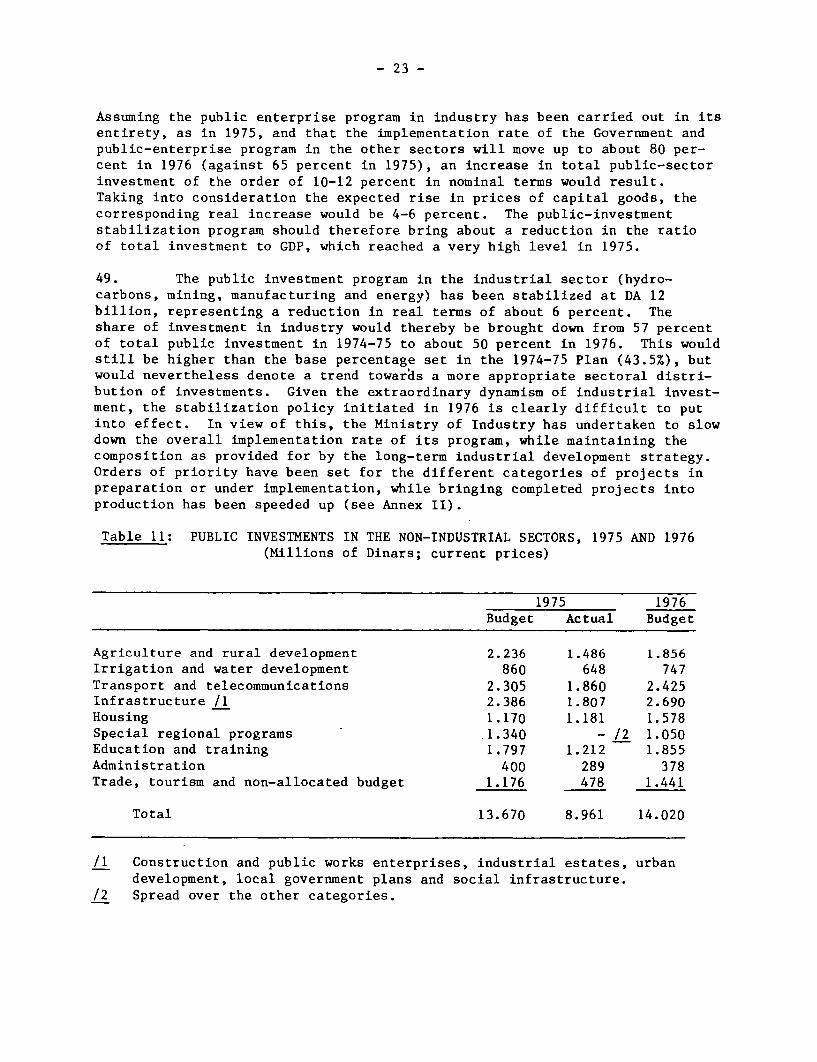
49. The public investment program in the industrial sector (hydro-carbons, mining, manufacturing and energy) has been stabilized at DA 12billion, representing a reduction in real terms of about 6 percent. Theshare of investment in industry would thereby be brought down from 57 percentof total public investment in 1974-75 to about 50 percent in 1976. This wouldstill be higher than the base percentage set in the 1974-75 Plan (43.5%), butwould nevertheless denote a trend towards a more appropriate sectoral distri-bution of investments. Given the extraordinary dynamism of industrial invest-ment, the stabilization policy initiated in 1976 is clearly difficult to putinto effect. In view of this, the Ministry of Industry has undertaken to slowdown the overall implementation rate of its program, while maintaining thecomposition as provided for by the long-term industrial development strategy.Orders of priority have been set for the different categories of projects inpreparation or under implementation, while bringing completed projects intoproduction has been speeded up (see Annex II).
Table 11: PUBLIC INVESTMENTS IN THE NON-INDUSTRIAL SECTORS, 1975 AND 1976(Millions of Dinars; current prices)
1975 1976Budget Actual Budget
Agriculture and rural development 2.236 1.486 1.856Irrigation and water development 860 648 747Transport and telecommunications 2.305 1.860 2.425Infrastructure /1 2.386 1.807 2.690Housing 1.170 1.181 1.578Special regional programs 1.340 - /2 1.050Education and training 1.797 1.212 1.855Administration 400 289 378Trade, tourism and non-allocated budget 1.176 478 1.441
Total 13.670 8.961 14.020
/1 Construction and public works enterprises, industrial estates, urbandevelopment, local government plans and social infrastructure.
/2 Spread over the other categories.

- 24 -
50. As regards the non-industrial sectors (Table 11), the 1976 budgetallocations show pronounced increases for housing (11.3 percent of the non-industrial investment budget compared with 8.6 percent in 1975) and infra-structure, including construction enterprises (19.2 percent in 1976 comparedwith 17.5 percent in 1975). The investment budget for trade is also higher(3.2 percent in 1976 as against 2 percent in 1975). These increases are inresponse to the need to reduce the considerable lags which the development ofthese sectors experienced as compared with the development of the industrialsector. The budget allocations for transportation, telecommunications,education and training have been maintained at about the same levels as in1975. The investment budget for agriculture, rural development and waterdevelopment was scaled down in 1976, to take account of the absorptivecapacity of these sectors, which had been overestimated when setting up the1974 and 1975 budgets with low implementation rates as a result. The budgetfor special regional development programs, which benefit selected wilayate(provinces), has also been reduced because most of these programs are nearingcompletion and are being replaced by the rapidly expanding village and citydevelopment plans.
51. Production in 1976 should benefit from the expected upturn in thehydrocarbon sector. The technical problems posed by the secondary recoveryof crude oil deposits which had caused lower production since 1973 appearto have been solved. The international demand for petroleum products has,moreover, improved. According to estimates by the Secretariat of State forPlanning, production of crude oil and condensate should reach 50 million tonsin 1976 compared with 45.4 million tons in 1975. Gas production should go upfrom 7.4 billion m3 to 10 billion m3 and there should also be an appreciableincrease in the output of refined petroleum products. Altogether, the valueadded of the hydrocarbon sector is expected to be 10 percent up in real termsand hydrocarbon exports should total US$4.7 billion in current prices, asagainst US$4 billion in 1975.
52. Substantial growth is also expected in other sectors. In agricul-ture, the 1975/76 cereal crop benefited from abundant and well distributedrain. Agricultural crops are benefiting now from production prices which,apart from some exceptions such as sugarbeet, appear to be remunerative. Theincreasing management autonomy granted to collective farms in the course ofthe past two years is beginning to have a positive effect on their results.In manufacturing, the production of certain branches (heavy industry, steel,mechanical industry and construction materials) is expected to rise sharply asnew units come into production. Output in light industries should benefitfrom the general rise in purchasing power, especially on the part of farmers,and from the measures taken in 1975 to improve trade channels. For industryas a whole, an increase in capacity utilization can be expected, especially inthe 144 units that came into operations in 1974 and 1975. Finally, consider-able production increases are expected in energy, construction (especiallyhousing construction) and transport, in view of the strong demand and thehigh investments made in preceding years.
- 25 -
53. Altogether, GDP should grow by over 10 percent in real terms in
1976, which would be an appreciable acceleration from the growth rates of the
previous two years. Growth of total consumption should speed up under the
effect of higher domestic income (GDY) and an improved domestic supply of
agricultural and industrial products. This increase in consumption would be
in line with the Government's social policy since it would originate for a
large part from the least privileged social groups who now have access for the
first time to employment and income. Savings would, nonetheless, increase
sufficiently to cover a larger part of total investment than they did in 1975.
54. The resource gap is therefore likely to be significantly smaller
than in 1975, thus easing the pressures on the balance of payments. The terms
of trade are also expected to stabilize after the deterioration that occurred
in 1975. Total imports are not likely to increase in real terms, as the
slower growth of investment should be reflected by a similar slackening in the
requirements of imported capital goods and associated services. Further, the
rise in agricultural production, and especially that of cereals, is likely to
bring about a reduction in food imports. Sizable stocks of equipment and
foodstuffs were built up in 1974 and 1975 which can be used to meet a part of
the additional demand. Imports of intermediates and consumer goods should
grow less rapidly than GDP, in view of the increase in industrial production
for import substitution. Exports, on the other hand, are expected to show a
real increase of 8 to 10 percent. Exports of crude oil and condensate will go
up from 38 million tons in 1975 to 42 million tons in 1976, while those of
liquefied natural gas will rise from 4 billion cubic meters to over 5 billion.
Exports of refined products would, however, drop (by about 20 percent) so
that the rapidly growing domestic demand can be met. Following the increases
that went into effect at the end of 1975, export prices of Algerian hydro-
carbons should increase by an average of 6.5 percent in 1976 as compared with
1975. This increase would offset the expected rise in import prices. Al-
together, the resource gap (goods and non factor services) should be reduced
from DA 7.4 billion in 1975 (balance of payments figure) to about DA 5 billion
in 1976.
55. The balance of payments current account deficit, however, suffered
the adverse effects of the growing interest payments on foreign loans (up
about 40 percent) and the slowdown in the growth of workers' remittances.
This deficit is provisionally estimated at about DA 5.5 billion (US$1.4
billion), which represents a sizeable reduction in relative terms (9 percent
of GDP as against 13.6 percent in 1975). At the same time, the net inflow
from external borrowing is estimated at DA 8.5 billion (US$2.15 billion). An
increase in foreign exchange reserves should be possible on the basis of these
estimates. Net reserves could amount to the equivalent of 2.5-3 months'
imports by the end of 1976. Debt service would rise from 11.9 percent of
exports in 1975 to 14 percent in 1976, with disbursed external debt rising
from 35 percent to some 43 percent of GDP.
- 26 -
56. Such developments have been accompanied by a relatively satisfactorysituation for public finances. Whereas budgetary expenditures were contained,particularly as regards investment and debt rescheduling (where the greaterpart of the expenditures was effected in 1974 and 1975), revenue continued torise thanks to the higher receipts from hydrocarbon exports. As a result, theoverall Government deficit should represent a lower percentage of GDP than itdid in 1975, thus permitting a stabilization or reduction of the Government'sfinancing needs from the banking system and bringing about less acute domesticpressures on price levels than in 1975. No wage increases were authorized in1976.
- 27 -
III. DEVELOPMENT OBJECTIVES AND PROSPECTS
Development Objectives
57. In 1966, the Council of the Revolution defined the fundamentalobjectives and strategy which Algeria proposed to pursue over the fifteenyears up to 1980. These were reaffirmed in detail in the National Charterrecently adopted by the country. In brief, these objectives are as follows:
(1) Expansion and organization of the productive base ofthe national economy in order to reach by 1980 a rateof sustained growth sufficient to assure full employment.
(2) Achievement of economic independence, meaning that Algeriawill have to rely primarily o,n its own means for itsdevelopment, although expansion and diversification ofinternational relations are justified if based on mutualinterest and respect.
(3) Improvement of income distribution, particularly by givingthe most underprivileged regions of the country equaldevelopment opportunities through raising of theirproductive capacities.
The National Charter added the objective of economic democracy, meaning thatthe effective control over investment plans and economic management would bevested in workers' and people's assemblies. It also substantially strength-ened the national commitment to regional development objectives.
58. The rapid establishment of a diversified and highly integratedindustrial base, the education and training of all Algerians for the require-ments of modern tasks and austerity in consumption are still the main elementsof Algeria's long-term development strategy. The National Charter placesemphasis more particularly, however, on the following aspects of the strategy.Whereas priority goes to hydrocarbon development as a means of accumulatingfinancial resources, investments in other industries must henceforth betaylored more closely to the national capacity to prepare and implementprojects, to the availability of financial resources, and to the rates ofdevelopment in non-industrial sectors. The National Charter specificallyunderscores the importance of agriculture for creating jobs, for increasingincomes and improving their distribution and for substituting agriculturalimports. Worker participation in the new management structures, introducedin 1971, is to be progressively expanded to offset the deficiencies inherentin central planning. The control of the people's assemblies over economicplanning and management, which is already effective at local government level,has been introduced at national level by the new constitution approved inNovember 1976. Private enterprise's contribution to national economic
- 28 -
development will be encouraged in small agricultural, industrial and retailenterprises. The Charter envisages, finally, major industrial investmentsalong a communication axis running east-west over the High Plateaux, with aview to bringing modern development to the backward regions of the country'sinterior.
59. Among the elements of the development strategy, the National Charterputs special emphasis on economic decentralization, while maintaining theprinciple of central planning of the economy. Decentralization is seen as themeans to mobilize creative energies at all levels so as to achieve the coun-try's development objectives with maximum efficiency. In addition to themeasures already taken in several sectors over the past few years, the pro-cedures by which decentralization will be implemented in all areas of economicand social life in a manner compatible with central planning, are presentlybeing put into effect and adjusted--a difficult and time consuming taskin most cases.
60. In agriculture, increased autonomy was given to self-managed farms(domaines auto-ge'res) in 1975, based on the encouraging results and theinstitutional framework of the cooperative sector of the Agarian Revolution.The self-managed farms, like the cooperatives, will from now on be very largelyresponsible for their own production and investment plans, under the supervi-sion of the regional authorities and the local branches of the Banque Nationaled'Algerie (the agricultural credit bank). The Ministry of Agriculture istherefore now freed from day-to-day supervision of the self-managed farms andcan devote itself to coordinating production and investments at nationallevel. The supply of inputs and trade in agricultural products have also beenreorganized; this was done when the service cooperatives were set up at com-mune (village) level (CAPCSs) 1/ and at wilaya (province) level (COFELs) 2/.The agricultural price system is under review with the aim of making it amore effective production incentive and ensuring incomes for agriculturalworkers that are appropriate from the viewpoints of equity and economicefficiency.
61. In industry, procedures for the socialist management of enterprises(GSE), which was introduced in 1971, are in effect now in about 20 nationalenterprises, and they will be extended progressively to other sectors. GSEprocedures organize workers' participation in the management of their enter-prises through workers' assemblies and councils elected for each establish-ment and each large enterprise (see Annex II). GSE procedures also providethat workers will receive a share of the enterprises' financial surpluses.Under GSE procedures, enterprise management will have to pay increasingattention to economic efficiency and, with this end in view, the enterpriseswill be given wider responsibilities, especially in the spheres of wage policyand financial management (see next paragraph). Domestic trade in industrial
1/ "Cooperatives agricoles polyvalentes de services"
2/ "Cooperatives des fruits et legumes"

- 29 -
products, like that in agricultural commodities, is currently being reorganized.With a view to greater flexibility and lowest costs of trade between producersand consumers (or users), production enterprises will now, depending on theparticular case, be authorized to sell their products and purchase theirsupplies on their own.
62. Regarding the financial system, the 1976 Budget Law provides thatthe Treasury may now grant long-term loans for working capital to public enter-prises, which was up to now financed by short-term loans. It further removesthe obligation formerly placed on public enterprises and establishments todeposit their amortization and reserve funds with the Treasury. The banks arecalled upon to exercise increasing controls over the financial and economicmanagement of enterprises. To facilitate these controls, enterprises are nowrequired to submit detailed accounts in support of their credit applications,in order to enable the banks (which are the keepers of national savings) toassess the use that is made of bank credit. It is expected that such proce-dures will provide an opportunity for a fruitful dialogue between banks andenterprises regarding the latters' economic and financial management. Thisdialogue has already begun in several cases, and the move toward increasingautonomy on the part of enterprises, coupled with public financial and ac-counting control, should continue to expand. Although the establishment ofan economically rational prices and wages system is still at the study stage,significant steps have been taken recently (see paragraph 45) to ensure thatthe prices of certain key products bear proper relation to the cost of inputsrequired in their production. In this field also, economic rationality willbe introduced gradually and prudently.
63. In the context of regional development policy, the regional decen-tralization of administrative, economic and financial powers is already veryadvanced. The basic units for regional planning and management are thewilayate (provinces) and communes (municipalities), who contribute directlyto the preparation and implementation of the regionalization of the nationalPlan. Within their areas, the wilayate chiefs (Walis) have extensive finan-cial and economic powers which they exercise under the supervision of thewilayate people's assemblies. The wilayate governments have planning unitsand representatives of the technical ministries who can carry out most of thepreparation, implementation and supervision of the local, urban and communeplans which are progressively replacing the former special regional programs.Coordination and supervision of these plans at national level is handled bythe Secretariat of State for Planning. The wilayate and communes also havepowers and budgets to set up enterprises to meet local needs and make use oflocal resources in all economic sectors. A number of public works and serviceenterprises owned jointly by several communes have been set up, and locallight industry projects are under preparation or being implemented (see AnnexII). After further study, the financial resources of local governments may beincreased by transferring to them some tax revenues currently collected by theCentral Government. The decentralized institutions, already established atwilaya and commune level, allow local initiatives to emerge and thus create

- 30 -
considerable dynamism for development projects. The movement toward regionaldecentralization deserves to be encouraged and pursued from this viewpoint,provided, however, there is appropriate supervision and coordination on thepart of central authorities.
Economic Prospects
64. The Government's decision to slow down the growth of investmentin 1976, and the publication of general guidelines in the National Charter,were not accompanied by a systematic revision of the 1974-77 Plan and theofficial medium-term projections. Adjustments will be made in 1977 when the1978-81 Plan is prepared. The mission nevertheless attempted to quantifyAlgeria's economic and financial prospects basing itself on the generalorientations laid down for the economy and the long-term development programsof the main sectors. It used a macroeconomic model that was necessarilysimple in view of the data available, but still useful since it ensuresconsistency between national and external economic magnitudes--hence betweenthe policies underlying these magnitudes--and makes it possible to follow thereal effect on the economy of expected changes in import and export prices.Taking 1975 as base year and incorporating the policy decisions of 1976, theprojection aims primarily at tracing the equilibrium line between investmentrequirements and the financial constraint, over the medium and long term.It assumes that Algeria will continue to use external borrowing to the extentcompatible with its long-term debt-carrying capacity, in order to speed up asmuch as possible the pace of its economic development.
65. Based on assumptions that are explained in the following paragraphs,it appears that Algeria could maintain a relatively high rate of GDP growth(about 8% p.a.) over the coming decade, thanks in particular to the expecteddevelopment of the hydrocarbon sector and the expansion of the other sectorsof the economy, mainly for import substitution. Whereas investment wouldgradually move towards a sustainable proportion of the country's resources,the overall deficit of the economy (imports less exports in terms of interna-tional purchasing power) would remain substantial up to the early 1980's, thusentailing considerable external capital requirements. External borrowingswould be required in particular to finance the gas export development program.Later in the 1980's, the overall deficit of the economy would diminish, mainlybecause of the combined effect of liquified gas exports and lower requirementsfor investment in gas development. The main economic magnitudes of theprojection are shown in Table 12.
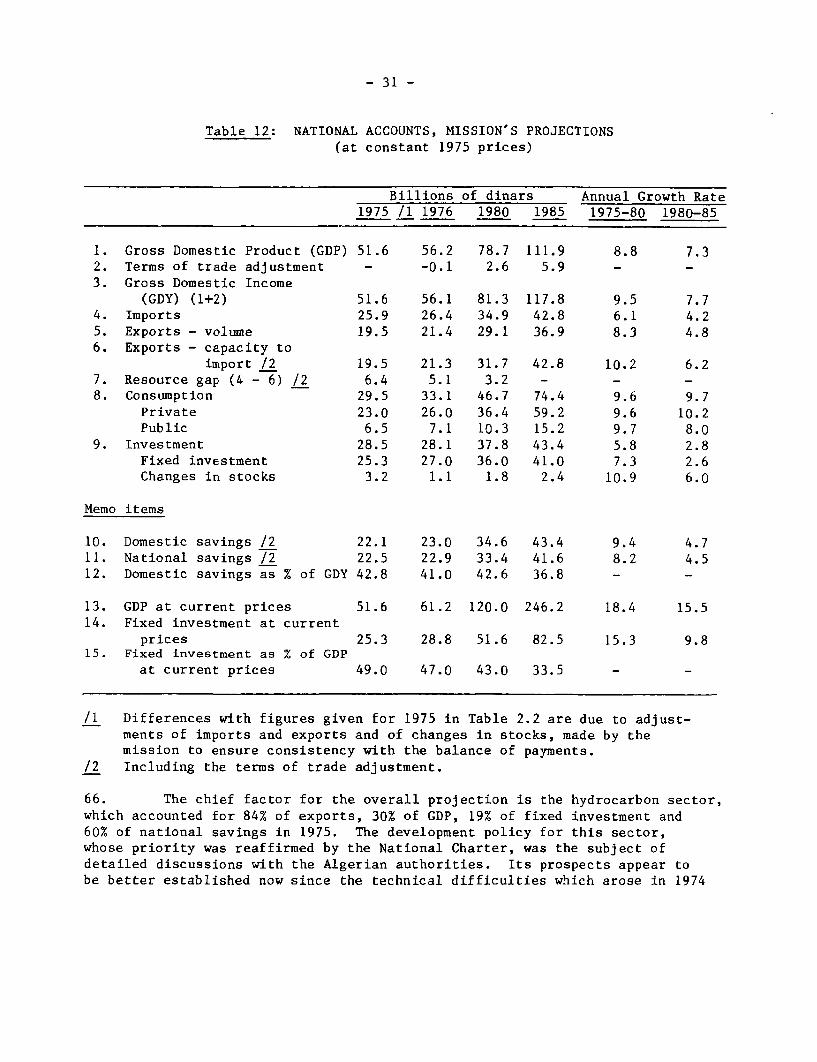
- 31 -
Table 12: NATIONAL ACCOUNTS, MISSION'S PROJECTIONS(at constant 1975 prices)
Billions of dinars Annual Growth Rate1975 /1 1976 1980 1985 1975-80 1980-85
1. Gross Domestic Product (GDP) 51.6 56.2 78.7 111.9 8.8 7.32. Terms of trade adjustment - -0.1 2.6 5.9 - -3. Gross Domestic Income
(GDY) (1+2) 51.6 56.1 81.3 117.8 9.5 7.74. Imports 25.9 26.4 34.9 42.8 6.1 4.25. Exports - volume 19.5 21.4 29.1 36.9 8.3 4.86. Exports - capacity to
import /2 19.5 21.3 31.7 42.8 10.2 6.27. Resource gap (4 - 6) /2 6.4 5.1 3.2 - - -8. Consumption 29.5 33.1 46.7 74.4 9.6 9.7
Private 23.0 26.0 36.4 59.2 9.6 10.2Public 6.5 7.1 10.3 15.2 9.7 8.0
9. Investment 28.5 28.1 37.8 43.4 5.8 2.8Fixed investment 25.3 27.0 36.0 41.0 7.3 2.6Changes in stocks 3.2 1.1 1.8 2.4 10.9 6.0
Memo items
10. Domestic savings /2 22.1 23.0 34.6 43.4 9.4 4.711. National savings /2 22.5 22.9 33.4 41.6 8.2 4.512. Domestic savings as % of GDY 42.8 41.0 42.6 36.8 - -
13. GDP at current prices 51.6 61.2 120.0 246.2 18.4 15.514. Fixed investment at current
prices 25.3 28.8 51.6 82.5 15.3 9.815. Fixed investment as % of GDP
at current prices 49.0 47.0 43.0 33.5 - -
/1 Differences with figures given for 1975 in Table 2.2 are due to adjust-ments of imports and exports and of changes in stocks, made by themission to ensure consistency with the balance of payments.
/2 Including the terms of trade adjustment.
66. The chief factor for the overall projection is the hydrocarbon sector,which accounted for 84% of exports, 30% of GDP, 19% of fixed investment and60% of national savings in 1975. The development policy for this sector,whose priority was reaffirmed by the National Charter, was the subject ofdetailed discussions with the Algerian authorities. Its prospects appear tobe better established now since the technical difficulties which arose in 1974

- 32 -
seem to have been overcome and the external demand for Algerian oil and gas,especially the latter, has been firmed up for the years ahead. Based on dataavailable at the time of writing this report, the following projections havebeen adopted, and may be compared to actuals for 1973 and 1975:
Actuals Projections1973 1975 1976 1980 1985
Production
Crude oil (millions of tons) 49.6 43.7 47.7 57.0 60.0Condensate (millions of tons) 1.2 1.7 2.2 8.0 15.0Refined products (millions of tons) 4.9 5.6 6.3 25.0 28.0LNG (billions of cubic meters) 2.5 4.2 5.5 20.5 56.0
Exports
1975 prices (US$ billions) 4.4 4.0 4.4 5.9 7.0Current prices (US$ billions) 2.7 4.0 4.7 9.5 17.6Price index (1975 = 1.0) 0.6 1.0 1.1 1.6 2.5
67. The above projections seem prudent in terms of both quantities andprices. Regarding quantities, they assume that crude oil production will notregain its 1973 level until 1977 and that it will level out at 60 milliontons--the known capacity of the existing fields with the secondary recoveryequipment installed over the past two years--beginning in 1981. The projectedoutput of refined products, liquefied natural gas (LNG), condensate and otherliquid gases associated with natural gas is based on projects that are eitherbeing implemented or firmly committed. Regarding export prices, it is assumedthat oil and refined oil products will retain a stable international purchasingpower, and that, based on the contracts concluded in 1975, the LNG price willrise linearly from about US$0.50 per million BTU's in 1976 to US$1.30 in 1980,in 1976 prices. The increase expected in the hydrocarbon price thereforereflects primarily the projected rate of international price inflation and,to a lesser extent, the rise in the real price and relative importance of LNGexports.
68. Export projections for products other than hydrocarbons and servicesare also conservative. Exports of agricultural products would increase inreal terms at an annual rate of 12.5% up to 1980, which takes account of thevery low level of the base year (1975), and at 8% thereafter. The growth ofindustrial exports is expected to accelerate after 1980--17% p.a. as comparedwith 8% from 1975 to 1980--since export possibilities should then open up forthe industrial capacities installed primarily to serve the domestic market.Altogether, with hydrocarbons, export growth would be about 8% p.a. for1976-80 and about 5% for 1981-85. However, the import capacity of exports(exports at current prices divided by the import price index) would risesubstantially faster than that due to the expected increase in the relativeprice and importance of LNG (Table 11, lines 5 and 6).
- 33 -
69. The second important factor in the economic projection is invest-ment, because of its currently very high level and its determining effect onthe future output growth for export and import substitution. The investmentrequirements of the Algerian economy are going to remain large. Very largeamounts will be needed to develop the LNG and condensate export capacity inconformity with the contracts concluded with foreign purchasers (the cost ofone billion cubic meters of export capacity, including transportation andprocessing in Algeria but excluding sea transport, is about US$250 million at1976 prices). The secondary recovery, refining and transportation of oil willcall for very sizeable amounts. In other sectors, investment requirementswill also be considerable because of the highly capital-intensive techniquesgenerally used in industry and the need rapidly to develop the economic andsocial infrastructure and to modernize agriculture, in order to allow effi-cient use of production capacities. The Government therefore is expectedto continue a dynamic investment policy. At the same time, however, theprojected trend reflects the Government's policy, which began in 1976, tobring the level and composition of investment into line with the availabilityof financial resources and the need for sectoral balance. Consequently, theprojection assumes a moderate growth of total investment, which represents anoptimum for maintenance of the country's financial stability over the mediumand long term, and for its absorptive capacity defined in terms of reasonableefficiency for the economic system. Fixed investment is projected as follows(average annual amounts in billions of dinars and 1975 prices):
1976-78 1979-82 1983-85
Gas development 3.9 7.8 6.8Other sectors 24.6 28.6 33.2Total 28.5 36.4 40.0
Up to 1979, investment in gas would rise rapidly while investment in othersectors would be stabilized in real terms. The stabilization in sectors otherthan gas should, moreover, be accompanied by the reorientation, commenced in1976, of the distribution of investment over industry and the non-industrialsectors. From 1979 to 1982, investment in gas is expected to remain high, butthere could be an increase in investment in the other sectors. After 1982,the investment requirements for gas development would diminish, and thus thegrowth of total investment could slow down and thic -lid ease externalfinancing requirements. The ratio of fixed investment to GDP at currentprices is expected to go down from 49% in 1975 to about 34% in 1985. 1/
1/ Investment prices are projected taking IBRD forecasts for internationalprices of capital goods. GDP prices are based on the price assumptionsfor hydrocarbons in paragraph 66 and an assumed increase in other domesticprices.
- 34 -
70. The efficiency of the economic system, the third determining factorfor the projection, is at this stage the most uncertain element in assessingthe production prospects of sectors other than hydrocarbons. Distinct improve-ments have been noted recently in the planning and management framework of theeconomy and the policies laid down in the National Charter provide grounds forexpecting further progress in these areas. However, much remains to be doneto strengthen planning, improve project implementation and increase capacityutilization. Progress in these areas is subject to several constraints, whichthe mission is unable to assess (and therefore quantify) in detail owing tolack of time and sufficient data.
71. The primary constraint is availability of skilled and experiencedmanpower. Algeria expects a shortage of skilled labor until around the mid-1980's. For higher levels of qualification, a partial but relatively satis-factory solution should be found in temporary recourse to expatriates, althoughthis is very costly. At mid-levels of qualification, the shortage of managerialand technical workers will however persist and this will make it difficult touse fully the investments that have been made. This constraint should berelieved gradually considering the considerable training efforts in Algeria.The return into the national economy of skilled emigrant workers should alsohelp relieve this constraint. For the official policy to promote such returnsto be fully effective, however, inducements (particularly housing and urbanservices) will need to be rapidly improved.
72. Other constraints could be overcome more rapidly if the growth ofinvestment remains as moderate as projected. Project preparation and imple-mentation has begun to improve in industry and economic infrastructure, wherefeasibility studies and implementation schedules seem to be increasinglyreliable. With the experience gained during the initial years of development,an improvement in management and technical capabilities can also be observedin industry. As a result, the technical aspects of plant start up are nowbetter controlled (see Annex II). Moreover, the shortage of strategic pro-ducts, especially construction materials, is easing and less of a physicalconstraint, and construction enterprises are rapidly expanding, although theycannot still meet all the demand on their services. Finally, Algeria isemploying a new contract formula with foreign firms for the implementation ofcertain industrial projects. This is the "product-in-hand" contract, whichrequires the contractor to train personnel, provide technical assistance inthe plant and achieve a normal level of production during start up. Thesecontracts are olviously more costly for Algeria, but they seem to lead tobetter results than "turnkey" contracts in most cases.
73. A final cxtegory of constraints weighing on the efficiency of theeconomy is particularly difficult to dssess, since it derives from the generalplanning and mana-ement framework. For instance, numprous projects suffer frominadequate coordination with other projects, either upstream or downstream,in the same sector or in others. Investments, and occasi-nally considerableones, will probably be needed to adapt these projects to their environments in
- 35 -
order to bring their output up to design capacity. Limited data are presentlyavailable on this coordination problem, which would warrant a systematic andin-depth study with a view to determine case by case the investments needed toovercome it. The level of certain relative prices and insufficient accountingare also obstacles to achieving full utilization of production capacities, butthe importance of these factors is difficult to ascertain. Strengthening ofplanning (overall and especially sectoral) and of accounting and financialcontrols are important objectives, since it is the indispensable counterpartof the management decentralization, which the Government is endeavoring to putinto effect.
74. Taking these constraints into account, and in view of the capital-intensive investments needed for hydrocarbons, the incremental capital outputratio (ratio of fixed investment to increase in value added with one year lag)implicit in the projection is relatively high, reaching 5.3 for the period1976-80 and 5.7 for 1981-85.
75. The growth rates for the main sectors of the economy are projectedas follows:
Annual growth in %1975-80 1980-85
Gross domestic product 8.8 7.3
Hydrocarbons 10.7 4.0
Other sectors, 7.9 8.8of which: Agriculture 4.5 3.5
Industry 8.2 9.5Services 8.6 9.4
The growth of the hydrocarbon sector is projected from the assumptions given inparagraph 66. The growth of agriculture and industry is projected exogenously(see next paragraph). The growth of the service sector should be rapid, inview of the level of development reached by Algeria and the considerable ex-pansion requirements of economic and social infrastructure, housing, trade,financial services and administrative capacity. It is linked in the projec-tion by an elasticity of 1.15 to the combined growth of agriculture andindustry. Overall, GDP growth is expected to be more rapid over 1976-80, dueto the projected increase in hydrocarbon output until the early 1980's. After1980, the growth of non-hydrocarbon sectors would accelerate as a result ofpast investments in these sectors, while the growth of hydrocarbons would slowdown as crude oil output would stabilize (para. 67).
76. The growth rate forecast for agriculture is relatively high. Thisis to take account of the low production level in the base year (1975), whichwas below that of 1971 and 1972, and of the progress that should follow from
- 36 -
the dynamic policy put into effect by the Government to encourage production
in the sector, improve its management structures and modernize its production
methods. Implementation of the Agrarian Revolution, which is central to
Algeria's agricultural policy, is well advanced and the results to date seem
to be quite positive. The first phase, which consisted of establishing pro-
duction cooperatives on public collective lands, has been completed. The
second phase, which involved the redistribution of private lands exceeding
a legal maximum and the establishment of cooperatives on the redistributed
lands, is nearing completion. Redistribution is finished, but a number of
cooperatives still have to be organized and equipped. Altogether in 1976,
about 3,600 production cooperatives (CAPRA's) 1/, some 760 operating coopera-
tives (CAEC's) 2/, and 830 development groups (GMV's) 3/, involving nearly
100,000 beneficiaries, had been formed, and over 600 communal service coopera-
tives (CAPCS's) 4/ had been set up. About 60 socialist villages, intended
for beneficiaries of the Agrarian Revolution, had been built or were under
construction. The third phase of the Agrarian Revolution, which consists
in establishing livestock cooperatives on the extensive grazing lands of the
steppe, has begun in three pilot wilayate (provinces); the first livestock
cooperatives, which involve fencing of large steppic areas, seem to have re-
gistered favorable results for meat production and shepherds' incomes. This
third phase aims at a fundamental transformation of resource management in
the steppe, and it could have considerable social and economic effects.
The Agrarian Revolution should furthermore have a beneficial effect on the
productivity of small private farms which can take advantage of the services
(supply of inputs, extension, marketing) provided by the service cooperatives
set up in each rural commune. In the self-managed sector, land reallocation
is under way, the long-term aim being to merge this sector with that of the
Agrarian Revolution cooperatives. Appreciable progress in the productivity
and financial results of the self-managed sector have resulted from the
decentralization measures introduced in 1975.
77. The growth rate projected for industry (mining, energy, manufac-
iuring and construction) is significantly higher than the rates achieved over
recent years. This acceleration would result from three main factors, which
-re analyzed in detail in Annex III. In the first place, a large number of
-mportant projects of the 1974-77 Plan are being completed, and will begin
production in the years immediately ahead. Secondly, capacity utilization
,Thr the projects which came into production in recent years should improve
steadily for the reasons explained above (paragraphs 70-73). Finally, the
1/ Cnopnratives agricoles polyvalentes de la Revolution Agraire.
Cooperatives agricoles d'exploitation en commun.
oroupements de mise en valeur.
a CooperatVves agricoles polyvalentes, communales de services.
- 37 -
Government's policy designed to moderate the rate of industrial investmentand reduce development lags in other sectors should make it possible to removethe intersectoral bottlenecks which presently constrain output in the indus-trial sector. This stabilization period would also allow to consolidate theresults already achieved in the industrial sector. After 1980, the develop-ment of industry could continue to be rapid thanks to the renewed momentum ofinvestment which appears possible. Moreover, with a modern industrial baseestablished by then and oriented mainly toward the domestic market, severalbranches possessing comparative advantages ought to be able to begin exporting.
78. Consumption growth could be rapid. In the projection, public con-sumption is linked to GDP by an elasticity coefficient of 1.10, which takesaccount of the need to develop administrative capacity, particularly in theeducation and social fields. Private consumption is calculated residually.It would increase yearly by 9.9 percent during 1976-85 (Table 12), or by about6 percent per capita, taking population growth into consideration. Thisrelatively high rate reflects the Government's policy of fostering the con-sumption of the low-income groups, and is in line with the rapid rate ofemployment creation and the projected growth of the supply of goods andservices from domestic sources. The growth of national savings would never-theless be appreciably higher than that of investment, due in particular toimprovements in the terms of trade, which are projected as follows:
Indices (1975 = 100)1975 1976 1978 1980 1982 1985
Export prices 100.0 106.3 126.4 157.6 184.5 238.3Import prices 100.0 106.4 127.1 144.5 166.1 205.1Terms of trade 100.0 99.9 99.5 109.1 111.1 116.2
79. Import requirements are determined in the projection by their enduses, namely consumption, investment, and intermediate demand of industry;requirements are linked to these uses by appropriate elasticity coefficients.Capital goods imports are linked to investment by an elasticity of 0.9, whichtakes account of the reorientation of the composition of investment in favorof economic and social infrastructure, where the imported capital goods com-ponent is less than in industry. For imports of intermediate and consumergoods, the respective elasticities are adjusted progressively downward, asprogress is expected in the country's import substitution capacity and verti-cal industrial integration (downstream or upstream). The same applies forthe elasticity of foodstuff imports (related to private consumption) whichtakes account particularly of the growth assumption for agricultural produc-tion. Services, which consist for the greater part of the cost of studiesand civil works by foreign enterprises, are linked to investment by anelasticity that is also declining, due to the expected development of Algerianproject preparation and implementation capabilities.
80. The different import categories are projected to increase as follows,in real terms:

- 38 -
Annual growth rate (%)1975-80 1980-85
Capital goods 5.9 2.2Intermediate goods 7.6 6.0Consumer goods 7.5 5.5Food products 4.9 4.9Services 7.0 2.3
Total 6.1 4.2
Import grow less rapidly than GDP (the average elasticity of imports withrespect to GDP works out at 0.69 in 1976-80 and 0.58 in 1981-85) for severalreasons. First, after the very marked rise in imports in 1974 and 1975, asubstantial part of which was accumulated in stocks of foodstuffs and capitalgoods, a reduction in the volume and a slowdown in the growth of imports ofthese categories, respectively, can be expected in 1976, which thereforereduces the average elasticity for the period 1976-80. Second, a large partof GDP growth up to 1980 will come from hydrocarbons whose output requiresvery little intermediate imports. Over the following years, 1980-85, capitalgoods imports would rise at the same, very moderate rate as total investment.Finally, the assumption adopted for the efficiency of the economy implies arelatively rapid rise in production for import substitution purposes.
Financial Prospects
81. Based on such economic prospects, the balance of payments cur-rent account can be expected to follow the pattern shown in Table 13. Theeconomy's resource gap (balance of current transactions on goods and services),in current prices, is expected to average US$1.5 billion during the five-yearperiod 1976-80 mainly because of heavy investments for gas development. Thisdeficit would diminish in the years thereafter and turn into a small surplusby 1985, the chief causes of this favorable trend being the improvement in theterms of trade, the lower investment requirements of the hydrocarbon sector,the increase in gas exports and the parallel increase in production for importsubstitution. Regarding factor services and current transfers, Algeria shouldexpect a growing deficit throughout the projection period. Emigrant workerremittances would at best remain stable at constant prices, increasing incurrent prices at a rate only similar to that of international price inflation,whereas interest payments on external loans would rise rapidly and payments inremuneration of foreign capital and labor can also be expected to increase.Altogether, the current account balance would show a growing deficit up to1979--probably reaching US$2 billion in that year. This deficit would tend todiminish in later years, but remain substantial (averaging about US$1 billioneach year) because of rising interest payments on external debts.
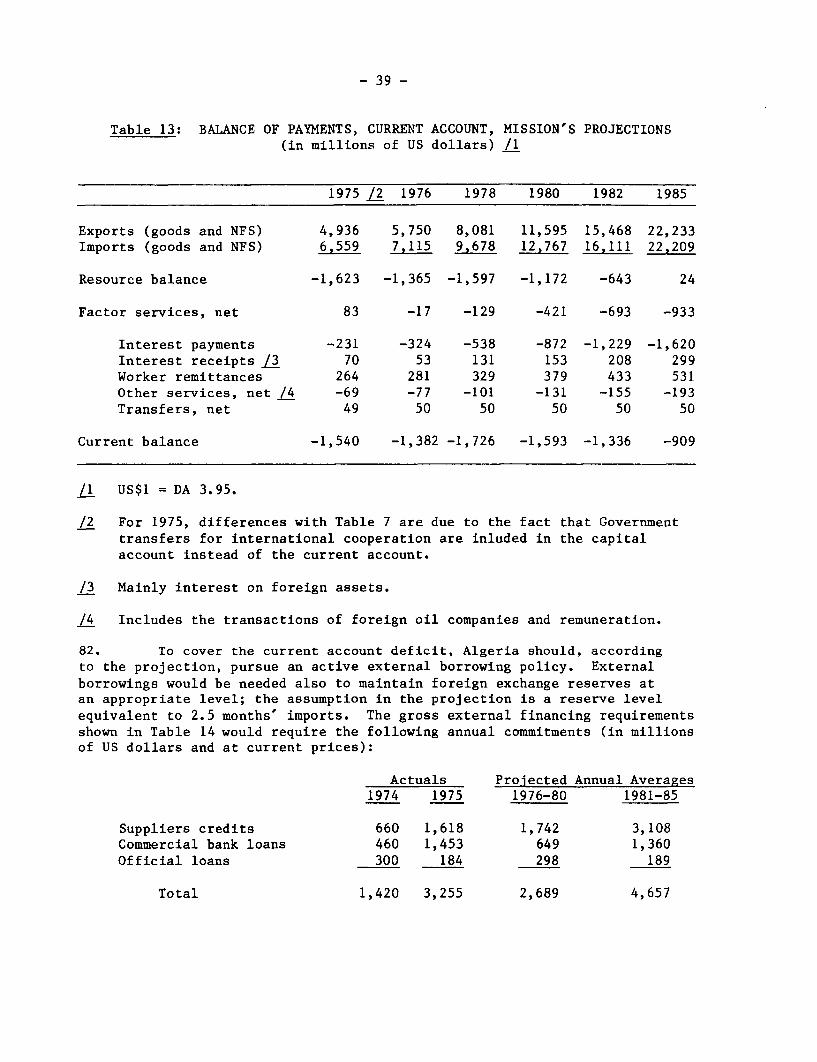
- 39 -
Table 13: BALANCE OF PAYMENTS, CURRENT ACCOUNT, MISSION'S PROJECTIONS(in millions of US dollars) /1
1975 t2 1976 1978 1980 1982 1985
Exports (goods and NFS) 4,936 5,750 8,081 11,595 15,468 22,233Imports (goods and NFS) 6,559 7,115 9,678 12,767 16,111 22,209
Resource balance -1,623 -1,365 -1,597 -1,172 -643 24
Factor services, net 83 -17 -129 -421 -693 -933
Interest payments -231 -324 -538 -872 -1,229 -1,620Interest receipts /3 70 53 131 153 208 299Worker remittances 264 281 329 379 433 531Other services, net /4 -69 -77 -101 -131 -155 -193Transfers, net 49 50 50 50 50 50
Current balance -1,540 -1,382 -1,726 -1,593 -1,336 -909
Li US$1 = DA 3.95.
/2 For 1975, differences with Table 7 are due to the fact that Governmenttransfers for international cooperation are inluded in the capitalaccount instead of the current account.
/3 Mainly interest on foreign assets.
/4 Includes the transactions of foreign oil companies and remuneration.
82. To cover the current account deficit, Algeria should, accordingto the projection, pursue an active external borrowing policy. Externalborrowings would be needed also to maintain foreign exchange reserves atan appropriate level; the assumption in the projection is a reserve levelequivalent to 2.5 months' imports. The gross external financing requirementsshown in Table 14 would require the following annual commitments (in millionsof US dollars and at current prices):
Actuals Projected Annual Averages1974 1975 1976-80 1981-85
Suppliers credits 660 1,618 1,742 3,108Commercial bank loans 460 1,453 649 1,360Official loans 300 184 298 189
Total 1,420 3,255 2,689 4,657
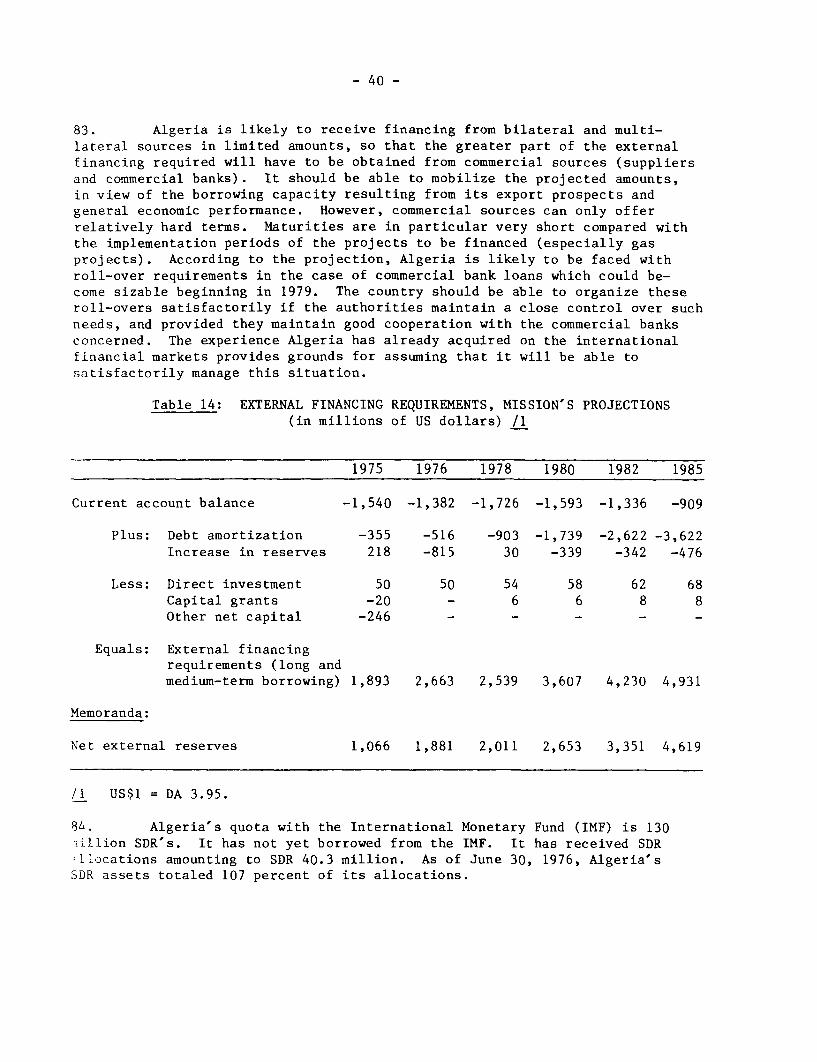
- 40 -
83. Algeria is likely to receive financing from bilateral and multi-lateral sources in limited amounts, so that the greater part of the externalfinancing required will have to be obtained from commercial sources (suppliersand commercial banks). It should be able to mobilize the projected amounts,in view of the borrowing capacity resulting from its export prospects andgeneral economic performance. However, commercial sources can only offerrelatively hard terms. Maturities are in particular very short compared withthe implementation periods of the projects to be financed (especially gasprojects). According to the projection, Algeria is likely to be faced withroll-over requirements in the case of commercial bank loans which could be-come sizable beginning in 1979. The country should be able to organize theseroll-overs satisfactorily if the authorities maintain a close control over suchneeds, and provided they maintain good cooperation with the commercial banksconcerned. The experience Algeria has already acquired on the internationalfinancial markets provides grounds for assuming that it will be able tosatisfactorily manage this situation.
Table 14: EXTERNAL FINANCING REQUIREMENTS, MISSION'S PROJECTIONS(in millions of US dollars) /1
1975 1976 1978 1980 1982 1985
Current account balance -1,540 -1,382 -1,726 -1,593 -1,336 -909
Plus: Debt amortization -355 -516 -903 -1,739 -2,622 -3,622Increase in reserves 218 -815 30 -339 -342 -476
Less: Direct investment 50 50 54 58 62 68Capital grants -20 - 6 6 8 8Other net capital -246 - - - - -
Equals: External financingrequirements (long andmedium-term borrowing) 1,893 2,663 2,539 3,607 4,230 4,931
Memoranda:
Net external reserves 1,066 1,881 2,011 2,653 3,351 4,619
/1 US$1 = DA 3.95.
84. Algeria's quota with the International Monetary Fund (IMF) is 130fhllion SDR's. It has not yet borrowed from the IMF. It has received SDRlLocations amounting to SDR 40.3 million. As of June 30, 1976, Algeria's
SDR assets totaled 107 percent of its allocations.
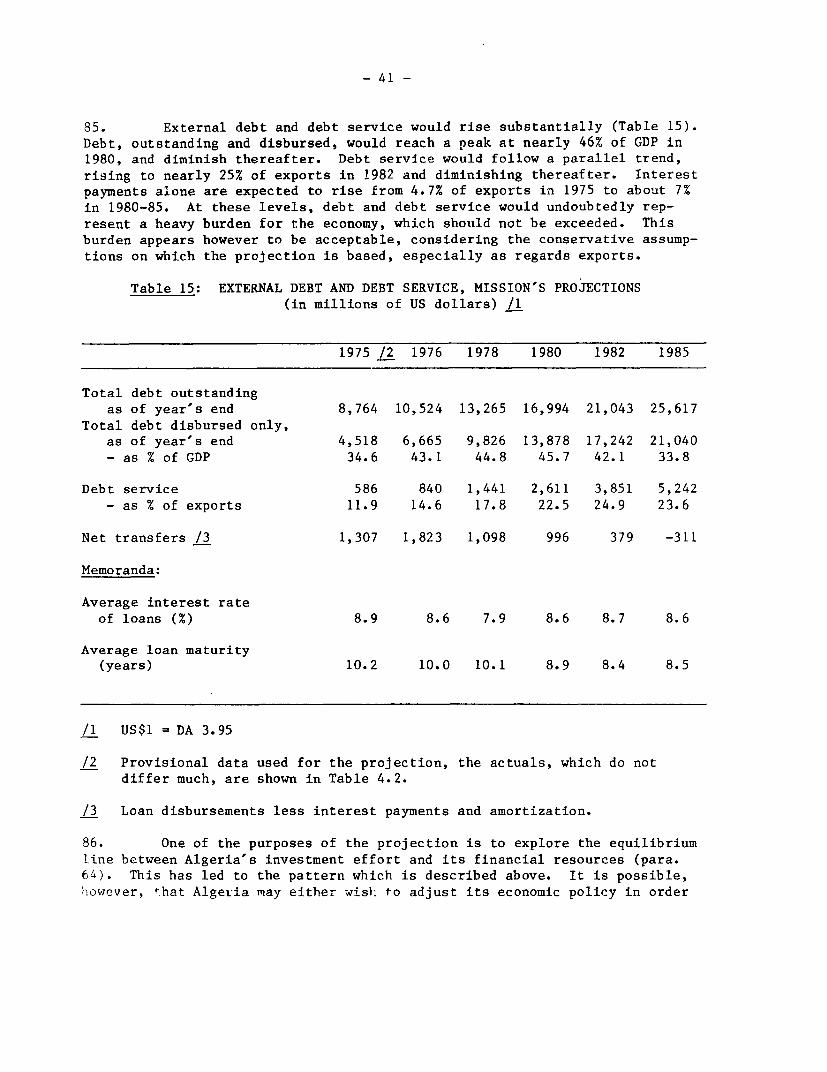
- 41 -
85. External debt and debt service would rise substantially (Table 15).Debt, outstanding and disbursed, would reach a peak at nearly 46% of GDP in1980, and diminish thereafter. Debt service would follow a parallel trend,rising to nearly 25% of exports in 1982 and diminishing thereafter. Interestpayments alone are expected to rise from 4.7% of exports in 1975 to about 7%in 1980-85. At these levels, debt and debt service would undoubtedly rep-resent a heavy burden for the economy, which should not be exceeded. Thisburden appears however to be acceptable, considering the conservative assump-tions on which the projection is based, especially as regards exports.
Table 15: EXTERNAL DEBT AND DEBT SERVICE, MISSION'S PROJECTIONS(in millions of US dollars) /1
1975 /2 1976 1978 1980 1982 1985
Total debt outstandingas of year's end 8,764 10,524 13,265 16,994 21,043 25,617
Total debt disbursed only,as of year's end 4,518 6,665 9,826 13,878 17,242 21,040- as % of GDP 34.6 43.1 44.8 45.7 42.1 33.8
Debt service 586 840 1,441 2,611 3,851 5,242- as % of exports 11.9 14.6 17.8 22.5 24.9 23.6
Net transfers /3 1,307 1,823 1,098 996 379 -311
Memoranda:
Average interest rateof loans (%) 8.9 8.6 7.9 8.6 8.7 8.6
Average loan maturity(years) 10.2 10.0 10.1 8.9 8.4 8.5
/1 US$1 = DA 3.95
/2 Provisional data used for the projection, the actuals, which do notdiffer much, are shown in Table 4.2.
/3 Loan disbursements less interest payments and amortization.
86. One of the purposes of the projection is to explore the equilibriumline between Algeria's investment effort and its financial resources (para.64). This has led to the pattern which is described above. It is possible,however, that Algeria may either wish to adjust its economic policy in order

- 42 -
to reduce its external borrowing requirements, or find some financing on morefavorable terms than those assumed in this report.
87. The projected development effort implies that strict domestic finan-cial policies will be followed. The Government has made a remarkable savingeffort up to the present, despite the introduction of tax relief measuresand the increase in price subsidization in favor of the less privileged socialgroups in 1975. The projection in this report implies that the budget savingeffort will be continued. It also implies increases in the financial resultsof public enterprises which would allow them to contribute more to the budgetthrough direct taxation. With respect to the Government's current expendi-tures, price subsidization is likely to diminish, since the exceptional foodprice increases in 1975 seem now to be normalized. It is also expected thatthe growth of other current spending will remain moderate for the CentralGovernment as well as for local Governments. The latter are being givenincreased responsibilities, and systematic budget supervision procedures areto accompany regional financial decentralization. Finally, the introductionof new mechanisms for mobilizing private liquid savings is to be pursued. Inthis connection, the "housing saving" scheme introduced by CNEP deserves tobe developed as rapidly as CNEP's management capacity and housing programspermit.
ANNEX 1Page 1
ESTIMATE OF NATIONAL ACCOUNTS AT CONSTANT PRICES
Introduction
1. Algeria's national accounts are available only in current prices.The mission made an estimate of the accounts at constant prices, which isgiven in the following tables. 1975 constant prices were chosen as referenceprices, since 1975 is used as base year in the long-term projections given inthe report. The calculations were made for the years 1971 to 1975, for whicha set of homogeneous accounts at current prices is available. 1/
Methodology
2. The calculations presented in the tables below call for the follow-ing comments. Value added by agriculture, mining, energy, manufacturing andconstruction are deflated by production price indices, for lack of other data(Table 2). This is not a perfect method since prices applicable to valueadded, which depend both on the cost of intermediate consumptions and the costof the final product, do not necessarily follow production prices, particu-larly in a period of considerable variations in relative prices. In the caseof hydrocarbons, which have undergone the sharpest price changes, indices ofvalue added per ton were used and the results thus obtained seem reliable.The transport and services sectors were deflated by retail price indices, forlack of anything better.
3. Imports, exports, consumption and investment were deflated by therelevant indices. The difference between total uses and resources at constantprices is represented by a statistical discrepancy the significance of whichis discussed below. Imports and exports are divided into major product cate-gories available from the Customs statistics. As shown in Tables 8 and 9,indices based on changes in per-ton prices are used for product categorieswhose composition remains homogeneous over time (food, raw materials, semi-manufactures and hydrocarbons). For other categories (capital and consumergoods), IBRD international price indices, adjusted for exchange rate changes,are used. For reasons connected with the composition and conditions of in-vestment in Algeria, prices of imported capital goods may have risen more inAlgeria than on the average in the world. Since no sufficiently precise dataare to hand on this point, it has not been taken into account however.
4. The same problem affects estimates of fixed investment at constantprices. As shown in Table 7, fixed investment is broken down into importedand local components. The imported components (capital goods, studies andservices by foreign firms) are deflated by international price indices.In view of the system of "turnkey" and "product-in-hand" contracts used byAlgeria for major industrial projects, and the difficulties posed by certain
1/ As shown in Table 2.1, import taxes has been broken down by sector onlysince 1971.
ANNEX 1Page 2
projects and advanced technologies, it appears that the cost of projects inAlgeria has risen faster than average international investment costs. However,since sufficiently precise data are lacking on this point, it has also beendisregarded. It is therefore probable that Table 7 underestimates the invest-ment figures for 1971-74 in 1975 prices, and consequently overestimates theincrease in investment in real terms during the period considered. It wouldbe worth compiling data that would make it possible to elucidate this point inview of its importance for development strategy.
5. Private consumption has been deflated by the retail price index.Public consumption is broken down into wages and salaries, which are deflatedby the same index as the value added of government services, and goods, whichare deflated by the retail price index. For stock changes, an average indexderived from import prices, export prices and domestic prices is used, on theassumption that the stocks are made up of goods in these three categories inequal proportions.
6. The statistical discrepancy between resources and uses at constantprices given in Table 6 (resources exceeding uses in each one of the years1971-74) can be explained as follows:
(i) the increase in investment prices over the period1971-75 is underestimated and the value of investmentat 1975 prices should be higher, thus taking up a largerpart of the resources (see paragraph 4);
(ii) the subsidies included in the 1974 and 1975 budgets tokeep consumer prices down entailed a distortion betweenthe rise in the apparent cost of private consumption andthe faster rise in actual import and production prices(Table 5), thus leading to underestimation of the realvalue of total consumption expressed in 1975 prices; and
(iii) the national accounts have perhaps overestimated the valueof imports at current prices and underestimated those ofexports, especially for 1973. The distortion thus introducedin the total value of resources and uses are then amplifiedin the constant-price figures, due to the markedly differentchanges in import and export prices. In this respect, thedifferences in the import and export statistics from thevarious sources would be worth analyzing.
The Main Results
7. Keeping in mind the above comments on methodology, the constant-price estimates make it possible to draw the following conclusions regardingthe changes in the main aggregates of the Algerian economy over recent years.GDP in real terms rose by 4% in 1974 and 4.3% in 1975. The average rate ofGDP growth has been 3.4% since 1972 (Table 3). It should be noted, however,that using constant 1975 prices for determining the real GDP growth, gives
ANNEX 1Page 3
considerable weight in the GDP to the hydrocarbon sector. If the hydrocarbonsector, whose production remained static since 1972 for technical and economicreasons, is excluded, the growth of the other sectors of the economy in realterms works out at 7.2 percent in 1974 and 6.1 percent in 1975, with an averageof 7.4 percent p.a. since 1972. Sectors which expanded most rapidly in 1974and 1975 were energy, transport, construction and government services. Manu-facturing, whose production increased markedly in 1973, only achieved anaverage growth of 4.7 percent in 1974-75. Agricultural production, whichdeclined in 1973, grew by about 3 percent p.a. in 1974-75.
8. As in previous years, the main growth factors were investment and,to a lesser extent, consumption in 1974 and 1975 (Table 6). At the price-increase assumptions adopted, fixed investment rose by about 20 percent involume in 1973 and over 23 percent in 1975. It more than doubled between1971 and 1975. There was a marked increase in stocks in 1974 and 1975.Private consumption rose by an average of more than 8 percent a year since1972 and total consumption by over 9 percent. The high investment demand andthe expansion of the industrial sector brought about a rapid rise in importsof goods, about 27 percent a year since 1972. Capital goods imports tripledin volume between 1972 and 1975, based on the price assumption made here.Imports of intermediate goods for industry and construction more than doubled,while those of foodstuffs and consumer goods rose by a little over 20% a yearover the last three years. A part of the increase in imports was intendedfor the stock buildup noted in 1974 and 1975. Commodity exports volumes,on the other hand, declined by about 12% between 1972 and 1975, due mainlyto the lower quantities of crude oil and agricultural products exported.
9. The terms of trade, which had improved steadily over previous years,almost doubled in 1974 as a result of higher oil and gas prices. In that yeargross domestic income, which measures the real flow of resources, increasedby nearly 30 percent and exports in terms of international purchasing power(real import capacity of the economy) by over 90 percent (Table 6). The termsof trade deteriorated by about 20 percent in 1975, causing a reduction ingross domestic income and real import capacity. Domestic savings, adjustedfrom terms of trade changes, doubled and exceeded total investment in 1974.They declined by 16 percent in 1975, in which year a relatively considerableresource gap developed (14 percent of GDP).

Annex I
Table 1: GDP BY INDUSTRIAL ORIGIN AT CURRENT PRICES,1971-75(Millions of dinars)
Sector 1971 1972 1973 1974 1975-
Agriculture 2,610 2,970 2,630 3,180 3,700
Hydrocarbons 2,820 4,400 6,060 17,700 15,70'.
Mining and quarrying 150 160 190 360 400
Manufacturing 3,120 3,440 4,650 5,060 5,990
Food processing 1,120 1,240 1,510 1,670 1,920
Steel, mechanical and electrical 670 Y90 1,200 1,250 1,620
Chemicals 240 310 500 440 530
Textiles and leather 630 640 880 980 1,080
Construction materials 170 170 190 270 300
Miscellaneous 290 290 370 450 540
Energy 350 370 440 490 610
Construction and Public Works 2,050 2,650 4,280 5,200 6,200
Subtotal: Industry 8,490 11,020 15,620 28,810 28,900
Transportation and communications 850 1,090 1,380 1,890 2,300
Trade 4,090 4,710 4,650 5,080 5,600
Other services 2,920 3,210 3,380 3,900 4,300
Subtotal: Services 7,860 9,010 9,410 10,870 12,200
Total value added 18,960 23,000 27,660 42,860 44,800
plus: Import duties 560 600 720 1,210 1,800
Gross domestic production 19,520 23,600 2R,380 44,070 46,600
plus: Government services 2,870 3,110 3,160 3,700 5,000
Gross domestic product 22,390 26,710 31,540 47,770 51,600
1/ Preliminary.
Source: Secretariat d'Etat au Plan
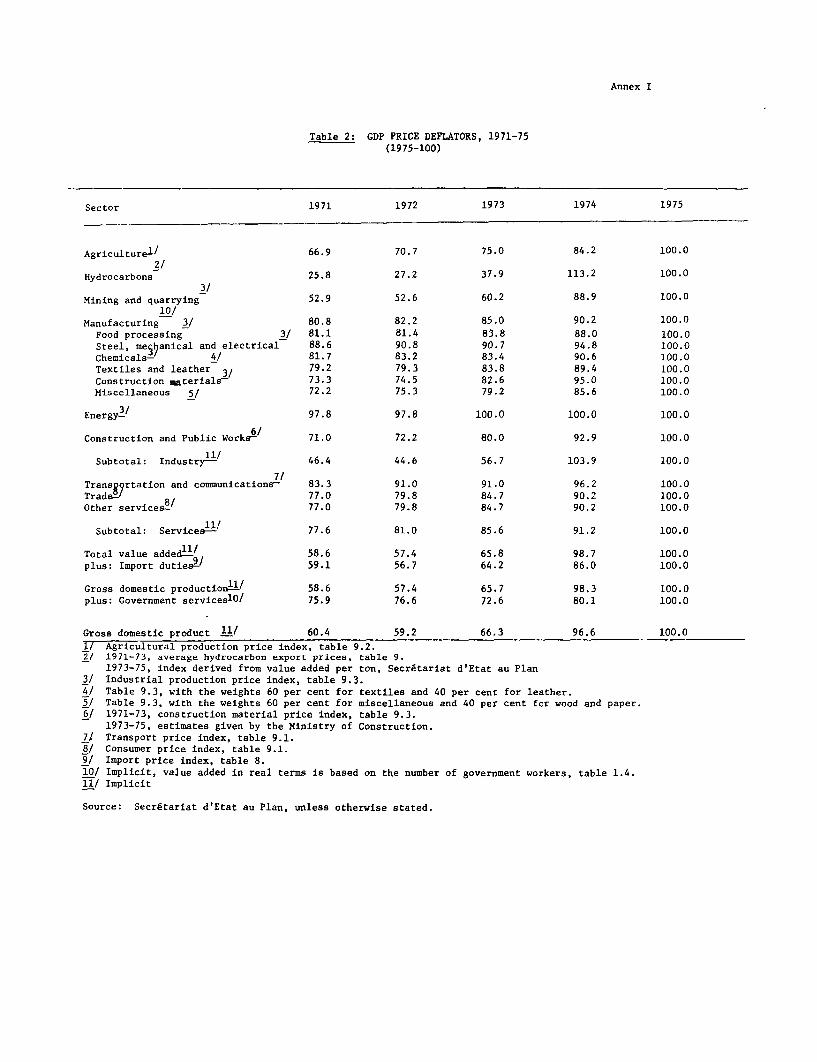
Annex I
Table 2: GDP PRICE DEFLATORS, 1971-75(1975-100)
Sector 1971 1972 1973 1974 1975
Agriculturei/ 66.9 70.7 75.0 84.2 100.02/
Hydrocarbons 25.8 27.2 37.9 113.2 100.0
Mining and quarrying 52.9 52.6 60.2 88.9 100.010/
Manufacturing 3/ 80.8 82.2 85.0 90.2 100.0Food processing 3/ 81.1 81.4 83.8 88.0 100.0Steel, meS0anical and electrical 88.6 90.8 90.7 94.8 100.0Chemicals- 4/ 81.7 83.2 83.4 90.6 100.0Textiles and leather 3/ 79.2 79.3 83.8 89.4 100.0Construction materials- 73.3 74.5 82.6 95.0 100.0Miscellaneous 5/ 72.2 75.3 79.2 85.6 100.0
Energy3/ 97.8 97.8 100.0 100.0 100.0
Construction and Public Work6/ 71.0 72.2 80.0 92.9 100.0
Subtotal: Industryl1/ 46.4 44.6 56.7 103.9 100.0
Transg/rtation and communications- 83.3 91.0 91.0 96.2 100.0Trade- 8 77.0 79.8 84.7 90.2 100.0Other services- 77.0 79.8 84.7 90.2 100.0
Subtotal: Service1l1/ 77.6 81.0 85.6 91.2 100.0
Total value added11= 58.6 57.4 65.8 98.7 100.0
plus: Import duties9/ 59.1 56.7 64.2 86.0 100.0
Gross domestic production1' 58.6 57.4 65.7 98.3 100.0
plus: Government servicesl0/ 75.9 76.6 72.6 80.1 100.0
Gross domestic product 1L/ 60.4 59.2 66.3 96.6 100.0
1/ Agricultural production price index, table 9.2.2/ 1971-73, average hydrocarbon export prices, table 9.
1973-75, index derived from value added per ton, Secretariat d'Etat au Plan3/ Industrial production price index, table 9.3.4/ Table 9.3, with the weights 60 per cent for textiles and 40 per cent for leather.5/ Table 9.3, with the weights 60 per cent for miscellaneous and 40 per cent for wood and paper.6/ 1971-73, construction material price index, table 9.3.
1973-75, estimates given by the Ministry of Construction.71 Transport price index, table 9.1.8/ Consumer price index, table 9.1.9/ Import price index, table 8.10/ Implicit, value added in real terms is based on the number of government workers, table 1.4.11/ Implicit
Source: Secretariat d'Etat au Plan, unless otherwise stated.
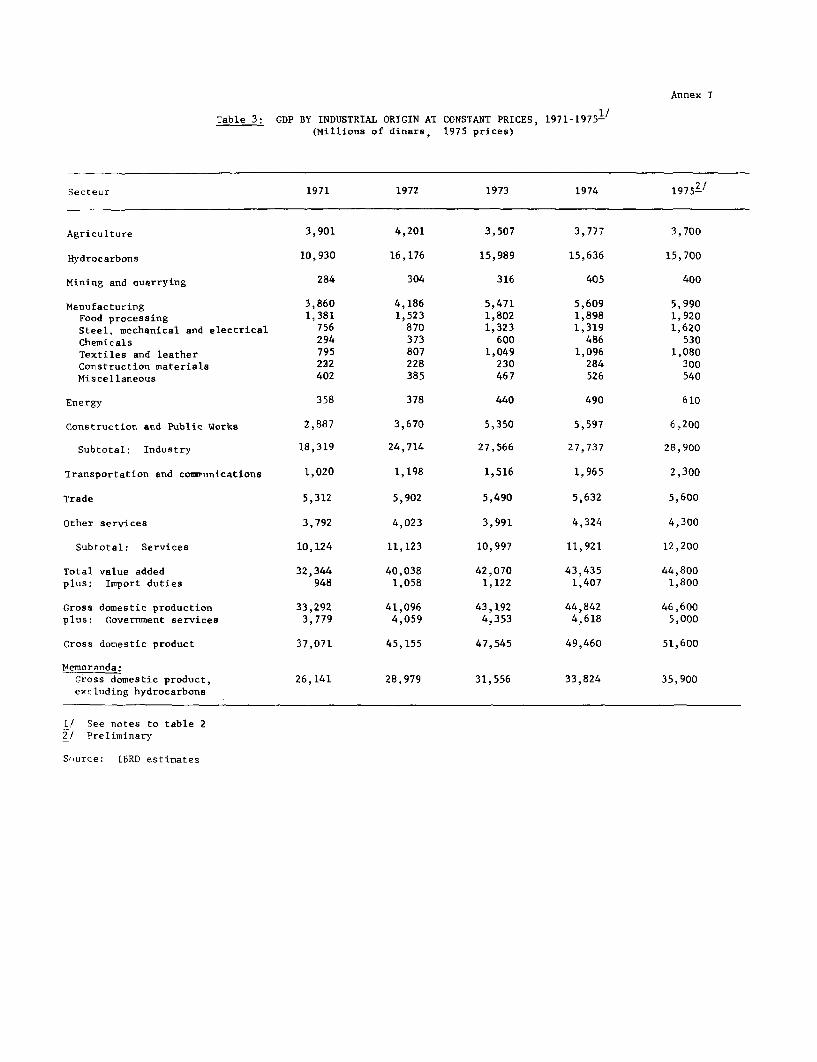
Annex I
Table 3: GDP BY INDUSTRIAL ORIGIN AT CONSTANT PRICES, 1971-1975-/(Millions of dinars, 1975 prices)
Secteur 1971 1972 1973 1974 19752/
Agriculture 3,901 4,201 3,507 3,777 3,700
Hydrocarbons 10,930 16,176 15,989 15,636 15,700
Mining and cuarrying 284 304 316 405 400
Manufacturing 3,860 4,186 5,471 5,609 5,990Food processing 1,381 1,523 1,802 1,898 1,920Steel, mechanical and electrical 756 870 1,323 1,319 1,620Chemicals 294 373 600 486 530Textiles and leather 795 807 1,049 1,096 1,080Construction materials 222 228 230 284 300Miscellaneous 402 385 467 526 540
Energy 358 378 440 490 610
Construction and Public Works 2,887 3,670 5,350 5,597 6,200
Subtotal: Industry 18,319 24,714 27,566 27,737 28,900
Transportation and couzninnfcations 1,020 1,198 1,516 1,965 2,300
Trade 5,312 5,902 5,490 5,632 5,600
Other services 3,792 4,023 3,991 4,324 4,300
Subtotal: Services 10,124 11,123 10,997 11,921 12,200
Total value added 32,344 40,038 42,070 43,435 44,800plus: Import duties 948 1,058 1,122 1,407 1,800
Gross domestic production 33,292 41,096 43,192 44,842 46,600plus: Government services 3,779 4,059 4,353 4,618 5,000
Gross domestic product 37,071 45,155 47,545 49,460 51,600
Memoranda:cross domestic product, 26,141 28,979 31,556 33,824 35,900excluding hydrocarbons
1/ See notes to table 22/ Preliminary
Source: IBRD estimates

Annex I
Table 4: NATIONAL ACCOUNTS IN CURRENT PRICES, 1971-75(Millions of dinars)
1971 1972 1973 1974 1975 1/
Gross domestic product 22,390 26,710 31,540 47,770 51,600
Imports, including NFS 7,430 8,350 11,650 19,250 26,860 2/
Exports, including NFS 4,970 6,550 7,920 20,160 19,500 2/
Resource gap 2,460 1,800 3,730 -910 6,900
Total resources and uses 24,850 28,510 35,270 46,860 58,960
Consumption 16,150 18,070 21,080 23,910 29,960
Private 12,860 14,550 17,010 19,060 23,460
General government 3,290 3,520 4,070 4,850 6,500
Investment 8,700 10,440 14,190 22,950 29,000
Gross fixed investment 8,600 9,560 13,090 18,750 25,300
Changes in stocks 100 880 1,100 4,200 3,700
Domestic savings 6,240 8,640 10,460 23,860 22.100
Net factor service income 500 960 1,020 1,230 159 3/
Net current transfers 320 170 210 -1,620 193 3/
National savings 7,060 9,770 11,690 23,470 22,400
Gross national product 22,890 27,670 32,560 49,000 51,900
1/ Preliminary2/ Date corrected on the basis of customs returns and the balance of payments
3/ Data from the balance of payments
Source: Secretariat d'Etat au Plan
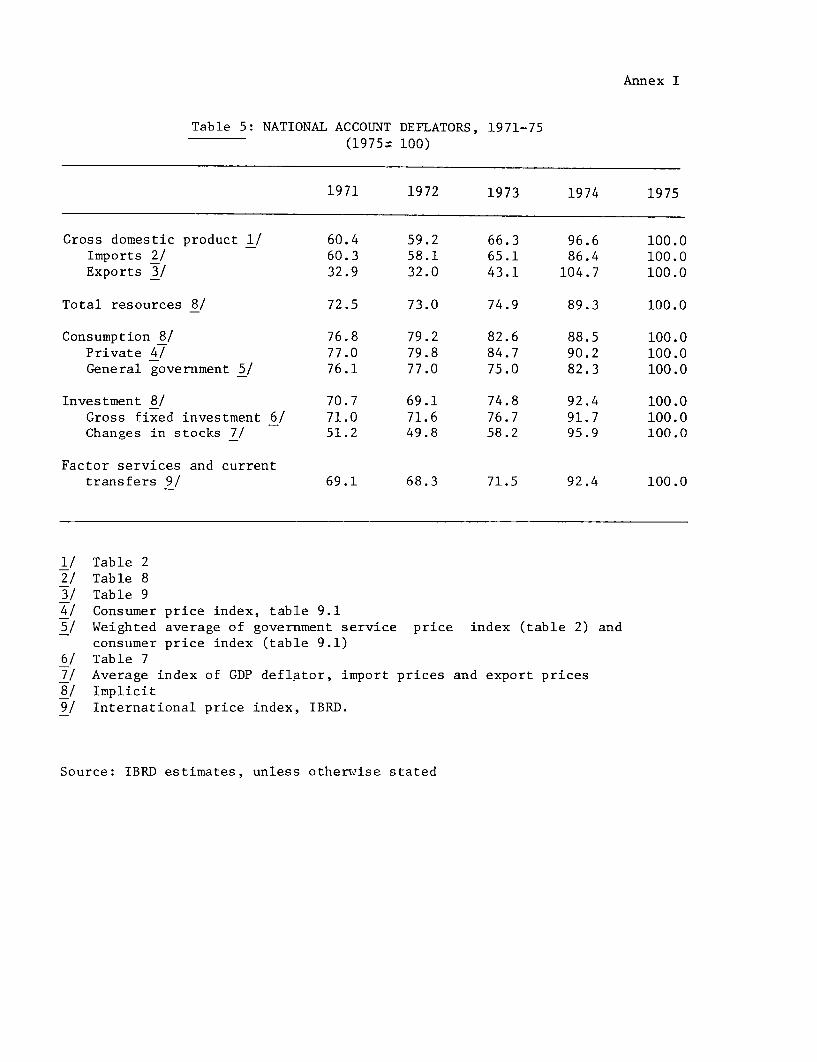
Annex I
Table 5: NATIONAL ACCOUNT DEFLATORS, 1971-75(1975: 100)
1971 1972 1973 1974 1975
Gross domestic product 1/ 60.4 59.2 66.3 96.6 100.0Imports 2/ 60.3 58.1 65.1 86.4 100.0Exports 3/ 32.9 32.0 43.1 104.7 100.0
Total resources 8/ 72.5 73.0 74.9 89.3 100.0
Consumption 8/ 76.8 79.2 82.6 88.5 100.0Private 4/ 77.0 79.8 84.7 90.2 100.0General government 5/ 76.1 77.0 75.0 82.3 100.0
Investment 8/ 70.7 69.1 74.8 92.4 100.0Gross fixed investment 6/ 71.0 71.6 76.7 91.7 100.0Changes in stocks 7/ 51.2 49.8 58.2 95.9 100.0
Factor services and currenttransfers 9/ 69.1 68.3 71.5 92.4 100.0
1/ Table 22/ Table 83/ Table 94/ Consumer price index, table 9.15/ Weighted average of government service price index (table 2) and
consumer price index (table 9.1)6/ Table 77/ Average index of GDP deflator, import prices and export prices8/ Implicit9/ International price index, IBRD.
Source: IBRD estimates, unless otherwise stated
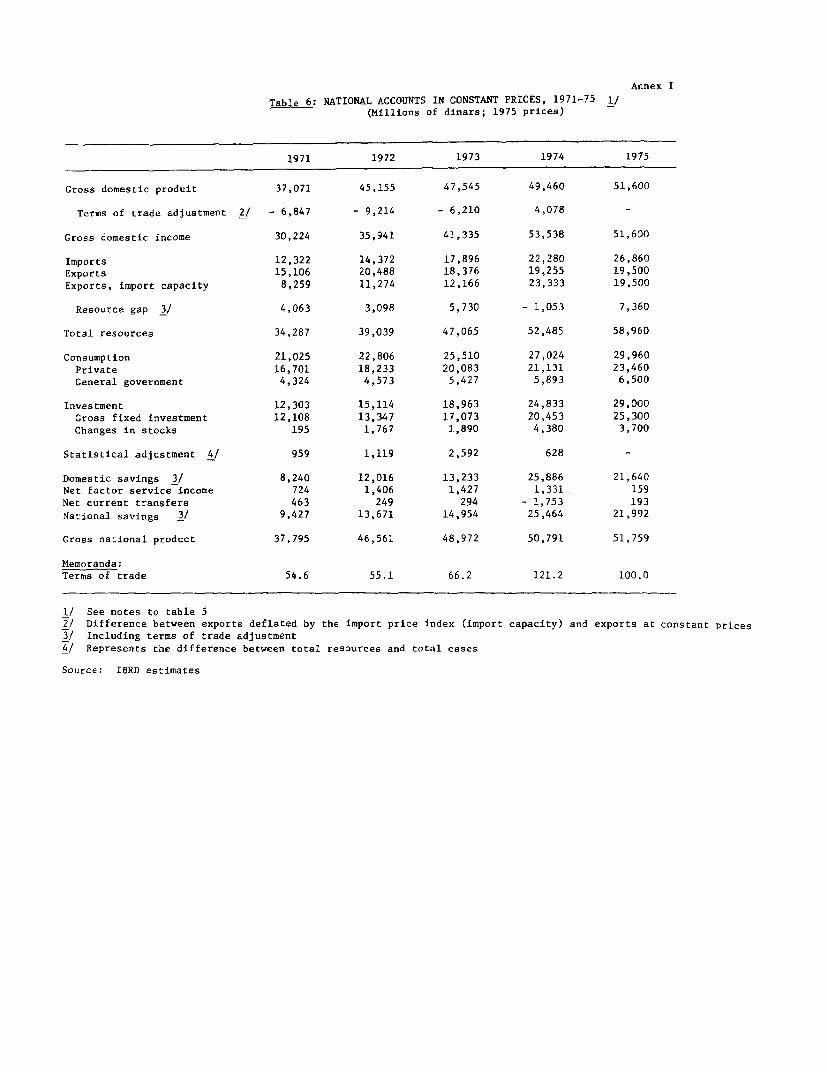
Annex I
Table 6: NATIONAL ACCOUNTS IN CONSTANT PRICES, 1971-75 1/(Millions of dinars; 1975 prices)
1971 1972 1973 1974 1975
Gross domestic produit 37,071 45,155 47,545 49,460 51,600
Terms of trade adjustment 2t - 6,847 - 9,214 - 6,210 4,078 -
Gross domestic income 30,224 35,941 41,335 53,538 51,600
Imports 12,322 14,372 17,896 22,280 26,860Exports 15,106 20,488 18,376 19,255 19,500Exports, import capacity 8,259 11,274 12,166 23,333 19,500
Resource gap 3/ 4,063 3,098 5,730 - 1,053 7,360
Total resources 34,287 39,039 47,065 52,485 58,960
Consumption 21,025 22,806 25,510 27,024 29,960Private 16,701 18,233 20,083 21,131 23,460General government 4,324 4,573 5,427 5,893 6,500
Investment 12,303 15,114 18,963 24,833 29,000Gross fixed investment 12,108 13,347 17,073 20,453 25,300Changes in stocks 195 1,767 1,890 4,380 3,700
Statistical adjustment 4/ 959 1,119 2,592 628 -
Domestic savings 3/ 8,240 12,016 13,233 25,886 21,640Net factor service income 724 1,406 1,427 1,331 159Net current transfers 463 249 294 - 1,753 193National savings 3t 9,427 13,671 14,954 25,464 21,992
Gross national product 37,795 46,561 48,972 50,791 51,759
Memoranda:Terms of trade 54.6 55.1 66.2 121.2 100.0
1/ See notes to table 5t Difference between exports deflated by the import price index (import capacity) and exports at constant Prices3/ Including terms of trade adjustment
4/ Represents the difference between total resources and total cases
Source: IBRD estimates
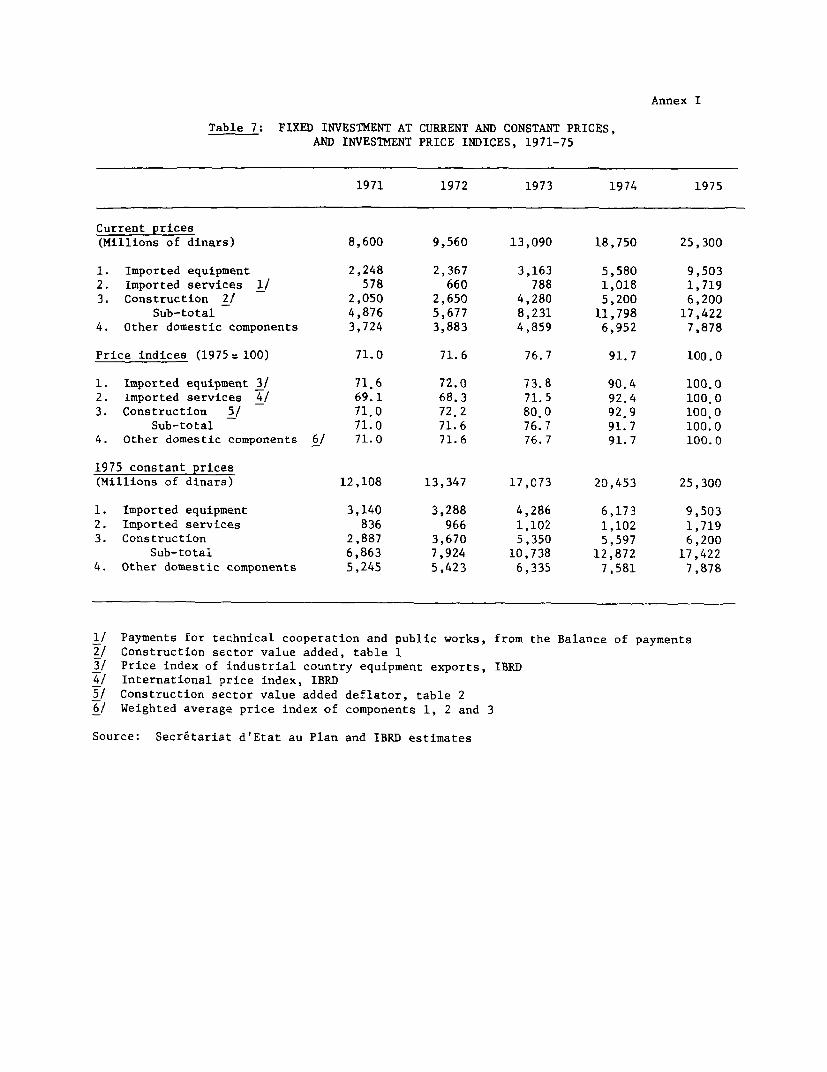
Annex I
Table 7: FIXED INVESTMENT AT CURRENT AND CONSTANT PRICES,AND INVESTMENT PRICE INDICES, 1971-75
1971 1972 1973 1974 1975
Current prices(Millions of dinars) 8,600 9,560 13,090 18,750 25,300
1. Imported equipment 2,248 2,367 3,163 5,580 9,503
2. Imported services 1/ 578 660 788 1,018 1,719
3. Construction 2/ 2,050 2,650 4,280 5,200 6,200
Sub-total 4,876 5,677 8,231 11,798 17,422
4. Other domestic components 3,724 3,883 4,859 6,952 7,878
Price indices (1975 100) 71.0 71.6 76.7 91.7 100.0
1. Imported equipment 3/ 71.6 72.0 73.8 90.4 100.0
2. Imported services 4/ 69.1 68.3 71.5 92.4 100.0
3. Construction 5/ 71.0 72.2 80.0 92.9 100.0
Sub-total 71.0 71.6 76.7 91.7 100.0
4. Other domestic components 6/ 71.0 71.6 76.7 91.7 100.0
1975 constant prices(Millions of dinars) 12,108 13,347 17,073 20,453 25,300
1. Imported equipment 3,140 3,288 4,286 6,173 9,503
2. Imported services 836 966 1,102 1,102 1,719
3. Construction 2,887 3,670 5,350 5,597 6,200
Sub-total 6,863 7,924 10,738 12,872 17,422
4. Other domestic components 5,245 5,423 6,335 7,581 7,878
1/ Payments for technical cooperation and public works, from the Balance of payments
2/ Construction sector value added, table 13/ Price index of industrial country equipment exports, IBRD
4/ International price index, IBRD
5/ Construction sector value added deflator, table 2
6/ Weighted average price index of components 1, 2 and 3
Source: Secretariat d'Etat au Plan and IBRD estimates
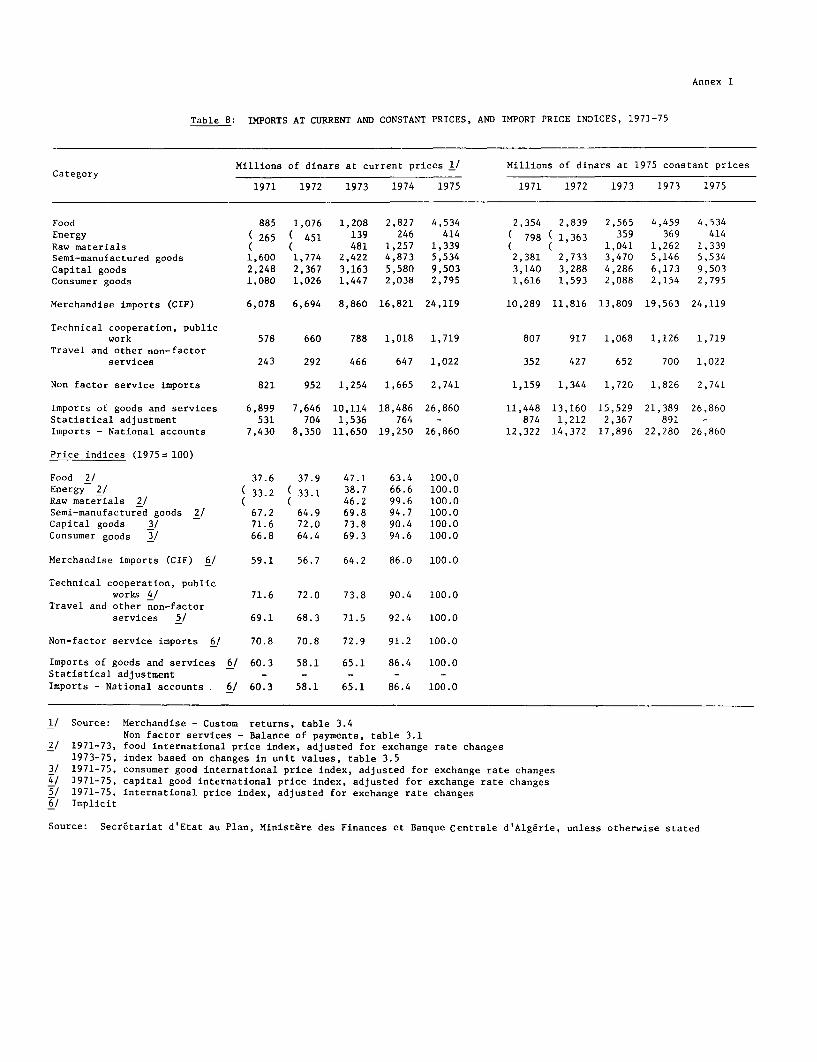
Annex I
Table 8: IMPORTS AT CURRENT AND CONSTANT PRICES, AND IMPORT PRICE INDICES, 1971-75
Category Millions of dinars at current prices 1/ Millions of dinars at 1975 constant prices
1971 1972 1973 1974 1975 1971 1972 1973 1973 1975
Food 885 1,076 1,208 2,827 4,534 2,354 2,839 2,565 4,459 4,534Energy 265 ( 451 139 246 414 ( 798 1,363 359 369 414Raw materials ( ( 481 1,257 1,339 ( ( 1,041 1,262 1,339Semi-manufactured goods 1,600 1,774 2,422 4,873 5,534 2,381 2,733 3,470 5,146 5,534Capital goods 2,248 2,367 3,163 5,580 9,503 3,140 3,288 4,286 6,173 9,503Consumer goods 1,080 1,026 1,447 2,038 2,795 1,616 1,593 2,088 2,154 2,795
Merchandise imports (CIF) 6,078 6,694 8,860 16,821 24,119 10,289 11,816 1.3,809 19,563 24,119
Technical cooperation, publicwork 578 660 788 1,018 1,719 807 917 1,068 1,126 1,719
Travel and other non-factorservices 243 292 466 647 1,022 352 427 652 700 1,022
Non factor service imports 821 952 1,254 1,665 2,741 1,159 1,344 1,720 1,826 2,741
Imports of goods and services 6,899 7,646 10,114 18,486 26,860 11,448 13,160 15,529 21,389 26,860Statistical adjustment 531 704 1,536 764 - 874 1,212 2,367 891 -Imports - National accounts 7,430 8,350 11,650 19,250 26,860 12,322 14,372 17,896 22,280 26,860
Price indices (1975- 100)
Food 2/ 37.6 37.9 47.1 63.4 100,0Energy 2/ ( 33.2 ( 33.1 38.7 66.6 100.0Raw materials 2/ ( ( 46.2 99.6 100.0Semi-manufactured goods 2/ 67.2 64.9 69.8 94.7 100.0Capital goods 3/ 71.6 72.0 73.8 90.4 100.0Consumer goods 3/ 66.8 64.4 69.3 94.6 100.0
Merchandise imports (CIF) 6/ 59.1 56.7 64.2 86.0 100.0
Technical cooperation, publicworks 4/ 71.6 72.0 73.8 90.4 100.0
Travel and other non-factorservices 5/ 69.1 68.3 71.5 92.4 100.0
Non-factor service imports 6/ 70.8 70.8 72.9 91.2 100.0
Imports of goods and services 6/ 60.3 58.1 65.1 86.4 100.0Statistical adjustment - - - - -Imports - National accounts . 6/ 60.3 58.1 65.1 86.4 100.0
1/ Source: Merchandise - Custom returns, table 3.4Non factor services - Balance of payments, table 3.1
2/ 1971-73, food international price index, adjusted for exchange rate changes1973-75, index based on changes in unit values, table 3.5
3/ 1971-75, consumer good international price index, adjusted for exchange rate changes4/ 1971-75, capital good international price index, adjusted for exchange rate changes5/ 1971-75, international price index, adjusted for exchange rate changes6/ Implicit
Source: Secr6tariat d'Etat au Plan, Ministare des Finances et Banque centrale d'Algerie, unless otherwise stated

Annex I
Table 9: EXPORTS AT CURRENT AND CONSTANT PRICES, AND EXPORT PRICE INDICES, 1971-75
Millions of dinars at current prices 1/ Millions of dinars at 1975 constant pricesCategory
1971 1972 1973 1974 1975 1971 1972 1973 1974 1975
Food 521 536 910 664 672 1,024 1,047 1,429 1,201 672Hydrocarbons 3,149 4,815 6,700 18,117 15,939 12,112 17,590 17,540 16,427 15,939Crude oil and condensate 2,972 4,627 6,050 16,974 14,454 11,841 17,265 16,440 15,361 14,454Liquefied natural gas 133 139 211 241 341 127 156 211 241 341Refined oil products and LPG 44 49 439 902 1,144 144 169 889 825 1,144
Raw materials 150 171 119 311 210 299 341 180 388 210Semi-manufactured goods 127 231 213 ) 178 250 213Capital goods 388 332 76 81 142 561 487 106 87 142Consumer goods 41 47 29 57 51 29
Merchandise exports (FOB) 4,208 5,854 7,973 19,451 17,205 13,996 19,465 19,490 18,404 17,205
Non-factor services 758 692 1,096 1,398 1,834 1,097 1,013 1,533 1,513 1,834
Exports of goods and services 4,966 6,546 9,069 20,849 19,039 15,093 20,478 21,023 19,917 19,039Statistical adjustment 4 4 -1.149 - 689 461 13 10 - 2,647 - 662 461Exports - National accounts 4,970 6,550 7,920 20,160 19,500 15,106 20,488 18,376 19,255 19,500
Price indices ( 1975 =100)
Food 2/ 50.9 51.2 63.7 55.3 100.0Hydrocarbons 5/ 26.0 27.4 38.2 110.3 100.0
Crude oil and condensate 3/ 25.1 26.8 36.8 110.5 100.0Liquefied natural gas 3/ 104.3 89.2 100.0 100.0 100.0Refined oil products and LPG 3/ 30.6 28.9 49.4 109.3 100.0
Raw materials 2/ 50.2 50.1 66.0 80.0 100.0Semi-manufactured goods 4/ 71.5 92.4 100.0Capital goods 4/ 69.1 68.3 71.5 92.4 100.0Consumer goods 4/ 71.5 92,4 100.0
Merchandise exports (FOB) 5/ 30.1 30.1 40.9 105.7 100.0
Non-factor services 4/ 69.1 68.3 71.5 92.4 100.0
Exports of goods and services 5/ 32.9 32.0 43.1 104.7 100.0Statistical adjustment - - - - -
Exports - National accounts 5/ 32.9 32.0 43.1 104.7 100.0
1/ Source: Merchandise - Custom returns, table 3.2; hydrocarbons, data from the Secretariat d'Etat au Plan, table 3.4Non-factor services - Balance of payments, table 3.1
2/ 1971-73, international price index for the category, adjusted; 1973-75, index based on changes in unit values, table 3.23/ Index based on changes in unit values, table 3.44/ 1971-75, international price index, adjusted5/ Implicit
Source: Secretariat d'Etat au Plan, Ministere des Finances et Banque Centrale d'Algerie, unless otherwise stated

ANNEX IIPage 1
RECENT PROGRESS AND PROSPECTS OF INDUSTRIALIZATION
Overall view
1. The overall trend of development in the industrial sector 1/ inAlgeria during the first two years of the 1974-77 plan, though uneven, wasfavorable in the main. Growth of value added estimated at constant priceswas low in 1974--about 4 percent--but recovered in 1975 to about 9 percent.This rate is expected to be maintained or to increase slightly in 1976.Although higher than the average rate of 8.2 percent during the precedingPlan, it is still well below the target rate for average annual growth ofindustry in the present Plan (nearly 20 percent), for reasons which arediscussed below.
2. Job creation expanded at a rate of 5 to 6 percent annually between1973 and 1975. An even larger increase, more than 7 percent, is expected in1976. With hydrocarbons and construction and public works added to the in-dustrial sector as defined here, the total number of jobs offered (471,400)should in 1976 exceed for the first time the number of Algerian migrantworkers in Europe (about 450,000). Particularly since 1974, the progressof industrialization in Algeria has led to the return of a growing numberof migrant workers. Taking the economy as a whole, some 10-15,000 workersa year have returned since mid-1975.
3. Investment in industry has grown very fast, from DA 3.5 billion in1973 to DA 4.9 billion in 1974 and to DA 7.2 billion in 1975 (up 32.5%).These figures also represent very high rates of growth in real terms: 16% in1974 and 36% in 1975. The list of projects that have come into productionor been put in hand (Table 4) in 1974 and 1975 confirms this. However, theprograms have been revised for 1976 and industrial investment is expectedto be at best sluggish, with a possible drop in real terms.
4. For manufacturing, development trends differ even more sharply. Inreal terms, value added appears to have increased by 2 percent in 1974 and7.4 percent in 1975, compared with investment growth of 26 percent annuallyin both years. Value added, investment and employment trends in the threebranches of industry are shown in the following table of indices (1973 = 100;value added and investment at constant 1973 prices):
1/ The industrial sector as described in this Annex does not include construc-tion and public works. It covers mining (excluding hydrocarbons), energyand manufacturing.
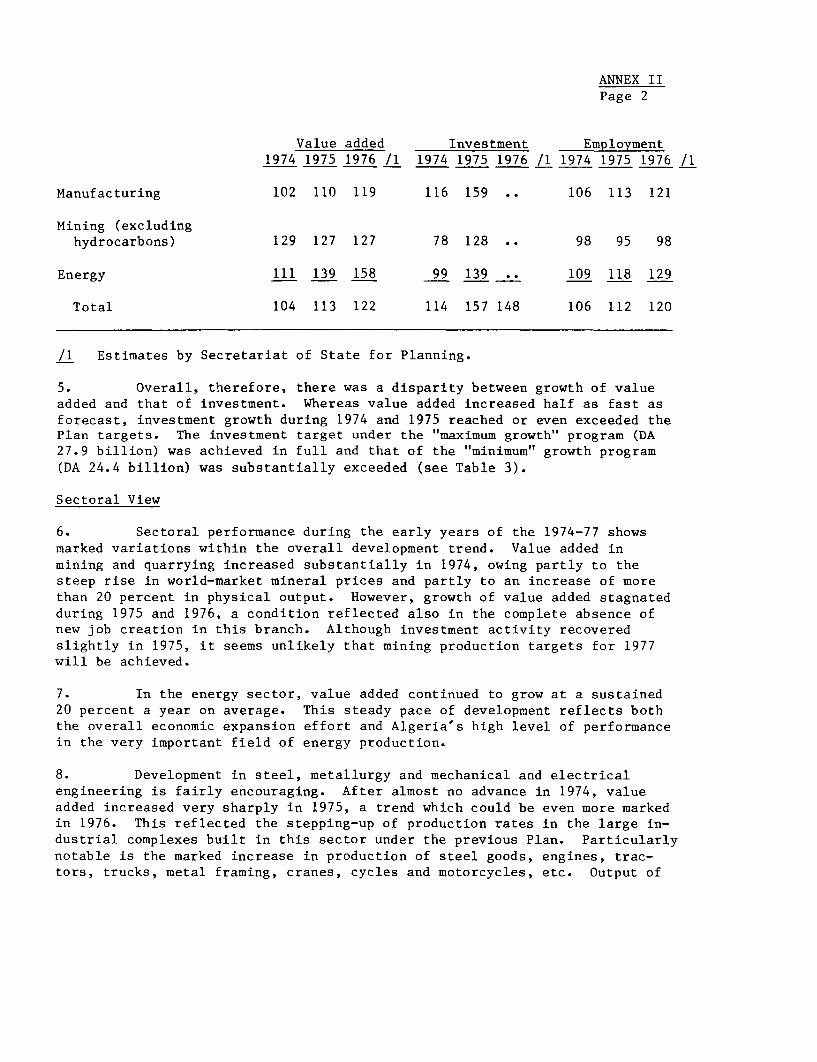
ANNEX IIPage 2
Value added Investment Employment1974 1975 1976 /1 1974 1975 1976 /1 1974 1975 1976 /1
Manufacturing 102 110 119 116 159 .. 106 113 121
Mining (excludinghydrocarbons) 129 127 127 78 128 .. 98 95 98
Energy 111 139 158 99 139 .. 109 118 129
Total 104 113 122 114 157 148 106 112 120
/1 Estimates by Secretariat of State for Planning.
5. Overall, therefore, there was a disparity between growth of valueadded and that of investment. Whereas value added increased half as fast asforecast, investment growth during 1974 and 1975 reached or even exceeded thePlan targets. The investment target under the "maximum growth" program (DA27.9 billion) was achieved in full and that of the "minimum" growth program(DA 24.4 billion) was substantially exceeded (see Table 3).
Sectoral View
6. Sectoral performance during the early years of the 1974-77 showsmarked variations within the overall development trend. Value added inmining and quarrying increased substantially in 1974, owing partly to thesteep rise in world-market mineral prices and partly to an increase of morethan 20 percent in physical output. However, growth of value added stagnatedduring 1975 and 1976, a condition reflected also in the complete absence ofnew job creation in this branch. Although investment activity recoveredslightly in 1975, it seems unlikely that mining production targets for 1977will be achieved.
7. In the energy sector, value added continued to grow at a sustained20 percent a year on average. This steady pace of development reflects boththe overall economic expansion effort and Algeria's high level of performancein the very important field of energy production.
8. Development in steel, metallurgy and mechanical and electricalengineering is fairly encouraging. After almost no advance in 1974, valueadded increased very sharply in 1975, a trend which could be even more markedin 1976. This reflected the stepping-up of production rates in the large in-dustrial complexes built in this sector under the previous Plan. Particularlynotable is the marked increase in production of steel goods, engines, trac-tors, trucks, metal framing, cranes, cycles and motorcycles, etc. Output of

ANNEX IIPage 3
the plants that came into production in 1973, 1974 and 1975 will probably comeclose to full capacity during the second half of the 1974-77 plan. From itsvisits to the SNS complex at El Hadjar and the SONACOME manufacturing complexesat Guelma (cycles and motorcycles), Constantine (engines and tractors) andRouiba (trucks and buses) the mission learned that these enterprises havegreatly stepped up their production rates since 1975. However, the range ofgoods manufactured by the metal industries still has many gaps. For example,Algeria produces only 40,000 tons a year of concrete reinforcing rods at theOran steelworks, against needs of 600,000 tons. Very substantial investmentwas made in this branch in 1974 and 1975 (42 percent of total industrial-sectorinvestment), the larger part in the steel industry (27 percent), exceeding theplanned targets. In addition, a large number of new jobs were created over
the same period (30 percent of all new jobs in industry).
9. In short, there appears to have been a notable improvement in theperformance of the metal industries compared with the previous Plan. Althoughtwo to three years behind the forecasts in achieving design production rates,these industries have stepped up execution of their investment programs andhave created a large number of new jobs.
10. Analysis of the chemical industry is difficult, since the provi-sional data combine the petrochemicals figures with those for hydrocarbons.The whole sector is in process of change. Very substantial investment isbeing made in the construction of large petrochemical complexes at Skikda andArzew. A considerable number of new jobs have thus been created. But it willbe a year or more before the impact of these efforts is felt on the sector'svalue added, which seems to have stagnated during 1974 and 1975.
11. Conditions in the construction materials subsector, particularlydelays in cement production, seriously hampered execution of the 1970-73 planas a whole. However, with the start-up of large-scale industrial units in1974 the growth of value added picked up again and maintained a very steadyrate (13-14 percent annually on average). Ongoing investment in this branchis the largest for the entire industrial sector apart from the metal indus-tries (23.6 percent of total investment). It is well in excess of the 1974-77 Plan targets.
12. Development has been uneven among the light industries. It is dif-ficult to pinpoint the causes, given the relatively large role of the privatesector in these industries and the lack of data for that sector for 1974 and1975. At all events, in the public sector, value added in the agriculture andfood, textiles and leather and miscellaneous industries registered very littlegrowth, with a few exceptions associated with consumption of basic food prod-ucts, which is increasing rapidly. From 1973 to 1975, for example, annualgrowth rates at constant prices averaged an estimated 8 percent for flourmilling, 20 percent for edible oil manufacture and 60 percent for sugar
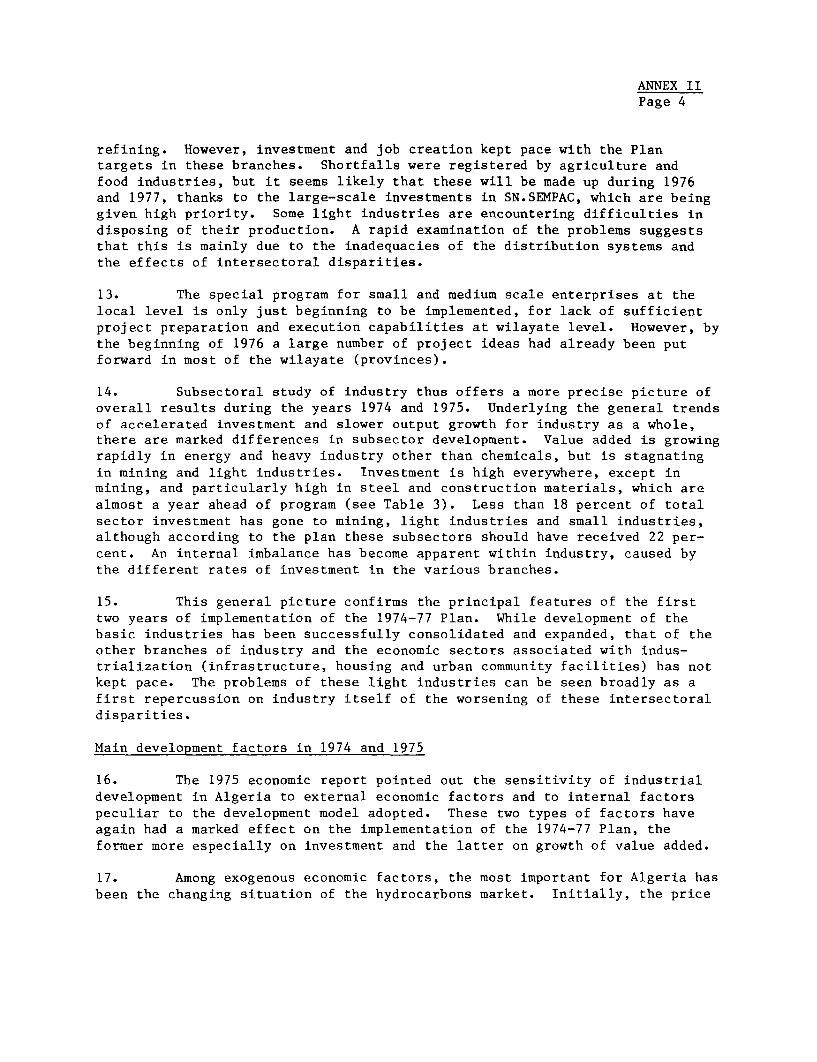
ANNEX IIPage 4
refining. However, investment and job creation kept pace with the Plantargets in these branches. Shortfalls were registered by agriculture andfood industries, but it seems likely that these will be made up during 1976and 1977, thanks to the large-scale investments in SN.SEMPAC, which are beinggiven high priority. Some light industries are encountering difficulties indisposing of their production. A rapid examination of the problems suggeststhat this is mainly due to the inadequacies of the distribution systems andthe effects of intersectoral disparities.
13. The special program for small and medium scale enterprises at thelocal level is only just beginning to be implemented, for lack of sufficientproject preparation and execution capabilities at wilayate level. However, bythe beginning of 1976 a large number of project ideas had already been putforward in most of the wilayate (provinces).
14. Subsectoral study of industry thus offers a more precise picture ofoverall results during the years 1974 and 1975. Underlying the general trendsof accelerated investment and slower output growth for industry as a whole,there are marked differences in subsector development. Value added is growingrapidly in energy and heavy industry other than chemicals, but is stagnatingin mining and light industries. Investment is high everywhere, except inmining, and particularly high in steel and construction materials, which arealmost a year ahead of program (see Table 3). Less than 18 percent of totalsector investment has gone to mining, light industries and small industries,although according to the plan these subsectors should have received 22 per-cent. An internal imbalance has become apparent within industry, caused bythe different rates of investment in the various branches.
15. This general picture confirms the principal features of the firsttwo years of implementation of the 1974-77 Plan. While development of thebasic industries has been successfully consolidated and expanded, that of theother branches of industry and the economic sectors associated with indus-trialization (infrastructure, housing and urban community facilities) has notkept pace. The problems of these light industries can be seen broadly as afirst repercussion on industry itself of the worsening of these intersectoraldisparities.
Main development factors in 1974 and 1975
16. The 1975 economic report pointed out the sensitivity of industrialdevelopment in Algeria to external economic factors and to internal factorspeculiar to the development model adopted. These two types of factors haveagain had a marked effect on the implementation of the 1974-77 Plan, theformer more especially on investment and the latter on growth of value added.
17. Among exogenous economic factors, the most important for Algeria hasbeen the changing situation of the hydrocarbons market. Initially, the price

ANNEX IIPage 5
increases at the end of 1973 led the Algerian Government to raise the 1974-77 plan targets, and 1974 and 1975 saw very substantial investment growth,particularly in industry. But this favorable situation was reversed earlierthan expected. The rise in prices was succeeded by a decline, aggravated forAlgeria by a slight fall in oil production.
18. This development was one of the main reasons for the revision ofthe 1974-77 plan implementation, reflected in the public investment program ofthe 1976 budget. For mining, hydrocarbons, manufacturing, industry and energy,the investment program was kept at a nominal DA 12 billion, representing areduction estimated provisionally at 6 to 7 percent in constant prices, where-as had the 1974-75 trend continued investment would have reached nearlyDA 16 billion.
19. The internal factors specific to the Algerian development model have,however, also had a part in revising the 1974-77 sectoral investment targets.Several bottlenecks have slowed down the implementation of planned investments:port congestion, inadequacy of maintenance and transportation facilities,telecommunications and planning units, and shortages of management and super-visory personnel and skilled labor. Although there has been constant improve-ment in these areas, this has been completely outstripped by the high rate ofgrowth of industrial investment reached in 1974, and especially in 1975. Someof the factors (congestion of ports and transportation facilities) have becomephysical obstacles, while the others have impaired efficient plant utilization.
20. These internal factors have been the major constraint on the growthof industrial value added, which was slower than expected. This phenomenon isone of the main characteristics of 1974-77 Plan implementation. The Govern-ment agencies concerned are conducting detailed studies to remedy the situa-tion as rapidly as possible.
21. During the preceding plan, delays occurred mainly in project imple-mentation. Since then, most projects have come into production, but timetabledelays have now shifted to the stage of early operations of these projects,especially in the large steel and mechanical and electrical engineeringcomplexes. The causes of these delays vary. In some projects, such as theArzew nitrogen fertilizer plant and the Skikda natural gas liquefaction plant,there have been technical problems apparently attributable mainly to theconstruction contractor. In other cases, projects have been inadequatelyprepared and coordinated with infrastructure causing operating problems (watersupply difficulties, for example).
22. But in most cases it was virtually inevitable that longer leadtimes would be required than in the industrialized countries. First, theplants had to be built in an environment almost totally devoid of industrial

ANNEX IIPage 6
capacity. Second, the planned production levels had to be reached withan inexperienced technical staff and labor force and very limited managementcapabilities. In assessing growth prospects for industrial production inAlgeria, allowance must be made for the fact that industrialization involvesnot only setting up physical infrastructures but also training the necessarymanagement, technical and blue-collar staff and enabling them to obtain theexperience they need. The human aspect of industrialization involves costlyinvestment and long lead times that cannot easily be reduced.
23. To some extent, therefore, it would be more correct to speak of over-optimistic production targets than of genuine delays. Moreover, it seems thatthe foreign contractors building the Algerian industrial complexes are in partresponsible for these over-optimistic production forecasts. When they sign"product in hand" contracts, as required by Algeria for some years past, 1/they often commit themselves to production levels without fully weighing theeffect of certain factors. Examples are the problem of very highly integratedplants--new for them, since they are accustomed to subcontracting; the need totrain all employees, starting from an often inadequate level of basic or tech-nical education; and the complete lack of previous industrial experience onthe part of these employees. All difficulties are not an insurmountableobstacle to the expansion of production, and Algeria has taken the necessaryaction to deal with them. Nevertheless, they do constitute constraints on theproductivity of the Algerian economy that will prevent growth from attainingits potential level for some years to come. It is up to the planners to makeallowances for this situation in order to ensure balanced economic development.
24. Furthermore, constraints peculiar to development dynamics inAlgeria have aggravated the disparities and pressures existing between thedevelopment of industry and that of the other sectors of the economy. Thesedisparities are related to the priority given since 1966 to industrial invest-ment and, conversely, the inadequacy of investment in other sectors. Theywere exacerbated already during the 1970-73 plan, and again in 1974 andespecially 1975, by the higher rate of implementation of planned investmentin industry than in other sectors. These intersectoral imbalances seem to bethe most serious factors in Algeria's present economic situation, since theycould considerably restrain the overall rate of development and cause seriousproblems in the industrial sector itself. In three sectors in particular,these disparities have been so acute as to create obstacles to the furtherexpansion of industry itself.
1/ "Turnkey" contracts involve the delivery and assembly of complete in-dustrial installations. The constructor must provide proof that the in-stallations function but is not responsible for actual production."Product-in-hand" contracts cover not only the delivery and assemblyof installations but also the training of all personnel. Furthermore,the contractor must show that both the plant and its personnel arecapable of reaching the output planned within a specific period estab-lished in advance. All operation problems must therefore be dealt withby him prior to delivery of the plant.

ANNEX IIPage 7
25. First of all, there are the cumulative delays in urban development,especially in housing and community facilities (transportation, hygiene andpublic health, administration, etc.). All the factories visited by themission recruit their personnel from up to 50 km away. In a relatively largenumber of cases, management and supervisory staff and even skilled workershave turned down job offers because they could not find housing close by.The present rate of investment in industry calls for even greater effort topromote urban development, simply to prevent the situation from deterioratingfurther. An extensive program, tied in with regional and land develop-ment policies, will have to be introduced to deal with the delays accumulatedover ten years.
26. Agricultural production is another major problem. Up to 1974 itregistered little progress; the result was a sizeable increase in imports offoodstuffs accompanied by a steady fall in exports. Owing to the inadequacyof investment prior to 1974 and to high centralization of management, pro-duction in the self-managed sector remained stagnant or increased only veryslightly (apart from wine production, which was substantially reduced). Atthe same time private investment in the rest of agriculture slowed down inanticipation of the Agrarian Revolution. The low level of investment limitedthe consumption of intermediate goods by that sector. Indirectly, the rapidincrease in imports of agricultural products deprived other sectors--but firstagriculture itself--of external resources that could have been used for theirdevelopment.
27. Finally, for the small and medium scale local industries, the pro-gram that was to have been initiated by the wilayate has in most cases notgot beyond the preliminary design or planning stage. This program was incor-porated into the 1974-77 plan in order to disseminate the effects of indus-trial growth to the small local centers, and gave priority to production ofconstruction materials. In the wilaya of Batna, one of the few where theprogram has truly got under way, ten enterprises will be producing in 1976and 1977 in the field of construction materials alone, creating approximatley700 new jobs, while seven others will be started up in other fields (repairshops, furniture making, hardware, etc.). The capacities of the wilaya enter-prises and the intercommunal associations concerned with housing and publicworks will increase greatly as soon as these plants come into production.These achievements indicate what might have been done had all the wilayatebeen able to put their programs into execution. The Batna experience showsthat the decisive factors in implementing the program were the existence ofa planning unit at the level of the wilaya itself, and the establishment ofmanagement structures for each major activity. For instance, the ten con-struction materials units are managed by a single wilaya enterprise, SOMACBA(Societe des materiaux de construction de Batna). Thus, a local industrymanagement structure has been established at the level of this wilaya whichis comparable to that of the national enterprises covering the whole country;this enables maximum efficiency to be achieved with the very limited manage-ment staff and facilities available at that level. The delays in executing

ANNEX IIPage 8
the program for small and medium scale industry in Algeria as a whole havethus slowed down development of a local industrial network whose existencewould have made it easier to tie in the rapid growth of the major nationalcomplexes with the less dynamic development of other economic activities.
Progress as regards certain special problems
28. The mission noted a substantial improvement in a number of importantaspects of management capability in industry. The experience acquired duringthe early years of development has strengthened the ability of Algerianmanagement staff to handle industrial problems or led to the promotion ofstaff with better technical training. The improved quality of the staff isreflected in better preparation of investment projects, more confidence andexperience in negotiations and increased efficiency in project implementation.The mission noted also a steady strengthening of relations between industrialenterprises and banks, and the latter have shown themselves better equipped tosupervise the use of funds (national savings) lent to enterprises.
29. Generally speaking, Algerian industry does not have a market problem.The very high investment level is creating rapidly expanding outlets for allbranches of intermediate and capital goods manufacture, and the forecasts ofrequirements of pipe, steel plate, frames, trucks, etc. have always been welloutstripped by actual demand. Similarly, the demand for consumer goods isgrowing very rapidly--especially for durable goods (major household appliances,automobiles) which Algerian industry is far from able to meet. As regardsmass consumption goods, distribution problems have hampered the adjustmentof production (both industrial and agricultural) to demand.
30. Some progress has been made in cost analysis, in that industrialmanagers have become more aware of the importance of management techniques.The large industrial complexes built during the 1970-73 plan are settingup inventory control systems and staff organizations to perform the accountingand financial functions. But it will still take some time before this actionyields significant results and accurate information on industrial productioncosts. With the expected progress in knowledge of real production costs, theneed for a price policy for industrial goods that reflects real costs shouldbe increasingly recognized, even if this means showing up the existence ofsubsidies where these are necessary because of government policies.
31. Another problem, of growing importance to the economic situation,is the establishment of economically effective regulations for wages andincomes. This is of course only one aspect of the problem the Algerianauthorities still face in overall planning for employment of the labor force.At the skilled worker and managerial levels, it takes the form of "competitive"bidding in salaries and wages between the private and public sectors, insidethe public sector between the civil service and public enterprises, and inmany cases between different public enterprises and even between differentunits of the same enterprise. The result is that skilled labor, a rareresource, is not allocated with sufficient regard to the needs of planneddevelopment.

ANNEX IIPage 9
32. Overall, industry has been better placed in this respect than othersectors. As often happens in conditions of acute scarcity, those who are inthe market for skilled labor have to anticipate their real needs and practicea form of "advance recruitment" with a view also to organizing the train-ing and upgrading of this labor in their own firms. For this reason, thepublic enterprises sometimes have a sizeable proportion of both workers andmanagers actually under training; there are even, at times, workers, techni-cians and engineers, already trained, waiting for the projects they wererecruited for to be completed. This is one of the reasons for industry'sgreater capacity to implement investments.
33. A solution thus seems to be in sight to some of the specific problemsarising from the implementation of the first four-year plan in the industrialsector:
- The shortage of strategic products, particularly construc-tion materials, is less acute and should gradually diminish;
- W4hile the shortage of senior and especially middle-levelmanagers is still felt, there is evidence of a very definiteimprovement in project preparation and implementation capacityin all branches of industry. As a result, project executiondeadlines are being better respected;
- Although run-up to full production in the large integratedcomplexes has not been greatly accelerated, it now seemsto be under better technical control.
34. On the other hand, two categories of problems have worsened: thegeneral inadequacy of infrastructure, especially as regards handling, trans-portation and communications and the widening disparity between expansion inindustry and that in other sectors. The two categories are closely linked andare related to the need to bring industrial expansion into harmony with socialdevelopment as a whole. It seems that Algerian industry has now completed onestage in its growth--that of building up a basic physical infrastructurepractically from scratch--during which its need was to progress as rapidly aspossible, pretty much on its own. From now on, to safeguard its development,Algerian industry will have to reinforce its relations with the other economicsectors and help to coordinate its development with that of its total socialenvironment.
The second half of the 1974-1977 plan
35. The decision to stabilize investment in 1976 is an important factorin evaluating the execution prospects for the last two years of the 1974-1977
ANNEX IIPage 10
plan in industry. But this stabilization is not the only factor, and inparticular it must be seen in its economic and political context. 1/
36. The most important point is the abilitiy demonstrated by Algerianeconomic management system to execute rationally so important a decision asthat to stabilize industrial investment, which until then had been expandingvery fast. Real investment will no doubt be slightly greater than planned in1976 under the impetus of the growth dynamism of the past two years. But theessential goal should be achieved of a return to a more favorable ratiobetween investment and GDP and the establishment of a better intersectoralbalance.
37. The authorities of the Ministry of Industry have applied this deci-sion judiciously, controlling the rate of implementation of projects withouteliminating any. For three priority-rated categories of projects the rate ofimplementation has been maintained:
(a) projects of strategic importance for continuation andintensification of development: cement works, energy pro-duction, infrastructure works, hydrocarbons and mining;
(b) projects essential to meet priority needs (e.g. the SN.SEMPAC projects for stocking and processing cereals);
(c) ancillary projects vital to future industrial development(training and research facilities).
In addition, all projects nearing completion, i.e. those with plant installa-tion completed or under way, have been given priority and putting them intoproduction is to be speeded up. Implementation of projects outside the abovecategories has been delayed.
38. The global stabilization of the investment provided for in the 1976Finance Law does not imply modification of the development strategy followedin Algeria since 1966, or any change in the functions assigned to industry.All the components of this strategy are restated emphatically and describedin detail in the National Charter. The basic objectives of industrial devel-opment thus remain the same:
1/ The evolution of external cyclical and structural factors, particularlyhydrocarbon production and prices of hydrocarbons is not analyzed here,but the sensitivity of industrial development to these factors must notbe overlooked. The conclusions drawn in this chapter are therefore ofonly relative value and will need to be revised if the present forecastsof the behavior of these external factors have to be reconsidered.
ANNEX IIPage 11
(a) Development of natural resources as a means of earningforeign exchange and accumulating financial resources forinvestment;
(b) Expansion of integration industries providing linkages withall the productive sectors of the economy, especially energy,construction materials, steel, mechanical and electricalengineering and petrochemicals;
(c) Production of mass consumption goods to meet the population'sessential needs; and
(d) Development of small and medium scale industries at the locallevel to achieve better dissemination of the effects of indus-trialization throughout the country.
39. The Charter, however, also underlines the need, which was not re-spected in 1974 and 1975, to maintain development coherence: "The governingcriterion of Algeria's development policy is that development is conceivedas indivisible, that is, as a body of actions which affect all aspects ofpolitical, economic, social and cultural life, and which are interconnected,forming integral parts of a single process marked by unity of means andpurpose ..... Development policy therefore rests on the establishment ofclose bonds designed to link industrial projects, and the programs undertakenin the various branches of education, with operations for the restructuring ofagriculture, the reorganization of trade, the development of infrastructureand housing, and the organization of communes and wilayate ... "
40. Thus, the main orientations of the plan will be maintained in 1976and 1977. The goal of optimum utilization of natural resources will bepursued mainly by expanding the capacity for natural gas liquefaction atSkikda and Arzew and for gas processing in the field. A new outlet for gasproduction is in preparation, with USSR assistance, with the start of con-struction of an aluminum production plant.
41. Expansion of industries with backward and forward linkages shouldcontinue and even be speeded up in 1976 and 1977. A major threshold of achieve-ment in this area will be reached with the expected start-up of productionof two new types of plants:
(a) Beginning in July 1976, the ALMO plant at Constantine willmanufacture relatively complex universal machine tools (lathes,milling machinery, drilling machinery, shaping machinery, etc.)at a planned rate of 1,000 machines a year. This will give Algeriaits first machinery manufacturing capability, the heart of anyrelatively self-sufficient industry.

ANNEX IIPage 12
(b) Plants specializing in the manufacture of semi-finished prod-ucts, such as ball bearings, nuts and bolts, car upholsteryand fittings, springs and wheels, or in a particular industrialfunction, e.g. machinery servicing and maintenance.
The start-up of these new types of plants indicates that Algerian industry isgoing to evolve from a system based on large and internally highly integratedcomplexes toward a more diversified and more specialized division of workamongst the various enterprises.
42. The Algerian industrialization model, characterized by large andhighly integrated complexes of an advanced technological level, is alsodeveloping close links between the various branches of domestic industry andmajor foreign industrial centers. These links are reflected in, for example,increased imports of semi-manufactures (29 percent of total imports in 1974).An in-depth branch-by-branch study might usefully be made to determine whetherthe internal process of intersectoral integration is developing more or lessrapidly than these external links, and whether such links involve the risk ofcreating a new dependence on the outside world or constitute mutually advanta-geous cooperation instruments.
43. As regards mass production of consumer goods, the growth pattern isexpected to be more favorable in 1976 and 1977 than in the preceding years asa result of the combined effects of the following factors:
(a) Planned investments have been made in all branches of lightindustry, and priority is being given in 1976 and 1977 to in-vestments that promote consumption of primary products, 'likethose made in cereals processing;
(b) To overcome shortcomings in consumer-goods distribution, it wasdecided that Algerian manufacturing companies should distributetheir products themselves up to the retail point. These distri-bution systems have been expanding rapidly since 1975 and willfacilitate the marketing of all mass consumption goods;
(c) The broadening impact of the Agrarian Revolution and the expectedincreases in agricultural production of cooperatives should help toraise the purchasing power of the rural population and expand itsconsumption of industrial products. This expansion of consumptionshould be enhanced by the planned intensification of self-managedagriculture, which should stabilize the situation of the mass ofunderemployed seasonal workers.
44. The training resources of the industrial sector will be strengthenedin 1976 and 1977, particularly at the middle and upper management levels. Tothe existing technical institutes (National Hydrocarbons Institute, Textiles
ANNEX IIPage 13
Institute, etc.) will be added four new establishments serving mechanicalengineering, electrical engineering and electronics. Courses have alreadybeen started in temporary premises. Two other institutes will substantiallyexpand their training capacity by setting up regional establishments: theAlgerian Petroleum Institute, whose main emphasis is on a long-cycle,research-oriented training, and INPED, responsible for training managementtraining, needed in every branch of industry.
45. Significant improvements are also expected in the management ofenterprises, particularly in personnel management. The new methods ofsocialist management of enterprises have been widely adopted in industry,affecting a score or so of national corporations and more than 150,000individuals. 1/ They consist in organizing worker participation in manage-ment through the election of a workers' assembly in each industrial estab-lishment or large corporation. These assemblies appoint five standingcommittees, each overseeing an aspect of policy in the plant or enterprise:economic matters, social and cultural affairs, personnel and training,discipline and health and safety. The workers' assemblies also elect twoworkers' representatives to the board of the plant or enterprise. The boardis required to make recommendations on all problems affecting the managementof a plant or enterprise but the final decisions remain the responsibility ofits general manager. Socialist management of enterprises provides for three-way distribution of financial surpluses: one part goes to the central orlocal Governments, a second to the enterprise investment fund, while thethird remains at the disposal of the workers' assembly.
46. The Ministry of Industry expects worker participation in enterprisemanagement to yield three basic results:
(a) Rational reorganization of the systems of remuneration forwork, ensuring equal pay for equal skills and working condi-tions by means of a minimum fixed basic wage and the linking ofremuneration to work productivity through a differential bonusesscheme. Substantial progress has been made in this direction incertain sectors through joint consultation machinery set up undersocialist management of enterprises. In particular, a collectiveagreement is expected to be signed in the metallurgical industry;
(b) Improvements in work productivity consequent on the revised systemof remuneration and the development among the workers of an aware-ness of their responsibilities;
(c) Effective methods of corporate control to avoid waste, conservethe resources of the public sector and prevent the growth ofbureaucratic structures, which are sources of abuse of power andunwarranted privilege.
1/ The Charter for Socialist Management of Enterprises was promulgatedin November 1971 but is being introduced progressively. In prin-ciple it should apply not only to enterprises in the economic sectorsbut also to administrative, social and cultural institutions.

ANNEX IIPage 14
47. In these circumstances, it is reasonable to expect a marked improve-ment in the economic and financial situation of industry during the next two
years, though with substantial intrasectoral variations. Some projectsinitiated in 1974 should come on stream in 1976 or 1977 (see Table 3). Growth
of value added should accelerate, and this, in view of the restrictions oninvestment, should lead to a rapid improvement in marginal productivity of
capital employed and a reduction in average fixed capital per job.
48. Government policy now appears to be oriented toward progressivecorrection of Algeria's current major intersectoral disparities and a reduc-
tion in total investment in relation to GDP and available financial resources.Recovery in agricultural production, rapid development in housing and com-munity infrastructures in urban areas, improvement of heavy goods transpor-tation facilities, management and proper allocation of the labor force asa whole: these are the priority goals to be achieved if development --especially industrial development -- is to go forward. The changes in in-vestment rates and structure made in 1976 are designed to realize thesegoals. They should be viewed as an effort to redress the intersectoralimbalances, whose adverse consequences have threatened economic and socialdevelopment as a whole and particularly the development of industry.
Longer-term prospects for industrial development
49. The results achieved by Algerian development strategy in the 1966-75decade already provide an adequate basis for forecasting the medium-rangegrowth of industry with some accuracy. The goals set in the National Chartergive some indication of longer-term trends.
50. As regards the exploitation of natural resources, the decisions sofar made primarily concern arrangements for exports of liquefied natural gas,which are to be substantially expanded under the 1978-81 plan and thereafter.The Skikda refinery will be added to that at Arzew to increase exports ofrefined petroleum products. The steel industry is to produce and process 2million tons of steel at El Hadjar and 1 million at Jijel (by direct reduc-
tion) in the early 1980s. Finally, the aluminum plant at Msila should beproducing 140,000 tons a year in the 1981-90 decade, much of it for export.
51. Longer-term projects to expand capacities for natural-resourcedevelopment are currently under consideration. It is intended to doublealuminum-producing capacity and to build a new iron and steel complex in thewestern Algeria whose capacity has not yet been determined (current projec-tions range from 5 million to 10 million tons of steel a year). The exploita-tion of Algerian uranium deposits is also under study; it would be accompaniedby the building of nuclear power stations and development of the technologicalinfrastructure needed for their operation. One of the consequences of theseefforts to develop natural resources now being exported would be to increasethe contribution--currently insignificant--of manufacturing to Algerian ex-ports, commencing with heavy-industry products and the primary processing ofraw materials.

ANNEX IIPage 15
52. The integration impetus in industrial growth should continue andeven intensify through diversification, with the rapid development of the
metallurgical, mechanical and electrical engineering and electronics in-dustries. The determination to extend this pattern of integrated growth to
development of the "Hauts Plateaux" and the steppe is especially significant.A "second industrial belt" is to be established from the west to the east of
the country, between Maghnia and Tebessa, to provide the basic frame forregional development as a whole. Locations have already been decided for some
vital elements in this new industrialized area. They include aluminum produc-tion at Msila, an engine manufacturing complex (100,000 units a year) at AinOussers, a plant producing light trucks (34,000 units a year) at Tiaret, afoundry and a pump and valve factory at Berrouaghia, and a high-quality andspecial steels plant at Ain Mlila. To these nuclei of heavy industry wouldbe added a whole series of light industries in all the urban centers of theregion (textiles, food, construction materials and others) and some miningcenters (Djebel Onk). In addition, the third phase of the "Agrarian Revolu-tion" has been launched in three wilayate in this region, together with theplanting of the "green barrier", a program of afforestation of the SaharanAtlas region extending from the Tunisian to the Moroccan frontiers.
53. The aim of all these investments is to transform in depth the pat-tern of development by ensuring a better territorial balance. Projects arealso under study for development of the immense Saharan regions. The role ofprime mover assigned to industrialization in the implementation of theseprojects is emphasized in the National Charter: "The Industrial Revolutioninvolves some degree of anticipation in developing the environment that isvital to the performance of the activities it generates. The strategy ofindustrialization policy therefore includes measures to develop the environ-ment and prepare the people for the new role they are to play. Such measuresgenerate imbalances throughout the economy that exert powerful driving forceswhich in turn stimulate and activate the other sectors of national activity.Consequently, even when the existing structures have not yet been improved,industry will eventually, through its acknowledged multiplier effect, createaround it the environment it needs for its expansion".
54. Creation of this environment will, however, call for substantialinvestment. The region already has a well-developed natural gas distributionsystem but more electric power stations will have to be built. Two sectors inparticular will need to be strengthened or built up practically from scratch:transportation and communications, and urban infrastructure. A new east-westrailway line will have to be built over the "Hauts Plateaux" as well as new
trunk roads, and villages transformed into true towns. The mission was unableto determine the cost of establishing this new industrial belt. It ismoreover difficult to determine how quickly an integrated regional developmentproject of this kind can be implemented, given the constraints imposed by theeconomy, such as financial resources, construction and public works capacity,and availability of supervisory personnel and skilled workers.
ANNEX IIPage 16
55. Both medium and long term prospects for industrial growth point to arapid increase in industrial jobs. The Ministry of Industry estimates thatthe annual creation of industrial jobs, estimated in 1976 at 25,000 (excludingconstruction and public works) could reach 100,000 by 1981. SONACOME alone,which currently employs 20,000 persons, expects to employ 115,000 by 1981.
56. Breaking down these estimates by skill levels, the Ministry of In-dustry concluded that the present scarcity of upper and middle level super-visory personnel was likely to increase and spread rapidly to the entireindustrial work force. The existing training resources, despite the effortsmade, are unequal to such demands. It was therefore decided to speed up thedevelopment of higher education; Algeria's current target is to build auniversity center in each of the 31 wilayate.
57. At skilled-worker level the problem is enormous. Vocational trainingcapacity in 1973 represented 12,000 jobs a year in all sectors of the economyplus 2,000 a year in the public enterprises. Training of the labor force on aproject-by-project basis, as now done under "product in hand" contracts,has serious drawbacks. Foreign engineering firms charge a very high pricefor this training; moreover, the system inhibits the creation of permanenttraining capacity as an integral part of Algerian industry. The Ministry hastherefore launched a program to create manpower-training capacity representing100,000 jobs a year by 1980. The public enterprises are responsible forcarrying out this program in each branch of industry. The Ministry regardsthis training capacity as the absolute minimum needed to meet the directrequirements of industrial development. The other economic, administrativeand social sectors will have to install additional capacity to meet their ownneeds. Finally, under its policy of reintegration of emigrant workers,Algeria intends to accelerate the studies needed to prepare for an increasein annual rates of permanent return - still quite low - to those sectors andregions where work can be found. This calls for a substantial upsurge inconstruction to provide the housing and urban infrastructures needed by theseworkers.
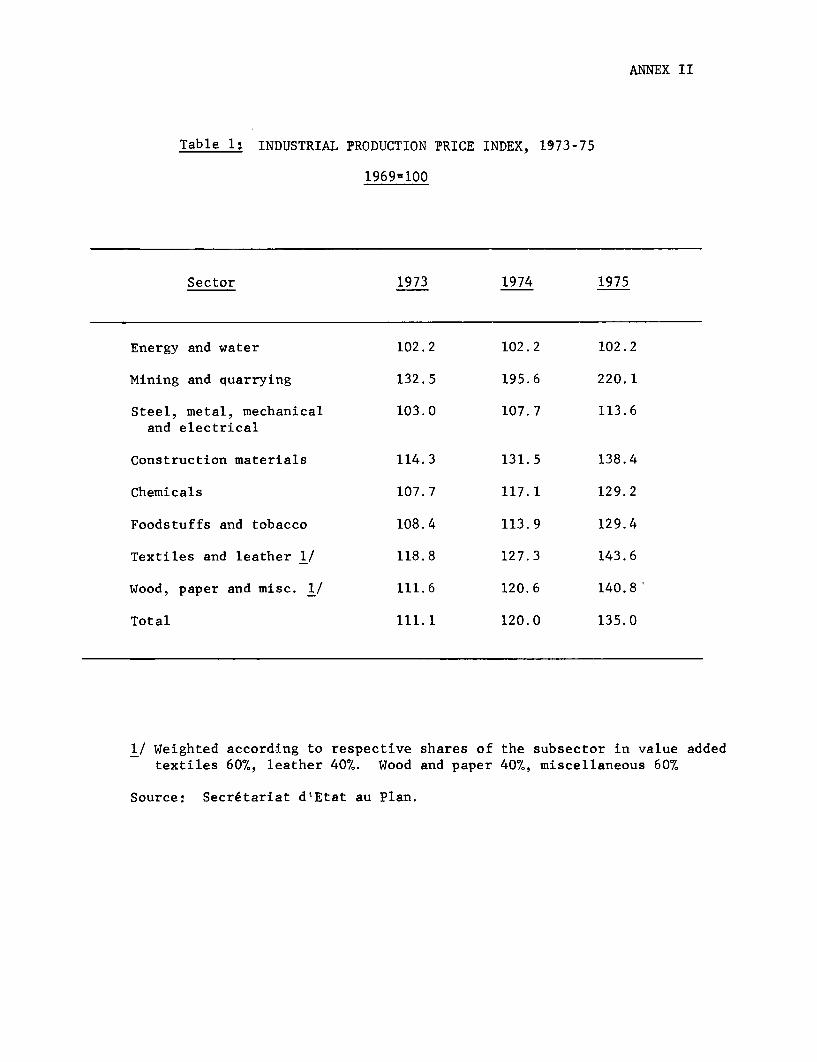
ANNEX II
Table 1s INDUSTRIAL PRODUCTION PRICE INDEX, 1973-75
1969-100
Sector 1973 1974 1975
Energy and water 102.2 102.2 102.2
Mining and quarrying 132.5 195.6 220.1
Steel, metal, mechanical 103.0 107.7 113.6and electrical
Construction materials 114.3 131.5 138.4
Chemicals 107.7 117.1 129.2
Foodstuffs and tobacco 108.4 113.9 129.4
Textiles and leather 1/ 118.8 127.3 143.6
Wood, paper and misc. 1/ 111.6 120.6 140.8'
Total 111.1 120.0 135.0
1/ Weighted according to respective shares of the subsector in value addedtextiles 60%, leather 40%. Wood and paper 40%, miscellaneous 60%
Source! Secretariat d'Etat au Plan.

ANNEX II
Table 2: VALUE ADDED AT CONSTANT 1969 PRICES(millions of dinars)
Sector 1973 1974 1975 1/
Mining and quarrying 143.4 184.0 181.7
Energy & water 430.5 479.5 596.9
Manufacturing 4260.7 4350.7 4672.5
1. Steel, metal, mech, 1165.0 1160.5 1426.1elec. industries
2. Chemicals 464.3 375.7 410.2
3. Constr. materials 166.2 205.3 216.8
4. Food processing 1393.0 1466.2 1483.8
5. Textiles & leather 740.7 769.8 752.1
6. Miscellaneous 331.5 373.1 383.5
1 + 2 + 3 1795.5 1741.6 2053.1
4 + 5 + 6 2465.2 2609.1 2619.4
Total industry 4834.6 5014.2 5451.1
1/ Preliminary
Source: IBRD estimates
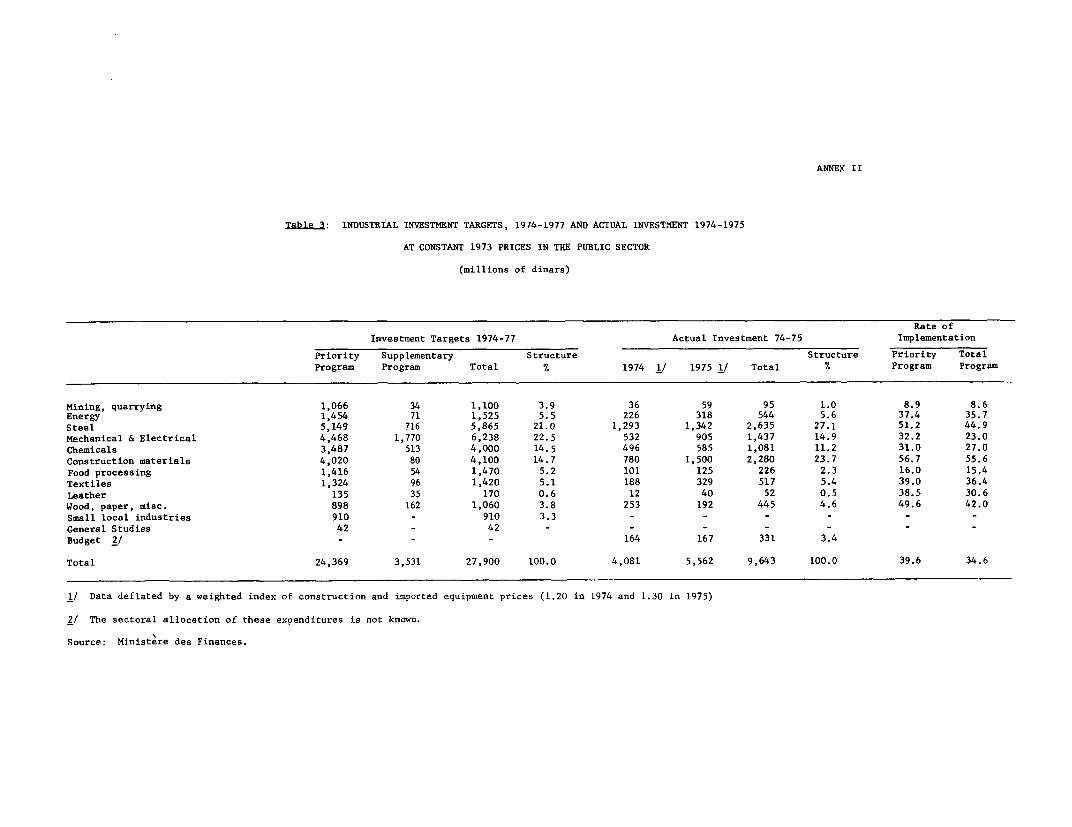
ANNEX II
Table 3: INDUSTRIAL INVESTMENT TARGETS, 1974-1977 AND ACTUAL INVESTMENT 1974-1975
AT CONSTANT 1973 PRICES IN THE PUBLIC SECTOR
(millions of dinars)
Rate ofInvestment Targets 1974-77 Actual Investment 74-75 Implementation
Priority Supplementary Structure Structure Priority TotalProgram Program Total % 1974 1/ 1975 1/ Total % Program Program
Mining, quarrying 1,066 34 1,100 3.9 36 59 95 1.0 8.9 8.6Energy 1,454 71 1,525 5.5 226 318 544 5.6 37.4 35.7Steel 5,149 716 5,865 21.0 1,293 1,342 2,635 27.1 51.2 44.9Mechanical & Electrical 4,468 1,770 6,238 22.5 532 905 1,437 14.9 32.2 23.0Chemicals 3,487 513 4,000 14.5 496 585 1,081 11.2 31.0 27.0Construction materials 4,020 80 4,100 14.7 780 1,500 2,280 23.7 56.7 55.6Food processing 1,416 54 1,470 5.2 101 125 226 2.3 16.0 15.4Textiles 1,324 96 1,420 5.1 188 329 517 5.4 39.0 36.4Leather 135 35 170 0.6 12 40 52 0.5 38.5 30.6Wood, paper, misc. 898 162 1,060 3.8 253 192 445 4.6 49.6 42.0Small local industries 910 - 910 3.3 - - - - - -General Studies 42 - 42 - - - - - - -Budget 2/ - - - 164 167 331 3.4
Total 24,369 3,531 27,900 100.0 4,081 5,562 9,643 100.0 39.6 34.6
1/ Data deflated by a weighted index of construction and imported equipment prices (1.20 in 1974 and 1.30 in 1975)
2/ The sectoral allocation of these expenditures is not known.
Source: Ministere des Finances.
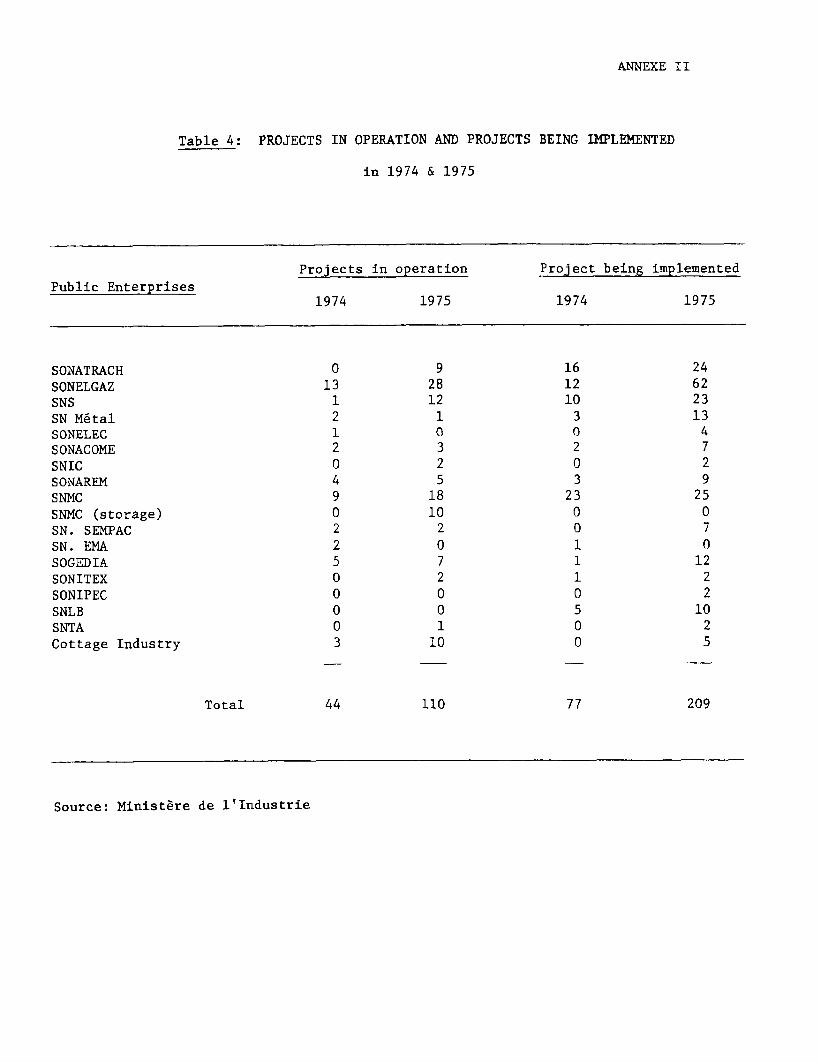
ANNEXE II
Table 4: PROJECTS IN OPERATION AND PROJECTS BEING IMPLEMENTED
in 1974 & 1975
Projects in operation Project being implemented
Public Enterprises1974 1975 1974 1975
SONATRACH 0 9 16 24
SONELGAZ 13 28 12 62
SNS 1 12 10 23
SN Metal 2 1 3 13
SONELEC 1 0 0 4SONACOME 2 3 2 7
SNIC 0 2 0 2
SONAREM 4 5 3 9SNMC 9 18 23 25
SNMC (storage) 0 10 0 0
SN. SEMPAC 2 2 0 7
SN. EMA 2 0 1 0
SOGEDIA 5 7 1 12
SONITEX 0 2 1 2
SONIPEC 0 0 0 2
SNLB 0 0 5 10
SNTA 0 1 0 2
Cottage Industry 3 10 0 5
Total 44 110 77 209
Source: Ministere de l'Industrie

ANNEX II
Table 5:
PRINCIPAL INDUSTRIAL UNITS EXISTING AND UNDER CONSTRUCTIONIN "HAUTS PLATEAUX" REGION IN 1974 AND 1975
SNS Spiral pipes in GhardaiaSteel wire-works in El Eulma et Tiaret
Gas cylinders in Batna and Tiaret (3 units)Aluminium processing in Bordj Bon ArreridjAluminium electrolysis in MsilaSpecial steel in Ain MlikaElectrode production in El Eulma
SN Metal Metal frames in BatnaSmelting works in TiaretMetal furniture in SaidaRepairs of railroad cars in Souk AlmasBreak-system in TiaretHardware production in Sedrata
SONATRACH Plastic processing in Setif
SONELEC Battery production in Setif
SONACOME Smelting, pump and valve production in Berrouaghia
Engines, tractors and machine tools in Constantine
Light trucks, body industry in TiaretEngines in Ain Oussera
SNMC Cement in Saida and ConstantineBrick works in Setif, Mila, Saida, Bechar, Souk Ahras and Tiaret
SONELGAZ Pipeline distribution of natural gas in Khroub, Sftif, Souk
Ahras, Saida, Bordj Bou Arreridj, Constantine, Chelgoum El Aid,
Ain, Mlila, Maghnia, Touggourt, etc.
Source: Ministere de l'Industrie.