filing at a glance - rhode island · aarp medicare supplement portfolio group policy number...
TRANSCRIPT
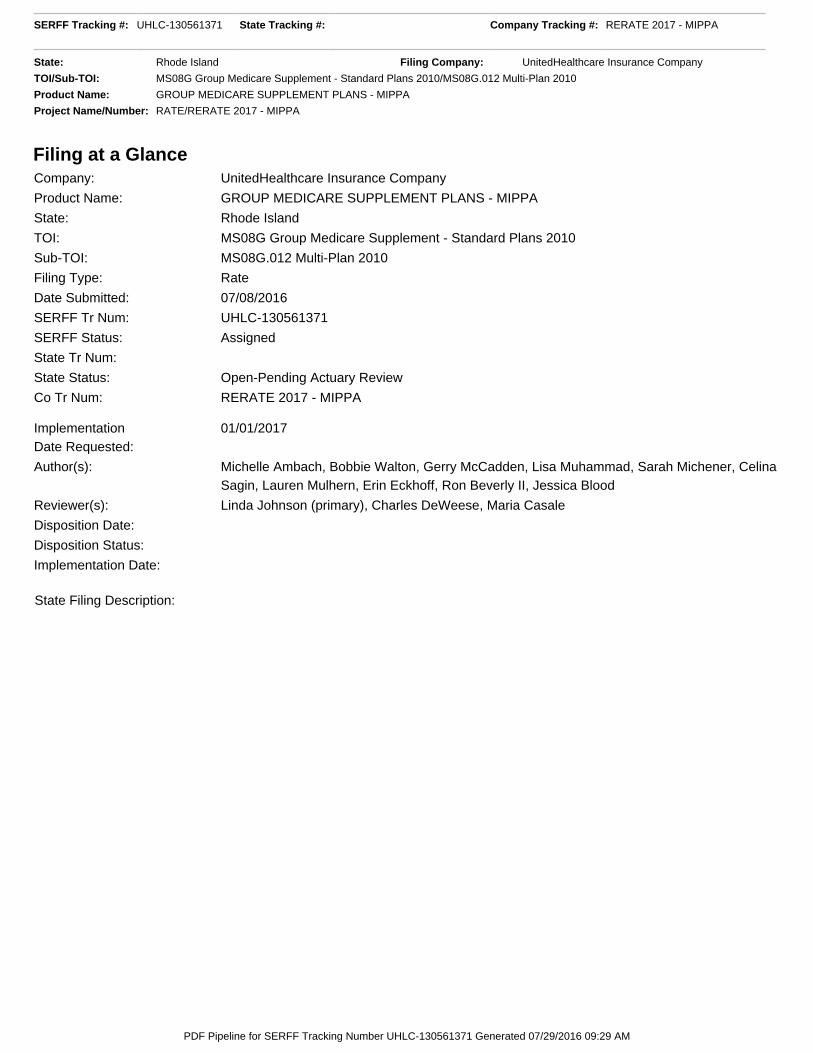
Filing at a Glance
Company: UnitedHealthcare Insurance Company
Product Name: GROUP MEDICARE SUPPLEMENT PLANS - MIPPA
State: Rhode Island
TOI: MS08G Group Medicare Supplement - Standard Plans 2010
Sub-TOI: MS08G.012 Multi-Plan 2010
Filing Type: Rate
Date Submitted: 07/08/2016
SERFF Tr Num: UHLC-130561371
SERFF Status: Assigned
State Tr Num:
State Status: Open-Pending Actuary Review
Co Tr Num: RERATE 2017 - MIPPA
ImplementationDate Requested:
01/01/2017
Author(s): Michelle Ambach, Bobbie Walton, Gerry McCadden, Lisa Muhammad, Sarah Michener, CelinaSagin, Lauren Mulhern, Erin Eckhoff, Ron Beverly II, Jessica Blood
Reviewer(s): Linda Johnson (primary), Charles DeWeese, Maria Casale
Disposition Date:
Disposition Status:
Implementation Date:
State Filing Description:
SERFF Tracking #: UHLC-130561371 State Tracking #: Company Tracking #: RERATE 2017 - MIPPA
State: Rhode Island Filing Company: UnitedHealthcare Insurance Company
TOI/Sub-TOI: MS08G Group Medicare Supplement - Standard Plans 2010/MS08G.012 Multi-Plan 2010
Product Name: GROUP MEDICARE SUPPLEMENT PLANS - MIPPA
Project Name/Number: RATE/RERATE 2017 - MIPPA
PDF Pipeline for SERFF Tracking Number UHLC-130561371 Generated 07/29/2016 09:29 AM

General Information
Company and Contact
Filing Fees
Project Name: RATE Status of Filing in Domicile: Not Filed
Project Number: RERATE 2017 - MIPPA Date Approved in Domicile:
Requested Filing Mode: Review & Approval Domicile Status Comments:
Explanation for Combination/Other: Market Type: Group
Submission Type: New Submission Group Market Size: Large
Group Market Type: Association Overall Rate Impact:
Filing Status Changed: 07/11/2016
State Status Changed: 07/11/2016 Deemer Date:
Created By: Ron Beverly II Submitted By: Ron Beverly II
Corresponding Filing Tracking Number: RERATE 2017 -MIPPA - MIPPA Forms Approved 9/9/2009 under SERFFUHLC-126263871
Filing Description:
Rate Revision Filing & Modification to Early Enrollment Discounts and Base Rate EligibilityRates for 2010 Standardized Medicare Supplement PlansUnitedHealthcare Insurance CompanyNAIC #0707-79413
Filing Contact InformationSarah Michener, Director, Actuarial [email protected]
680 Blair Mill Rd
Horsham, PA 19044
215-902-8419 [Phone]
Filing Company InformationUnitedHealthcare InsuranceCompany
185 Asylum Street
Hartford, CT 06103
(860) 702-5000 ext. [Phone]
CoCode: 79413
Group Code: 707
Group Name:
FEIN Number: 36-2739571
State of Domicile: Connecticut
Company Type: Life andHealth
State ID Number: 79413
Fee Required? Yes
Fee Amount: $175.00
Retaliatory? No
Fee Explanation: RQD FEE
Per Company: Yes
Company Amount Date Processed Transaction #UnitedHealthcare Insurance Company $175.00 07/08/2016 111145077
SERFF Tracking #: UHLC-130561371 State Tracking #: Company Tracking #: RERATE 2017 - MIPPA
State: Rhode Island Filing Company: UnitedHealthcare Insurance Company
TOI/Sub-TOI: MS08G Group Medicare Supplement - Standard Plans 2010/MS08G.012 Multi-Plan 2010
Product Name: GROUP MEDICARE SUPPLEMENT PLANS - MIPPA
Project Name/Number: RATE/RERATE 2017 - MIPPA
PDF Pipeline for SERFF Tracking Number UHLC-130561371 Generated 07/29/2016 09:29 AM

Correspondence Summary Filing NotesSubject Note Type Created By Created On Date SubmittedSample Narrative Filings Note To Filer Linda Johnson 07/15/2016 07/15/2016Request for Narrative Note To Filer Linda Johnson 07/12/2016 07/12/2016
SERFF Tracking #: UHLC-130561371 State Tracking #: Company Tracking #: RERATE 2017 - MIPPA
State: Rhode Island Filing Company: UnitedHealthcare Insurance Company
TOI/Sub-TOI: MS08G Group Medicare Supplement - Standard Plans 2010/MS08G.012 Multi-Plan 2010
Product Name: GROUP MEDICARE SUPPLEMENT PLANS - MIPPA
Project Name/Number: RATE/RERATE 2017 - MIPPA
PDF Pipeline for SERFF Tracking Number UHLC-130561371 Generated 07/29/2016 09:29 AM
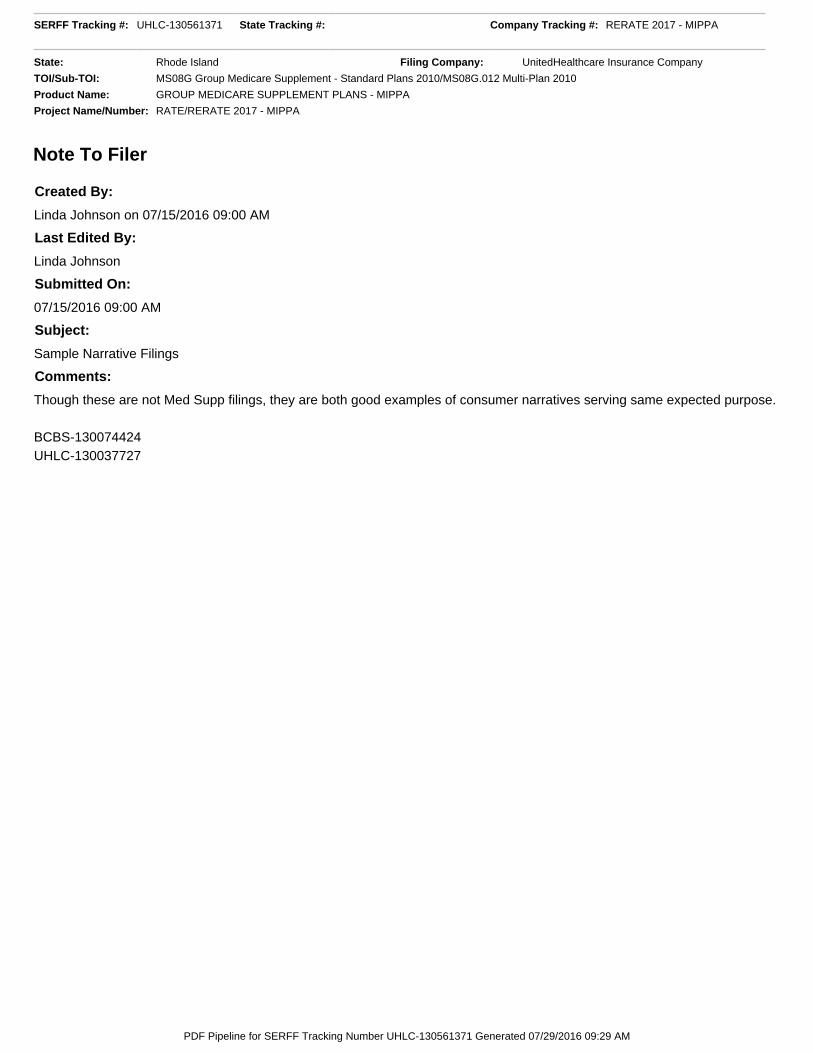
Note To Filer
Created By:
Linda Johnson on 07/15/2016 09:00 AM
Last Edited By:
Linda Johnson
Submitted On:
07/15/2016 09:00 AM
Subject:
Sample Narrative Filings
Comments:
Though these are not Med Supp filings, they are both good examples of consumer narratives serving same expected purpose.
BCBS-130074424UHLC-130037727
SERFF Tracking #: UHLC-130561371 State Tracking #: Company Tracking #: RERATE 2017 - MIPPA
State: Rhode Island Filing Company: UnitedHealthcare Insurance Company
TOI/Sub-TOI: MS08G Group Medicare Supplement - Standard Plans 2010/MS08G.012 Multi-Plan 2010
Product Name: GROUP MEDICARE SUPPLEMENT PLANS - MIPPA
Project Name/Number: RATE/RERATE 2017 - MIPPA
PDF Pipeline for SERFF Tracking Number UHLC-130561371 Generated 07/29/2016 09:29 AM

Note To Filer
Created By:
Linda Johnson on 07/12/2016 03:27 PM
Last Edited By:
Linda Johnson
Submitted On:
07/12/2016 03:27 PM
Subject:
Request for Narrative
Comments:
Please submit a Consumer friendly rate justification narrative in the Supplemental Documentation tab. Please keep thisinformative consumer narrative to one page and readability to meet OHIC Regulation 5.
SERFF Tracking #: UHLC-130561371 State Tracking #: Company Tracking #: RERATE 2017 - MIPPA
State: Rhode Island Filing Company: UnitedHealthcare Insurance Company
TOI/Sub-TOI: MS08G Group Medicare Supplement - Standard Plans 2010/MS08G.012 Multi-Plan 2010
Product Name: GROUP MEDICARE SUPPLEMENT PLANS - MIPPA
Project Name/Number: RATE/RERATE 2017 - MIPPA
PDF Pipeline for SERFF Tracking Number UHLC-130561371 Generated 07/29/2016 09:29 AM
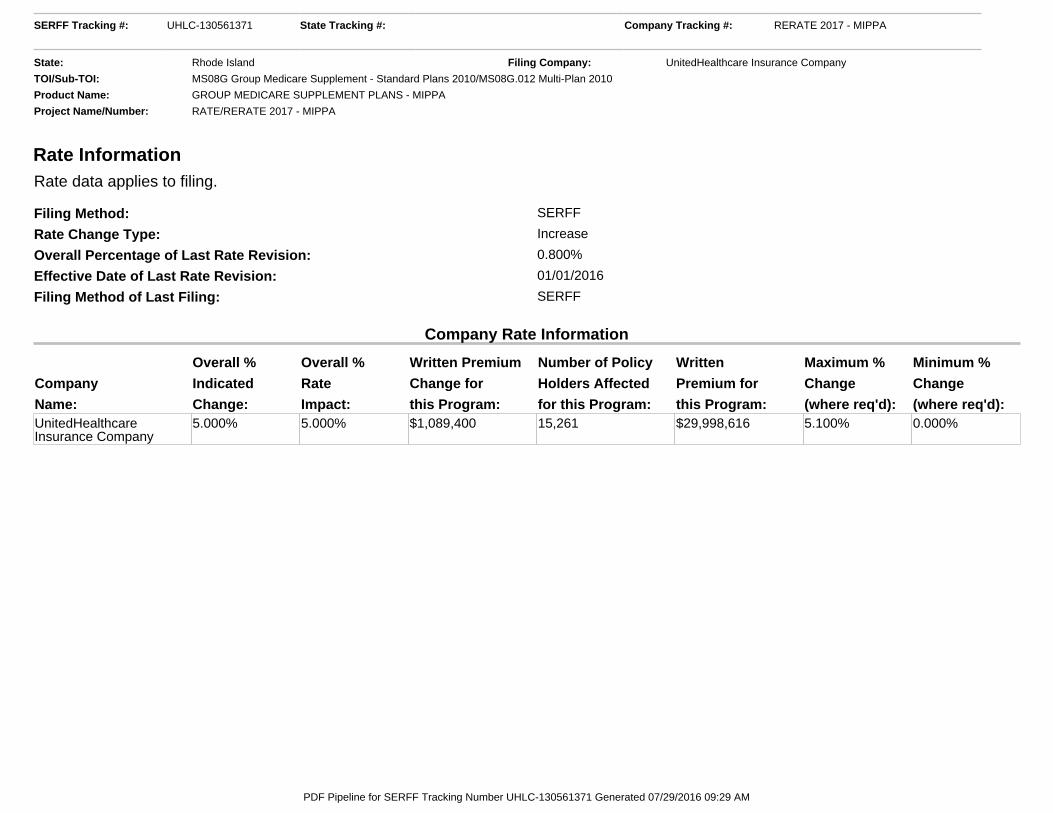
Rate Information Rate data applies to filing.
Filing Method: SERFF
Rate Change Type: Increase
Overall Percentage of Last Rate Revision: 0.800%
Effective Date of Last Rate Revision: 01/01/2016
Filing Method of Last Filing: SERFF
Company Rate Information
Company
Name:
Overall %
Indicated
Change:
Overall %
Rate
Impact:
Written Premium
Change for
this Program:
Number of Policy
Holders Affected
for this Program:
Written
Premium for
this Program:
Maximum %
Change
(where req'd):
Minimum %
Change
(where req'd):UnitedHealthcareInsurance Company
5.000% 5.000% $1,089,400 15,261 $29,998,616 5.100% 0.000%
SERFF Tracking #: UHLC-130561371 State Tracking #: Company Tracking #: RERATE 2017 - MIPPA
State: Rhode Island Filing Company: UnitedHealthcare Insurance Company
TOI/Sub-TOI: MS08G Group Medicare Supplement - Standard Plans 2010/MS08G.012 Multi-Plan 2010
Product Name: GROUP MEDICARE SUPPLEMENT PLANS - MIPPA
Project Name/Number: RATE/RERATE 2017 - MIPPA
PDF Pipeline for SERFF Tracking Number UHLC-130561371 Generated 07/29/2016 09:29 AM
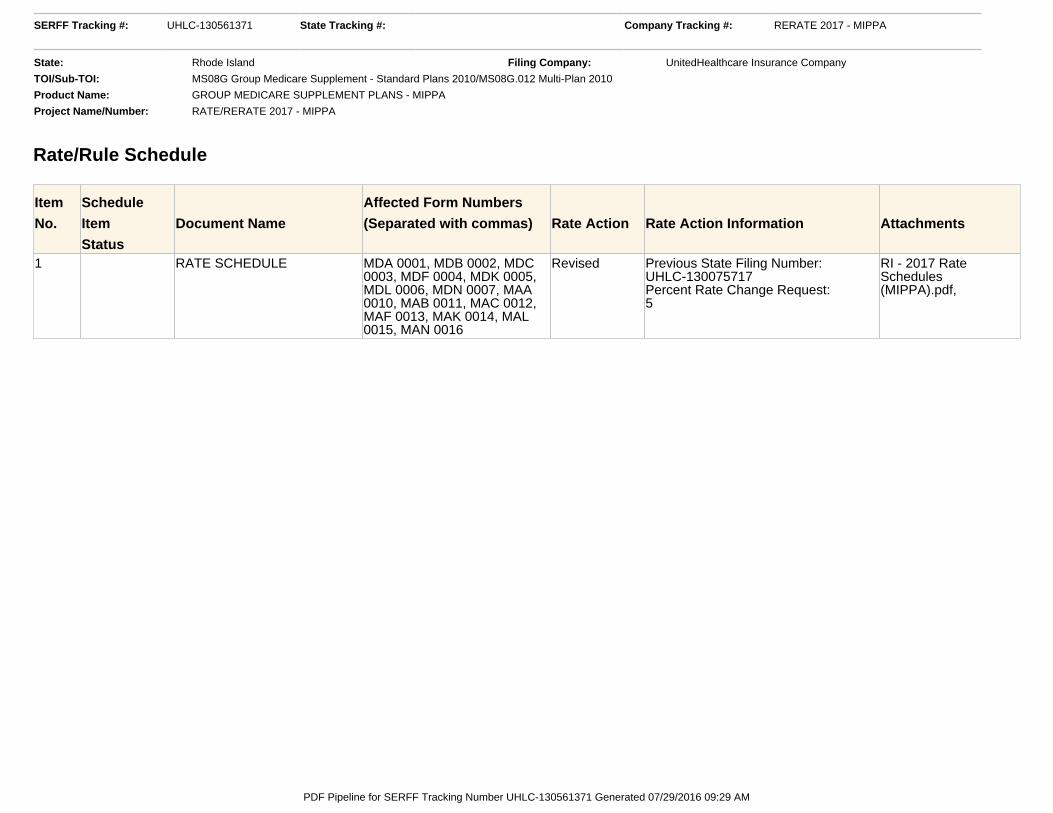
Rate/Rule Schedule
Item
No.
Schedule
Item
Status
Document Name
Affected Form Numbers
(Separated with commas) Rate Action Rate Action Information Attachments
1 RATE SCHEDULE MDA 0001, MDB 0002, MDC0003, MDF 0004, MDK 0005,MDL 0006, MDN 0007, MAA0010, MAB 0011, MAC 0012,MAF 0013, MAK 0014, MAL0015, MAN 0016
Revised Previous State Filing Number:UHLC-130075717Percent Rate Change Request:5
RI - 2017 RateSchedules(MIPPA).pdf,
SERFF Tracking #: UHLC-130561371 State Tracking #: Company Tracking #: RERATE 2017 - MIPPA
State: Rhode Island Filing Company: UnitedHealthcare Insurance Company
TOI/Sub-TOI: MS08G Group Medicare Supplement - Standard Plans 2010/MS08G.012 Multi-Plan 2010
Product Name: GROUP MEDICARE SUPPLEMENT PLANS - MIPPA
Project Name/Number: RATE/RERATE 2017 - MIPPA
PDF Pipeline for SERFF Tracking Number UHLC-130561371 Generated 07/29/2016 09:29 AM
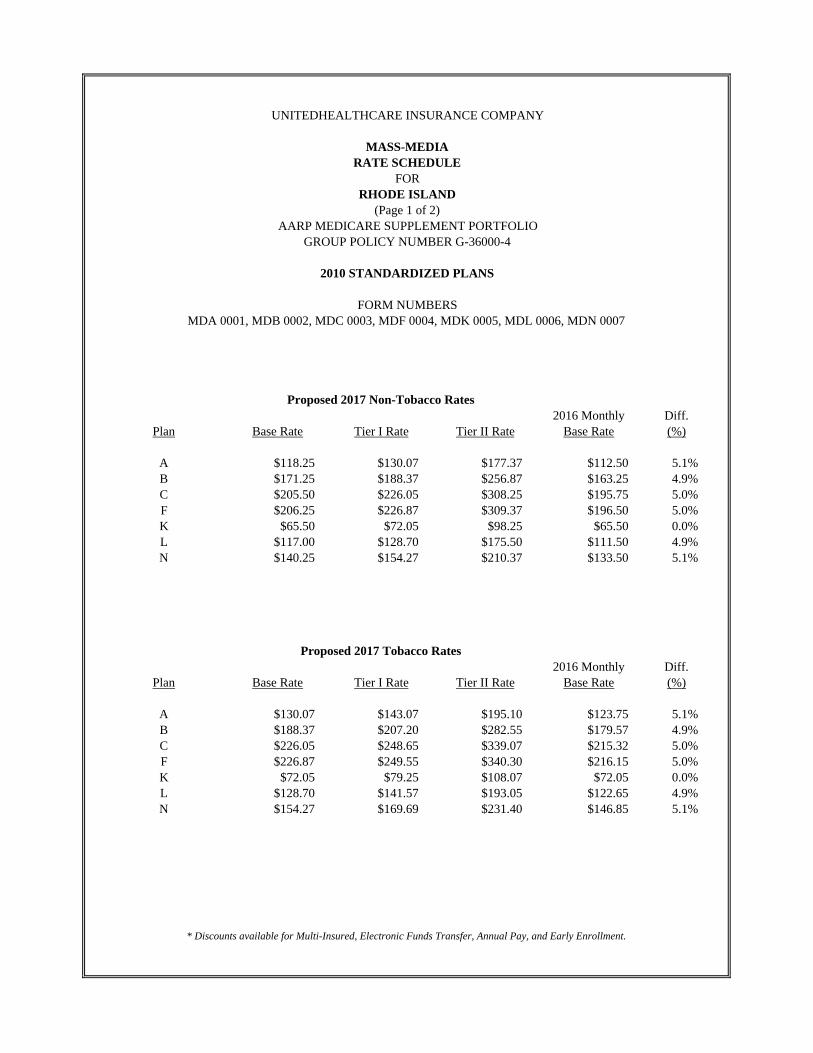
UNITEDHEALTHCARE INSURANCE COMPANY
MASS-MEDIARATE SCHEDULE
FORRHODE ISLAND
(Page 1 of 2)AARP MEDICARE SUPPLEMENT PORTFOLIO
GROUP POLICY NUMBER G-36000-4
2010 STANDARDIZED PLANS
FORM NUMBERSMDA 0001, MDB 0002, MDC 0003, MDF 0004, MDK 0005, MDL 0006, MDN 0007
0
Proposed 2017 Non-Tobacco Rates2016 Monthly Diff.
Plan Base Rate Tier I Rate Tier II Rate Base Rate (%)
A $118.25 $130.07 $177.37 $112.50 5.1%B $171.25 $188.37 $256.87 $163.25 4.9%C $205.50 $226.05 $308.25 $195.75 5.0%F $206.25 $226.87 $309.37 $196.50 5.0%K $65.50 $72.05 $98.25 $65.50 0.0%L $117.00 $128.70 $175.50 $111.50 4.9%N $140.25 $154.27 $210.37 $133.50 5.1%
Proposed 2017 Tobacco Rates2016 Monthly Diff.
Plan Base Rate Tier I Rate Tier II Rate Base Rate (%)
A $130.07 $143.07 $195.10 $123.75 5.1%B $188.37 $207.20 $282.55 $179.57 4.9%C $226.05 $248.65 $339.07 $215.32 5.0%F $226.87 $249.55 $340.30 $216.15 5.0%K $72.05 $79.25 $108.07 $72.05 0.0%L $128.70 $141.57 $193.05 $122.65 4.9%N $154.27 $169.69 $231.40 $146.85 5.1%
* Discounts available for Multi-Insured, Electronic Funds Transfer, Annual Pay, and Early Enrollment.

UNITEDHEALTHCARE INSURANCE COMPANY
AGENT DISTRIBUTIONRATE SCHEDULE
FORRHODE ISLAND
(Page 2 of 2)AARP MEDICARE SUPPLEMENT PORTFOLIO
GROUP POLICY NUMBER G-36000-4
2010 STANDARDIZED PLANS
FORM NUMBERSMAA 0010, MAB 0011, MAC 0012, MAF 0013, MAK 0014, MAL 0015, MAN 0016
0
Proposed 2017 Non-Tobacco Rates2016 Monthly Diff.
Plan Base Rate Tier I Rate Tier II Rate Base Rate (%)
A $118.25 $130.07 $177.37 $112.50 5.1%B $171.25 $188.37 $256.87 $163.25 4.9%C $205.50 $226.05 $308.25 $195.75 5.0%F $206.25 $226.87 $309.37 $196.50 5.0%K $65.50 $72.05 $98.25 $65.50 0.0%L $117.00 $128.70 $175.50 $111.50 4.9%N $140.25 $154.27 $210.37 $133.50 5.1%
Proposed 2017 Tobacco Rates2016 Monthly Diff.
Plan Base Rate Tier I Rate Tier II Rate Base Rate (%)
A $130.07 $143.07 $195.10 $123.75 5.1%B $188.37 $207.20 $282.55 $179.57 4.9%C $226.05 $248.65 $339.07 $215.32 5.0%F $226.87 $249.55 $340.30 $216.15 5.0%K $72.05 $79.25 $108.07 $72.05 0.0%L $128.70 $141.57 $193.05 $122.65 4.9%N $154.27 $169.69 $231.40 $146.85 5.1%
* Discounts available for Multi-Insured, Electronic Funds Transfer, Annual Pay, and Early Enrollment.
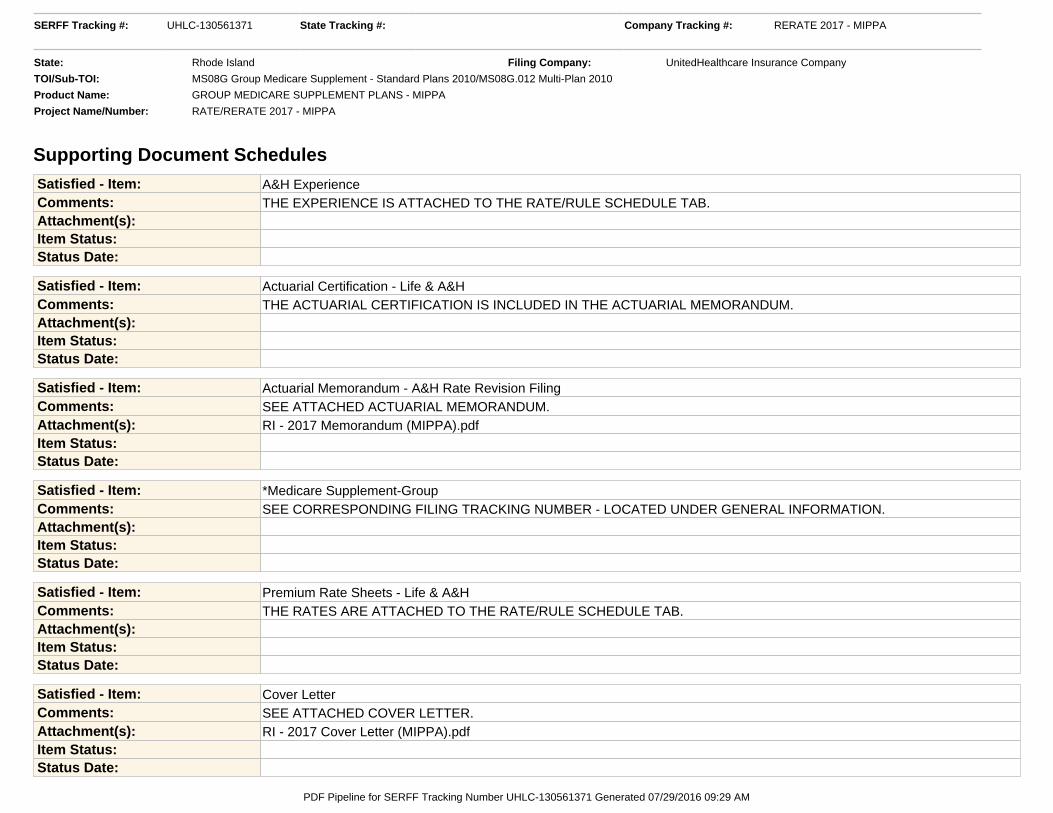
Supporting Document Schedules Satisfied - Item: A&H ExperienceComments: THE EXPERIENCE IS ATTACHED TO THE RATE/RULE SCHEDULE TAB.Attachment(s):Item Status:Status Date:
Satisfied - Item: Actuarial Certification - Life & A&HComments: THE ACTUARIAL CERTIFICATION IS INCLUDED IN THE ACTUARIAL MEMORANDUM.Attachment(s):Item Status:Status Date:
Satisfied - Item: Actuarial Memorandum - A&H Rate Revision FilingComments: SEE ATTACHED ACTUARIAL MEMORANDUM.Attachment(s): RI - 2017 Memorandum (MIPPA).pdfItem Status:Status Date:
Satisfied - Item: *Medicare Supplement-GroupComments: SEE CORRESPONDING FILING TRACKING NUMBER - LOCATED UNDER GENERAL INFORMATION.Attachment(s):Item Status:Status Date:
Satisfied - Item: Premium Rate Sheets - Life & A&HComments: THE RATES ARE ATTACHED TO THE RATE/RULE SCHEDULE TAB.Attachment(s):Item Status:Status Date:
Satisfied - Item: Cover LetterComments: SEE ATTACHED COVER LETTER.Attachment(s): RI - 2017 Cover Letter (MIPPA).pdfItem Status:Status Date:
SERFF Tracking #: UHLC-130561371 State Tracking #: Company Tracking #: RERATE 2017 - MIPPA
State: Rhode Island Filing Company: UnitedHealthcare Insurance Company
TOI/Sub-TOI: MS08G Group Medicare Supplement - Standard Plans 2010/MS08G.012 Multi-Plan 2010
Product Name: GROUP MEDICARE SUPPLEMENT PLANS - MIPPA
Project Name/Number: RATE/RERATE 2017 - MIPPA
PDF Pipeline for SERFF Tracking Number UHLC-130561371 Generated 07/29/2016 09:29 AM

Satisfied - Item: Uniform Transmittal Document (MIPPA)Comments: SEE ATTACHED UNIFORM TRANSMITTAL DOCUMENT.Attachment(s): 2017 Uniform Transmittal - RI MIPPA.pdfItem Status:Status Date:
Satisfied - Item: Attachments (MIPPA)Comments: SEE ATTACHED ATTACHMENTS.Attachment(s): RI - 2017 Attachments (MIPPA).pdfItem Status:Status Date:
SERFF Tracking #: UHLC-130561371 State Tracking #: Company Tracking #: RERATE 2017 - MIPPA
State: Rhode Island Filing Company: UnitedHealthcare Insurance Company
TOI/Sub-TOI: MS08G Group Medicare Supplement - Standard Plans 2010/MS08G.012 Multi-Plan 2010
Product Name: GROUP MEDICARE SUPPLEMENT PLANS - MIPPA
Project Name/Number: RATE/RERATE 2017 - MIPPA
PDF Pipeline for SERFF Tracking Number UHLC-130561371 Generated 07/29/2016 09:29 AM

1
UnitedHealthcare Insurance Company
Annual Medicare Supplement Filing Actuarial Memorandum
AARP Medicare Supplement Portfolio
Group Policy Number G-36000-4
2010 Standardized Plans
Form Numbers MDA 0001, MDB 0002, MDC 0003, MDF 0004, MDK 0005, MDL 0006, MDN 0007, MAA 0010,
MAB 0011, MAC 0012, MAF 0013, MAK 0014, MAL 0015, MAN 0016
Rhode Island A. Purpose of Filing
The purpose of this filing is to request approval of 2017 rate revisions for 2010 Standardized Medicare Supplement plans and to demonstrate compliance with loss ratio standards. We are also requesting approval to modify the early enrollment discounts and the eligibility period for the base rate for new insureds beginning approximately July 1, 2017. Our filing pools your state’s experience of 1990 and 2010 standardized plans for developing proposed rate actions and demonstrating compliance with loss ratio requirements.
B. General Description
1. Issuer Name: UnitedHealthcare Insurance Company
2. Group Policy Number: G-36000-4
Medicare Supplement Mass Media Form Numbers: Agent Distribution Form Numbers: MDA 0001 MDB 0002 MDC 0003 MDF 0004
MDK 0005 MDL 0006 MDN 0007
MAA 0010 MAB 0011 MAC 0012 MAF 0013
MAK 0014 MAL 0015 MAN 0016
These form numbers include inforce certificates and new sales.
3. Policy Type: Group Standardized Medicare Supplement Insurance
4. Benefits Description: Benefits provided by the 2010 Plans are shown in Attachment 12.

2
5. Renewal Provision: Guaranteed renewable. If the group policy is terminated by the group policyholder and not replaced by another group policy by the same policyholder, an individual Medicare Supplement policy will be offered.
6. Marketing Method: Plans are sold via mass-media and agent distribution to members of AARP. Mass-media will constitute policies issued as a result of solicitation of individuals through the mail or by mass-media advertising (including both print and broadcast advertising).
7. Underwriting Method:
a) Ages 65 and older:
First six months of Medicare Part B coverage at age 65 or older – Medicare Supplement Plans are available on a guarantee issue basis.
More than six months after becoming eligible for Medicare Part B coverage except those that apply within six months following their 65th birthday – Applicants must satisfy underwriting requirements to be eligible for coverage, unless otherwise eligible for open enrollment or guaranteed issue.
8. Pre-Existing Conditions Exclusion: The maximum exclusion on these plans is 3 months/3 months. 9. Issue Age Limits:
Minimum Age – 65. Maximum Age – None. Insureds must be members of AARP at the time of issue.
10. Premium Basis:
Premium is earned on the first of the month for the entire month in which it is due.
a. Age 65 and older:
Premium rates vary based on the time elapsed from an insured’s 65th birthday or Medicare Part B Effective Date, if later, their effective date in an AARP 2010 Medicare Supplement plan and the underwriting requirements.
Effective dates before July 1, 2017 (actual effective date may vary from this target date depending on operational readiness)
o Insureds whose effective date is less than three years following their 65th birthday or Medicare Part B Effective Date, if later, pay the base rates.
o Insureds whose effective date is three or more years following their 65th birthday or Medicare Part B Effective Date, if later, pay rates based on their responses to medical questions when they applied. Applicants whose answers indicate they have a serious medical condition,
pay rates that are 50% (Tier 2) higher than the base rates. Applicants whose answers indicate they do not have a serious medical
condition pay: The base rates if their effective date is less than six years following
their 65th birthday or Medicare Part B Effective Date, if later; or Rates that are 10% (Tier 1) higher than the base rates if their
effective date is six or more years following their 65th birthday or Medicare Part B Effective Date, if later.
3
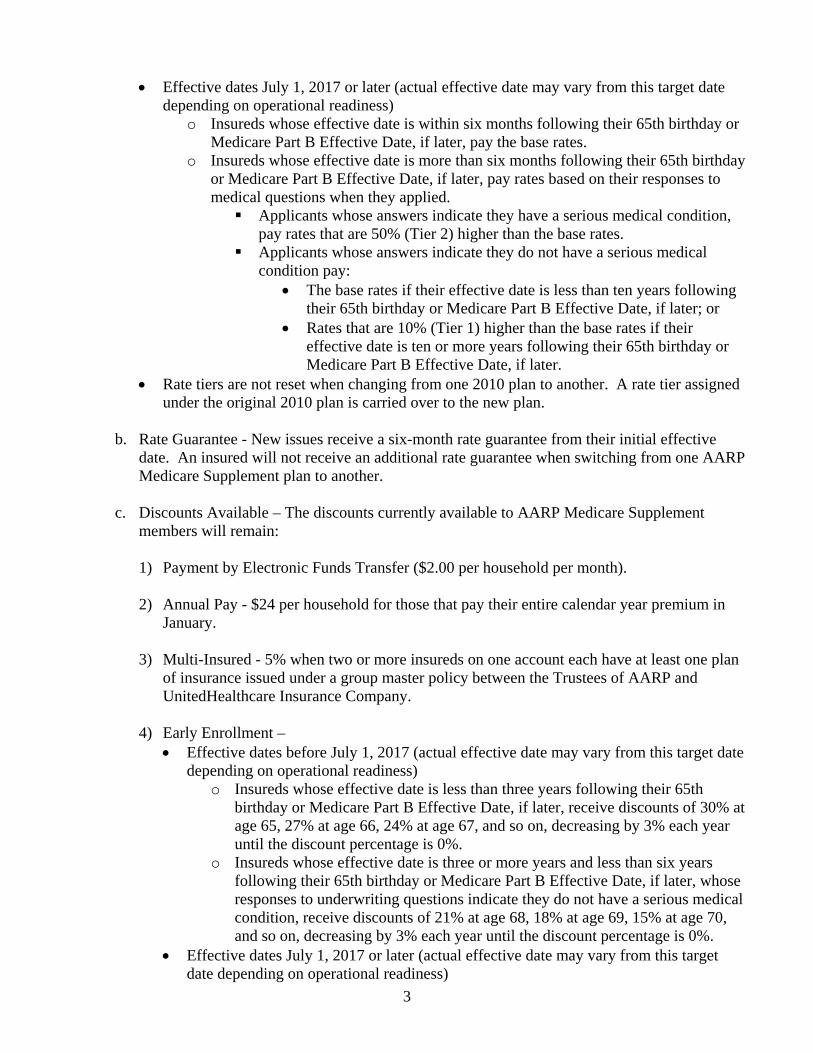
Effective dates July 1, 2017 or later (actual effective date may vary from this target date depending on operational readiness)
o Insureds whose effective date is within six months following their 65th birthday or Medicare Part B Effective Date, if later, pay the base rates.
o Insureds whose effective date is more than six months following their 65th birthday or Medicare Part B Effective Date, if later, pay rates based on their responses to medical questions when they applied. Applicants whose answers indicate they have a serious medical condition,
pay rates that are 50% (Tier 2) higher than the base rates. Applicants whose answers indicate they do not have a serious medical
condition pay: The base rates if their effective date is less than ten years following
their 65th birthday or Medicare Part B Effective Date, if later; or Rates that are 10% (Tier 1) higher than the base rates if their
effective date is ten or more years following their 65th birthday or Medicare Part B Effective Date, if later.
Rate tiers are not reset when changing from one 2010 plan to another. A rate tier assigned under the original 2010 plan is carried over to the new plan.
b. Rate Guarantee - New issues receive a six-month rate guarantee from their initial effective
date. An insured will not receive an additional rate guarantee when switching from one AARP Medicare Supplement plan to another.
c. Discounts Available – The discounts currently available to AARP Medicare Supplement
members will remain:
1) Payment by Electronic Funds Transfer ($2.00 per household per month). 2) Annual Pay - $24 per household for those that pay their entire calendar year premium in
January.
3) Multi-Insured - 5% when two or more insureds on one account each have at least one plan of insurance issued under a group master policy between the Trustees of AARP and UnitedHealthcare Insurance Company.
4) Early Enrollment –
Effective dates before July 1, 2017 (actual effective date may vary from this target date depending on operational readiness)
o Insureds whose effective date is less than three years following their 65th birthday or Medicare Part B Effective Date, if later, receive discounts of 30% at age 65, 27% at age 66, 24% at age 67, and so on, decreasing by 3% each year until the discount percentage is 0%.
o Insureds whose effective date is three or more years and less than six years following their 65th birthday or Medicare Part B Effective Date, if later, whose responses to underwriting questions indicate they do not have a serious medical condition, receive discounts of 21% at age 68, 18% at age 69, 15% at age 70, and so on, decreasing by 3% each year until the discount percentage is 0%.
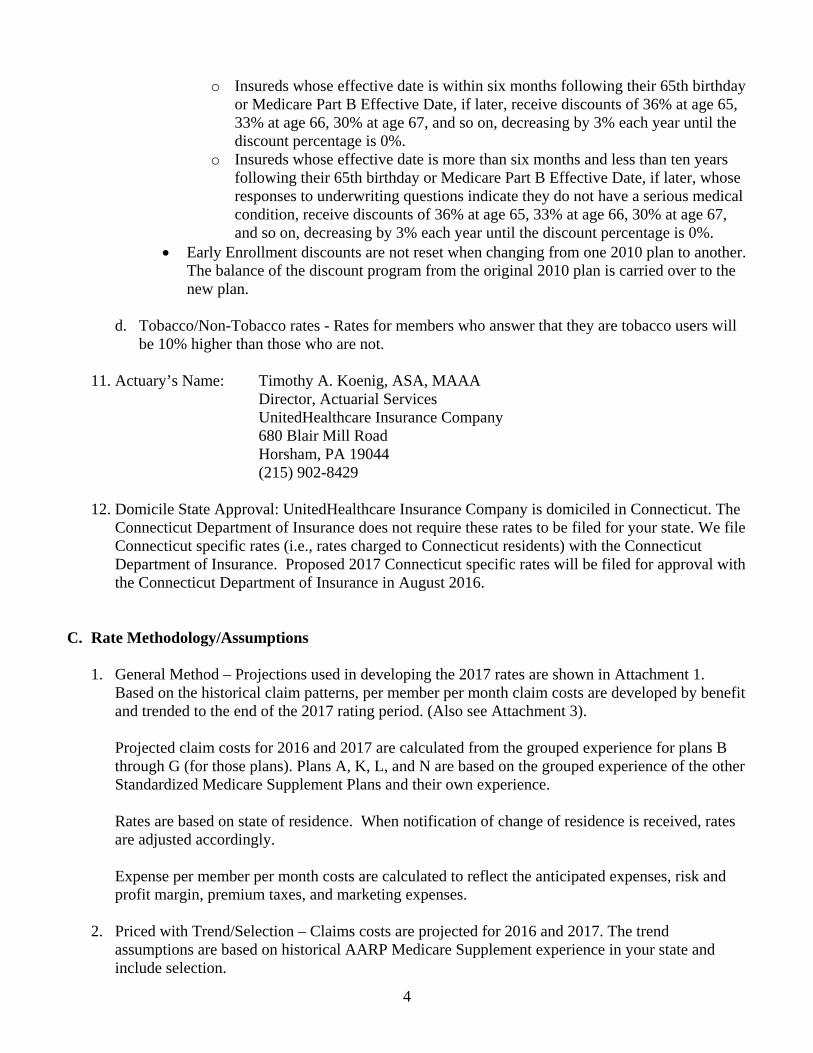
Effective dates July 1, 2017 or later (actual effective date may vary from this target date depending on operational readiness)
4
o Insureds whose effective date is within six months following their 65th birthday or Medicare Part B Effective Date, if later, receive discounts of 36% at age 65, 33% at age 66, 30% at age 67, and so on, decreasing by 3% each year until the discount percentage is 0%.
o Insureds whose effective date is more than six months and less than ten years following their 65th birthday or Medicare Part B Effective Date, if later, whose responses to underwriting questions indicate they do not have a serious medical condition, receive discounts of 36% at age 65, 33% at age 66, 30% at age 67, and so on, decreasing by 3% each year until the discount percentage is 0%.
Early Enrollment discounts are not reset when changing from one 2010 plan to another. The balance of the discount program from the original 2010 plan is carried over to the new plan.
d. Tobacco/Non-Tobacco rates - Rates for members who answer that they are tobacco users will
be 10% higher than those who are not.
11. Actuary’s Name: Timothy A. Koenig, ASA, MAAA Director, Actuarial Services UnitedHealthcare Insurance Company 680 Blair Mill Road Horsham, PA 19044 (215) 902-8429
12. Domicile State Approval: UnitedHealthcare Insurance Company is domiciled in Connecticut. The
Connecticut Department of Insurance does not require these rates to be filed for your state. We file Connecticut specific rates (i.e., rates charged to Connecticut residents) with the Connecticut Department of Insurance. Proposed 2017 Connecticut specific rates will be filed for approval with the Connecticut Department of Insurance in August 2016.
C. Rate Methodology/Assumptions
1. General Method – Projections used in developing the 2017 rates are shown in Attachment 1. Based on the historical claim patterns, per member per month claim costs are developed by benefit and trended to the end of the 2017 rating period. (Also see Attachment 3).
Projected claim costs for 2016 and 2017 are calculated from the grouped experience for plans B through G (for those plans). Plans A, K, L, and N are based on the grouped experience of the other Standardized Medicare Supplement Plans and their own experience. Rates are based on state of residence. When notification of change of residence is received, rates are adjusted accordingly. Expense per member per month costs are calculated to reflect the anticipated expenses, risk and profit margin, premium taxes, and marketing expenses.
2. Priced with Trend/Selection – Claims costs are projected for 2016 and 2017. The trend
assumptions are based on historical AARP Medicare Supplement experience in your state and include selection.

5
3. Priced with Rate Increases – Rates are calculated to be sufficient through 2017. We anticipate
future annual rate increases similar to future medical trend levels for most plans. For some plans future annual rate increases may be different than future medical trends in order to increase or decrease future loss ratios to target levels over time.
4. Commission Rate – Commissions comply with your state’s requirements. For each enrollment,
commissions are paid up to $600 for the first year and up to $600 per year for renewals. Renewal commissions are paid for a minimum of five years. Additional incentives may be paid up to $250 per enrollment per year.
Replacement commissions are paid at the renewal rate.
5. Lapse Assumption – Lapse assumptions are based on historical AARP Medicare Supplement
experience. For 2016 and 2017, the assumed annual lapse rates (including death) are 7.2% and 7.5%, respectively.
6. Morbidity Assumption – Morbidity assumptions are based on historical AARP Medicare
Supplement experience and are incorporated into the trend projections and base claim costs. 7. Interest Assumption – 5.0%. 8. Pre-Funding – The plans are community rated. The rates are projected to be effective until
December 31, 2017 and reflect no pre-funding. D. Scope/Reason for Request
1. Overall increase – The overall increase is 5.0%.
2. Variations by Cell – The requested rate increases vary by plan. Refer to the enclosed Rate Schedule.
3. Effective Date - January 1, 2017.
4. Timing – These plans are rated on a calendar year basis. For 2017, we propose to defer the rate
revision until April 1, 2017, and have rates effective through December 31, 2017. E. Rates and Rating Factors
1. Current – See Rate Schedule.
2. Proposed – See Rate Schedule.
3. Period Rates Apply – Effective January 1, 2017. F. Average Annualized Premium – $1,989. See Attachment 4 for 2017 annualized premiums by plan.
6
G. Rate History – See Attachment 5. H. Average Lives – See Attachment 1. I. Historical Incurred Claims – See Attachment 1. J. Historical Earned Premium – See Attachment 1. K. Loss Ratio Projection
The target lifetime loss ratio for Standardized Medicare Supplement plans is 75.0% and was filed with the initial policy filing. 1. Definition – Loss ratios are calculated as incurred claims divided by premium. 2. Base Period – Claim cost projections are based on claim data incurred through 2015. 3. Lapse Assumption – Lapse assumptions are based on historical AARP Medicare Supplement
experience. For 2016 and 2017, the assumed annual lapse rates (including death) are 7.2% and 7.5%, respectively.
4. Claim Trend Assumption – Claim trend projections are based on historical AARP Medicare
Supplement experience and reflect changes made to the Medicare program. See Attachment 3 for projected claim trends.
5. Attained Age/Selection Adjustments – The loss ratio projections anticipate that increases in claim
costs due to aging of current insureds will be offset by continuing enrollment of younger insureds. 6. Future Rate Increases – We anticipate future annual rate increases similar to future medical trend
levels for most plans. For some plans future annual rate increases may be different than future medical trends in order to increase or decrease future loss ratios to target levels over time.
7. Interest Assumption – 5.0%. 8. With and Without Rate Change
The anticipated lifetime loss ratio with the rate change implemented on April 1, 2017 is
81.1%. Without a change to the 2016 rates, the anticipated lifetime loss ratio is 83.3%.
7
L. Loss Ratio Demonstration The anticipated lifetime and future loss ratios for these plans are shown in Attachment 1. After proposed rate actions and considering the credibility of the business, the anticipated lifetime loss ratio, future loss ratios and third year loss ratios are greater than or equal to the applicable ratio.
M. Actuarial Certification
I am a member of the Society of Actuaries and a member of the American Academy of Actuaries. I meet the Qualification Standards of Actuarial Opinion as adopted by the American Academy of Actuaries and am qualified to render this prescribed statement of actuarial opinion. I hereby certify that to the best of my knowledge and judgment, the following items are true with respect to this Medicare Supplement rate filing:
This entire filing is in compliance with your state’s applicable laws, regulations and rules.
This filing complies with all applicable Actuarial Standards of Practice as promulgated by the Actuarial Standards Board, including Actuarial Standard of Practice No. 8 “Regulatory Filings for Health Plan Entities” and Actuarial Standard of Practice No. 23 “Data Quality”.
Data provided by others were reviewed and determined to be of high quality and reliable. The assumptions within this filing present my best judgment as to the expected value for each
assumption and are consistent with UnitedHealthcare’s business plan at the time of the filing.
The filed rates maintain the proper relationship between policies which were originally filed with differing rating methodologies.
The rates determined in this filing are reasonable in relation to the benefits provided and are not excessive, inadequate or unfairly discriminatory.
The anticipated lifetime loss ratio, future loss ratios, and third-year loss ratios all meet or
exceed the applicable ratio.
______________________________ ________July 7, 2016__________ Timothy A. Koenig, ASA, MAAA Date Director, Actuarial Services UnitedHealthcare Insurance Company

July 7, 2016 Elizabeth K. Dwyer Superintendent State of Rhode Island Department of Business Regulation Division of Insurance 1511 Pontiac Avenue, Building 69-2 Cranston, Rhode Island 02920 RE: Rate Revision Filing & Modification to Early Enrollment Discounts and Base Rate Eligibility
Rates for 2010 Standardized Medicare Supplement Plans UnitedHealthcare Insurance Company NAIC #0707-79413
Dear Superintendent: The attached filing is made to obtain approval for rates effective January 1, 2017 for the 2010 Standardized Medicare Supplement Plans issued to members of AARP and demonstrate compliance with loss ratio standards. The enclosed actuarial memorandum provides supporting information. Certification regarding compliance with loss ratio standards for your state is also provided. The proposed rates include an average rate change of 5.0%. With these changes we project an anticipated lifetime loss ratio of 81.1%. The rates are proposed to be effective January 1, 2017 through December 31, 2017. For 2017, we propose to defer the implementation of the January 1, 2017 rate revision until April 1, 2017, and have the rates effective through December 31, 2017. We anticipate that the next rate revision will be effective January 1, 2018 through December 31, 2018. We are also requesting approval to modify the early enrollment discounts and the eligibility period for the base rate for new insureds beginning approximately July 1, 2017 (actual implementation date may vary from this target date depending on operational readiness). The enclosed actuarial memorandum provides details regarding these changes. We would appreciate your acting expeditiously on this request so that we can provide AARP members with adequate notice of their 2017 rates. If you need any further information regarding this matter, please contact me at (215) 902-8429. If you prefer to e-mail me, my address is [email protected]. Sincerely,
Timothy A. Koenig, ASA, MAAA Director, Actuarial Services
UnitedHealthcare Insurance Company 680 Blair Mill Road Horsham, PA 19044
Effective January 1, 2009
© 2009 National Association of Insurance Commissioners 1
Life, Accident & Health, Annuity, Credit Transmittal Document
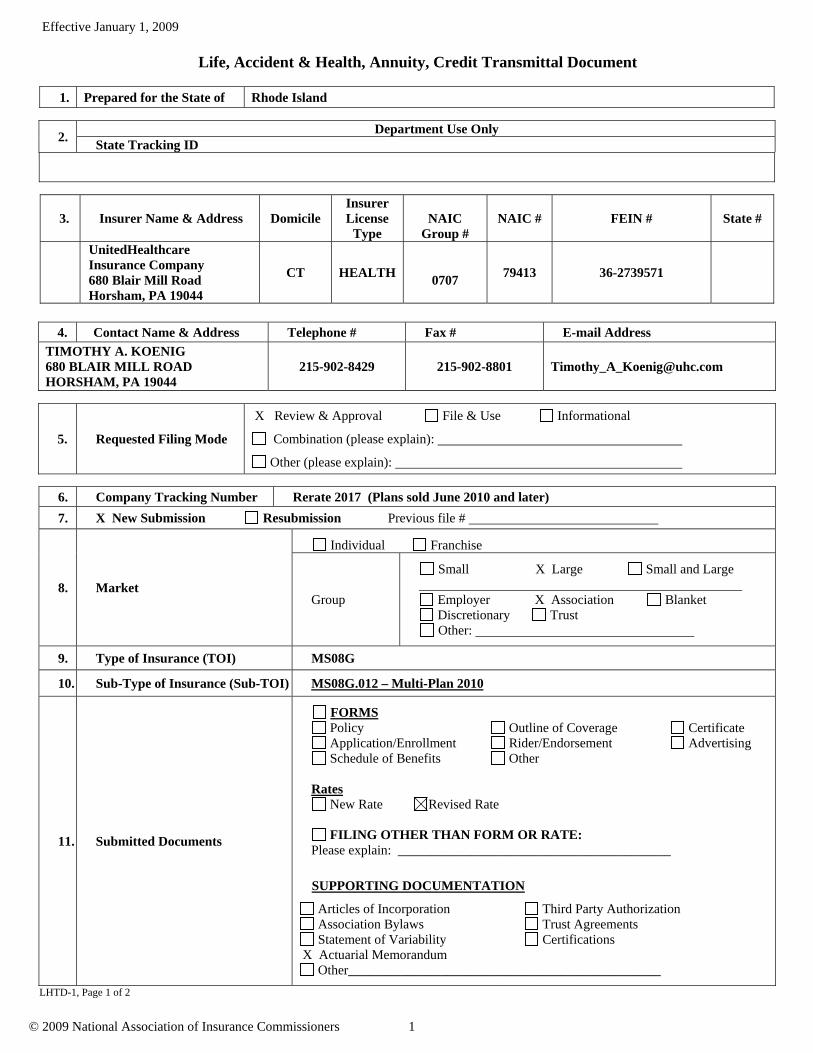
1. Prepared for the State of Rhode Island
2. Department Use Only
State Tracking ID
3. Insurer Name & Address Domicile Insurer License
Type
NAIC
Group # NAIC # FEIN # State #
UnitedHealthcare Insurance Company 680 Blair Mill Road Horsham, PA 19044
CT HEALTH
0707 79413 36-2739571
4. Contact Name & Address Telephone # Fax # E-mail Address
TIMOTHY A. KOENIG 680 BLAIR MILL ROAD HORSHAM, PA 19044
215-902-8429 215-902-8801 [email protected]
5. Requested Filing Mode
X Review & Approval File & Use Informational
Combination (please explain):
Other (please explain):
6. Company Tracking Number Rerate 2017 (Plans sold June 2010 and later)
7. X New Submission Resubmission Previous file #
8. Market
Individual Franchise
Group
Small X Large Small and Large
Employer X Association Blanket Discretionary Trust Other:
9. Type of Insurance (TOI) MS08G
10. Sub-Type of Insurance (Sub-TOI) MS08G.012 – Multi-Plan 2010
11. Submitted Documents
FORMS Policy Outline of Coverage Certificate Application/Enrollment Rider/Endorsement Advertising Schedule of Benefits Other
Rates
New Rate Revised Rate
FILING OTHER THAN FORM OR RATE: Please explain: _________________________________________
SUPPORTING DOCUMENTATION
Articles of Incorporation Third Party Authorization Association Bylaws Trust Agreements Statement of Variability Certifications
X Actuarial Memorandum Other_______________________________________________
LHTD-1, Page 1 of 2

Effective January 1, 2009
© 2009 National Association of Insurance Commissioners 2
12. Filing Submission Date July 7, 2016
13 Filing Fee (If required)
Amount $40.00 Check Date EFT
Retaliatory Yes No Check Number EFT
14. Date of Domiciliary Approval To be filed August 2016
15. Filing Description:
RATES FOR STANDARDIZED MEDICARE SUPPLEMENT PLANS
SEE ATTACHED COVER LETTER
16. Certification (If required) I HEREBY CERTIFY that I have reviewed the applicable filing requirements for this filing, and the filing complies with all applicable statutory and regulatory provisions for the state of Rhode Island .
Print Name TIMOTHY A. KOENIG Title DIRECTOR, ACTUARIAL SERVICES
Signature Date: July 7, 2016
LHTD-1, Page 2 of 2
Effective January 1, 2009
© 2009 National Association of Insurance Commissioners 3
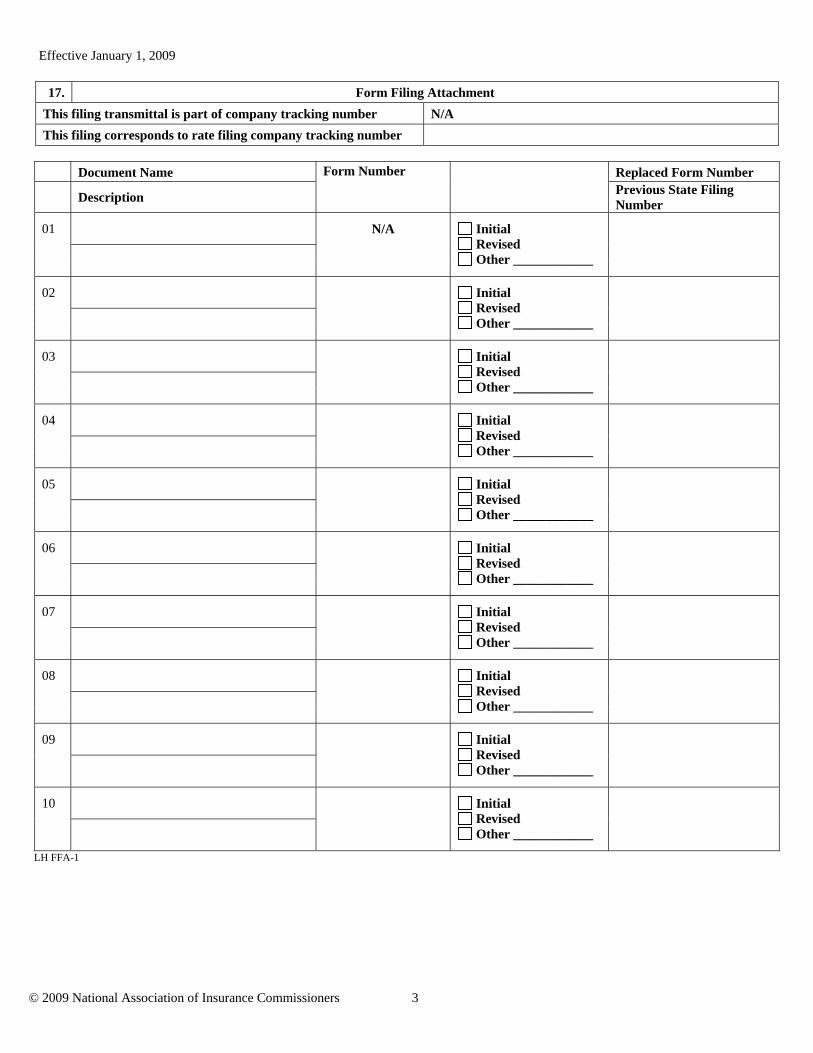
17. Form Filing Attachment
This filing transmittal is part of company tracking number N/A
This filing corresponds to rate filing company tracking number
Document Name Form Number
Replaced Form Number
Description
Previous State Filing Number
01 N/A Initial Revised Other ____________
02 Initial Revised Other ____________
03 Initial Revised Other ____________
04 Initial Revised Other ____________
05 Initial Revised Other ____________
06 Initial Revised Other ____________
07 Initial Revised Other ____________
08 Initial Revised Other ____________
09 Initial Revised Other ____________
10 Initial Revised Other ____________
LH FFA-1
Effective January 1, 2009
© 2009 National Association of Insurance Commissioners 4
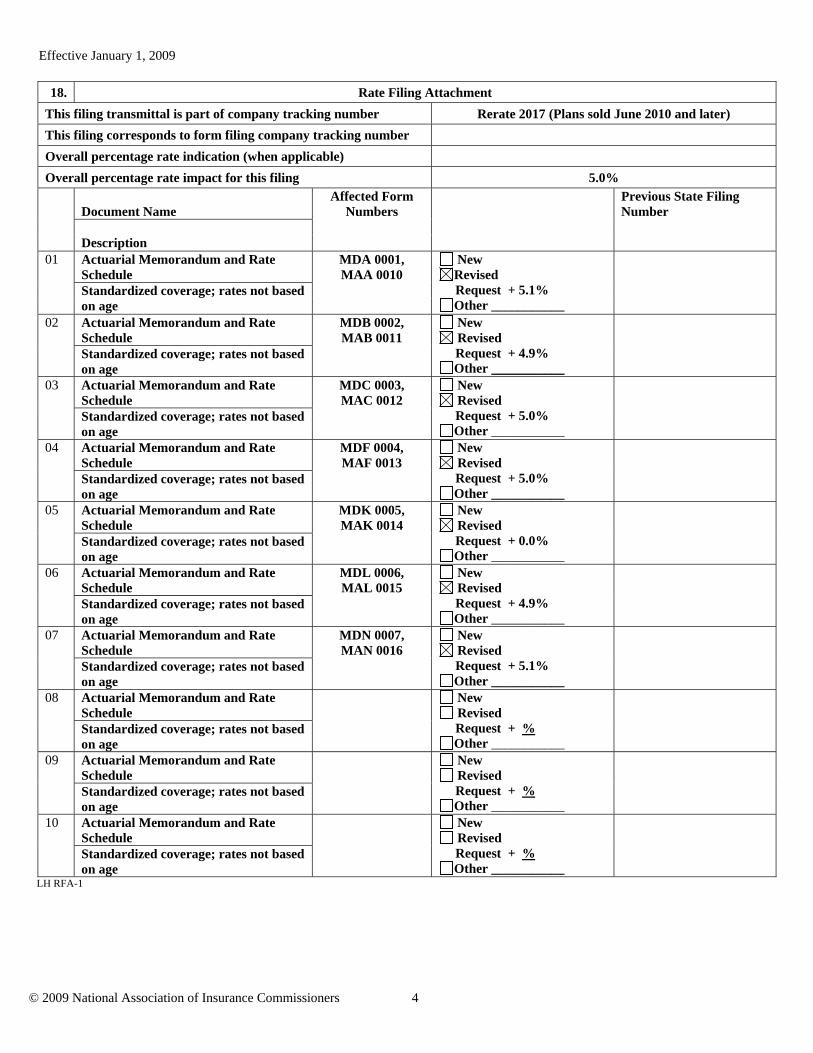
18. Rate Filing Attachment
This filing transmittal is part of company tracking number Rerate 2017 (Plans sold June 2010 and later)
This filing corresponds to form filing company tracking number
Overall percentage rate indication (when applicable)
Overall percentage rate impact for this filing 5.0%
Document Name
Affected Form Numbers
Previous State Filing Number
Description
01 Actuarial Memorandum and Rate Schedule
MDA 0001, MAA 0010
New Revised
Request + 5.1% Other ___________
Standardized coverage; rates not based on age
02 Actuarial Memorandum and Rate Schedule
MDB 0002, MAB 0011
New Revised
Request + 4.9% Other ___________
Standardized coverage; rates not based on age
03 Actuarial Memorandum and Rate Schedule
MDC 0003, MAC 0012
New Revised
Request + 5.0% Other ___________
Standardized coverage; rates not based on age
04 Actuarial Memorandum and Rate Schedule
MDF 0004, MAF 0013
New Revised
Request + 5.0% Other ___________
Standardized coverage; rates not based on age
05 Actuarial Memorandum and Rate Schedule
MDK 0005, MAK 0014
New Revised
Request + 0.0% Other ___________
Standardized coverage; rates not based on age
06 Actuarial Memorandum and Rate Schedule
MDL 0006, MAL 0015
New Revised
Request + 4.9% Other ___________
Standardized coverage; rates not based on age
07 Actuarial Memorandum and Rate Schedule
MDN 0007, MAN 0016
New Revised
Request + 5.1% Other ___________
Standardized coverage; rates not based on age
08 Actuarial Memorandum and Rate Schedule
New Revised
Request + % Other ___________
Standardized coverage; rates not based on age
09
Actuarial Memorandum and Rate Schedule
New Revised
Request + % Other ___________
Standardized coverage; rates not based on age
10
Actuarial Memorandum and Rate Schedule
New Revised
Request + % Other ___________
Standardized coverage; rates not based on age
LH RFA-1
July 2016
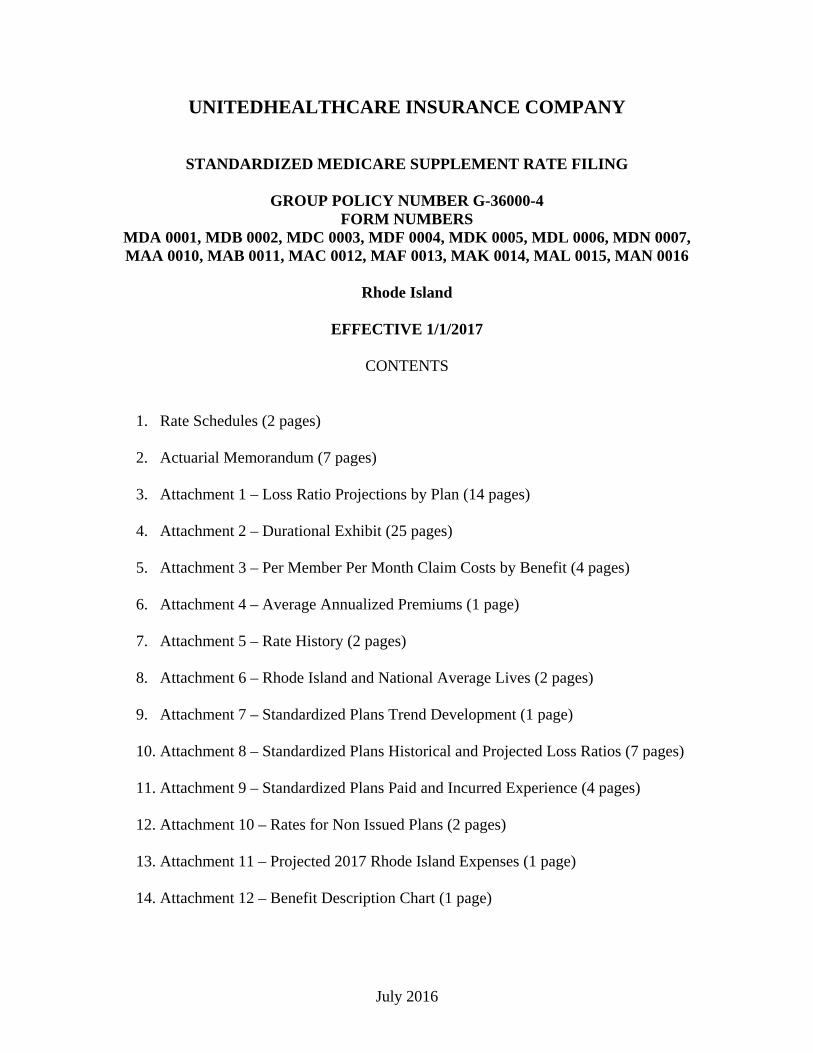
UNITEDHEALTHCARE INSURANCE COMPANY
STANDARDIZED MEDICARE SUPPLEMENT RATE FILING
GROUP POLICY NUMBER G-36000-4 FORM NUMBERS
MDA 0001, MDB 0002, MDC 0003, MDF 0004, MDK 0005, MDL 0006, MDN 0007, MAA 0010, MAB 0011, MAC 0012, MAF 0013, MAK 0014, MAL 0015, MAN 0016
Rhode Island
EFFECTIVE 1/1/2017
CONTENTS
1. Rate Schedules (2 pages) 2. Actuarial Memorandum (7 pages)
3. Attachment 1 – Loss Ratio Projections by Plan (14 pages)
4. Attachment 2 – Durational Exhibit (25 pages)
5. Attachment 3 – Per Member Per Month Claim Costs by Benefit (4 pages)
6. Attachment 4 – Average Annualized Premiums (1 page)
7. Attachment 5 – Rate History (2 pages)
8. Attachment 6 – Rhode Island and National Average Lives (2 pages)
9. Attachment 7 – Standardized Plans Trend Development (1 page)
10. Attachment 8 – Standardized Plans Historical and Projected Loss Ratios (7 pages)
11. Attachment 9 – Standardized Plans Paid and Incurred Experience (4 pages)
12. Attachment 10 – Rates for Non Issued Plans (2 pages)
13. Attachment 11 – Projected 2017 Rhode Island Expenses (1 page)
14. Attachment 12 – Benefit Description Chart (1 page)

Attachment 1 (Page 1 of 14)
RHODE ISLAND - LOSS RATIO PROJECTIONS - 1990 and 2010 PLANS COMBINED
Company: UnitedHealthcare Insurance CompanyPolicy Form: G-36000-4 Plan A
PLAN AHISTORICAL EXPERIENCE
Incurred Loss AveragePremium Claims Ratio Lives
1998 $87,049 $58,697 67.4% 1191999 $73,980 $60,170 81.3% 842000 $84,505 $55,603 65.8% 922001 $92,580 $80,274 86.7% 992002 $85,816 $81,641 95.1% 912003 $95,490 $76,406 80.0% 972004 $110,938 $70,139 63.2% 1012005 $107,727 $57,716 53.6% 952006 $127,425 $69,707 54.7% 1062007 $137,298 $107,497 78.3% 1152008 $132,618 $86,681 65.4% 1132009 $150,385 $101,936 67.8% 1282010 $157,347 $135,383 86.0% 1332011 $162,191 $153,343 94.5% 1392012 $162,467 $158,242 97.4% 1382013 $157,634 $150,546 95.5% 1272014 $162,095 $125,797 77.6% 1262015 $169,487 $126,042 74.4% 1262016 $167,318 $135,768 81.1% 123
Total Historical $2,424,350 $1,891,589 78.0% n/aWith Interest* $3,729,222 $2,869,343 76.9% n/a
FUTURE EXPERIENCE - WITH 2017 RATE CHANGEIncurred Loss Average
Premium Claims Ratio Lives2017 $171,437 $133,708 78.0% 1202018 $185,463 $142,865 77.0% 1212019 $198,163 $152,648 77.0% 1222020 $211,733 $163,101 77.0% 1232021 $226,233 $174,271 77.0% 1242022 $241,725 $186,205 77.0% 1252023 $258,279 $198,956 77.0% 1262024 $275,965 $212,580 77.0% 1272025 $294,864 $227,138 77.0% 1282026 $315,056 $242,692 77.0% 129
Total Future $2,378,918 $1,834,164 77.1% n/aDiscounted with Interest* $1,832,496 $1,413,208 77.1% n/a
LIFETIME EXPERIENCE* - WITHOUT 2017 RATE CHANGEIncurred Loss Average
Premium Claims Ratio LivesTotal Historical $3,729,222 $2,869,343 76.9% n/a
Total Future $1,745,074 $1,413,208 81.0% n/aTotal Lifetime $5,474,296 $4,282,551 78.2% n/a
LIFETIME EXPERIENCE* - WITH 2017 RATE CHANGEIncurred Loss Average
Premium Claims Ratio LivesTotal Historical $3,729,222 $2,869,343 76.9% n/a
Total Future $1,832,496 $1,413,208 77.1% n/aTotal Lifetime $5,561,718 $4,282,551 77.0% n/a
*Accumulated at 5% interest rate
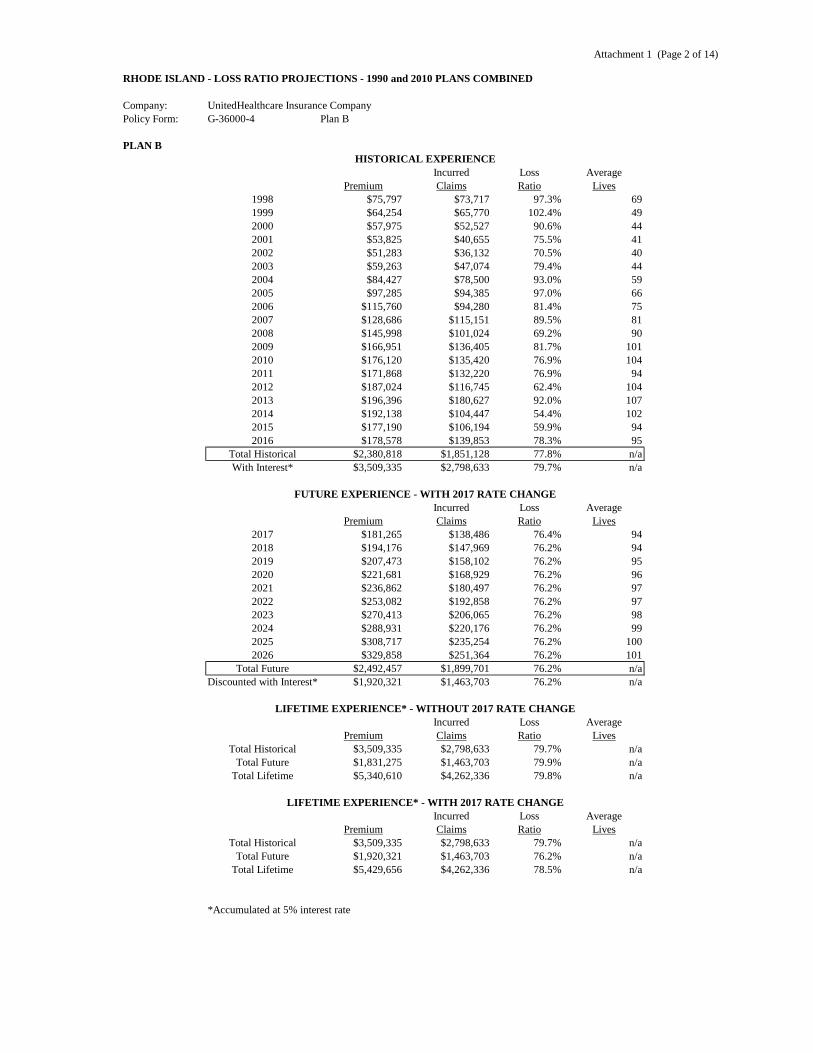
Attachment 1 (Page 2 of 14)
RHODE ISLAND - LOSS RATIO PROJECTIONS - 1990 and 2010 PLANS COMBINED
Company: UnitedHealthcare Insurance CompanyPolicy Form: G-36000-4 Plan B
PLAN BHISTORICAL EXPERIENCE
Incurred Loss AveragePremium Claims Ratio Lives
1998 $75,797 $73,717 97.3% 691999 $64,254 $65,770 102.4% 492000 $57,975 $52,527 90.6% 442001 $53,825 $40,655 75.5% 412002 $51,283 $36,132 70.5% 402003 $59,263 $47,074 79.4% 442004 $84,427 $78,500 93.0% 592005 $97,285 $94,385 97.0% 662006 $115,760 $94,280 81.4% 752007 $128,686 $115,151 89.5% 812008 $145,998 $101,024 69.2% 902009 $166,951 $136,405 81.7% 1012010 $176,120 $135,420 76.9% 1042011 $171,868 $132,220 76.9% 942012 $187,024 $116,745 62.4% 1042013 $196,396 $180,627 92.0% 1072014 $192,138 $104,447 54.4% 1022015 $177,190 $106,194 59.9% 942016 $178,578 $139,853 78.3% 95
Total Historical $2,380,818 $1,851,128 77.8% n/aWith Interest* $3,509,335 $2,798,633 79.7% n/a
FUTURE EXPERIENCE - WITH 2017 RATE CHANGEIncurred Loss Average
Premium Claims Ratio Lives2017 $181,265 $138,486 76.4% 942018 $194,176 $147,969 76.2% 942019 $207,473 $158,102 76.2% 952020 $221,681 $168,929 76.2% 962021 $236,862 $180,497 76.2% 972022 $253,082 $192,858 76.2% 972023 $270,413 $206,065 76.2% 982024 $288,931 $220,176 76.2% 992025 $308,717 $235,254 76.2% 1002026 $329,858 $251,364 76.2% 101
Total Future $2,492,457 $1,899,701 76.2% n/aDiscounted with Interest* $1,920,321 $1,463,703 76.2% n/a
LIFETIME EXPERIENCE* - WITHOUT 2017 RATE CHANGEIncurred Loss Average
Premium Claims Ratio LivesTotal Historical $3,509,335 $2,798,633 79.7% n/a
Total Future $1,831,275 $1,463,703 79.9% n/aTotal Lifetime $5,340,610 $4,262,336 79.8% n/a
LIFETIME EXPERIENCE* - WITH 2017 RATE CHANGEIncurred Loss Average
Premium Claims Ratio LivesTotal Historical $3,509,335 $2,798,633 79.7% n/a
Total Future $1,920,321 $1,463,703 76.2% n/aTotal Lifetime $5,429,656 $4,262,336 78.5% n/a
*Accumulated at 5% interest rate

Attachment 1 (Page 3 of 14)
RHODE ISLAND - LOSS RATIO PROJECTIONS - 1990 and 2010 PLANS COMBINED
Company: UnitedHealthcare Insurance CompanyPolicy Form: G-36000-4 Plan C
PLAN CHISTORICAL EXPERIENCE
Incurred Loss AveragePremium Claims Ratio Lives
1998 $1,406,557 $1,159,394 82.4% 1,1201999 $1,297,098 $994,276 76.7% 9432000 $1,497,399 $1,253,679 83.7% 1,0702001 $1,677,138 $1,430,682 85.3% 1,1692002 $1,718,027 $1,605,640 93.5% 1,1952003 $1,958,418 $1,686,022 86.1% 1,2842004 $2,131,173 $1,700,949 79.8% 1,3152005 $2,190,847 $1,824,409 83.3% 1,3152006 $2,382,490 $2,206,000 92.6% 1,3742007 $2,527,368 $2,095,266 82.9% 1,3992008 $2,621,759 $2,264,045 86.4% 1,4072009 $2,683,824 $2,291,140 85.4% 1,4292010 $2,866,048 $2,490,937 86.9% 1,4722011 $2,993,383 $2,434,274 81.3% 1,4432012 $2,967,608 $2,488,531 83.9% 1,4112013 $3,016,350 $2,328,046 77.2% 1,3682014 $3,081,370 $2,552,758 82.8% 1,3212015 $3,116,074 $2,433,299 78.1% 1,3172016 $2,932,765 $2,354,363 80.3% 1,257
Total Historical $45,065,695 $37,593,707 83.4% n/aWith Interest* $69,264,943 $58,012,605 83.8% n/a
FUTURE EXPERIENCE - WITH 2017 RATE CHANGEIncurred Loss Average
Premium Claims Ratio Lives2017 $2,922,002 $2,313,265 79.2% 1,2092018 $3,161,103 $2,471,677 78.2% 1,2192019 $3,377,575 $2,640,937 78.2% 1,2292020 $3,608,872 $2,821,789 78.2% 1,2392021 $3,856,007 $3,015,025 78.2% 1,2492022 $4,120,067 $3,221,494 78.2% 1,2592023 $4,402,209 $3,442,102 78.2% 1,2692024 $4,703,672 $3,677,817 78.2% 1,2792025 $5,025,780 $3,929,674 78.2% 1,2892026 $5,369,945 $4,198,778 78.2% 1,299
Total Future $40,547,232 $31,732,555 78.3% n/aDiscounted with Interest* $31,233,790 $24,449,656 78.3% n/a
LIFETIME EXPERIENCE* - WITHOUT 2017 RATE CHANGEIncurred Loss Average
Premium Claims Ratio LivesTotal Historical $69,264,943 $58,012,605 83.8% n/a
Total Future $29,750,182 $24,449,656 82.2% n/aTotal Lifetime $99,015,125 $82,462,262 83.3% n/a
LIFETIME EXPERIENCE* - WITH 2017 RATE CHANGEIncurred Loss Average
Premium Claims Ratio LivesTotal Historical $69,264,943 $58,012,605 83.8% n/a
Total Future $31,233,790 $24,449,656 78.3% n/aTotal Lifetime $100,498,733 $82,462,262 82.1% n/a
*Accumulated at 5% interest rate

Attachment 1 (Page 4 of 14)
RHODE ISLAND - LOSS RATIO PROJECTIONS - 1990 PLAN ONLY
Company: UnitedHealthcare Insurance CompanyPolicy Form: G-36000-4 Plan D
PLAN DHISTORICAL EXPERIENCE
Incurred Loss AveragePremium Claims Ratio Lives
1998 $63,294 $43,853 69.3% 581999 $66,628 $43,299 65.0% 512000 $78,706 $74,032 94.1% 602001 $81,144 $55,059 67.9% 602002 $73,152 $49,209 67.3% 542003 $82,435 $59,414 72.1% 562004 $88,511 $69,160 78.1% 572005 $91,957 $84,911 92.3% 572006 $94,341 $67,981 72.1% 562007 $97,357 $104,608 107.4% 562008 $104,664 $95,583 91.3% 592009 $119,947 $138,156 115.2% 672010 $132,906 $172,637 129.9% 712011 $129,977 $132,731 102.1% 632012 $107,163 $97,247 90.7% 512013 $90,042 $113,642 126.2% 412014 $86,110 $100,654 116.9% 382015 $74,150 $96,942 130.7% 322016 $69,336 $55,154 79.5% 31
Total Historical $1,731,822 $1,654,273 95.5% n/aWith Interest* $2,777,724 $2,548,211 91.7% n/a
FUTURE EXPERIENCE - WITH 2017 RATE CHANGEIncurred Loss Average
Premium Claims Ratio Lives2017 $64,515 $50,259 77.9% 282018 $62,337 $47,947 76.9% 252019 $59,469 $45,742 76.9% 232020 $56,734 $43,638 76.9% 202021 $54,124 $41,630 76.9% 182022 $51,634 $39,715 76.9% 172023 $49,259 $37,888 76.9% 152024 $46,993 $36,146 76.9% 132025 $44,832 $34,483 76.9% 122026 $42,769 $32,897 76.9% 11
Total Future $532,666 $410,345 77.0% n/aDiscounted with Interest* $429,284 $330,812 77.1% n/a
LIFETIME EXPERIENCE* - WITHOUT 2017 RATE CHANGEIncurred Loss Average
Premium Claims Ratio LivesTotal Historical $2,777,724 $2,548,211 91.7% n/a
Total Future $409,058 $330,812 80.9% n/aTotal Lifetime $3,186,783 $2,879,023 90.3% n/a
LIFETIME EXPERIENCE* - WITH 2017 RATE CHANGEIncurred Loss Average
Premium Claims Ratio LivesTotal Historical $2,777,724 $2,548,211 91.7% n/a
Total Future $429,284 $330,812 77.1% n/aTotal Lifetime $3,207,008 $2,879,023 89.8% n/a
*Accumulated at 5% interest rate

Attachment 1 (Page 5 of 14)
RHODE ISLAND - LOSS RATIO PROJECTIONS - 1990 PLAN ONLY
Company: UnitedHealthcare Insurance CompanyPolicy Form: G-36000-4 Plan E
PLAN EHISTORICAL EXPERIENCE
Incurred Loss AveragePremium Claims Ratio Lives
1998 $152,240 $139,773 91.8% 1491999 $175,537 $136,937 78.0% 1442000 $172,433 $122,294 70.9% 1302001 $165,790 $116,184 70.1% 1232002 $144,016 $99,693 69.2% 1072003 $160,650 $165,589 103.1% 1122004 $168,807 $151,740 89.9% 1112005 $153,136 $168,465 110.0% 982006 $154,153 $123,099 79.9% 952007 $154,920 $120,005 77.5% 922008 $149,024 $147,626 99.1% 852009 $153,197 $110,457 72.1% 852010 $167,784 $108,451 64.6% 902011 $162,164 $126,001 77.7% 822012 $143,855 $156,350 108.7% 722013 $138,661 $117,410 84.7% 662014 $130,008 $104,613 80.5% 592015 $119,586 $97,757 81.7% 542016 $112,554 $89,461 79.5% 51
Total Historical $2,878,515 $2,401,905 83.4% n/aWith Interest* $4,835,264 $4,025,785 83.3% n/a
FUTURE EXPERIENCE - WITH 2017 RATE CHANGEIncurred Loss Average
Premium Claims Ratio Lives2017 $108,850 $84,297 77.4% 472018 $105,149 $80,419 76.5% 422019 $100,312 $76,720 76.5% 382020 $95,698 $73,191 76.5% 342021 $91,296 $69,824 76.5% 312022 $87,096 $66,612 76.5% 282023 $83,090 $63,548 76.5% 252024 $79,268 $60,625 76.5% 232025 $75,621 $57,836 76.5% 202026 $72,143 $55,176 76.5% 18
Total Future $898,521 $688,248 76.6% n/aDiscounted with Interest* $724,137 $554,852 76.6% n/a
LIFETIME EXPERIENCE* - WITHOUT 2017 RATE CHANGEIncurred Loss Average
Premium Claims Ratio LivesTotal Historical $4,835,264 $4,025,785 83.3% n/a
Total Future $690,171 $554,852 80.4% n/aTotal Lifetime $5,525,435 $4,580,637 82.9% n/a
LIFETIME EXPERIENCE* - WITH 2017 RATE CHANGEIncurred Loss Average
Premium Claims Ratio LivesTotal Historical $4,835,264 $4,025,785 83.3% n/a
Total Future $724,137 $554,852 76.6% n/aTotal Lifetime $5,559,401 $4,580,637 82.4% n/a
*Accumulated at 5% interest rate

Attachment 1 (Page 6 of 14)
RHODE ISLAND - LOSS RATIO PROJECTIONS - 1990 and 2010 PLANS COMBINED
Company: UnitedHealthcare Insurance CompanyPolicy Form: G-36000-4 Plan F
PLAN FHISTORICAL EXPERIENCE
Incurred Loss AveragePremium Claims Ratio Lives
1998 $1,288,551 $1,048,384 81.4% 9811999 $1,270,601 $918,928 72.3% 8522000 $1,302,249 $1,089,983 83.7% 8752001 $1,350,987 $1,124,758 83.3% 9092002 $1,390,312 $1,120,395 80.6% 9362003 $1,561,365 $1,334,266 85.5% 1,0192004 $1,803,165 $1,514,924 84.0% 1,1222005 $2,023,135 $1,641,702 81.1% 1,2342006 $2,456,173 $1,967,027 80.1% 1,4502007 $3,002,169 $2,404,715 80.1% 1,7082008 $3,505,543 $2,888,148 82.4% 1,9532009 $4,089,675 $3,404,000 83.2% 2,2842010 $4,943,243 $4,186,409 84.7% 2,6762011 $6,470,393 $5,442,764 84.1% 3,3782012 $7,937,978 $6,427,209 81.0% 4,1932013 $9,756,488 $7,880,029 80.8% 4,9802014 $13,595,229 $11,203,741 82.4% 6,5472015 $21,150,230 $17,251,177 81.6% 9,9132016 $23,484,799 $19,486,557 83.0% 11,005
Total Historical $112,382,284 $92,335,116 82.2% n/aWith Interest* $143,619,978 $117,885,596 82.1% n/a
FUTURE EXPERIENCE - WITH 2017 RATE CHANGEIncurred Loss Average
Premium Claims Ratio Lives2017 $26,174,266 $21,538,366 82.3% 11,8782018 $28,298,664 $23,013,313 81.3% 11,9732019 $30,236,556 $24,589,265 81.3% 12,0692020 $32,307,156 $26,273,138 81.3% 12,1652021 $34,519,550 $28,072,322 81.3% 12,2622022 $36,883,449 $29,994,715 81.3% 12,3612023 $39,409,227 $32,048,753 81.3% 12,4592024 $42,107,971 $34,243,452 81.3% 12,5592025 $44,991,525 $36,588,443 81.3% 12,6602026 $48,072,544 $39,094,020 81.3% 12,761
Total Future $363,000,907 $295,455,787 81.4% n/aDiscounted with Interest* $279,625,205 $227,646,102 81.4% n/a
LIFETIME EXPERIENCE* - WITHOUT 2017 RATE CHANGEIncurred Loss Average
Premium Claims Ratio LivesTotal Historical $143,619,978 $117,885,596 82.1% n/a
Total Future $266,566,726 $227,646,102 85.4% n/aTotal Lifetime $410,186,704 $345,531,698 84.2% n/a
LIFETIME EXPERIENCE* - WITH 2017 RATE CHANGEIncurred Loss Average
Premium Claims Ratio LivesTotal Historical $143,619,978 $117,885,596 82.1% n/a
Total Future $279,625,205 $227,646,102 81.4% n/aTotal Lifetime $423,245,183 $345,531,698 81.6% n/a
*Accumulated at 5% interest rate

Attachment 1 (Page 7 of 14)
RHODE ISLAND - LOSS RATIO PROJECTIONS - 1990 PLAN ONLY
Company: UnitedHealthcare Insurance CompanyPolicy Form: G-36000-4 Plan G
PLAN GHISTORICAL EXPERIENCE
Incurred Loss AveragePremium Claims Ratio Lives
1998 $87,467 $64,763 74.0% 771999 $98,950 $61,081 61.7% 722000 $98,608 $71,538 72.5% 712001 $109,848 $78,179 71.2% 782002 $120,094 $146,985 122.4% 842003 $131,916 $112,286 85.1% 902004 $158,783 $143,182 90.2% 1032005 $162,223 $113,561 70.0% 1032006 $186,866 $144,052 77.1% 1162007 $177,571 $139,875 78.8% 1062008 $176,310 $126,647 71.8% 1012009 $171,559 $156,745 91.4% 972010 $177,907 $121,290 68.2% 972011 $168,304 $111,503 66.3% 852012 $164,612 $193,224 117.4% 822013 $162,832 $131,780 80.9% 772014 $154,677 $118,094 76.3% 702015 $149,247 $144,226 96.6% 662016 $137,859 $109,094 79.1% 62
Total Historical $2,795,631 $2,288,106 81.8% n/aWith Interest* $4,425,338 $3,597,670 81.3% n/a
FUTURE EXPERIENCE - WITH 2017 RATE CHANGEIncurred Loss Average
Premium Claims Ratio Lives2017 $135,934 $104,997 77.2% 592018 $131,301 $100,167 76.3% 532019 $125,261 $95,559 76.3% 482020 $119,499 $91,163 76.3% 432021 $114,002 $86,970 76.3% 382022 $108,758 $82,969 76.3% 352023 $103,755 $79,153 76.3% 312024 $98,982 $75,512 76.3% 282025 $94,429 $72,038 76.3% 252026 $90,085 $68,724 76.3% 23
Total Future $1,122,005 $857,252 76.4% n/aDiscounted with Interest* $904,250 $691,099 76.4% n/a
LIFETIME EXPERIENCE* - WITHOUT 2017 RATE CHANGEIncurred Loss Average
Premium Claims Ratio LivesTotal Historical $4,425,338 $3,597,670 81.3% n/a
Total Future $861,989 $691,099 80.2% n/aTotal Lifetime $5,287,326 $4,288,769 81.1% n/a
LIFETIME EXPERIENCE* - WITH 2017 RATE CHANGEIncurred Loss Average
Premium Claims Ratio LivesTotal Historical $4,425,338 $3,597,670 81.3% n/a
Total Future $904,250 $691,099 76.4% n/aTotal Lifetime $5,329,588 $4,288,769 80.5% n/a
*Accumulated at 5% interest rate
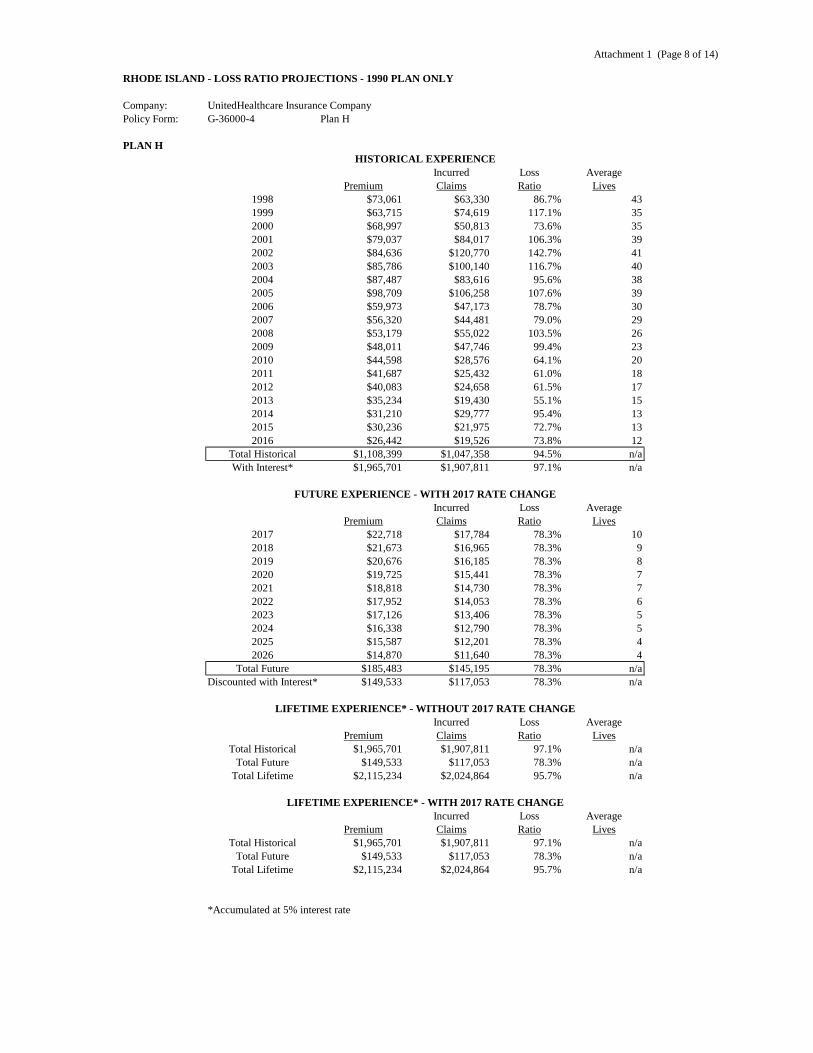
Attachment 1 (Page 8 of 14)
RHODE ISLAND - LOSS RATIO PROJECTIONS - 1990 PLAN ONLY
Company: UnitedHealthcare Insurance CompanyPolicy Form: G-36000-4 Plan H
PLAN HHISTORICAL EXPERIENCE
Incurred Loss AveragePremium Claims Ratio Lives
1998 $73,061 $63,330 86.7% 431999 $63,715 $74,619 117.1% 352000 $68,997 $50,813 73.6% 352001 $79,037 $84,017 106.3% 392002 $84,636 $120,770 142.7% 412003 $85,786 $100,140 116.7% 402004 $87,487 $83,616 95.6% 382005 $98,709 $106,258 107.6% 392006 $59,973 $47,173 78.7% 302007 $56,320 $44,481 79.0% 292008 $53,179 $55,022 103.5% 262009 $48,011 $47,746 99.4% 232010 $44,598 $28,576 64.1% 202011 $41,687 $25,432 61.0% 182012 $40,083 $24,658 61.5% 172013 $35,234 $19,430 55.1% 152014 $31,210 $29,777 95.4% 132015 $30,236 $21,975 72.7% 132016 $26,442 $19,526 73.8% 12
Total Historical $1,108,399 $1,047,358 94.5% n/aWith Interest* $1,965,701 $1,907,811 97.1% n/a
FUTURE EXPERIENCE - WITH 2017 RATE CHANGEIncurred Loss Average
Premium Claims Ratio Lives2017 $22,718 $17,784 78.3% 102018 $21,673 $16,965 78.3% 92019 $20,676 $16,185 78.3% 82020 $19,725 $15,441 78.3% 72021 $18,818 $14,730 78.3% 72022 $17,952 $14,053 78.3% 62023 $17,126 $13,406 78.3% 52024 $16,338 $12,790 78.3% 52025 $15,587 $12,201 78.3% 42026 $14,870 $11,640 78.3% 4
Total Future $185,483 $145,195 78.3% n/aDiscounted with Interest* $149,533 $117,053 78.3% n/a
LIFETIME EXPERIENCE* - WITHOUT 2017 RATE CHANGEIncurred Loss Average
Premium Claims Ratio LivesTotal Historical $1,965,701 $1,907,811 97.1% n/a
Total Future $149,533 $117,053 78.3% n/aTotal Lifetime $2,115,234 $2,024,864 95.7% n/a
LIFETIME EXPERIENCE* - WITH 2017 RATE CHANGEIncurred Loss Average
Premium Claims Ratio LivesTotal Historical $1,965,701 $1,907,811 97.1% n/a
Total Future $149,533 $117,053 78.3% n/aTotal Lifetime $2,115,234 $2,024,864 95.7% n/a
*Accumulated at 5% interest rate
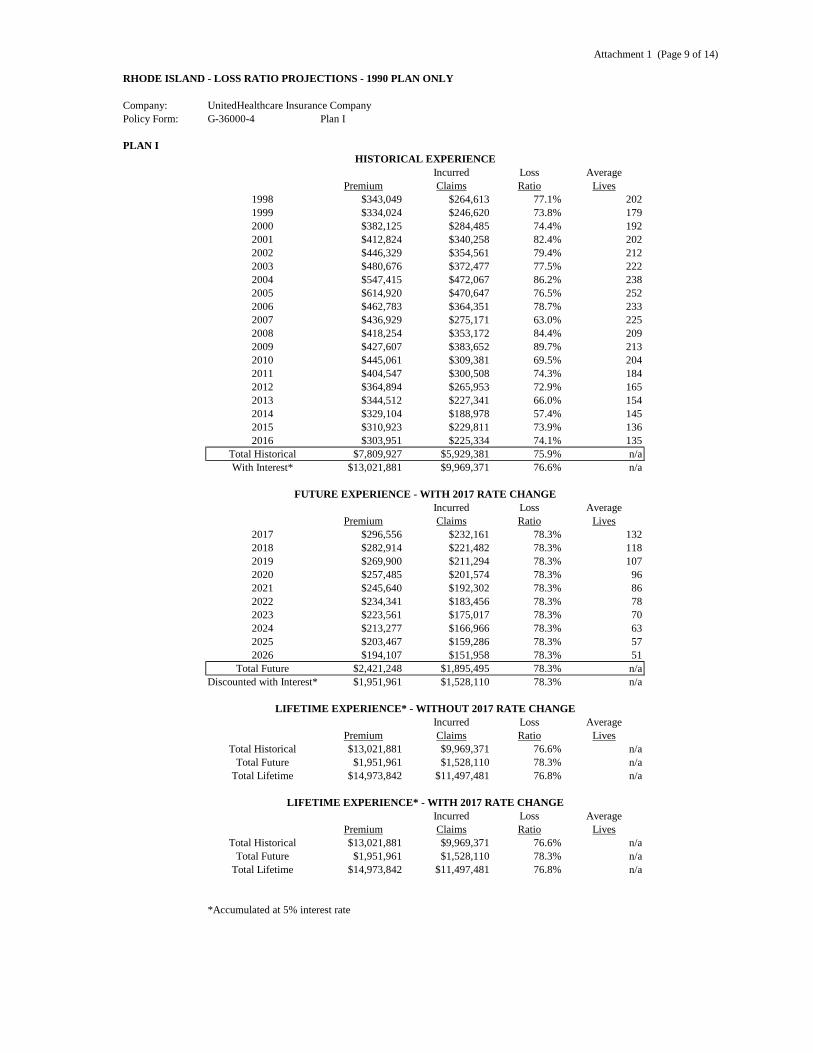
Attachment 1 (Page 9 of 14)
RHODE ISLAND - LOSS RATIO PROJECTIONS - 1990 PLAN ONLY
Company: UnitedHealthcare Insurance CompanyPolicy Form: G-36000-4 Plan I
PLAN IHISTORICAL EXPERIENCE
Incurred Loss AveragePremium Claims Ratio Lives
1998 $343,049 $264,613 77.1% 2021999 $334,024 $246,620 73.8% 1792000 $382,125 $284,485 74.4% 1922001 $412,824 $340,258 82.4% 2022002 $446,329 $354,561 79.4% 2122003 $480,676 $372,477 77.5% 2222004 $547,415 $472,067 86.2% 2382005 $614,920 $470,647 76.5% 2522006 $462,783 $364,351 78.7% 2332007 $436,929 $275,171 63.0% 2252008 $418,254 $353,172 84.4% 2092009 $427,607 $383,652 89.7% 2132010 $445,061 $309,381 69.5% 2042011 $404,547 $300,508 74.3% 1842012 $364,894 $265,953 72.9% 1652013 $344,512 $227,341 66.0% 1542014 $329,104 $188,978 57.4% 1452015 $310,923 $229,811 73.9% 1362016 $303,951 $225,334 74.1% 135
Total Historical $7,809,927 $5,929,381 75.9% n/aWith Interest* $13,021,881 $9,969,371 76.6% n/a
FUTURE EXPERIENCE - WITH 2017 RATE CHANGEIncurred Loss Average
Premium Claims Ratio Lives2017 $296,556 $232,161 78.3% 1322018 $282,914 $221,482 78.3% 1182019 $269,900 $211,294 78.3% 1072020 $257,485 $201,574 78.3% 962021 $245,640 $192,302 78.3% 862022 $234,341 $183,456 78.3% 782023 $223,561 $175,017 78.3% 702024 $213,277 $166,966 78.3% 632025 $203,467 $159,286 78.3% 572026 $194,107 $151,958 78.3% 51
Total Future $2,421,248 $1,895,495 78.3% n/aDiscounted with Interest* $1,951,961 $1,528,110 78.3% n/a
LIFETIME EXPERIENCE* - WITHOUT 2017 RATE CHANGEIncurred Loss Average
Premium Claims Ratio LivesTotal Historical $13,021,881 $9,969,371 76.6% n/a
Total Future $1,951,961 $1,528,110 78.3% n/aTotal Lifetime $14,973,842 $11,497,481 76.8% n/a
LIFETIME EXPERIENCE* - WITH 2017 RATE CHANGEIncurred Loss Average
Premium Claims Ratio LivesTotal Historical $13,021,881 $9,969,371 76.6% n/a
Total Future $1,951,961 $1,528,110 78.3% n/aTotal Lifetime $14,973,842 $11,497,481 76.8% n/a
*Accumulated at 5% interest rate
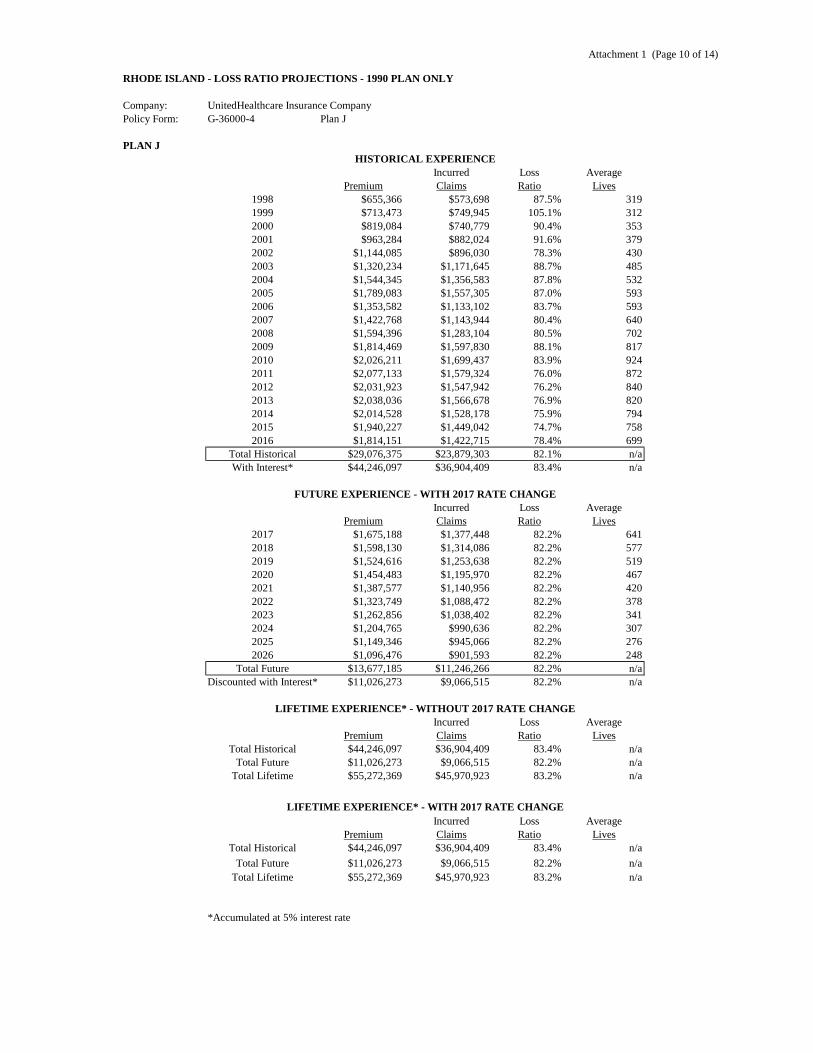
Attachment 1 (Page 10 of 14)
RHODE ISLAND - LOSS RATIO PROJECTIONS - 1990 PLAN ONLY
Company: UnitedHealthcare Insurance CompanyPolicy Form: G-36000-4 Plan J
PLAN JHISTORICAL EXPERIENCE
Incurred Loss AveragePremium Claims Ratio Lives
1998 $655,366 $573,698 87.5% 3191999 $713,473 $749,945 105.1% 3122000 $819,084 $740,779 90.4% 3532001 $963,284 $882,024 91.6% 3792002 $1,144,085 $896,030 78.3% 4302003 $1,320,234 $1,171,645 88.7% 4852004 $1,544,345 $1,356,583 87.8% 5322005 $1,789,083 $1,557,305 87.0% 5932006 $1,353,582 $1,133,102 83.7% 5932007 $1,422,768 $1,143,944 80.4% 6402008 $1,594,396 $1,283,104 80.5% 7022009 $1,814,469 $1,597,830 88.1% 8172010 $2,026,211 $1,699,437 83.9% 9242011 $2,077,133 $1,579,324 76.0% 8722012 $2,031,923 $1,547,942 76.2% 8402013 $2,038,036 $1,566,678 76.9% 8202014 $2,014,528 $1,528,178 75.9% 7942015 $1,940,227 $1,449,042 74.7% 7582016 $1,814,151 $1,422,715 78.4% 699
Total Historical $29,076,375 $23,879,303 82.1% n/aWith Interest* $44,246,097 $36,904,409 83.4% n/a
FUTURE EXPERIENCE - WITH 2017 RATE CHANGEIncurred Loss Average
Premium Claims Ratio Lives2017 $1,675,188 $1,377,448 82.2% 6412018 $1,598,130 $1,314,086 82.2% 5772019 $1,524,616 $1,253,638 82.2% 5192020 $1,454,483 $1,195,970 82.2% 4672021 $1,387,577 $1,140,956 82.2% 4202022 $1,323,749 $1,088,472 82.2% 3782023 $1,262,856 $1,038,402 82.2% 3412024 $1,204,765 $990,636 82.2% 3072025 $1,149,346 $945,066 82.2% 2762026 $1,096,476 $901,593 82.2% 248
Total Future $13,677,185 $11,246,266 82.2% n/aDiscounted with Interest* $11,026,273 $9,066,515 82.2% n/a
LIFETIME EXPERIENCE* - WITHOUT 2017 RATE CHANGEIncurred Loss Average
Premium Claims Ratio LivesTotal Historical $44,246,097 $36,904,409 83.4% n/a
Total Future $11,026,273 $9,066,515 82.2% n/aTotal Lifetime $55,272,369 $45,970,923 83.2% n/a
LIFETIME EXPERIENCE* - WITH 2017 RATE CHANGEIncurred Loss Average
Premium Claims Ratio LivesTotal Historical $44,246,097 $36,904,409 83.4% n/a
Total Future $11,026,273 $9,066,515 82.2% n/aTotal Lifetime $55,272,369 $45,970,923 83.2% n/a
*Accumulated at 5% interest rate
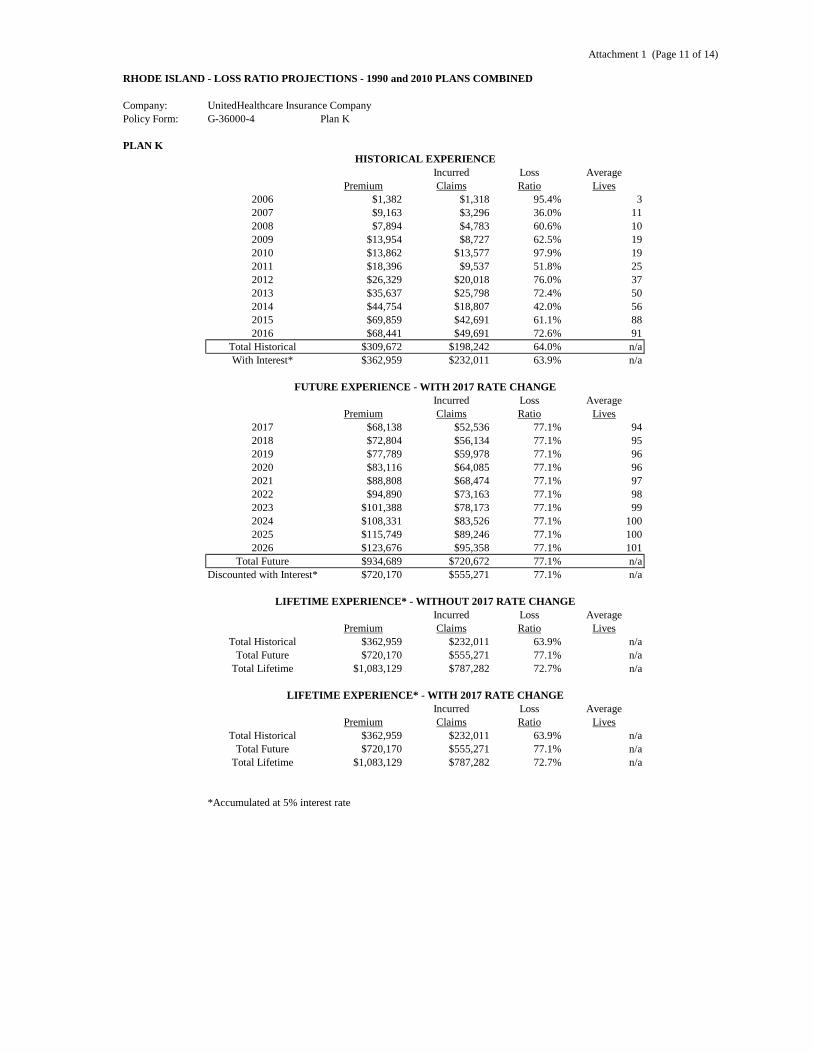
Attachment 1 (Page 11 of 14)
RHODE ISLAND - LOSS RATIO PROJECTIONS - 1990 and 2010 PLANS COMBINED
Company: UnitedHealthcare Insurance CompanyPolicy Form: G-36000-4 Plan K
PLAN KHISTORICAL EXPERIENCE
Incurred Loss AveragePremium Claims Ratio Lives
2006 $1,382 $1,318 95.4% 32007 $9,163 $3,296 36.0% 112008 $7,894 $4,783 60.6% 102009 $13,954 $8,727 62.5% 192010 $13,862 $13,577 97.9% 192011 $18,396 $9,537 51.8% 252012 $26,329 $20,018 76.0% 372013 $35,637 $25,798 72.4% 502014 $44,754 $18,807 42.0% 562015 $69,859 $42,691 61.1% 882016 $68,441 $49,691 72.6% 91
Total Historical $309,672 $198,242 64.0% n/aWith Interest* $362,959 $232,011 63.9% n/a
FUTURE EXPERIENCE - WITH 2017 RATE CHANGEIncurred Loss Average
Premium Claims Ratio Lives2017 $68,138 $52,536 77.1% 942018 $72,804 $56,134 77.1% 952019 $77,789 $59,978 77.1% 962020 $83,116 $64,085 77.1% 962021 $88,808 $68,474 77.1% 972022 $94,890 $73,163 77.1% 982023 $101,388 $78,173 77.1% 992024 $108,331 $83,526 77.1% 1002025 $115,749 $89,246 77.1% 1002026 $123,676 $95,358 77.1% 101
Total Future $934,689 $720,672 77.1% n/aDiscounted with Interest* $720,170 $555,271 77.1% n/a
LIFETIME EXPERIENCE* - WITHOUT 2017 RATE CHANGEIncurred Loss Average
Premium Claims Ratio LivesTotal Historical $362,959 $232,011 63.9% n/a
Total Future $720,170 $555,271 77.1% n/aTotal Lifetime $1,083,129 $787,282 72.7% n/a
LIFETIME EXPERIENCE* - WITH 2017 RATE CHANGEIncurred Loss Average
Premium Claims Ratio LivesTotal Historical $362,959 $232,011 63.9% n/a
Total Future $720,170 $555,271 77.1% n/aTotal Lifetime $1,083,129 $787,282 72.7% n/a
*Accumulated at 5% interest rate

Attachment 1 (Page 12 of 14)
RHODE ISLAND - LOSS RATIO PROJECTIONS - 1990 and 2010 PLANS COMBINED
Company: UnitedHealthcare Insurance CompanyPolicy Form: G-36000-4 Plan L
PLAN LHISTORICAL EXPERIENCE
Incurred Loss AveragePremium Claims Ratio Lives
2006 $5,172 $1,766 34.1% 52007 $16,357 $12,920 79.0% 162008 $24,048 $12,259 51.0% 232009 $30,026 $12,947 43.1% 282010 $36,302 $44,210 121.8% 332011 $37,948 $35,258 92.9% 322012 $40,275 $19,223 47.7% 332013 $43,789 $29,271 66.8% 362014 $46,569 $38,251 82.1% 362015 $57,083 $35,094 61.5% 432016 $58,274 $45,642 78.3% 44
Total Historical $395,845 $286,840 72.5% n/aWith Interest* $489,662 $353,936 72.3% n/a
FUTURE EXPERIENCE - WITH 2017 RATE CHANGEIncurred Loss Average
Premium Claims Ratio Lives2017 $53,952 $42,238 78.3% 392018 $58,364 $45,130 77.3% 402019 $62,361 $48,221 77.3% 402020 $66,632 $51,523 77.3% 402021 $71,195 $55,051 77.3% 412022 $76,070 $58,821 77.3% 412023 $81,279 $62,849 77.3% 412024 $86,845 $67,153 77.3% 422025 $92,792 $71,752 77.3% 422026 $99,147 $76,665 77.3% 42
Total Future $748,637 $579,402 77.4% n/aDiscounted with Interest* $576,681 $446,424 77.4% n/a
LIFETIME EXPERIENCE* - WITHOUT 2017 RATE CHANGEIncurred Loss Average
Premium Claims Ratio LivesTotal Historical $489,662 $353,936 72.3% n/a
Total Future $549,888 $446,424 81.2% n/aTotal Lifetime $1,039,550 $800,360 77.0% n/a
LIFETIME EXPERIENCE* - WITH 2017 RATE CHANGEIncurred Loss Average
Premium Claims Ratio LivesTotal Historical $489,662 $353,936 72.3% n/a
Total Future $576,681 $446,424 77.4% n/aTotal Lifetime $1,066,343 $800,360 75.1% n/a
*Accumulated at 5% interest rate

Attachment 1 (Page 13 of 14)
RHODE ISLAND - LOSS RATIO PROJECTIONS - 2010 PLAN ONLY
Company: UnitedHealthcare Insurance CompanyPolicy Form: G-36000-4 Plan N
PLAN NHISTORICAL EXPERIENCE
Incurred Loss AveragePremium Claims Ratio Lives
2010 $16,307 $7,751 47.5% 142011 $387,032 $312,136 80.6% 3042012 $632,900 $521,188 82.3% 5232013 $1,138,420 $904,260 79.4% 9182014 $2,272,650 $1,791,136 78.8% 1,6972015 $4,464,470 $3,493,001 78.2% 3,1602016 $5,391,165 $4,226,848 78.4% 3,681
Total Historical $14,302,945 $11,256,319 78.7% n/aWith Interest* $15,562,483 $12,253,598 78.7% n/a
FUTURE EXPERIENCE - WITH 2017 RATE CHANGEIncurred Loss Average
Premium Claims Ratio Lives2017 $6,578,675 $5,081,531 77.2% 4,2912018 $7,111,891 $5,429,514 76.3% 4,3252019 $7,598,913 $5,801,328 76.3% 4,3602020 $8,119,286 $6,198,603 76.3% 4,3952021 $8,675,295 $6,623,083 76.3% 4,4302022 $9,269,379 $7,076,632 76.3% 4,4652023 $9,904,146 $7,561,239 76.3% 4,5012024 $10,582,382 $8,079,033 76.3% 4,5372025 $11,307,064 $8,632,285 76.3% 4,5732026 $12,081,372 $9,223,424 76.3% 4,610
Total Future $91,228,404 $69,706,671 76.4% n/aDiscounted with Interest* $70,274,788 $53,708,381 76.4% n/a
LIFETIME EXPERIENCE* - WITHOUT 2017 RATE CHANGEIncurred Loss Average
Premium Claims Ratio LivesTotal Historical $15,562,483 $12,253,598 78.7% n/a
Total Future $67,000,313 $53,708,381 80.2% n/aTotal Lifetime $82,562,797 $65,961,980 79.9% n/a
LIFETIME EXPERIENCE* - WITH 2017 RATE CHANGEIncurred Loss Average
Premium Claims Ratio LivesTotal Historical $15,562,483 $12,253,598 78.7% n/a
Total Future $70,274,788 $53,708,381 76.4% n/aTotal Lifetime $85,837,271 $65,961,980 76.8% n/a
*Accumulated at 5% interest rate

Attachment 1 (Page 14 of 14)
RHODE ISLAND - LOSS RATIO PROJECTIONS - 1990 AND 2010 PLANS COMBINED
Company: UnitedHealthcare Insurance CompanyPolicy Form: G-36000-4 Total Standardized
TOTAL STANDARDIZEDHISTORICAL EXPERIENCE
Incurred Loss AveragePremium Claims Ratio Lives
1998 $4,232,432 $3,490,221 82.5% 3,1381999 $4,158,259 $3,351,644 80.6% 2,7202000 $4,562,080 $3,795,735 83.2% 2,9222001 $4,986,458 $4,232,088 84.9% 3,1002002 $5,257,750 $4,511,057 85.8% 3,1892003 $5,936,233 $5,125,318 86.3% 3,4472004 $6,725,051 $5,640,860 83.9% 3,6762005 $7,329,022 $6,119,359 83.5% 3,8512006 $7,400,101 $6,219,856 84.1% 4,1352007 $8,166,905 $6,566,930 80.4% 4,4792008 $8,933,686 $7,418,093 83.0% 4,7772009 $9,869,606 $8,389,741 85.0% 5,2912010 $11,203,694 $9,453,458 84.4% 5,8562011 $13,225,023 $10,795,031 81.6% 6,7182012 $14,807,111 $12,036,529 81.3% 7,6662013 $17,154,031 $13,674,859 79.7% 8,7592014 $22,140,443 $17,905,231 80.9% 11,0042015 $31,828,762 $25,527,251 80.2% 15,8012016 $34,745,632 $28,360,007 81.6% 17,286
Total Historical $222,662,279 $182,613,268 82.0% n/aWith Interest* $307,810,587 $253,358,980 82.3% n/a
FUTURE EXPERIENCE - WITH 2017 RATE CHANGEIncurred Loss Average
Premium Claims Ratio Lives2017 $38,453,496 $31,167,075 81.1% 18,6422018 $41,283,967 $33,087,669 80.1% 18,6922019 $43,859,065 $35,149,616 80.1% 18,7522020 $46,622,099 $37,362,144 80.1% 18,8222021 $49,585,406 $39,735,135 80.1% 18,9012022 $52,762,191 $42,279,163 80.1% 18,9872023 $56,166,588 $45,005,551 80.1% 19,0802024 $59,813,721 $47,926,410 80.1% 19,1812025 $63,719,771 $51,054,701 80.1% 19,2872026 $67,902,047 $54,404,289 80.1% 19,398
Total Future $520,168,353 $417,171,754 80.2% n/aDiscounted with Interest* $401,368,888 $321,971,186 80.2% n/a
LIFETIME EXPERIENCE* - WITHOUT 2017 RATE CHANGEIncurred Loss Average
Premium Claims Ratio LivesTotal Historical $307,810,587 $253,358,980 82.3% n/a
Total Future $383,252,614 $321,971,186 84.0% n/aTotal Lifetime $691,063,200 $575,330,166 83.3% n/a
LIFETIME EXPERIENCE* - WITH 2017 RATE CHANGEIncurred Loss Average
Premium Claims Ratio LivesTotal Historical $307,810,587 $253,358,980 82.3% n/a
Total Future $401,368,888 $321,971,186 80.2% n/aTotal Lifetime $709,179,475 $575,330,166 81.1% n/a
*Accumulated at 5% interest rate

Attachment 2 (page 1 of 25)RHODE ISLAND'S EXPERIENCE BY DURATION
PLAN A
Incurred Year
Issue YearIncurred Claims
Earned Premiums
Loss Ratio Average Lives
1998 1998 58,697 87,049 67.4% 119Total 58,697 87,049 67.4% 119
1999 1999 725 3,976 18.2% 51998 59,444 70,004 84.9% 79
Total 60,170 73,980 81.3% 84
2000 2000 7,759 12,904 60.1% 151999 2,138 7,362 29.0% 81998 45,706 64,239 71.2% 69
Total 55,603 84,505 65.8% 92
2001 2001 2,020 7,349 27.5% 82000 7,922 15,107 52.4% 171999 4,028 6,041 66.7% 61998 66,304 64,083 103.5% 68
Total 80,274 92,580 86.7% 99
2002 2002 5,149 6,452 79.8% 72001 6,375 11,065 57.6% 122000 11,628 12,234 95.0% 13
1998-1999 58,490 56,066 104.3% 59Total 81,641 85,816 95.1% 91
2003 2003 8,575 7,992 107.3% 92002 11,917 13,765 86.6% 142001 3,081 11,341 27.2% 11
1998-2000 52,833 62,391 84.7% 63Total 76,406 95,490 80.0% 97
2004 2004 6,708 10,369 64.7% 102003 14,530 13,679 106.2% 142002 10,534 15,461 68.1% 14
1998-2001 38,368 71,429 53.7% 64Total 70,139 110,938 63.2% 101
2005 2005 4,081 9,653 42.3% 82004 6,474 12,454 52.0% 122003 10,029 10,963 91.5% 10
1998-2002 37,132 74,657 49.7% 64Total 57,716 107,727 53.6% 95
2006 2006 9,148 21,906 41.8% 182005 6,208 13,152 47.2% 112004 3,770 11,828 31.9% 11
1998-2003 50,580 80,538 62.8% 67Total 69,707 127,425 54.7% 106
2007 2007 7,966 10,278 77.5% 92006 39,417 30,157 130.7% 252005 5,281 11,821 44.7% 10
1998-2004 54,833 85,042 64.5% 71Total 107,497 137,298 78.3% 115
2008 2008 7,880 11,013 71.6% 102007 7,566 14,609 51.8% 132006 24,418 22,861 106.8% 20
1998-2005 46,817 84,135 55.6% 70Total 86,681 132,618 65.4% 113

Attachment 2 (page 2 of 25)RHODE ISLAND'S EXPERIENCE BY DURATION
PLAN A
Incurred Year
Issue YearIncurred Claims
Earned Premiums
Loss Ratio Average Lives
2009 2009 5,836 14,636 39.9% 132008 20,040 19,521 102.7% 172007 10,194 14,526 70.2% 13
1998-2006 65,866 101,703 64.8% 85Total 101,936 150,385 67.8% 128
2010 2010 10,173 10,047 101.3% 92009 8,520 18,667 45.6% 172008 41,996 18,387 228.4% 16
1998-2007 74,693 110,246 67.8% 91Total 135,383 157,347 86.0% 133
2011 2011 10,883 13,421 81.1% 132010 18,618 13,071 142.4% 132009 21,343 12,266 174.0% 11
1998-2008 102,498 123,433 83.0% 102Total 153,343 162,191 94.5% 139
2012 2012 9,496 5,761 164.8% 72011 9,165 17,740 51.7% 162010 34,129 10,975 311.0% 11
1998-2009 105,452 127,991 82.4% 104Total 158,242 162,467 97.4% 138
2013 2013 5,585 7,055 79.2% 52012 11,985 7,724 155.2% 82011 2,733 10,410 26.3% 10
1998-2010 130,243 132,445 98.3% 104Total 150,546 157,634 95.5% 127
2014 2014 3,881 11,637 33.4% 102013 4,912 6,781 72.4% 52012 3,323 7,462 44.5% 7
1998-2011 113,682 136,215 83.5% 103Total 125,797 162,095 77.6% 126
2015 2015 1,166 7,205 16.2% 62014 8,816 14,562 60.5% 122013 2,333 7,488 31.2% 5
1998-2012 113,727 140,233 81.1% 103Total 126,042 169,487 74.4% 126

Attachment 2 (page 3 of 25)RHODE ISLAND'S EXPERIENCE BY DURATION
PLAN B
Incurred Year
Issue YearIncurred Claims
Earned Premiums
Loss Ratio Average Lives
1998 1998 73,717 75,797 97.3% 69Total 73,717 75,797 97.3% 69
1999 1999 0 0 0.0% 01998 65,770 64,254 102.4% 49
Total 65,770 64,254 102.4% 49
2000 2000 1,172 4,088 28.7% 31999 0 0 0.0% 01998 51,355 53,886 95.3% 41
Total 52,527 57,975 90.6% 44
2001 2001 0 697 0.0% 12000 1,526 7,147 21.3% 51999 0 0 0.0% 01998 39,130 45,982 85.1% 35
Total 40,655 53,825 75.5% 41
2002 2002 10,575 5,682 186.1% 52001 116 443 26.1% 02000 4,999 7,223 69.2% 5
1998-1999 20,442 37,935 53.9% 29Total 36,132 51,283 70.5% 40
2003 2003 3,742 7,631 49.0% 62002 16,624 9,978 166.6% 82001 0 0 0.0% 0
1998-2000 26,707 41,654 64.1% 30Total 47,074 59,263 79.4% 44
2004 2004 21,829 19,139 114.1% 132003 7,289 13,278 54.9% 102002 13,974 11,180 125.0% 8
1998-2001 35,409 40,830 86.7% 28Total 78,500 84,427 93.0% 59
2005 2005 15,096 6,036 250.1% 42004 18,933 25,205 75.1% 172003 9,759 11,742 83.1% 8
1998-2002 50,597 54,301 93.2% 36Total 94,385 97,285 97.0% 66
2006 2006 15,230 24,457 62.3% 162005 7,907 6,655 118.8% 52004 18,898 24,391 77.5% 15
1998-2003 52,244 60,256 86.7% 39Total 94,280 115,760 81.4% 75
2007 2007 13,636 16,365 83.3% 112006 28,975 35,360 81.9% 222005 5,353 7,624 70.2% 5
1998-2004 67,188 69,337 96.9% 43Total 115,151 128,686 89.5% 81
2008 2008 27,605 25,924 106.5% 162007 13,397 24,549 54.6% 162006 14,559 27,428 53.1% 17
1998-2005 45,464 68,097 66.8% 41Total 101,024 145,998 69.2% 90
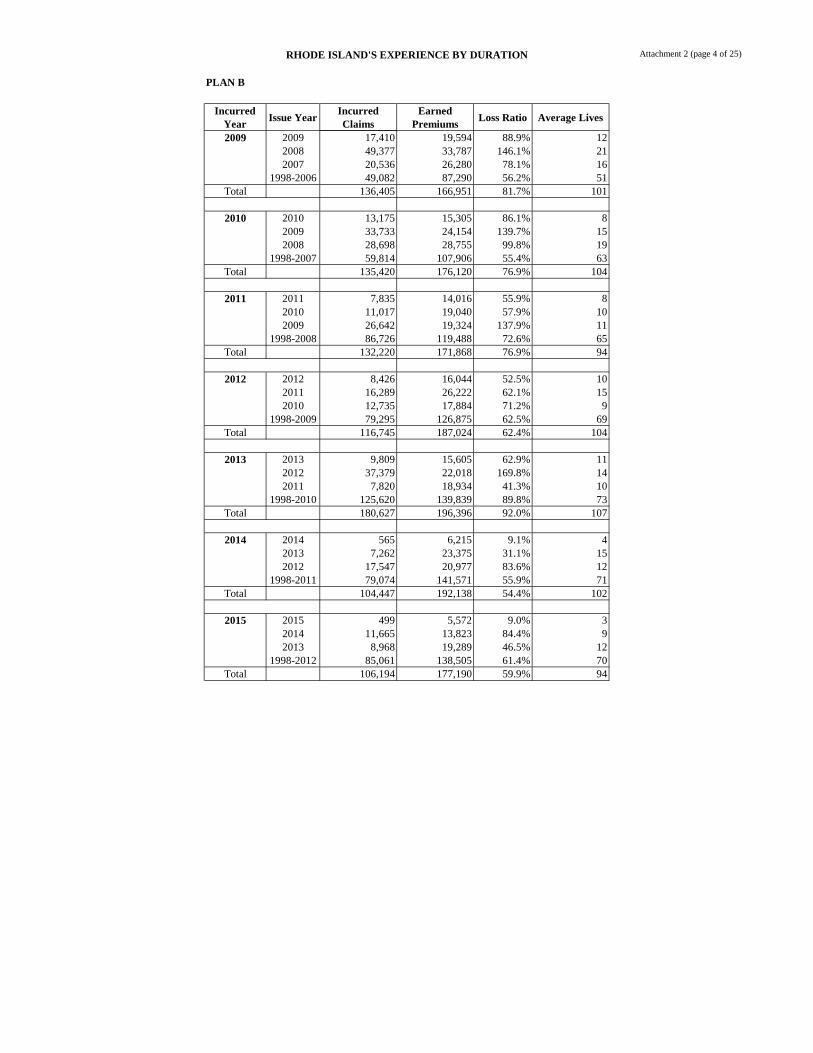
Attachment 2 (page 4 of 25)RHODE ISLAND'S EXPERIENCE BY DURATION
PLAN B
Incurred Year
Issue YearIncurred Claims
Earned Premiums
Loss Ratio Average Lives
2009 2009 17,410 19,594 88.9% 122008 49,377 33,787 146.1% 212007 20,536 26,280 78.1% 16
1998-2006 49,082 87,290 56.2% 51Total 136,405 166,951 81.7% 101
2010 2010 13,175 15,305 86.1% 82009 33,733 24,154 139.7% 152008 28,698 28,755 99.8% 19
1998-2007 59,814 107,906 55.4% 63Total 135,420 176,120 76.9% 104
2011 2011 7,835 14,016 55.9% 82010 11,017 19,040 57.9% 102009 26,642 19,324 137.9% 11
1998-2008 86,726 119,488 72.6% 65Total 132,220 171,868 76.9% 94
2012 2012 8,426 16,044 52.5% 102011 16,289 26,222 62.1% 152010 12,735 17,884 71.2% 9
1998-2009 79,295 126,875 62.5% 69Total 116,745 187,024 62.4% 104
2013 2013 9,809 15,605 62.9% 112012 37,379 22,018 169.8% 142011 7,820 18,934 41.3% 10
1998-2010 125,620 139,839 89.8% 73Total 180,627 196,396 92.0% 107
2014 2014 565 6,215 9.1% 42013 7,262 23,375 31.1% 152012 17,547 20,977 83.6% 12
1998-2011 79,074 141,571 55.9% 71Total 104,447 192,138 54.4% 102
2015 2015 499 5,572 9.0% 32014 11,665 13,823 84.4% 92013 8,968 19,289 46.5% 12
1998-2012 85,061 138,505 61.4% 70Total 106,194 177,190 59.9% 94

Attachment 2 (page 5 of 25)RHODE ISLAND'S EXPERIENCE BY DURATION
PLAN C
Incurred Year
Issue YearIncurred Claims
Earned Premiums
Loss Ratio Average Lives
1998 1998 1,159,394 1,406,557 82.4% 1,120Total 1,159,394 1,406,557 82.4% 1,120
1999 1999 76,745 68,133 112.6% 511998 917,531 1,228,965 74.7% 892
Total 994,276 1,297,098 76.7% 943
2000 2000 188,746 191,577 98.5% 1411999 118,399 134,879 87.8% 991998 946,534 1,170,942 80.8% 830
Total 1,253,679 1,497,399 83.7% 1,070
2001 2001 99,301 145,112 68.4% 1022000 270,315 265,506 101.8% 1881999 114,805 130,995 87.6% 921998 946,260 1,135,525 83.3% 788
Total 1,430,682 1,677,138 85.3% 1,169
2002 2002 101,369 119,749 84.7% 882001 177,378 218,177 81.3% 1512000 220,068 236,187 93.2% 163
1998-1999 1,106,824 1,143,915 96.8% 793Total 1,605,640 1,718,027 93.5% 1,195
2003 2003 100,155 148,217 67.6% 1062002 210,883 205,050 102.8% 1412001 152,065 222,651 68.3% 140
1998-2000 1,222,919 1,382,499 88.5% 897Total 1,686,022 1,958,418 86.1% 1,284
2004 2004 57,220 102,043 56.1% 652003 157,184 229,777 68.4% 1542002 157,875 198,963 79.3% 125
1998-2001 1,328,670 1,600,390 83.0% 971Total 1,700,949 2,131,173 79.8% 1,315
2005 2005 76,519 104,997 72.9% 672004 147,123 168,479 87.3% 1042003 147,159 225,412 65.3% 142
1998-2002 1,453,608 1,691,958 85.9% 1,003Total 1,824,409 2,190,847 83.3% 1,315
2006 2006 217,145 194,692 111.5% 1182005 152,548 163,654 93.2% 982004 117,799 162,349 72.6% 95
1998-2003 1,718,507 1,861,795 92.3% 1,064Total 2,206,000 2,382,490 92.6% 1,374
2007 2007 69,157 120,455 57.4% 732006 253,910 297,282 85.4% 1722005 127,000 163,250 77.8% 91
1998-2004 1,645,198 1,946,381 84.5% 1,062Total 2,095,266 2,527,368 82.9% 1,399
2008 2008 59,880 106,902 56.0% 672007 124,100 175,775 70.6% 1042006 236,539 283,401 83.5% 154
1998-2005 1,843,526 2,055,681 89.7% 1,083Total 2,264,045 2,621,759 86.4% 1,407
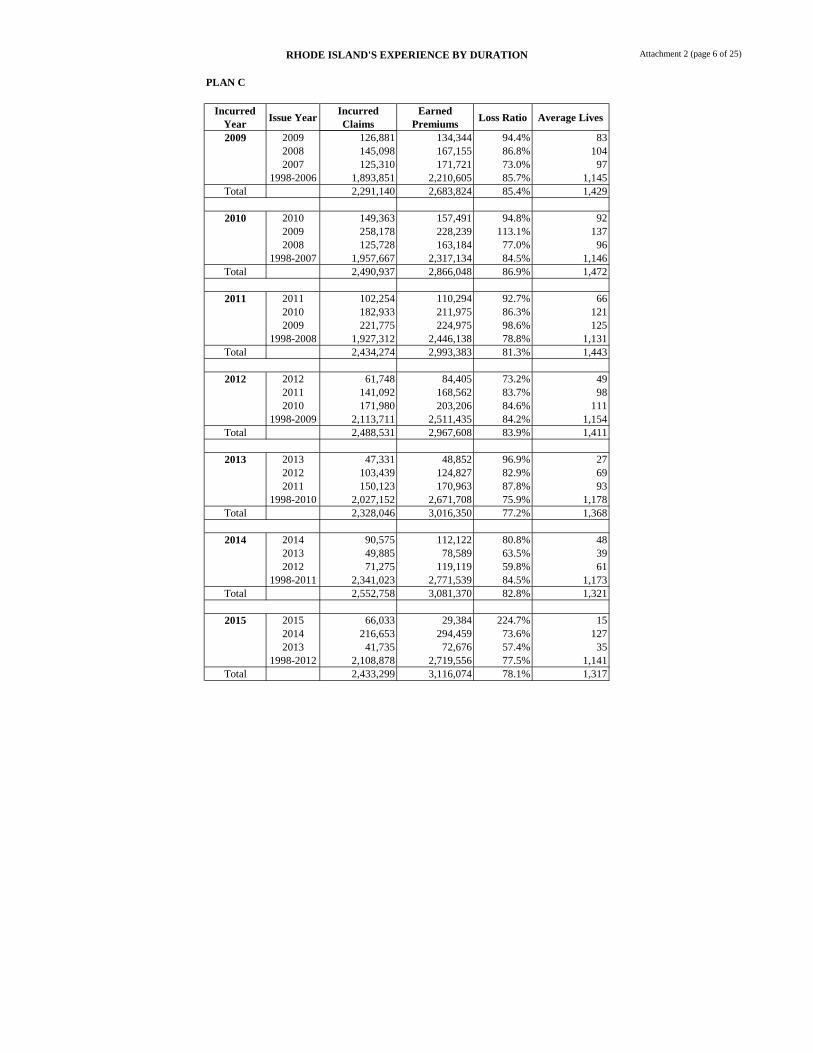
Attachment 2 (page 6 of 25)RHODE ISLAND'S EXPERIENCE BY DURATION
PLAN C
Incurred Year
Issue YearIncurred Claims
Earned Premiums
Loss Ratio Average Lives
2009 2009 126,881 134,344 94.4% 832008 145,098 167,155 86.8% 1042007 125,310 171,721 73.0% 97
1998-2006 1,893,851 2,210,605 85.7% 1,145Total 2,291,140 2,683,824 85.4% 1,429
2010 2010 149,363 157,491 94.8% 922009 258,178 228,239 113.1% 1372008 125,728 163,184 77.0% 96
1998-2007 1,957,667 2,317,134 84.5% 1,146Total 2,490,937 2,866,048 86.9% 1,472
2011 2011 102,254 110,294 92.7% 662010 182,933 211,975 86.3% 1212009 221,775 224,975 98.6% 125
1998-2008 1,927,312 2,446,138 78.8% 1,131Total 2,434,274 2,993,383 81.3% 1,443
2012 2012 61,748 84,405 73.2% 492011 141,092 168,562 83.7% 982010 171,980 203,206 84.6% 111
1998-2009 2,113,711 2,511,435 84.2% 1,154Total 2,488,531 2,967,608 83.9% 1,411
2013 2013 47,331 48,852 96.9% 272012 103,439 124,827 82.9% 692011 150,123 170,963 87.8% 93
1998-2010 2,027,152 2,671,708 75.9% 1,178Total 2,328,046 3,016,350 77.2% 1,368
2014 2014 90,575 112,122 80.8% 482013 49,885 78,589 63.5% 392012 71,275 119,119 59.8% 61
1998-2011 2,341,023 2,771,539 84.5% 1,173Total 2,552,758 3,081,370 82.8% 1,321
2015 2015 66,033 29,384 224.7% 152014 216,653 294,459 73.6% 1272013 41,735 72,676 57.4% 35
1998-2012 2,108,878 2,719,556 77.5% 1,141Total 2,433,299 3,116,074 78.1% 1,317

Attachment 2 (page 7 of 25)RHODE ISLAND'S EXPERIENCE BY DURATION
PLAN D
Incurred Year
Issue YearIncurred Claims
Earned Premiums
Loss Ratio Average Lives
1998 1998 43,853 63,294 69.3% 58Total 43,853 63,294 69.3% 58
1999 1999 2,667 2,353 113.3% 21998 40,632 64,275 63.2% 49
Total 43,299 66,628 65.0% 51
2000 2000 4,272 17,034 25.1% 131999 1,706 2,666 64.0% 21998 68,055 59,006 115.3% 45
Total 74,032 78,706 94.1% 60
2001 2001 2,146 4,993 43.0% 32000 12,569 19,233 65.4% 151999 4,080 2,736 149.1% 21998 36,264 54,182 66.9% 40
Total 55,059 81,144 67.9% 60
2002 2002 1,126 3,042 37.0% 22001 1,719 5,921 29.0% 42000 9,899 16,699 59.3% 12
1998-1999 36,466 47,490 76.8% 35Total 49,209 73,152 67.3% 54
2003 2003 4,521 5,329 84.8% 32002 3,232 6,530 49.5% 42001 5,607 6,532 85.8% 5
1998-2000 46,054 64,044 71.9% 44Total 59,414 82,435 72.1% 56
2004 2004 6,616 2,521 262.5% 22003 7,123 9,484 75.1% 62002 3,965 6,737 58.9% 4
1998-2001 51,456 69,768 73.8% 45Total 69,160 88,511 78.1% 57
2005 2005 3,710 6,577 56.4% 42004 9,188 3,423 268.4% 22003 4,376 8,649 50.6% 5
1998-2002 67,637 73,308 92.3% 46Total 84,911 91,957 92.3% 57
2006 2006 3,491 6,226 56.1% 42005 3,417 7,167 47.7% 42004 1,507 3,141 48.0% 2
1998-2003 59,567 77,807 76.6% 47Total 67,981 94,341 72.1% 56
2007 2007 4,168 8,965 46.5% 52006 2,760 8,797 31.4% 52005 3,706 7,474 49.6% 4
1998-2004 93,974 72,122 130.3% 42Total 104,608 97,357 107.4% 56
2008 2008 6,425 6,758 95.1% 42007 2,910 8,634 33.7% 52006 7,572 9,193 82.4% 5
1998-2005 78,676 80,078 98.2% 45Total 95,583 104,664 91.3% 59

Attachment 2 (page 8 of 25)RHODE ISLAND'S EXPERIENCE BY DURATION
PLAN D
Incurred Year
Issue YearIncurred Claims
Earned Premiums
Loss Ratio Average Lives
2009 2009 5,654 13,672 41.4% 82008 10,330 13,446 76.8% 82007 14,812 5,967 248.2% 3
1998-2006 107,361 86,861 123.6% 47Total 138,156 119,947 115.2% 67
2010 2010 12,906 5,695 226.6% 32009 45,519 23,001 197.9% 122008 17,274 15,376 112.3% 9
1998-2007 96,938 88,834 109.1% 46Total 172,637 132,906 129.9% 71
2011 2010 5,032 8,076 62.3% 42009 29,306 24,003 122.1% 12
1998-2008 98,392 97,898 100.5% 48Total 132,731 129,977 102.1% 63
2012 2010 8,612 8,166 105.5% 41998-2009 88,635 98,997 89.5% 47
Total 97,247 107,163 90.7% 51
2013 1998-2010 113,642 90,042 126.2% 41Total 113,642 90,042 126.2% 41
2014 1998-2010 100,654 86,110 116.9% 38Total 100,654 86,110 116.9% 38
2015 1998-2010 96,942 74,150 130.7% 32Total 96,942 74,150 130.7% 32
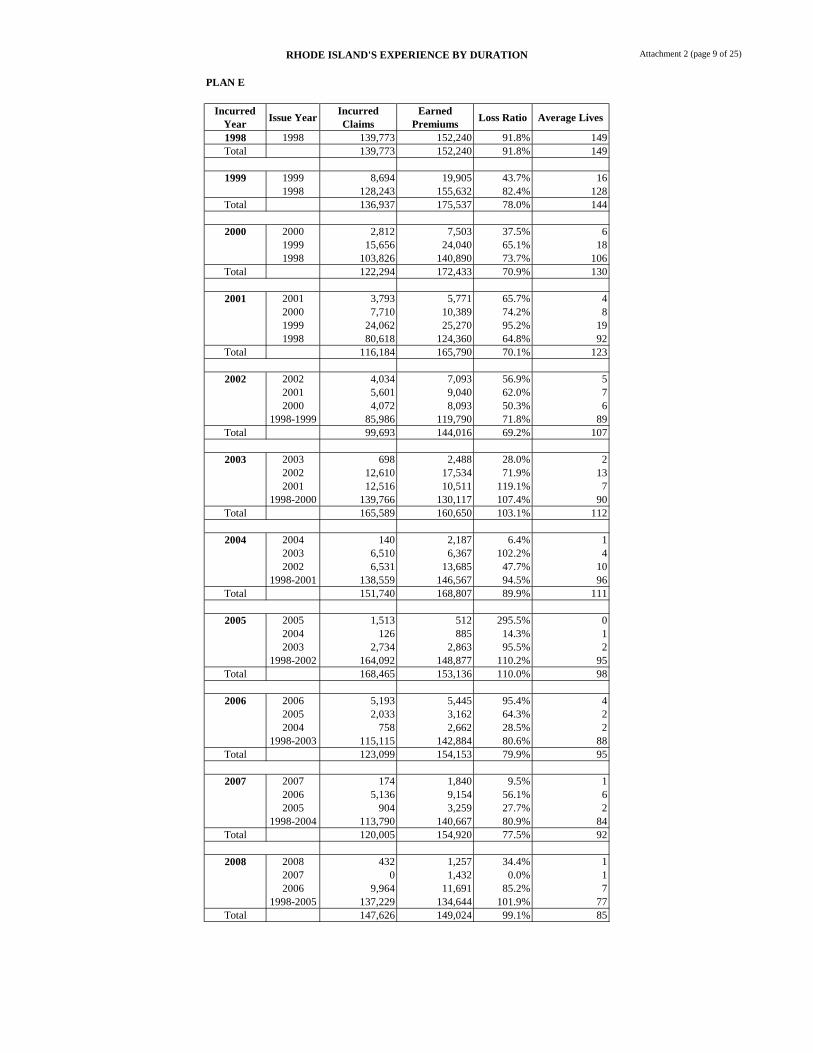
Attachment 2 (page 9 of 25)RHODE ISLAND'S EXPERIENCE BY DURATION
PLAN E
Incurred Year
Issue YearIncurred Claims
Earned Premiums
Loss Ratio Average Lives
1998 1998 139,773 152,240 91.8% 149Total 139,773 152,240 91.8% 149
1999 1999 8,694 19,905 43.7% 161998 128,243 155,632 82.4% 128
Total 136,937 175,537 78.0% 144
2000 2000 2,812 7,503 37.5% 61999 15,656 24,040 65.1% 181998 103,826 140,890 73.7% 106
Total 122,294 172,433 70.9% 130
2001 2001 3,793 5,771 65.7% 42000 7,710 10,389 74.2% 81999 24,062 25,270 95.2% 191998 80,618 124,360 64.8% 92
Total 116,184 165,790 70.1% 123
2002 2002 4,034 7,093 56.9% 52001 5,601 9,040 62.0% 72000 4,072 8,093 50.3% 6
1998-1999 85,986 119,790 71.8% 89Total 99,693 144,016 69.2% 107
2003 2003 698 2,488 28.0% 22002 12,610 17,534 71.9% 132001 12,516 10,511 119.1% 7
1998-2000 139,766 130,117 107.4% 90Total 165,589 160,650 103.1% 112
2004 2004 140 2,187 6.4% 12003 6,510 6,367 102.2% 42002 6,531 13,685 47.7% 10
1998-2001 138,559 146,567 94.5% 96Total 151,740 168,807 89.9% 111
2005 2005 1,513 512 295.5% 02004 126 885 14.3% 12003 2,734 2,863 95.5% 2
1998-2002 164,092 148,877 110.2% 95Total 168,465 153,136 110.0% 98
2006 2006 5,193 5,445 95.4% 42005 2,033 3,162 64.3% 22004 758 2,662 28.5% 2
1998-2003 115,115 142,884 80.6% 88Total 123,099 154,153 79.9% 95
2007 2007 174 1,840 9.5% 12006 5,136 9,154 56.1% 62005 904 3,259 27.7% 2
1998-2004 113,790 140,667 80.9% 84Total 120,005 154,920 77.5% 92
2008 2008 432 1,257 34.4% 12007 0 1,432 0.0% 12006 9,964 11,691 85.2% 7
1998-2005 137,229 134,644 101.9% 77Total 147,626 149,024 99.1% 85
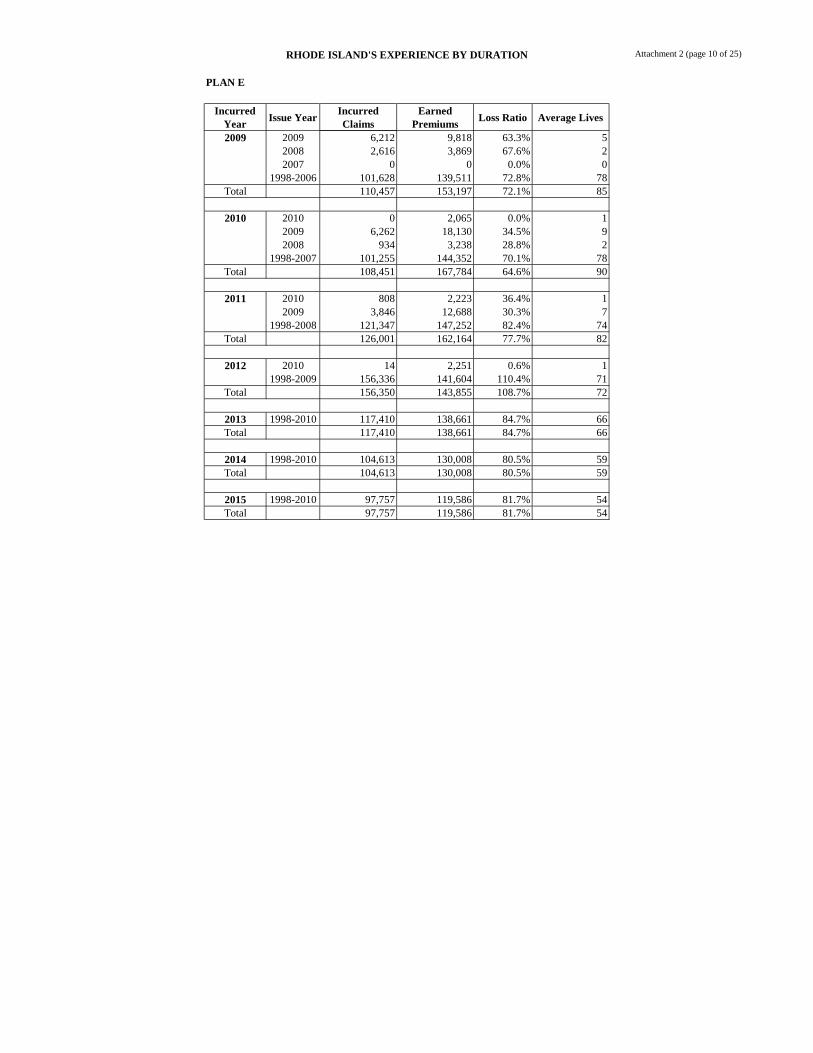
Attachment 2 (page 10 of 25)RHODE ISLAND'S EXPERIENCE BY DURATION
PLAN E
Incurred Year
Issue YearIncurred Claims
Earned Premiums
Loss Ratio Average Lives
2009 2009 6,212 9,818 63.3% 52008 2,616 3,869 67.6% 22007 0 0 0.0% 0
1998-2006 101,628 139,511 72.8% 78Total 110,457 153,197 72.1% 85
2010 2010 0 2,065 0.0% 12009 6,262 18,130 34.5% 92008 934 3,238 28.8% 2
1998-2007 101,255 144,352 70.1% 78Total 108,451 167,784 64.6% 90
2011 2010 808 2,223 36.4% 12009 3,846 12,688 30.3% 7
1998-2008 121,347 147,252 82.4% 74Total 126,001 162,164 77.7% 82
2012 2010 14 2,251 0.6% 11998-2009 156,336 141,604 110.4% 71
Total 156,350 143,855 108.7% 72
2013 1998-2010 117,410 138,661 84.7% 66Total 117,410 138,661 84.7% 66
2014 1998-2010 104,613 130,008 80.5% 59Total 104,613 130,008 80.5% 59
2015 1998-2010 97,757 119,586 81.7% 54Total 97,757 119,586 81.7% 54
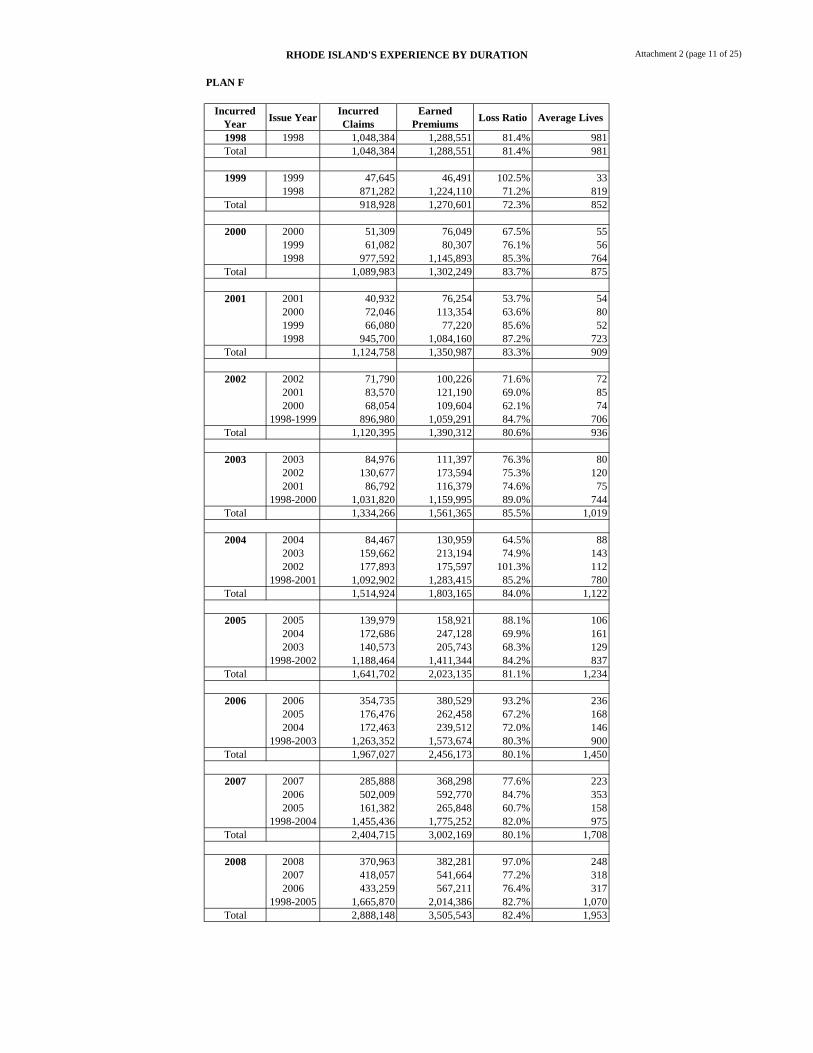
Attachment 2 (page 11 of 25)RHODE ISLAND'S EXPERIENCE BY DURATION
PLAN F
Incurred Year
Issue YearIncurred Claims
Earned Premiums
Loss Ratio Average Lives
1998 1998 1,048,384 1,288,551 81.4% 981Total 1,048,384 1,288,551 81.4% 981
1999 1999 47,645 46,491 102.5% 331998 871,282 1,224,110 71.2% 819
Total 918,928 1,270,601 72.3% 852
2000 2000 51,309 76,049 67.5% 551999 61,082 80,307 76.1% 561998 977,592 1,145,893 85.3% 764
Total 1,089,983 1,302,249 83.7% 875
2001 2001 40,932 76,254 53.7% 542000 72,046 113,354 63.6% 801999 66,080 77,220 85.6% 521998 945,700 1,084,160 87.2% 723
Total 1,124,758 1,350,987 83.3% 909
2002 2002 71,790 100,226 71.6% 722001 83,570 121,190 69.0% 852000 68,054 109,604 62.1% 74
1998-1999 896,980 1,059,291 84.7% 706Total 1,120,395 1,390,312 80.6% 936
2003 2003 84,976 111,397 76.3% 802002 130,677 173,594 75.3% 1202001 86,792 116,379 74.6% 75
1998-2000 1,031,820 1,159,995 89.0% 744Total 1,334,266 1,561,365 85.5% 1,019
2004 2004 84,467 130,959 64.5% 882003 159,662 213,194 74.9% 1432002 177,893 175,597 101.3% 112
1998-2001 1,092,902 1,283,415 85.2% 780Total 1,514,924 1,803,165 84.0% 1,122
2005 2005 139,979 158,921 88.1% 1062004 172,686 247,128 69.9% 1612003 140,573 205,743 68.3% 129
1998-2002 1,188,464 1,411,344 84.2% 837Total 1,641,702 2,023,135 81.1% 1,234
2006 2006 354,735 380,529 93.2% 2362005 176,476 262,458 67.2% 1682004 172,463 239,512 72.0% 146
1998-2003 1,263,352 1,573,674 80.3% 900Total 1,967,027 2,456,173 80.1% 1,450
2007 2007 285,888 368,298 77.6% 2232006 502,009 592,770 84.7% 3532005 161,382 265,848 60.7% 158
1998-2004 1,455,436 1,775,252 82.0% 975Total 2,404,715 3,002,169 80.1% 1,708
2008 2008 370,963 382,281 97.0% 2482007 418,057 541,664 77.2% 3182006 433,259 567,211 76.4% 317
1998-2005 1,665,870 2,014,386 82.7% 1,070Total 2,888,148 3,505,543 82.4% 1,953

Attachment 2 (page 12 of 25)RHODE ISLAND'S EXPERIENCE BY DURATION
PLAN F
Incurred Year
Issue YearIncurred Claims
Earned Premiums
Loss Ratio Average Lives
2009 2009 456,888 501,201 91.2% 3152008 503,620 615,079 81.9% 4002007 369,694 507,696 72.8% 282
1998-2006 2,073,797 2,465,699 84.1% 1,287Total 3,404,000 4,089,675 83.2% 2,284
2010 2010 615,347 704,198 87.4% 4152009 649,906 720,590 90.2% 4452008 447,405 610,842 73.2% 372
1998-2007 2,473,751 2,907,613 85.1% 1,444Total 4,186,409 4,943,243 84.7% 2,676
2011 2011 980,502 1,101,596 89.0% 6502010 942,574 1,111,894 84.8% 6462009 589,439 738,575 79.8% 415
1998-2008 2,930,250 3,518,327 83.3% 1,667Total 5,442,764 6,470,393 84.1% 3,378
2012 2012 926,190 1,141,464 81.1% 6882011 1,344,089 1,632,846 82.3% 9652010 877,544 1,063,260 82.5% 589
1998-2009 3,279,387 4,100,408 80.0% 1,950Total 6,427,209 7,937,978 81.0% 4,193
2013 2013 984,646 1,182,899 83.2% 6672012 1,579,515 1,858,752 85.0% 1,0642011 1,419,825 1,655,504 85.8% 905
1998-2010 3,896,044 5,059,333 77.0% 2,343Total 7,880,029 9,756,488 80.8% 4,980
2014 2014 3,173,803 3,369,007 94.2% 1,6022013 1,507,115 1,802,350 83.6% 9732012 1,511,203 1,844,025 82.0% 977
1998-2011 5,011,620 6,579,847 76.2% 2,996Total 11,203,741 13,595,229 82.4% 6,547
2015 2015 1,395,829 1,825,464 76.5% 9542014 8,020,968 9,495,439 84.5% 4,3462013 1,514,885 1,706,015 88.8% 891
1998-2012 6,319,494 8,123,312 77.8% 3,722Total 17,251,177 21,150,230 81.6% 9,913

Attachment 2 (page 13 of 25)RHODE ISLAND'S EXPERIENCE BY DURATION
PLAN G
Incurred Year
Issue YearIncurred Claims
Earned Premiums
Loss Ratio Average Lives
1998 1998 64,763 87,467 74.0% 77Total 64,763 87,467 74.0% 77
1999 1999 2,438 9,696 25.1% 71998 58,642 89,254 65.7% 65
Total 61,081 98,950 61.7% 72
2000 2000 8,961 7,758 115.5% 61999 6,847 13,851 49.4% 101998 55,731 76,999 72.4% 55
Total 71,538 98,608 72.5% 71
2001 2001 16,953 14,714 115.2% 112000 9,159 10,494 87.3% 81999 8,378 13,853 60.5% 101998 43,689 70,787 61.7% 50
Total 78,179 109,848 71.2% 78
2002 2002 6,983 17,863 39.1% 122001 14,804 17,872 82.8% 132000 26,813 9,993 268.3% 7
1998-1999 98,385 74,366 132.3% 53Total 146,985 120,094 122.4% 84
2003 2003 22,375 19,567 114.4% 142002 11,451 26,974 42.5% 182001 13,417 10,397 129.0% 7
1998-2000 65,043 74,978 86.7% 51Total 112,286 131,916 85.1% 90
2004 2004 7,824 12,513 62.5% 92003 20,929 30,132 69.5% 202002 25,984 29,195 89.0% 18
1998-2001 88,445 86,942 101.7% 56Total 143,182 158,783 90.2% 103
2005 2005 9,521 12,920 73.7% 82004 20,917 22,525 92.9% 162003 12,035 26,116 46.1% 17
1998-2002 71,089 100,662 70.6% 62Total 113,561 162,223 70.0% 103
2006 2006 19,146 19,546 98.0% 132005 13,033 23,585 55.3% 152004 12,501 22,530 55.5% 15
1998-2003 99,373 121,205 82.0% 72Total 144,052 186,866 77.1% 116
2007 2007 15 1,167 1.3% 12006 10,164 24,235 41.9% 152005 14,044 18,124 77.5% 12
1998-2004 115,652 134,045 86.3% 78Total 139,875 177,571 78.8% 106
2008 2008 2,165 4,487 48.3% 32007 170 1,461 11.6% 12006 10,174 22,398 45.4% 13
1998-2005 114,137 147,964 77.1% 84Total 126,647 176,310 71.8% 101

Attachment 2 (page 14 of 25)RHODE ISLAND'S EXPERIENCE BY DURATION
PLAN G
Incurred Year
Issue YearIncurred Claims
Earned Premiums
Loss Ratio Average Lives
2009 2009 5,074 4,954 102.4% 32008 3,704 5,586 66.3% 42007 1,274 2,781 45.8% 2
1998-2006 146,694 158,239 92.7% 88Total 156,745 171,559 91.4% 97
2010 2010 9,029 12,195 74.0% 72009 3,610 7,392 48.8% 52008 13,060 4,122 316.8% 3
1998-2007 95,590 154,198 62.0% 82Total 121,290 177,907 68.2% 97
2011 2010 6,689 12,019 55.6% 62009 774 4,960 15.6% 3
1998-2008 104,040 151,324 68.8% 75Total 111,503 168,304 66.3% 85
2012 2010 15,466 11,661 132.6% 61998-2009 177,758 152,951 116.2% 76
Total 193,224 164,612 117.4% 82
2013 1998-2010 131,780 162,832 80.9% 77Total 131,780 162,832 80.9% 77
2014 1998-2010 118,094 154,677 76.3% 70Total 118,094 154,677 76.3% 70
2015 1998-2010 144,226 149,247 96.6% 66Total 144,226 149,247 96.6% 66
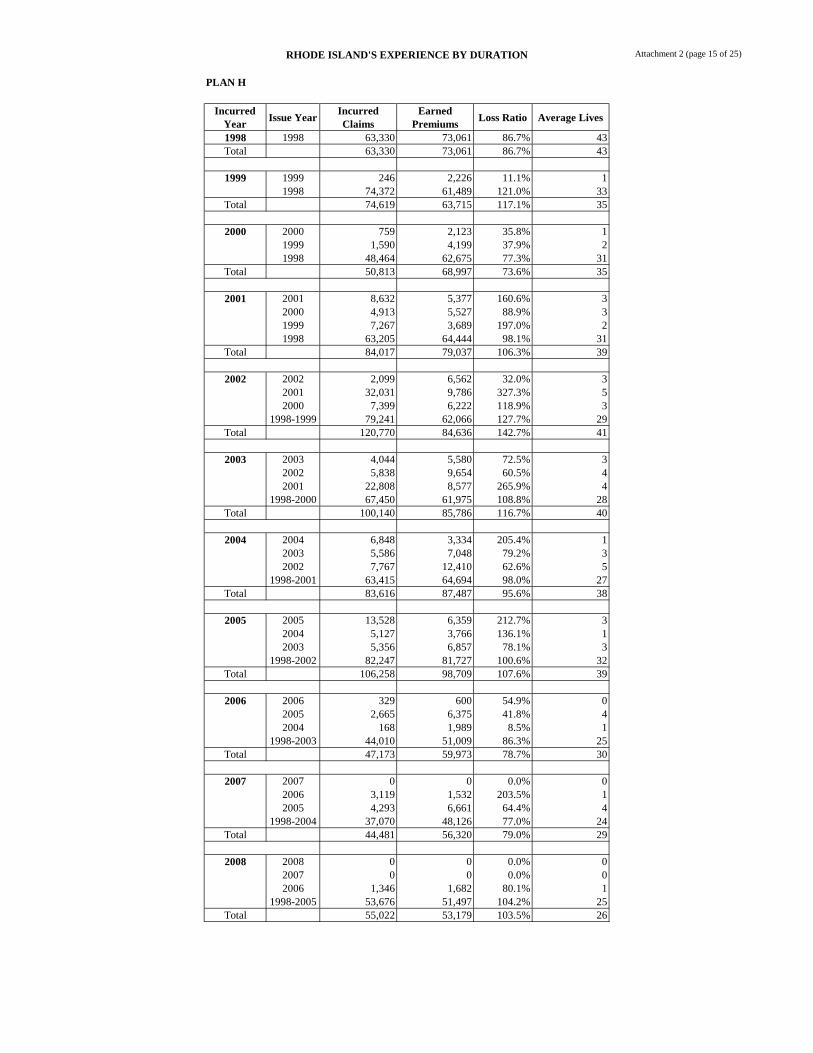
Attachment 2 (page 15 of 25)RHODE ISLAND'S EXPERIENCE BY DURATION
PLAN H
Incurred Year
Issue YearIncurred Claims
Earned Premiums
Loss Ratio Average Lives
1998 1998 63,330 73,061 86.7% 43Total 63,330 73,061 86.7% 43
1999 1999 246 2,226 11.1% 11998 74,372 61,489 121.0% 33
Total 74,619 63,715 117.1% 35
2000 2000 759 2,123 35.8% 11999 1,590 4,199 37.9% 21998 48,464 62,675 77.3% 31
Total 50,813 68,997 73.6% 35
2001 2001 8,632 5,377 160.6% 32000 4,913 5,527 88.9% 31999 7,267 3,689 197.0% 21998 63,205 64,444 98.1% 31
Total 84,017 79,037 106.3% 39
2002 2002 2,099 6,562 32.0% 32001 32,031 9,786 327.3% 52000 7,399 6,222 118.9% 3
1998-1999 79,241 62,066 127.7% 29Total 120,770 84,636 142.7% 41
2003 2003 4,044 5,580 72.5% 32002 5,838 9,654 60.5% 42001 22,808 8,577 265.9% 4
1998-2000 67,450 61,975 108.8% 28Total 100,140 85,786 116.7% 40
2004 2004 6,848 3,334 205.4% 12003 5,586 7,048 79.2% 32002 7,767 12,410 62.6% 5
1998-2001 63,415 64,694 98.0% 27Total 83,616 87,487 95.6% 38
2005 2005 13,528 6,359 212.7% 32004 5,127 3,766 136.1% 12003 5,356 6,857 78.1% 3
1998-2002 82,247 81,727 100.6% 32Total 106,258 98,709 107.6% 39
2006 2006 329 600 54.9% 02005 2,665 6,375 41.8% 42004 168 1,989 8.5% 1
1998-2003 44,010 51,009 86.3% 25Total 47,173 59,973 78.7% 30
2007 2007 0 0 0.0% 02006 3,119 1,532 203.5% 12005 4,293 6,661 64.4% 4
1998-2004 37,070 48,126 77.0% 24Total 44,481 56,320 79.0% 29
2008 2008 0 0 0.0% 02007 0 0 0.0% 02006 1,346 1,682 80.1% 1
1998-2005 53,676 51,497 104.2% 25Total 55,022 53,179 103.5% 26

Attachment 2 (page 16 of 25)RHODE ISLAND'S EXPERIENCE BY DURATION
PLAN H
Incurred Year
Issue YearIncurred Claims
Earned Premiums
Loss Ratio Average Lives
2009 2009 0 0 0.0% 02008 0 0 0.0% 02007 0 0 0.0% 0
1998-2006 47,746 48,011 99.4% 23Total 47,746 48,011 99.4% 23
2010 2010 0 0 0.0% 02009 0 0 0.0% 02008 0 0 0.0% 0
1998-2007 28,576 44,598 64.1% 20Total 28,576 44,598 64.1% 20
2011 2010 0 0 0.0% 02009 0 0 0.0% 0
1998-2008 25,432 41,687 61.0% 18Total 25,432 41,687 61.0% 18
2012 2010 0 0 0.0% 01998-2009 24,658 40,083 61.5% 17
Total 24,658 40,083 61.5% 17
2013 1998-2010 19,430 35,234 55.1% 15Total 19,430 35,234 55.1% 15
2014 1998-2010 29,777 31,210 95.4% 13Total 29,777 31,210 95.4% 13
2015 1998-2010 21,975 30,236 72.7% 13Total 21,975 30,236 72.7% 13

Attachment 2 (page 17 of 25)RHODE ISLAND'S EXPERIENCE BY DURATION
PLAN I
Incurred Year
Issue YearIncurred Claims
Earned Premiums
Loss Ratio Average Lives
1998 1998 264,613 343,049 77.1% 202Total 264,613 343,049 77.1% 202
1999 1999 7,983 19,267 41.4% 111998 238,636 314,757 75.8% 168
Total 246,620 334,024 73.8% 179
2000 2000 24,899 26,787 93.0% 151999 41,589 50,113 83.0% 271998 217,997 305,225 71.4% 150
Total 284,485 382,125 74.4% 192
2001 2001 8,630 24,676 35.0% 132000 41,426 39,516 104.8% 201999 39,690 47,091 84.3% 231998 250,511 301,541 83.1% 145
Total 340,258 412,824 82.4% 202
2002 2002 12,454 20,088 62.0% 102001 26,316 50,580 52.0% 262000 36,190 40,470 89.4% 19
1998-1999 279,600 335,192 83.4% 156Total 354,561 446,329 79.4% 212
2003 2003 19,784 34,087 58.0% 182002 22,441 38,187 58.8% 192001 27,008 53,845 50.2% 25
1998-2000 303,244 354,558 85.5% 159Total 372,477 480,676 77.5% 222
2004 2004 36,775 44,896 81.9% 222003 58,803 64,277 91.5% 322002 18,610 35,002 53.2% 15
1998-2001 357,879 403,241 88.8% 169Total 472,067 547,415 86.2% 238
2005 2005 40,947 57,383 71.4% 252004 54,404 71,788 75.8% 322003 38,624 62,033 62.3% 27
1998-2002 336,672 423,717 79.5% 167Total 470,647 614,920 76.5% 252
2006 2006 19,411 13,526 143.5% 82005 48,815 60,467 80.7% 332004 33,033 44,573 74.1% 24
1998-2003 263,092 344,217 76.4% 168Total 364,351 462,783 78.7% 233
2007 2007 1,880 6,238 30.1% 42006 6,211 22,677 27.4% 132005 39,976 54,159 73.8% 30
1998-2004 227,105 353,855 64.2% 179Total 275,171 436,929 63.0% 225
2008 2008 1,742 3,541 49.2% 32007 3,624 9,877 36.7% 62006 17,585 24,228 72.6% 13
1998-2005 330,222 380,608 86.8% 187Total 353,172 418,254 84.4% 209

Attachment 2 (page 18 of 25)RHODE ISLAND'S EXPERIENCE BY DURATION
PLAN I
Incurred Year
Issue YearIncurred Claims
Earned Premiums
Loss Ratio Average Lives
2009 2009 3,570 8,557 41.7% 62008 60,491 7,965 759.5% 62007 6,180 12,528 49.3% 7
1998-2006 313,411 398,557 78.6% 194Total 383,652 427,607 89.7% 213
2010 2010 15,070 18,588 81.1% 102009 6,149 11,585 53.1% 72008 5,123 6,429 79.7% 4
1998-2007 283,039 408,460 69.3% 184Total 309,381 445,061 69.5% 204
2011 2010 10,257 13,632 75.2% 72009 6,033 12,721 47.4% 8
1998-2008 284,218 378,194 75.2% 170Total 300,508 404,547 74.3% 184
2012 2010 5,853 13,612 43.0% 71998-2009 260,101 351,282 74.0% 158
Total 265,953 364,894 72.9% 165
2013 1998-2010 227,341 344,512 66.0% 154Total 227,341 344,512 66.0% 154
2014 1998-2010 188,978 329,104 57.4% 145Total 188,978 329,104 57.4% 145
2015 1998-2010 229,811 310,923 73.9% 136Total 229,811 310,923 73.9% 136
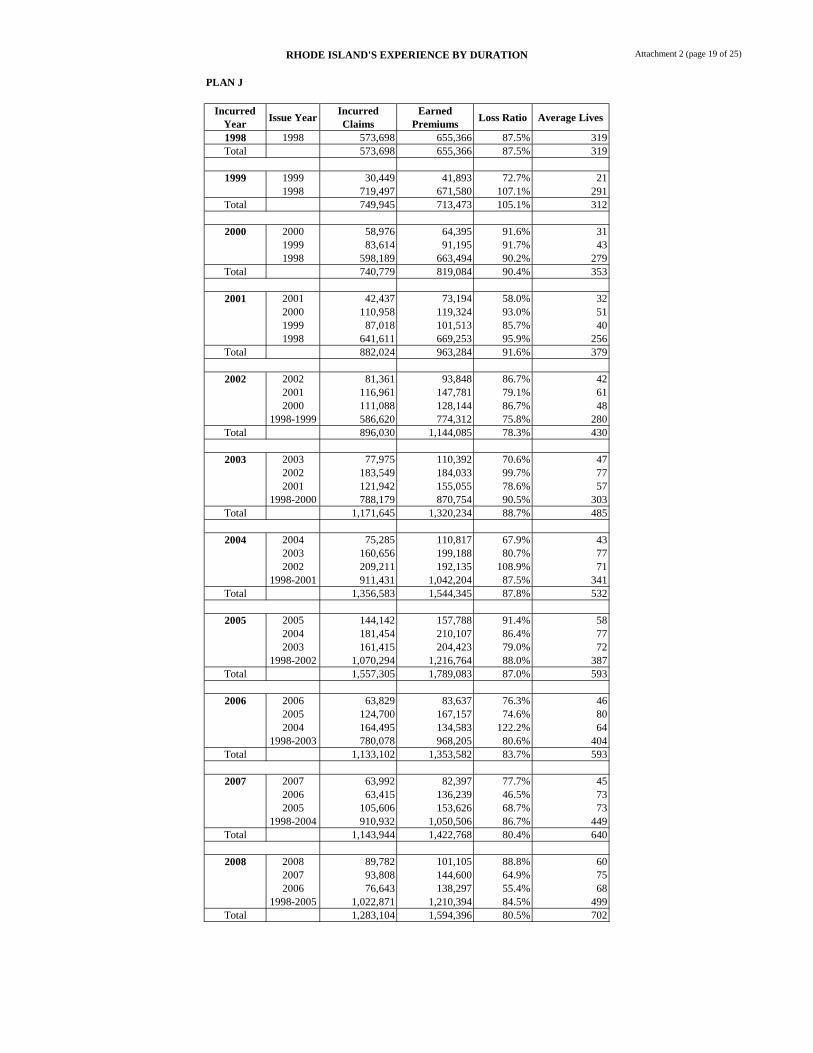
Attachment 2 (page 19 of 25)RHODE ISLAND'S EXPERIENCE BY DURATION
PLAN J
Incurred Year
Issue YearIncurred Claims
Earned Premiums
Loss Ratio Average Lives
1998 1998 573,698 655,366 87.5% 319Total 573,698 655,366 87.5% 319
1999 1999 30,449 41,893 72.7% 211998 719,497 671,580 107.1% 291
Total 749,945 713,473 105.1% 312
2000 2000 58,976 64,395 91.6% 311999 83,614 91,195 91.7% 431998 598,189 663,494 90.2% 279
Total 740,779 819,084 90.4% 353
2001 2001 42,437 73,194 58.0% 322000 110,958 119,324 93.0% 511999 87,018 101,513 85.7% 401998 641,611 669,253 95.9% 256
Total 882,024 963,284 91.6% 379
2002 2002 81,361 93,848 86.7% 422001 116,961 147,781 79.1% 612000 111,088 128,144 86.7% 48
1998-1999 586,620 774,312 75.8% 280Total 896,030 1,144,085 78.3% 430
2003 2003 77,975 110,392 70.6% 472002 183,549 184,033 99.7% 772001 121,942 155,055 78.6% 57
1998-2000 788,179 870,754 90.5% 303Total 1,171,645 1,320,234 88.7% 485
2004 2004 75,285 110,817 67.9% 432003 160,656 199,188 80.7% 772002 209,211 192,135 108.9% 71
1998-2001 911,431 1,042,204 87.5% 341Total 1,356,583 1,544,345 87.8% 532
2005 2005 144,142 157,788 91.4% 582004 181,454 210,107 86.4% 772003 161,415 204,423 79.0% 72
1998-2002 1,070,294 1,216,764 88.0% 387Total 1,557,305 1,789,083 87.0% 593
2006 2006 63,829 83,637 76.3% 462005 124,700 167,157 74.6% 802004 164,495 134,583 122.2% 64
1998-2003 780,078 968,205 80.6% 404Total 1,133,102 1,353,582 83.7% 593
2007 2007 63,992 82,397 77.7% 452006 63,415 136,239 46.5% 732005 105,606 153,626 68.7% 73
1998-2004 910,932 1,050,506 86.7% 449Total 1,143,944 1,422,768 80.4% 640
2008 2008 89,782 101,105 88.8% 602007 93,808 144,600 64.9% 752006 76,643 138,297 55.4% 68
1998-2005 1,022,871 1,210,394 84.5% 499Total 1,283,104 1,594,396 80.5% 702
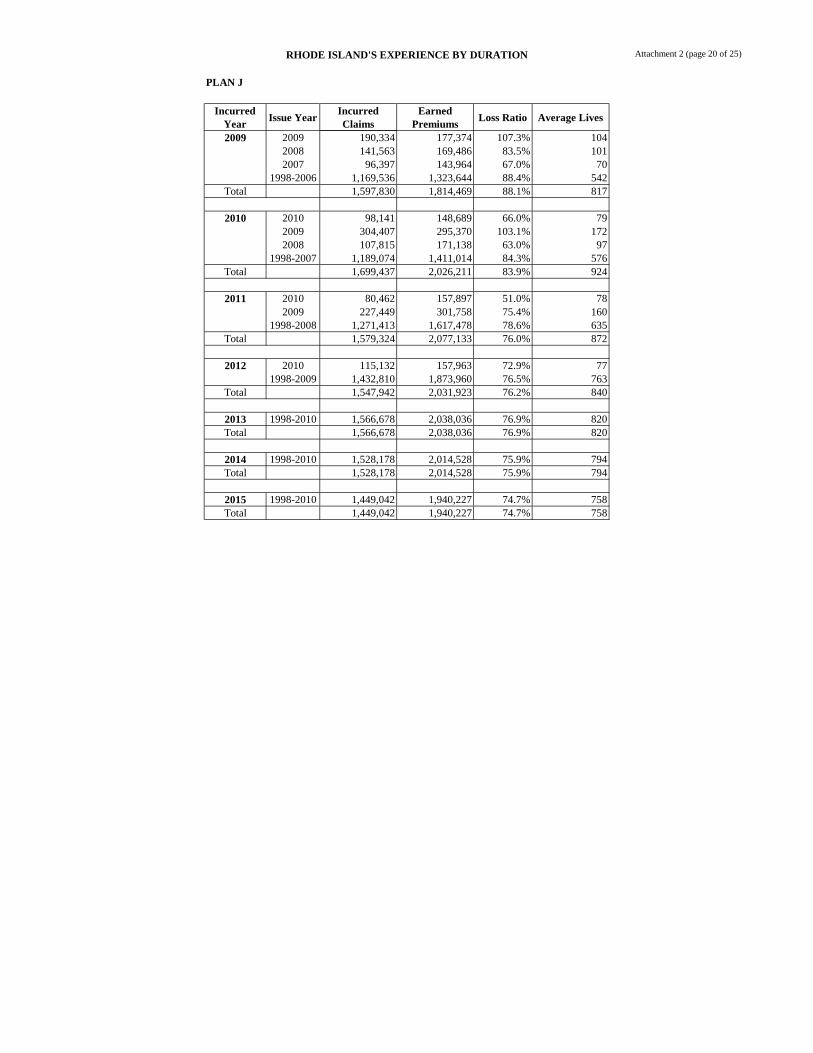
Attachment 2 (page 20 of 25)RHODE ISLAND'S EXPERIENCE BY DURATION
PLAN J
Incurred Year
Issue YearIncurred Claims
Earned Premiums
Loss Ratio Average Lives
2009 2009 190,334 177,374 107.3% 1042008 141,563 169,486 83.5% 1012007 96,397 143,964 67.0% 70
1998-2006 1,169,536 1,323,644 88.4% 542Total 1,597,830 1,814,469 88.1% 817
2010 2010 98,141 148,689 66.0% 792009 304,407 295,370 103.1% 1722008 107,815 171,138 63.0% 97
1998-2007 1,189,074 1,411,014 84.3% 576Total 1,699,437 2,026,211 83.9% 924
2011 2010 80,462 157,897 51.0% 782009 227,449 301,758 75.4% 160
1998-2008 1,271,413 1,617,478 78.6% 635Total 1,579,324 2,077,133 76.0% 872
2012 2010 115,132 157,963 72.9% 771998-2009 1,432,810 1,873,960 76.5% 763
Total 1,547,942 2,031,923 76.2% 840
2013 1998-2010 1,566,678 2,038,036 76.9% 820Total 1,566,678 2,038,036 76.9% 820
2014 1998-2010 1,528,178 2,014,528 75.9% 794Total 1,528,178 2,014,528 75.9% 794
2015 1998-2010 1,449,042 1,940,227 74.7% 758Total 1,449,042 1,940,227 74.7% 758

Attachment 2 (page 21 of 25)
PLAN K
Incurred Year
Issue YearIncurred Claims
Earned Premiums
Loss Ratio Average Lives
2006 2006 1,318 1,382 95.4% 3Total 1,318 1,382 95.4% 3
2007 2007 2,611 5,711 45.7% 62006 685 3,453 19.9% 4
Total 3,296 9,163 36.0% 11
2008 2008 552 2,255 24.5% 32007 4,151 3,907 106.3% 52006 80 1,732 4.6% 2
Total 4,783 7,894 60.6% 10
2009 2009 1,290 6,047 21.3% 82008 2,896 4,034 71.8% 72007 4,046 3,052 132.5% 42006 494 821 60.2% 1
Total 8,727 13,954 62.5% 19
2010 2010 1,974 3,232 61.1% 52009 6,161 6,354 97.0% 82008 5,072 2,177 233.0% 4
2006-2007 371 2,098 17.7% 3Total 13,577 13,862 97.9% 19
2011 2011 1,853 7,072 26.2% 102010 3,158 3,566 88.5% 52009 2,915 3,978 73.3% 5
2006-2008 1,612 3,780 42.6% 5Total 9,537 18,396 51.8% 25
2012 2012 3,158 4,630 68.2% 82011 5,702 11,426 49.9% 152010 558 3,432 16.3% 5
2006-2009 10,600 6,840 155.0% 9Total 20,018 26,329 76.0% 37
2013 2013 4,463 9,931 44.9% 142012 3,537 6,530 54.2% 112011 8,950 9,567 93.6% 12
2006-2010 8,847 9,609 92.1% 12Total 25,798 35,637 72.4% 50
2014 2014 9,648 11,821 81.6% 142013 2,882 9,755 29.5% 122012 506 5,302 9.6% 8
2006-2011 5,771 17,877 32.3% 22Total 18,807 44,754 42.0% 56
2015 2015 2,118 9,932 21.3% 142014 26,747 31,334 85.4% 382013 2,466 8,428 29.3% 10
2006-2012 11,359 20,166 56.3% 25Total 42,691 69,859 61.1% 88
RHODE ISLAND'S EXPERIENCE BY DURATION
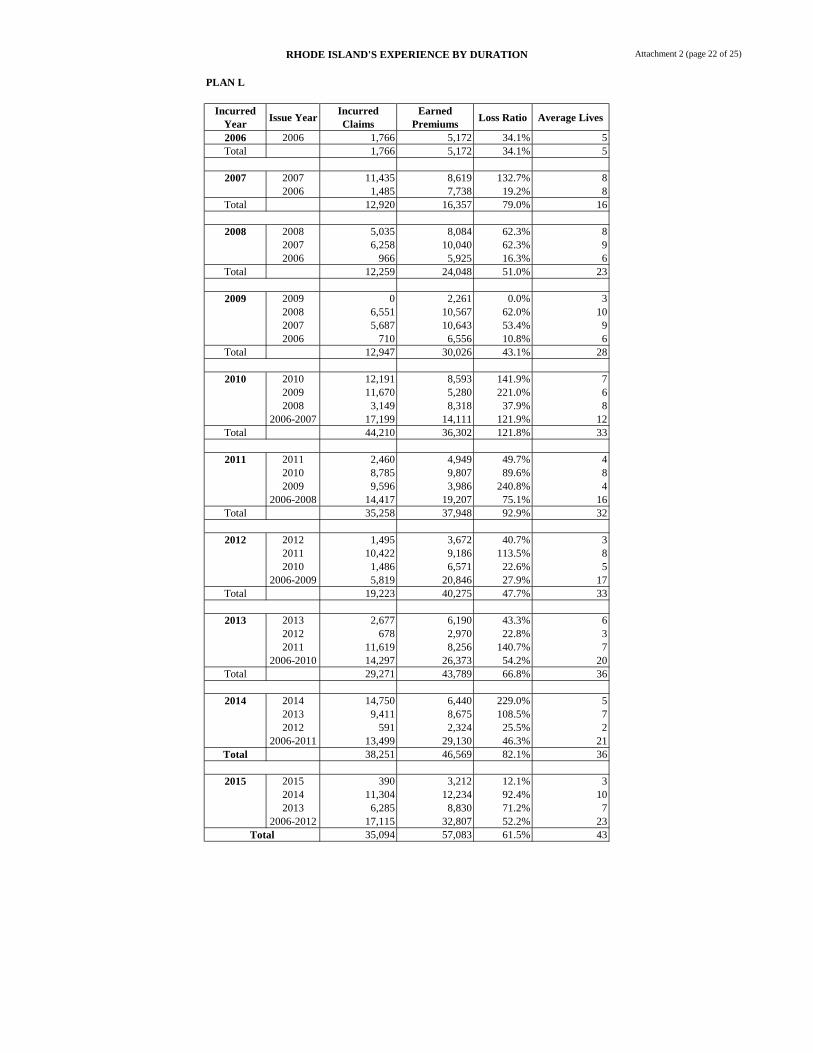
Attachment 2 (page 22 of 25)
PLAN L
Incurred Year
Issue YearIncurred Claims
Earned Premiums
Loss Ratio Average Lives
2006 2006 1,766 5,172 34.1% 5Total 1,766 5,172 34.1% 5
2007 2007 11,435 8,619 132.7% 82006 1,485 7,738 19.2% 8
Total 12,920 16,357 79.0% 16
2008 2008 5,035 8,084 62.3% 82007 6,258 10,040 62.3% 92006 966 5,925 16.3% 6
Total 12,259 24,048 51.0% 23
2009 2009 0 2,261 0.0% 32008 6,551 10,567 62.0% 102007 5,687 10,643 53.4% 92006 710 6,556 10.8% 6
Total 12,947 30,026 43.1% 28
2010 2010 12,191 8,593 141.9% 72009 11,670 5,280 221.0% 62008 3,149 8,318 37.9% 8
2006-2007 17,199 14,111 121.9% 12Total 44,210 36,302 121.8% 33
2011 2011 2,460 4,949 49.7% 42010 8,785 9,807 89.6% 82009 9,596 3,986 240.8% 4
2006-2008 14,417 19,207 75.1% 16Total 35,258 37,948 92.9% 32
2012 2012 1,495 3,672 40.7% 32011 10,422 9,186 113.5% 82010 1,486 6,571 22.6% 5
2006-2009 5,819 20,846 27.9% 17Total 19,223 40,275 47.7% 33
2013 2013 2,677 6,190 43.3% 62012 678 2,970 22.8% 32011 11,619 8,256 140.7% 7
2006-2010 14,297 26,373 54.2% 20Total 29,271 43,789 66.8% 36
2014 2014 14,750 6,440 229.0% 52013 9,411 8,675 108.5% 72012 591 2,324 25.5% 2
2006-2011 13,499 29,130 46.3% 21Total 38,251 46,569 82.1% 36
2015 2015 390 3,212 12.1% 32014 11,304 12,234 92.4% 102013 6,285 8,830 71.2% 7
2006-2012 17,115 32,807 52.2% 23Total 35,094 57,083 61.5% 43
RHODE ISLAND'S EXPERIENCE BY DURATION

Attachment 2 (page 23 of 25)
PLAN N
Incurred Year
Issue YearIncurred Claims
Earned Premiums
Loss Ratio Average Lives
2010 2010 7,751 16,307 47.5% 14Total 7,751 16,307 47.5% 14
2011 2011 283,161 343,537 82.4% 2662010 28,975 43,495 66.6% 38
Total 312,136 387,032 80.6% 304
2012 2012 142,958 197,810 72.3% 1712011 327,776 399,801 82.0% 3212010 50,453 35,288 143.0% 31
Total 521,188 632,900 82.3% 523
2013 2013 326,365 416,603 78.3% 3382012 225,789 307,314 73.5% 2622011 308,601 381,421 80.9% 2912010 43,506 33,083 131.5% 27
Total 904,260 1,138,420 79.4% 918
2014 2014 745,233 957,620 77.8% 6972013 495,888 610,090 81.3% 4782012 240,087 300,483 79.9% 235
2010-2011 309,928 404,457 76.6% 287Total 1,791,136 2,272,650 78.8% 1,697
2015 2015 496,166 703,853 70.5% 5272014 1,895,631 2,504,233 75.7% 1,7322013 479,289 567,570 84.4% 419
2010-2012 621,915 688,814 90.3% 482Total 3,493,001 4,464,470 78.2% 3,160
RHODE ISLAND'S EXPERIENCE BY DURATION

Attachment 2 (page 24 of 25)
Incurred Year
Issue YearIncurred Claims
Earned Premiums
Loss Ratio Average Lives
1998 1998 3,490,221 4,232,432 82.5% 3,138Total 3,490,221 4,232,432 82.5% 3,138
1999 1999 177,593 213,938 83.0% 1461998 3,174,051 3,944,321 80.5% 2,574
Total 3,351,644 4,158,259 80.6% 2,720
2000 2000 349,667 410,219 85.2% 2851999 332,620 408,612 81.4% 2661998 3,113,448 3,743,249 83.2% 2,371
Total 3,795,735 4,562,080 83.2% 2,922
2001 2001 224,844 358,135 62.8% 2322000 538,544 605,596 88.9% 3941999 355,408 408,410 87.0% 2461998 3,113,292 3,614,316 86.1% 2,228
Total 4,232,088 4,986,458 84.9% 3,100
2002 2002 296,940 380,604 78.0% 2462001 464,870 591,855 78.5% 3642000 500,212 574,867 87.0% 350
1998-1999 3,249,035 3,710,424 87.6% 2,229Total 4,511,057 5,257,750 85.8% 3,189
2003 2003 326,847 452,681 72.2% 2882002 609,222 685,300 88.9% 4192001 445,236 595,288 74.8% 332
1998-2000 3,744,014 4,202,965 89.1% 2,409Total 5,125,318 5,936,233 86.3% 3,447
2004 2004 303,711 438,777 69.2% 2552003 598,272 786,426 76.1% 4632002 632,344 690,366 91.6% 383
1998-2001 4,106,532 4,809,482 85.4% 2,576Total 5,640,860 6,725,051 83.9% 3,676
2005 2005 449,036 521,146 86.2% 2842004 616,433 765,760 80.5% 4232003 532,060 764,802 69.6% 415
1998-2002 4,521,831 5,277,314 85.7% 2,729Total 6,119,359 7,329,022 83.5% 3,851
2006 2006 710,741 757,118 93.9% 4702005 537,803 713,834 75.3% 4192004 525,393 647,558 81.1% 374
1998-2003 4,445,920 5,281,591 84.2% 2,873Total 6,219,856 7,400,101 84.1% 4,135
2007 2007 460,923 630,330 73.1% 3862006 917,286 1,169,395 78.4% 6972005 467,544 691,847 67.6% 388
1998-2004 4,721,178 5,675,334 83.2% 3,007Total 6,566,930 8,166,905 80.4% 4,479
2008 2008 572,462 653,606 87.6% 4232007 674,040 936,547 72.0% 5522006 833,104 1,116,048 74.6% 623
1998-2005 5,338,486 6,227,485 85.7% 3,180Total 7,418,093 8,933,686 83.0% 4,777
UHC TOTAL STANDARDIZED PLANS
RHODE ISLAND'S EXPERIENCE BY DURATION
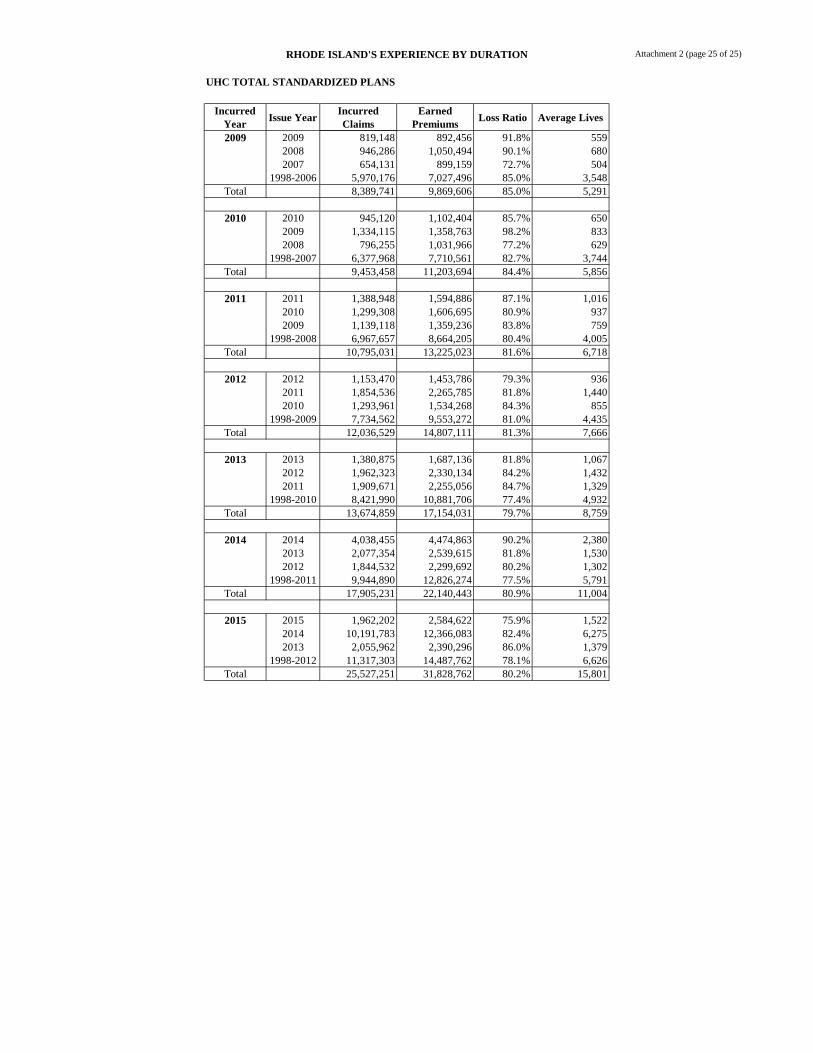
Attachment 2 (page 25 of 25)
Incurred Year
Issue YearIncurred Claims
Earned Premiums
Loss Ratio Average Lives
UHC TOTAL STANDARDIZED PLANS
RHODE ISLAND'S EXPERIENCE BY DURATION
2009 2009 819,148 892,456 91.8% 5592008 946,286 1,050,494 90.1% 6802007 654,131 899,159 72.7% 504
1998-2006 5,970,176 7,027,496 85.0% 3,548Total 8,389,741 9,869,606 85.0% 5,291
2010 2010 945,120 1,102,404 85.7% 6502009 1,334,115 1,358,763 98.2% 8332008 796,255 1,031,966 77.2% 629
1998-2007 6,377,968 7,710,561 82.7% 3,744Total 9,453,458 11,203,694 84.4% 5,856
2011 2011 1,388,948 1,594,886 87.1% 1,0162010 1,299,308 1,606,695 80.9% 9372009 1,139,118 1,359,236 83.8% 759
1998-2008 6,967,657 8,664,205 80.4% 4,005Total 10,795,031 13,225,023 81.6% 6,718
2012 2012 1,153,470 1,453,786 79.3% 9362011 1,854,536 2,265,785 81.8% 1,4402010 1,293,961 1,534,268 84.3% 855
1998-2009 7,734,562 9,553,272 81.0% 4,435Total 12,036,529 14,807,111 81.3% 7,666
2013 2013 1,380,875 1,687,136 81.8% 1,0672012 1,962,323 2,330,134 84.2% 1,4322011 1,909,671 2,255,056 84.7% 1,329
1998-2010 8,421,990 10,881,706 77.4% 4,932Total 13,674,859 17,154,031 79.7% 8,759
2014 2014 4,038,455 4,474,863 90.2% 2,3802013 2,077,354 2,539,615 81.8% 1,5302012 1,844,532 2,299,692 80.2% 1,302
1998-2011 9,944,890 12,826,274 77.5% 5,791Total 17,905,231 22,140,443 80.9% 11,004
2015 2015 1,962,202 2,584,622 75.9% 1,5222014 10,191,783 12,366,083 82.4% 6,2752013 2,055,962 2,390,296 86.0% 1,379
1998-2012 11,317,303 14,487,762 78.1% 6,626Total 25,527,251 31,828,762 80.2% 15,801

Attachment 3 (Page 1 of 4)
Per Member Per Month Costs*2012 2013 2014 2015 Proj 2016 Proj 2017
PLAN APart B Coinsurance $96.75 $108.61 $96.58 $94.85 $95.14 $96.45Long Hospital Stay $0.00 $0.00 $0.00 $1.36 $2.05 $2.05Total PMPM Cost $96.75 $108.61 $96.58 $96.21 $97.19 $98.50Trend 12.3% -11.1% -0.4% 1.0% 1.4%
PLAN BPart B Coinsurance $82.05 $129.86 $87.37 $79.51 $100.67 $100.44Part A Deductible $18.73 $23.53 $11.91 $16.64 $25.72 $26.84Long Hospital Stay $1.33 $0.00 $0.00 $1.35 $2.05 $2.05Total PMPM Cost $102.11 $153.40 $99.28 $97.50 $128.44 $129.33Trend 50.2% -35.3% -1.8% 31.7% 0.7%
PLAN CPart B Coinsurance $100.10 $97.00 $103.36 $105.07 $100.69 $100.44Part B Deductible $11.50 $12.07 $12.15 $12.09 $13.73 $14.73Part A Deductible $22.16 $21.18 $26.94 $25.23 $25.72 $26.84Long Hospital Stay $1.44 $0.71 $0.37 $1.35 $2.05 $2.05SNF Day 21-100 $18.48 $14.32 $31.39 $17.56 $17.93 $19.58Other $0.03 $0.02 $0.00 $0.05 $0.20 $0.20Total PMPM Cost $153.71 $145.31 $174.21 $161.35 $160.31 $163.83Trend -5.5% 19.9% -7.4% -0.6% 2.2%
PLAN DPart B Coinsurance $122.14 $101.42 $135.14 $124.05 $100.69 $100.44Part A Deductible $35.77 $28.65 $56.64 $50.03 $25.72 $26.84Long Hospital Stay $0.00 $0.00 $0.00 $1.35 $2.05 $2.05SNF Day 21-100 $0.47 $99.05 $31.40 $73.78 $17.93 $19.58Other $0.00 $0.00 $0.00 $0.00 $0.20 $0.20Total PMPM Cost $158.38 $229.12 $223.18 $249.21 $146.59 $149.10Trend 44.7% -2.6% 11.7% -41.2% 1.7%
PLAN EPart B Coinsurance $120.17 $96.46 $93.07 $107.68 $100.66 $100.44Part A Deductible $29.31 $22.34 $25.62 $34.19 $25.72 $26.84Long Hospital Stay $0.00 $0.00 $0.00 $1.35 $2.05 $2.05SNF Day 21-100 $30.63 $28.86 $28.24 $7.82 $17.93 $19.58Other $0.23 $0.03 $0.00 $0.05 $0.10 $0.10Total PMPM Cost $180.33 $147.69 $146.93 $151.09 $146.46 $149.00Trend -18.1% -0.5% 2.8% -3.1% 1.7%
PLAN FPart B Coinsurance $99.33 $98.06 $102.91 $100.13 $100.67 $100.44Part B Deductible $11.60 $12.14 $12.22 $12.12 $13.73 $14.73Part B Excess Charges $0.08 $0.04 $0.05 $0.05 $0.10 $0.10Part A Deductible $19.61 $19.63 $20.92 $23.62 $25.72 $26.84Long Hospital Stay $0.42 $0.85 $0.85 $2.36 $2.05 $2.05SNF Day 21-100 $8.89 $12.12 $12.84 $14.12 $17.93 $19.58Other $0.01 $0.02 $0.91 $0.73 $0.20 $0.20Total PMPM Cost $139.94 $142.85 $150.71 $153.13 $160.40 $163.93Trend 2.1% 5.5% 1.6% 4.7% 2.2%
PLAN GPart B Coinsurance $131.68 $110.69 $109.50 $121.25 $100.70 $100.44
Part B Excess Charges $0.06 $0.14 $0.00 $0.00 $0.08 $0.08Part A Deductible $35.47 $25.57 $24.79 $34.19 $25.71 $26.84Long Hospital Stay $23.32 $0.00 $0.00 $1.35 $2.05 $2.05SNF Day 21-100 $6.83 $5.91 $7.31 $24.63 $17.93 $19.58Other $0.00 $0.00 $0.00 $0.00 $0.20 $0.20
Total PMPM Cost $197.37 $142.31 $141.60 $181.42 $146.68 $149.18Trend -27.9% -0.5% 28.1% -19.1% 1.7%
RHODE ISLAND BENEFIT COSTS1990 PLANS
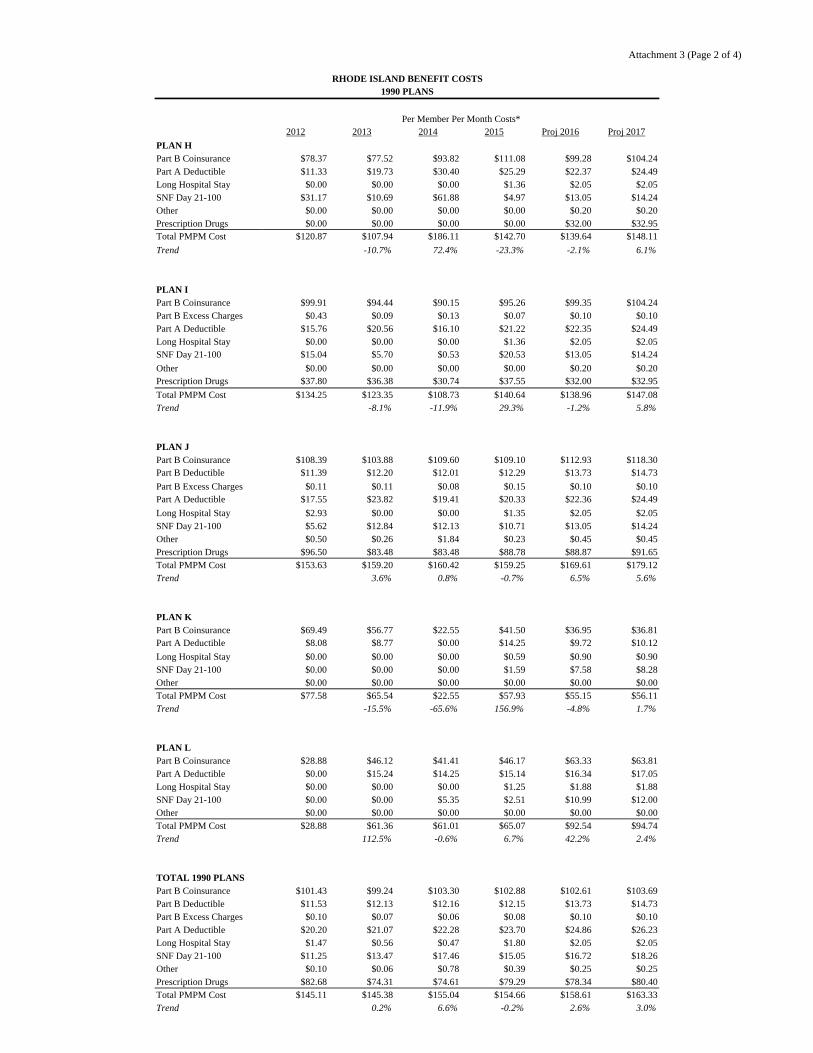
Attachment 3 (Page 2 of 4)
1990 PLANS
Per Member Per Month Costs*2012 2013 2014 2015 Proj 2016 Proj 2017
PLAN HPart B Coinsurance $78.37 $77.52 $93.82 $111.08 $99.28 $104.24Part A Deductible $11.33 $19.73 $30.40 $25.29 $22.37 $24.49Long Hospital Stay $0.00 $0.00 $0.00 $1.36 $2.05 $2.05SNF Day 21-100 $31.17 $10.69 $61.88 $4.97 $13.05 $14.24Other $0.00 $0.00 $0.00 $0.00 $0.20 $0.20Prescription Drugs $0.00 $0.00 $0.00 $0.00 $32.00 $32.95Total PMPM Cost $120.87 $107.94 $186.11 $142.70 $139.64 $148.11
Trend -10.7% 72.4% -23.3% -2.1% 6.1%
PLAN IPart B Coinsurance $99.91 $94.44 $90.15 $95.26 $99.35 $104.24Part B Excess Charges $0.43 $0.09 $0.13 $0.07 $0.10 $0.10Part A Deductible $15.76 $20.56 $16.10 $21.22 $22.35 $24.49Long Hospital Stay $0.00 $0.00 $0.00 $1.36 $2.05 $2.05SNF Day 21-100 $15.04 $5.70 $0.53 $20.53 $13.05 $14.24
Other $0.00 $0.00 $0.00 $0.00 $0.20 $0.20Prescription Drugs $37.80 $36.38 $30.74 $37.55 $32.00 $32.95
Total PMPM Cost $134.25 $123.35 $108.73 $140.64 $138.96 $147.08Trend -8.1% -11.9% 29.3% -1.2% 5.8%
PLAN JPart B Coinsurance $108.39 $103.88 $109.60 $109.10 $112.93 $118.30Part B Deductible $11.39 $12.20 $12.01 $12.29 $13.73 $14.73
Part B Excess Charges $0.11 $0.11 $0.08 $0.15 $0.10 $0.10Part A Deductible $17.55 $23.82 $19.41 $20.33 $22.36 $24.49
Long Hospital Stay $2.93 $0.00 $0.00 $1.35 $2.05 $2.05SNF Day 21-100 $5.62 $12.84 $12.13 $10.71 $13.05 $14.24Other $0.50 $0.26 $1.84 $0.23 $0.45 $0.45Prescription Drugs $96.50 $83.48 $83.48 $88.78 $88.87 $91.65Total PMPM Cost $153.63 $159.20 $160.42 $159.25 $169.61 $179.12Trend 3.6% 0.8% -0.7% 6.5% 5.6%
PLAN KPart B Coinsurance $69.49 $56.77 $22.55 $41.50 $36.95 $36.81Part A Deductible $8.08 $8.77 $0.00 $14.25 $9.72 $10.12
Long Hospital Stay $0.00 $0.00 $0.00 $0.59 $0.90 $0.90SNF Day 21-100 $0.00 $0.00 $0.00 $1.59 $7.58 $8.28Other $0.00 $0.00 $0.00 $0.00 $0.00 $0.00Total PMPM Cost $77.58 $65.54 $22.55 $57.93 $55.15 $56.11Trend -15.5% -65.6% 156.9% -4.8% 1.7%
PLAN LPart B Coinsurance $28.88 $46.12 $41.41 $46.17 $63.33 $63.81Part A Deductible $0.00 $15.24 $14.25 $15.14 $16.34 $17.05Long Hospital Stay $0.00 $0.00 $0.00 $1.25 $1.88 $1.88SNF Day 21-100 $0.00 $0.00 $5.35 $2.51 $10.99 $12.00Other $0.00 $0.00 $0.00 $0.00 $0.00 $0.00Total PMPM Cost $28.88 $61.36 $61.01 $65.07 $92.54 $94.74Trend 112.5% -0.6% 6.7% 42.2% 2.4%
TOTAL 1990 PLANSPart B Coinsurance $101.43 $99.24 $103.30 $102.88 $102.61 $103.69Part B Deductible $11.53 $12.13 $12.16 $12.15 $13.73 $14.73Part B Excess Charges $0.10 $0.07 $0.06 $0.08 $0.10 $0.10Part A Deductible $20.20 $21.07 $22.28 $23.70 $24.86 $26.23Long Hospital Stay $1.47 $0.56 $0.47 $1.80 $2.05 $2.05SNF Day 21-100 $11.25 $13.47 $17.46 $15.05 $16.72 $18.26Other $0.10 $0.06 $0.78 $0.39 $0.25 $0.25Prescription Drugs $82.68 $74.31 $74.61 $79.29 $78.34 $80.40Total PMPM Cost $145.11 $145.38 $155.04 $154.66 $158.61 $163.33Trend 0.2% 6.6% -0.2% 2.6% 3.0%
RHODE ISLAND BENEFIT COSTS
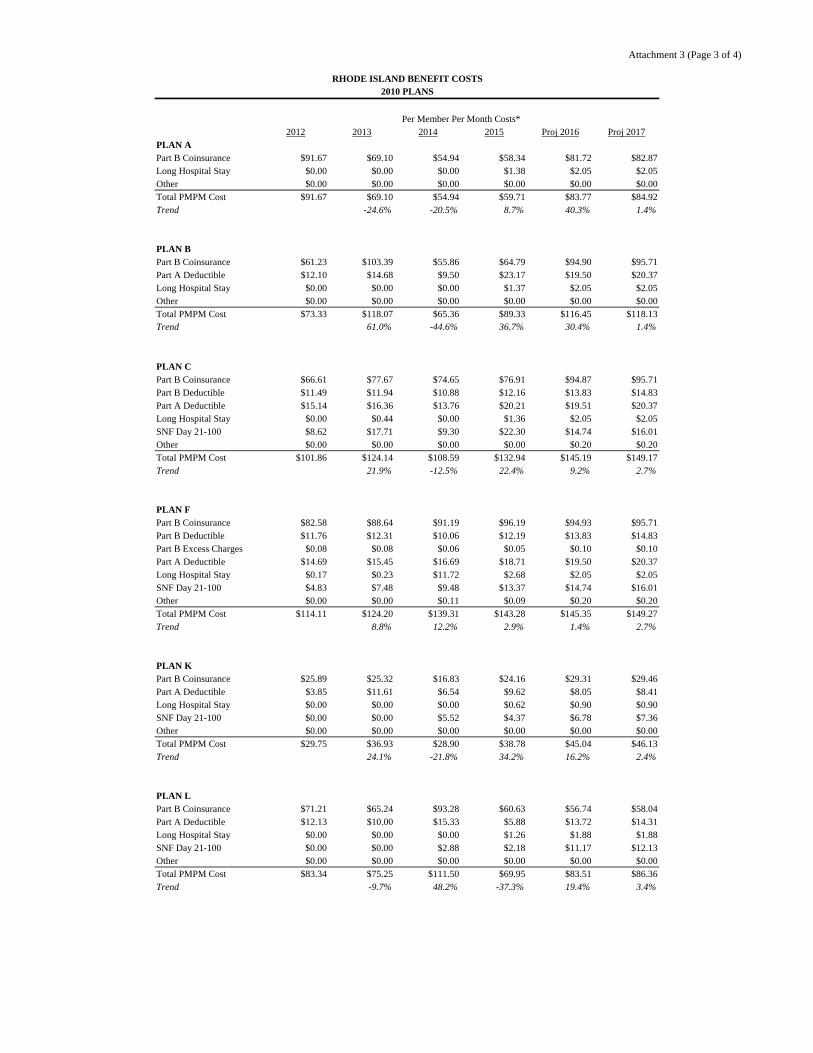
Attachment 3 (Page 3 of 4)
2010 PLANS
2012 2013 2014 2015 Proj 2016 Proj 2017PLAN APart B Coinsurance $91.67 $69.10 $54.94 $58.34 $81.72 $82.87Long Hospital Stay $0.00 $0.00 $0.00 $1.38 $2.05 $2.05Other $0.00 $0.00 $0.00 $0.00 $0.00 $0.00Total PMPM Cost $91.67 $69.10 $54.94 $59.71 $83.77 $84.92Trend -24.6% -20.5% 8.7% 40.3% 1.4%
PLAN BPart B Coinsurance $61.23 $103.39 $55.86 $64.79 $94.90 $95.71Part A Deductible $12.10 $14.68 $9.50 $23.17 $19.50 $20.37Long Hospital Stay $0.00 $0.00 $0.00 $1.37 $2.05 $2.05Other $0.00 $0.00 $0.00 $0.00 $0.00 $0.00Total PMPM Cost $73.33 $118.07 $65.36 $89.33 $116.45 $118.13Trend 61.0% -44.6% 36.7% 30.4% 1.4%
PLAN CPart B Coinsurance $66.61 $77.67 $74.65 $76.91 $94.87 $95.71Part B Deductible $11.49 $11.94 $10.88 $12.16 $13.83 $14.83Part A Deductible $15.14 $16.36 $13.76 $20.21 $19.51 $20.37Long Hospital Stay $0.00 $0.44 $0.00 $1.36 $2.05 $2.05SNF Day 21-100 $8.62 $17.71 $9.30 $22.30 $14.74 $16.01Other $0.00 $0.00 $0.00 $0.00 $0.20 $0.20Total PMPM Cost $101.86 $124.14 $108.59 $132.94 $145.19 $149.17Trend 21.9% -12.5% 22.4% 9.2% 2.7%
PLAN FPart B Coinsurance $82.58 $88.64 $91.19 $96.19 $94.93 $95.71Part B Deductible $11.76 $12.31 $10.06 $12.19 $13.83 $14.83Part B Excess Charges $0.08 $0.08 $0.06 $0.05 $0.10 $0.10Part A Deductible $14.69 $15.45 $16.69 $18.71 $19.50 $20.37Long Hospital Stay $0.17 $0.23 $11.72 $2.68 $2.05 $2.05SNF Day 21-100 $4.83 $7.48 $9.48 $13.37 $14.74 $16.01Other $0.00 $0.00 $0.11 $0.09 $0.20 $0.20Total PMPM Cost $114.11 $124.20 $139.31 $143.28 $145.35 $149.27Trend 8.8% 12.2% 2.9% 1.4% 2.7%
PLAN KPart B Coinsurance $25.89 $25.32 $16.83 $24.16 $29.31 $29.46Part A Deductible $3.85 $11.61 $6.54 $9.62 $8.05 $8.41Long Hospital Stay $0.00 $0.00 $0.00 $0.62 $0.90 $0.90SNF Day 21-100 $0.00 $0.00 $5.52 $4.37 $6.78 $7.36Other $0.00 $0.00 $0.00 $0.00 $0.00 $0.00Total PMPM Cost $29.75 $36.93 $28.90 $38.78 $45.04 $46.13Trend 24.1% -21.8% 34.2% 16.2% 2.4%
PLAN LPart B Coinsurance $71.21 $65.24 $93.28 $60.63 $56.74 $58.04Part A Deductible $12.13 $10.00 $15.33 $5.88 $13.72 $14.31Long Hospital Stay $0.00 $0.00 $0.00 $1.26 $1.88 $1.88SNF Day 21-100 $0.00 $0.00 $2.88 $2.18 $11.17 $12.13Other $0.00 $0.00 $0.00 $0.00 $0.00 $0.00Total PMPM Cost $83.34 $75.25 $111.50 $69.95 $83.51 $86.36Trend -9.7% 48.2% -37.3% 19.4% 3.4%
Per Member Per Month Costs*
RHODE ISLAND BENEFIT COSTS

Attachment 3 (Page 4 of 4)
2010 PLANS
2012 2013 2014 2015 Proj 2016 Proj 2017PLAN NPart B Coinsurance $56.32 $58.91 $61.84 $66.07 $66.93 $68.55Part A Deductible $15.10 $14.63 $16.25 $16.43 $16.87 $17.54Long Hospital Stay $3.59 $0.00 $0.73 $1.43 $2.05 $2.05SNF Day 21-100 $8.02 $8.53 $9.07 $8.09 $9.63 $10.35Other $0.00 $0.01 $0.06 $0.09 $0.20 $0.20Total PMPM Cost $83.04 $82.08 $87.96 $92.11 $95.68 $98.69Trend -1.2% 7.2% 4.7% 3.9% 3.1%
TOTAL 2010 PLANS Part B Coinsurance $75.89 $80.89 $82.25 $86.78 $86.82 $87.57Part B Deductible $11.74 $12.29 $10.11 $12.19 $13.83 $14.83Part B Excess Charges $0.08 $0.08 $0.06 $0.05 $0.10 $0.10
Part A Deductible $14.66 $15.25 $16.34 $18.07 $18.70 $19.49Long Hospital Stay $0.80 $0.18 $8.25 $2.28 $2.04 $2.04SNF Day 21-100 $5.64 $8.17 $9.32 $12.13 $13.29 $14.35Other $0.00 $0.00 $0.09 $0.08 $0.20 $0.20Total PMPM Cost $105.86 $113.54 $123.44 $127.96 $130.84 $134.01Trend 7.3% 8.7% 3.7% 2.2% 2.4%
TOTAL STANDARDIZED PLANS (1990 & 2010 Plans Combined)Part B Coinsurance $92.15 $90.44 $90.35 $90.80 $90.16 $90.50Part B Deductible $11.60 $12.20 $10.99 $12.18 $13.81 $14.81Part B Excess Charges $0.09 $0.08 $0.06 $0.06 $0.10 $0.10Part A Deductible $18.17 $18.26 $18.61 $19.46 $19.99 $20.69Long Hospital Stay $1.22 $0.38 $5.26 $2.16 $2.04 $2.04SNF Day 21-100 $9.19 $10.90 $12.41 $12.84 $14.00 $15.04Other $0.07 $0.03 $0.35 $0.16 $0.21 $0.21Prescription Drugs $82.68 $74.31 $74.61 $79.29 $78.34 $80.40Total PMPM Cost $130.85 $130.11 $135.60 $134.63 $136.72 $139.32Trend -0.6% 4.2% -0.7% 1.6% 1.9%
"Other" includes hospice care, foreign care, home health care, and/or preventive care benefit depending on the plan.
*The per member per month cost is equal to the incurred claims divided by the number of lives with that specific benefit.
Per Member Per Month Costs*
RHODE ISLAND BENEFIT COSTS

Attachment 4
ProposedPlan 2017* 2016*
A $1,507 $1,426B $2,137 $2,022C $2,565 $2,428D $2,326 $2,211E $2,338 $2,211F $2,577 $2,430G $2,347 $2,224H $2,270 $2,269I $2,254 $2,249J $2,614 $2,595K $806 $795L $1,537 $1,460
Total 1990 Plans $2,525 $2,414
ProposedPlan 2017* 2016*
A $1,360 $1,255B $1,808 $1,728C $2,172 $2,088F $2,180 $2,083K $720 $741L $1,307 $1,258N $1,551 $1,478
Total 2010 Plans $1,989 $1,905
2010 PlansRhode Island Average Annualized Premiums
Rhode Island Average Annualized Premiums1990 Plans
*Average premiums are net of discounts.
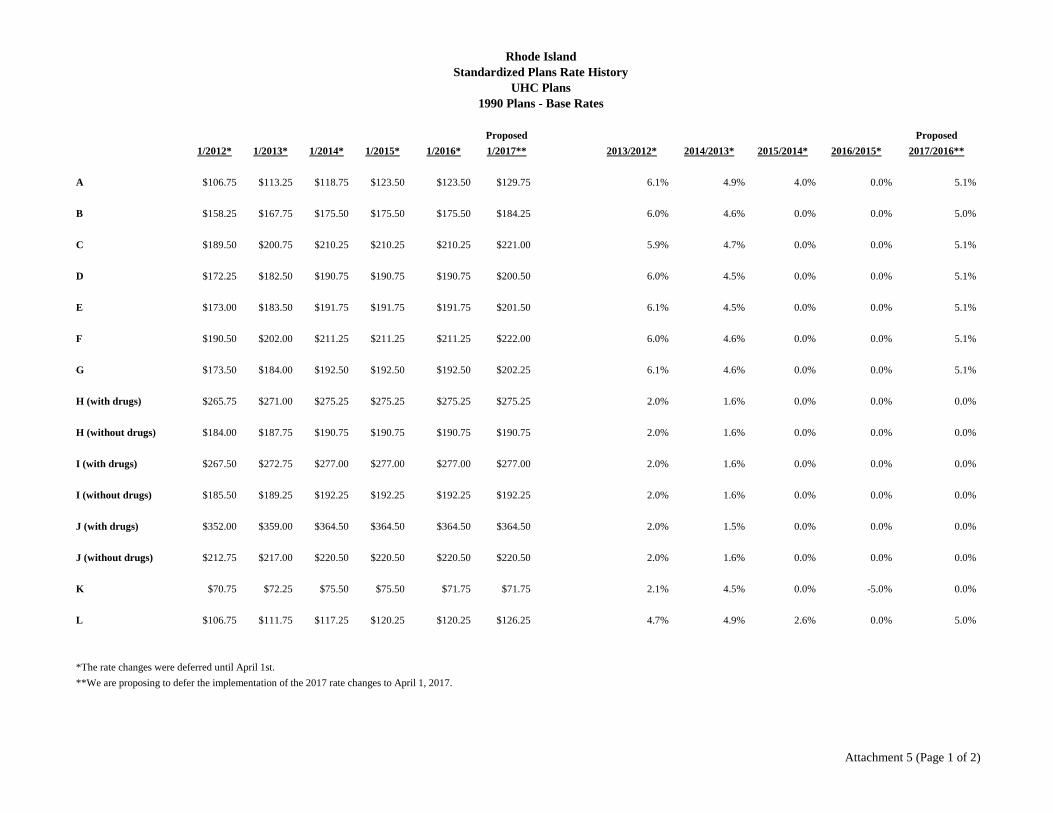
Rhode IslandStandardized Plans Rate History
UHC Plans1990 Plans - Base Rates
Proposed Proposed
1/2012* 1/2013* 1/2014* 1/2015* 1/2016* 1/2017** 2013/2012* 2014/2013* 2015/2014* 2016/2015* 2017/2016**
A $106.75 $113.25 $118.75 $123.50 $123.50 $129.75 6.1% 4.9% 4.0% 0.0% 5.1%
B $158.25 $167.75 $175.50 $175.50 $175.50 $184.25 6.0% 4.6% 0.0% 0.0% 5.0%
C $189.50 $200.75 $210.25 $210.25 $210.25 $221.00 5.9% 4.7% 0.0% 0.0% 5.1%
D $172.25 $182.50 $190.75 $190.75 $190.75 $200.50 6.0% 4.5% 0.0% 0.0% 5.1%
E $173.00 $183.50 $191.75 $191.75 $191.75 $201.50 6.1% 4.5% 0.0% 0.0% 5.1%
F $190.50 $202.00 $211.25 $211.25 $211.25 $222.00 6.0% 4.6% 0.0% 0.0% 5.1%
G $173.50 $184.00 $192.50 $192.50 $192.50 $202.25 6.1% 4.6% 0.0% 0.0% 5.1%
H (with drugs) $265.75 $271.00 $275.25 $275.25 $275.25 $275.25 2.0% 1.6% 0.0% 0.0% 0.0%
H (without drugs) $184.00 $187.75 $190.75 $190.75 $190.75 $190.75 2.0% 1.6% 0.0% 0.0% 0.0%
I (with drugs) $267.50 $272.75 $277.00 $277.00 $277.00 $277.00 2.0% 1.6% 0.0% 0.0% 0.0%
I (without drugs) $185.50 $189.25 $192.25 $192.25 $192.25 $192.25 2.0% 1.6% 0.0% 0.0% 0.0%
J (with drugs) $352.00 $359.00 $364.50 $364.50 $364.50 $364.50 2.0% 1.5% 0.0% 0.0% 0.0%
J (without drugs) $212.75 $217.00 $220.50 $220.50 $220.50 $220.50 2.0% 1.6% 0.0% 0.0% 0.0%
K $70.75 $72.25 $75.50 $75.50 $71.75 $71.75 2.1% 4.5% 0.0% -5.0% 0.0%
L $106.75 $111.75 $117.25 $120.25 $120.25 $126.25 4.7% 4.9% 2.6% 0.0% 5.0%
*The rate changes were deferred until April 1st.
**We are proposing to defer the implementation of the 2017 rate changes to April 1, 2017.
Attachment 5 (Page 1 of 2)

Rhode IslandStandardized Plans Rate History
UHC Plans2010 Plans - Non-Tobacco User Base Rates
Proposed Proposed
1/2012* 1/2013* 1/2014* 1/2015* 1/2016* 1/2017** 2013/2012* 2014/2013* 2015/2014* 2016/2015* 2017/2016**
A $97.50 $103.25 $108.25 $112.50 $112.50 $118.25 5.9% 4.8% 3.9% 0.0% 5.1%
B $147.50 $156.25 $163.25 $163.25 $163.25 $171.25 5.9% 4.5% 0.0% 0.0% 4.9%
C $176.50 $187.00 $195.75 $195.75 $195.75 $205.50 5.9% 4.7% 0.0% 0.0% 5.0%
F $177.25 $188.00 $196.50 $196.50 $196.50 $206.25 6.1% 4.5% 0.0% 0.0% 5.0%
K $64.75 $66.00 $69.00 $69.00 $65.50 $65.50 1.9% 4.5% 0.0% -5.1% 0.0%
L $99.25 $103.75 $108.75 $111.50 $111.50 $117.00 4.5% 4.8% 2.5% 0.0% 4.9%
N $109.75 $116.25 $123.75 $128.50 $133.50 $140.25 5.9% 6.5% 3.8% 3.9% 5.1%
*The rate changes were deferred until April 1st.
**We are proposing to defer the implementation of the 2017 rate changes to April 1, 2017.
Attachment 5 (Page 2 of 2)
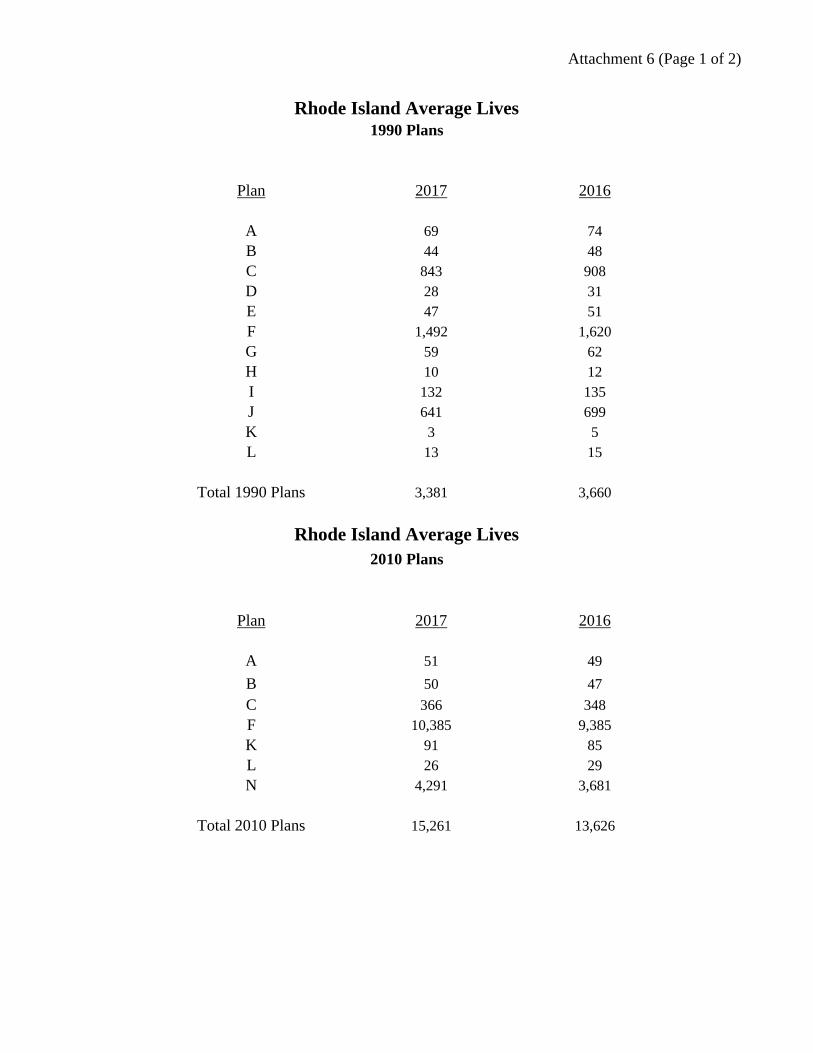
Attachment 6 (Page 1 of 2)
Plan 2017 2016
A 69 74B 44 48C 843 908D 28 31E 47 51F 1,492 1,620G 59 62H 10 12I 132 135J 641 699K 3 5L 13 15
Total 1990 Plans 3,381 3,660
Plan 2017 2016
A 51 49
B 50 47
C 366 348F 10,385 9,385K 91 85L 26 29N 4,291 3,681
Total 2010 Plans 15,261 13,626
2010 Plans
Rhode Island Average Lives
Rhode Island Average Lives1990 Plans
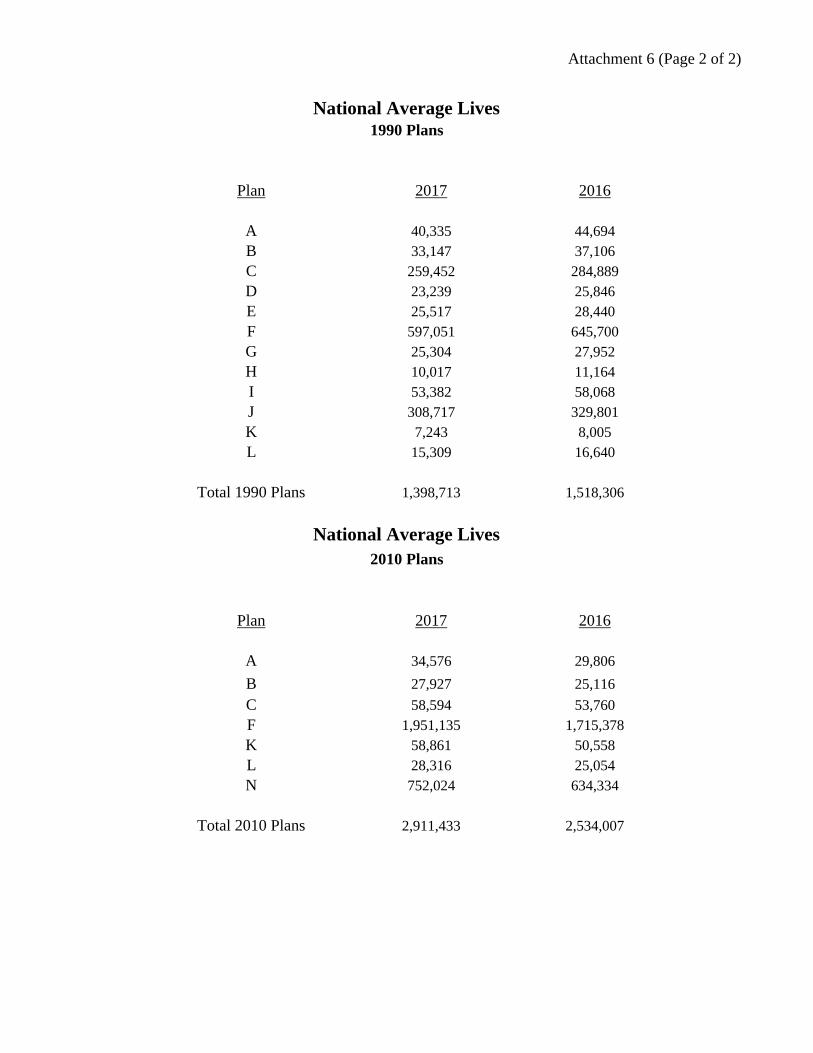
Attachment 6 (Page 2 of 2)
Plan 2017 2016
A 40,335 44,694B 33,147 37,106C 259,452 284,889D 23,239 25,846E 25,517 28,440F 597,051 645,700G 25,304 27,952H 10,017 11,164I 53,382 58,068J 308,717 329,801K 7,243 8,005L 15,309 16,640
Total 1990 Plans 1,398,713 1,518,306
Plan 2017 2016
A 34,576 29,806
B 27,927 25,116
C 58,594 53,760F 1,951,135 1,715,378K 58,861 50,558L 28,316 25,054N 752,024 634,334
Total 2010 Plans 2,911,433 2,534,007
2010 Plans
National Average Lives
National Average Lives1990 Plans

Attachment 7
Rhode Island Medicare SupplementTotal Standardized Plans Trend Development
The components of the composite trend are shown below.
Part B Coinsurance2014 2015 2016 2017
Medicare Fee Update 0.2% 0.4% -0.2% 0.9%Utilization Trend -0.3% 0.1% -0.5% -0.6%Composite Trend -0.1% 0.5% -0.7% 0.4%
The net change in the cost for Part B services in 2016 was -0.2%. For 2017, we assume a net change of 0.9%.
Utilization trend considers changes in the number of services used as well as the intensity of services.Our assumed utilization trends for 2016 and 2017 are -0.5% and -0.6%, respectively.
Part B Deductible -- For 2017 we assume the Part B deductible will be $178, an increase of 7.2% over 2016.The projected Part B deductible trend is 13.3% for 2016 and 7.3% for 2017.
Part B Excess -- Projected claim costs for 2016 and 2017 are based on actuarial judgmentand are $0.10 and $0.10, respectively.
Part A Deductible --
2014 2015 2016 2017Medicare Part A Deductible $1,216 $1,260 $1,288 $1,332% Change in Part A Deductible 2.7% 3.6% 2.2% 3.4%Utilization Trend -0.8% 0.9% 0.5% 0.1%Composite Trend 1.9% 4.6% 2.7% 3.5%
Hospital Co-Payments -- Hospital Co-payments are paid for days 61 and after for long hospital stays.Projected claim costs for 2016 and 2017 are based on actuarial judgment and are $2.04 and $2.04, respectively.
Skilled Nursing -- Medicare Supplement plans which have a skilled nursing facility stay benefit pay theMedicare cost sharing amount for days 21-100.
2014 2015 2016 2017Medicare Daily Coinsurance $152 $158 $161 $167% Change in Daily Coinsurance 2.7% 3.6% 2.2% 3.4%Utilization/Length of Stay, days 21-100 10.8% -0.1% 6.7% 3.9%Composite Trend 13.8% 3.5% 9.0% 7.4%
Foreign Care/ At-Home Care/ Preventive Care / Prescription Drugs -- In aggregate, these benefitsrepresent less than 1% of the total Rhode Island claim costs. Projected costs for these benefits were based onhistorical experience and actuarial judgment.

Attachment 8 (Page 1 of 7)RHODE ISLAND HISTORICAL AND PROJECTED LOSS RATIOS(Years 1997 and Prior are Prudential's Experience)
Premium Incurred ClaimsAccumulated Incurred Accumulated Incurred
PLAN A Premium to 12/16 Claims to 12/16 Loss Ratioa b c d d/b
Prudential Experience1992 $4,586 $15,156 $649 $2,145 14.2%1993 $18,768 $59,070 $6,096 $19,186 32.5%1994 $33,985 $101,870 $21,361 $64,029 62.9%1995 $44,501 $127,040 $31,034 $88,595 69.7%1996 $71,925 $195,550 $62,125 $168,908 86.4%1997 $85,292 $220,850 $77,767 $201,366 91.2%Total $259,056 $719,535 $199,032 $544,230 75.6%
UnitedHealthcare Experience1998 $87,049 $214,668 $58,697 $144,749 67.4%1999 $73,980 $173,750 $60,170 $141,316 81.3%2000 $84,505 $189,018 $55,603 $124,373 65.8%2001 $92,580 $197,221 $80,274 $171,004 86.7%2002 $85,816 $174,106 $81,641 $165,636 95.1%2003 $95,490 $184,507 $76,406 $147,633 80.0%2004 $110,938 $204,149 $70,139 $129,071 63.2%2005 $107,727 $188,799 $57,716 $101,152 53.6%2006 $127,425 $212,687 $69,707 $116,349 54.7%2007 $137,298 $218,254 $107,497 $170,881 78.3%2008 $132,618 $200,775 $86,681 $131,231 65.4%2009 $150,385 $216,833 $101,936 $146,976 67.8%2010 $157,347 $216,067 $135,383 $185,906 86.0%2011 $162,191 $212,113 $153,343 $200,541 94.5%2012 $162,467 $202,357 $158,242 $197,094 97.4%2013 $157,634 $186,987 $150,546 $178,580 95.5%2014 $162,095 $183,123 $125,797 $142,117 77.6%2015 $169,487 $182,356 $126,042 $135,612 74.4%2016 $167,318 $171,450 $135,768 $139,121 81.1%Total $2,424,350 $3,729,222 $1,891,589 $2,869,343 76.9%
Expected Future Experience2017 $171,437 $167,306 $133,708 $130,486 78.0%2018 $185,463 $172,374 $142,865 $132,783 77.0%2019 $198,163 $175,408 $152,648 $135,120 77.0%2020 $211,733 $178,495 $163,101 $137,498 77.0%2021 $226,233 $181,637 $174,271 $139,918 77.0%
2022 $241,725 $184,834 $186,205 $142,380 77.0%
2023 $258,279 $188,087 $198,956 $144,886 77.0%2024 $275,965 $191,397 $212,580 $147,436 77.0%2025 $294,864 $194,766 $227,138 $150,031 77.0%2026 $315,056 $198,193 $242,692 $152,671 77.0%
Expected Future (2017-2026) $2,378,918 $1,832,496 $1,834,164 $1,413,208 77.1%Aggregate (1992-2026) $5,062,324 $6,281,253 $3,924,786 $4,826,780 76.8%
Premium Incurred ClaimsAccumulated Incurred Accumulated Incurred
PLAN B Premium to 12/16 Claims to 12/16 Loss Ratioa b c d d/b
Prudential Experience1992 $13,882 $45,876 $12,645 $41,788 91.1%1993 $43,894 $138,151 $47,357 $149,050 107.9%1994 $55,076 $165,090 $41,852 $125,453 76.0%1995 $65,088 $185,811 $49,585 $141,554 76.2%1996 $114,761 $312,016 $112,898 $306,950 98.4%1997 $121,170 $313,751 $117,154 $303,352 96.7%Total $413,871 $1,160,695 $381,491 $1,068,147 92.0%
UnitedHealthcare Experience1998 $75,797 $186,920 $73,717 $181,790 97.3%1999 $64,254 $150,908 $65,770 $154,468 102.4%2000 $57,975 $129,677 $52,527 $117,491 90.6%2001 $53,825 $114,662 $40,655 $86,607 75.5%2002 $51,283 $104,045 $36,132 $73,306 70.5%2003 $59,263 $114,508 $47,074 $90,957 79.4%2004 $84,427 $155,363 $78,500 $144,457 93.0%2005 $97,285 $170,499 $94,385 $165,417 97.0%2006 $115,760 $193,217 $94,280 $157,364 81.4%2007 $128,686 $204,564 $115,151 $183,049 89.5%2008 $145,998 $221,033 $101,024 $152,945 69.2%2009 $166,951 $240,718 $136,405 $196,675 81.7%2010 $176,120 $241,846 $135,420 $185,957 76.9%2011 $171,868 $224,769 $132,220 $172,917 76.9%2012 $187,024 $232,943 $116,745 $145,408 62.4%2013 $196,396 $232,967 $180,627 $214,262 92.0%2014 $192,138 $217,063 $104,447 $117,997 54.4%2015 $177,190 $190,644 $106,194 $114,258 59.9%2016 $178,578 $182,988 $139,853 $143,307 78.3%Total $2,380,818 $3,509,335 $1,851,128 $2,798,633 79.7%
Expected Future Experience2017 $181,265 $176,897 $138,486 $135,148 76.4%
2018 $194,176 $180,473 $147,969 $137,527 76.2%2019 $207,473 $183,649 $158,102 $139,947 76.2%2020 $221,681 $186,881 $168,929 $142,411 76.2%2021 $236,862 $190,170 $180,497 $144,917 76.2%2022 $253,082 $193,517 $192,858 $147,468 76.2%2023 $270,413 $196,923 $206,065 $150,063 76.2%2024 $288,931 $200,389 $220,176 $152,704 76.2%2025 $308,717 $203,916 $235,254 $155,392 76.2%2026 $329,858 $207,505 $251,364 $158,127 76.2%
Expected Future (2017-2026) $2,492,457 $1,920,321 $1,899,701 $1,463,703 76.2%Aggregate (1992-2026) $5,287,146 $6,590,351 $4,132,321 $5,330,484 80.9%
Assumption: Interest rate is 5%.

Attachment 8 (Page 2 of 7)RHODE ISLAND HISTORICAL AND PROJECTED LOSS RATIOS(Years 1997 and Prior are Prudential's Experience)
Premium Incurred Claims
Accumulated Incurred Accumulated IncurredPLAN C Premium to 12/16 Claims to 12/16 Loss Ratio
a b c d d/b
Prudential Experience1992 $34,302 $113,359 $20,411 $67,453 59.5%1993 $206,358 $649,486 $145,847 $459,035 70.7%1994 $556,968 $1,669,512 $474,393 $1,421,995 85.2%1995 $877,037 $2,503,732 $875,407 $2,499,080 99.8%1996 $1,518,727 $4,129,148 $1,437,272 $3,907,684 94.6%1997 $1,625,144 $4,208,072 $1,405,006 $3,638,057 86.5%Total $4,818,536 $13,273,309 $4,358,337 $11,993,305 90.4%
UnitedHealthcare Experience1998 $1,406,557 $3,468,642 $1,159,394 $2,859,123 82.4%1999 $1,297,098 $3,046,390 $994,276 $2,335,176 76.7%2000 $1,497,399 $3,349,352 $1,253,679 $2,804,206 83.7%2001 $1,677,138 $3,572,753 $1,430,682 $3,047,735 85.3%2002 $1,718,027 $3,485,578 $1,605,640 $3,257,564 93.5%2003 $1,958,418 $3,784,085 $1,686,022 $3,257,757 86.1%2004 $2,131,173 $3,921,796 $1,700,949 $3,130,095 79.8%2005 $2,190,847 $3,839,626 $1,824,409 $3,197,415 83.3%2006 $2,382,490 $3,976,662 $2,206,000 $3,682,079 92.6%2007 $2,527,368 $4,017,601 $2,095,266 $3,330,715 82.9%2008 $2,621,759 $3,969,189 $2,264,045 $3,427,631 86.4%2009 $2,683,824 $3,869,669 $2,291,140 $3,303,478 85.4%2010 $2,866,048 $3,935,627 $2,490,937 $3,420,528 86.9%2011 $2,993,383 $3,914,744 $2,434,274 $3,183,542 81.3%2012 $2,967,608 $3,696,225 $2,488,531 $3,099,523 83.9%2013 $3,016,350 $3,578,033 $2,328,046 $2,761,557 77.2%2014 $3,081,370 $3,481,104 $2,552,758 $2,883,918 82.8%2015 $3,116,074 $3,352,677 $2,433,299 $2,618,059 78.1%2016 $2,932,765 $3,005,190 $2,354,363 $2,412,505 80.3%Total $45,065,695 $69,264,943 $37,593,707 $58,012,605 83.8%
Expected Future Experience2017 $2,922,002 $2,851,582 $2,313,265 $2,257,515 79.2%2018 $3,161,103 $2,938,020 $2,471,677 $2,297,247 78.2%2019 $3,377,575 $2,989,729 $2,640,937 $2,337,679 78.2%2020 $3,608,872 $3,042,348 $2,821,789 $2,378,822 78.2%2021 $3,856,007 $3,095,893 $3,015,025 $2,420,689 78.2%2022 $4,120,067 $3,150,381 $3,221,494 $2,463,293 78.2%2023 $4,402,209 $3,205,828 $3,442,102 $2,506,647 78.2%2024 $4,703,672 $3,262,250 $3,677,817 $2,550,764 78.2%2025 $5,025,780 $3,319,666 $3,929,674 $2,595,658 78.2%2026 $5,369,945 $3,378,092 $4,198,778 $2,641,341 78.2%
Expected Future (2017-2026) $40,547,232 $31,233,790 $31,732,555 $24,449,656 78.3%Aggregate (1992-2026) $90,431,464 $113,772,042 $73,684,599 $94,455,566 83.0%
Premium Incurred ClaimsAccumulated Incurred Accumulated Incurred
PLAN D Premium to 12/16 Claims to 12/16 Loss Ratioa b c d d/b
Prudential Experience1992 $4,668 $15,427 $7,787 $25,734 166.8%1993 $16,486 $51,888 $11,920 $37,517 72.3%1994 $25,101 $75,240 $10,537 $31,585 42.0%1995 $28,257 $80,667 $20,936 $59,768 74.1%1996 $52,707 $143,301 $47,171 $128,249 89.5%1997 $55,208 $142,953 $44,461 $115,125 80.5%Total $182,427 $509,475 $142,812 $397,977 78.1%
UnitedHealthcare Experience1998 $63,294 $156,086 $43,853 $108,144 69.3%1999 $66,628 $156,483 $43,299 $101,693 65.0%2000 $78,706 $176,048 $74,032 $165,594 94.1%2001 $81,144 $172,859 $55,059 $117,291 67.9%2002 $73,152 $148,414 $49,209 $99,837 67.3%2003 $82,435 $159,283 $59,414 $114,801 72.1%2004 $88,511 $162,878 $69,160 $127,269 78.1%2005 $91,957 $161,161 $84,911 $148,812 92.3%2006 $94,341 $157,467 $67,981 $113,469 72.1%2007 $97,357 $154,763 $104,608 $166,288 107.4%2008 $104,664 $158,455 $95,583 $144,707 91.3%2009 $119,947 $172,946 $138,156 $199,201 115.2%2010 $132,906 $182,505 $172,637 $237,064 129.9%2011 $129,977 $169,984 $132,731 $173,585 102.1%2012 $107,163 $133,474 $97,247 $121,123 90.7%2013 $90,042 $106,809 $113,642 $134,804 126.2%2014 $86,110 $97,281 $100,654 $113,712 116.9%2015 $74,150 $79,781 $96,942 $104,303 130.7%2016 $69,336 $71,048 $55,154 $56,516 79.5%Total $1,731,822 $2,777,724 $1,654,273 $2,548,211 91.7%
Expected Future Experience2017 $64,515 $62,960 $50,259 $49,048 77.9%2018 $62,337 $57,938 $47,947 $44,564 76.9%2019 $59,469 $52,640 $45,742 $40,489 76.9%2020 $56,734 $47,828 $43,638 $36,787 76.9%2021 $54,124 $43,455 $41,630 $33,424 76.9%2022 $51,634 $39,482 $39,715 $30,368 76.9%2023 $49,259 $35,872 $37,888 $27,592 76.9%2024 $46,993 $32,592 $36,146 $25,069 76.9%2025 $44,832 $29,612 $34,483 $22,777 76.9%2026 $42,769 $26,905 $32,897 $20,694 76.9%
Expected Future (2017-2026) $532,666 $429,284 $410,345 $330,812 77.1%Aggregate (1992-2026) $2,446,915 $3,716,484 $2,207,430 $3,277,000 88.2%
Assumption: Interest rate is 5%.
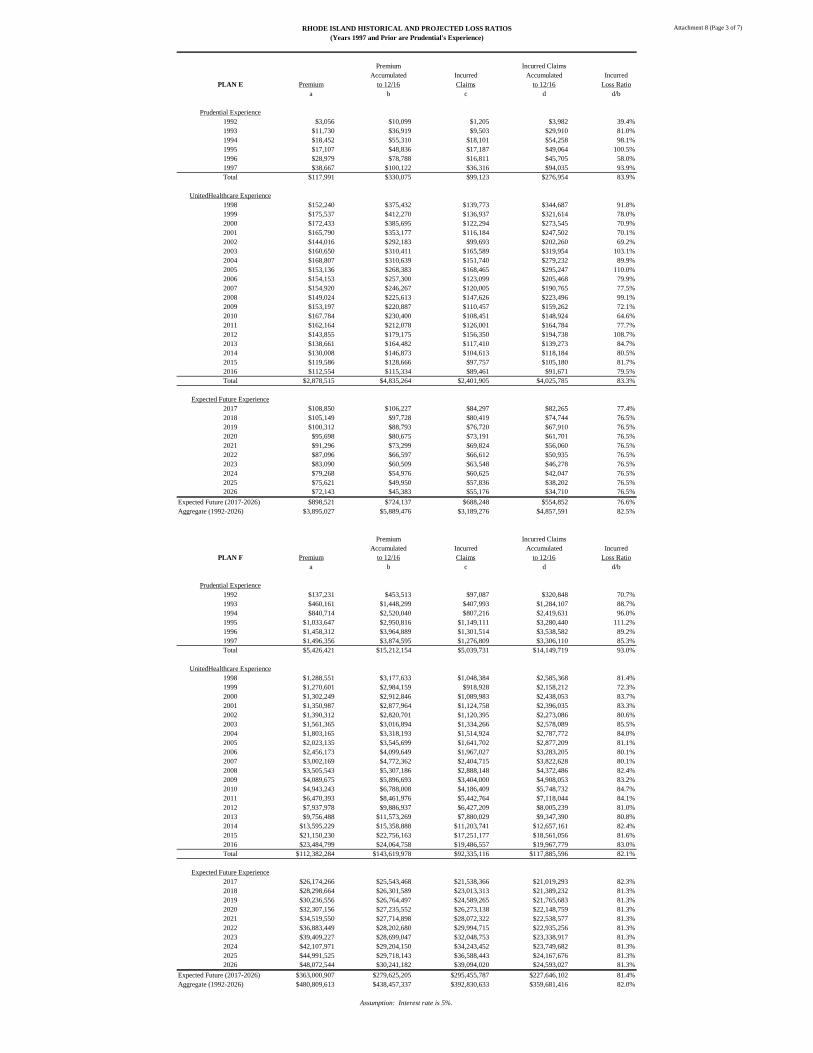
Attachment 8 (Page 3 of 7)RHODE ISLAND HISTORICAL AND PROJECTED LOSS RATIOS(Years 1997 and Prior are Prudential's Experience)
Premium Incurred ClaimsAccumulated Incurred Accumulated Incurred
PLAN E Premium to 12/16 Claims to 12/16 Loss Ratioa b c d d/b
Prudential Experience1992 $3,056 $10,099 $1,205 $3,982 39.4%1993 $11,730 $36,919 $9,503 $29,910 81.0%1994 $18,452 $55,310 $18,101 $54,258 98.1%1995 $17,107 $48,836 $17,187 $49,064 100.5%1996 $28,979 $78,788 $16,811 $45,705 58.0%1997 $38,667 $100,122 $36,316 $94,035 93.9%Total $117,991 $330,075 $99,123 $276,954 83.9%
UnitedHealthcare Experience1998 $152,240 $375,432 $139,773 $344,687 91.8%1999 $175,537 $412,270 $136,937 $321,614 78.0%2000 $172,433 $385,695 $122,294 $273,545 70.9%2001 $165,790 $353,177 $116,184 $247,502 70.1%2002 $144,016 $292,183 $99,693 $202,260 69.2%2003 $160,650 $310,411 $165,589 $319,954 103.1%2004 $168,807 $310,639 $151,740 $279,232 89.9%2005 $153,136 $268,383 $168,465 $295,247 110.0%2006 $154,153 $257,300 $123,099 $205,468 79.9%2007 $154,920 $246,267 $120,005 $190,765 77.5%2008 $149,024 $225,613 $147,626 $223,496 99.1%2009 $153,197 $220,887 $110,457 $159,262 72.1%2010 $167,784 $230,400 $108,451 $148,924 64.6%2011 $162,164 $212,078 $126,001 $164,784 77.7%2012 $143,855 $179,175 $156,350 $194,738 108.7%2013 $138,661 $164,482 $117,410 $139,273 84.7%2014 $130,008 $146,873 $104,613 $118,184 80.5%2015 $119,586 $128,666 $97,757 $105,180 81.7%2016 $112,554 $115,334 $89,461 $91,671 79.5%Total $2,878,515 $4,835,264 $2,401,905 $4,025,785 83.3%
Expected Future Experience2017 $108,850 $106,227 $84,297 $82,265 77.4%2018 $105,149 $97,728 $80,419 $74,744 76.5%2019 $100,312 $88,793 $76,720 $67,910 76.5%2020 $95,698 $80,675 $73,191 $61,701 76.5%2021 $91,296 $73,299 $69,824 $56,060 76.5%2022 $87,096 $66,597 $66,612 $50,935 76.5%2023 $83,090 $60,509 $63,548 $46,278 76.5%2024 $79,268 $54,976 $60,625 $42,047 76.5%2025 $75,621 $49,950 $57,836 $38,202 76.5%2026 $72,143 $45,383 $55,176 $34,710 76.5%
Expected Future (2017-2026) $898,521 $724,137 $688,248 $554,852 76.6%Aggregate (1992-2026) $3,895,027 $5,889,476 $3,189,276 $4,857,591 82.5%
Premium Incurred ClaimsAccumulated Incurred Accumulated Incurred
PLAN F Premium to 12/16 Claims to 12/16 Loss Ratioa b c d d/b
Prudential Experience1992 $137,231 $453,513 $97,087 $320,848 70.7%1993 $460,161 $1,448,299 $407,993 $1,284,107 88.7%1994 $840,714 $2,520,040 $807,216 $2,419,631 96.0%1995 $1,033,647 $2,950,816 $1,149,111 $3,280,440 111.2%1996 $1,458,312 $3,964,889 $1,301,514 $3,538,582 89.2%1997 $1,496,356 $3,874,595 $1,276,809 $3,306,110 85.3%Total $5,426,421 $15,212,154 $5,039,731 $14,149,719 93.0%
UnitedHealthcare Experience1998 $1,288,551 $3,177,633 $1,048,384 $2,585,368 81.4%1999 $1,270,601 $2,984,159 $918,928 $2,158,212 72.3%2000 $1,302,249 $2,912,846 $1,089,983 $2,438,053 83.7%2001 $1,350,987 $2,877,964 $1,124,758 $2,396,035 83.3%2002 $1,390,312 $2,820,701 $1,120,395 $2,273,086 80.6%2003 $1,561,365 $3,016,894 $1,334,266 $2,578,089 85.5%2004 $1,803,165 $3,318,193 $1,514,924 $2,787,772 84.0%2005 $2,023,135 $3,545,699 $1,641,702 $2,877,209 81.1%2006 $2,456,173 $4,099,649 $1,967,027 $3,283,205 80.1%2007 $3,002,169 $4,772,362 $2,404,715 $3,822,628 80.1%2008 $3,505,543 $5,307,186 $2,888,148 $4,372,486 82.4%2009 $4,089,675 $5,896,693 $3,404,000 $4,908,053 83.2%2010 $4,943,243 $6,788,008 $4,186,409 $5,748,732 84.7%2011 $6,470,393 $8,461,976 $5,442,764 $7,118,044 84.1%2012 $7,937,978 $9,886,937 $6,427,209 $8,005,239 81.0%2013 $9,756,488 $11,573,269 $7,880,029 $9,347,390 80.8%2014 $13,595,229 $15,358,888 $11,203,741 $12,657,161 82.4%2015 $21,150,230 $22,756,163 $17,251,177 $18,561,056 81.6%2016 $23,484,799 $24,064,758 $19,486,557 $19,967,779 83.0%Total $112,382,284 $143,619,978 $92,335,116 $117,885,596 82.1%
Expected Future Experience2017 $26,174,266 $25,543,468 $21,538,366 $21,019,293 82.3%2018 $28,298,664 $26,301,589 $23,013,313 $21,389,232 81.3%2019 $30,236,556 $26,764,497 $24,589,265 $21,765,683 81.3%2020 $32,307,156 $27,235,552 $26,273,138 $22,148,759 81.3%2021 $34,519,550 $27,714,898 $28,072,322 $22,538,577 81.3%2022 $36,883,449 $28,202,680 $29,994,715 $22,935,256 81.3%2023 $39,409,227 $28,699,047 $32,048,753 $23,338,917 81.3%2024 $42,107,971 $29,204,150 $34,243,452 $23,749,682 81.3%2025 $44,991,525 $29,718,143 $36,588,443 $24,167,676 81.3%2026 $48,072,544 $30,241,182 $39,094,020 $24,593,027 81.3%
Expected Future (2017-2026) $363,000,907 $279,625,205 $295,455,787 $227,646,102 81.4%Aggregate (1992-2026) $480,809,613 $438,457,337 $392,830,633 $359,681,416 82.0%
Assumption: Interest rate is 5%.

Attachment 8 (Page 4 of 7)RHODE ISLAND HISTORICAL AND PROJECTED LOSS RATIOS(Years 1997 and Prior are Prudential's Experience)
Premium Incurred ClaimsAccumulated Incurred Accumulated Incurred
PLAN G Premium to 12/16 Claims to 12/16 Loss Ratioa b c d d/b
Prudential Experience1992 $6,680 $22,076 $6,074 $20,073 90.9%1993 $31,104 $97,896 $29,970 $94,327 96.4%1994 $47,932 $143,676 $54,573 $163,583 113.9%1995 $51,196 $146,152 $29,266 $83,548 57.2%1996 $78,192 $212,589 $55,485 $150,855 71.0%1997 $87,038 $225,373 $68,113 $176,368 78.3%Total $302,142 $847,762 $243,482 $688,754 81.2%
UnitedHealthcare Experience1998 $87,467 $215,698 $64,763 $159,708 74.0%1999 $98,950 $232,395 $61,081 $143,455 61.7%2000 $98,608 $220,564 $71,538 $160,015 72.5%2001 $109,848 $234,006 $78,179 $166,541 71.2%2002 $120,094 $243,650 $146,985 $298,208 122.4%2003 $131,916 $254,890 $112,286 $216,962 85.1%2004 $158,783 $292,193 $143,182 $263,484 90.2%2005 $162,223 $284,307 $113,561 $199,025 70.0%2006 $186,866 $311,902 $144,052 $240,440 77.1%2007 $177,571 $282,273 $139,875 $222,351 78.8%2008 $176,310 $266,923 $126,647 $191,735 71.8%2009 $171,559 $247,363 $156,745 $226,002 91.4%2010 $177,907 $244,300 $121,290 $166,555 68.2%2011 $168,304 $220,108 $111,503 $145,824 66.3%2012 $164,612 $205,027 $193,224 $240,664 117.4%2013 $162,832 $193,154 $131,780 $156,319 80.9%2014 $154,677 $174,743 $118,094 $133,414 76.3%2015 $149,247 $160,579 $144,226 $155,178 96.6%2016 $137,859 $141,263 $109,094 $111,788 79.1%Total $2,795,631 $4,425,338 $2,288,106 $3,597,670 81.3%
Expected Future Experience2017 $135,934 $132,658 $104,997 $102,466 77.2%2018 $131,301 $122,035 $100,167 $93,098 76.3%2019 $125,261 $110,877 $95,559 $84,586 76.3%2020 $119,499 $100,740 $91,163 $76,852 76.3%2021 $114,002 $91,529 $86,970 $69,826 76.3%2022 $108,758 $83,161 $82,969 $63,442 76.3%2023 $103,755 $75,558 $79,153 $57,641 76.3%2024 $98,982 $68,649 $75,512 $52,371 76.3%2025 $94,429 $62,373 $72,038 $47,583 76.3%2026 $90,085 $56,670 $68,724 $43,233 76.3%
Expected Future (2017-2026) $1,122,005 $904,250 $857,252 $691,099 76.4%Aggregate (1992-2026) $4,219,778 $6,177,350 $3,388,840 $4,977,523 80.6%
Premium Incurred ClaimsAccumulated Incurred Accumulated Incurred
PLAN H Premium to 12/16 Claims to 12/16 Loss Ratioa b c d d/b
Prudential Experience1992 $9,102 $30,080 $3,520 $11,633 38.7%1993 $41,344 $130,125 $26,041 $81,961 63.0%1994 $57,378 $171,991 $47,096 $141,169 82.1%1995 $77,319 $220,727 $71,295 $203,529 92.2%1996 $96,132 $261,365 $99,648 $270,924 103.7%1997 $88,407 $228,917 $71,935 $186,264 81.4%Total $369,682 $1,043,205 $319,534 $895,481 85.8%
UnitedHealthcare Experience1998 $73,061 $180,171 $63,330 $156,175 86.7%1999 $63,715 $149,643 $74,619 $175,251 117.1%2000 $68,997 $154,332 $50,813 $113,658 73.6%2001 $79,037 $168,369 $84,017 $178,978 106.3%2002 $84,636 $171,711 $120,770 $245,021 142.7%2003 $85,786 $165,757 $100,140 $193,492 116.7%2004 $87,487 $160,994 $83,616 $153,871 95.6%2005 $98,709 $172,996 $106,258 $186,225 107.6%2006 $59,973 $100,103 $47,173 $78,737 78.7%2007 $56,320 $89,528 $44,481 $70,709 79.0%2008 $53,179 $80,510 $55,022 $83,300 103.5%2009 $48,011 $69,225 $47,746 $68,843 99.4%2010 $44,598 $61,241 $28,576 $39,240 64.1%2011 $41,687 $54,518 $25,432 $33,260 61.0%2012 $40,083 $49,924 $24,658 $30,712 61.5%2013 $35,234 $41,795 $19,430 $23,048 55.1%2014 $31,210 $35,259 $29,777 $33,640 95.4%2015 $30,236 $32,532 $21,975 $23,644 72.7%2016 $26,442 $27,095 $19,526 $20,008 73.8%Total $1,108,399 $1,965,701 $1,047,358 $1,907,811 97.1%
Expected Future Experience2017 $22,718 $22,171 $17,784 $17,355 78.3%2018 $21,673 $20,144 $16,965 $15,768 78.3%2019 $20,676 $18,302 $16,185 $14,327 78.3%2020 $19,725 $16,629 $15,441 $13,017 78.3%2021 $18,818 $15,108 $14,730 $11,827 78.3%2022 $17,952 $13,727 $14,053 $10,745 78.3%2023 $17,126 $12,472 $13,406 $9,763 78.3%2024 $16,338 $11,332 $12,790 $8,870 78.3%2025 $15,587 $10,296 $12,201 $8,059 78.3%2026 $14,870 $9,354 $11,640 $7,322 78.3%
Expected Future (2017-2026) $185,483 $149,533 $145,195 $117,053 78.3%Aggregate (1992-2026) $1,663,564 $3,158,439 $1,512,087 $2,920,345 92.5%
Assumption: Interest rate is 5%.
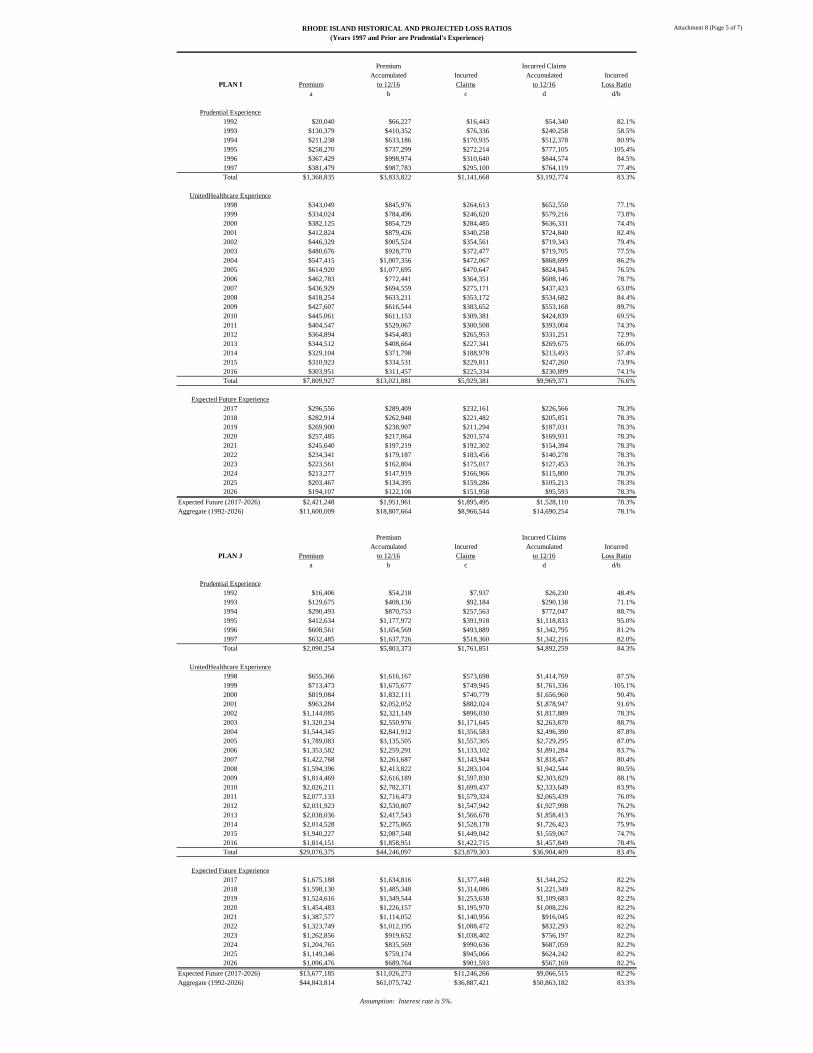
Attachment 8 (Page 5 of 7)RHODE ISLAND HISTORICAL AND PROJECTED LOSS RATIOS(Years 1997 and Prior are Prudential's Experience)
Premium Incurred ClaimsAccumulated Incurred Accumulated Incurred
PLAN I Premium to 12/16 Claims to 12/16 Loss Ratioa b c d d/b
Prudential Experience1992 $20,040 $66,227 $16,443 $54,340 82.1%1993 $130,379 $410,352 $76,336 $240,258 58.5%1994 $211,238 $633,186 $170,935 $512,378 80.9%1995 $258,270 $737,299 $272,214 $777,105 105.4%1996 $367,429 $998,974 $310,640 $844,574 84.5%1997 $381,479 $987,783 $295,100 $764,119 77.4%Total $1,368,835 $3,833,822 $1,141,668 $3,192,774 83.3%
UnitedHealthcare Experience1998 $343,049 $845,976 $264,613 $652,550 77.1%1999 $334,024 $784,496 $246,620 $579,216 73.8%2000 $382,125 $854,729 $284,485 $636,331 74.4%2001 $412,824 $879,426 $340,258 $724,840 82.4%2002 $446,329 $905,524 $354,561 $719,343 79.4%2003 $480,676 $928,770 $372,477 $719,705 77.5%2004 $547,415 $1,007,356 $472,067 $868,699 86.2%2005 $614,920 $1,077,695 $470,647 $824,845 76.5%2006 $462,783 $772,441 $364,351 $608,146 78.7%2007 $436,929 $694,559 $275,171 $437,423 63.0%2008 $418,254 $633,211 $353,172 $534,682 84.4%2009 $427,607 $616,544 $383,652 $553,168 89.7%2010 $445,061 $611,153 $309,381 $424,839 69.5%2011 $404,547 $529,067 $300,508 $393,004 74.3%2012 $364,894 $454,483 $265,953 $331,251 72.9%2013 $344,512 $408,664 $227,341 $269,675 66.0%2014 $329,104 $371,798 $188,978 $213,493 57.4%2015 $310,923 $334,531 $229,811 $247,260 73.9%2016 $303,951 $311,457 $225,334 $230,899 74.1%Total $7,809,927 $13,021,881 $5,929,381 $9,969,371 76.6%
Expected Future Experience2017 $296,556 $289,409 $232,161 $226,566 78.3%2018 $282,914 $262,948 $221,482 $205,851 78.3%2019 $269,900 $238,907 $211,294 $187,031 78.3%2020 $257,485 $217,064 $201,574 $169,931 78.3%2021 $245,640 $197,219 $192,302 $154,394 78.3%2022 $234,341 $179,187 $183,456 $140,278 78.3%2023 $223,561 $162,804 $175,017 $127,453 78.3%2024 $213,277 $147,919 $166,966 $115,800 78.3%2025 $203,467 $134,395 $159,286 $105,213 78.3%2026 $194,107 $122,108 $151,958 $95,593 78.3%
Expected Future (2017-2026) $2,421,248 $1,951,961 $1,895,495 $1,528,110 78.3%Aggregate (1992-2026) $11,600,009 $18,807,664 $8,966,544 $14,690,254 78.1%
Premium Incurred ClaimsAccumulated Incurred Accumulated Incurred
PLAN J Premium to 12/16 Claims to 12/16 Loss Ratioa b c d d/b
Prudential Experience1992 $16,406 $54,218 $7,937 $26,230 48.4%1993 $129,675 $408,136 $92,184 $290,138 71.1%1994 $290,493 $870,753 $257,563 $772,047 88.7%1995 $412,634 $1,177,972 $391,918 $1,118,833 95.0%1996 $608,561 $1,654,569 $493,889 $1,342,795 81.2%1997 $632,485 $1,637,726 $518,360 $1,342,216 82.0%Total $2,090,254 $5,803,373 $1,761,851 $4,892,259 84.3%
UnitedHealthcare Experience1998 $655,366 $1,616,167 $573,698 $1,414,769 87.5%1999 $713,473 $1,675,677 $749,945 $1,761,336 105.1%2000 $819,084 $1,832,111 $740,779 $1,656,960 90.4%2001 $963,284 $2,052,052 $882,024 $1,878,947 91.6%2002 $1,144,085 $2,321,149 $896,030 $1,817,889 78.3%2003 $1,320,234 $2,550,976 $1,171,645 $2,263,870 88.7%2004 $1,544,345 $2,841,912 $1,356,583 $2,496,390 87.8%2005 $1,789,083 $3,135,505 $1,557,305 $2,729,295 87.0%2006 $1,353,582 $2,259,291 $1,133,102 $1,891,284 83.7%2007 $1,422,768 $2,261,687 $1,143,944 $1,818,457 80.4%2008 $1,594,396 $2,413,822 $1,283,104 $1,942,544 80.5%2009 $1,814,469 $2,616,189 $1,597,830 $2,303,829 88.1%2010 $2,026,211 $2,782,371 $1,699,437 $2,333,649 83.9%2011 $2,077,133 $2,716,473 $1,579,324 $2,065,439 76.0%2012 $2,031,923 $2,530,807 $1,547,942 $1,927,998 76.2%2013 $2,038,036 $2,417,543 $1,566,678 $1,858,413 76.9%2014 $2,014,528 $2,275,865 $1,528,178 $1,726,423 75.9%2015 $1,940,227 $2,087,548 $1,449,042 $1,559,067 74.7%2016 $1,814,151 $1,858,951 $1,422,715 $1,457,849 78.4%Total $29,076,375 $44,246,097 $23,879,303 $36,904,409 83.4%
Expected Future Experience2017 $1,675,188 $1,634,816 $1,377,448 $1,344,252 82.2%2018 $1,598,130 $1,485,348 $1,314,086 $1,221,349 82.2%2019 $1,524,616 $1,349,544 $1,253,638 $1,109,683 82.2%2020 $1,454,483 $1,226,157 $1,195,970 $1,008,226 82.2%2021 $1,387,577 $1,114,052 $1,140,956 $916,045 82.2%2022 $1,323,749 $1,012,195 $1,088,472 $832,293 82.2%2023 $1,262,856 $919,652 $1,038,402 $756,197 82.2%2024 $1,204,765 $835,569 $990,636 $687,059 82.2%2025 $1,149,346 $759,174 $945,066 $624,242 82.2%2026 $1,096,476 $689,764 $901,593 $567,169 82.2%
Expected Future (2017-2026) $13,677,185 $11,026,273 $11,246,266 $9,066,515 82.2%Aggregate (1992-2026) $44,843,814 $61,075,742 $36,887,421 $50,863,182 83.3%
Assumption: Interest rate is 5%.

Attachment 8 (Page 6 of 7)RHODE ISLAND HISTORICAL AND PROJECTED LOSS RATIOS(Years 1997 and Prior are Prudential's Experience)
Premium Incurred ClaimsAccumulated Incurred Accumulated Incurred
PLAN K Premium to 12/16 Claims to 12/16 Loss Ratioa b c d d/b
UnitedHealthcare Experience2006 $1,382 $2,306 $1,318 $2,200 95.4%2007 $9,163 $14,567 $3,296 $5,240 36.0%2008 $7,894 $11,951 $4,783 $7,242 60.6%2009 $13,954 $20,120 $8,727 $12,582 62.5%2010 $13,862 $19,034 $13,577 $18,644 97.9%2011 $18,396 $24,059 $9,537 $12,473 51.8%2012 $26,329 $32,794 $20,018 $24,932 76.0%2013 $35,637 $42,273 $25,798 $30,601 72.4%2014 $44,754 $50,560 $18,807 $21,247 42.0%2015 $69,859 $75,164 $42,691 $45,932 61.1%2016 $68,441 $70,131 $49,691 $50,918 72.6%Total $309,672 $362,959 $198,242 $232,011 63.9%
Expected Future Experience2017 $68,138 $66,496 $52,536 $51,270 77.1%2018 $72,804 $67,666 $56,134 $52,172 77.1%2019 $77,789 $68,857 $59,978 $53,091 77.1%2020 $83,116 $70,069 $64,085 $54,025 77.1%2021 $88,808 $71,302 $68,474 $54,976 77.1%2022 $94,890 $72,557 $73,163 $55,943 77.1%2023 $101,388 $73,834 $78,173 $56,928 77.1%2024 $108,331 $75,133 $83,526 $57,930 77.1%2025 $115,749 $76,456 $89,246 $58,949 77.1%2026 $123,676 $77,801 $95,358 $59,987 77.1%
Expected Future (2017-2026) $934,689 $720,170 $720,672 $555,271 77.1%Aggregate (2006-2026) $1,244,361 $1,083,129 $918,914 $787,282 72.7%
Premium Incurred ClaimsAccumulated Incurred Accumulated Incurred
PLAN L Premium to 12/16 Claims to 12/16 Loss Ratioa b c d d/b
UnitedHealthcare Experience2006 $5,172 $8,633 $1,766 $2,948 34.1%2007 $16,357 $26,002 $12,920 $20,538 79.0%2008 $24,048 $36,408 $12,259 $18,559 51.0%2009 $30,026 $43,293 $12,947 $18,668 43.1%2010 $36,302 $49,850 $44,210 $60,708 121.8%2011 $37,948 $49,628 $35,258 $46,110 92.9%2012 $40,275 $50,163 $19,223 $23,942 47.7%2013 $43,789 $51,943 $29,271 $34,722 66.8%2014 $46,569 $52,611 $38,251 $43,213 82.1%2015 $57,083 $61,418 $35,094 $37,759 61.5%2016 $58,274 $59,713 $45,642 $46,769 78.3%Total $395,845 $489,662 $286,840 $353,936 72.3%
Expected Future Experience2017 $53,952 $52,652 $42,238 $41,220 78.3%2018 $58,364 $54,245 $45,130 $41,945 77.3%2019 $62,361 $55,200 $48,221 $42,683 77.3%2020 $66,632 $56,172 $51,523 $43,435 77.3%2021 $71,195 $57,160 $55,051 $44,199 77.3%2022 $76,070 $58,166 $58,821 $44,977 77.3%2023 $81,279 $59,190 $62,849 $45,769 77.3%2024 $86,845 $60,232 $67,153 $46,574 77.3%2025 $92,792 $61,292 $71,752 $47,394 77.3%2026 $99,147 $62,371 $76,665 $48,228 77.3%
Expected Future (2017-2026) $748,637 $576,681 $579,402 $446,424 77.4%Aggregate (2006-2026) $1,144,482 $1,066,343 $866,242 $800,360 75.1%
Premium Incurred ClaimsAccumulated Incurred Accumulated Incurred
PLAN N Premium to 12/16 Claims to 12/16 Loss Ratioa b c d d/b
UnitedHealthcare Experience2010 $16,307 $22,393 $7,751 $10,643 47.5%2011 $387,032 $506,161 $312,136 $408,212 80.6%2012 $632,900 $788,292 $521,188 $649,151 82.3%2013 $1,138,420 $1,350,409 $904,260 $1,072,645 79.4%2014 $2,272,650 $2,567,473 $1,791,136 $2,023,493 78.8%2015 $4,464,470 $4,803,457 $3,493,001 $3,758,224 78.2%2016 $5,391,165 $5,524,300 $4,226,848 $4,331,230 78.4%Total $14,302,945 $15,562,483 $11,256,319 $12,253,598 78.7%
Expected Future Experience2017 $6,578,675 $6,420,130 $5,081,531 $4,959,067 77.2%2018 $7,111,891 $6,609,995 $5,429,514 $5,046,346 76.3%2019 $7,598,913 $6,726,331 $5,801,328 $5,135,162 76.3%2020 $8,119,286 $6,844,714 $6,198,603 $5,225,541 76.3%2021 $8,675,295 $6,965,181 $6,623,083 $5,317,510 76.3%2022 $9,269,379 $7,087,768 $7,076,632 $5,411,098 76.3%2023 $9,904,146 $7,212,513 $7,561,239 $5,506,334 76.3%2024 $10,582,382 $7,339,453 $8,079,033 $5,603,245 76.3%2025 $11,307,064 $7,468,628 $8,632,285 $5,701,862 76.3%2026 $12,081,372 $7,600,075 $9,223,424 $5,802,215 76.3%
Expected Future (2017-2026) $91,228,404 $70,274,788 $69,706,671 $53,708,381 76.4%Aggregate (2010-2026) $105,531,349 $85,837,271 $80,962,991 $65,961,980 76.8%
Assumption: Interest rate is 5%.

Attachment 8 (Page 7 of 7)RHODE ISLAND HISTORICAL AND PROJECTED LOSS RATIOS
(Years 1997 and Prior are Prudential's Experience)
Premium Incurred ClaimsAccumulated Incurred Accumulated Incurred
TOTAL STANDARDIZED Premium to 12/16 Claims to 12/16 Loss Ratioa b c d d/b
Prudential Experience1992 $249,953 $826,031 $173,758 $574,226 69.5%1993 $1,089,899 $3,430,321 $853,247 $2,685,489 78.3%1994 $2,137,337 $6,406,668 $1,903,629 $5,706,127 89.1%1995 $2,865,056 $8,179,053 $2,907,954 $8,301,517 101.5%1996 $4,395,724 $11,951,188 $3,937,452 $10,705,227 89.6%1997 $4,611,245 $11,940,144 $3,911,020 $10,127,013 84.8%Total $15,349,215 $42,733,406 $13,687,059 $38,099,599 89.2%
UnitedHealthcare Experience1998 $4,232,432 $10,437,393 $3,490,221 $8,607,064 82.5%1999 $4,158,259 $9,766,170 $3,351,644 $7,871,737 80.6%2000 $4,562,080 $10,204,373 $3,795,735 $8,490,226 83.2%2001 $4,986,458 $10,622,489 $4,232,088 $9,015,480 84.9%2002 $5,257,750 $10,667,061 $4,511,057 $9,152,151 85.8%2003 $5,936,233 $11,470,081 $5,125,318 $9,903,219 86.3%2004 $6,725,051 $12,375,473 $5,640,860 $10,380,340 83.9%2005 $7,329,022 $12,844,670 $6,119,359 $10,724,643 83.5%2006 $7,400,101 $12,351,658 $6,219,856 $10,381,688 84.1%2007 $8,166,905 $12,982,426 $6,566,930 $10,439,043 80.4%2008 $8,933,686 $13,525,076 $7,418,093 $11,230,557 83.0%2009 $9,869,606 $14,230,480 $8,389,741 $12,096,738 85.0%2010 $11,203,694 $15,384,794 $9,453,458 $12,981,389 84.4%2011 $13,225,023 $17,295,677 $10,795,031 $14,117,736 81.6%2012 $14,807,111 $18,442,601 $12,036,529 $14,991,777 81.3%2013 $17,154,031 $20,348,329 $13,674,859 $16,221,290 79.7%2014 $22,140,443 $25,012,641 $17,905,231 $20,228,011 80.9%2015 $31,828,762 $34,245,514 $25,527,251 $27,465,531 80.2%2016 $34,745,632 $35,603,678 $28,360,007 $29,060,360 81.6%Total $222,662,279 $307,810,587 $182,613,268 $253,358,980 82.3%
Expected Future Experience2017 $38,453,496 $37,526,769 $31,167,075 $30,415,951 81.1%2018 $41,283,967 $38,370,502 $33,087,669 $30,752,627 80.1%2019 $43,859,065 $38,822,735 $35,149,616 $31,113,390 80.1%2020 $46,622,099 $39,303,324 $37,362,144 $31,497,004 80.1%2021 $49,585,406 $39,810,903 $39,735,135 $31,902,362 80.1%2022 $52,762,191 $40,344,253 $42,279,163 $32,328,477 80.1%2023 $56,166,588 $40,902,288 $45,005,551 $32,774,467 80.1%
2024 $59,813,721 $41,484,043 $47,926,410 $33,239,552 80.1%2025 $63,719,771 $42,088,667 $51,054,701 $33,723,039 80.1%2026 $67,902,047 $42,715,405 $54,404,289 $34,224,317 80.1%
Expected Future (2017-2026) $520,168,353 $401,368,888 $417,171,754 $321,971,186 80.2%Aggregate (1992-2026) $758,179,847 $751,912,880 $613,472,081 $613,429,765 81.6%
Assumption: Interest rate is 5%.

Attachment 9 (Page 1 of 4)
Rhode Island StandardizedPaid and Incurred Experience
(Most recent 5 years shown)
Plan A Paid Earned Paid Incurred Incurred Paid IncurredPremium Premium Claims Claims Expenses Loss Ratios Loss Ratios
2011 162,191 162,191 151,259 153,343 39,071 93.3% 94.5%2012 162,467 162,467 164,649 158,242 39,452 101.3% 97.4%2013 157,634 157,634 146,851 150,546 36,538 93.2% 95.5%2014 162,095 162,095 138,049 125,797 37,063 85.2% 77.6%2015 169,487 169,487 120,531 126,042 38,505 71.1% 74.4%
Plan B Paid Earned Paid Incurred Incurred Paid IncurredPremium Premium Claims Claims Expenses Loss Ratios Loss Ratios
2011 171,868 171,868 119,305 132,220 33,402 69.4% 76.9%2012 187,024 187,024 124,286 116,745 38,369 66.5% 62.4%2013 196,396 196,396 180,285 180,627 40,966 91.8% 92.0%2014 192,138 192,138 110,046 104,447 40,388 57.3% 54.4%2015 177,190 177,190 103,792 106,194 38,386 58.6% 59.9%
Plan C Paid Earned Paid Incurred Incurred Paid IncurredPremium Premium Claims Claims Expenses Loss Ratios Loss Ratios
2011 2,993,383 2,993,383 2,412,320 2,434,274 542,219 80.6% 81.3%2012 2,967,608 2,967,608 2,498,934 2,488,531 556,503 84.2% 83.9%2013 3,016,350 3,016,350 2,377,345 2,328,046 565,898 78.8% 77.2%2014 3,081,370 3,081,370 2,416,973 2,552,758 573,400 78.4% 82.8%2015 3,116,074 3,116,074 2,545,416 2,433,299 591,384 81.7% 78.1%

Attachment 9 (Page 2 of 4)
(Most recent 5 years shown)
Plan D Paid Earned Paid Incurred Incurred Paid IncurredPremium Premium Claims Claims Expenses Loss Ratios Loss Ratios
2011 129,977 129,977 129,722 132,731 23,648 99.8% 102.1%2012 107,163 107,163 106,724 97,247 20,139 99.6% 90.7%2013 90,042 90,042 106,860 113,642 17,007 118.7% 126.2%2014 86,110 86,110 105,696 100,654 16,179 122.7% 116.9%2015 74,150 74,150 104,327 96,942 14,337 140.7% 130.7%
Plan E Paid Earned Paid Incurred Incurred Paid IncurredPremium Premium Claims Claims Expenses Loss Ratios Loss Ratios
2011 162,164 162,164 139,747 126,001 30,126 86.2% 77.7%2012 143,855 143,855 140,359 156,350 27,802 97.6% 108.7%2013 138,661 138,661 128,918 117,410 26,773 93.0% 84.7%2014 130,008 130,008 107,773 104,613 25,031 82.9% 80.5%2015 119,586 119,586 99,566 97,757 23,522 83.3% 81.7%
Plan F Paid Earned Paid Incurred Incurred Paid IncurredPremium Premium Claims Claims Expenses Loss Ratios Loss Ratios
2011 6,470,393 6,470,393 5,264,603 5,442,764 1,223,928 81.4% 84.1%2012 7,937,978 7,937,978 6,545,067 6,427,209 1,578,461 82.5% 81.0%2013 9,756,488 9,756,488 7,598,589 7,880,029 1,955,168 77.9% 80.8%2014 13,595,229 13,595,229 9,584,456 11,203,741 2,697,487 70.5% 82.4%2015 21,150,230 21,150,230 17,162,431 17,251,177 4,252,285 81.1% 81.6%
Rhode Island StandardizedPaid and Incurred Experience

Attachment 9 (Page 3 of 4)
Rhode Island StandardizedPaid and Incurred Experience
(Most recent 5 years shown)
Plan G Paid Earned Paid Incurred Incurred Paid IncurredPremium Premium Claims Claims Expenses Loss Ratios Loss Ratios
2011 168,304 168,304 102,502 111,503 31,180 60.9% 66.3%2012 164,612 164,612 191,310 193,224 31,578 116.2% 117.4%2013 162,832 162,832 139,095 131,780 31,298 85.4% 80.9%2014 154,677 154,677 120,570 118,094 29,527 77.9% 76.3%2015 149,247 149,247 139,396 144,226 29,102 93.4% 96.6%
Plan H Paid Earned Paid Incurred Incurred Paid IncurredPremium Premium Claims Claims Expenses Loss Ratios Loss Ratios
2011 41,687 41,687 26,001 25,432 7,132 62.4% 61.0%2012 40,083 40,083 19,485 24,658 7,072 48.6% 61.5%2013 35,234 35,234 29,256 19,430 6,392 83.0% 55.1%2014 31,210 31,210 27,042 29,777 5,797 86.6% 95.4%2015 30,236 30,236 21,393 21,975 5,752 70.8% 72.7%
Plan I Paid Earned Paid Incurred Incurred Paid IncurredPremium Premium Claims Claims Expenses Loss Ratios Loss Ratios
2011 404,547 404,547 306,501 300,508 71,109 75.8% 74.3%2012 364,894 364,894 279,021 265,953 66,603 76.5% 72.9%2013 344,512 344,512 237,029 227,341 64,048 68.8% 66.0%2014 329,104 329,104 187,309 188,978 62,115 56.9% 57.4%2015 310,923 310,923 220,459 229,811 60,174 70.9% 73.9%

Attachment 9 (Page 4 of 4)
Rhode Island StandardizedPaid and Incurred Experience
(Most recent 5 years shown)
Plan J Paid Earned Paid Incurred Incurred Paid IncurredPremium Premium Claims Claims Expenses Loss Ratios Loss Ratios
2011 2,077,133 2,077,133 1,592,025 1,579,324 350,290 76.6% 76.0%2012 2,031,923 2,031,923 1,558,316 1,547,942 353,729 76.7% 76.2%2013 2,038,036 2,038,036 1,576,341 1,566,678 359,048 77.3% 76.9%2014 2,014,528 2,014,528 1,514,935 1,528,178 358,605 75.2% 75.9%2015 1,940,227 1,940,227 1,439,755 1,449,042 353,125 74.2% 74.7%
Plan K Paid Earned Paid Incurred Incurred Paid IncurredPremium Premium Claims Claims Expenses Loss Ratios Loss Ratios
2011 18,396 18,396 12,312 9,537 6,159 66.9% 51.8%2012 26,329 26,329 20,855 20,018 9,101 79.2% 76.0%2013 35,637 35,637 25,816 25,798 12,047 72.4% 72.4%2014 44,754 44,754 13,057 18,807 14,239 29.2% 42.0%2015 69,859 69,859 38,953 42,691 22,674 55.8% 61.1%
Plan L Paid Earned Paid Incurred Incurred Paid IncurredPremium Premium Claims Claims Expenses Loss Ratios Loss Ratios
2011 37,948 37,948 33,792 35,258 8,967 89.0% 92.9%2012 40,275 40,275 22,400 19,223 9,559 55.6% 47.7%2013 43,789 43,789 25,183 29,271 10,297 57.5% 66.8%2014 46,569 46,569 38,751 38,251 10,607 83.2% 82.1%2015 57,083 57,083 33,733 35,094 13,054 59.1% 61.5%
Plan N Paid Earned Paid Incurred Incurred Paid IncurredPremium Premium Claims Claims Expenses Loss Ratios Loss Ratios
2011 387,032 387,032 208,800 312,136 93,645 53.9% 80.6%2012 632,900 632,900 524,003 521,188 166,520 82.8% 82.3%2013 1,138,420 1,138,420 853,076 904,260 303,709 74.9% 79.4%2014 2,272,650 2,272,650 1,490,561 1,791,136 591,360 65.6% 78.8%2015 4,464,470 4,464,470 3,296,621 3,493,001 1,158,784 73.8% 78.2%
TotalStandardized Paid Earned Paid Incurred Incurred Paid Incurred
Premium Premium Claims Claims Expenses Loss Ratios Loss Ratios
2011 13,225,023 13,225,023 10,498,891 10,795,031 2,460,877 79.4% 81.6%2012 14,807,111 14,807,111 12,195,410 12,036,529 2,904,888 82.4% 81.3%2013 17,154,031 17,154,031 13,424,644 13,674,859 3,429,187 78.3% 79.7%2014 22,140,443 22,140,443 15,855,217 17,905,231 4,461,798 71.6% 80.9%2015 31,828,762 31,828,762 25,326,373 25,527,251 6,601,082 79.6% 80.2%
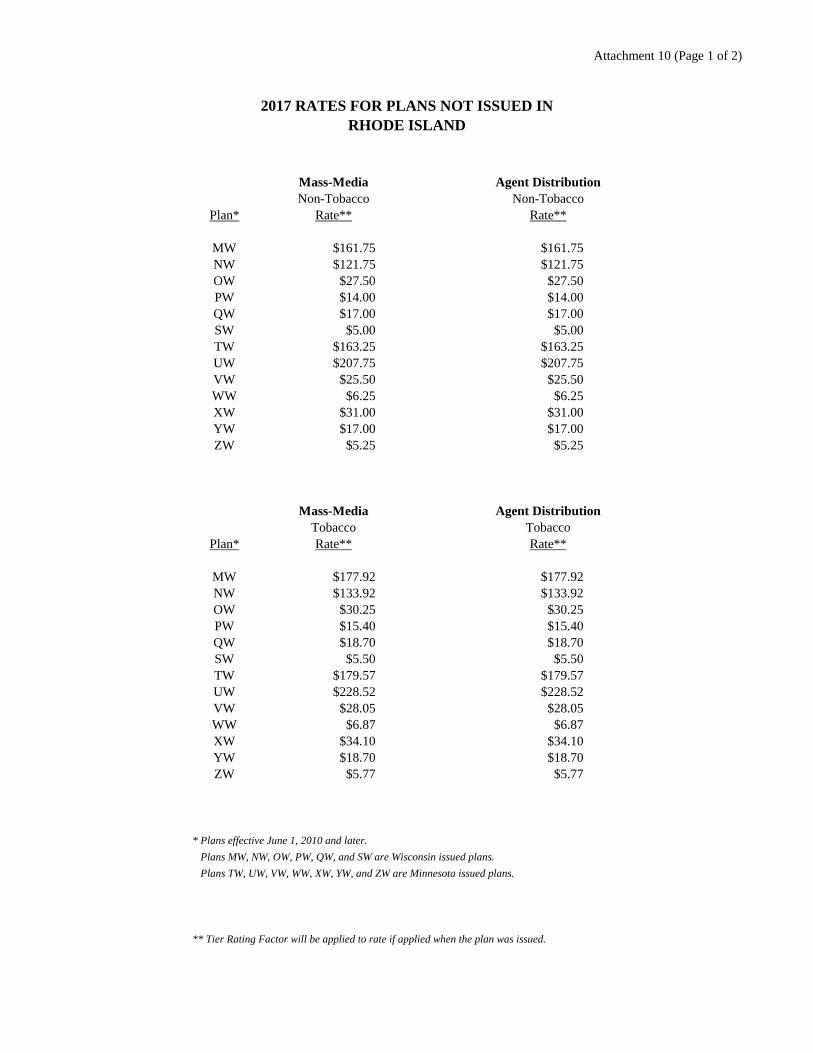
Attachment 10 (Page 1 of 2)
2017 RATES FOR PLANS NOT ISSUED INRHODE ISLAND
Mass-Media Agent DistributionNon-Tobacco Non-Tobacco
Plan* Rate** Rate**
MW $161.75 $161.75NW $121.75 $121.75OW $27.50 $27.50PW $14.00 $14.00QW $17.00 $17.00SW $5.00 $5.00TW $163.25 $163.25UW $207.75 $207.75VW $25.50 $25.50WW $6.25 $6.25XW $31.00 $31.00YW $17.00 $17.00ZW $5.25 $5.25
Mass-Media Agent DistributionTobacco Tobacco
Plan* Rate** Rate**
MW $177.92 $177.92NW $133.92 $133.92OW $30.25 $30.25PW $15.40 $15.40QW $18.70 $18.70SW $5.50 $5.50TW $179.57 $179.57UW $228.52 $228.52VW $28.05 $28.05WW $6.87 $6.87XW $34.10 $34.10YW $18.70 $18.70ZW $5.77 $5.77
* Plans effective June 1, 2010 and later.
Plans MW, NW, OW, PW, QW, and SW are Wisconsin issued plans.
Plans TW, UW, VW, WW, XW, YW, and ZW are Minnesota issued plans.
** Tier Rating Factor will be applied to rate if applied when the plan was issued.
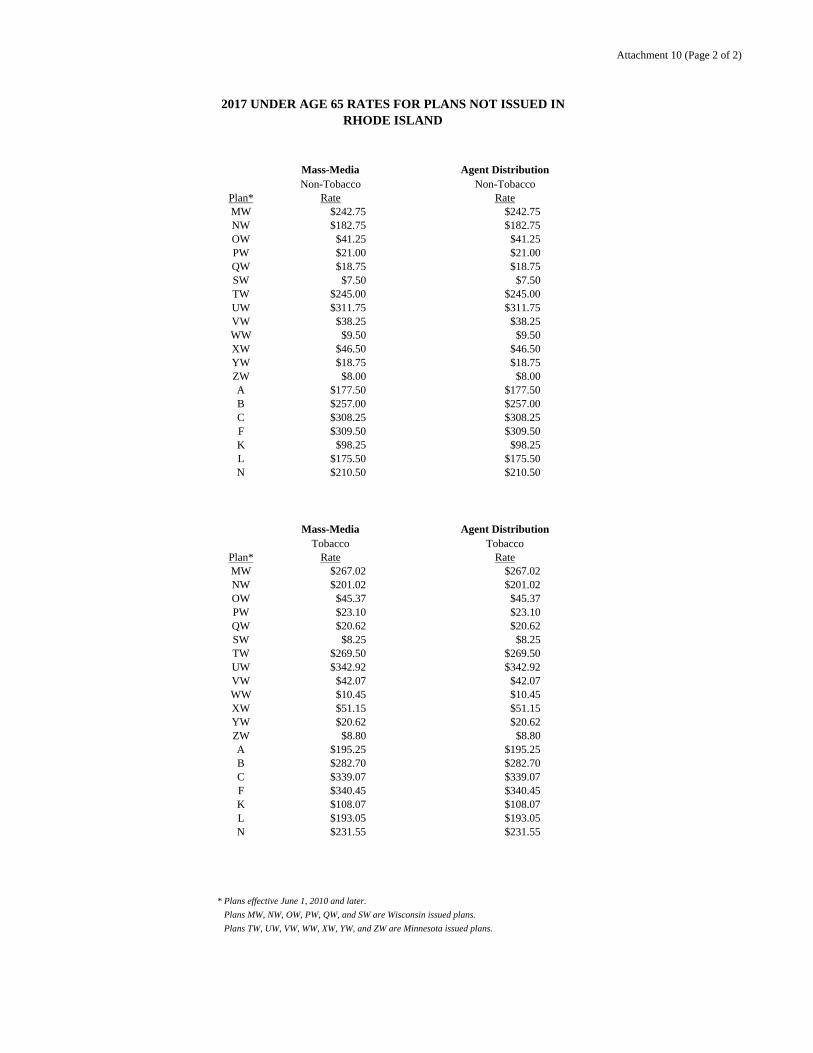
Attachment 10 (Page 2 of 2)
2017 UNDER AGE 65 RATES FOR PLANS NOT ISSUED INRHODE ISLAND
Mass-Media Agent DistributionNon-Tobacco Non-Tobacco
Plan* Rate RateMW $242.75 $242.75NW $182.75 $182.75OW $41.25 $41.25PW $21.00 $21.00QW $18.75 $18.75SW $7.50 $7.50TW $245.00 $245.00UW $311.75 $311.75VW $38.25 $38.25WW $9.50 $9.50XW $46.50 $46.50YW $18.75 $18.75ZW $8.00 $8.00A $177.50 $177.50B $257.00 $257.00C $308.25 $308.25F $309.50 $309.50K $98.25 $98.25L $175.50 $175.50N $210.50 $210.50
Mass-Media Agent DistributionTobacco Tobacco
Plan* Rate RateMW $267.02 $267.02NW $201.02 $201.02OW $45.37 $45.37PW $23.10 $23.10QW $20.62 $20.62SW $8.25 $8.25TW $269.50 $269.50UW $342.92 $342.92VW $42.07 $42.07WW $10.45 $10.45XW $51.15 $51.15YW $20.62 $20.62ZW $8.80 $8.80A $195.25 $195.25B $282.70 $282.70C $339.07 $339.07F $340.45 $340.45K $108.07 $108.07L $193.05 $193.05N $231.55 $231.55
* Plans effective June 1, 2010 and later.
Plans MW, NW, OW, PW, QW, and SW are Wisconsin issued plans.
Plans TW, UW, VW, WW, XW, YW, and ZW are Minnesota issued plans.
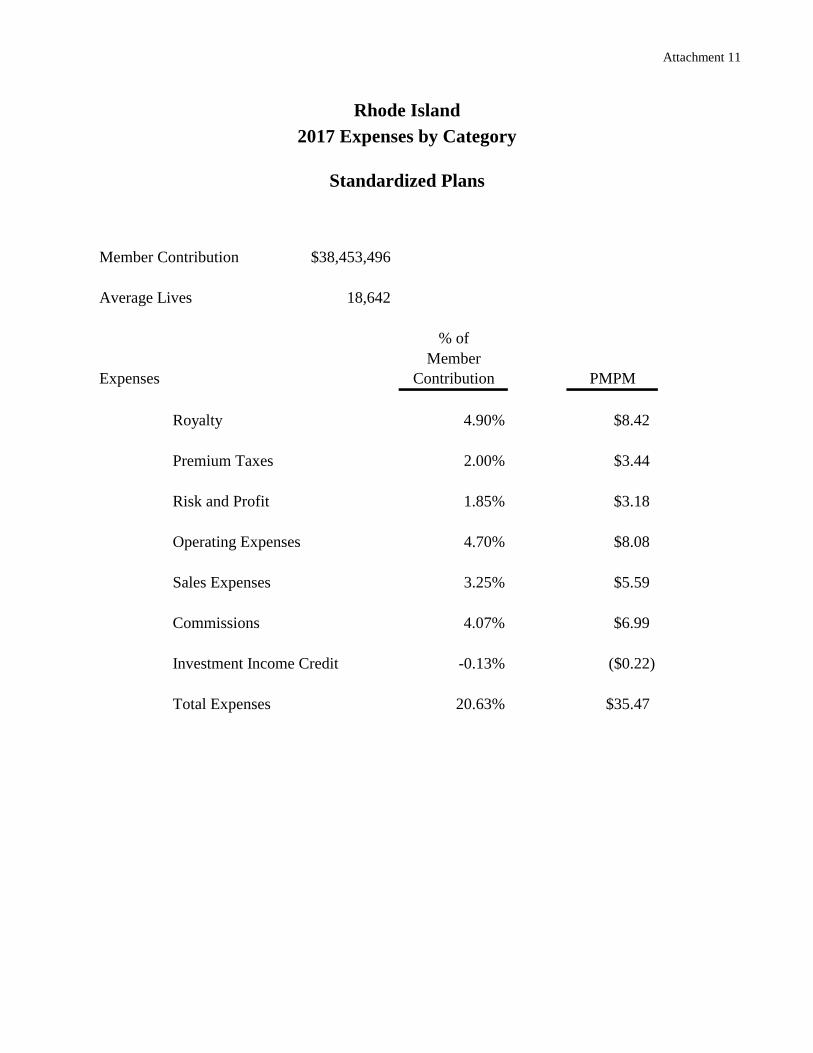
Attachment 11
Rhode Island
2017 Expenses by Category
Standardized Plans
Member Contribution $38,453,496
Average Lives 18,642
% ofMember
Expenses Contribution PMPM
Royalty 4.90% $8.42
Premium Taxes 2.00% $3.44
Risk and Profit 1.85% $3.18
Operating Expenses 4.70% $8.08
Sales Expenses 3.25% $5.59
Commissions 4.07% $6.99
Investment Income Credit -0.13% ($0.22)
Total Expenses 20.63% $35.47
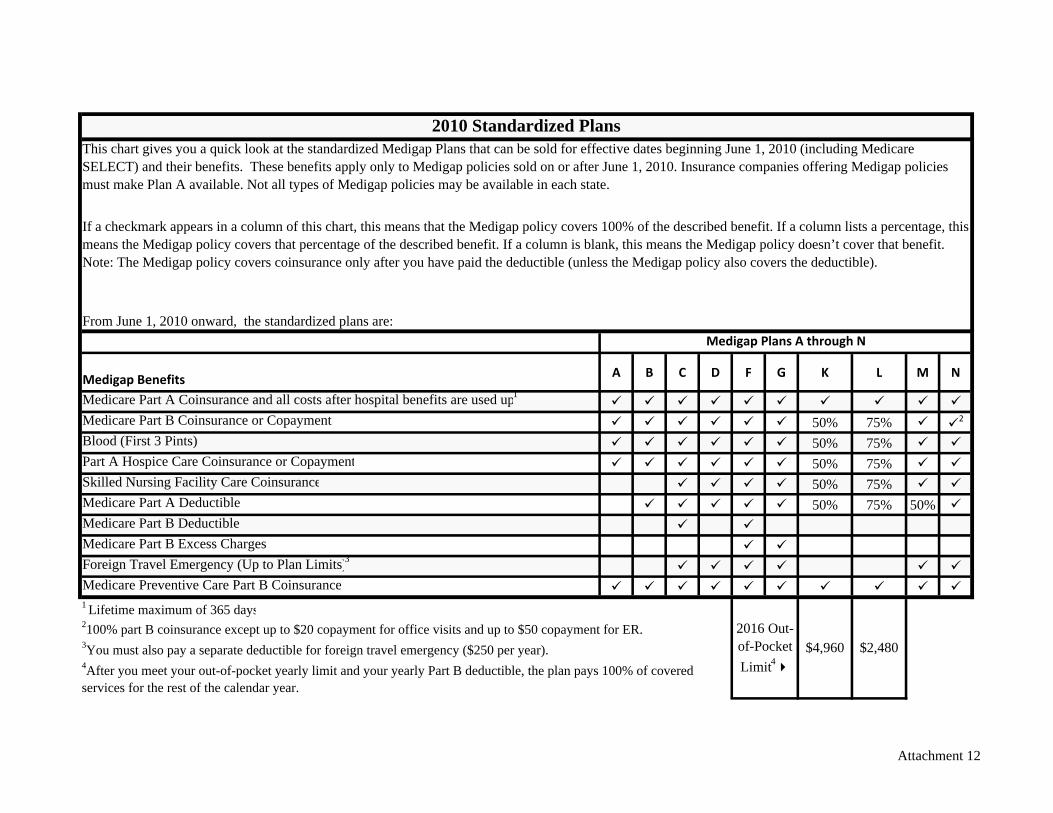
Medigap Benefits A B C D F G K L M N
Medicare Part A Coinsurance and all costs after hospital benefits are used up1
Medicare Part B Coinsurance or Copayment 50% 75% 2
Blood (First 3 Pints) 50% 75% Part A Hospice Care Coinsurance or Copayment 50% 75% Skilled Nursing Facility Care Coinsurance 50% 75% Medicare Part A Deductible 50% 75% 50% Medicare Part B Deductible Medicare Part B Excess Charges Foreign Travel Emergency (Up to Plan Limits)3 Medicare Preventive Care Part B Coinsurance 1 Lifetime maximum of 365 days
2016 Out-of-Pocket
Limit4$4,960 $2,480
2010 Standardized PlansThis chart gives you a quick look at the standardized Medigap Plans that can be sold for effective dates beginning June 1, 2010 (including Medicare SELECT) and their benefits. These benefits apply only to Medigap policies sold on or after June 1, 2010. Insurance companies offering Medigap policies must make Plan A available. Not all types of Medigap policies may be available in each state.
If a checkmark appears in a column of this chart, this means that the Medigap policy covers 100% of the described benefit. If a column lists a percentage, this means the Medigap policy covers that percentage of the described benefit. If a column is blank, this means the Medigap policy doesn’t cover that benefit. Note: The Medigap policy covers coinsurance only after you have paid the deductible (unless the Medigap policy also covers the deductible).
4After you meet your out-of-pocket yearly limit and your yearly Part B deductible, the plan pays 100% of covered services for the rest of the calendar year.
2100% part B coinsurance except up to $20 copayment for office visits and up to $50 copayment for ER.3You must also pay a separate deductible for foreign travel emergency ($250 per year).
From June 1, 2010 onward, the standardized plans are:
Medigap Plans A through N
Attachment 12