film formation and surface tension studies of …10081/fulltext01.pdf · film formation and surface...
TRANSCRIPT
Film Formation andSurface Tension Studies
Of Powder Coatings
JEANETTE ADLER
Master's Degree Project
Stockholm, Sweden 2005
Film Formation and Surface Tension Studies
Of Powder Coatings
Master's Degree Project
JEANETTE ADLER [email protected]
Examiner Mats Johansson
Fiber and Polymer Technology
Royal Institute of Technology
Stockholm, Sweden
Supervisors Anders Larsson
Institute for Surface Chemistry
Stockholm, Sweden
2005

3
Abstract
In industrial use of paint systems a swift processing is crucial. Another very important issue is
to improve the quality of the final coating. This report investigates the film formation process
of powder coatings, specially the spreading of individual powder particles. The obtained
results can be used to understand and control the film formation process. In this way the
desired levelling can be achieved and thus the desired gloss or other surface characteristics
that may be required. This means that the method could be used when evaluating different
polymer and additive combinations that could be used to change film formation behaviour or
curing time for powder coating systems to suit various substrates. It makes it is possible to
avoid and minimize different surface defects as orange peel or cratering in the powder coated
film.
We used a reflection optical microscope to better understand the film formation process and
especially the spreading of a powder melt on surfaces with various surface energies. The
obtained data were: the particle diameter, the area, area ratio and the contact angle of the
powder particle as a function of time and temperature. This information can be used to derive
the surface tension of any powder melt.
In this report we evaluate the dependencies of temperature, heat rate and surface energy for
powder coatings on different substrates. The method provides information that can be used to
optimize the film formation of a specific powder coating/substrate combination. This method
can be used to evaluate the powder spreading and levelling on different substrates from a
surface tension point of view.
We found, as expected, that the powder flows out on a hydrophilic surface and is inhibited by
a hydrophobic. The increase of the area ratio on a hydrophilic surface was about five times as
the initial area coverage and on a hydrophobic surface only two times the initial area
coverage. The contact angle between the melted powder particle on the different surface types
could be calculated. The melt surface tension could be calculated since three substrates
surfaces with various surface energies were used. The melt surface tension was found to be
about 18.5 mN/m.
4
Sammanfattning
Vid industriell användning av ett färgsystem är det viktigt med en snabb och smidig målningsprocess. En viktig del är att förbättra kvaliteten på den färdiga ytan. Denna rapport undersöker filmbildningsprocessen för pulverfärg, närmare bestämt spridningen av individuella pulverpartiklar. Resultaten från utvärderingen av denna metod kan användas för att bättre förstå och få kontroll över filmbildningsprocessen. Med denna undersökningsmetod kan den önskade utslätningen uppnås och därmed den önskade glansen eller annan yteffekt som kan vara önskvärd. Metoden kan användas för att utvärdera olika polymer- och additivkombinationer som kan användas för att ändra filmbildningens uppförande eller bestämma härdningstiden för en pulverfärg att passa ett visst substrat. Metoden gör det möjligt att förhindra och minska olika ytdefekter såsom apelsinskals- eller kratereffekter i pulverfärgens yta. Ett optiskt reflectionsmikroskop användes för att bättre kunna förstå filmbildningsprocessen och särskilt spridningen av smält pulver på substrat med olika ytenergier. De mätdata vi fick var partikeldiameter, area, areaförändring och kontaktvinkeln för pulverpartiklar som funktion av tid och temperatur. Ur denna information kunde pulversmältans ytenergier härledas. I denna rapport utvärderas pulvrets beroende av temperatur, uppvärmning och ytenergi på olika substrat. Denna metod ger information som kan användas för att optimera filmbildningen av en specifik kombination av pulverfärg och substrat. Denna metod kan också användas för att utvärdera pulverspridning och utjämning av färgfilmen på olika substrat med avseende på ytenergierna. Som förväntat flyter pulvret ut på hydrofila ytor och utflytningen ändras på en hydrofob yta. På en hydrofil yta sprider sig partikeln till fem gånger den ursprungliga arean över substratet och motsvarande två gånger för en hydrofob yta. Kontaktvinkeln mellan en smält pulverpartikel på olika sorters substrat från utförda mätningar beräknas utifrån utförda mätningar. Kontaktvinklar mellan pulver och olika substrat kan användas för att beräkna smältans ytspänning. Smältans ytspänning kan beräknas då experiment gjorts på tre sorters ytor med olika kända ytenergier. Smältans ytspänning var 18,5 mN/m. Slutsatsen är att det går att observera och utvärdera resultaten av utsmältningsförloppet för pulverfärg med denna metod.
5
1 INTRODUCTION 7
2 AIM OF THIS WORK 7
3 THEORY 7
3.1 AN INTRODUCTION TO POWDER COATINGS 7 3.2 HOW POWDER COATINGS WORKS 7 3.2.1 UV-CURING 10 3.2.1.1 UV- curing in general 10 3.2.1.2 UV-curable Powder Coatings 10 3.3 FILM FORMATION 11 3.3.1 WETTING/SPREADING OF POWDER PARTICLES ON A SUBSTRATE 11 3.3.2 COALESCENCE 12 3.3.3 FILM FLOW AND LEVELLING OF COATINGS 13 3.4 OPTIMISING FILM FORMATION 14 3.4.1 PARAMETERS INFLUENCING POWDER COATING PROPERTIES 16 3.5 SUBSTRATE SURFACE 17 3.6 CALCULATIONS OF POWDER PARTICLE SPREADING 17 3.7 SURFACE ENERGIES, LEWIS ACID-BASE AND LIFSHITZ-VAN DER WAALS FORCES 19 3.7.1 THE SUBSTRATE SURFACE 19 3.7.2 SURFACE TENSIONS OF A POWDER COATING MELT 19
4 EXPERIMENTAL 20
4.1 MATERIALS 20 4.2 METHODS 20 4.2.1 MOLECULAR WEIGHT AND DISTRIBUTION 20 4.2.2 MELTING POINT 20 4.2.3 PREPARATION OF SUBSTRATE SURFACES 21 4.2.4 CONTACT ANGLE MEASUREMENTS 21 4.2.5 POWDER PARTICLE SPREADING 22 4.2.5.1 Microscope Set-up 22 4.2.5.2 Heating of the Powder on the Substrates 22 4.2.6 EVALUATION OF SURFACE ENERGY AND FORCE CHARACTERISTICS 23
5 RESULTS AND DISCUSSION 24
5.1 MOLECULAR WEIGHT AND MOLECULAR WEIGHT DISTRIBUTION 24 5.2 MELTING POINT 25 5.3 PREPARATION OF SUBSTRATE SURFACES 26 5.4 CONTACT ANGLE MEASUREMENTS 26 5.5 POWDER PARTICLE SPREADING 27 5.6 EVALUATION OF SURFACE ENERGIES, LEWIS ACID-BASE AND LIFSHITZ-VAN DER WAALS FORCES 34 5.6.1 SUBSTRATES 35 5.6.2 POWDER MELT 35
6 CONCLUSIONS 36

6
7 FURTHER WORK/PROPOSAL FOR FURTHER WORK 36
8 ACKNOWLEDGEMENTS 37
9 REFERENCES 38
APPENDIX I____________________________________________________________ _______i APPENDIX II_________________________________________________________ ________iv
7
1 Introduction When powder coating, one wants to be able to control the smoothness of the coating. The tool
to achieve this is a better control of the film formation process. To understand how to control
the film formation process we have to gain knowledge about the actual spreading
development of the powder particles. Different substrates as for instance hydrophobic and
hydrophilic surfaces affect the ability for coatings to flow and spread on a surface. Parameters
that can affect the film formation are for instance: melt temperature, viscosity and surface
tension of the powder and the surface energy of the substrate. The requirements of the final
result govern the formulation of a powder-coating product for a specific powder
coating/substrate combination.
2 Aim of this work This work is aiming at a better understanding of the spreading of powder coatings. The
spreading is one part of the film formation process. The film formation can be divided into
three parts spreading, coalescence and levelling. The spreading should be understood with
respect to temperature, heating-rate and surface energy of various substrates. We used a
simplified model system with an especially prepared spherical powder on purified substrates.
We observed the change of the area ratio as a function of time when spreading only one
particle at a time.
The aim for this work was to test a specific method for observing the spreading of powder
coatings. The spreading on different substrates, with respect to temperature, heating-rate and
surface energy, is part of the film formation process. The method is based on a simplified
model in which spherical particles were used on specially prepared purified substrates. The
key component of this method was the ability to observe powder particle spreading in-situ.
Other methods, as the Wilhelmy balance method only looks at surface tension of the polymer
melt to understand the film formation and wetting process.
3 Theory
3.1 An introduction to powder coatings
Surfaces with powder coatings can be found on a large range of different mainly metal objects
in our everyday life, such as furniture or refrigerators. The powder are milled small grains of a
formulated polymer material, ready to be used. Binder, pigment, film flow agents and all
other additives in the powder form together a coating on the substrate. No solvents are
needed, not even water, why powder coatings are more environmental safe than many other
paint systems. For a fundamental understanding of powder coating I recommend Powder
Coatings Chemistry and Technology, T. A. Misev [1] or a more updated version with the
same title but a new author, Pieter Gillis de Lange [2]
3.2 How powder coatings works
8
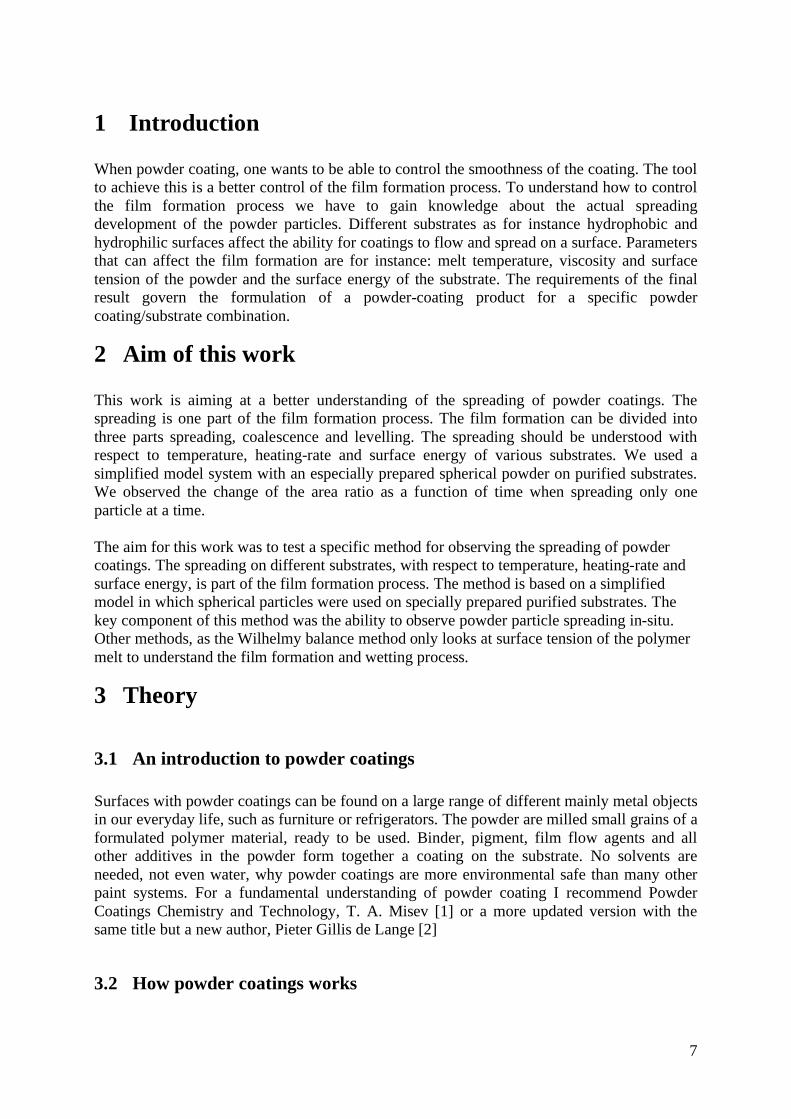
In short, painting with powders can be described as follows figure 1a-c. The powder is
suspended in air. An electrostatic attractive force sticks the dry charged powder particles to
the grounded substrate. The powder is heated and melts reaching a low viscosity, spreads and
form a film. The film polymerises, cross-links, to a relatively hard thin surface layer. By the
choice of polymer additives and formulation the properties of the final coating can be
influenced and adjusted to fit a variety of applications.
Figure 1a Milled
polymer powder [3].
Figure 1b Powder
spread over the surface
[4].
Figure 1c Powder heated,
in this case by IR-light [5].
Figure 1d The final
coating [6].
Painting with powder coatings is a relatively simple and over all a fast process why it is
convenient for industrial usage. To be cost effective the series of components should be fairly
large since the painting equipment is expensive. An even powder layer is applied to the
substrate. This can be done in a variety of ways for example by using a fluidized bed,
electrostatic spraying and plasma spraying. For example in a fluidized bed the particles are
charged by ionized air, the charged particles repel each other and form a “bed” of powder. A
grounded substrate is placed in the “bed” and the particles are drawn to the substrate to form
an even layer. When the powder layer is evenly distributed heat is applied to the object for the sintering and coalescence process. The grains melt to form an even and smooth film layer (coating) and curing of the binder can be initialised. The polymerization leads to a cross linkage of the molecules, or in other words more commonly known “the paint is drying”. How the paint hardens or cure depends on the kind of polymer and additives used. A UV-cured polymer takes only seconds to cure while other polymers as thermosetting polymers could crave for higher curing temperatures in an oven, which in that case demands longer processing time and crave substrates that can withstand that high temperatures. Drawbacks with all powder coatings systems are the expensive equipment and the high operating temperatures to melt the powder into a film.
A problem with thermosetting powder coatings, the most commonly used powder today, is
the curing temperature of 140-200°C. A high curing temperature is necessary to prevent
polymerisation and sintering of the particles to take place while storage. Storage stability is
related to the reactivity of the components, if too reactive the powder will polymerise during
storage and if too little reactive the powder will require a higher temperature when stoving to
polymerise. Hence the reactivity must be tuned and that can be understood from the Arrenius
equation. The Arrenius equation 1, displays that the higher activation energy (reactivity)
demands an increasing temperature for the rate coefficient (of polymerisation) to increase.
The different parts of the equation are; rate coefficient K, the constant A, the activation
energy Ea, gas constant R and temperature T. ln K is plotted against 1/T and has a straight line
with an intercept ln A and the slope –Ea/R [2, 7].
9
lnK = ln AEa
RT
Equation 1 A logarithmic form of the Arrenius eq. that describes the reaction kinetics.
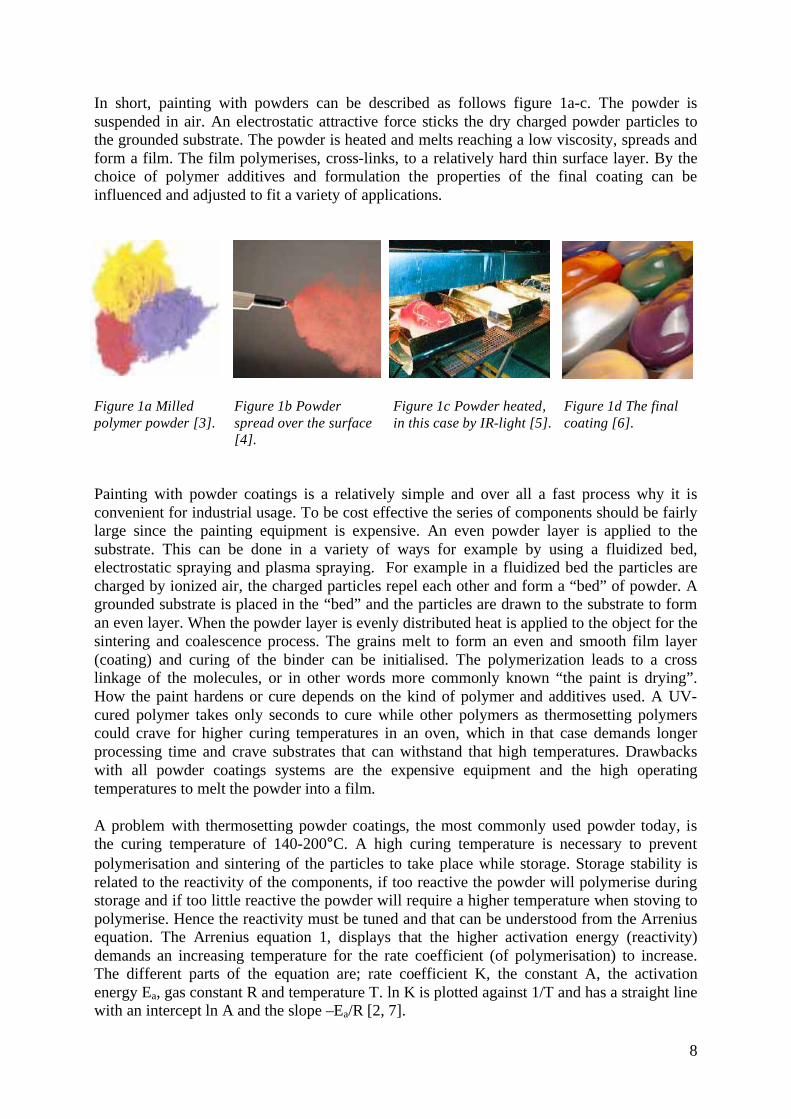
One way of influencing the curing reaction of a thermoplastic powder is the use of catalysts as
illustrated in figure 2. Line (1 and 2) that represents different concentrations of the same
catalyst gives that a higher concentration brings an earlier curing of the polymer. Line 3
demonstrates a steeper slope, a higher activation energy and pre-exponential parameter.
Finally line 4 shows a latent catalyst and the delay of the reaction forms a piecewise linear
increasing function. That is for line 4 a low reactivity in the Tstorage temperature range and a
higher reactivity of the powder when heated to Tstoving.
Figure 2 Arrenius plot of curing reactions catalyzed with different concentrations of the same catalyst
(1 and 2), a catalyst with higher activation energy and pre-exponential parameter (3) and a latent
catalyst (4) (arbitrary units) [2].
Heat sensitive objects are very difficult to paint with powder coatings. Wood or plastics that cannot withstand high temperatures are therefore quite difficult to cover with “thermosetting” powder coatings. Heat sensitive substrates such as wood, MDF, plastics and paper needs
lower temperatures. A low curing temperature gives problems to achieve good storage
stability and/or good film forming properties for thermosetting powders. Therefore a system
with a latent catalysis that can be activated after film formation like in a UV-curing system
could overcome the problem described above. A good combination of storage stability and
high curing speed can be achieved [2].
10
3.2.1 UV-Curing
There is a variety of polymer material used for powder coatings. Powder formulations can be
tailored to fit a certain application, depending on what substrate is to be used or what
demands is set on the final coating regarding finish, toughness, scratch resistant,
weatherability etc. Over the years development of powder coating has given us a variety of
polymer formulations to choose from. One relatively recent development is the introduction
of UV-curing techniques for powder coatings.
3.2.1.1 UV- curing in general
UV-curing of coatings is a process where the polymerization (drying) is initiated by irradiation with UV-light. The UV-light is absorbed by photo-initiators, which are activated upon irradiation to form initiating species that starts the polymerisation. One main advantage with this process is that the coating is stable on storage as long as it is protected from UV-light. The wet-film formation can thus be decoupled from the curing. More details on UV-curing can be found in various textbooks such as Exploring the Science, Technology and Applications of UV and EB Curing, [8]. UV curing commences either by a free radical or a cationic polymerisation that is initiated by
a photo initiator.
With radical polymerization photo-initiators forms, during UV radiation, free radicals, which
initiate the polymerization of the unsaturated binder system.
With cationic polymerization (only used for epoxy resins) the photo-initiators are onium salts
producing cat ions of strong Lewis or Bronstedt acids upon irradiation [2].
Radical Polymerisation Cationic polymerisation
o Shrinking
o No inhibition by water
o Inhibition by oxygen
o Very fast curing (in seconds)
o Very little shrinking
o Inhibition by water
o No inhibition by oxygen
o Somewhat longer curing (but also sec.)
Comparing radical and cationic polymerisation
3.2.1.2 UV-curable Powder Coatings With the help of photo-initiators and UV irradiation to initiate curing of the polymer powder
there is an opening for lowering processing temperatures since the polymer blend is stable
until exposed to UV-light. By combining UV irradiation with infra-red (IR) heating instead of
a conventional oven, the film formation process can be done without affecting heat sensitive
substrates. In other words reduced heat impact on the substrate.
In a UV-curing process the first step is to let the powder melt, sinter and the resulting film
spread to a smooth homogeneous surface and then the polymer is cured by UV irradiation. In
this way the film can level out before curing. Thermally curing systems level and cure partly

11
simultaneously leading to an increased viscosity and more surface defects. Another feature is
energy savings when using decreased temperature and a swift processing.
3.3 Film formation
Film formation takes places by heating the powder particles. The individual particles melts
and simultaneously spread on the surface and sinter together. Thereafter the melt flows out
and level, to a smooth surface. Preferably the cross linking occur as a final step after levelling,
to reach a high molecular weight film. This can for example be obtained by UV-curing
techniques.
Figure 3 Levelling, spreading of powder coating
3.3.1 Wetting/Spreading of Powder Particles On a Substrate
Spreading of a melted powder particle over a substrate can only occur when the melt has a
surface tension that is lower than the surface energy of the substrate. That is when the
spreading coefficient (S) is positive in Young’s equation 2. S depends of the following
interfacial tensions; the substrate/vapour SV,, the melt (liquid)/vapour LV and the
substrate/melt SL., see Figure 3 [9].
S = SV LV cos SL
Equation 2
LV
SVmelt
SLsubstrate
Figure 4. A contact angle ( ) between a substrate and the tangent of the molten powder surface revels
the surface energy values [10].
12
How well a liquid wet a substrate surface and spread is distinguished by measuring the
contact angle that a liquid droplet in equilibrium forms together with the surface. When the
liquid covers the whole surface the contact angle is 0°. If the contact angle is higher than 90°
the liquid wetting will be hindered and spreading will not occur [10].
The property that describes the restrictions of the flow is the viscosity that is a higher
viscosity means higher restriction for flow.
To obtain as good film formation as possible it is necessary to control how the viscosity and
the surface tension of the melt changes with temperature and polymerisation. It is simple to
study the viscosity but considerably more difficult to study the surface tension, since the melt
has a high temperature [9].
3.3.2 Coalescence
Coalescence is when powder particles sinter together, that is grows or melts together into one
solid unit. Several different models exist that describes this process.
Important factors that governs coalescence at a certain temperature are the melting point of
the polymer, the viscosity of the melted powder particles and the size of the particles [11].
The Nix and Dodges, equation 3, describes the time needed for separate particles to coalesce.
The time t needed for coalescence, at a constant temperature is proportional to the viscosity ,
the mean radius of curvature Rc and inversely proportional to the surface tension . Rc can to
begin with be approximated as the particle diameter [9].
t = fRc
Equation 3 Nix and Dodge equation
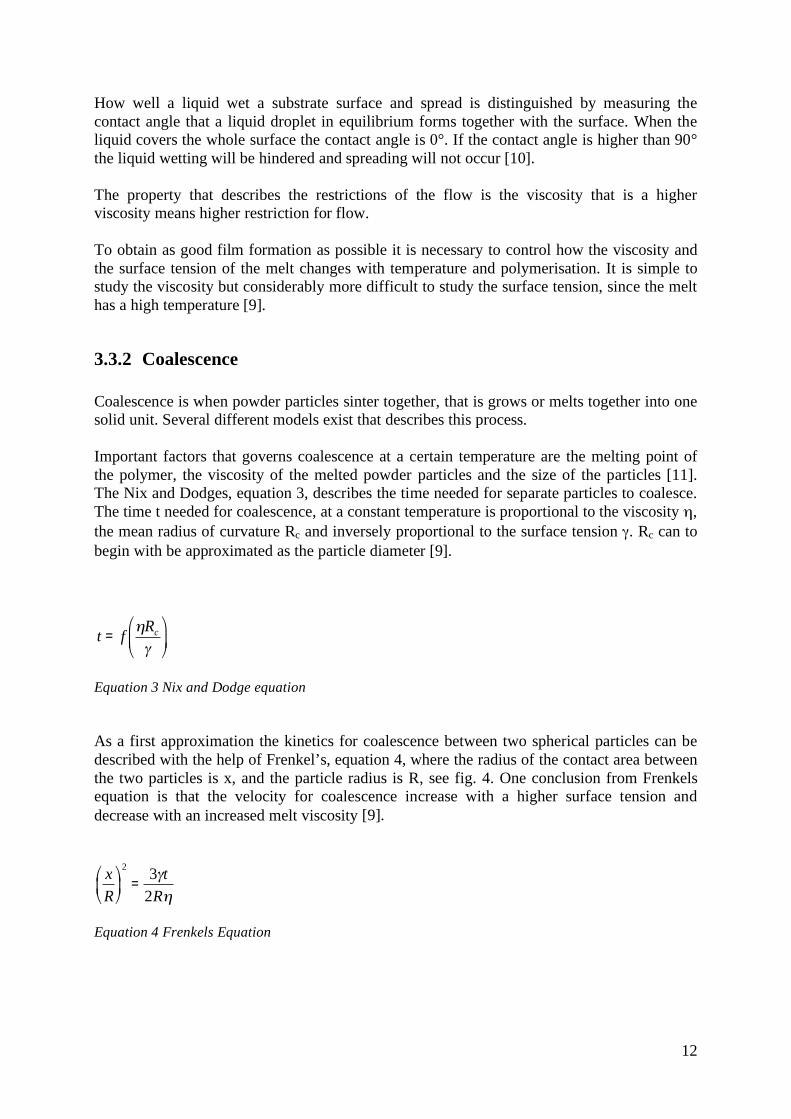
As a first approximation the kinetics for coalescence between two spherical particles can be described with the help of Frenkel’s, equation 4, where the radius of the contact area between the two particles is x, and the particle radius is R, see fig. 4. One conclusion from Frenkels equation is that the velocity for coalescence increase with a higher surface tension and decrease with an increased melt viscosity [9].
x
R
2
=3 t
2R
Equation 4 Frenkels Equation
13
x
R
Figure 5. Coalescence between two spherical particles with the particle radius R and the contact area
radius x displayed.
Both these equations however assume that the viscosity and surface tension are constant. The
coalescence of powder coating particles however normally coalesce during a temperature
increase. This makes a complete description much more complex to describe. One way to
improve the understanding is thus to reveal how the surface tension and viscosity vary with
temperature.
3.3.3 Film flow and levelling of coatings
After coalescence of the particles, the powder coating forms a continues film layer by
spreading over the substrate into an even layer, which is described by Rhodes and Orchards
equation 5. The equation describes the process very well [1, 9].
If surface tension and viscosity is assumed constant, at a given temperature, then the
velocity of levelling can be described in equation 5 [9]. The constant k = (16 4)/3) [1].
lna0
at
= k
h3
4 dt0
t
Equation 5 Levelling velocity if surface tension and viscosity of the polymer melt is assumed constant
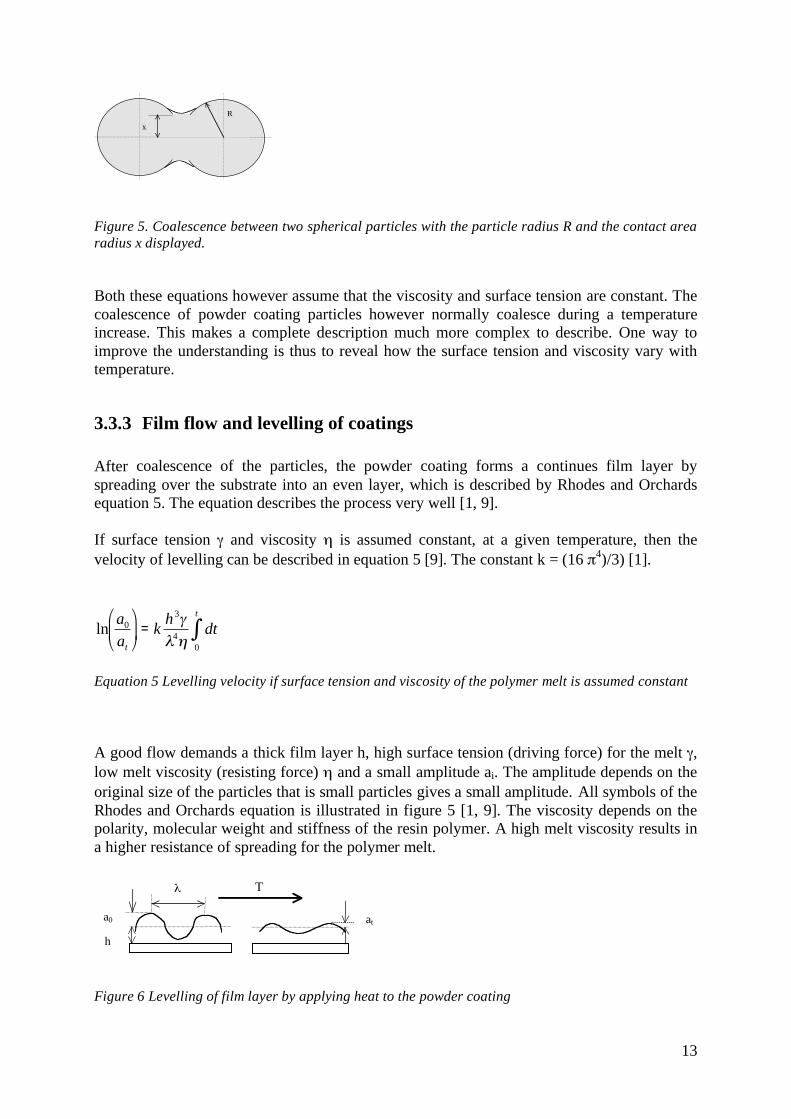
A good flow demands a thick film layer h, high surface tension (driving force) for the melt ,
low melt viscosity (resisting force) and a small amplitude ai. The amplitude depends on the
original size of the particles that is small particles gives a small amplitude. All symbols of the
Rhodes and Orchards equation is illustrated in figure 5 [1, 9]. The viscosity depends on the
polarity, molecular weight and stiffness of the resin polymer. A high melt viscosity results in
a higher resistance of spreading for the polymer melt.
a0
h
at
T
Figure 6 Levelling of film layer by applying heat to the powder coating
14
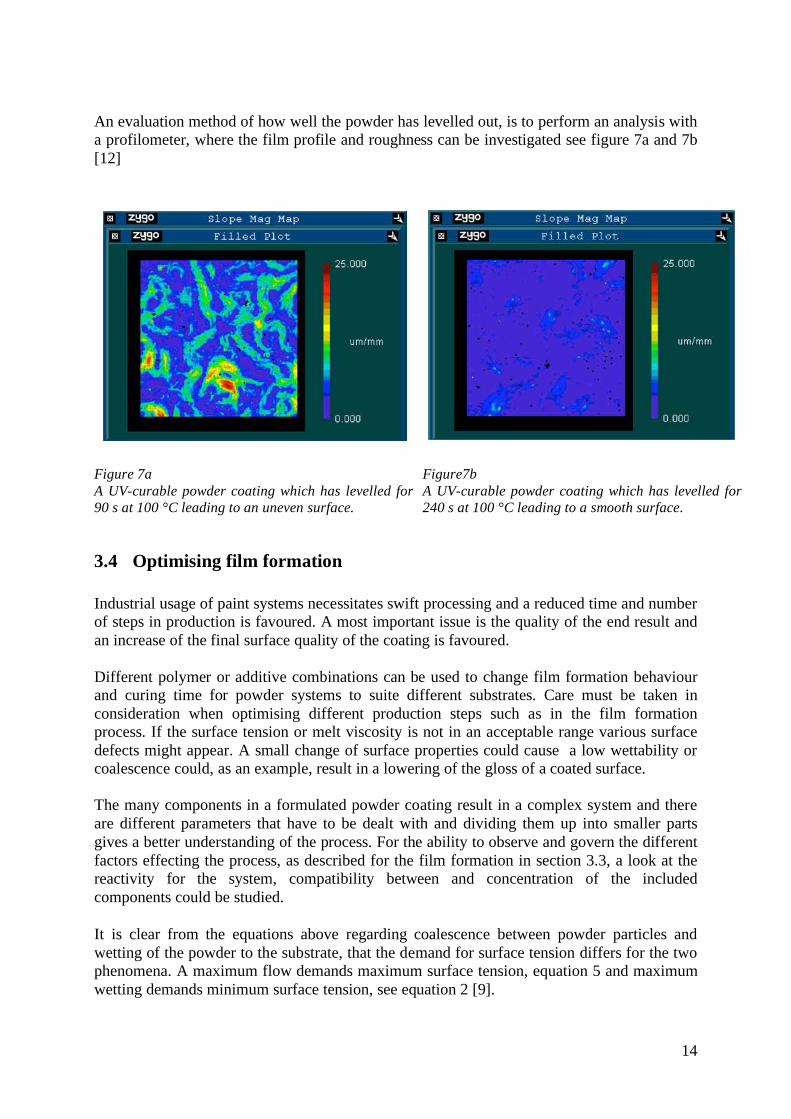
An evaluation method of how well the powder has levelled out, is to perform an analysis with
a profilometer, where the film profile and roughness can be investigated see figure 7a and 7b
[12]
Figure 7a
A UV-curable powder coating which has levelled for
90 s at 100 °C leading to an uneven surface.
Figure7b
A UV-curable powder coating which has levelled for
240 s at 100 °C leading to a smooth surface.
3.4 Optimising film formation
Industrial usage of paint systems necessitates swift processing and a reduced time and number
of steps in production is favoured. A most important issue is the quality of the end result and
an increase of the final surface quality of the coating is favoured.
Different polymer or additive combinations can be used to change film formation behaviour
and curing time for powder systems to suite different substrates. Care must be taken in
consideration when optimising different production steps such as in the film formation
process. If the surface tension or melt viscosity is not in an acceptable range various surface
defects might appear. A small change of surface properties could cause a low wettability or
coalescence could, as an example, result in a lowering of the gloss of a coated surface.
The many components in a formulated powder coating result in a complex system and there are different parameters that have to be dealt with and dividing them up into smaller parts gives a better understanding of the process. For the ability to observe and govern the different factors effecting the process, as described for the film formation in section 3.3, a look at the reactivity for the system, compatibility between and concentration of the included components could be studied.
It is clear from the equations above regarding coalescence between powder particles and
wetting of the powder to the substrate, that the demand for surface tension differs for the two
phenomena. A maximum flow demands maximum surface tension, equation 5 and maximum
wetting demands minimum surface tension, see equation 2 [9].
15
When the temperature increases and film formation develops the surface tension decrease
which is a problem, since it would be more convenient for the surface tension to be the other
way around. This problem can be solved by a compromise or if the surface tension
temperature dependency could be minimised [9].There could also be a change in composition
between the paint main ingredients [11]
It is necessary to reach a certain minimum viscosity for good flow and the time needed to
reach a satisfyingly viscosity at a certain heating rate is dependent of the powder formulation.
A normal heating rate of about 10-30 °C/min is used in practice. When using a temperature
cured powder coating a high heating rate is preferable to obtain a good levelling of the
powder coating, while UV-cured powder coatings is not that dependent of higher heating rates
[1].
A normal heating temperature of the powder is a temperature of 30-50°C above Tg or Tm
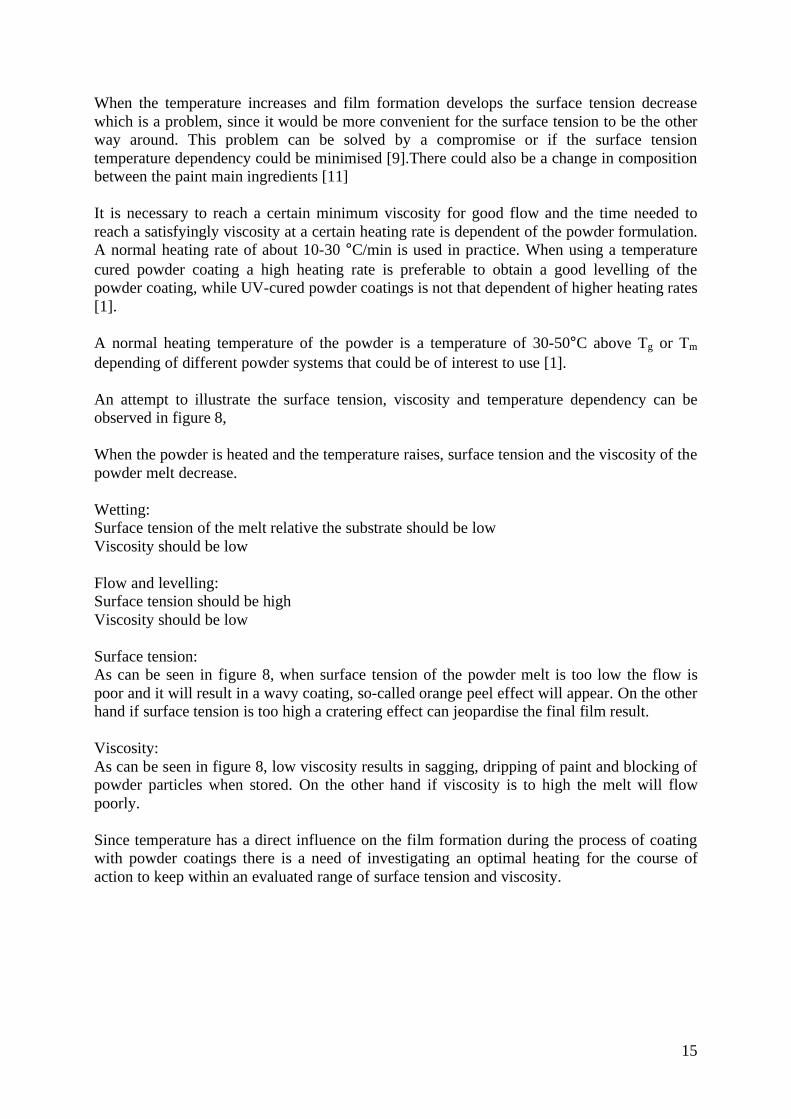
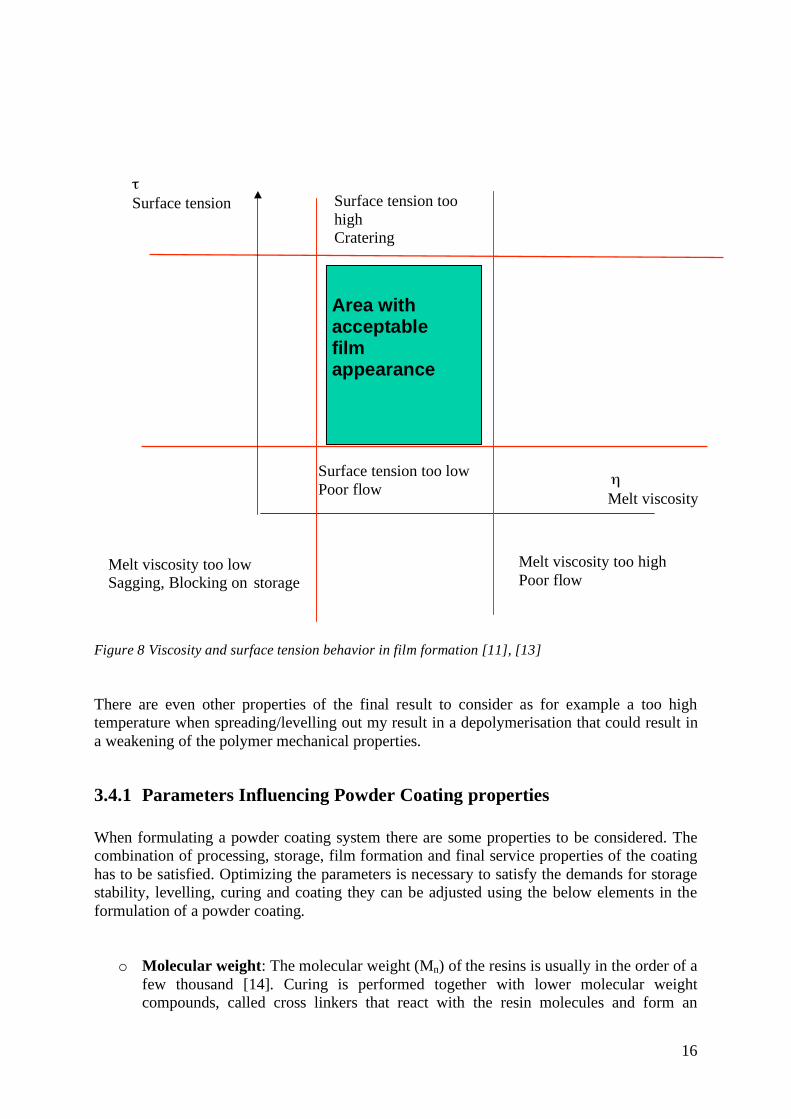
depending of different powder systems that could be of interest to use [1]. An attempt to illustrate the surface tension, viscosity and temperature dependency can be
observed in figure 8,
When the powder is heated and the temperature raises, surface tension and the viscosity of the
powder melt decrease.
Wetting:
Surface tension of the melt relative the substrate should be low
Viscosity should be low
Flow and levelling:
Surface tension should be high
Viscosity should be low
Surface tension:
As can be seen in figure 8, when surface tension of the powder melt is too low the flow is
poor and it will result in a wavy coating, so-called orange peel effect will appear. On the other
hand if surface tension is too high a cratering effect can jeopardise the final film result.
Viscosity:
As can be seen in figure 8, low viscosity results in sagging, dripping of paint and blocking of
powder particles when stored. On the other hand if viscosity is to high the melt will flow
poorly.
Since temperature has a direct influence on the film formation during the process of coating
with powder coatings there is a need of investigating an optimal heating for the course of
action to keep within an evaluated range of surface tension and viscosity.
16
Figure 8 Viscosity and surface tension behavior in film formation [11], [13]
There are even other properties of the final result to consider as for example a too high
temperature when spreading/levelling out my result in a depolymerisation that could result in
a weakening of the polymer mechanical properties.
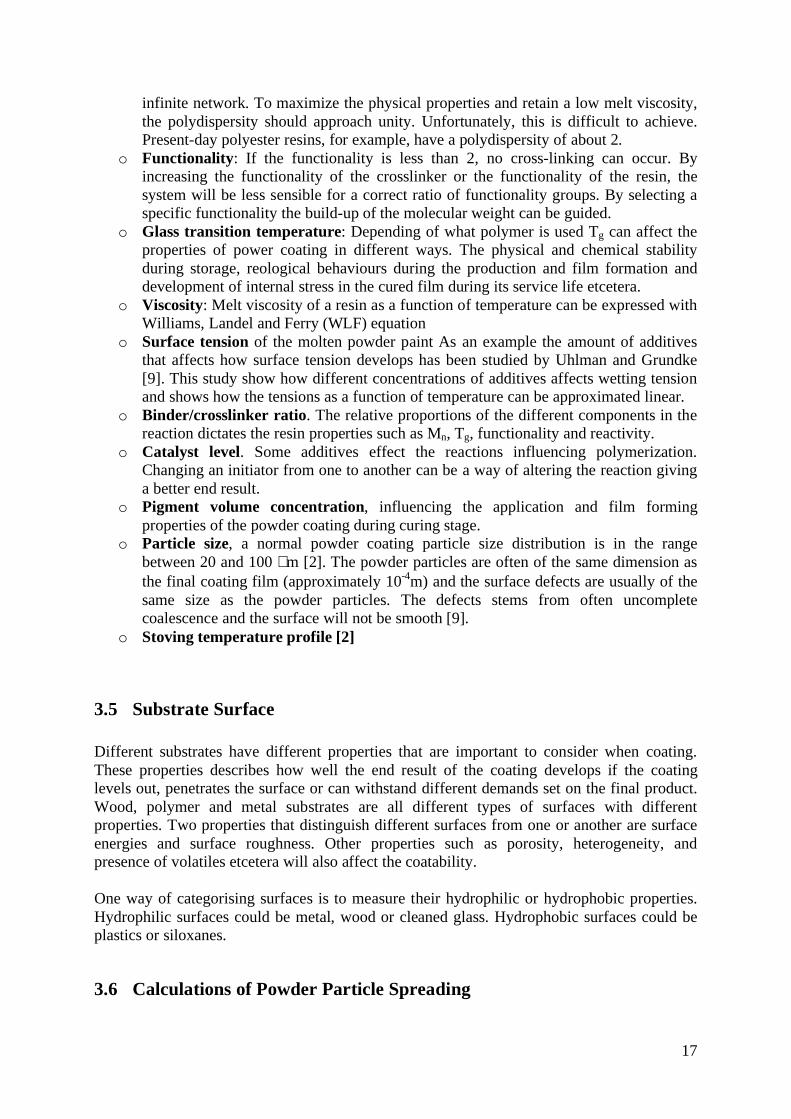
3.4.1 Parameters Influencing Powder Coating properties
When formulating a powder coating system there are some properties to be considered. The
combination of processing, storage, film formation and final service properties of the coating
has to be satisfied. Optimizing the parameters is necessary to satisfy the demands for storage
stability, levelling, curing and coating they can be adjusted using the below elements in the
formulation of a powder coating.
o Molecular weight: The molecular weight (Mn) of the resins is usually in the order of a
few thousand [14]. Curing is performed together with lower molecular weight
compounds, called cross linkers that react with the resin molecules and form an
Melt viscosity too high
Poor flow
Melt viscosity
Surface tension Surface tension too
high
Cratering
Surface tension too low
Poor flow
Melt viscosity too low
Sagging, Blocking on storage
Area with acceptable film appearance
17
infinite network. To maximize the physical properties and retain a low melt viscosity,
the polydispersity should approach unity. Unfortunately, this is difficult to achieve.
Present-day polyester resins, for example, have a polydispersity of about 2.
o Functionality: If the functionality is less than 2, no cross-linking can occur. By
increasing the functionality of the crosslinker or the functionality of the resin, the
system will be less sensible for a correct ratio of functionality groups. By selecting a
specific functionality the build-up of the molecular weight can be guided.
o Glass transition temperature: Depending of what polymer is used Tg can affect the
properties of power coating in different ways. The physical and chemical stability
during storage, reological behaviours during the production and film formation and
development of internal stress in the cured film during its service life etcetera.
o Viscosity: Melt viscosity of a resin as a function of temperature can be expressed with
Williams, Landel and Ferry (WLF) equation
o Surface tension of the molten powder paint As an example the amount of additives
that affects how surface tension develops has been studied by Uhlman and Grundke
[9]. This study show how different concentrations of additives affects wetting tension
and shows how the tensions as a function of temperature can be approximated linear.
o Binder/crosslinker ratio. The relative proportions of the different components in the
reaction dictates the resin properties such as Mn, Tg, functionality and reactivity.
o Catalyst level. Some additives effect the reactions influencing polymerization.
Changing an initiator from one to another can be a way of altering the reaction giving
a better end result.
o Pigment volume concentration, influencing the application and film forming
properties of the powder coating during curing stage.
o Particle size, a normal powder coating particle size distribution is in the range
between 20 and 100 µm [2]. The powder particles are often of the same dimension as
the final coating film (approximately 10-4
m) and the surface defects are usually of the
same size as the powder particles. The defects stems from often uncomplete
coalescence and the surface will not be smooth [9].
o Stoving temperature profile [2]
3.5 Substrate Surface
Different substrates have different properties that are important to consider when coating.
These properties describes how well the end result of the coating develops if the coating
levels out, penetrates the surface or can withstand different demands set on the final product.
Wood, polymer and metal substrates are all different types of surfaces with different
properties. Two properties that distinguish different surfaces from one or another are surface
energies and surface roughness. Other properties such as porosity, heterogeneity, and
presence of volatiles etcetera will also affect the coatability.
One way of categorising surfaces is to measure their hydrophilic or hydrophobic properties.
Hydrophilic surfaces could be metal, wood or cleaned glass. Hydrophobic surfaces could be
plastics or siloxanes.
3.6 Calculations of Powder Particle Spreading
18
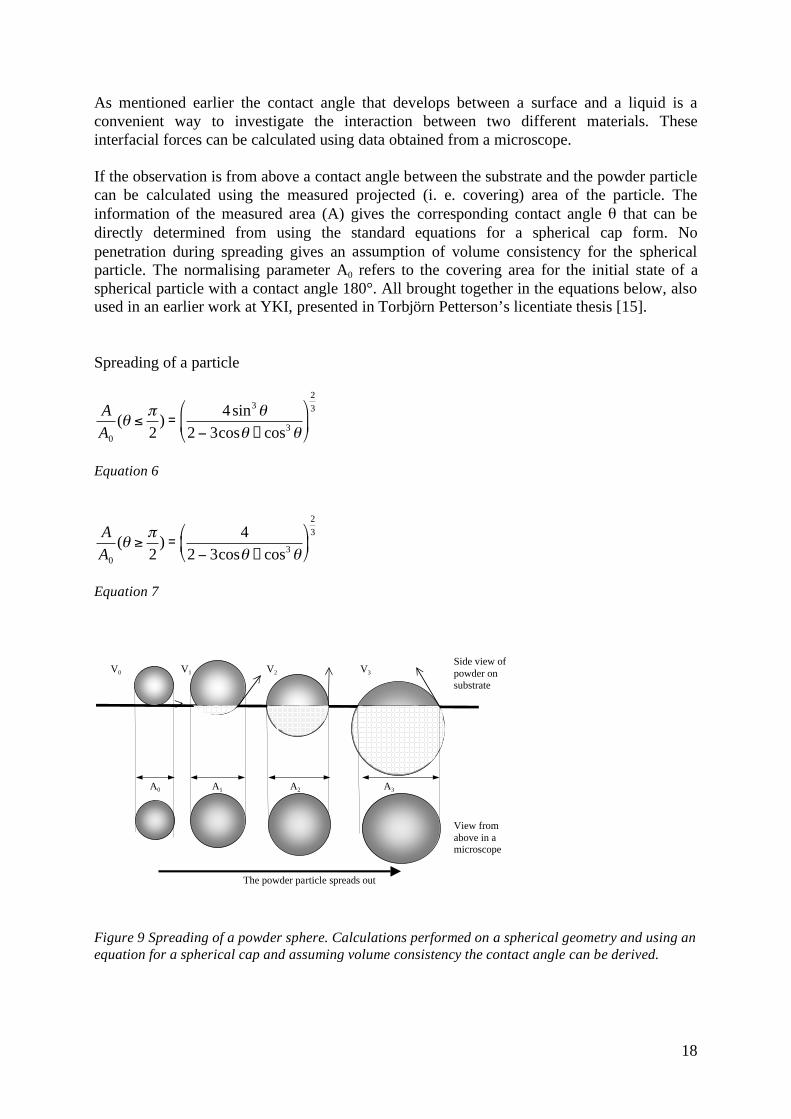
As mentioned earlier the contact angle that develops between a surface and a liquid is a convenient way to investigate the interaction between two different materials. These interfacial forces can be calculated using data obtained from a microscope. If the observation is from above a contact angle between the substrate and the powder particle can be calculated using the measured projected (i. e. covering) area of the particle. The information of the measured area (A) gives the corresponding contact angle that can be directly determined from using the standard equations for a spherical cap form. No penetration during spreading gives an assumption of volume consistency for the spherical particle. The normalising parameter A0 refers to the covering area for the initial state of a spherical particle with a contact angle 180°. All brought together in the equations below, also used in an earlier work at YKI, presented in Torbjörn Petterson’s licentiate thesis [15]. Spreading of a particle
A
A0
(2
) =4sin3
2 3cos + cos3
2
3
Equation 6
A
A0
(2
) =4
2 3cos + cos3
2
3
Equation 7
A0 A1 A3A2
V3V2V1V0
Side view ofpowder onsubstrate
View fromabove in amicroscope
The powder particle spreads out
Figure 9 Spreading of a powder sphere. Calculations performed on a spherical geometry and using an
equation for a spherical cap and assuming volume consistency the contact angle can be derived.
19
3.7 Surface Energies, Lewis Acid-Base and Lifshitz-Van Der Waals Forces
In powder coatings, melt surface tensions have an important role in film formation. The
surface tension of the powder must be adjusted to suit the substrate to be covered. In this way
levelling and hence gloss can be controlled. By adding additives surface tension can be
controlled and accustomed.
3.7.1 The substrate surface
A way of evaluating the surface tension of a solid surface is to measure the contact angle from
three different liquids with known surface energy components onto the substrate surface.
Wetting phenomena of a substrate can be described with surface energies. Energies derived
by measuring the contact angle that is caused by surface tensions balanced as in the Young’s
equation, equation 2.
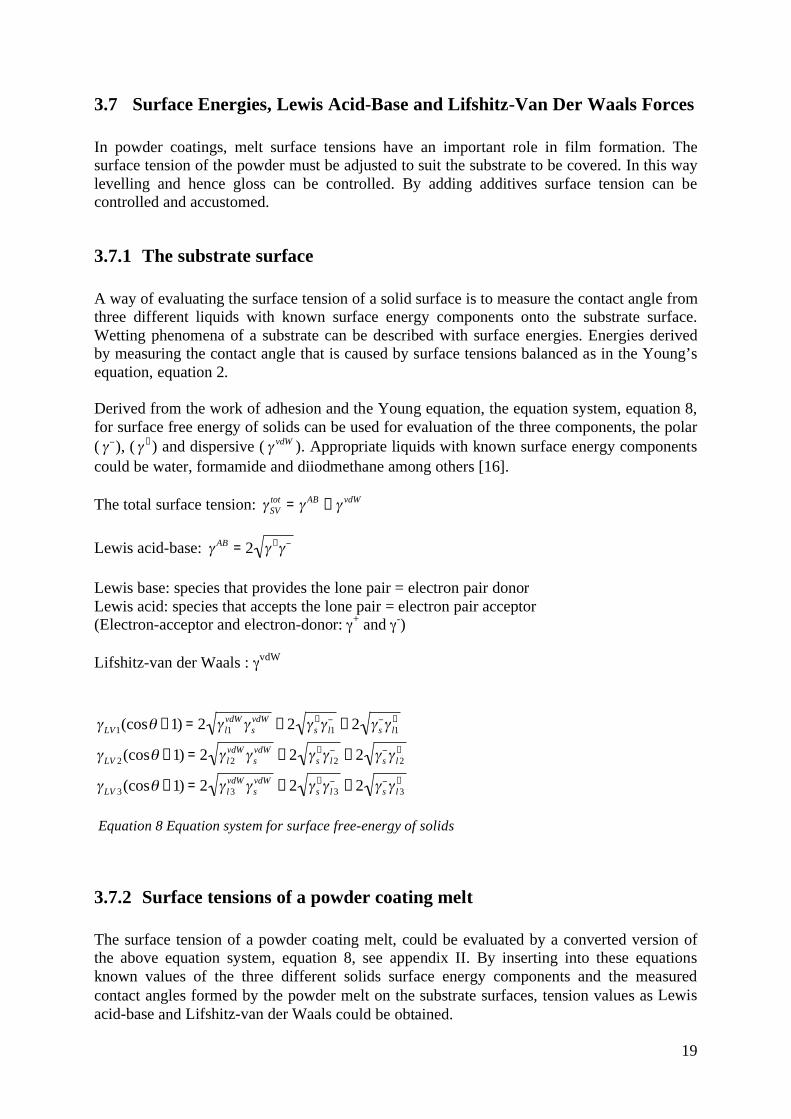
Derived from the work of adhesion and the Young equation, the equation system, equation 8,
for surface free energy of solids can be used for evaluation of the three components, the polar
( ), ( +) and dispersive ( vdW ). Appropriate liquids with known surface energy components
could be water, formamide and diiodmethane among others [16].
The total surface tension: SVtot = AB + vdW
Lewis acid-base: AB = 2 +
Lewis base: species that provides the lone pair = electron pair donor
Lewis acid: species that accepts the lone pair = electron pair acceptor
(Electron-acceptor and electron-donor: + and
-)
Lifshitz-van der Waals : vdW
LV1(cos +1) = 2 l1vdW
svdW + 2 s
+
l1 + 2 s l1+
LV 2(cos +1) = 2 l2vdW
svdW + 2 s
+
l2 + 2 s l2+
LV 3(cos +1) = 2 l3vdW
svdW + 2 s
+
l3 + 2 s l3+
Equation 8 Equation system for surface free-energy of solids
3.7.2 Surface tensions of a powder coating melt
The surface tension of a powder coating melt, could be evaluated by a converted version of the above equation system, equation 8, see appendix II. By inserting into these equations known values of the three different solids surface energy components and the measured contact angles formed by the powder melt on the substrate surfaces, tension values as Lewis
acid-base and Lifshitz-van der Waals could be obtained.
20
4 Experimental
4.1 Materials
Spherical powder particles, a UV-curable maleate-modified polyester powder without
crosslinker and additives [17] The size of the particles are 50-100 µm
Cover glass slips 16 mm
Milli-Q water
Deconex
Ethanol
Nitrogen, blow-drying of cover glasses before melting of polyester particles and contact
angel measurements
Tetrahydrofuran (THF) from Fischer
Dichlorodimethylsilane (C2H6Cl2Si) from Merck
Formamide from Merck
Methylene Iodide from Aldrich
Hexamethyldisiloxane (HMDSO)
Oxygen used for plasma surface modification
Chemicals were used as received.
4.2 Methods
All experiments were performed at YKI, Ytkemiska Institutet AB if not otherwise mentioned.
4.2.1 Molecular Weight and Distribution
Evaluation of molecular weight and distribution on the powder particles was performed at the
Department of Fibre and Polymer Technology, Royal Institute of Technology (KTH). A Size
Exclusion Chromatograph (SEC) using THF (1.0mL min-1
) as the mobile phase at 35°C using
a Viscotek TDA model 301 equipped with two GMHHR-M columns with TSK-gel (mixed
bed, MW resolving range 300-100 000) from Tosoh Biosep, a VE 5200 GPC autosampler, a
VE 1121 GPC solvent pump, and a VE 5710 GPC degasser (all from Viscotek corp.). A
universal calibration method was created using broad and narrow linear polystyrenes
standards. Corrections for the flow rate fluctuations were made using THF as an internal
standard. Viscotek Trisec 2000 version 1.0.2 software was used to process data.
12 mg polyester powder was dissolved in 10 ml THF. Two samples were analysed.
4.2.2 Melting Point
21
The melting point of the powder particles was determined with a Differential Scanning
Calorimeter (DSC). A METTLER TOLEDO. DSC 822e was used with a METTLER
TOLEDO TSO 801RO Sample Robot and a METTLER TOLEDO TSO 800 GC1 gas control
unit connected. The software METTLER TOLEDO STARe System was used as a control
temperature program.
Two samples were heated from 25°C to 200°C at a rate of 3°C/min with a gas flow of 40
ml/min of nitrogen and then cooled down to 25°C with the rate of 10°C/min.
4.2.3 Preparation of Substrate Surfaces
Cover glass slip surfaces were treated with three different methods to obtain three different
substrate surface energies. One surface was only cleaned, one surface was silanized and one
surface plasma treated.
o Cleaned cover glasses: Rinsed using a mixture of Milli-Q water and Deconex then
placed in Milli-Q water with Deconex over night. Rinsed again the day after, several
times with heated Milli-Q water. Stored in ethanol, in a glass vial and sealed with a
lid. Storing vial, lids and tweezers all cleaned in the same manor as described above.
o Silane treated cover glasses: First cleaned as above, then hydrophobiased in a vapour
phase of dichlorodimethylsilane, placed on a porcelain plate, in a evacuated Vacuum
Desiccator with nitrogen at room temperature for 24 hours. All cover glasses were
turned over with a tweezers and exposed ones again as above. Finally the cover
glasses were stored in cleaned glass vial, in ethanol and sealed with a lid.
o Plasma-deposited SiOx coatings on cover glasses. First cleaned as above then plasma-
coated using a mixture of HMDSO and O2 (1:20) in 130W for 2 minutes. Stored in
aluminium foil. Kenth Johansson from YKI, performed plasma modifications of the
cover glasses.
4.2.4 Contact Angle Measurements
Evaluation of the contact angle on the substrate surfaces (<15°) was performed using a
contact angle goniometer A 1100, Ramé Hart. In the goniometer droplets can be observed
from a side view, by placing a droplet of liquid on the substrate using a syringe with a
vertically cut needlepoint. The contact angle were measured and 5 to 10 drops of the test
liquids were used to determine the contact angle of each liquid on each surface when
equilibrium was established.
The test liquids were Milli-Q water and Formamide and the tests were conducted at the room
temperature.
Evaluation of the contact angle on the substrate surfaces (>15°) were performed using a
Dynamic Contact Angle and Absorption Tester (DAT), Fibro 1100 + 1129 from Fibro
Systems AB. Contact angle measurements are made by analysing side images of drops
deposited on solid substrates as a function of time. The drop is formed using a high precision
fluid pump and an electromagnetic dispenser automatically applies it on the substrate. The
22
images are captured by a CCD-camera with 50 images per second and subsequently
transferred to a computer for further analysis. The base diameter, height, projected area and
drop contour are determined from the images. The drop is assumed to be symmetrical around
its vertical axis. The drop contour is used to calculate the average contact angle.
Three to five drops of the test liquids were used to determine the contact angle of each test
liquid on each surface. Test liquids were Milli-Q water, Formamide and Methylene Iodide
and conducted at room temperature (23°C).
The cleaned and the silanized substrate surfaces were rinsed with ethanol and dried with
nitrogen. Thereafter evaluation of the contact angles was performed.
The plasma-modified surfaces were tested without further purification.
4.2.5 Powder Particle Spreading
Film formation studies were performed, by observing the powder particle spreading onto
different substrates at different temperatures.
4.2.5.1 Microscope Set-up
To observe the spreading of powder particles on a surface during heating a reflection optical
microscope, Nikon Optiphot 100S with a 20X lens, was used onto which a video camera,
digital Sony XC-75 CCD video camera was set-up. The images were captured with a frame
grabber IMAQ-1411, National instruments software and the images were then analyzed with
IMAQ vision in a Lab View 6i program from National Instruments. Torbjörn Pettersson, YKI,
built a Lab View program that measured the powder particle size during heating and
spreading. The images were analysed with an algorithm based on edge detection at eight
points around the particle, then fitted to a circle, giving the particle diameter, area, area ratio
and contact angle, equation 6 and 7, as a function of time and temperature.
4.2.5.2 Heating of the Powder on the Substrates
The cleaned and the silanized glass substrates were before use, first rinsed with ethanol and
then dried with nitrogen gas. The plasma-modified surfaces were used without any
purification.
The glass substrate with powder was placed one at a time on a silver plate in a THIMS 600
stage, from Linkam. A heating control unit, TMS 93, was used to set a suitable temperature
profile, from Linkam. Heating of that plate was performed from ambient temperature at rate
20°C/min. to 60°C, then held for 3 min., followed by continued heating at 20°C/min to a
temperature of either 100°C, 120°C or 140°C and held for 10 min A temperature probe (K-
type, Cu-plate, 5 mm diameter, 2 mm thickness) placed on the glass surface connected to the
computer registered the actual temperature just some mm above the glass

23
4.2.6 Evaluation of surface energy and force characteristics
The surface energy and the polar/unpolar parts of surface tension were calculated as follows. The substrate surface energy was calculated by inserting measured contact angles from section (4.2.4) to the equations from the theory section (3.7.1). Calculations of the surface tension of the powder melt was conducted by using the measured
and calculated surface energies of the three substrates, the contact angles evaluated from the
curves in section (5.5) and also using the equations derived in appendix II.
24
5 Results and Discussion
5.1 Molecular Weight and Molecular Weight Distribution
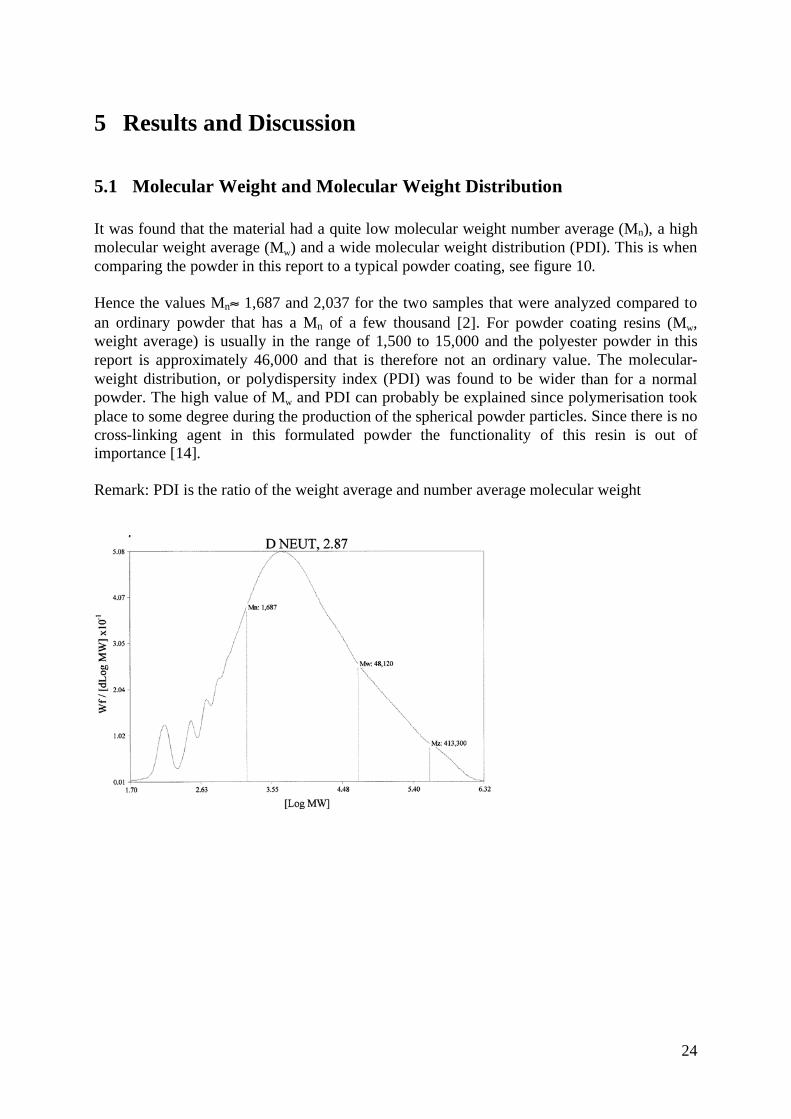
It was found that the material had a quite low molecular weight number average (Mn), a high
molecular weight average (Mw) and a wide molecular weight distribution (PDI). This is when
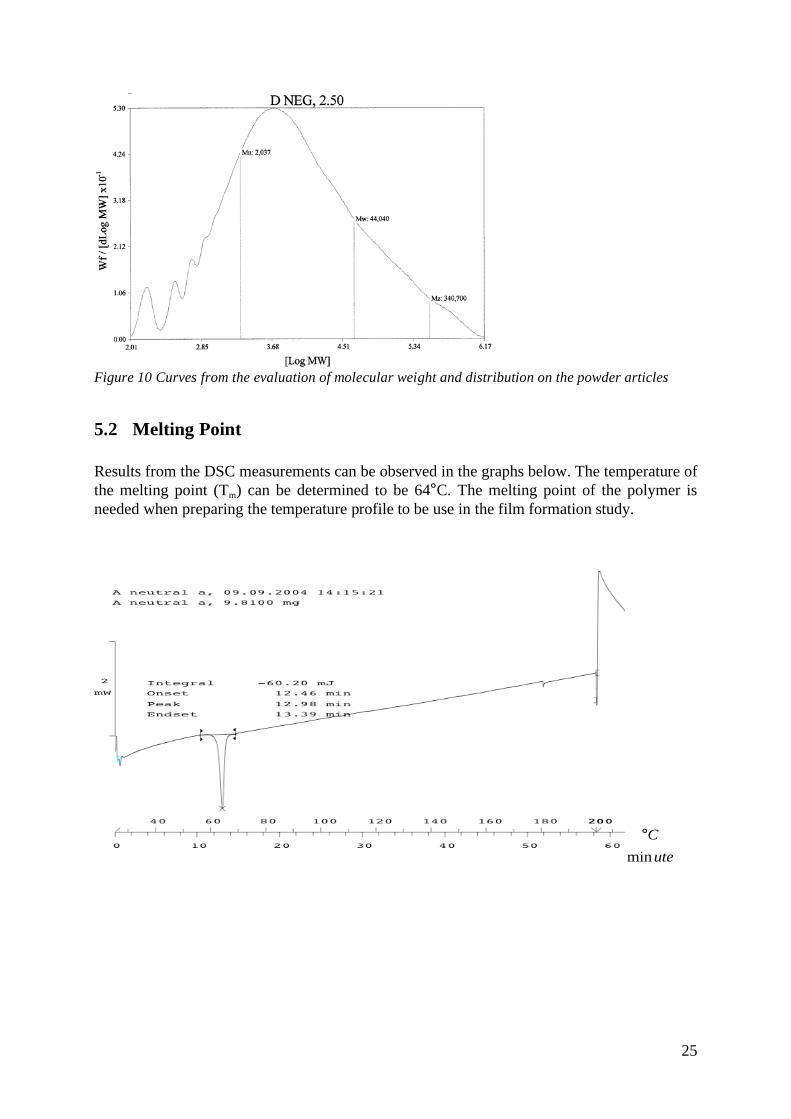
comparing the powder in this report to a typical powder coating, see figure 10.
Hence the values Mn 1,687 and 2,037 for the two samples that were analyzed compared to
an ordinary powder that has a Mn of a few thousand [2]. For powder coating resins (Mw, weight average) is usually in the range of 1,500 to 15,000 and the polyester powder in this report is approximately 46,000 and that is therefore not an ordinary value. The molecular-
weight distribution, or polydispersity index (PDI) was found to be wider than for a normal powder. The high value of Mw and PDI can probably be explained since polymerisation took place to some degree during the production of the spherical powder particles. Since there is no
cross-linking agent in this formulated powder the functionality of this resin is out of
importance [14].
Remark: PDI is the ratio of the weight average and number average molecular weight
25
Figure 10 Curves from the evaluation of molecular weight and distribution on the powder articles
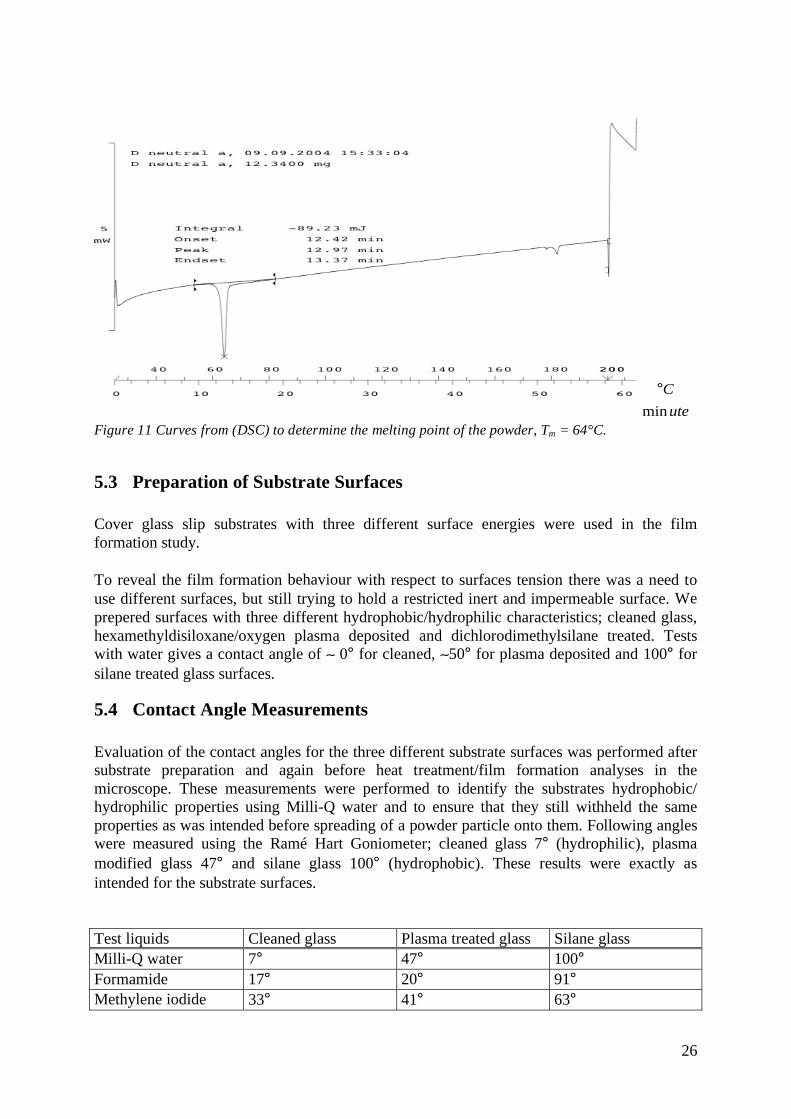
5.2 Melting Point
Results from the DSC measurements can be observed in the graphs below. The temperature of the melting point (Tm) can be determined to be 64°C. The melting point of the polymer is needed when preparing the temperature profile to be use in the film formation study.
°C
minute
26
°C
minute
Figure 11 Curves from (DSC) to determine the melting point of the powder, Tm = 64°C.
5.3 Preparation of Substrate Surfaces
Cover glass slip substrates with three different surface energies were used in the film formation study. To reveal the film formation behaviour with respect to surfaces tension there was a need to use different surfaces, but still trying to hold a restricted inert and impermeable surface. We
prepered surfaces with three different hydrophobic/hydrophilic characteristics; cleaned glass,
hexamethyldisiloxane/oxygen plasma deposited and dichlorodimethylsilane treated. Tests
with water gives a contact angle of 0° for cleaned, 50° for plasma deposited and 100° for
silane treated glass surfaces.
5.4 Contact Angle Measurements
Evaluation of the contact angles for the three different substrate surfaces was performed after
substrate preparation and again before heat treatment/film formation analyses in the
microscope. These measurements were performed to identify the substrates hydrophobic/
hydrophilic properties using Milli-Q water and to ensure that they still withheld the same
properties as was intended before spreading of a powder particle onto them. Following angles
were measured using the Ramé Hart Goniometer; cleaned glass 7° (hydrophilic), plasma
modified glass 47° and silane glass 100° (hydrophobic). These results were exactly as
intended for the substrate surfaces.
Test liquids Cleaned glass Plasma treated glass Silane glass
Milli-Q water 7° 47° 100°
Formamide 17° 20° 91°
Methylene iodide 33° 41° 63°
27
Measurements of contact angles for two additional liquids were also performed for evaluation
of the substrates surface energy and powder melt surface tension, see section 5.6.
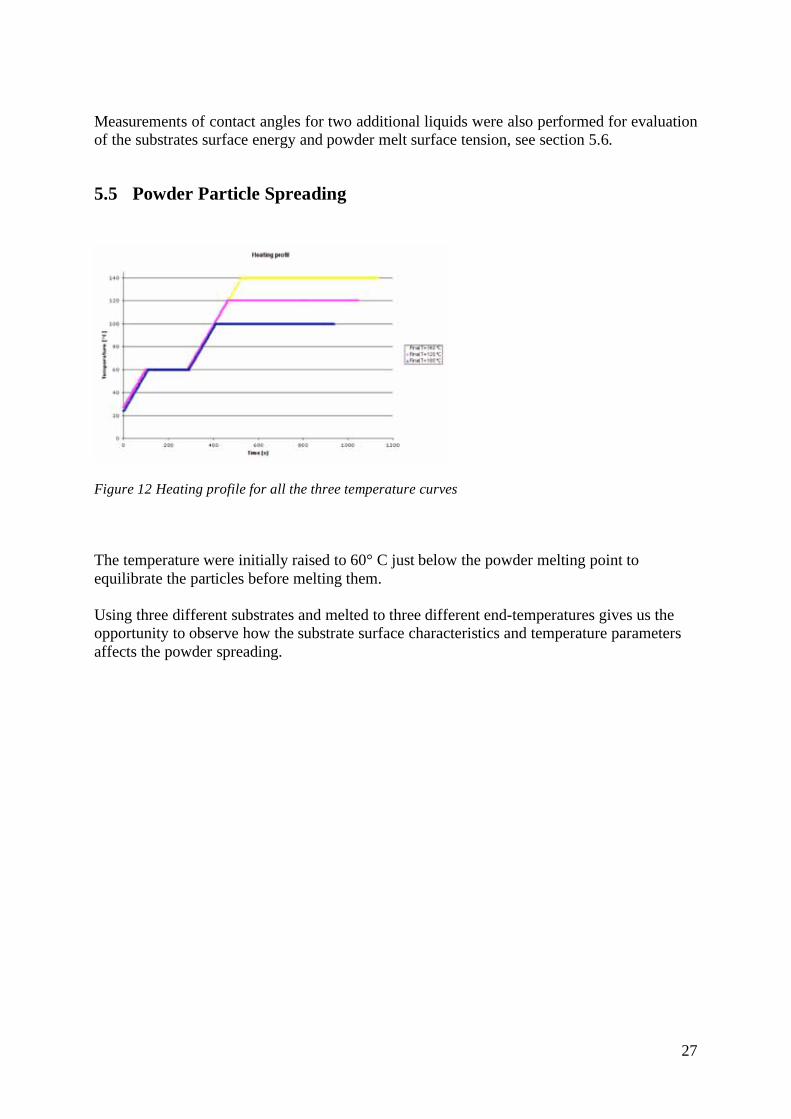
5.5 Powder Particle Spreading
Figure 12 Heating profile for all the three temperature curves
The temperature were initially raised to 60° C just below the powder melting point to
equilibrate the particles before melting them.
Using three different substrates and melted to three different end-temperatures gives us the opportunity to observe how the substrate surface characteristics and temperature parameters affects the powder spreading.
28
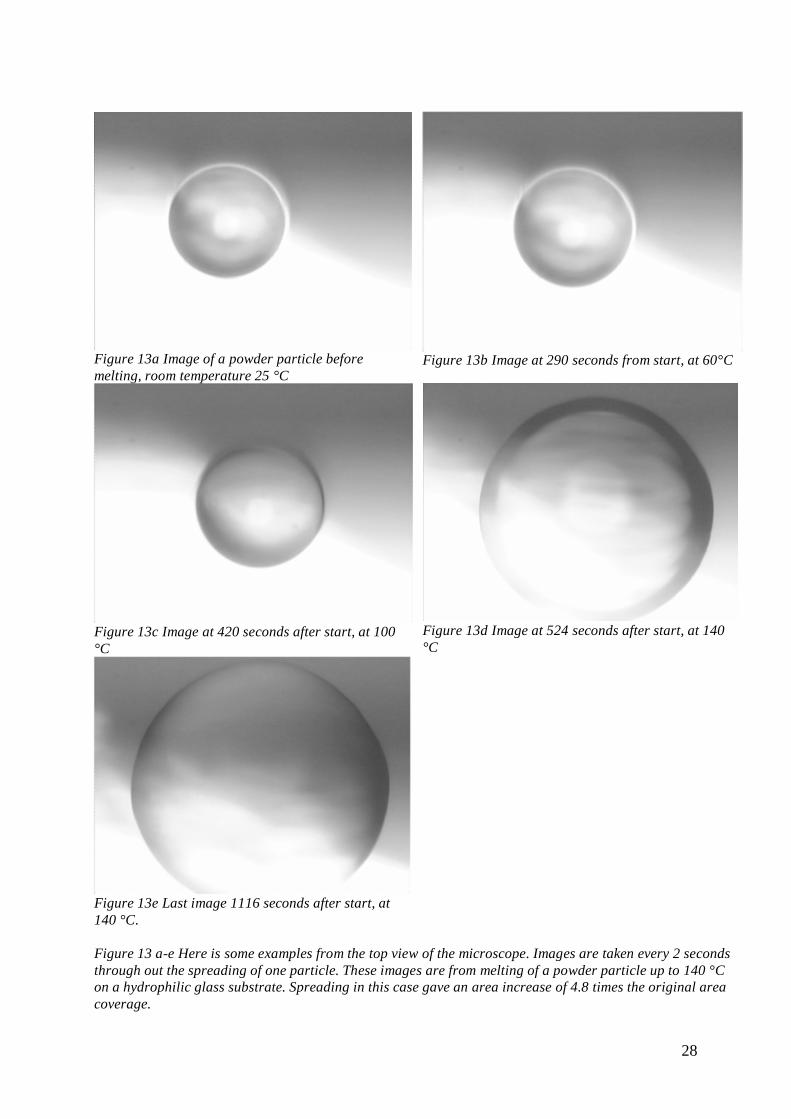
Figure 13a Image of a powder particle before
melting, room temperature 25 °C
Figure 13b Image at 290 seconds from start, at 60°C
Figure 13c Image at 420 seconds after start, at 100
°C
Figure 13d Image at 524 seconds after start, at 140
°C
Figure 13e Last image 1116 seconds after start, at
140 °C.
Figure 13 a-e Here is some examples from the top view of the microscope. Images are taken every 2 seconds
through out the spreading of one particle. These images are from melting of a powder particle up to 140 °C
on a hydrophilic glass substrate. Spreading in this case gave an area increase of 4.8 times the original area
coverage.
29
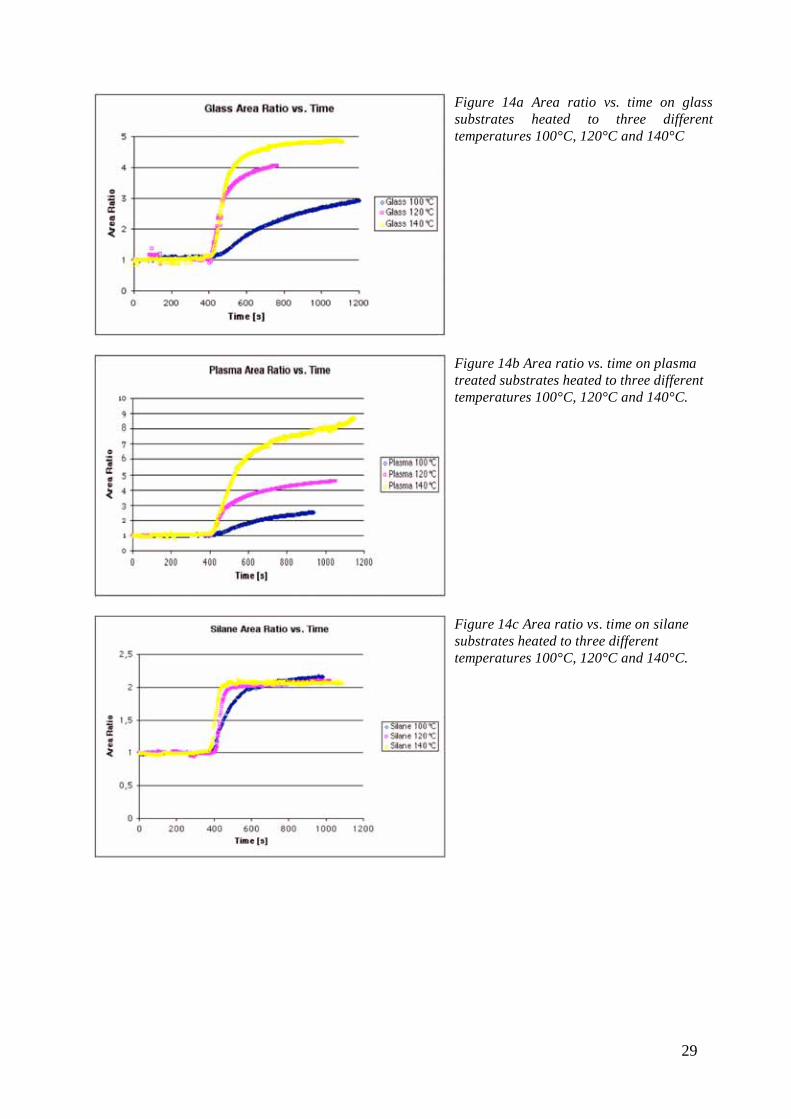
Figure 14a Area ratio vs. time on glass
substrates heated to three different
temperatures 100°C, 120°C and 140°C
Figure 14b Area ratio vs. time on plasma
treated substrates heated to three different
temperatures 100°C, 120°C and 140°C.
Figure 14c Area ratio vs. time on silane
substrates heated to three different
temperatures 100°C, 120°C and 140°C.
30
General results: The powder particle spreading by time demonstrates the kinetics of
spreading for all three temperature-curves. High temperatures result in faster powder particle
spreading. Especially when increasing the temperature from 100°C to 120°C. Changing the
temperature from 120°C to 140°C gives a less marked increase in the kinetics of particle
spreading. The equilibrium value is about the same for all temperatures when the particles
have sufficient time to spread. The hydrophilic glass let the spreading reach approximately an
area ratio increase of five (A/A0 = 5) and hydrophobic surfaces allowed the spreading to give
an area ratio increase of two (A/A0 = 2). Hence the powder flows, spreads, more on a
hydrophilic as compared to a hydrophobic. The results from the plasma treated surface show
an even better spreading than the pure glass surface. This is not consistent with expectations
since the contact angle for water proves a surface energy that should be in-between the glass
and silane surfaces. Thus the plasma treated surface will be omitted from further evaluation.
Evaluation of the contact angles for preheated plasma modified substrate surface was
performed due to the unexpected results of particle spreading onto them. The substrates were
heated to 100°C, 120°C, 140°C and 250°C. the contact angle were always 47° using Milli-Q
water independent of the used pre-heating temperature.
On the plasma surfaces we suspect contamination or low molecular weight molecules to
affect the plasma result.
31
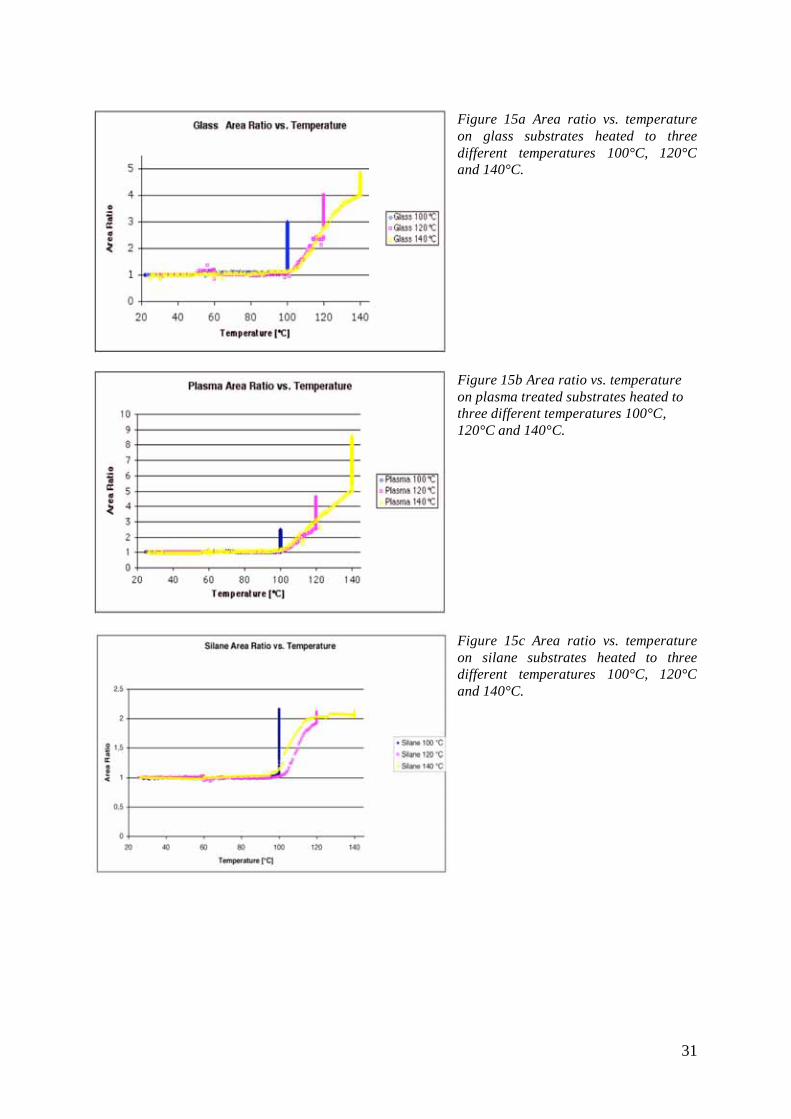
Figure 15a Area ratio vs. temperature
on glass substrates heated to three
different temperatures 100°C, 120°C
and 140°C.
Figure 15b Area ratio vs. temperature
on plasma treated substrates heated to
three different temperatures 100°C,
120°C and 140°C.
Figure 15c Area ratio vs. temperature
on silane substrates heated to three
different temperatures 100°C, 120°C
and 140°C.
32
General results: We have re-plotted the data so that the area ratio is plotted against the
applied temperature. It gives us a deeper understanding of the course of events. The spreading
of the powder particles vs. temperature also proves the differences between the three
substrates but from another point of view. The measured images of the powder particle all
form a close line that tightens towards the equilibrium for these
polymer/substrate/temperature combinations. It shows that the spreading as a function of
temperature can be evaluated. It also shows that particles do not start to spread until the
temperature reaches 100°C which is about 35°C above the melting point of the powder
particles. It demonstrates that the temperature must be well above the melting point of the
powder for an efficient flow to happen. As also mentioned in section 3.3.3.
We find that on the hydrophilic substrates, glass, that the area ratio spreading as a function of
temperature follows the same track. Hence the kinetics of the spreading as a function of
temperature is independent of the final temperature above 100°C. The experiments at 100°C
and 120°C does not reach equilibrium within the experimental time used in the experiment.
For the hydrophobic substrate, silane treated, we find that the track of the area ratio spreading
is shifted for the 140°C sample as compared to the 120°C spreading. Possibly the 140 °C data
should be shifted to slightly higher temperatures to give a correct result. The temperature
registered could in some experiments differ from the actual temperature due to lack of
connection between the temperature probe and the substrate surface.
Furthermore for the hydrophobic substrates, silane we note that all samples independent of the
final temperature finish at the same area ratio around two. It can be concluded that all those
samples have reached equilibrium spreading for this substrate.
Depending on the type of substrate (metal, wood, plastics etc.) and substrate thickness
different stoving temperature profiles will be necessary to warm the substrate surface to the
desired temperature. The method to determine the flow out of the powder versus temperature
gives us a tool to characterise the requirement for a good flow of the powder coating. Hence
the stoving profile must be adjusted for each combination of substrate and coating to obtain a
perfect end result of the coated object.
33
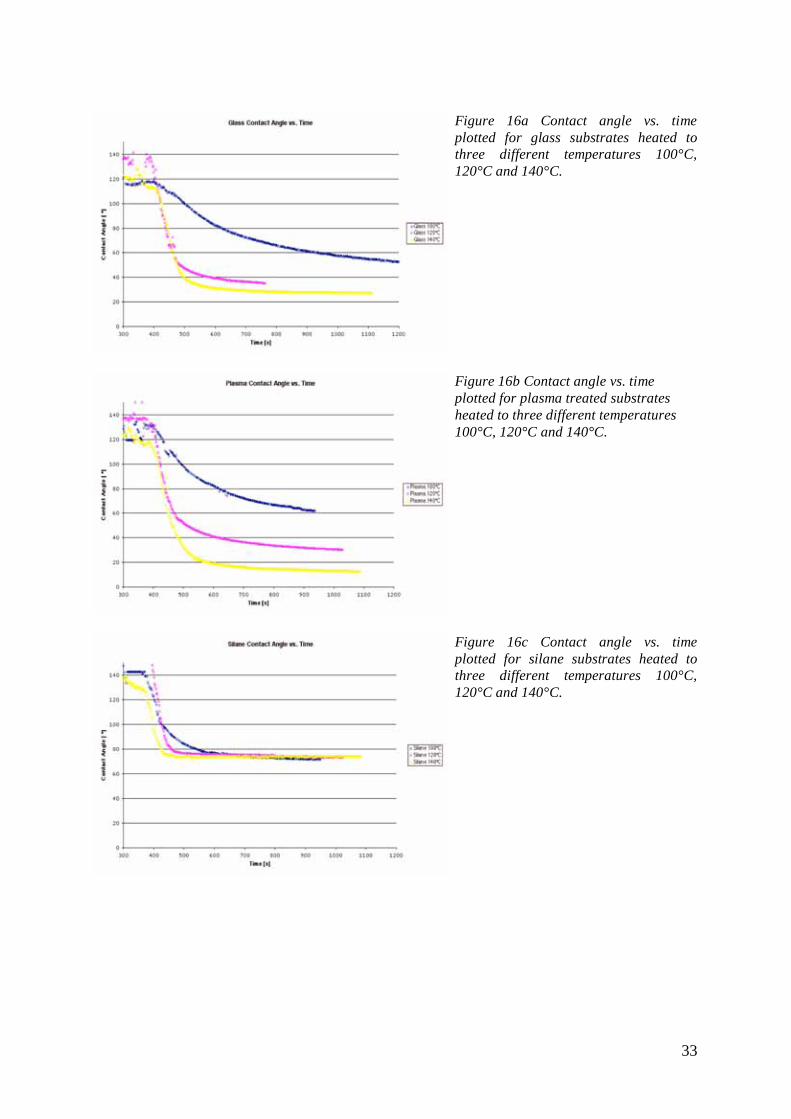
Figure 16a Contact angle vs. time
plotted for glass substrates heated to
three different temperatures 100°C,
120°C and 140°C.
Figure 16b Contact angle vs. time
plotted for plasma treated substrates
heated to three different temperatures
100°C, 120°C and 140°C.
Figure 16c Contact angle vs. time
plotted for silane substrates heated to
three different temperatures 100°C,
120°C and 140°C.
34
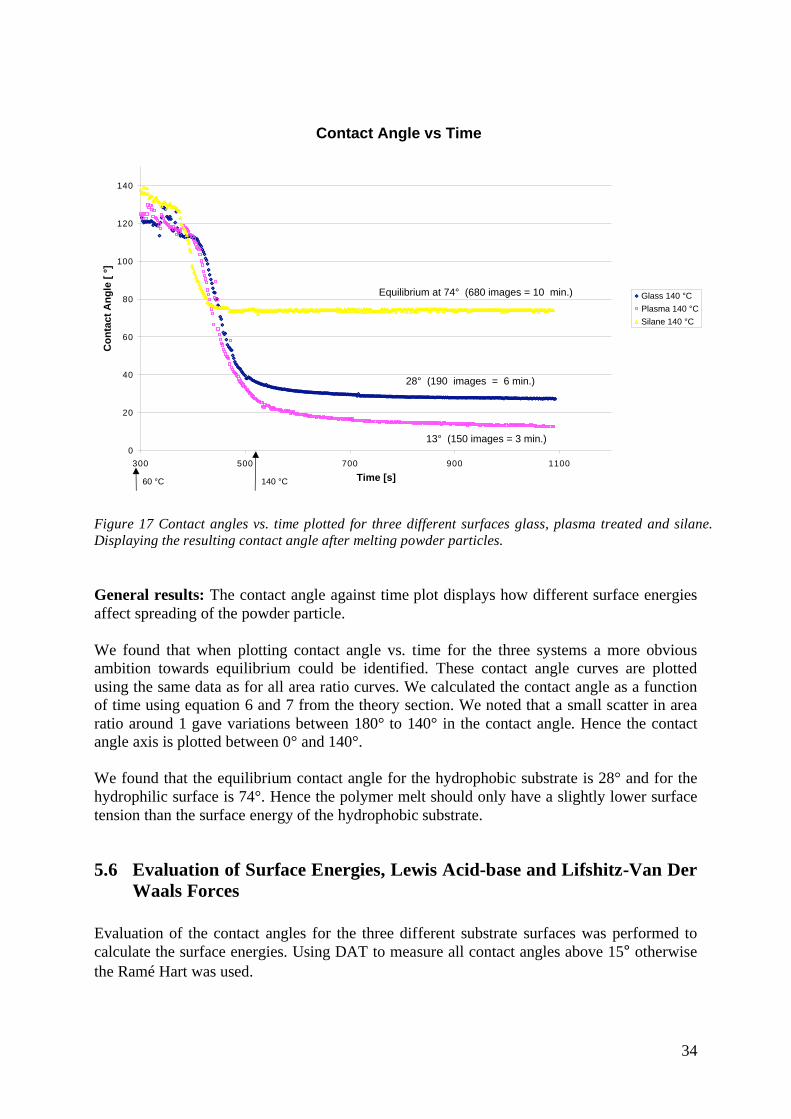
Figure 17 Contact angles vs. time plotted for three different surfaces glass, plasma treated and silane.
Displaying the resulting contact angle after melting powder particles.
General results: The contact angle against time plot displays how different surface energies
affect spreading of the powder particle.
We found that when plotting contact angle vs. time for the three systems a more obvious
ambition towards equilibrium could be identified. These contact angle curves are plotted
using the same data as for all area ratio curves. We calculated the contact angle as a function
of time using equation 6 and 7 from the theory section. We noted that a small scatter in area
ratio around 1 gave variations between 180° to 140° in the contact angle. Hence the contact
angle axis is plotted between 0° and 140°.
We found that the equilibrium contact angle for the hydrophobic substrate is 28° and for the hydrophilic surface is 74°. Hence the polymer melt should only have a slightly lower surface tension than the surface energy of the hydrophobic substrate.
5.6 Evaluation of Surface Energies, Lewis Acid-base and Lifshitz-Van Der
Waals Forces
Evaluation of the contact angles for the three different substrate surfaces was performed to
calculate the surface energies. Using DAT to measure all contact angles above 15° otherwise
the Ramé Hart was used.
Contact Angle vs Time
0
20
40
60
80
100
120
140
300 500 700 900 1100
Time [s]
Co
nta
ct A
ng
le [
°]
Glass 140 °C
Plasma 140 °C
Silane 140 °C
Equilibrium at 74° (680 images = 10 min.)
28° (190 images = 6 min.)
13° (150 images = 3 min.)
60 °C 140 °C
35
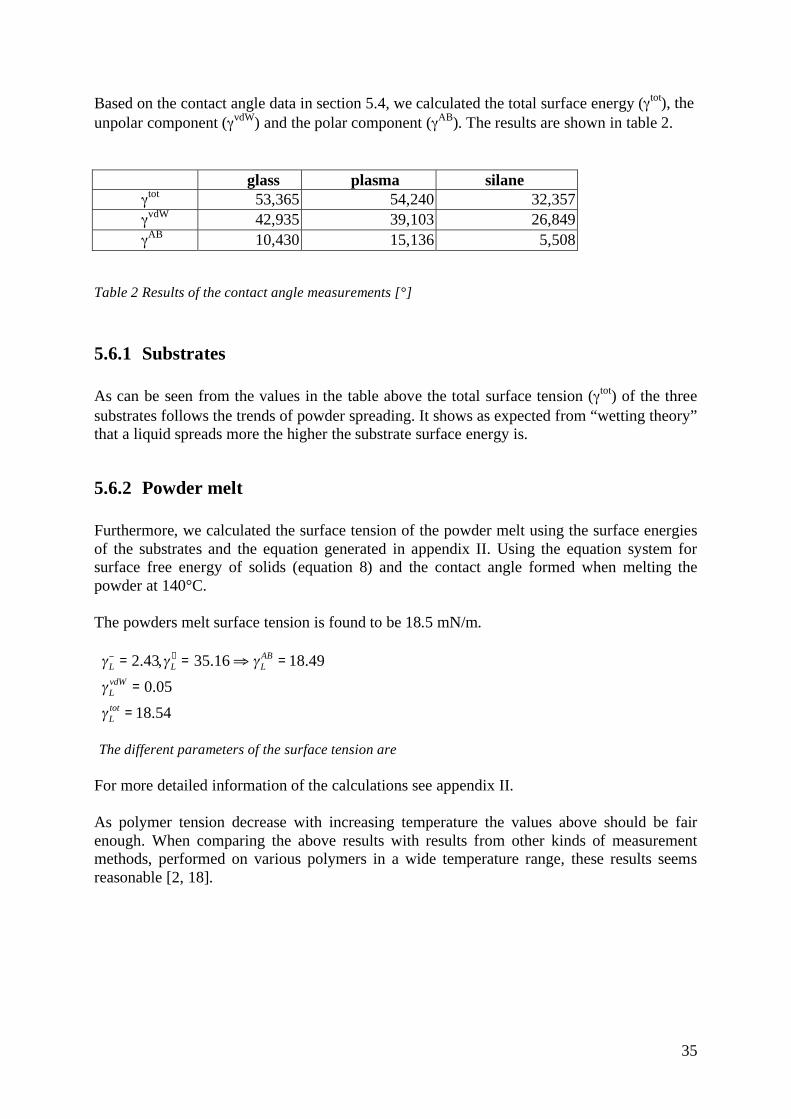
Based on the contact angle data in section 5.4, we calculated the total surface energy ( tot), the
unpolar component (vdW
) and the polar component (AB
). The results are shown in table 2.
glass plasma silane tot
53,365 54,240 32,357 vdW
42,935 39,103 26,849 AB
10,430 15,136 5,508
Table 2 Results of the contact angle measurements [°]
5.6.1 Substrates
As can be seen from the values in the table above the total surface tension (tot
) of the three
substrates follows the trends of powder spreading. It shows as expected from “wetting theory”
that a liquid spreads more the higher the substrate surface energy is.
5.6.2 Powder melt
Furthermore, we calculated the surface tension of the powder melt using the surface energies
of the substrates and the equation generated in appendix II. Using the equation system for
surface free energy of solids (equation 8) and the contact angle formed when melting the
powder at 140°C.
The powders melt surface tension is found to be 18.5 mN/m.
L = 2.43, L+ = 35.16 L
AB =18.49
LvdW = 0.05
Ltot =18.54
The different parameters of the surface tension are
For more detailed information of the calculations see appendix II.
As polymer tension decrease with increasing temperature the values above should be fair
enough. When comparing the above results with results from other kinds of measurement
methods, performed on various polymers in a wide temperature range, these results seems
reasonable [2, 18].
36
6 Conclusions
The powder used was a polyester with a melting temperature of 64 °C and when the powder
was heated up to between 100 and 140 °C a spreading of the melt could be observed and
evaluated. Generally it could be said that the powder in this report flows out on a hydrophilic
surface and is inhibited by a hydrophobic. The increase of the area ratio over a hydrophilic
surface was about five times and on a hydrophobic surfaces only two times the original area
coverage
The contact angle between the melted powder particles on the different surface types could be
calculated. The melt surface tension could be calculated since three substrates surfaces with
various surface energies were used. The melt surface tension was found to be about 18.5
mN/m.
7 Further work/Proposal for further work
For the glass substrate it could be interesting to melt up to 160 °C or await equilibrium for a
longer period of time, since equilibrium is not reached within the test range of this study.
When plotting area ratio against temperature a conclusion that the spreading of the polymer
had not reached equilibrium on the glass substrates was observed. Melting of the powder at a
higher temperature or with a longer time at a high temperature could provide a higher
accuracy in the results.
To study the surface energy of the powder material by producing a film, using the same three
test liquids as in this report. These results could be interesting for comparing with the results
from the surface energy calculations of the powder material. An alternative method of film formation studies that also would give information of the powder particle melt would be to use a Contact Angle Goniometer Ramé Hart with a thermo cell and connecting the same camera and software equipment as used in this study. It could be able to melt the powder on other substrates than glass as used in this study. An area ratio by time could be evaluated using the same equations as in this study, in reverse, and easily be verified by measurements of the area coverage on the substrate before and after melting. Cleaning the plasma surfaces in the same way as the other substrates before melting powder particles onto them. There is some kind of reaction in the interface melt/vapour/substrate that has to be explained.
We want to clarify why the plasma treated surfaces resulted in the enormous spreading of
melt over the surface. Theories concerning the plasma modified surface and the powder
material could be examined more thoroughly.
37
8 Acknowledgements I would like to thank Anders Larsson and Torbjörn Pettersson for the professional supervising
and helpful discussions during my diploma work.
Kenth Johansson for helping in decision and choice of substrate surface modifications and
also plasma modifications of cover glasses used as substrates in this study.
Thank you also all employees at YKI that took time to show me instruments and gadgets
always helpful and with a kind heart.
38
9 References [1] Misev, T.A. (1991). Powder Coatings Chemistry and Technology. John Wiley &sons Ltd. 0-471-92821-6 [2] de Lange, P.G. (2004). Powder Coatings Chemistry and Technology. 2 nd edtion ed. 3-87870-784-3 [3] Powder. http://www.dupont-bichon.com/. 2005-06-02. [4] Powder spreading. http://www.jotun.com.my/mppowder.htm. 2005-06-02. [5] Heated powder. http://pubs.acs.org/cen/coverstory/7945/7945paints.html. 2005-06-02. [6] Coated product. http://www.silberline.com/markets/powder/. 2005-06-02. [7] Gedde, U.W. (2001). Polymer Physics. 4 ed. Stockholm: Kluwer Academic Publishers. 9780412626401 [8] Davidson, S. (1999). Exploring the Science, Technology and Applications of UV and EB Curing. London UK: SITA Technology Ltd. 0 947798412 [9] Uhlmann, P. & Grundke, K. (2001). Influence of Additives on Interfacial Phenomena During Film Formation of Powder Coatings. JCT Journal of Coating Technology, 73. [10] Jones, R.A.L. & Richards, R.W. (1999). Polymers at Surfaces and Interfaces. Cambridge University Press. 0-521-47965-7 [11] Wouters, M. & Ruiter, B. (2003). Contact-angle Development of Polymer Melts. Progress in Organic Coatings, 48, 2-4 p. 207-213. [12] Larsson, A., Personal communication. 2005 [13] Bodnar (1997). Powder Coatings: How to Avoid Orange Peel. 3, 248-250. [14] Richart, D. Resins and Curatives: The Binder System for Thermosetting Powder Coatings. http://www.litmuschem.com/tech2000-3.htm. 2004-12-14. [15] Pettersson, T., Wetting and levelling of toner during fusing of electrophotograhic prints. 2004Royal Institute of Technology: Stockholm [16] van Oss, C.J. (1994). Interfacial Forces in Aqueos Media. Buffalo, New York. 0-8247-9168-1 [17] Hellgren, A. & Larsson, A. (2002). Surface characterisation of powder coatings cured at low temperatures to optimise application properties and film formation. Stockholm. YKI, Ytkemiska Institutet AB. (Final report). [18] Wulf, M. et al. (2000). Surface Tension Studies of Levelling Additives in Powder Coatings. Progress in Organic Coatings, 38, 2 p. 59-66.
i
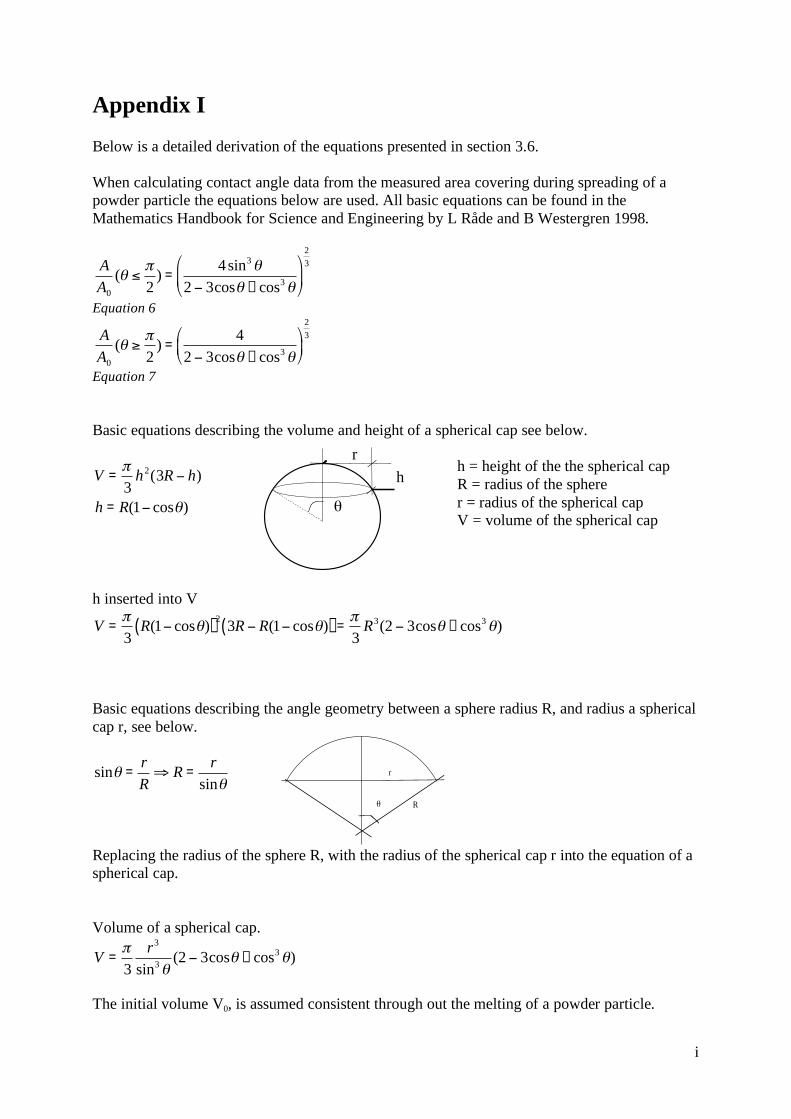
Appendix I Below is a detailed derivation of the equations presented in section 3.6.
When calculating contact angle data from the measured area covering during spreading of a
powder particle the equations below are used. All basic equations can be found in the
Mathematics Handbook for Science and Engineering by L Råde and B Westergren 1998.
A
A0
(2
) =4sin3
2 3cos + cos3
2
3
Equation 6
A
A0
(2
) =4
2 3cos + cos3
2
3
Equation 7 Basic equations describing the volume and height of a spherical cap see below.
V =3
h2(3R h)
h = R(1 cos )
R
r
h
h = height of the the spherical cap R = radius of the sphere r = radius of the spherical cap V = volume of the spherical cap
h inserted into V
V =3
R(1 cos )( )2
3R R(1 cos )( ) =3
R3(2 3cos + cos3 )
Basic equations describing the angle geometry between a sphere radius R, and radius a spherical cap r, see below.
sin =r
RR =
r
sin r
R
Replacing the radius of the sphere R, with the radius of the spherical cap r into the equation of a spherical cap. Volume of a spherical cap.
V =3
r3
sin3 (2 3cos + cos3 )
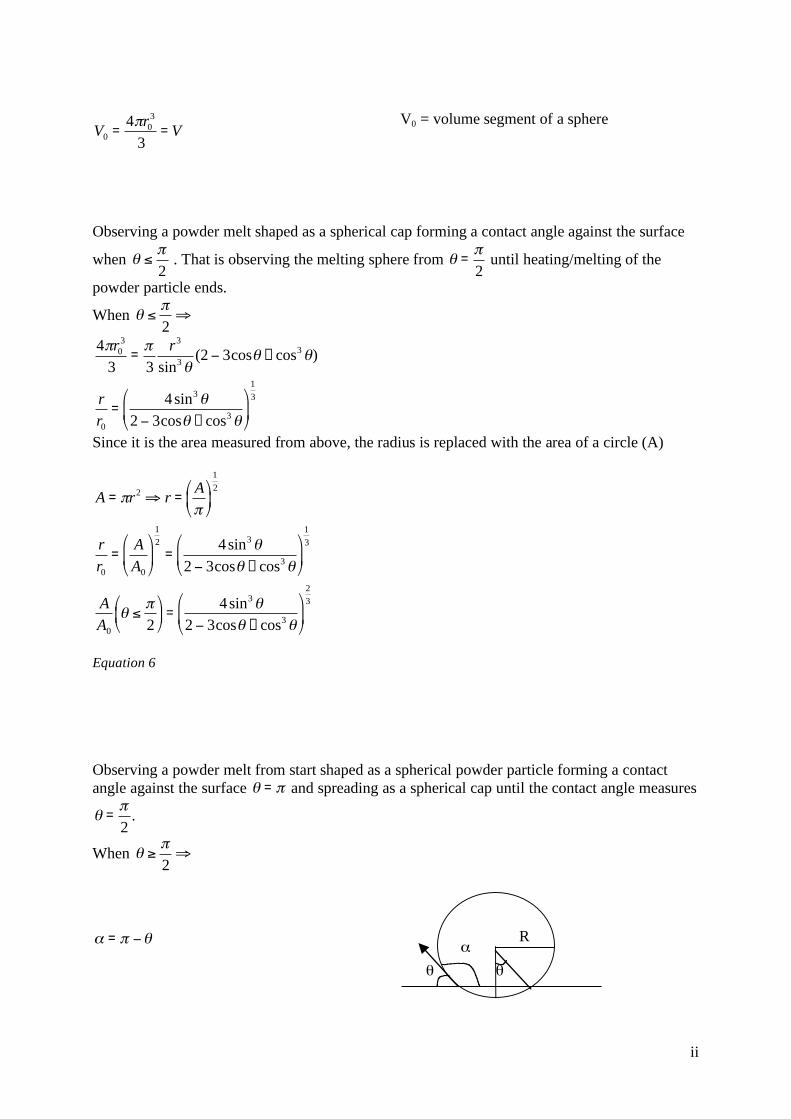
The initial volume V0, is assumed consistent through out the melting of a powder particle.
ii
V0 =4 r0
3
3= V
V0 = volume segment of a sphere
Observing a powder melt shaped as a spherical cap forming a contact angle against the surface
when 2
. That is observing the melting sphere from =2
until heating/melting of the
powder particle ends.
When 2
4 r03
3=
3r3
sin3 (2 3cos + cos3 )
r
r0
=4sin3
2 3cos + cos3
1
3
Since it is the area measured from above, the radius is replaced with the area of a circle (A)
A = r2 r =A
1
2
r
r0
=A
A0
1
2
=4sin3
2 3cos + cos3
1
3
A
A0 2
=
4sin3
2 3cos + cos3
2
3
Equation 6
Observing a powder melt from start shaped as a spherical powder particle forming a contact angle against the surface = and spreading as a spherical cap until the contact angle measures
=2
.
When 2
= R

iii
V =4 R3
3
R3
3(2 3cos + cos3 )
V =R3
3(2 + 3cos( ) cos3( ))
V =R3
3[2 + 3( cos ) ( cos3 )]
V =R3
3(2 3cos + cos3 )
As volume consistency V0 = V and as before the initial volume is a sphere. 4 R0
3
3=
R3
3(2 3cos + cos3 )
R
R0
= (4
2 3cos + cos3 )1
3
A
A0 2
= (
42 3cos + cos3 )
2
3
Equation 7

iv
Appendix II Deriving surface tension for a polymer melt by using the same equations as when calculating
surface tension of a solid surface.
Liquid1: L1vdW
L1 L1+
Liquid 2: L 2vdW
L 2 L 2+
Liquid 3: L 3vdW
L 3 L 3+
LV1(cos 1 +1) = 2 l1vdW
svdW + 2 s l1
+ + 2 s+
l1
LV 2(cos 2 +1) = 2 l2vdW
svdW + 2 s l2
+ + 2 s+
l2
LV 3(cos 3 +1) = 2 l3vdW
svdW + 2 s l3
+ + 2 s+
l3
and measured contact angles: 1 2 3
Equations used for deriving unknown surface tension for a solid surface with three known liquid
surface tensions.
Substrate glass: sgvdW , sg , sg
+
Substrate silane: ssvdW , ss, ss
+
Substrate plasma: sgvdW , sg , sg
+
LVtot (cos g +1) = 2 l
vdWsgvdW + 2 sg l
+ + 2 sg+
l
LVtot (cos s +1) = 2 l
vdWssvdW + 2 ss l
+ + 2 ss+
l
LVtot (cos p +1) = 2 l
vdWspvdW + 2 sp l
+ + 2 sp+
l
and measured contact angles: g s p
Equations used for deriving unknown surface tension of a powder melt using three known substrate surface tensions. Write the equations in matrix form.
(cos g +1)
2(cos s +1)
2(cos p +1)
2
= b1 2 4 3 4
=
sgvdW
sg sg+
ssvdW
ss ss+
spvdW
sp sp+
= A1 2 4 4 4 3 4 4 4
lvdW
l+
l
= X1 2 4 3 4
1
LVtot
Move all known values to the left hand side forming a vector C. A 1b = C = c1 c2 c3[ ]T and
all unknown X1
LVtot to the right hand side.
A 1b = C = X1
LVtot A 1b = C can easily be evaluated by the use of any
mathematical computer software.
C = X1
LVtot see the deriving of the separate surface
tensions below.
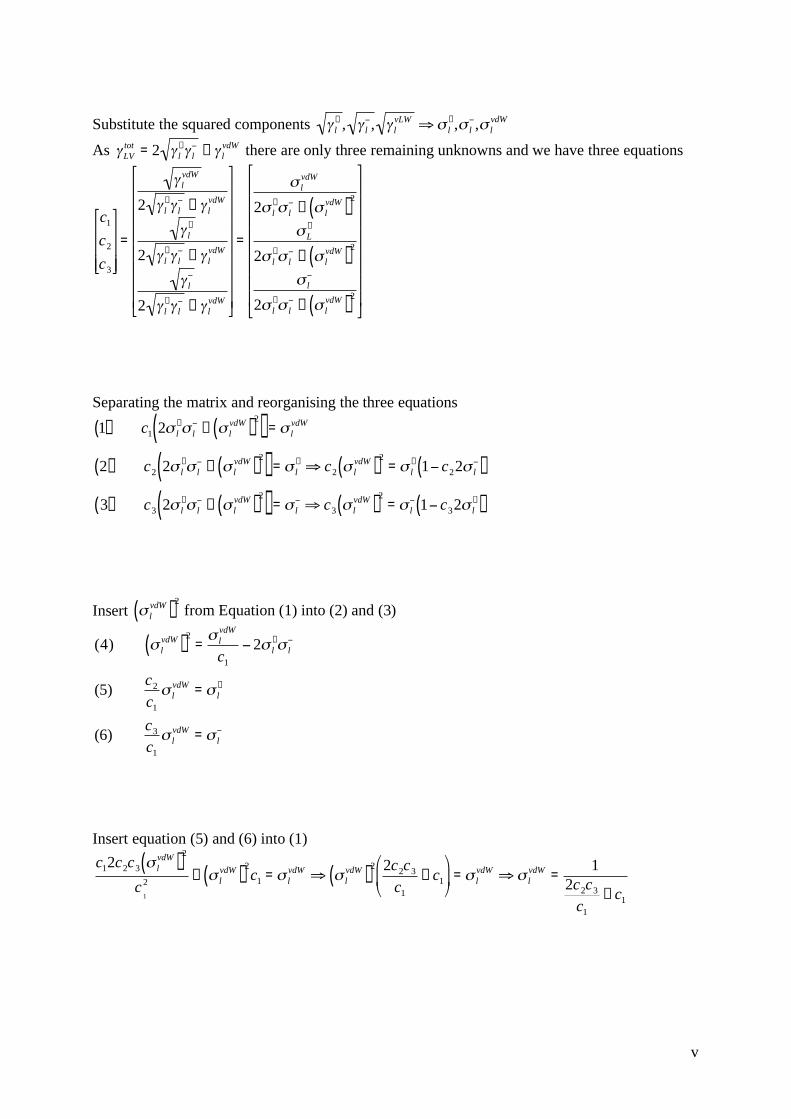
v
Substitute the squared components l+ , l , l
vLWl+, l , l
vdW
As LVtot = 2 l
+
l + lvdW there are only three remaining unknowns and we have three equations
c1
c2
c3
=
lvdW
2 l+
l + lvdW
l+
2 l+
l + lvdW
l
2 l+
l + lvdW
=
lvdW
2 l+
l + lvdW( )
2
L+
2 l+
l + lvdW( )
2
l
2 l+
l + lvdW( )
2
Separating the matrix and reorganising the three equations
1( ) c1 2 l+
l + lvdW( )
2
( ) = lvdW
2( ) c2 2 l+
l + lvdW( )
2
( ) = l+ c2 l
vdW( )2
= l+ 1 c22 l( )
3( ) c3 2 l+
l + lvdW( )
2
( ) = l c3 lvdW( )
2= l 1 c32 l
+( )
Insert lvdW( )
2 from Equation (1) into (2) and (3)
(4) lvdW( )
2= l
vdW
c1
2 l+
l
(5)c2
c1lvdW = l
+
(6)c3
c1lvdW = l
Insert equation (5) and (6) into (1)
c12c2c3 lvdW( )
2
c1
2 + lvdW( )
2c1 = l
vdWlvdW( )
2 2c2c3
c1
+ c1
= l
vdWlvdW =
12c2c3
c1
+ c1
vi
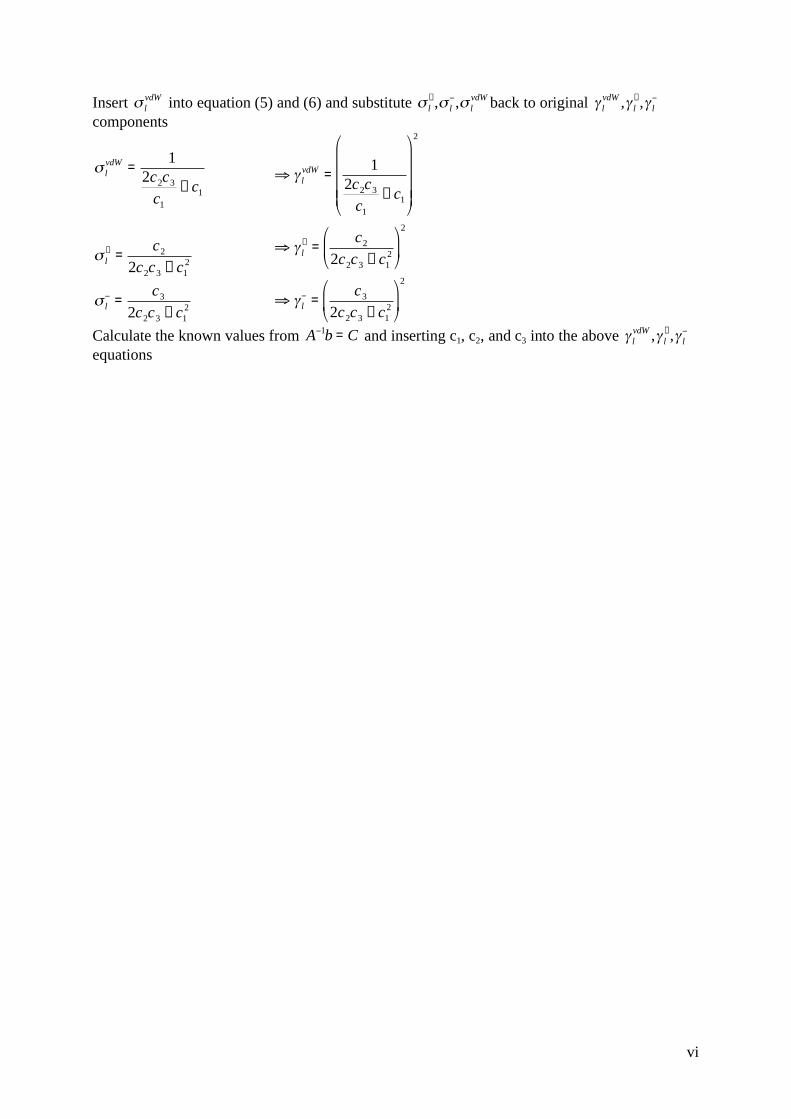
Insert lvdW into equation (5) and (6) and substitute l
+, l , lvdW back to original l
vdW , l+, l
components
lvdW =
12c2c3
c1
+ c1
l+ =
c2
2c2c3 + c12
l =c3
2c2c3 + c12
lvdW =
12c2c3
c1
+ c1
2
l+ =
c2
2c2c3 + c12
2
l =c3
2c2c3 + c12
2
Calculate the known values from A 1b = C and inserting c1, c2, and c3 into the above lvdW , l
+, l equations