filter optimization-challenges and opportunities operations/filter... · 2016-11-22 · media...
TRANSCRIPT

Overview
Increased federal emphasis on filter performanceVirginia’s emphasis on filter performanceMedia filter optimizationChallenges to good filtrationFinding solutions
Increased federal emphasis on filter performanceVirginia’s emphasis on filter performanceMedia filter optimizationChallenges to good filtrationFinding solutions

Federal Emphasis on Filter Performance: LT2 Summary
Increased filter performance is equated to increased pathogen reductionSource water monitoring for Cryptosporidium determines Bin classification Current classification my change in 2015‐
2016 (periodic testing is required)Bin classification determines additional Cryptosporidium removal requirements
Increased filter performance is equated to increased pathogen reductionSource water monitoring for Cryptosporidium determines Bin classification Current classification my change in 2015‐
2016 (periodic testing is required)Bin classification determines additional Cryptosporidium removal requirements
LT2 Bin Classification
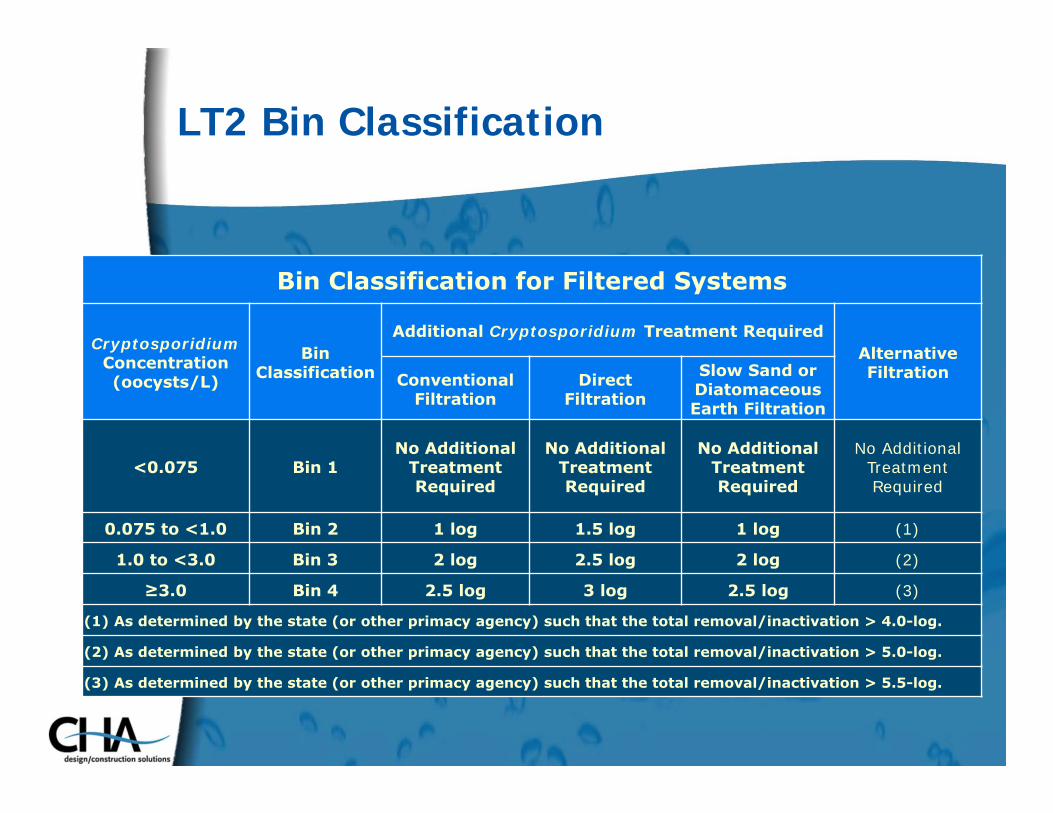
Bin Classification for Filtered Systems
CryptosporidiumConcentration(oocysts/L)
BinClassification
Additional Cryptosporidium Treatment RequiredAlternativeFiltrationConventional
FiltrationDirect
Filtration
Slow Sand orDiatomaceousEarth Filtration
<0.075 Bin 1No Additional
Treatment Required
No Additional Treatment Required
No Additional Treatment Required
No Additional Treatment Required
0.075 to <1.0 Bin 2 1 log 1.5 log 1 log (1)
1.0 to <3.0 Bin 3 2 log 2.5 log 2 log (2)
≥3.0 Bin 4 2.5 log 3 log 2.5 log (3)
(1) As determined by the state (or other primacy agency) such that the total removal/inactivation > 4.0-log.
(2) As determined by the state (or other primacy agency) such that the total removal/inactivation > 5.0-log.
(3) As determined by the state (or other primacy agency) such that the total removal/inactivation > 5.5-log.
Federal Emphasis on Filter Performance: LT2 Microbial Toolbox
Pathogen removal credits granted for: Source Protection and Management Pre‐filtration, pre‐sedimentation, bank
filtration Filter performance Additional Filtration (bags, membranes,
DE, etc.) Inactivation (UV, Ozone, etc.)Optimization of filter performance can frequently provide additional pathogen removal credit with limited capital cost
Increased Federal Emphasis on Filter Performance: LT2 Filter Performance Credit
Combined filter performance (0.5 log Crypto removal credit)
• ≤0.15 NTU in 95% of filtered water measurementsIndividual filter performance (0.5 log Crypto removal credit)
• ≤0.15 NTU in 95% of filtered water measurements• Never exceed 0.3 NTU in any two consecutive 15‐minute measurements
Optimized Filter performance can yield a 1.0 log Crypto removal credit; Bin 2 systems with optimized filtration can avoid capital expenses for UV, Ozone, etc.

Example Individual Filter Data
MonthsExamined
Filter 1 Filter 2 Filter 3 Filter 4#
≥0.15 NTU
% ≤0.15 NTU
# ≥0.15 NTU
% ≤0.15 NTU
# ≥0.15 NTU
% ≤0.15 NTU
# ≥0.15 NTU
% ≤0.15 NTU
February 2009
2 98.8% 0 100.0% 0 100.0% 2 98.8%
July 2009 3 98.4% 2 98.9% 1 99.5% 4 97.8%
December 2009
1 99.5% 0 100.0% 3 98.4% 1 99.5%
January 2010
0 100.0% 0 100.0% 1 99.5% 1 99.5%
July 2010 12 93.5% 11 94.1% 9 95.2% 10 94.6%
July 2011 0 100.0% 0 100.0% 0 100.0% 0 100.0%

Example Individual Filter Data
Applied filter turbidities averaged 0.42 NTUFiltered water turbidities averaged 0.032 NTUIn three years, there was one month that would have failed the LT2 individual filter requirements to help meet Bin 2 based on 4‐hour dataThere is some forgiveness if failure is very rare, but reliance on this is riskyConsistent performance is essential!!!
Applied filter turbidities averaged 0.42 NTUFiltered water turbidities averaged 0.032 NTUIn three years, there was one month that would have failed the LT2 individual filter requirements to help meet Bin 2 based on 4‐hour dataThere is some forgiveness if failure is very rare, but reliance on this is riskyConsistent performance is essential!!!

Virginia Optimization Program (VOP)
Meeting the EPA standards is not the ultimate goal… the goal is to provide pathogen free drinking waterThe VOP program establishes achievement goals to inspire operators to optimize their plants
Meeting the EPA standards is not the ultimate goal… the goal is to provide pathogen free drinking waterThe VOP program establishes achievement goals to inspire operators to optimize their plants
From 2012 VOP Document:The purpose of VOP is to reduce the risks to public health associated with drinking water beyond the risk reduction inherent by adherence to regulatory standards. VOP is currently focused on enhanced particulate removal at surface water treatment plants with gravity flow, granular media filters.

Performance Goals for Optimization
Clarification• Effluent turbidity < 1.0 NTU 95 % of time when average raw water turbidity for month < 10.0 NTU• Effluent turbidity < 2.0 NTU 95 % of time when average raw water turbidity for month > 10.0 NTU
Filtration
• Filtered water turbidity < 0.10 NTU 95 % of time (excluding 15 minutes after backwash)• Filtered water turbidity < 0.3 NTU 100% of time
Filter Backwash
• Backwash recovery period < 15 min. (return to < 0.10 NTU) in 95% of backwashes • Peak turbidity < 0.3 NTU during backwash recovery period2 in 95 % of backwashes • Filtered water turbidity < 0.10 NTU 95% of time a filter is placed into service following a backwash (for 15 min)
Minimum Data Monitoring Requirements
• Raw water turbidity @ 2 hr. intervals (15 minute intervals if continuous monitoring is provided) • Clarified water turbidity @ 2 hr. intervals (15 minute intervals if continuous monitoring is provided) • Filtered water turbidity @ 15 minute intervals, each filter (in conformance with SWTR)• Filtered water turbidity when filter is returned to service following a backwash • Peak turbidity during backwash recovery, and period of recovery, each filter, every backwash

MEDIA FILTER OPTIMIZATION

Measuring Filter Performance
Although the design of media filters is highly standardized their performance varies widely. Why?
Although the design of media filters is highly standardized their performance varies widely. Why?
Source: Hancock et al, Journal AWWA, 1996

Media Filter Optimization
CoagulationBackwashing ProceduresCoagulationBackwashing Procedures

Coagulation
Straining is not the most important particle removal mechanism in media filtration
Adhesion due to particle‐media collision is key
Optimized chemical pretreatment (coagulation) has a greater impact on Cryptosporidium removal than filtration rates, filter media design, and filtration aids (polymer)Optimizing filtration for turbidity removal can provide Cryptosporidium removal in excess of 5 log (treatment technique)Under LT2, 4‐log credit can be achieved for conventional treatment with optimized filtration
Coagulation
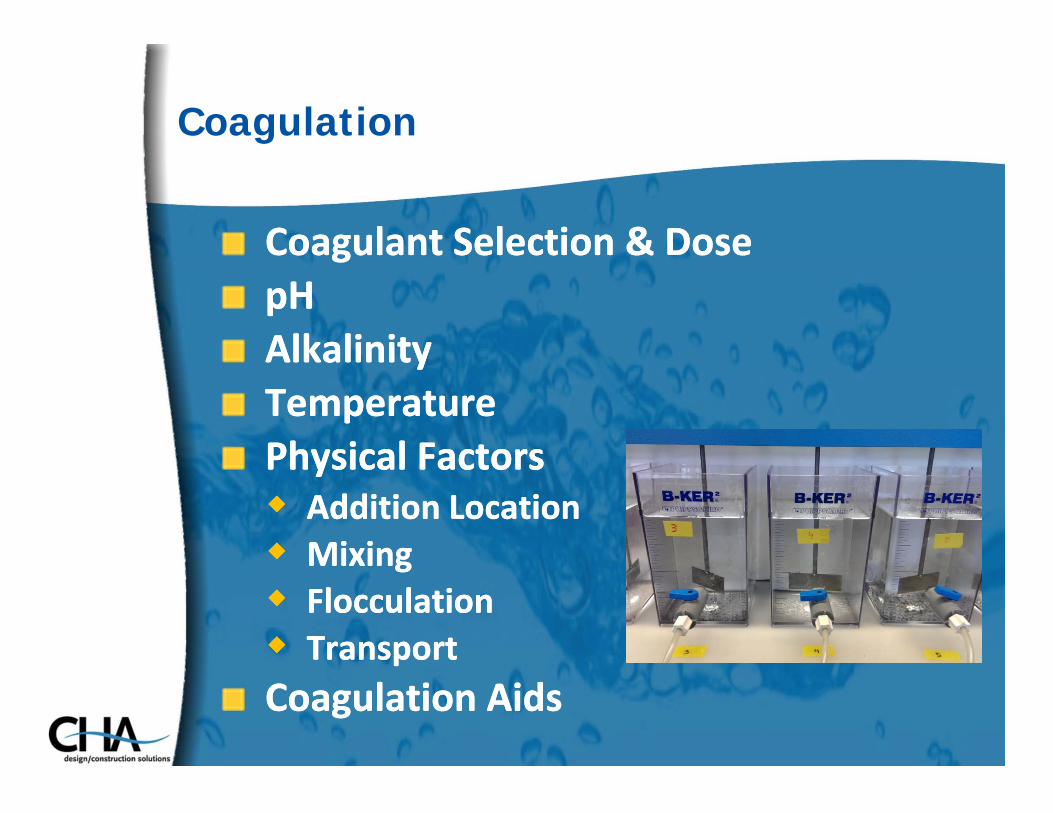
Coagulant Selection & DosepHAlkalinityTemperaturePhysical Factors Addition Location Mixing Flocculation TransportCoagulation Aids
Coagulant Selection & DosepHAlkalinityTemperaturePhysical Factors Addition Location Mixing Flocculation TransportCoagulation Aids

Coagulation
Is your current coagulant the best for your water?Is your water chemistry optimized for your coagulant and your water?Is your coagulant addition point and mixing intensity optimized for your coagulant?
Is your current coagulant the best for your water?Is your water chemistry optimized for your coagulant and your water?Is your coagulant addition point and mixing intensity optimized for your coagulant?

Filter Backwashing
Reduced filter performance during filter ripening can reduce Cryptosporidium removal by up to 1 logTurbidity removal is indicative of Cryptosporidium removal… a reason to filter the waste
Reduced filter performance during filter ripening can reduce Cryptosporidium removal by up to 1 logTurbidity removal is indicative of Cryptosporidium removal… a reason to filter the waste

Filter Backwashing:Sub-fluidization Wash
More important with evolving clarification processes that produce lower applied filter turbidities.
More important with evolving clarification processes that produce lower applied filter turbidities.
Source: Amburgey et al, Journal AWWA, 2003

Filter Backwashing:Backwash Water Chemistry
Backwashing with filtered vs. finished waterCorrosion Inhibitor, Chlorine, pH control
Backwashing with filtered vs. finished waterCorrosion Inhibitor, Chlorine, pH control
Source: Amburgey et al, Journal AWWA, 2004

Filtration Challenges
Chemical pretreatment: Coagulant type pH and other water chemistry parameters Coagulant addition point and mixingBackwash Procedures: Adequate backwashing Long ripening periodNew MediaAlgaeTurbidity Measurement
Chemical pretreatment: Coagulant type pH and other water chemistry parameters Coagulant addition point and mixingBackwash Procedures: Adequate backwashing Long ripening periodNew MediaAlgaeTurbidity Measurement

Filtration Challenges: New Media
Design media size and depth properly
Creates “tortuous path” Potential for higher filtration rates
Require onsite sieve analysis
Design media size and depth properly
Creates “tortuous path” Potential for higher filtration rates
Require onsite sieve analysis

Filtration Challenges: Algae
Type of Algae can change over time
Algal growth can lead to shorter filter runs
Chemical pretreatment can reduce algal growth but different chemicals may not provide the same results Chlorine and chlorine dioxide
may cause the algal cell to lyse Sodium permanganate kills the
algal cells without destroying them

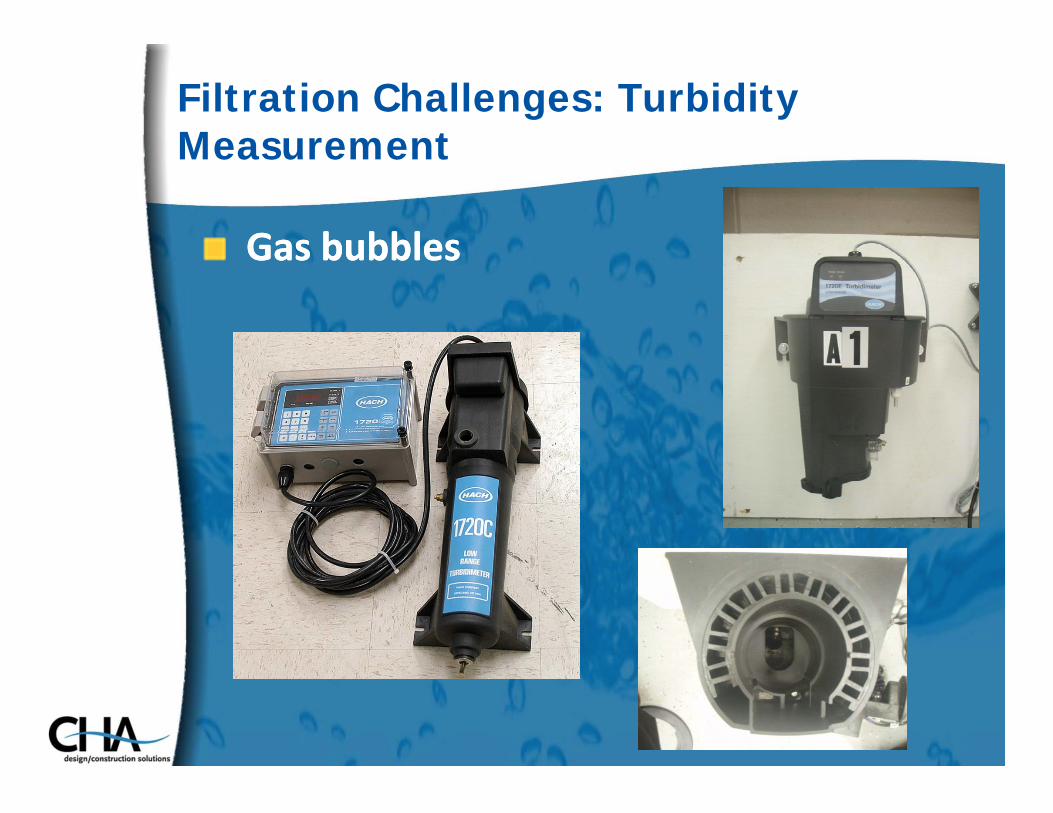
Filtration Challenges: Turbidity Measurement
Are the turbidimeters reporting numbers representative of actual turbidities?Equipment maintenance and calibration is a must
Are the turbidimeters reporting numbers representative of actual turbidities?Equipment maintenance and calibration is a must

Filtration Challenges: Turbidity Measurement
Don’t shear the particlesDon’t shear the particles
Source: Brumberger et al, Hach Turbidity Science
Filtration Challenges: Turbidity Measurement
Gas bubblesGas bubbles
Solutions
Cost‐effective solutions come down to good operators who know their plant and are devoted to producing the best water possible Vigilance Education and Experience Willingness to Change Improvement Implementation Plans
Cost‐effective solutions come down to good operators who know their plant and are devoted to producing the best water possible Vigilance Education and Experience Willingness to Change Improvement Implementation Plans

Solutions: Vigilance
Be proactiveDetermine/Understand what is going onConsider ways to make improvementsAsk questions
Be proactiveDetermine/Understand what is going onConsider ways to make improvementsAsk questions

Solutions: Education & Experience
Understand the issue and know your water and your plantUnderstand the issue and know your water and your plant

Solutions: Willingness to Change
Alternate pre‐oxidantsAlternate coagulantsAdjust mixing intensity/addition point
Alternate pre‐oxidantsAlternate coagulantsAdjust mixing intensity/addition point
Polymer/PAClbefore filtersPolymer/PAClbefore filters

Solutions: Incremental Changes
Make process changes one at a time and allow time to observe the effects Consider new coagulants and/or adjusting water
chemistry Adjusting mixers to the best speeds Consider adding coagulant in a pipe instead of
rapid mixer Consider adding polymer in the flocculators Consider permanganate addition for algal issues Consider adding polymer just prior to filters Consider changing backwash to include more or
less wash and perhaps sub‐fluidization flows Make sure your instruments are accurate with
calibration and that you understand their reporting protocol (averaging, instantaneous)
