fin fast track - spidispidi2.iimb.ernet.in/~networth/resources/fastrack/finfasttrack 2013... · fin...
TRANSCRIPT

Summers 2013-14
FIN FAST TRACK
Team NETWORTH
Abhishek Agarwal Akhil Mittal
Gaurav Pandey Akshat Sinha
Gautam Sridharan Devesh Jhalani
Lavanya Pandey Jyoti Nathany
Mehak Chopra Rahul Ghosh
Nikhil Pradeep Jalan Romil Johri
Pratik Jaipuriar Shashank Shekhar
Shobhit Aggarwal Shomrita Pal
Shubham Agrawal

Contents
AROUND THE WORLD ............................................................................................................................. 4
Abenomics and How Japan plans to reinvigorate? ................................................................................... 4
Eurozone recovery gathers steam in September ....................................................................................... 6
Emerging economies slowdown ............................................................................................................... 7
US Debt Ceiling Crisis .............................................................................................................................. 4
QE Tapering .............................................................................................................................................. 4
Detroit files for Bankruptcy ...................................................................................................................... 8
US unemployment rate at 5 year low ........................................................................................................ 8
Shibor Shock ............................................................................................................................................. 9
INDIAN MACRO ......................................................................................................................................... 9
RBI Policy under Raghuram Rajan ......................................................................................................... 10
Policy Measures .................................................................................................................................. 10
Policy Stance ....................................................................................................................................... 10
Forecasts ............................................................................................................................................. 10
Financial turmoil in India ........................................................................................................................ 11
NSEL Crisis ............................................................................................................................................ 11
What does NSEL do ............................................................................................................................ 11
Genesis of the problem ....................................................................................................................... 12
Government directives ........................................................................................................................ 12
Affected Parties ................................................................................................................................... 12
India joins the “defensive rate hike club”– engineers liquidity crunch................................................... 13
Inflation Data – September 2013 – WPI at 7 month high; Food Inflation @ 18% ................................. 14
Policy Guidance: ................................................................................................................................. 14
Chidambaram seeks 10 point action plan to revive economy ................................................................. 15
Key Macroeconomic Data - INDIA ........................................................................................................ 17
MERGERS AND ACQUISITIONS ....................................................................................................... 19
Overview ................................................................................................................................................. 19
Microsoft Nokia Deal ............................................................................................................................. 20

Verizon Vodafone Deal .......................................................................................................................... 22
HUL Unilever Deal ................................................................................................................................. 24
Ambuja Holcim Deal .............................................................................................................................. 25
June 2013 ................................................................................................................................................ 30
July 2013 ................................................................................................................................................. 31
August 2013 ............................................................................................................................................ 32
September ............................................................................................................................................... 34

4
AROUND THE WORLD
US Debt Ceiling Crisis
The US Debt ceiling represents the amount of borrowing the government can do which is
generally through the US treasury bonds and other securities. Inability of the government to
honour the debt and repay them leads to a situation of default if the debt ceiling is not raised
further.
The crisis in 2013 happened primarily due to a budget stand-off between the Democrats and the
Republicans. They could not reach an agreement over issues such as the reforms for American
Healthcare System due to which the debt ceiling could not be rose which was 16.7 trillion dollars
as of May 2013. The Republicans demanded for the privatization of the Medical Care and Social
Security programmes.
The consequences of the US debt crisis were that approximately 800000 employees in US were
indefinitely furloughed. An additional 1.3 million were kept on unsure payment terms. The US
treasuries were placed on the “rating watch negative” by Fitch. Many defence contractors and
manufacturers furloughed 1000s of their employees as they could not recover the money for the
sold goods. Many national parks were shutdown causing huge losses domestically.
Effects on the US bond market have been prevalent as the amount required to insure against a
US treasury default increased from .06% in Sep 2013 to 0.38% in Oct 2013. The dollar has been
trading at a two year low due to sentiments about the default. The sixteen day partial shutdown in
Oct 2013 has negatively affected the US dollar. However the US equity markets have not been
affected largely.
In mid-October US government struck a deal which has extended the US borrowing authority till
Feb 7 2014. It includes income verification measures for those who need subsidies under the
healthcare law. Also the Republicans took back many of their attempts including that of
eliminating medical device tax.
A debt crisis could invoke higher interest rates and severe impacts on the US economy. This
would ripple into other world economies as well.
QE Tapering
The US Federal Reserve Bank announced in May, 2013 that it will be slowing down the
Quantitative Easing (QE) programme as it does not need that sort of support anymore. The
reasons cited have been the impressive recovery of the US economy and the fear of increase in
inflation. QE was never a move to continue indefinitely as it increases the pressure on the US
balance sheet with each bond and security the Fed buys back.

5
US Fed has been adding $85 million per month into the banking system since Dec 2012 under its
QE programme by buying back bonds and Mortgage Backed Securities. US is currently in its
third round of QE. The announcement to begin tapering resulted in high volatilities in the equity
market and steep selling off of the US bonds. Tapering will result in high interest rates especially
at the longer end of the yield curve. It can slow down the housing market as the mortgage rates
will go up. It would also increase the cost to federal budget affecting programmes such as the
fiscal policy health. The borrowing cost for US will rise substantially which is already facing the
crisis of high debt.
Post the announcement the 10 year US bond yields have raised from 1.68% to 2.98%. Investors
seem to be fleeing the US Treasuries. In the long run it can affect the stock market as well
because as the bond yields rise, investors will shift from the stock markets to the bond markets.
S&P stock index and Gold plummeted substantially. Gold prices decreased by 26.4% in the first
half of 2013. Dow Jones Index also experienced a sharp fall. Emerging markets such as India and
Indonesia have been badly hit as the investors pull their money back to US. They have largely
used the foreign capital for funding their current account deficits. Australian Dollar has been
pushed down as an aftereffect. Tapering can also decrease the credit and liquidity quality for the
emerging economies.
However in Sep 2013 Ben Bernanke announced that US Fed does not intend to start the tapering
any time soon. This calmed the stock markets and the bond markets. The speculation for tapering
will continue to be on the minds of the traders and banks across the world. It has to be seen when
it comes into effect.
Abenomics and How Japan plans to reinvigorate?
Abenomics refers to the economic policies advocated by Shinzō Abe, the current Prime Minister
of Japan who assumed office on 26 December 2012.
Abe supports economic policies that include an aggressive monetary, fiscal and structural
reforms intended towards spurring inflation and taking Japan out of its decades-long deflationary
period. The bigger goal is to boost annual GDP growth (currently 2%), and take inflation to 2%
via various measures like short-term stimulus spending, monetary easing, and reforms to boost
the domestic labor markets and bolster trade partnerships.
The policy is a remarkable departure of former governor Masaaki Shirakawa where Japan’s
central bank set the inflation target of 2%. It pledged to achieve this through quantitative easing
that would buy mostly short-term government debt in an asset purchase plan. Haruhiko Kuroda
who is widely regarded as a proponent of aggressive easing policies was installed as the new
head of the central bank in February 2013.
6
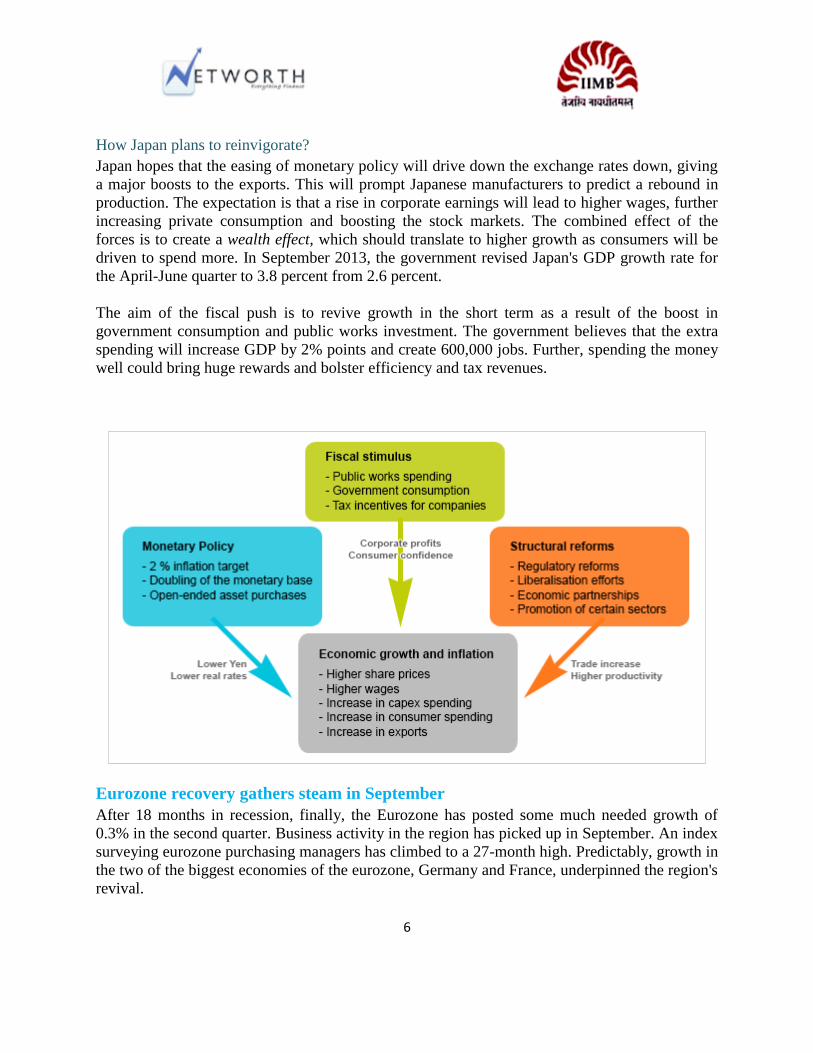
How Japan plans to reinvigorate?
Japan hopes that the easing of monetary policy will drive down the exchange rates down, giving
a major boosts to the exports. This will prompt Japanese manufacturers to predict a rebound in
production. The expectation is that a rise in corporate earnings will lead to higher wages, further
increasing private consumption and boosting the stock markets. The combined effect of the
forces is to create a wealth effect, which should translate to higher growth as consumers will be
driven to spend more. In September 2013, the government revised Japan's GDP growth rate for
the April-June quarter to 3.8 percent from 2.6 percent.
The aim of the fiscal push is to revive growth in the short term as a result of the boost in
government consumption and public works investment. The government believes that the extra
spending will increase GDP by 2% points and create 600,000 jobs. Further, spending the money
well could bring huge rewards and bolster efficiency and tax revenues.
Eurozone recovery gathers steam in September
After 18 months in recession, finally, the Eurozone has posted some much needed growth of
0.3% in the second quarter. Business activity in the region has picked up in September. An index
surveying eurozone purchasing managers has climbed to a 27-month high. Predictably, growth in
the two of the biggest economies of the eurozone, Germany and France, underpinned the region's
revival.

7
However, individual countries further down the pecking order throw up some interesting
statistics. Portugal, which got bailed out for lack of competitiveness and profligacy, grew at
1.1%. On the other hand, Netherlands, famous for fiscal prudence, contracted by 0.2% in the
fourth straight quarter. The economies of Italy and Spain remained stuck in reverse gear as well.
As such, the overall scenarios looks much better but it also depends on where one looks at in
Europe.
Across the Eurozone, firms have been amassing huge cash reserves which, due to the uncertain
economic scenario, have neither been spent on new machinery or new staff. These firms need
more evidence for a true lift than a mere quarter of expansion before they undertake heavy
capital expenditure.
The eurozone crisis has dominated the political and economic sphere for more than three years.
During that time millions have lost their jobs creating a legacy of high unemployment and long-
term underemployment which will take years to tackle.
With more than a quarter of their populations out of work today, countries like Spain and Greece
probably still finding solutions to their jobs crisis by the time the next recession rolls around. The
challenge for Europe's top brass will be to convince companies that the future is bright!
Emerging economies slowdown
The emerging economies’ share of the world output is no longer rising as fast as it did in the
2000s. 2009 saw a year-on-year increase of almost 1.5 percentage points. Tallying with a striking
slowdown in the BRIC growth rates, once again the output is back to below one percentage
point. Putting it in another perspective, in 2008, the emerging economies accounted for two-
thirds of world GDP growth. In 2011, they accounted for half of it, and in 2012, even less than
that. Predictions from IMF tell that this will remain the same for another 5 years.
Is this just a blip or a sign of trend?
According to Kantar research data, while the expectation of growth is to continue, it will be at a
lower rate than in recent decades. Businesses looking for sources of growth in emerging markets
need to take a more granular look at the opportunities. They advise:
Look beyond the BRIC model. Investing mainly in emerging markets in search of growth
is a one-horse bet which will leave you stranded if the horse falters.
Don't assume that the next few years will be like the last few years.
Make sure that your economics analysis pays attention to uncertainties caused by non-
economic factors such as institutional and environmental constraints.
Take a more granular view of emerging markets and the opportunities within them-the
emerging middle class in São Paulo is different from that in Senegal.

8
Detroit files for Bankruptcy
The city of Detroit filed for Chapter 9 bankruptcy on July 18, 2013. It is the largest municipal
bankruptcy filing in U.S. history by debt, estimated to be $18–20 billion, exceeding Jefferson
County, Alabama's $4 billion filing in 2011. Detroit is also the largest city by population in the
U.S. history to file for Chapter 9 bankruptcy, more than twice as large as Stockton, California,
which filed in 2012. Detroit’s population has declined from a peak of 1.8 million in 1950.
Numerous factors over many years have brought Detroit to this point, including a shrunken tax
base but still a huge, 139-square-mile city to maintain; overwhelming health care and pension
costs; repeated efforts to manage mounting debts with still more borrowing; annual deficits in the
city’s operating budget since 2008; and city services crippled by aged computer systems, poor
record-keeping and widespread dysfunction.
Some of the other cities in the US that have recently been downgraded by Moody’s and are
considered to be potential for bankruptcy filings are –
City Population Annual Budget Shortfall, 2012 2011 unemployment Rate
Camden, New Jersey 517,234 20.2% 11.1%
Cincinnati, Ohio 331,285 20% 8.7%
Baltimore 599,657 15% 9.4%
US unemployment rate at 5 year low
The Labor Department said Friday, September 6th that the unemployment rate dropped to 7.3
percent, the lowest in nearly five years. But it fell because more Americans stopped looking for
work and were no longer counted as unemployed. The proportion of Americans working or
looking for work fell to its lowest level in 35 years.
Data suggested that most of the hiring in
August was in lower-paying industries
such as retail, restaurants and bars,
continuing a trend that began earlier this
year. Retailers added 44,000 jobs and
hotels, restaurants and bars added
27,000. Temporary hiring rose by
13,000. Manufacturers added 14,000, the
first gain after five months of declines. Construction jobs were unchanged in August. Auto

9
manufacturers boosted hiring in August. Some of the jobs were workers who were rehired last
month after being temporarily laid off in July, when factories switched to new models.
Americans are buying more cars than at any time since the recession began in December 2007.
And U.S. factories expanded in August at their fastest pace in more than two years.
Shibor Shock
Ever since Bagehot wrote his book “The Lombard Street”, the Central
Banks have been considered as the lenders of last resort. However,
June 2013 saw a slight departure from this when the PBOC refused to
intervene even though the Chinese economy was reeling with what
was called the Shibor (Shanghai Interbank Offer Rate) Shock –
referring to the sharp hike in the 7 day repo rate to 12% and a
moderate hike in the 3 month SHIBOR on June 20th. In the previous
week, the banks had faced a sudden liquidity crunch, caused by
primarily two factors – first was the crackdown on illicit capital
inflows, and second was the withdrawal of deposits and payment of taxes before the Dragon
Boat holiday. While due to this illiquidity banks were struggling to acquire the required reserve
capital, the PBOC refused to intervene. According to Economist “Why was the PBOC so hard-
nosed? It sets an explicit target for money-supply growth and an implicit target for credit
growth. These targets are supposed to be consistent with each other and with economic stability.
From its point of view, if banks find themselves short of money they must have provided too much
credit. That may well be the case. Although straightforward bank loans are under control, banks
have simply invented new ways of lending.” Though the reasons why PBOC didn’t jump in are
debatable, yet this deterrence on the part of the central bank to act as the lender of the last resort,
led to the crippling of the Chinese Banking system and thus, the Shibor Shock.

10
INDIAN MACRO
RBI Policy under Raghuram Rajan
Reserve Bank of India Governor Raghuram Rajan struck a hawkish tone as he raised the repo
rate by 25 basis points (bps) to 7.5%. His measure was taken primarily due to the inflation
remaining high. Following are highlights from the monetary policy statements.
Policy Measures
Lowers marginal standing facility rate by 75 bps to 9.50 per cent
Raises repo rate and reverse repo rate by 25 bps to 7.50 % and 6.50 % respectively.
Cash reserve ratio (CRR) unchanged at 4.00 %
Partially relaxes minimum daily cash balance requirement to 95 % of deposits from 99 %
Policy Stance
Bringing down inflation to more tolerable levels warrants raising the repo rate by 25 basis
points immediately
To contemplate easing cash tightening measures in a calibrated manner
Policy steps to mitigate exchange market pressures, create a conducive environment for
revitalization of sustainable growth
Steps intended to address inflationary pressures so as to provide a stable nominal anchor for
the economy
Forecasts
Timing, direction of further actions on exceptional measures will be contingent upon
exchange market stability, and can be two-way
Further actions need not be announced only on policy dates
Focus now on internal determinants of rupee, fiscal deficit and domestic inflation, after steps
taken to contain current account gap
Growth is trailing below potential and the output gap is widening
Growth could pick up in the second half of the year
Despite good monsoons leading to some moderation in CPI inflation, no room for
complacency
In the absence of an appropriate policy response, WPI inflation will be higher than initially
projected over the rest of the year
Further change in the minimum daily maintenance of the CRR not contemplated
Objective to normalize conduct and operations of monetary policy so as to allow the repo
rate to resume its role as operational policy rate

11
Financial turmoil in India
This year has been extremely tough for the Indian markets. Rupee sunk to its all-time low against
the US dollar. Money-market rates rose. Although the broad market has been steady, the shares
of banks thought to be either full of bad debts or short of deposit funding fell sharply. The sell-
off had been made worse by new capital controls introduced on August 14th in response to
incipient signs of capital flight. They reduce the amount Indian residents and firms can take out
of the country. Foreign investors took fright, fearful that India might freeze their funds too.
Following are the key points that have resulted in pressure in the markets
India’s economic news has disappointed the markets for the past two years.
Growth rate is expected to be 4-5 % for this year.
Consumer price inflation remains stubborn at 10%. This has restricted RBI from cutting
its key policy rate.
The current account deficit has remained high at 4.6% and fiscal deficit at 5.3% of GDP
External borrowing has not risen by much relative to GDP—the ratio stands at 21%
today—but debt has become more short-term, and therefore riskier.
Total financing needs (defined as the current-account deficit plus debt that needs rolling
over) are $250 billion over the next year. India’s reserves are $279 billion, giving a
coverage ratio of 1.1 times. That has fallen sharply from over three times in 2007-08 and
leaves India looking weaker than many of its peers.
It needs to be seen how the government and RBI respond to stabilize the economy.
NSEL Crisis
What does NSEL do
NSEL was set up as a spot exchange where farmers and industrial producers could sell
commodities to traders through an electronic trading platform. According to the rule, all spot
contracts should settle within 11 days i.e. (T+10 basis; trading plus 10 days). Sellers were
required to deposit physical commodity in the NSEL warehouse. However, NSEL was offering
contracts over T+10 settlement cycle. It allowed buyers who could not pay for commodities they

12
bought more time and sellers who could not deliver commodities sold on time. This amounted to
forward trading, which is in violation of NSEL’s mandate.
Genesis of the problem
The root of the crisis lies in the long-dated contracts offered by NSEL that along with spot
contracts facilitated financing of commodity producers while offering 15-16% annualized returns
to the investors or lenders. While operating as a spot exchange where contracts are settled within
one or two days of a trade (T+1, T+2), NSEL also offered contracts for which the settlement
cycle ranged anywhere between 25 to 36 days for various commodities. Such long-period
contracts effectively acted as forward contracts which are long-dated derivative products
typically provided by an over-the-counter market.
For example, in a commodity where prices were trending up, the investor would buy a contract
while simultaneously selling a contract of the T+25 settlement cycle. The supplier or processor
of the commodity acted as the counter-party to both these trades. As a result, the supplier could
utilize the money earned in the first tranche of the trade for financing working capital
requirements while the investor could execute an arbitrage trade which offered 1% to 2% of
returns over the duration.
In effect, the ownership of the commodity just changes hands on paper without involving a
change in possession. Sugar, castor seed, paddy and raw cotton were amongst the 11
commodities on which these trades gained popularity. The extent of money involved in these
trades ballooned as most of the times the positions were rolled over for another trade cycle and
lenders collected the interest amount from each preceding trade.
Government directives
On July 10, Consumer Affairs Secretary held meeting with spot exchanges (NSEL and NCDEX
Spot Exchange). The ministry seeks an undertaking from NSEL that: (a) no further/fresh
contracts will be launched until further instructions; and (b) all existing contracts will be settled
on the due dates. Following the directives, NSEL issued a directive to its members that all
contracts have to be settled within 11 days or a (T+10) basis and that too on payment against
delivery basis. It also restricted traders from putting buy or sell trades at the same time to square
off the exposure to the market. The directive was to close the contracts and settle these on July
31. But NSEL cited “grave emergency” and market “disequilibrium”, deferring the settlement by
another 15 days. Later, it said it wanted another 5 months for this.
Affected Parties
Over Rs 5,600 crore trades remain unsettled. About 15,000 investors have to receive funds from
the exchanges. Half of these investors are small investors. Several leading brokering house like

13
Motilal Oswal, Indian Infoline, Geojit also suffered as their clients had exposure to the tune of
Rs 700 crore.
India joins the “defensive rate hike club”– engineers liquidity crunch
The last two quarters saw India joining the “defensive rate hike club” along with Indonesia,
possibly Turkey, and to some extent Brazil. In order to deal with the INR depreciation, the
authorities had three options: FX intervention; attracting new capital inflows through a sovereign
issuance, raising caps on foreign portfolio investment and/or lifting ceilings on FDI in specific
sectors; defensive rate hikes1.
Though the RBI did try to intervene into the FX market to reduce volatility and speculation, yet
the effect was pretty modest given the large amount of FII outflows. Thus, it decided to squeeze
liquidity by restricting proprietary trading, lowering open position limits and raising margin
requirements in an effort to curb speculation.
Moreover, it also took an unorthodox approach to tightening. Rather than hiking the repo rate
(the main policy rate) RBI engineered a liquidity squeeze to raise the cost of shorting INR and
attract capital inflows/reduce outflows.
First, Subbarao raised the Marginal Standing Facility (MSF) rate by 200bps to 10.25% thus
widening the policy rate corridor. The Bank Rate which is tied to the MSF was also raised by
200bps. Second, the RBI has placed a limit on the amount banks can borrow from the RBI’s
main overnight window—the liquidity adjustment facility (LAF)—to 1% of net demand and time
liabilities. Finally the RBI announced open market operations to sell government securities and
thus absorb liquidity.
The result was favourable: INR strengthened about 1% against USD, short-rates spiked by
around 250 bps as the bond and swap curve flattened and/or inverted, and rate sensitive sectors
(real estate, infrastructure and banking) sold off heavily.
The bottom line was that RBI effectively hiked overnight rates despite leaving the main policy
rate untouched. If sustained the resulting tighter financial conditions, like a normal rate hike,
could have posed a downside risk to the already weak growth outlook, but Raghuram Rajan who
succeeded Subbarao, has tried to reverse the steps, given the stabilization of INR vis-a-vis USD.

14
Inflation Data – September 2013 – WPI at 7 month high; Food Inflation @ 18%
The Wholesale Price Index (WPI) based inflation surprised all when the index came out as
6.46% instead of 6.1% that was being expected. Much of this increase can be attributed to
primary articles (owing to higher food as well as non-food inflation). Food inflation inched upto
18.4%, remaining elevated owing to continued high vegetable (89.37%) and fruit (13.5%)
inflation. Inflation in non-food primary articles also reported an increase to 5.17% as against
1.06% in the previous month. Table 1 represents the different components of WPI.
The combined (rural + urban) Consumer Price Index (CPI) inflation for September 2013
also produced negative results, inching up to 9.84% as compared to 9.52% in August 2013.
Worryingly, the contribution to a spike is driven by food, fuel as well as core inflation. Similar to
trends in WPI inflation, the food component in CPI is driven largely by vegetable and fruits
inflation.
Policy Guidance:
Even as food inflation is anticipated to ease going ahead, it is unlikely to lead to a substantial
moderation in headline WPI inflation (also likely to be impacted by imported inflation and low
base). In addition CPI inflation has also risen and remains sticky at near double-digit levels,
keeping elevated inflationary expectations intact. It is expected that RBI will hike the repo rate
by 25bps to 7.75% in its next policy review due on October 29, 2013. Also, the INR has
appreciated by more than 10% from its record low and is now stabilizing at present levels,
providing comfort to policymakers on the currency front. In view of this, we believe that the RBI
is likely to get some headroom for easing some of the exceptional short-term liquidity tightening
measures. We expect the RBI to reduce the marginal standing facility (MSF) rate by 25bp. We
thus expect the corridor between the repo and MSF to normalize at 100bp from 150bp currently

15
Figure 1 WPI data
Chidambaram seeks 10 point action plan to revive economy
In an attempt to kick-start a wider set of measures to revive the economy and improve business
sentiment, Chidambaram came up with ten-point action plan that would implement or prioritise
these ideas over the coming months. This was also used as mechanism to send out a signal that
the government was for the time done with steps to stabilise the rupee and wants to move on to
other pressing issues.
One key initiative that the government was working on was to open up the ports sector and the
real estate investment trusts (REITs) to help attract more equity. The action plan also included
impediments that were felt to be removed in order to revive growth from its low levels of 4.8%.
Another action point on Chiddu’s list was to contain the current account deficit at $70 billion,
3.7% of GDP against 4.8% last year, and he outlined a plan to fund this deficit without drawing
on the country's forex reserves.
Also the government further increased the duty on gold and silver while the Reserve Bank of
India lowered the limit on outbound investment through the automatic route for corporate and
also reduced the amount individuals could send out under the liberalised remittances schemes to
75,000 dollars from 200,000 dollars.

16
Other than keeping a check on deficits, Chidambaram's agenda for reforms also include accretion
to forex reserves, revival of the investment cycle, pushing through the capex programme of
public sector firms and capital infusion in public sector banks.
Finally he also emphasized on the need to resolve the impasse relating to “coal, iron ore,
environment and land acquisition issues”.
17
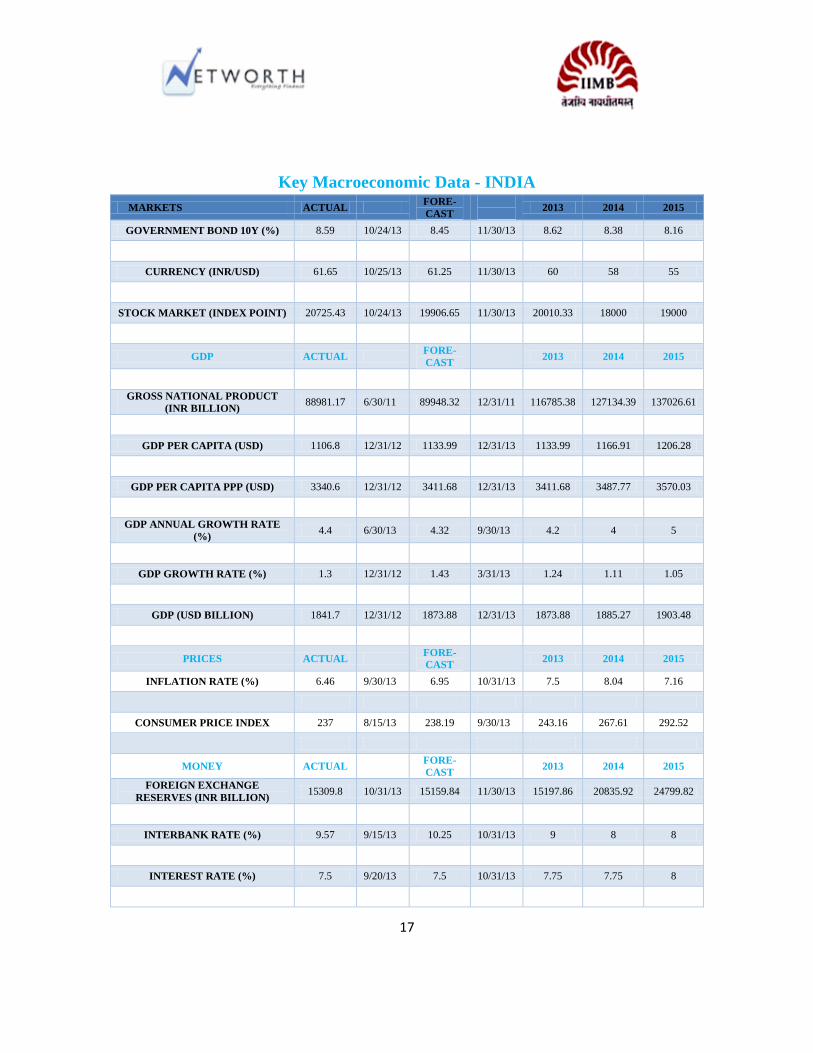
Key Macroeconomic Data - INDIA
MARKETS ACTUAL FORE-
CAST
2013 2014 2015
GOVERNMENT BOND 10Y (%) 8.59 10/24/13 8.45 11/30/13 8.62 8.38 8.16
CURRENCY (INR/USD) 61.65 10/25/13 61.25 11/30/13 60 58 55
STOCK MARKET (INDEX POINT) 20725.43 10/24/13 19906.65 11/30/13 20010.33 18000 19000
GDP ACTUAL FORE-
CAST 2013 2014 2015
GROSS NATIONAL PRODUCT
(INR BILLION) 88981.17 6/30/11 89948.32 12/31/11 116785.38 127134.39 137026.61
GDP PER CAPITA (USD) 1106.8 12/31/12 1133.99 12/31/13 1133.99 1166.91 1206.28
GDP PER CAPITA PPP (USD) 3340.6 12/31/12 3411.68 12/31/13 3411.68 3487.77 3570.03
GDP ANNUAL GROWTH RATE
(%) 4.4 6/30/13 4.32 9/30/13 4.2 4 5
GDP GROWTH RATE (%) 1.3 12/31/12 1.43 3/31/13 1.24 1.11 1.05
GDP (USD BILLION) 1841.7 12/31/12 1873.88 12/31/13 1873.88 1885.27 1903.48
PRICES ACTUAL FORE-
CAST 2013 2014 2015
INFLATION RATE (%) 6.46 9/30/13 6.95 10/31/13 7.5 8.04 7.16
CONSUMER PRICE INDEX 237 8/15/13 238.19 9/30/13 243.16 267.61 292.52
MONEY ACTUAL FORE-
CAST 2013 2014 2015
FOREIGN EXCHANGE
RESERVES (INR BILLION) 15309.8 10/31/13 15159.84 11/30/13 15197.86 20835.92 24799.82
INTERBANK RATE (%) 9.57 9/15/13 10.25 10/31/13 9 8 8
INTEREST RATE (%) 7.5 9/20/13 7.5 10/31/13 7.75 7.75 8
18
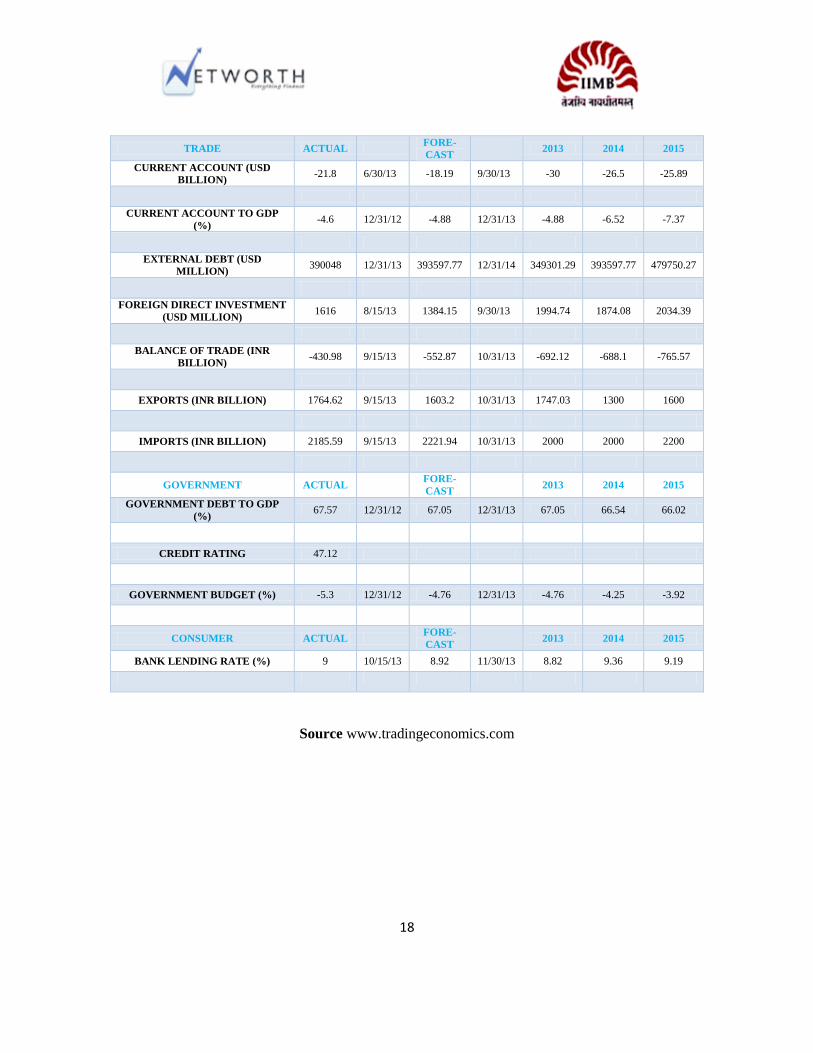
TRADE ACTUAL FORE-
CAST 2013 2014 2015
CURRENT ACCOUNT (USD
BILLION) -21.8 6/30/13 -18.19 9/30/13 -30 -26.5 -25.89
CURRENT ACCOUNT TO GDP
(%) -4.6 12/31/12 -4.88 12/31/13 -4.88 -6.52 -7.37
EXTERNAL DEBT (USD
MILLION) 390048 12/31/13 393597.77 12/31/14 349301.29 393597.77 479750.27
FOREIGN DIRECT INVESTMENT
(USD MILLION) 1616 8/15/13 1384.15 9/30/13 1994.74 1874.08 2034.39
BALANCE OF TRADE (INR
BILLION) -430.98 9/15/13 -552.87 10/31/13 -692.12 -688.1 -765.57
EXPORTS (INR BILLION) 1764.62 9/15/13 1603.2 10/31/13 1747.03 1300 1600
IMPORTS (INR BILLION) 2185.59 9/15/13 2221.94 10/31/13 2000 2000 2200
GOVERNMENT ACTUAL FORE-
CAST 2013 2014 2015
GOVERNMENT DEBT TO GDP
(%) 67.57 12/31/12 67.05 12/31/13 67.05 66.54 66.02
CREDIT RATING 47.12
GOVERNMENT BUDGET (%) -5.3 12/31/12 -4.76 12/31/13 -4.76 -4.25 -3.92
CONSUMER ACTUAL FORE-
CAST 2013 2014 2015
BANK LENDING RATE (%) 9 10/15/13 8.92 11/30/13 8.82 9.36 9.19
Source www.tradingeconomics.com

19
MERGERS AND ACQUISITION
Overview
The erratic pattern of the M&A industry since the financial crisis has led to lukewarm
performance throughout the bulge bracket, boutique and other firms across the globe. A brief
synopsis of the past 12 months (Oct- ’12 – Sept- ’13), gives the following picture (globally).
Number of Deals 27059
Value $ 2.63 Trillion
Average Disclosed Deal
Size
$ 175.75
Million
Average Premium 28.31%
Without any surprise U.S. is at the heart of deals, while industry wise Telecom has been at the
core of consolidation – both in terms of acquirers and targets, elucidated in the following charts.
Topping the M&A deal table of the 10 largest deals (globally) is the Vodafone – Verizon deal,
with a whopping deal size over $130.1 billion. Another news maker has been the strategic deal
between Microsoft and Nokia, poised to be a game changer for Microsoft. It has been discussed
in greater detail along with other deals in the next section.
The following table is with reference to Oct- ’12 to Sept- ’13 for the top 10.
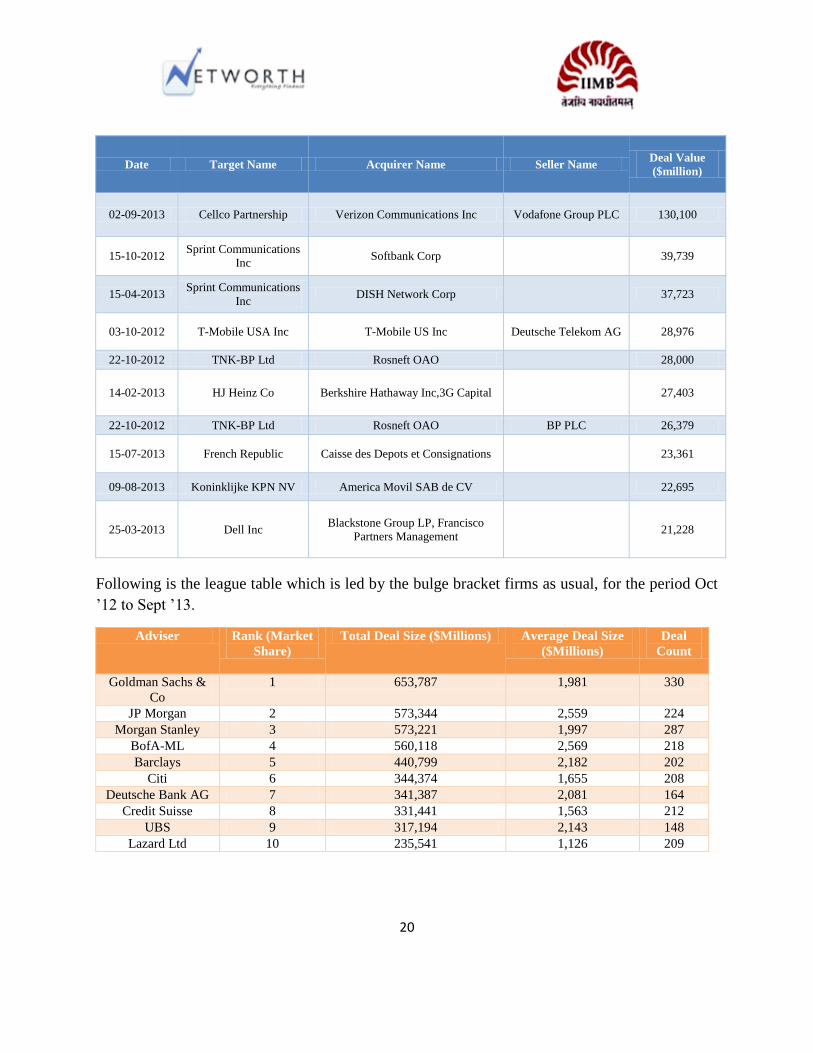
20
Date Target Name Acquirer Name Seller Name Deal Value
($million)
02-09-2013 Cellco Partnership Verizon Communications Inc Vodafone Group PLC 130,100
15-10-2012 Sprint Communications
Inc Softbank Corp
39,739
15-04-2013 Sprint Communications
Inc DISH Network Corp
37,723
03-10-2012 T-Mobile USA Inc T-Mobile US Inc Deutsche Telekom AG 28,976
22-10-2012 TNK-BP Ltd Rosneft OAO
28,000
14-02-2013 HJ Heinz Co Berkshire Hathaway Inc,3G Capital
27,403
22-10-2012 TNK-BP Ltd Rosneft OAO BP PLC 26,379
15-07-2013 French Republic Caisse des Depots et Consignations
23,361
09-08-2013 Koninklijke KPN NV America Movil SAB de CV
22,695
25-03-2013 Dell Inc Blackstone Group LP, Francisco
Partners Management 21,228
Following is the league table which is led by the bulge bracket firms as usual, for the period Oct
’12 to Sept ’13.
Adviser Rank (Market
Share)
Total Deal Size ($Millions) Average Deal Size
($Millions)
Deal
Count
Goldman Sachs &
Co
1 653,787 1,981 330
JP Morgan 2 573,344 2,559 224
Morgan Stanley 3 573,221 1,997 287
BofA-ML 4 560,118 2,569 218
Barclays 5 440,799 2,182 202
Citi 6 344,374 1,655 208
Deutsche Bank AG 7 341,387 2,081 164
Credit Suisse 8 331,441 1,563 212
UBS 9 317,194 2,143 148
Lazard Ltd 10 235,541 1,126 209

21
Microsoft Nokia Deal
In a game-changer, world’s largest software maker by revenues - Microsoft Corporation
announced on 3rd
September, 2013 that they will purchase largely all of Nokia's Devices &
Services business, license its patents, and mapping services.
The transaction terms require Microsoft to pay € 3.79 billion to purchase almost all of Nokia's
Devices & Services business, € 1.65 billion to license Nokia's patents, for a total transaction
price of € 5.44 billion in cash. Funding will be sourced primarily through its cash resources
outside US. Nokia will pay the software giant € 37.9 million if its shareholders do not approve
the deal. Approximately 32,000 people are expected to transfer to Microsoft.
Nokia will retain its patent portfolio and will grant Microsoft a 10-year non-exclusive license to
its patents. Microsoft will grant Nokia rights to use Microsoft patents in its HERE (formerly
Nokia Maps) services. In addition, Nokia will grant Microsoft an option to extend this mutual
patent agreement in perpetuity. As part of the transaction, Nokia is assigning to Microsoft its
long-term patent licensing agreement with Qualcomm, as well as other licensing agreements.
The deal revolves around increased synergies, faster innovation, unified branding and marketing
for Microsoft. Numerous reports have dubbed Steve Ballmer’s attempt to synchronize mobile
hardware and software services as replicating Apple’s. Nokia’s shareholders were expecting it to
make a strategic shift to the leading mobile operating system Android for the past one year.
Analysts’ insights suggest that poor numbers from the exclusive Windows OS strategy initiated
in February 2011 as a major reason for the deal.
Nokia alone constituted more than 90% of Windows phone sales in the first half of 2013.
However Microsoft aims to leverage the success from Lumia range of phones. Lumia phones
Announced Date 03-09-2013
Target Name Nokia (Devices and Services Business)
Acquirer Name Microsoft Corp
Announced Total Value $ 7.2 billion
Acquirer Financial Advisor Goldman Sachs
Target Financial Advisor JP Morgan
Deal Sector Technology

22
accounted for more than 75% of Windows phones across the globe in 2012-13. Lumia handsets
have grown in sales in each of the last three quarters, with sales reaching 7.4 million units in the
second quarter of 2013. Another reason doing the rounds is the close relationship between Nokia
CEO Stephen Elop and Microsoft, with the former being erstwhile head of Business Division in
Microsoft credited for launching Office 2010. In fact, Nokia expects that CEO Stephen Elop and
others would transfer to Microsoft at the anticipated closing of the transaction.
A sneak peek into numbers illustrates that operations planned to be transferred to Microsoft
generated an estimated € 14.9 billion, or almost 50 percent of Nokia's net sales for the full year
2012. Microsoft expects the deal to be accretive to adjusted earnings per share in FY 15.
As part of the deal, Microsoft will procure the Asha brand and will use the licensed Nokia brand
with existing Nokia mobile phone products. Nokia will continue to own and manage the brand.
This provides an opportunity to Microsoft to extend its service offerings to a larger consumer
base across the globe, while letting Nokia's mobile phones to serve as a platform for Windows
OS phones. It will take over Nokia's Mobile Phones division which had sales of 53.7 million
units in Q2 of 2013.
Microsoft will also immediately make available to Nokia € 1.5 billion of financing in the form of
three € 500 million tranches of convertible bonds.
Another important part in the deal is the restriction up to end of 2015 from further licensing the
Nokia brand with respect to mobile devices sales. Furthermore, the restriction is on using the
brand on its own devices as well, which implies Microsoft will call the shots. Fingers are crossed
over the expected synergies for the two companies.
Verizon Vodafone Deal
Announced Date 02-09-2013
Target Name Cellco Partnership (Seller – Vodafone Plc)
Acquirer Name Verizons Communications Inc
Announced Total Value $ 130.1 billion
Acquirer Financial
Advisor
BofA ML/ Barclays/ Guggenheim Partners/ Adviser/ JP Morgan/
Morgan Stanley
Target Financial Advisor Goldman Sachs/ UBS
Deal Sector Communication

23
September 2, 2013 marked a historic day in the world of Mergers & Acquisitions when Verizon
Communications Inc. announced that it will acquire Vodafone's 45 percent ownership in Verizon
Wireless for a whopping $130 billion, making it the 3rd
largest M&A deal ever. The deal size is
worth more than the GDP of more than 70% of the countries on this planet!
It is the largest deal in more than a decade. The previous largest deal was worth $203 billion
when Vodafone acquired Germany’s Mannesmann AG in 2000. M&A advisory league tables
have shaken up globally with six investment banks leading the deal as mentioned in the table.
The transaction is expected to be incremental to the company's EPS by 10 percent approximately
immediately. Verizon also announced an increase in quarterly dividend by 53 cents per share
simultaneously with the deal. This increases Verizon's dividend 6 cents per share, from $2.06 to
$2.12 per share YoY.
The bulk of the proceeds from the deal - 71% - will go to Vodafone shareholders, who could
cash in their Verizon shares to take the entire windfall as cash. The transaction would provide
Verizon with 100 percent ownership in the US after 13 years of partnership with Vodafone.
Chairman and CEO Lowell McAdam claims that as a wholly owned entity, Verizon Wireless
will be able to exploit the continuing progress of consumer demand for wireless, video and
broadband services, and also get the most out of the changing competitive dynamics in the
market. He expects the transaction to close in the first quarter of 2014.
Verizon Wireless’ sheer size can be adjudged from 100.1 million retail connections, largest 4G
LTE network, 73,400 employees and more than 1,900 retail locations in the US, as of the end of
Q2 2013. It was started in 2000 as a joint venture of Verizon and Vodafone. It reported $75.9
billion in operating revenues in 2012, $39.5 billion in the first half of 2013, and an impressive
operating income margin of 28.7 percent in 2012 and 32.6 percent in the first half of 2013, as per
company reports.
The deal break up is as follows: The common stock portion valued at approximately $60.2
billion will be distributed to Vodafone shareholders, with a minimum price of $47 and a
maximum price of $51. The cash portion of $58.9 billion will be funded by a $61 billion bridge
credit agreement with several banks. The bond issue is the largest ever above Apple’s bond issue
of $17 billion. In addition, Verizon will issue $5 billion in notes payable to Vodafone.
Analysts suggest that Verizon was keen towards the deal due to anticipated economic recovery in
US and rising interest rates. Also, Verizon would no longer have to operate its wireless and wire
line business separately, and helps it take decisions much faster. However analysts are worried
about the high price paid at a time when growth is slowing in US wireless industry and smaller

24
rivals are competing aggressively on price. Shareholders have not been enthusiastic after the deal
as reflected by the stock prices.
Vodafone too, has been focused towards reducing debt levels and facilitating acquisitions
particularly in Europe. The deal also involved Verizon giving out its 23% share in Vodafone
Italia for a value of $3.5 billion as part of the consideration. Its stock prices indicate a positive
response from the shareholders.
HUL Unilever Deal
Announced Date 30-04-2013
Target Name Hindustan Unilever Ltd.
Acquirer Name Unilever NV
Announced Total value Rs. 191819.5 million
Acquirer Financial Advisor HSBC Bank Plc
Target Financial Advisor -
Deal Sector Consumer Goods
On April 30, Anglo-Dutch consumer goods giant Unilever Plc will spend $ 5.4 billion (over Rs
29,380 crore) to hike stake in its Indian arm Hindustan Unilever to 75 per cent through an open
offer. Unilever Plc's $ 5.4 billion bid for a 23 per cent stake in Hindustan Unilever is the largest
Asia Pacific cross border inbound merger and acquisition (M&A) deal so far this year and is the
fifth largest India Inbound M&A transaction on record till date.
Unilever will pay Rs 600 a share in an open offer to raise its stake in Hindustan Unilever to 75
per cent from the current 52.48 per cent. Unilever is paying nearly 36 times the unit's forecast
earnings for the year ending March 2014, according to Thomson Reuters data. It trades on a
price/earnings ratio for the next 12 months of 29.5, compared with 19 for Unilever Plc. The offer
of INR 600 per share values the transaction at approximately INR 191.74 billion or €2.49 billion.
Based on the shares tendered which represent 14.78% of HUL, the Unilever Group will increase
its stake from 52.48% to 67.26%. The Anglo-Dutch giant said it planned to lift its share in
Hindustan Unilever India's largest consumer goods maker, known for its Dove and Lipton
brands, to as much as 75 percent from 52 percent at present.
The offer valued Hindustan Unilever at 37 times the subsidiary’s earnings before interest, taxes,
depreciation and amortization. The median multiple for similar deals was 10.8 times EBITDA,
according to data compiled by Bloomberg.

25
The deal, the largest single investment in the Indian consumer goods sector, is a major vote of
confidence in the Indian economy, where growth is at its lowest for a decade.
It fits Unilever's strategy of increasing its presence in fast-growing markets. Emerging markets,
which make up 57 percent of its turnover, have contributed double-digit growth in recent
quarters.
The offer valued HUL at 37 times the subsidiary’s earnings before interest, taxes, depreciation
and amortization (EBITDA). The median multiple for similar deals was 10.8 times EBITDA,
according to data compiled by Bloomberg.
Ambuja Holcim Deal
Date July 24 ,2013
Target Company Ambuja Cements
Sector Cement and Refractories
Acquirer Name Holcim
Announced Total Value INR 11000 Cr
Acquirer Financial adviser Citi Bank, Homburger AG
Target Financial Adviser Axis Capital, Amarchand & Mangaldas
Holcim, the Zurich-based company, through a chain of intra-group transactions involving both
cash and stock swaps, raised its stake in Ambuja from its earlier 50.01% to 61.30% and Ambuja
in turn bought Holcim’s 50.1% stake in ACC. Ambuja Cements issued 58.4 crore shares to
Holcim in the proposed merger swap ratio of 6.6 Ambuja shares for 1 ACC share.
While Ambuja became the flagship enity for Holcim’s India operations with ACC as a
subsidiary, both continue to operate as listed entities with their existing brands and separate go-
to-market strategies.
As on 31 March 2013, the Swiss cement giant had a net financial debt of 10.8 billion Swiss
Francs, or Rs 68,000 crore, on its balance sheet. Last December, the cement maker had
announced restructuring of its European operations. The company had said that the group had
introduced a leaner management structure for Europe to adapt better to the lower level of
construction activity.
Within weeks of it, several global transactions surfaced. For instance, barely a month before
proposing the restructuring of ownership of its Indian operations, Holcim had sold its New

26
Caledonia plant (Holcim Nouvelle Caledonie) to Japanese firm Tokuyama Corporation for an
undisclosed sum.
The deals were valued by BSR and Associates & Price Waterhouse & Co., India (both joint
venture for ACL and HIPL) with Axis Capital Limited providing the fairness option. The tax
advisers were D.B. Desai (for ACL) and KPMG, India (for HIPL/ Holderind Investments
limited)
A lot of bankers involved in the deal argued that this was not a premium deal. However, from the
perspective of Ambuja Cement’s shareholders, the cost of this deal was around Rs 14,600 crore
when the current market cap of ACC was around Rs 23.000 crore. That means that the deal was
at a premium to the current market price and the Indian shareholder was paying a much higher
premium. But from the perspective of a Holcim shareholder, the 9.76-percent stake in Gujarat
Ambuja being valued at Rs 11,000 crore would be cancelled and the net cash and stock that he
received was at the same price at which the 50-percent stake was valued.
Holcim, on its website, put up a statement saying, "Holcim simplifies group structure in India".
But its key man in India, Weijde knows it won't be that simple to explain it to investors.
The deal was quick to invite the wrath of brokerages and investors' associations who called it
"daylight robbery". Some said that this will turn cash-rich Ambuja into a net-debt company;
while concerns were also raised about minority shareholders' interest as using the company's
cash to buy a stake in ACC had restricted their choice. "The cash could have been used
alternatively for a buy-back," said Credit Suisse in a note. "Additionally, Ambuja has committed
to acquiring an additional 10 per cent stake in ACC over 24 months. In our view, this will
convert Ambuja into a net debt company," the note said.
However, Ambuja proved the earlier predictions wrong. Its stocks in September jumped up by
7.9%.
On October 17, 2013, Ambuja Cements closed at Rs 196.20, down Rs 1.65, or 0.83 percent. The
52-week high of the share was Rs 219.50 and the 52-week low was Rs 147.55. The company's
trailing 12-month (TTM) EPS was at Rs 8.60 per share as per the quarter ended June 2013. The
stock's price-to-earnings (P/E) ratio was 22.81. The latest book value of the company is Rs 57.00
per share. At current value, the price-to-book value of the company was 3.44.

27
Jet Etihad Deal
The Jet Airways board agreed to sell a stake to Abu Dhabi's Etihad Airways. This is the first deal
in the Indian aviation space ever since the government last September relaxed ownership rules
and allowed foreign airlines to buy up to a 49 per cent stake in Indian airlines.
The Abu Dhabi-based airlines acquired 24 percent stake in Jet and hence were not required to
make the mandatory open offer for Jet. According to Sebi rules, a buyer acquiring a 25 per cent
stake in a listed company will have to make an open offer to the shareholders of the target
company, and the minimum stake that the acquirer can own after the open offer is 51 per cent.
However, the government of India allows foreign airlines to own only up to a 49 per cent stake
in Indian carriers.
At 754.74 per share, the offer price was a 31.55 per cent premium to Jet's closing price
of Rs. 573.85 on the Bombay Stock Exchange and of Rs. 573 on the National Stock Exchange as
on 24th
April, 2013.
After a lot of fiasco, Etihad Airways won Indian government backing to invest in Jet Airways
(India) Ltd. (JETIN), paving the way for the first share sale by a carrier in the Asian country to a
foreign airline since restrictions were eased.
The approval will result in foreign investment of 20.6 billion rupees ($332 million), the
government said.
‘The deal is important to Jet, which is facing significant financial challenges. The deal will also
help the Indian civil aviation industry by enhancing capacity, increasing competition and
bringing down airfares," said Amber Dubey, partner and head aerospace and defence at global
consultancy firm KPMG.
Date April, 2013
Target Company Jet Airways
Sector Aviation
Acquirer Name Etihad
Announced Total Value USD 150.00 Million
Acquirer Financial
adviser
PWC, HSBC, Amarchand & Mangaldas
Target Financial Adviser Ernst & Young, Credit Suisse, Merrill Lynch, Economic Laws Practice,
Gagrats & Co.

28
"The step will instill confidence in the airlines industry in India. It particularly benefits both the
partners and in general improves the prevailing investment climate in the country," said Rajiv
Chib, associate director, PricewaterhouseCoopers.
As the Jet-Etihad hub will be located in Abu Dhabi, passengers will have access to a number of
new routes to cities on Africa, the USA and Europe. With Jet Airways getting access to low cost
fuel, flying could become cheaper.
However, the deal also has some drawbacks as the investment will not come for free. Most of the
new airlines will look to take a large chunk of traffic from India and domestic airlines will lose
out. Air India will be adversely impacted as their key market remains the West Asia while Indian
airports in Delhi run by GMR and Mumbai by GVK will have to wait longer to realise their
dream of turning it into hubs for south-east Asia. The intense competition could also damage
some of the Indian operators as Aviation Turbine Fuel.
Apollo Tyres – Cooper Tire Deal
Announced Date 12-06-2013
Target Name Cooper Tire & Rubber Co
Acquirer Name Apollo Tyres Ltd
Announced Total value Rs. 135424.4 million
Acquirer Financial Advisor BofA ML/Ernst & Young/Morgan Stanley
Target Financial Advisor Credit Suisse/UBS
Deal Sector Energy Sector
The offer price of $35 per share in cash represents a 40% premium to the 30-day volume-
weighted average price. Target will be delisted post transaction.
Morgan Stanley and Deutsche Bank Securities served as financial advisors and Greater Pacific
Capital acted as strategic and financial advisor to acquirer. Sullivan & Cromwell and Amarchand
& Mangaldas served as legal advisors to acquirer. Standard Chartered is the sole provider of
transaction financing at the acquirer and is also the structuring advisor. Morgan Stanley Senior
Funding, Inc., Deutsche Bank Securities Inc., Standard Chartered and Goldman Sachs Bank
USA are joint lead arrangers providing committed funding to acquirer s acquisition subsidiary.
BofA Merrill Lynch served as financial advisor and Jones Day served as legal advisor to target.
There are three major issues in this entire deal. Firstly, the stock markets have learnt that big
deals rarely yield big returns. Evidence suggests that 3 out of 4 M&A deals fail. Hence, the
assault on the shares of Apollo Tyres. Secondly, the premium of 40% over the market price is
not justified as in the case of Cooper Tire, the stock even after the recent surge trades at a P/E

29
multiple of 8 times compared to its peers across various geographies (Goodyear, Pirelli,
Bridgestone) all which trade at 12 times and above. Thirdly, there was apprehension regarding
the structure of payment. The entire amount would be paid through debt pushing the debt/equity
ratio to 1.35 times from 0.53 times. The debt will be for a 7-8 period having an interest of 10
percent per annum. This implies that interest expense for the company after tax will be around
USD 175 m.
The big question was: How can one justify a leveraged buyout where the target generates nearly
double the revenues of the acquirer?
Apollo had justified the acquisition on the three following grounds: 1) Cooper's strong financials,
which reported an EBITDA of USD 526 million in 2012. 2) A foothold in Asia where Cooper's
revenues in 2012 stood at USD 1.3 billion apart from access to the Chinese market through two
manufacturing facilities. 3) The strategic brand fit of Cooper in Apollo's portfolio which also
owns premium tyre brand Vredestein.
However, in the last four months the situation has changed drastically. A few backs Cooper
reportedly lowered its EBITDA guidance for 2013 to just USD 257 million, which the lowest in
the last four years.
Last week, Apollo's demand for a price reduction in the deal, citing problems related to the US
firm's operations in China and concessions to the union, was rejected by Cooper. According to
Cooper, Apollo wanted a price renegotiation "far greater than the USD 2.5 reduction it had
earlier proposed, and at one point referencing 'USD 8 or USD 9' per share. The disagreement
over price came to light after Cooper on Friday filed a complaint in a U.S. court to force Apollo
to close the acquisition "expeditiously. In response, Apollo Tyres has asked a US court to declare
that conditions precedent to closing the USD 2.5 billion mergers with Cooper Tire & Rubber
Company have not been satisfied.
The two companies have until the end of the year to resolve their pricing dispute and close the
transaction, to be funded entirely through debt. If completed, the deal would turn the Indian
company into the world's seventh-largest tire maker and give it access to the U.S. and China
markets. It would also represent the second-largest U.S. acquisition by an Indian company.
Cooper shares closed down 13 percent at $25.72 on the New York Stock Exchange on Monday,
just $1 above its trading levels prior to the deal announcement in June. On October 18, 2013, at
12:31 hrs Apollo Tyres was quoting at Rs 67.30, up Rs 0.40, or 0.60 percent. The 52-week high
of the share was Rs 101.50 and the 52-week low was Rs 54.60.

30
Markets at a glance
June 2013
The Benchmark indices ended negatively for the month of June 2013. While BSE Sensex fell by
1.8%, Nifty lost by 2.4%. Continuing worries over capital outflows coupled with fresh weakness
in the rupee cast a shadow on stock markets. Depreciation of rupee value against the dollar
continued to weigh on the market sentiments.
Average daily volumes on BSE during the month of June 2013 fell 18.05% M-o-M (NSE daily
average volumes were lower by 2.15% M-o-M). The average daily derivatives volumes on NSE
rose 4.7% to Rs. 1,59,544 Cr in June.
All sectoral indices ended in the negative (except IT, Oil & Gas, and Technology) in the month
of June. The top four losers for the month were Consumer Durable, Realty, Metal and Power,
which fell by 20.28%, 10.32%, 8.81%, and 7.55% respectively. IT, Oil & Gas, and Tech, the
only gainers, rose by 3.13%, 2.84% and 2.12% respectively.
The government increased duty on gold from 6% to 8% to curb its import. This was the second
time in six months that the duty was raised. The Reserve Bank extended the restrictions on gold
import to other agencies in addition to banks, to keep a check on burgeoning current account
deficit.
Consumer Durable Index fell making it the largest loser in the month across the board. Gitanjali
Gems, Titan Industries, PC Jewellers and VIP Industries were the top losers, falling 59.2%,
23.6%, 18.3% and 10.3% respectively. Index ended the Month on a negative note amid looming
fear that the falling local currency may further lead to overseas investors paring positions in
Indian equities. Gitanjali Gems Ltd slipped, as sharp fall in gold prices and the Reserve Bank of
India's (RBI) measures to curb gold sales turned the investment sentiment bearish. Continued
depreciation of rupee was another factor weighted on gems and jewellery stocks as sustained
depreciation in currency against the dollar may dampen the growth of the sector.
Index rose on a recent steep slide in rupee against the dollar. A weak rupee boosts revenue of IT
firms in rupee terms as the sector derives a lion's share of revenue from exports. Stocks rose on
positive economic data in the US, the biggest outsourcing market for the Indian IT firms. Satyam
Computer, Tech Mahindra, Hexaware Tech and Wipro were the top gainers, gaining 10.7%,
9.6%, 7.7% and 7.1% respectively.
West Texas Intermediate (WTI) crude traded near the highest price in more than four months on
renewed speculation that unrest in Syria will spread to other parts of the Middle East and disrupt

31
supplies. Oil prices surged helped by a rise in Middle East worries, after Washington said it
would provide military support to Syria’s rebels and Iran went to the polls to elect a new
president.
Rupee plunging to record level and a sharp fall in the equity market are knee-jerk investor
reactions to the US Federal Reserve's saying the it will slow down bond-buying programme in
view of improving American economy. Signs of improvement in the U.S economy and
speculation that the Federal Reserve might begin scaling down its asset-purchase program sooner
rather than later have pushed the dollar index up. The Rupee continued to reel under pressure and
logged an all-time low on weak economic fundamentals, costlier imports, inflation risks rise and
record high current account deficit (CAD). Selling by FIIs from India's bond market has put
pressure on the rupee.
July 2013
The Benchmark indices ended negatively for the month of July 2013. BSE Sensex fell by 0.3%.
Nifty fell 1.7 percent for the month, marking its second consecutive monthly fall, after the
Reserve Bank of India's measures to raise short-term interest rates to defend the rupee have
raised worries about the economic costs. The Nifty edged down to its lowest close in a month, as
lenders extended recent declines on uncertainty about how long the Reserve Bank of India (RBI)
will maintain its measures to defend the rupee by raising short-term interest rates.
The Reserve Bank of India (RBI) in its monetary policy review meet left interest rates
unchanged as it sought to support a battered rupee but said it will roll back recent liquidity
tightening measures when stability returns to the currency market, enabling it to resume
supporting growth. Indian rupee gained modestly as the government eased rules for foreign
investment, adding to measures taken by the central bank to suck out rupee liquidity.
India's trade deficit narrowed in June to $12.24 bn from a 7-month high, helped by a slowdown
in gold imports, which should ease pressure on the current account balance and the beleaguered
rupee. Government released Consumer Price Index (CPI) inflation data which showed that the
June CPI food inflation was 11.84%, CPI Inflation at 9.87% vs 9.31% (M-o-M), The WPI
inflation for the month of June came in better than expected at 4.86%. Core inflation came in at
2%.
Average daily volumes on BSE during the month of July 2013 rose 17.9% M-o-M (NSE daily
average volumes were higher by 1.8% M-o-M). The average daily derivatives volumes on NSE
fell 13.9% to Rs. 1,37,411 cr in July.

32
All sectoral indices ended in the negative (except IT, Teck, FMCG, Healthcare and Consumer
Durable) in the month of July. The top four losers for the month were Bankex, Realty, PSU and
Metal, which fell by 13.70%, 12.84%, 11.57%, and 11.24% respectively. IT, Teck, FMCG,
Healthcare and Consumer Durable, the only gainers, rose by 19.23%, 16.75%, 5.17%, 2.59 and
2.08% respectively.
Public sector banks (PSBs) have declined on fears of growing non-performing assets (NPAs) in
sectors like chemicals, pharmaceuticals, infra, steel and textiles, as well as the specter of a rising
wage bill. The RBI lowered the overall limit for borrowing under the daily liquidity adjustment
facility (LAF) -- which offers funds in exchange for collateral - for each bank to 0.5% of deposits
from 1%. Banks have been under pressure in the month of July, largely weighed down by the
RBI's action to shore up the currency and pressure on asset quality on most of the PSU banks.
Yes Bank, Union Bank, Canara Bank and Axis Bank were the top losers, falling 29.7%, 28.6%,
24.0% and 21.9% respectively.
IT sector index surged to a record, led by gains in shares of Tata Consultancy Services Ltd
(TCS), which also tested a new high on Friday after beating earnings estimates. TCS posted a
15.5% rise in consolidated net profit as volume surged to its fastest growth in seven quarters
backed by growth in the US. Also, Mindtree Ltd’s June quarter profit jumped by nearly 50%,
beating market expectations, driven mainly by higher spending by clients and forex gains.
Hexaware Technology, Wipro, HCL Technologies and TCS were the top gainers, rising 34.1%,
25.5%, 20.8% and 19.6% respectively.
Oil prices jumped boosted by concerns over rising tensions in Egypt and better-than-expected
U.S. economic data. News of protests near the Suez Canal added to the alarm for oil traders. U.S.
crude oil prices extended their string of 14-month highs.
August 2013
The Benchmark indices ended negatively for the month of August 2013. BSE Sensex fell by
3.8%. Nifty fell 4.7% for the month, weighed by a host of factors, including weakness in the
currency, possible tapering of US Fed's bond-buying program and threats of ratings downgrade.
In August, India’s financial markets remained under severe stress as the rupee lost around 9%,
deepening fears about the country’s fiscal condition.
In the first week of August, benchmark indices fell by 2.8%. This was triggered on concerns that
US monetary policy would soon become less accommodative, after two Fed Reserve officials on
Tuesday, 6 August 2013, said a reduction in Fed's asset purchases is likely later this year. In July,
the services sector, the largest in the Indian economy, contracted for the first time since October

33
2011. On the positive side, the Finance Ministry agreed to give Rs. 8,000 crore cash subsidy to
fuel retailers IOC, BPCL and HPCL to make up for less than a third of losses they incur on
selling diesel and cooking fuel below cost. FDI into India increased by 24.2% Y-o-Y to $3.95 bn
in April-May. According to data from the Department of Industrial Policy and Promotion
(DIPP), the country had received $3.18 bn of FDI in April-May 2012.
In the second week of August, indices fell by 1%. India's inflation accelerated sharply to close to
6% in July as a weak rupee pushed up import costs. The WPI, India's closest-watched cost-of-
living gauge, rose to 5.79% from a year earlier, up nearly 1% from 4.86% the previous month.
India reported a second straight contraction in industrial production in June, underscoring the
challenge for policymakers to stabilize the battered rupee without hurting economic revival. IIP
contracted 2.2% in June after falling 1.6% in May. Manufacturing contracted by 2.2% against
2% in the previous month, while mining sector recorded de-growth of -4.1% against -5.7% in the
previous month.
In the third week of August, indices stayed flat (-0.4%). Moody's Investors Service said that the
credit quality of state- owned oil marketing and upstream oil companies in India will likely
weaken for the rest of FY14 (April 2013-March 2014), if the government continues to ask them,
as it did in April-June, to share a higher burden of the country's fuel subsidies. Global financial
firm JP Morgan, in its latest report, downgraded India to neutral. As per Adrian Mowat of JP
Morgan, the report said that high CAD will be further exacerbated if the Rupee continues to
slide. On the positive side The RBI said that it would purchase Rs. 8,000 crore worth of bonds
via open market operations. It has allowed banks to shift a part of their AFS portfolio to HTM.
The measures will restrict a sharp rise in long-term yields and reduce MTM losses on banks'
investment portfolios.
Indices stayed flat for a second week running. India's first quarter for FY14 surprised on the
downside, as it recorded a growth of 4.35% annualized rate (lowest since Q4 FY09), lower than
Bloomberg consensus estimate of 4.7%. While the GDP number got a boost from the expected
uptick in the agriculture sector (a growth of 2.72%), manufacturing contracted quite sharply by
1.19%. The market managed to wipe off sharp losses during the week, tracking a rebound in the
rupee and a slide in oil prices. India's central bank stated that they would provide US dollars
directly to state oil companies in its latest attempt to shore up a currency that has slumped to a
record low, reflecting the stiff economic challenges facing the country in an uncertain global
environment.
All sectoral indices ended in the negative (except Metal, IT and Tech) in the month of August.
The top four losers for the month were Capital goods, Realty, Consumer goods and Bankex,

34
which fell by 13.88%, 10.88%, 10.33%, and 9.93% respectively. Metal, IT and Tech, the only
gainers, rose by 13.11%, 7.63% and 3.89% respectively. The world markets ended the month of
August 2013 on a negative note except Bovespa and Shanghai. Indonesia, Singapore, Dow
Jones, FTSE, DAX, Nikkei and Nasdaq were the losers, falling 9.0%, 6.0%, 4.4%, 3.1%, 2.1%,
2.1% & 1.0% respectively. Average daily volumes on BSE during the month of August 2013 fell
5.4% M-o-M (NSE daily average volumes increased by 15.2% M-o-M). The average daily
derivatives volumes on NSE rose 39% to Rs. 190,696 cr in August.
Gold rose by 6.33% in August as the dollar fell on lingering uncertainty about the scope and
timing of the Federal Reserve's eventual tapering of its bond-buying program and after the
Chinese government posted strong data on factory output during July. Prices posted hefty gains
on reports that physical demand is picking up, while uncertainty over the fate of monetary
stimulus programs in the U.S. bolstered the precious metal's safe haven appeal.
September
Benchmark indices broadly followed an upward trend during September, opening the month at
18886.13 and closing at 19379.77. In the first two weeks of the month, a slew of positive events
bolstered investor confidence and helped markets recover. Markets climbed steeply after Dr
Raghuram Rajan took over as the Governor of the RBI on September 5, and announced the
setting up of several committees to look into key financial sector reforms. Robust trade and IIP
data further bolstered the markets. Data released during September showed that India's trade
deficit narrowed to a five-month low in August, while industrial production unexpectedly
rebounded in July. After shrinking for three months, industrial output rose by 2.6 per cent in July
from a year earlier. Growth was aided by an upturn in capital goods production. Markets slid
steadily in the last two weeks of the month due to disappointing data on domestic inflation, an
interest rate hike by the RBI to counter rising inflation and signs of a weaker recovery in the US
- as the US Federal Reserve postponed the tapering of its quantitative easing (QE3) programme
due to growth and unemployment concerns.
The first week of September, markets ended high by 650 points to conclude at a 3-week high of
19,270.06 on sustained buying mainly in banking, PSU and refinery sectors. It was primarily due
to various plans announced by the new Reserve Bank Governor Raghuram Rajan to bolster the
financial industry. Renewed buying by foreign institutional investors also boosted sentiment. The
Reserve Bank's move to allow a special window to swap foreign currency non-resident (FCNR)
dollar funds for boosting foreign fund inflows was likely to fetch around $10 billion. Relaxing
the recent curbs on the outward investments, Reserve Bank allowed companies to invest up to
400% of its net worth provided it has raised the funds through external commercial borrowings
(ECBs). On the negative side, India’s manufacturing activity slowed down to its weakest pace in

35
four-and-a-half years in August, confirming fears that it may take longer- than-expected to scale
the slowdown hump in Asia’s third-largest economy, as GDP growth crashed to a four-year low
of 4.4% in April- June.
In the second week, the market surged in a truncated trading week on recent sharp recovery of
the rupee against the dollar and on receding geopolitical risks in Syria. The S&P BSE Sensex
rose 462.70 points or 2.4% to 19,732.76. The 50-unit CNX Nifty gained 170.20 points or 2.99%
to 5,850.60. India's trade deficit narrowed to a five-month low in August as slowing gold
demand helped cool imports, while the government's efforts to encourage exporters tap newer
markets drove merchandise exports higher. The deficit narrowed to $10.9 billion from $14.17
billion a year earlier. ndia's slowing economy and its massive current account and fiscal deficits
are not structural problems and can be fixed with modest reforms, according to newly appointed
central bank Governor Raghuram Rajan. ndustrial output rose 2.6% in July from a year earlier,
its first expansion in three months, lifted by a robust rebound in capital goods production. Prime
Minister's Economic Advisory Council (PMAEC) has pegged India's Gross Domestic Product
(GDP) growth at 5.3% for the current financial year. This is way down from their earlier
estimates of 6.4% but higher than sub-5% growth projected by various brokerage firms and
independent economists. The annual consumer price inflation eased marginally in August to
9.52% from 9.64% in July.
The third week of September was a week of surprises. Indian Market began the week on a tepid
note as investors remained on the sidelines, wary of FOMC and RBI decisions on quantitative
tapering and monetary policies respectively. Market went on a binging spree on FII liquidity on
as Fed's decision to delay its taper boosted the sentiment that cheap global liquidity will now
towards the emerging markets such as India. However, Indian inflation unexpectedly accelerated
to a six-month high in August as the rupee’s slide stoked import costs leading the RBI to hike the
repo rates by 25bps to 7.5%. The wholesale-price index rose 6.1 percent from a year earlier,
compared with July’s 5.79 percent climb. For the week ended September 20, Sensex gained 531
points or 2.7% to end at 20,264 and the 50-share Nifty gained 162 points or 2.8% to close at
6,012.
In the week ended September 27, BSE Sensex ended down 536 points or 2.7% to end at 19,727
and Nifty ended down 179 points or 3% to close at 5,833, on worries that the central bank may
avoid rate cuts for now after it flagged concerns over high inflation. Positive job data from the
US signaled improvement in the world's largest economy and fueled investor fears on possible
tapering. The rally in emerging markets including India lately was on account of ample liquidity
following the US Federal Reserve's bond-buying program.
36
With the exception of IT, Tech and Realty, all other sectoral indices recorded impressive gains
during the month. Sectors like Capital Goods and Power rose 8.8% and 9.8% respectively on
account of the strong rally in BHEL among others. BSE IT and BSE Teckh cooled off after 4
months of strong gains while BSE PSU index recovered a handsome 9.1% after 4 months of
sharp losses. BSE Oil & Gas and Consumer Durables proved to be laggards during the month
clocking in gains worth 0.8% and 2.8% respectively.