fina 5331 lecture 1: why study international finance? · lecture 1: why study international...
TRANSCRIPT
International FinanceFINA 5331
Lecture 1: Why study
International Finance?
William J. Crowder Ph.D.
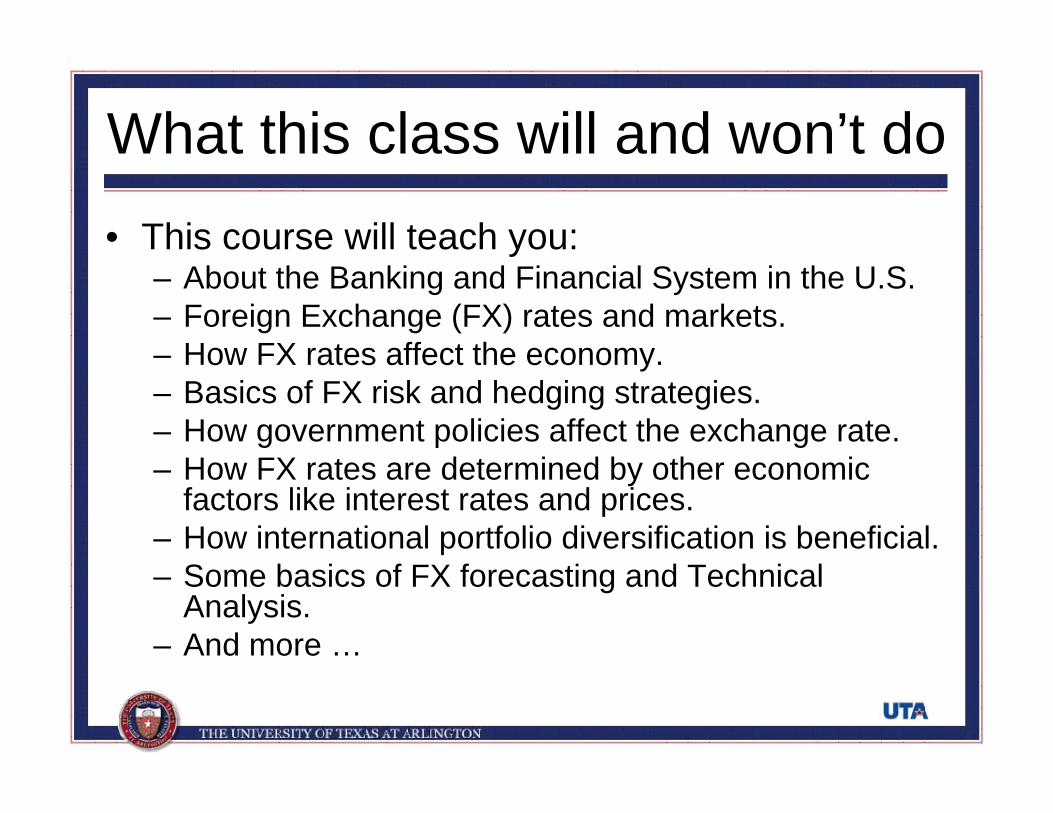
What this class will and won’t do• This course will teach you:
– About the Banking and Financial System in the U.S.– Foreign Exchange (FX) rates and markets.– How FX rates affect the economy.– Basics of FX risk and hedging strategies.– How government policies affect the exchange rate.– How FX rates are determined by other economic
factors like interest rates and prices.– How international portfolio diversification is beneficial.– Some basics of FX forecasting and Technical
Analysis.– And more …

What this class will and won’t do
• This course will not teach you:– How to make money by speculating in the
Foreign Exchange (FX) market.– How FX rates affect the your specific business
or company.
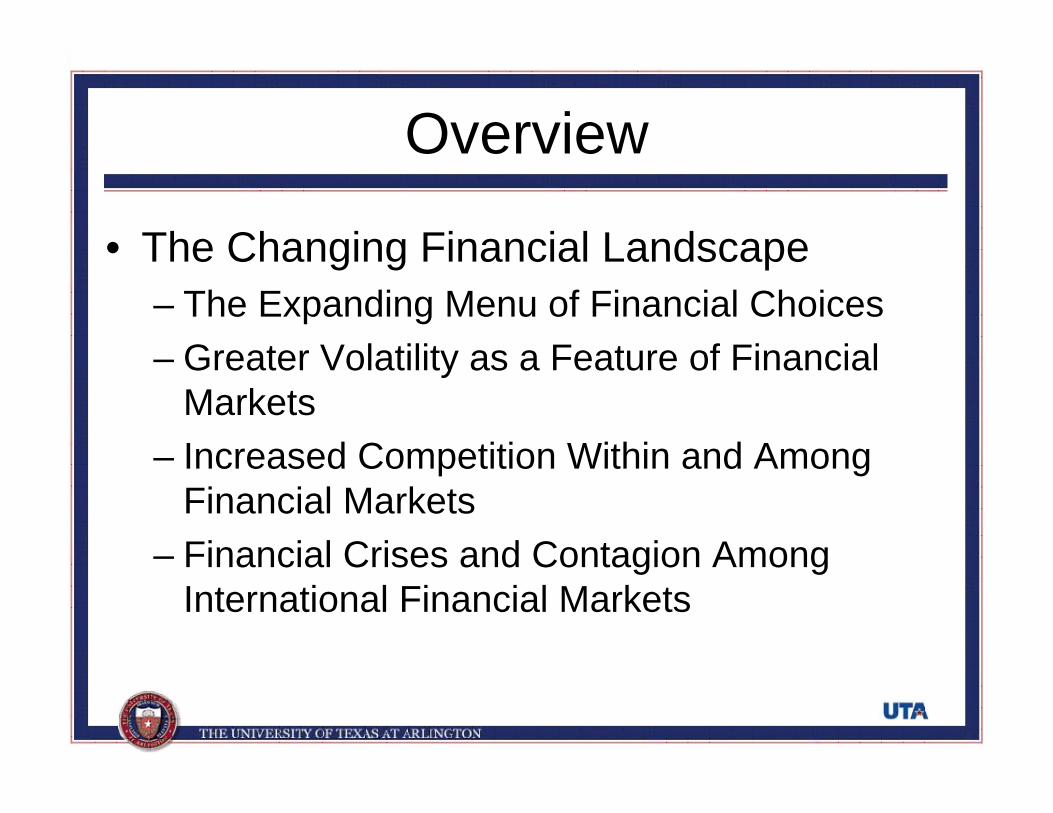
Overview
• The Changing Financial Landscape– The Expanding Menu of Financial Choices– Greater Volatility as a Feature of Financial
Markets– Increased Competition Within and Among
Financial Markets– Financial Crises and Contagion Among
International Financial Markets
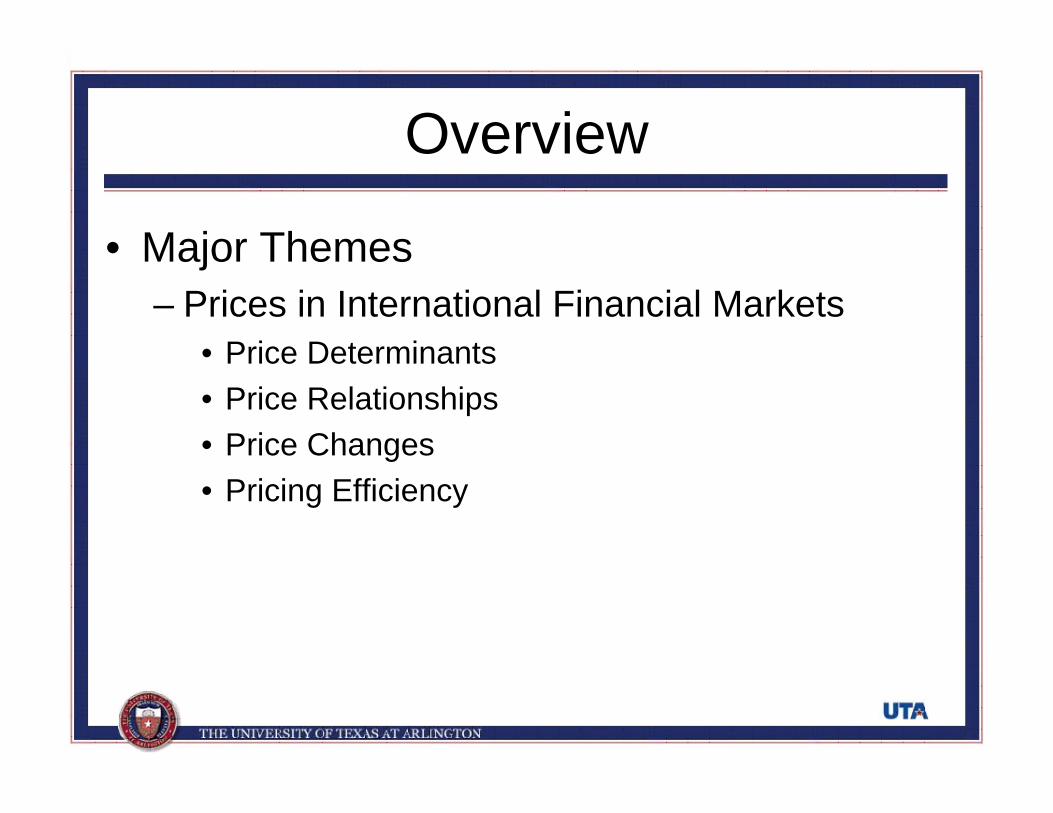
Overview
• Major Themes– Prices in International Financial Markets
• Price Determinants• Price Relationships• Price Changes• Pricing Efficiency

Overview
– Policy Issues in International Financial Markets
• Policy Issues for Individuals and Private Enterprises in International Financial Markets
• Policy Issues for Public Policymakers in International Financial Markets
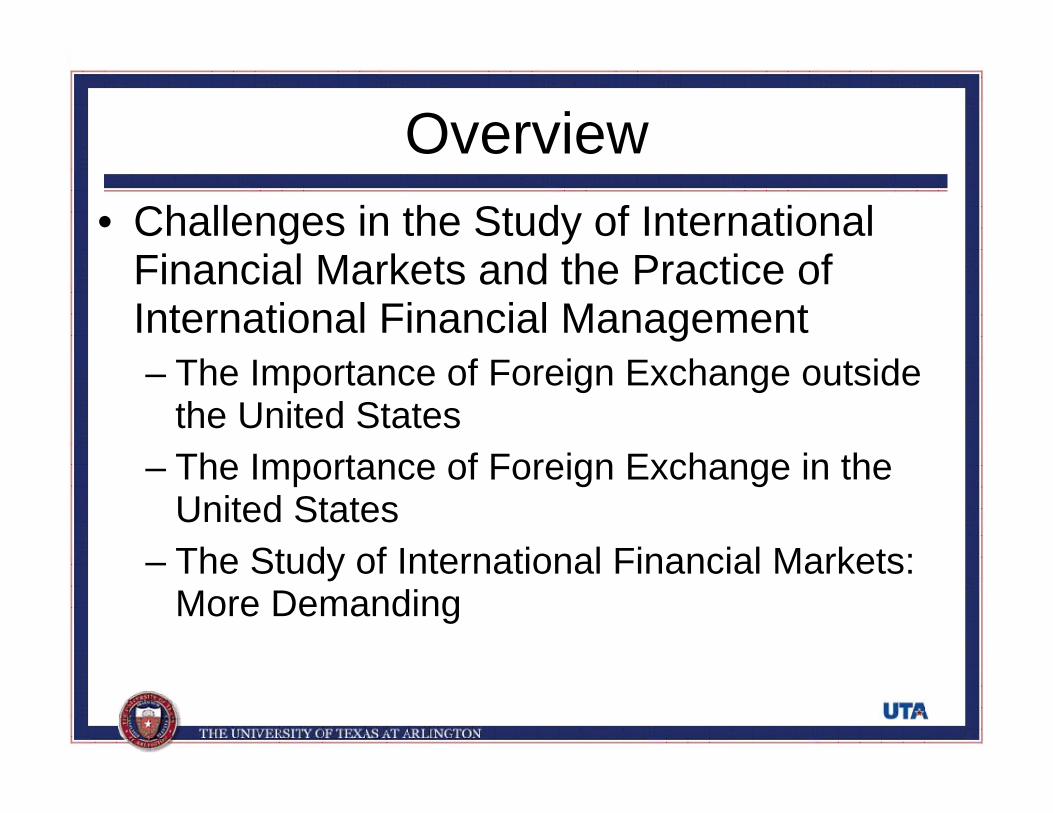
Overview• Challenges in the Study of International
Financial Markets and the Practice of International Financial Management– The Importance of Foreign Exchange outside
the United States– The Importance of Foreign Exchange in the
United States– The Study of International Financial Markets:
More Demanding
Overview
• A Road Map– Summary of Major Topics– Typical Chapter Outline
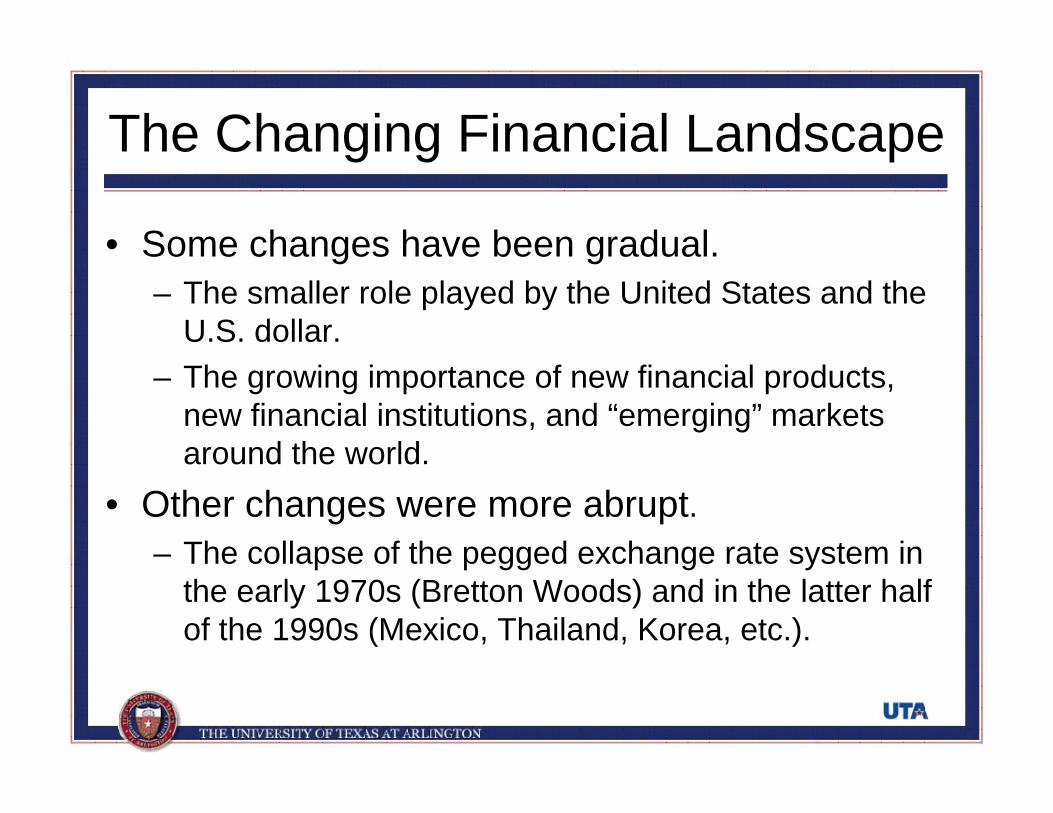
The Changing Financial Landscape
• Some changes have been gradual.– The smaller role played by the United States and the
U.S. dollar.– The growing importance of new financial products,
new financial institutions, and “emerging” markets around the world.
• Other changes were more abrupt.– The collapse of the pegged exchange rate system in
the early 1970s (Bretton Woods) and in the latter half of the 1990s (Mexico, Thailand, Korea, etc.).

The Changing Financial Landscape
• The menu of financial choices is expanding.– Financial engineering: Corporate issuers and private
investors have at their disposal innumerable futures and option contracts to acquire or lay off risks associated with economy-wide shocks or with firm-specific events.
• Financial markets have greater volatility now.– Large price swings over the past three decades led to
increased demands for financial forecasting, as well as a greater emphasis on risk management.
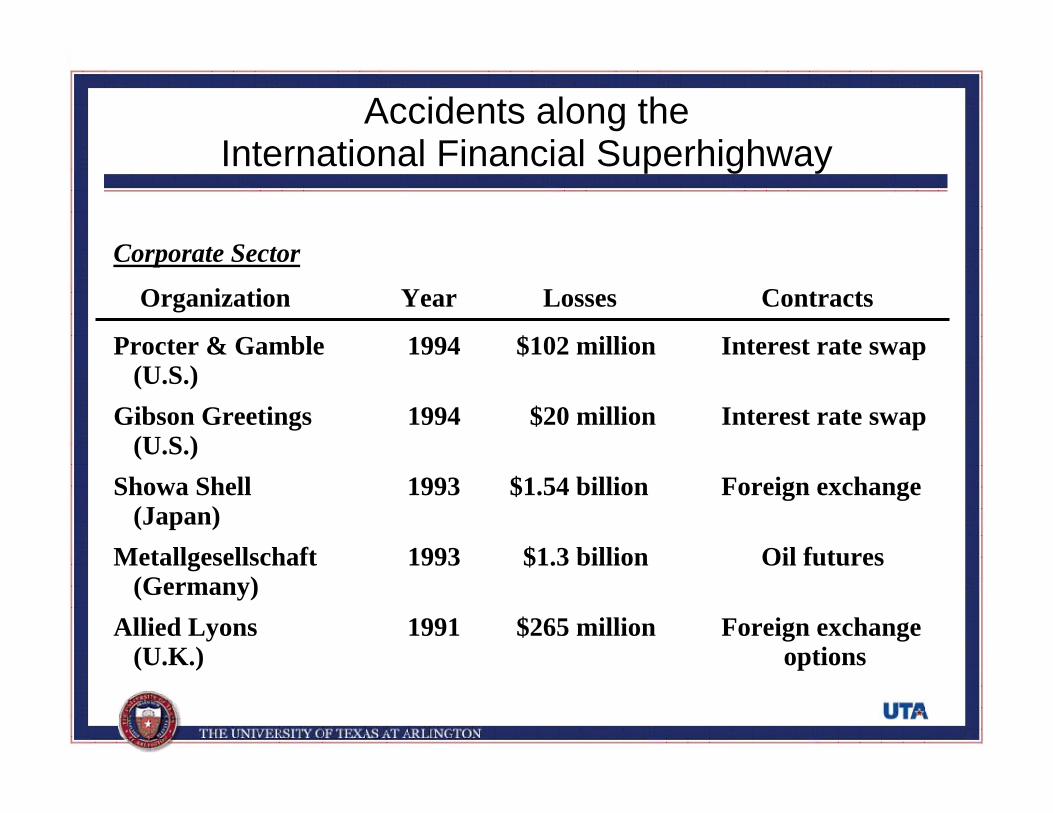
Accidents along the International Financial Superhighway
Corporate Sector
Organization Year Losses Contracts
Procter & Gamble 1994 $102 million Interest rate swap(U.S.)
Gibson Greetings 1994 $20 million Interest rate swap(U.S.)
Showa Shell 1993 $1.54 billion Foreign exchange(Japan)
Metallgesellschaft 1993 $1.3 billion Oil futures(Germany)
Allied Lyons 1991 $265 million Foreign exchange (U.K.) options
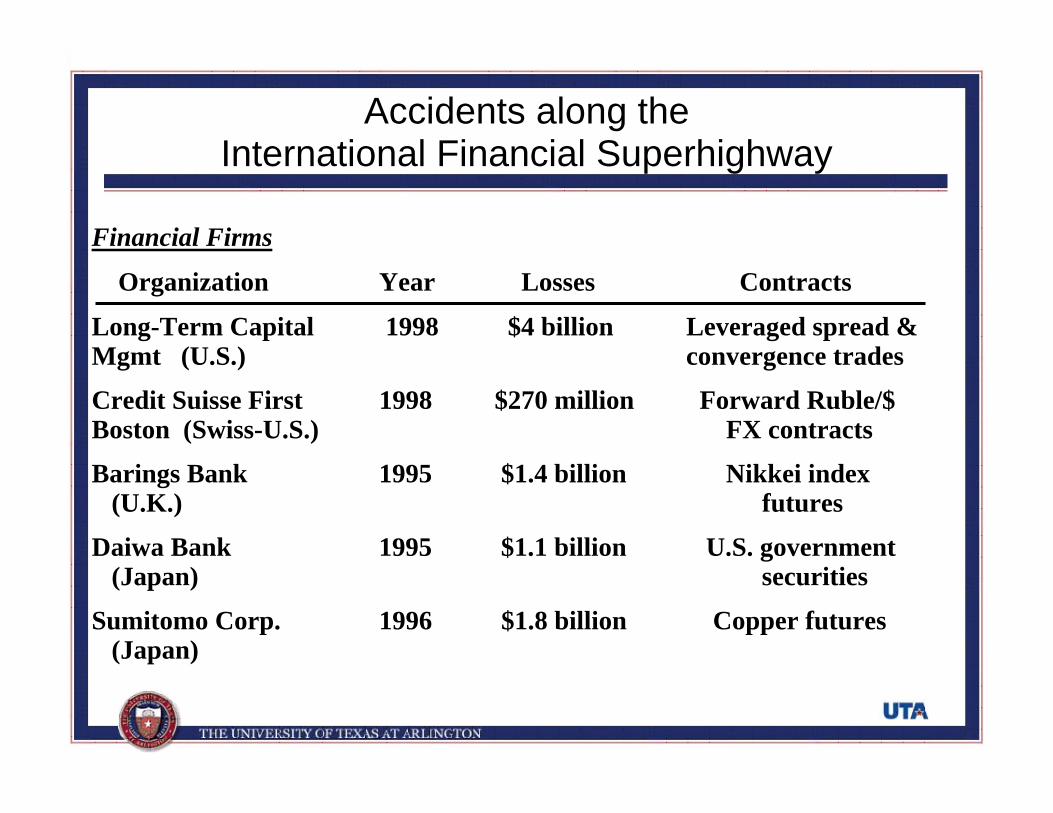
Financial Firms
Organization Year Losses Contracts
Long-Term Capital 1998 $4 billion Leveraged spread &Mgmt (U.S.) convergence trades
Credit Suisse First 1998 $270 million Forward Ruble/$Boston (Swiss-U.S.) FX contracts
Barings Bank 1995 $1.4 billion Nikkei index(U.K.) futures
Daiwa Bank 1995 $1.1 billion U.S. government(Japan) securities
Sumitomo Corp. 1996 $1.8 billion Copper futures(Japan)
Accidents along the International Financial Superhighway
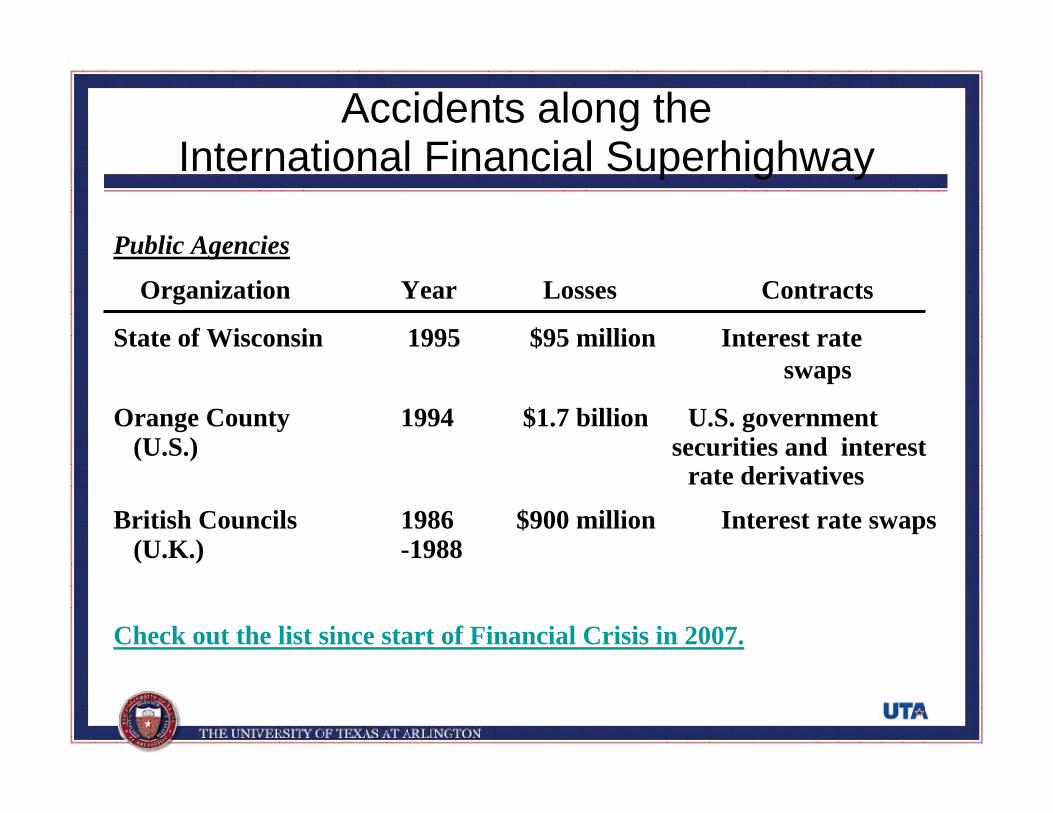
Public Agencies
Organization Year Losses Contracts
State of Wisconsin 1995 $95 million Interest rate swaps
Orange County 1994 $1.7 billion U.S. government(U.S.) securities and interest
rate derivatives
British Councils 1986 $900 million Interest rate swaps(U.K.) -1988
Check out the list since start of Financial Crisis in 2007.
Accidents along the International Financial Superhighway
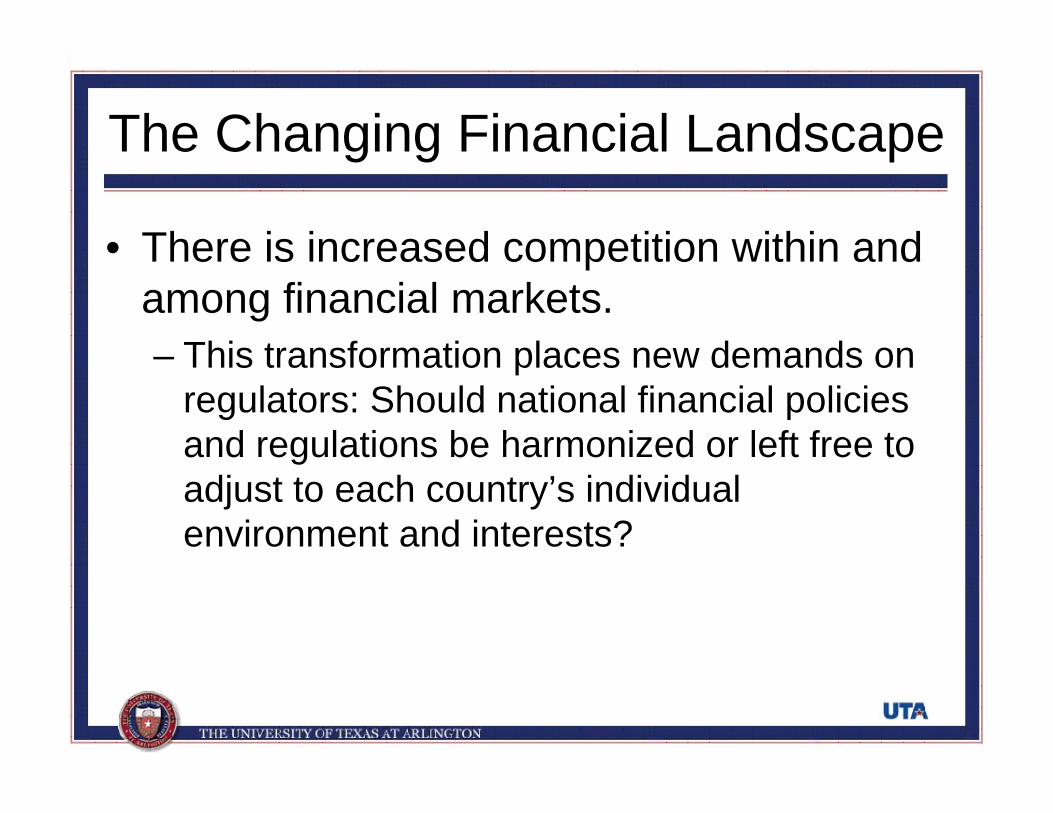
The Changing Financial Landscape
• There is increased competition within and among financial markets.– This transformation places new demands on
regulators: Should national financial policies and regulations be harmonized or left free to adjust to each country’s individual environment and interests?
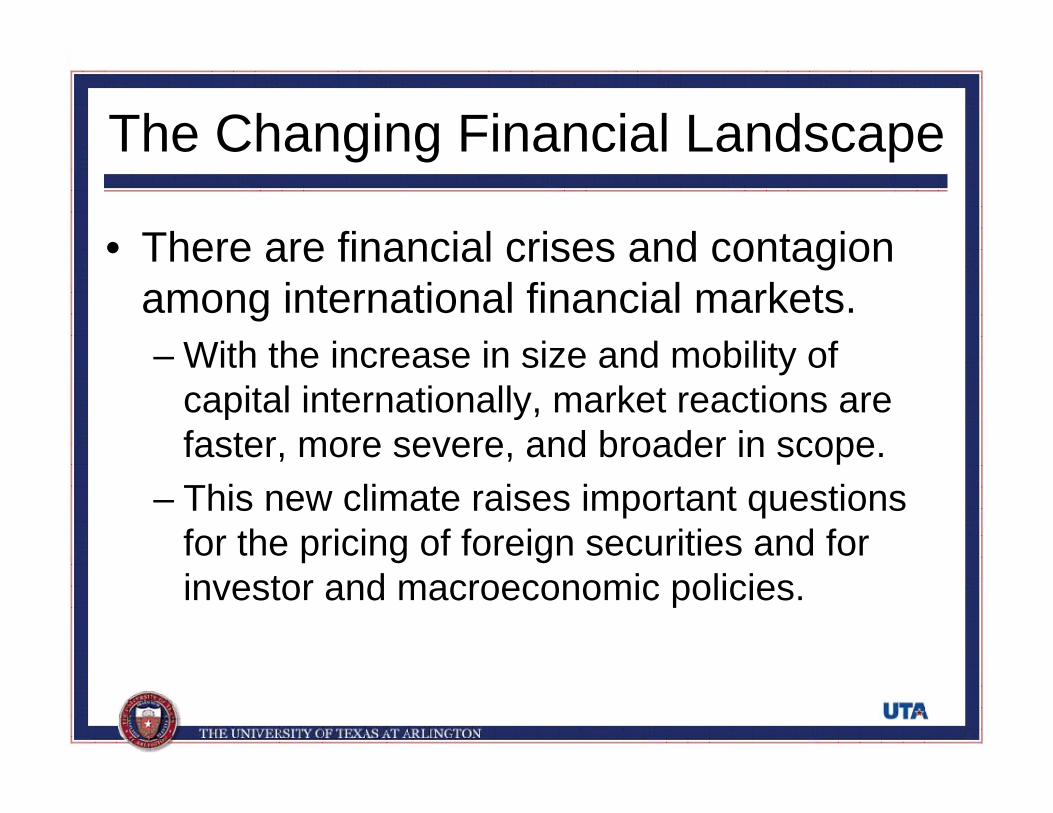
The Changing Financial Landscape
• There are financial crises and contagion among international financial markets.– With the increase in size and mobility of
capital internationally, market reactions are faster, more severe, and broader in scope.
– This new climate raises important questions for the pricing of foreign securities and for investor and macroeconomic policies.
Major Themes• Objective: To analyze the key segments of
the international financial markets with an emphasis on prices and policies.
• A focus on prices includes several distinct areas:– The determinants of prices.– The relationship among various market prices.– The pattern and distribution of price changes over time.– The efficiency of markets where prices are determined.
Major Themes• Policy implications are considered
separately for two broad groups:– Private individuals and managers of private
enterprises, for whom their own self-interest or value maximization are the decision criteria.
– Public policymakers, for whom broader measures of welfare maximization are typically invoked for decision making.

Challenges in the Study of International Financial Markets & thePractice of International Financial Management
• Outside the United States, the foreign exchange rate is usually considered as “the most important price” for the economy.– Most imports and exports of primary commodities are
priced in US$.– Foreign investors are attracted to U.S. financial
instruments for their depth and liquidity.– The international reserves of foreign central banks
are comprised mostly of US$.
Challenges in the Study of International Financial Markets & the Practice of International Financial Management
• The collapse of the pegged exchange rate system in 1973 set the stage for a change in how we view the foreign exchange rate.– Consumers are now more reliant on open trading
relations with the rest of the world.– International investors and borrowers have gradually
diversified their portfolios internationally too.– The U.S. depends heavily on foreign investors to
purchase U.S. government debt, keep bond prices high, and the interest rate on government debt low.
Challenges in the Study of International Financial Markets & the Practice of International Financial Management
• The study of international financial markets has become more demanding since the collapse of the pegged exchange rate system.– The historical data series are longer and exhibit
greater volatility.– Innovation has resulted in more procedures, markets,
and regulations to follow.– The creativity and research by financial economists
have also given us more realistic theoretical models and relevant empirical evidence to interpret.

Challenges in the Study of International Financial Markets & the Practice of International Financial Management
• The practice of international financial management has become more demanding.– There is a wider array of products and markets now.– There are also new techniques for forecasting,
measuring performance, and managing risks.– Greater price volatility in the financial markets raises
the opportunity cost of a wrong decision or an unexpected exchange rate change.
What’s so Special about“International” Finance?
• Political Risk– Sovereign governments have the right to
regulate the movement of goods, capital, and people across their borders. These laws sometimes change in unexpected ways.
• Market Imperfections– Legal restrictions on movement of
goods, people, and money– Transactions costs– Shipping costs– Tax arbitrage
What’s Special about “International” Finance?

The Example of Nestlé’s Market Imperfection
• Nestlé used to issue two different classes of common stock bearer shares and registered shares.– Foreigners were only allowed to buy bearer shares.– Swiss citizens could buy registered shares.– The bearer stock was more expensive.
• On November 18, 1988, Nestlé lifted restrictions imposed on foreigners, allowing them to hold registered shares as well as bearer shares.
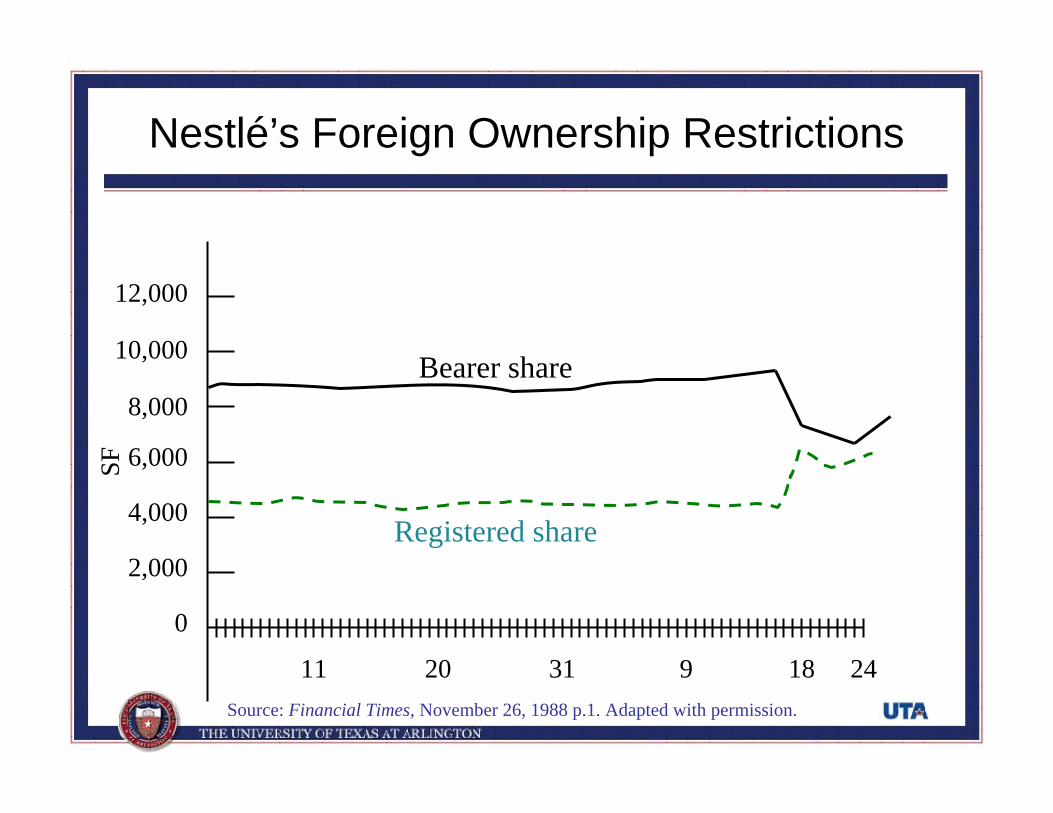
Nestlé’s Foreign Ownership Restrictions
12,000
10,000
8,000
6,000
4,000
2,000
0
11 20 31 9 18 24Source: Financial Times, November 26, 1988 p.1. Adapted with permission.
SF
Bearer share
Registered share
The Example of Nestlé’s Market Imperfection
• Following this, the price spread between the two types of shares narrowed dramatically.– This implies that there was a major transfer of wealth
from foreign shareholders to Swiss shareholders.• Foreigners holding Nestlé bearer shares were
exposed to political risk in a country that is widely viewed as a haven from such risk.
• The Nestlé episode illustrates both the importance of considering market imperfections and the peril of political risk.
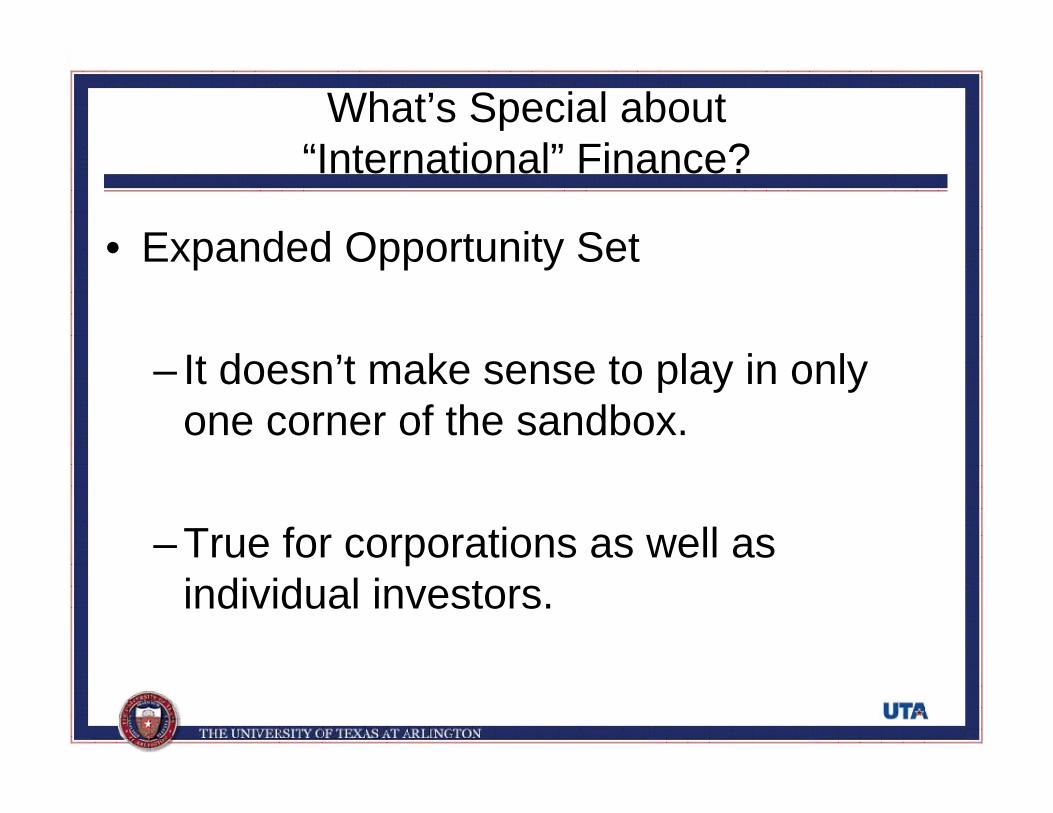
• Expanded Opportunity Set
– It doesn’t make sense to play in only one corner of the sandbox.
– True for corporations as well as individual investors.
What’s Special about “International” Finance?
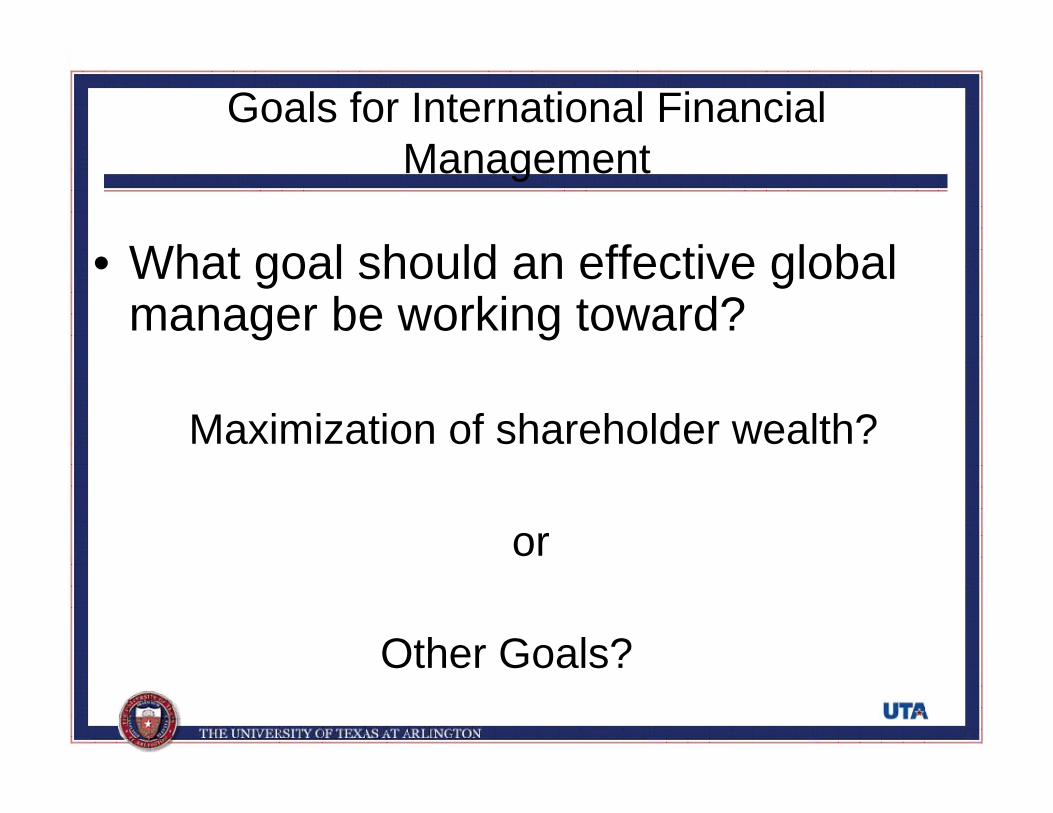
• What goal should an effective global manager be working toward?
Maximization of shareholder wealth?
or
Other Goals?
Goals for International Financial Management

Maximize Shareholder Wealth
• Long accepted as a goal in the Anglo-Saxon countries, but complications arise.
– Who are and where are the shareholders?
– In what currency should we maximize their wealth?
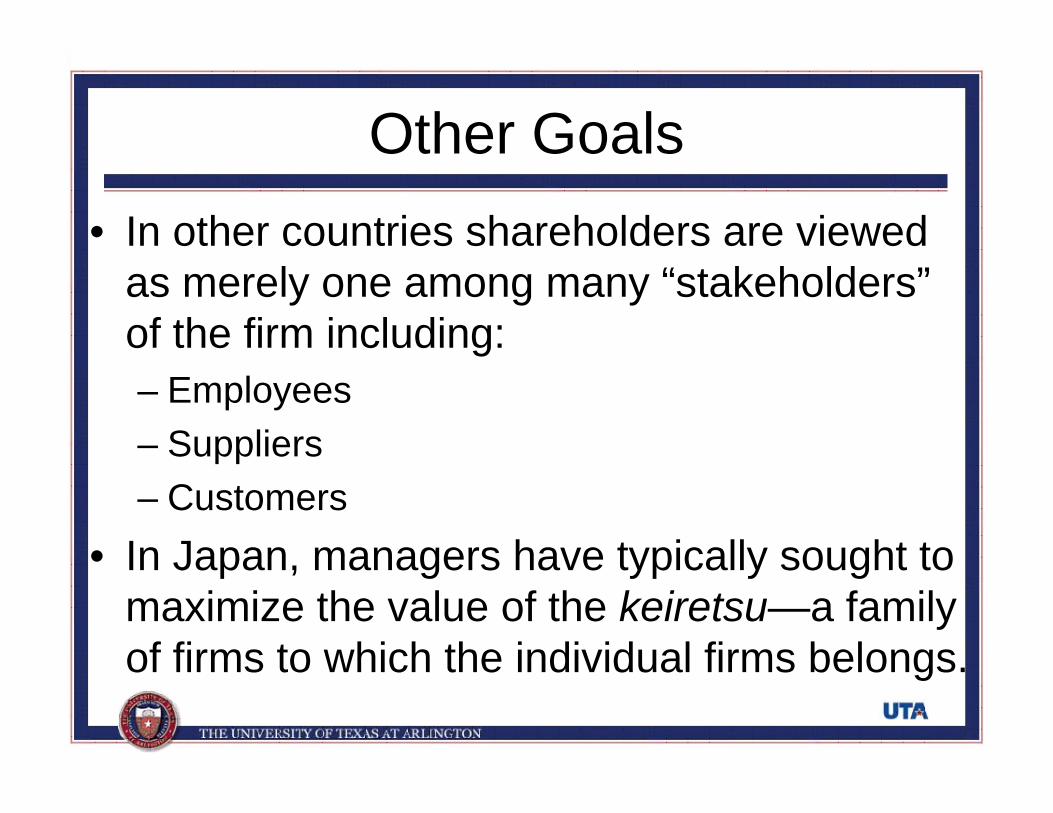
Other Goals• In other countries shareholders are viewed
as merely one among many “stakeholders”of the firm including:– Employees– Suppliers– Customers
• In Japan, managers have typically sought to maximize the value of the keiretsu—a family of firms to which the individual firms belongs.

Other Goals
• As shown by a series of recent corporate scandals at companies like Enron, WorldCom, and Global Crossing, managers may pursue their own private interests at the expense of shareholders when they are not closely monitored.
• These calamities have painfully reinforced the importance of corporate governance i.e. the financial and legal framework for regulating the relationship between a firm’s management and its shareholders.

Other Goals
• These types of issues can be much more serious in many other parts of the world, especially emerging and transitional economies, such as Indonesia, Korea, and Russia, where legal protection of shareholders is weak or virtually non-existing.
• No matter what the other goals, they cannot be achieved in the long term if the maximization of shareholder wealth is not given due consideration.
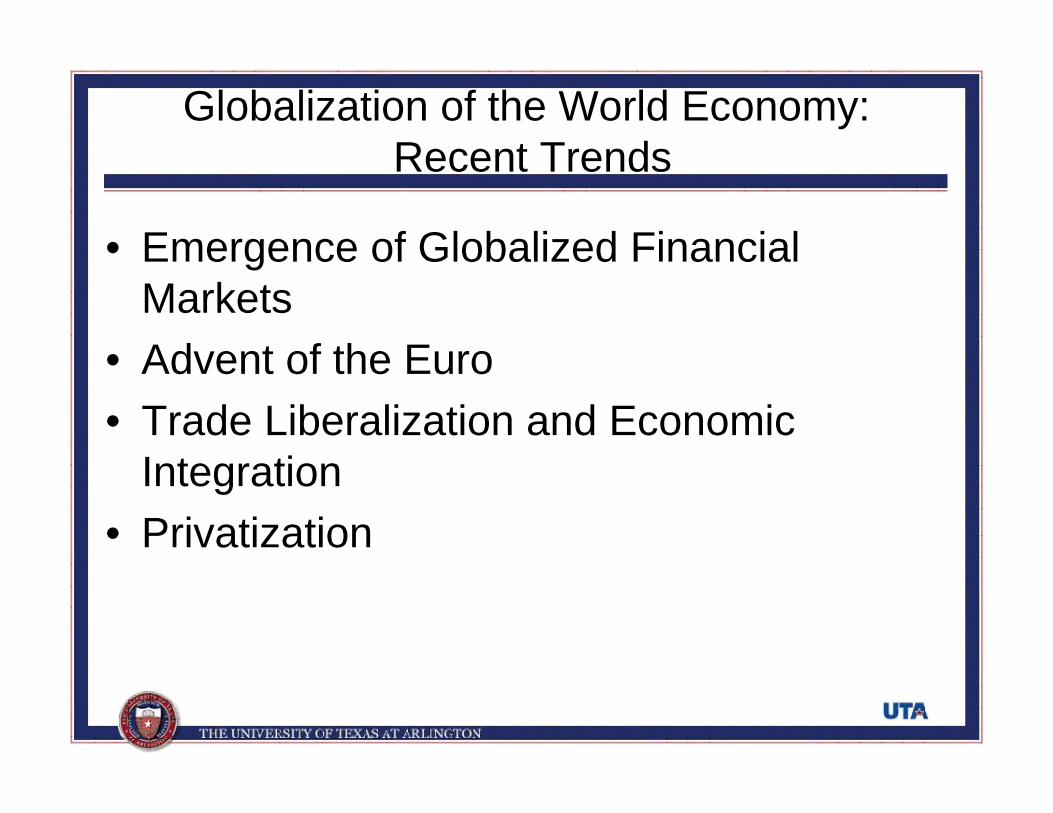
Globalization of the World Economy:Recent Trends
• Emergence of Globalized Financial Markets
• Advent of the Euro• Trade Liberalization and Economic
Integration • Privatization
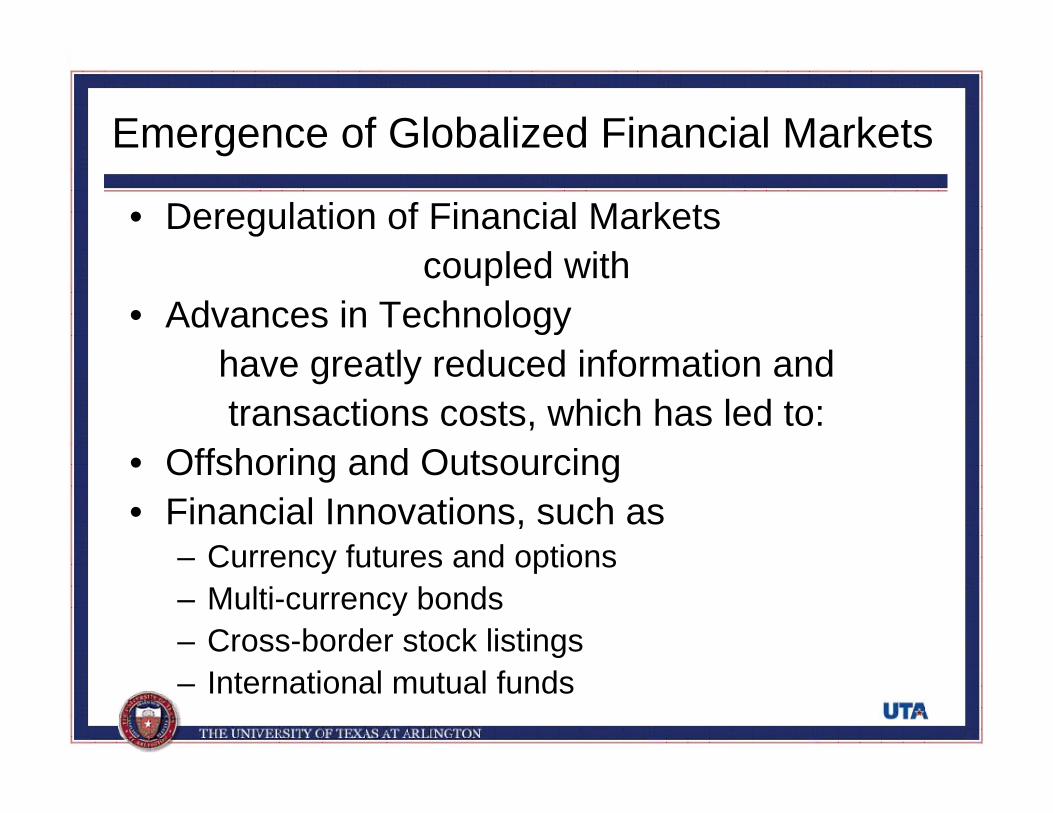
• Deregulation of Financial Markets coupled with
• Advances in Technology have greatly reduced information and transactions costs, which has led to:
• Offshoring and Outsourcing• Financial Innovations, such as
– Currency futures and options– Multi-currency bonds– Cross-border stock listings– International mutual funds
Emergence of Globalized Financial Markets
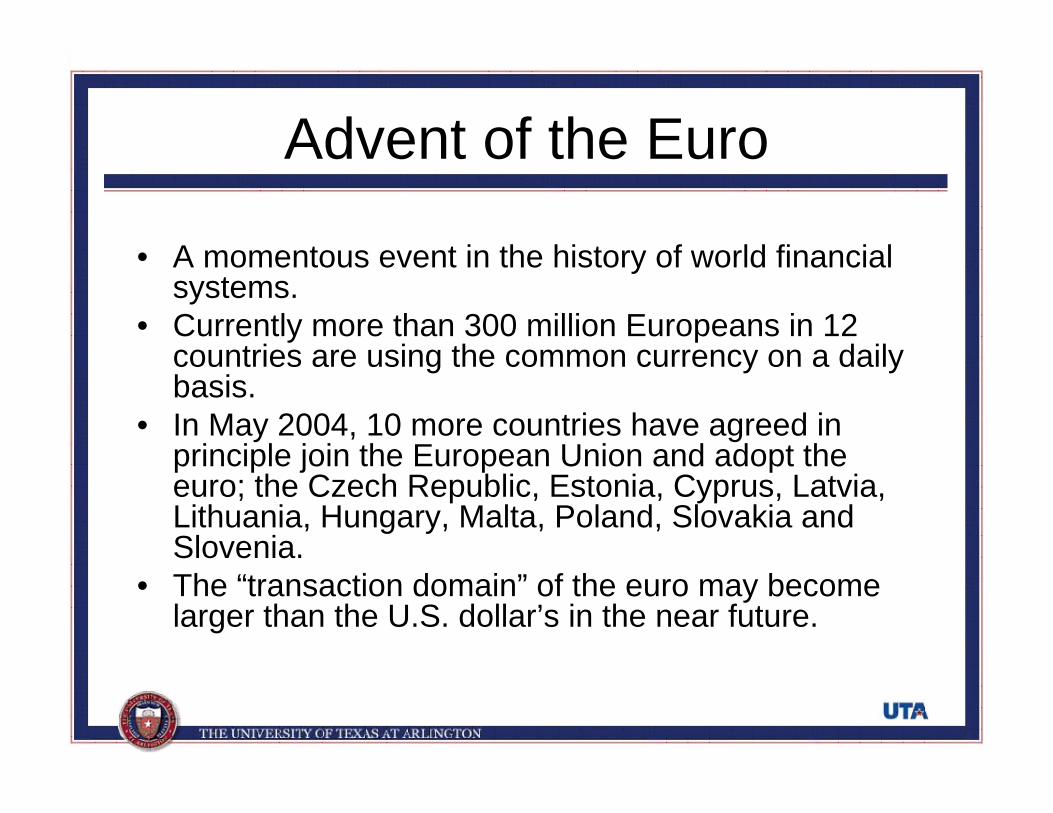
Advent of the Euro
• A momentous event in the history of world financial systems.
• Currently more than 300 million Europeans in 12 countries are using the common currency on a daily basis.
• In May 2004, 10 more countries have agreed in principle join the European Union and adopt the euro; the Czech Republic, Estonia, Cyprus, Latvia, Lithuania, Hungary, Malta, Poland, Slovakia and Slovenia.
• The “transaction domain” of the euro may become larger than the U.S. dollar’s in the near future.

Value of the Euro
January 1999 to October 2012
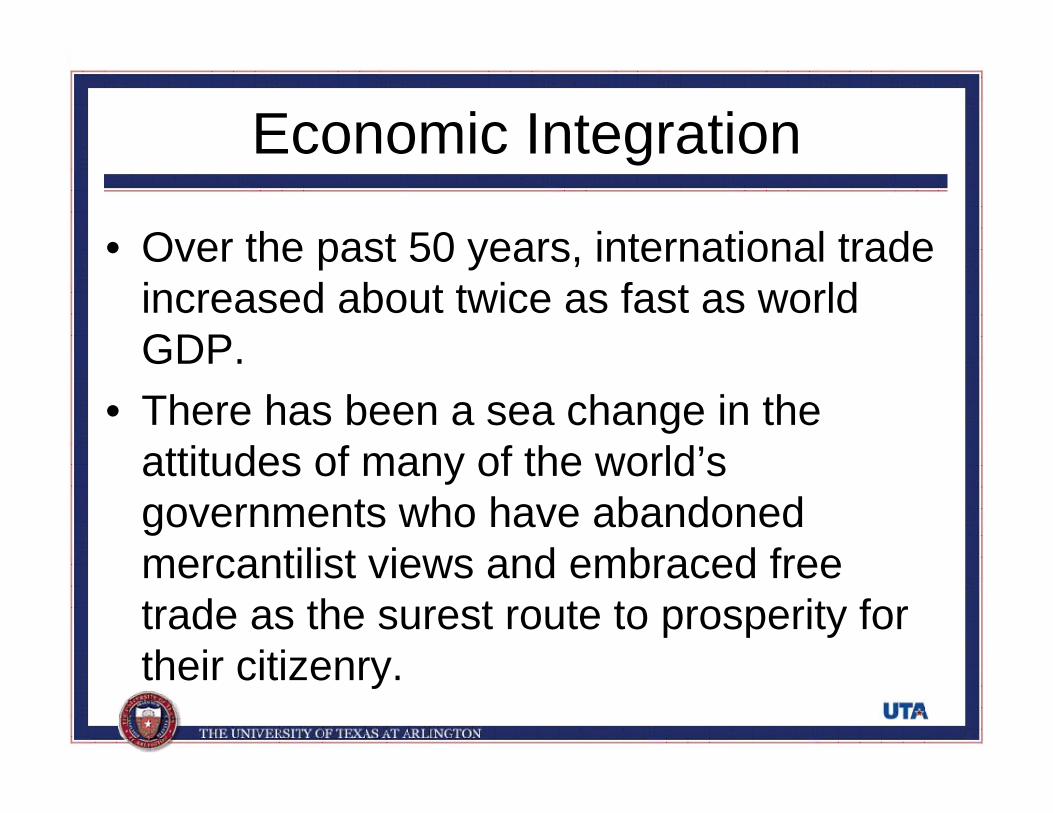
Economic Integration
• Over the past 50 years, international trade increased about twice as fast as world GDP.
• There has been a sea change in the attitudes of many of the world’s governments who have abandoned mercantilist views and embraced free trade as the surest route to prosperity for their citizenry.
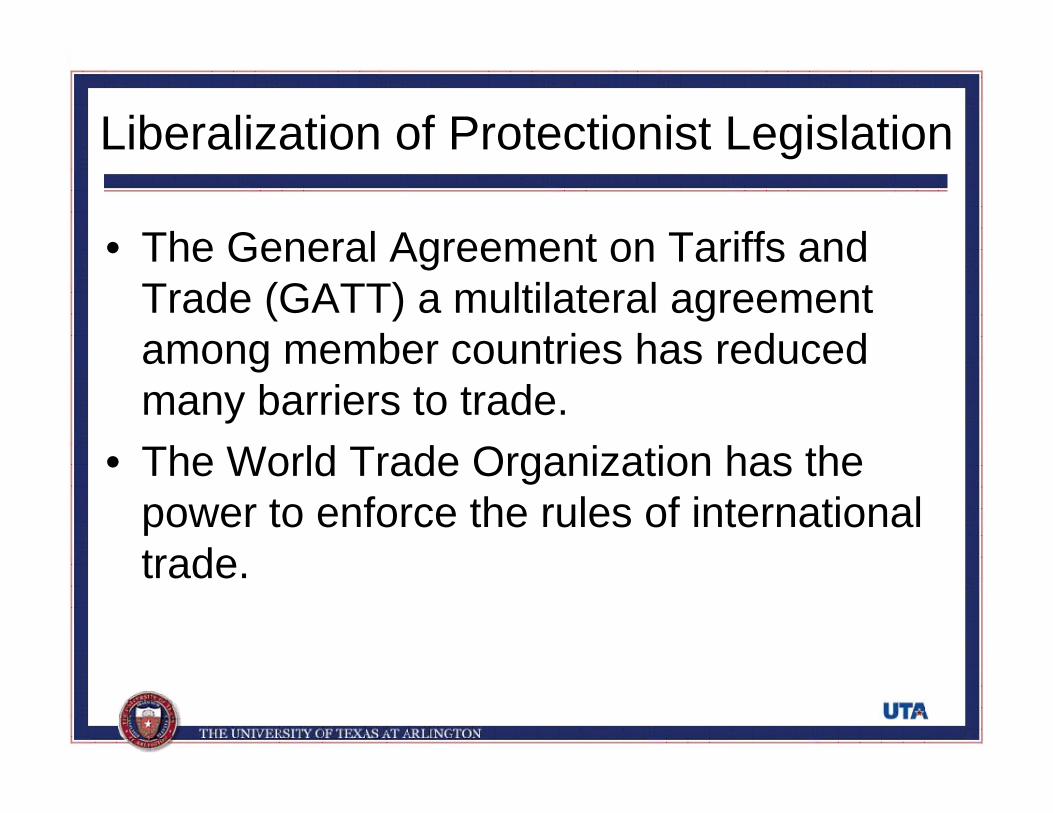
Liberalization of Protectionist Legislation
• The General Agreement on Tariffs and Trade (GATT) a multilateral agreement among member countries has reduced many barriers to trade.
• The World Trade Organization has the power to enforce the rules of international trade.

Example: NAFTA
• The North American Free Trade Agreement (NAFTA) calls for phasing out impediments to trade between Canada, Mexico and the United States over a 15-year period.
• For Mexico, the ratio of export to GDP has increased dramatically from 2.2% in 1973 to 28.7% in 2001.
• The increased trade will result in increased numbers of jobs and a higher standard of living for all member nations.
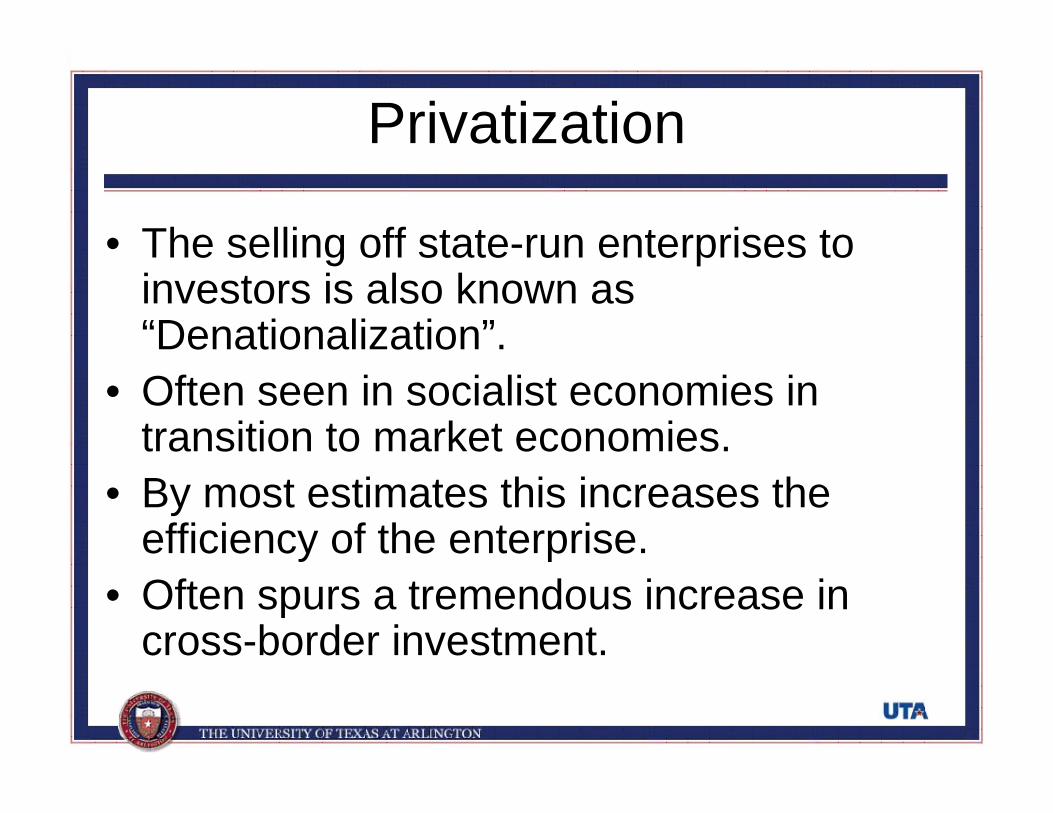
Privatization
• The selling off state-run enterprises to investors is also known as “Denationalization”.
• Often seen in socialist economies in transition to market economies.
• By most estimates this increases the efficiency of the enterprise.
• Often spurs a tremendous increase in cross-border investment.
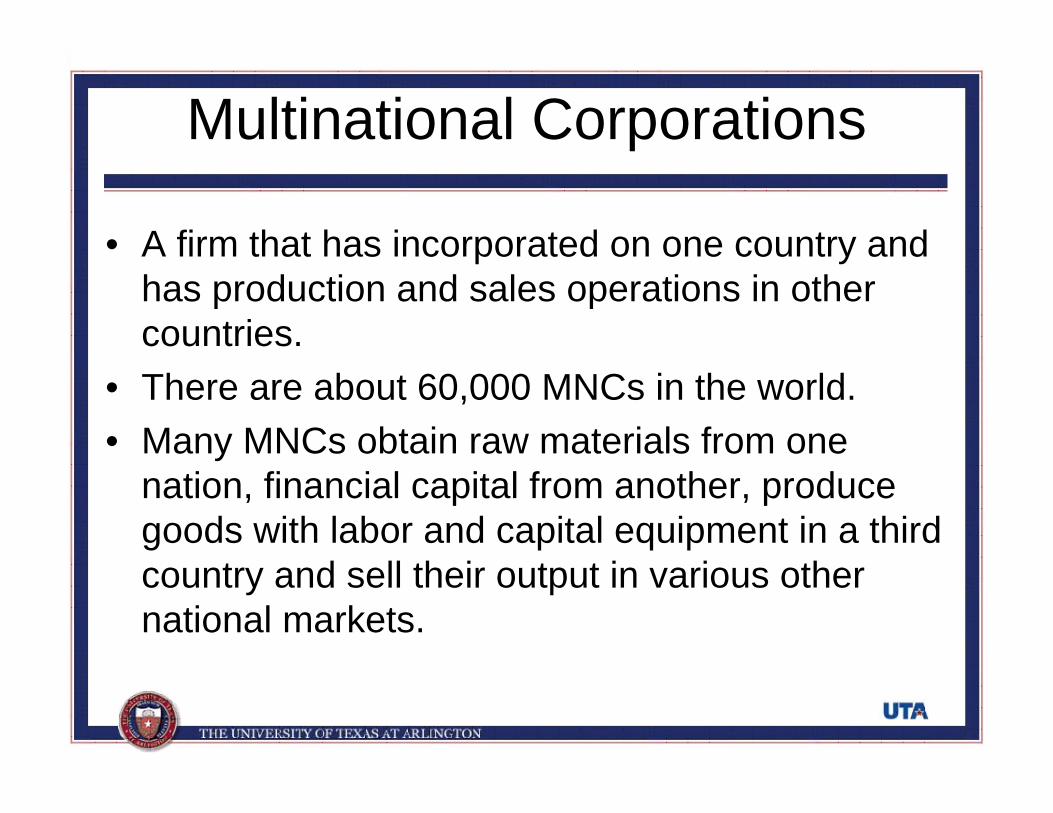
Multinational Corporations
• A firm that has incorporated on one country and has production and sales operations in other countries.
• There are about 60,000 MNCs in the world.• Many MNCs obtain raw materials from one
nation, financial capital from another, produce goods with labor and capital equipment in a third country and sell their output in various other national markets.
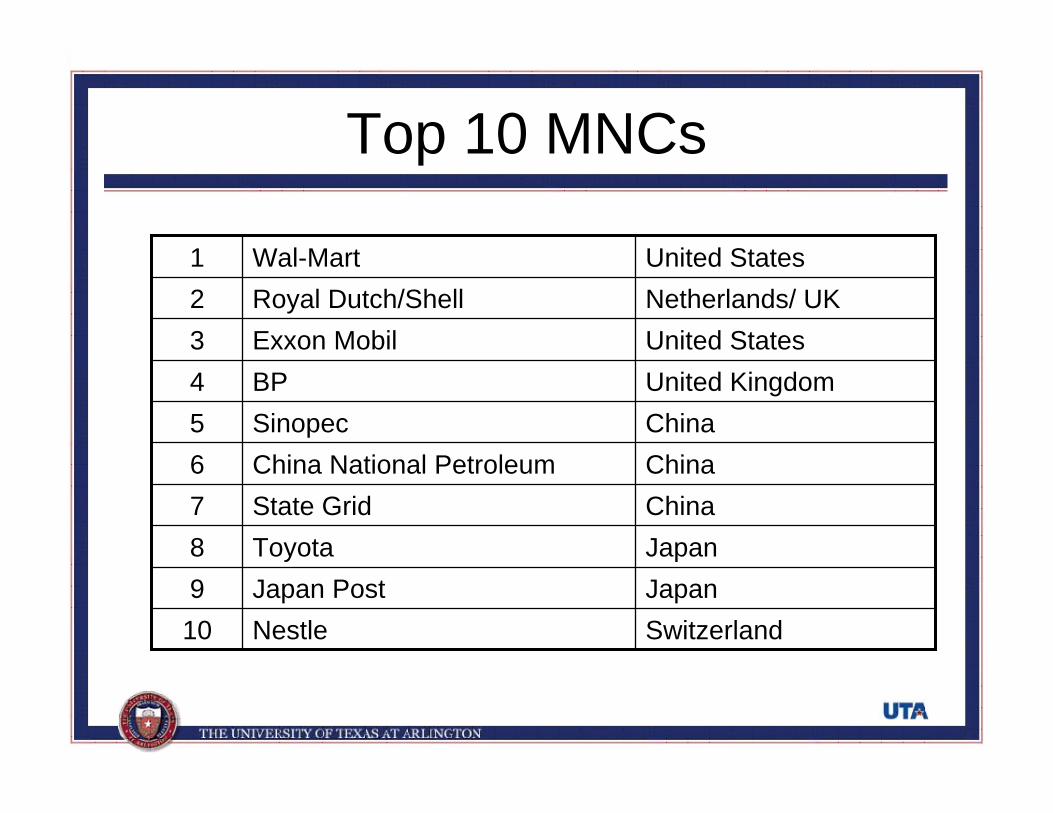
Top 10 MNCs
SwitzerlandNestle10JapanJapan Post9JapanToyota8ChinaState Grid7ChinaChina National Petroleum6ChinaSinopec5United KingdomBP4United StatesExxon Mobil3Netherlands/ UKRoyal Dutch/Shell2United StatesWal-Mart1
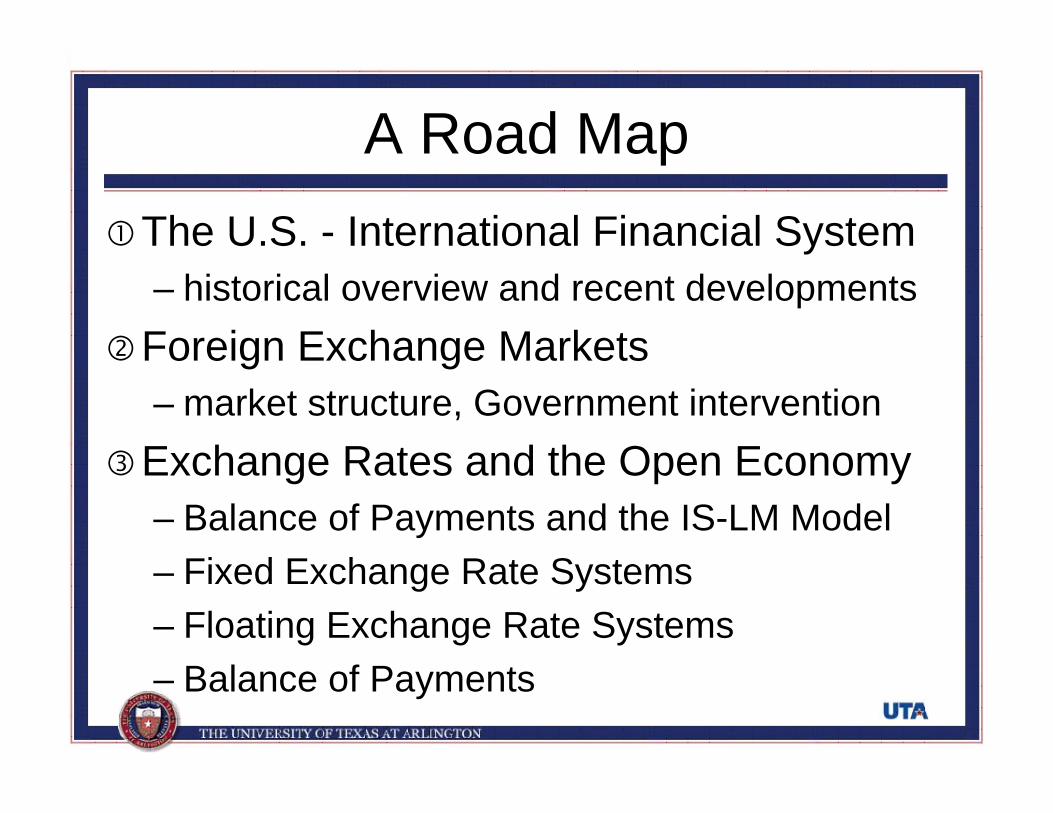
A Road MapThe U.S. - International Financial System– historical overview and recent developments
Foreign Exchange Markets– market structure, Government intervention
Exchange Rates and the Open Economy– Balance of Payments and the IS-LM Model– Fixed Exchange Rate Systems– Floating Exchange Rate Systems– Balance of Payments

A Road Map
Derivatives: Forward Contracts, Futures, Options, and Swaps– currency forwards and futures, options, and swaps
International Parity Conditions– Uncovered Interest Parity– Covered Interest Parity– Purchasing Power Parity– Real Interest Rate Parity
Exchange Rate Determination– Asset Models
A Road Map
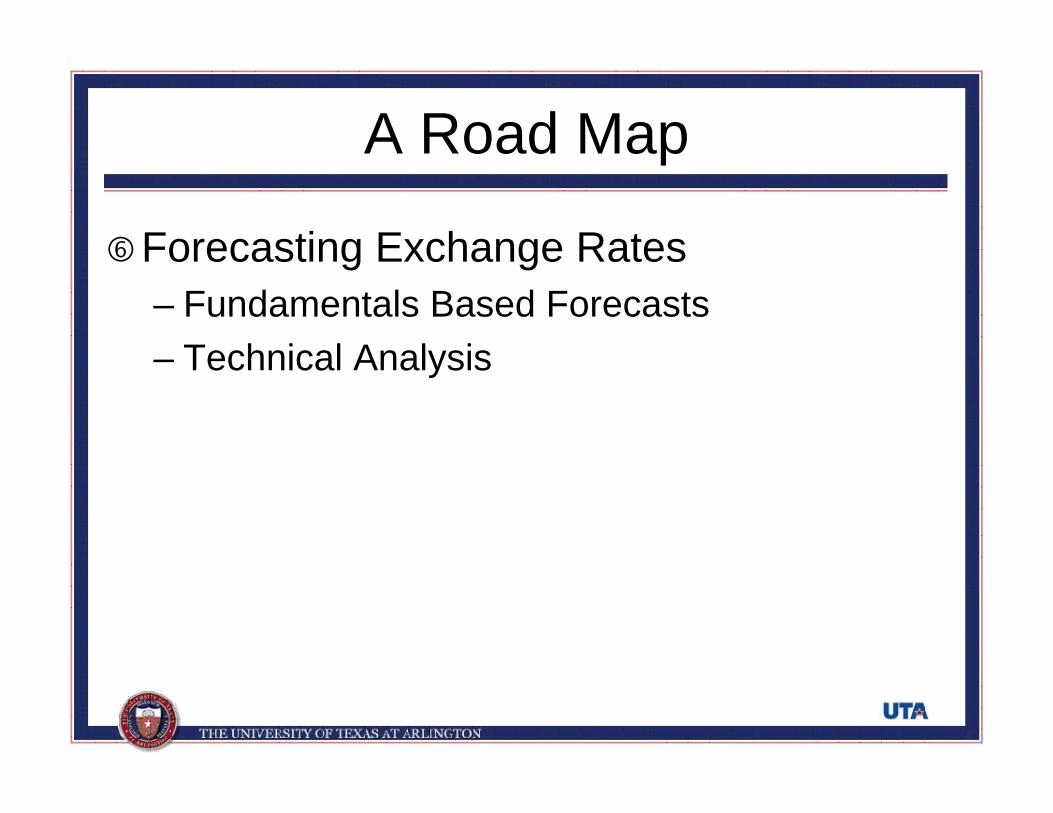
Forecasting Exchange Rates– Fundamentals Based Forecasts– Technical Analysis
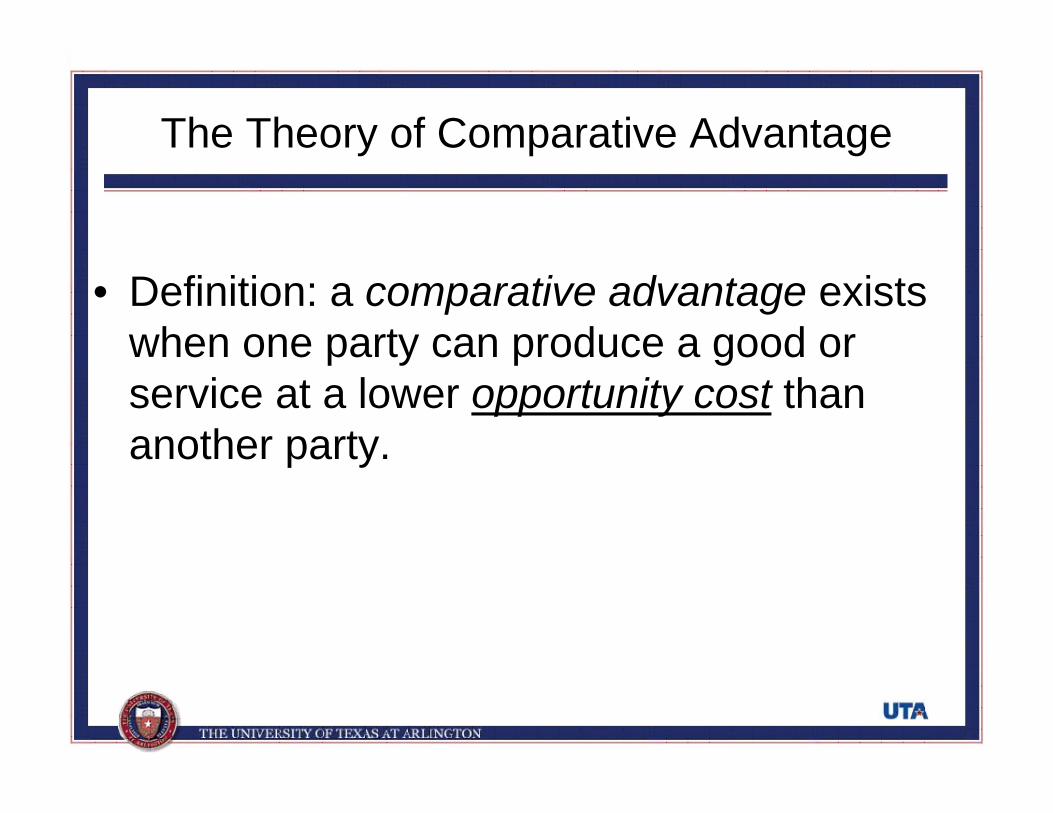
• Definition: a comparative advantage exists when one party can produce a good or service at a lower opportunity cost than another party.
The Theory of Comparative Advantage
The Geometry of Comparative Advantage
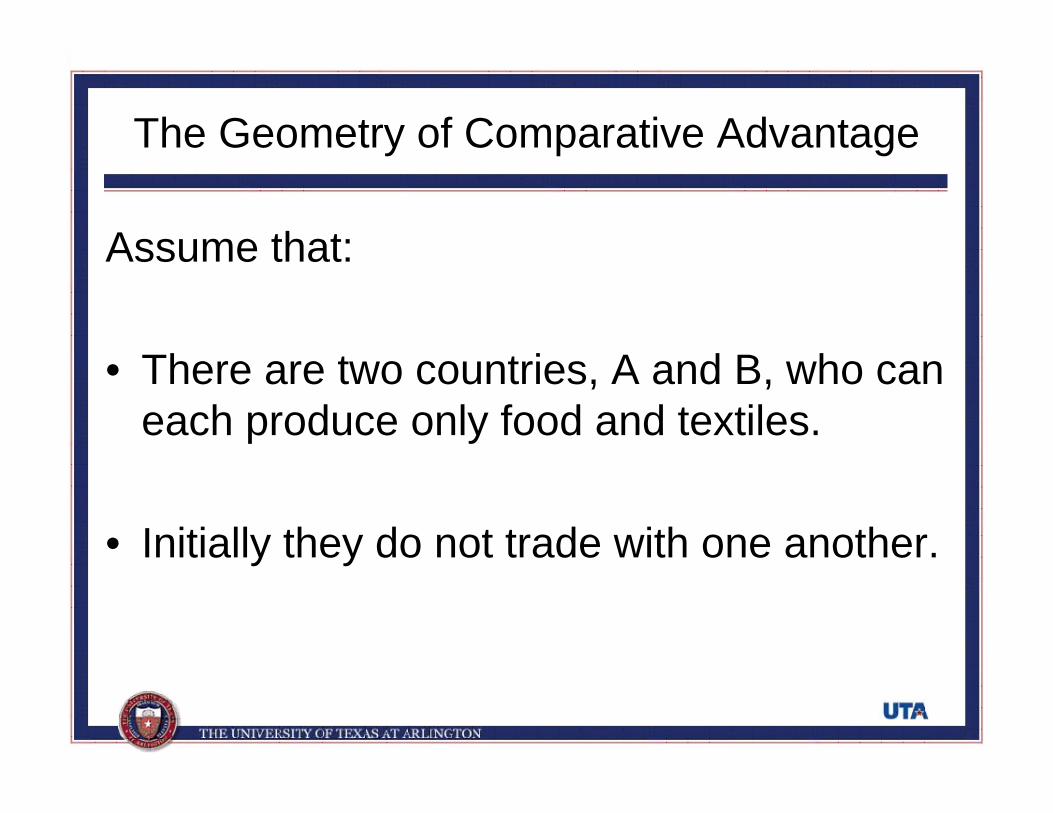
Assume that:
• There are two countries, A and B, who can each produce only food and textiles.
• Initially they do not trade with one another.

The Geometry of Comparative Advantage
300Food
Textiles
180
A production possibilities curve shows the various amounts of food or textiles that each country can make.
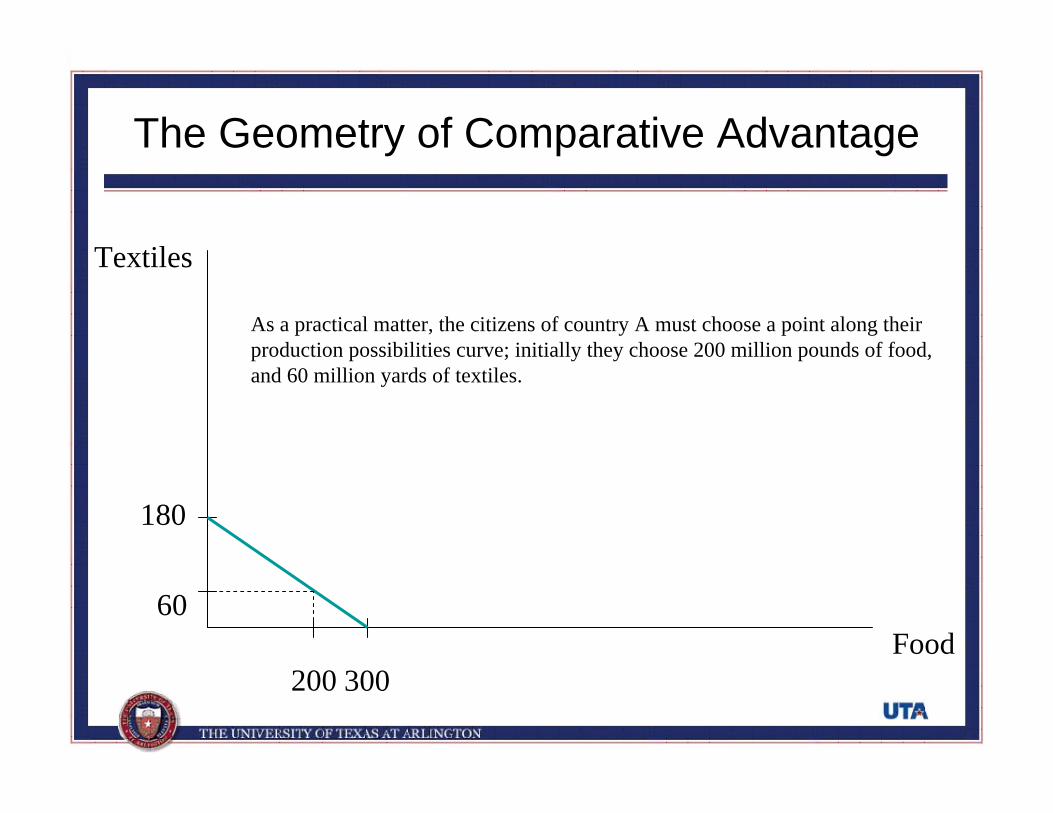
The production possibilities of country A are such that if they concentrated 100% of their resources into the production of textiles, they could produce 180 million yards of textiles.
If country A chose to concentrate 100% of their resources into the production of food, they could produce as much as 300 million pounds of food.
Country A can produce any combination of food and textiles between these two points.
The Geometry of Comparative Advantage
300Food
Textiles
180
60
200
As a practical matter, the citizens of country A must choose a point along their production possibilities curve; initially they choose 200 million pounds of food, and 60 million yards of textiles.
The Geometry of Comparative Advantage
1,200300Food
Textiles
180
900
240
60
200
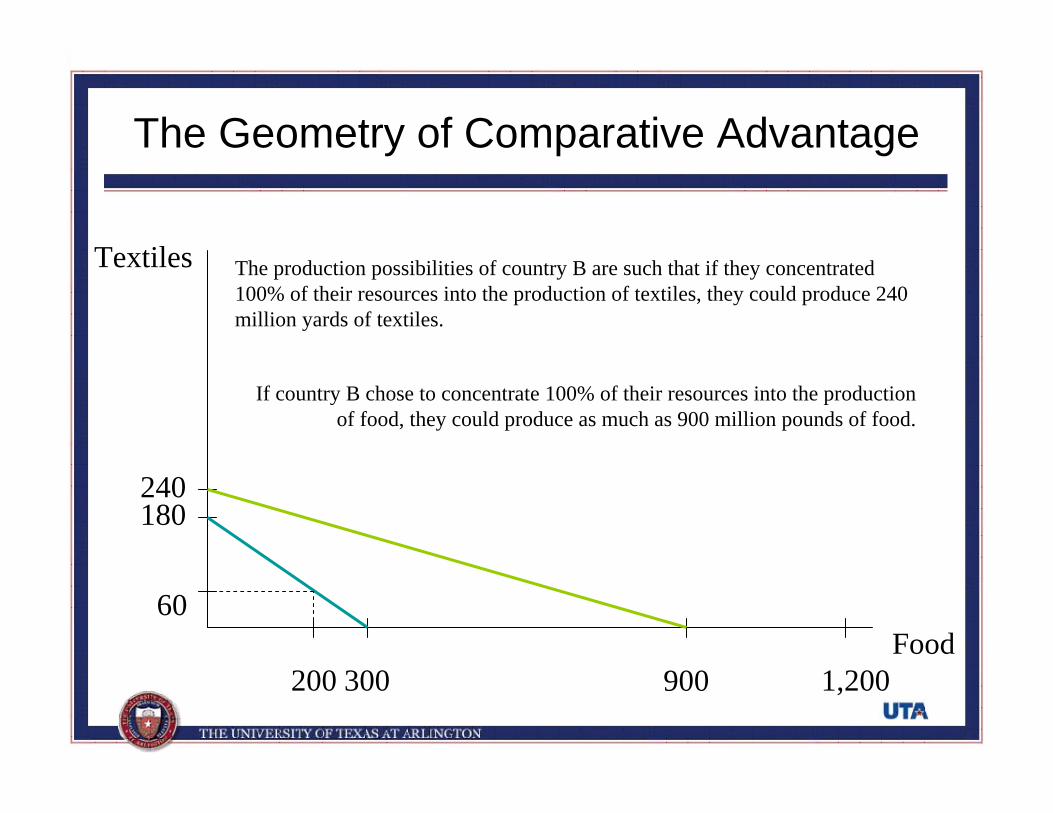
The production possibilities of country B are such that if they concentrated 100% of their resources into the production of textiles, they could produce 240 million yards of textiles.
If country B chose to concentrate 100% of their resources into the production of food, they could produce as much as 900 million pounds of food.
The Geometry of Comparative Advantage
1,200300Food
Textiles
180
900
240
60
200 600
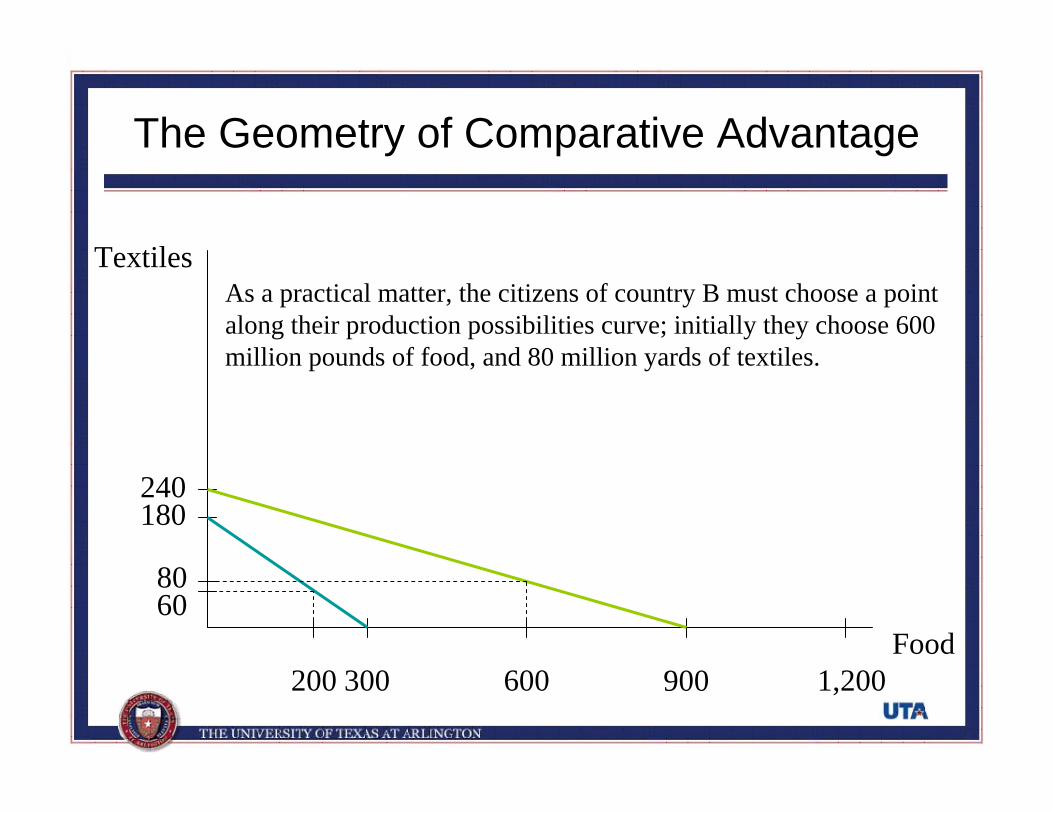
As a practical matter, the citizens of country B must choose a point along their production possibilities curve; initially they choose 600 million pounds of food, and 80 million yards of textiles.
80

The Geometry of Comparative Advantage
300Food
Textiles
180
900
240
60
200 600
80
Country A enjoys a comparative advantage in textiles because they have to give up food at a lower rate than B when making textiles.
Put another way, country B enjoys a comparative advantage in food because they have to give up textiles at a lower rate than A when making more food.
Geometrically, a comparative advantage exists because the slopes of the production possibilities differ.

The Geometry of Comparative Advantage
300Food
Textiles
180
900
240
60
200 600
80
If the countries specialize according to their comparative advantage, then country A should make textiles and trade for food, while country B should grow food and trade for textiles.
The Geometry of Comparative Advantage
1,200300Food
Textiles
420
180
900
240
60
200 600
80
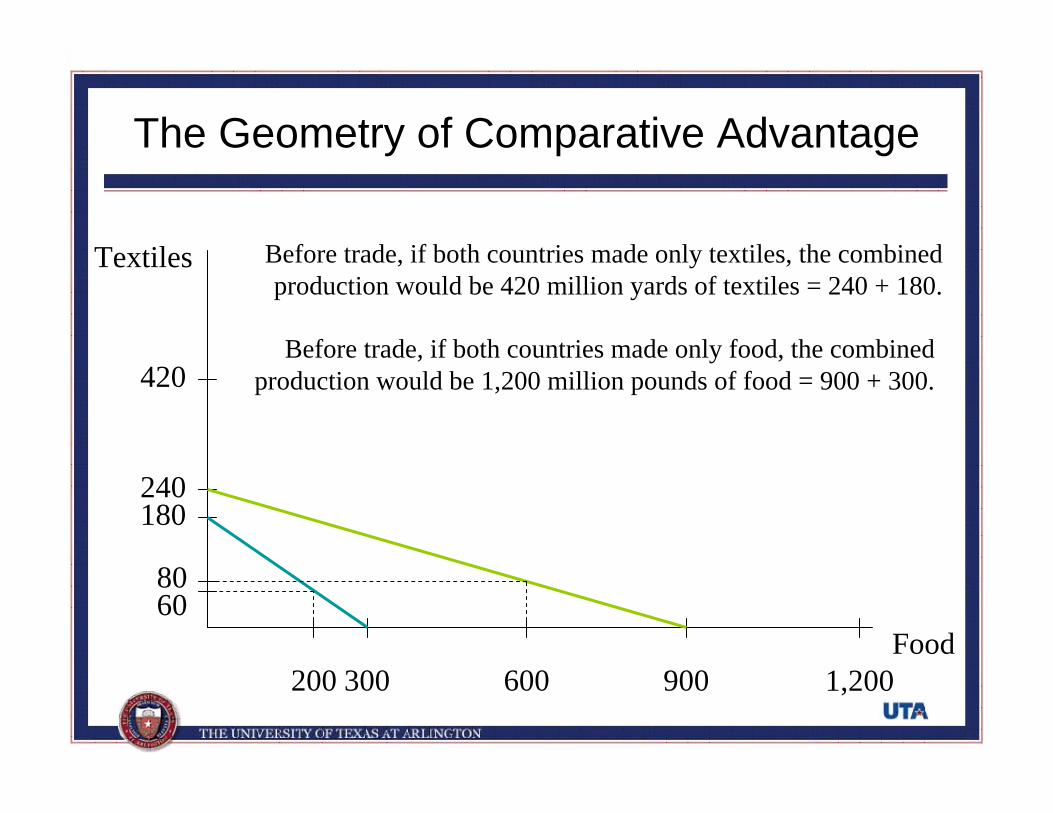
Before trade, if both countries made only textiles, the combinedproduction would be 420 million yards of textiles = 240 + 180.
Before trade, if both countries made only food, the combined production would be 1,200 million pounds of food = 900 + 300.
The Geometry of Comparative Advantage
1,200300Food
Textiles
420
180
900
240
60
200 600
80
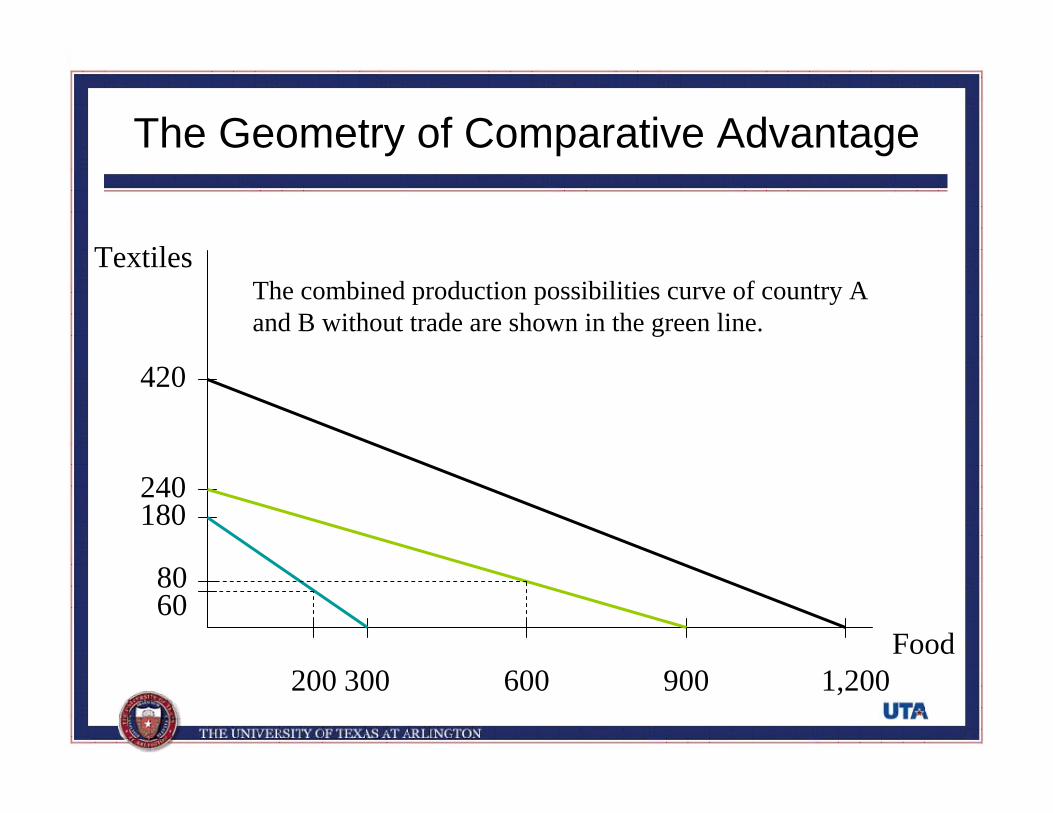
The combined production possibilities curve of country A and B without trade are shown in the green line.
The Geometry of Comparative Advantage
1,200300Food
Textiles
420
800
180
900
240
60
200 600
80
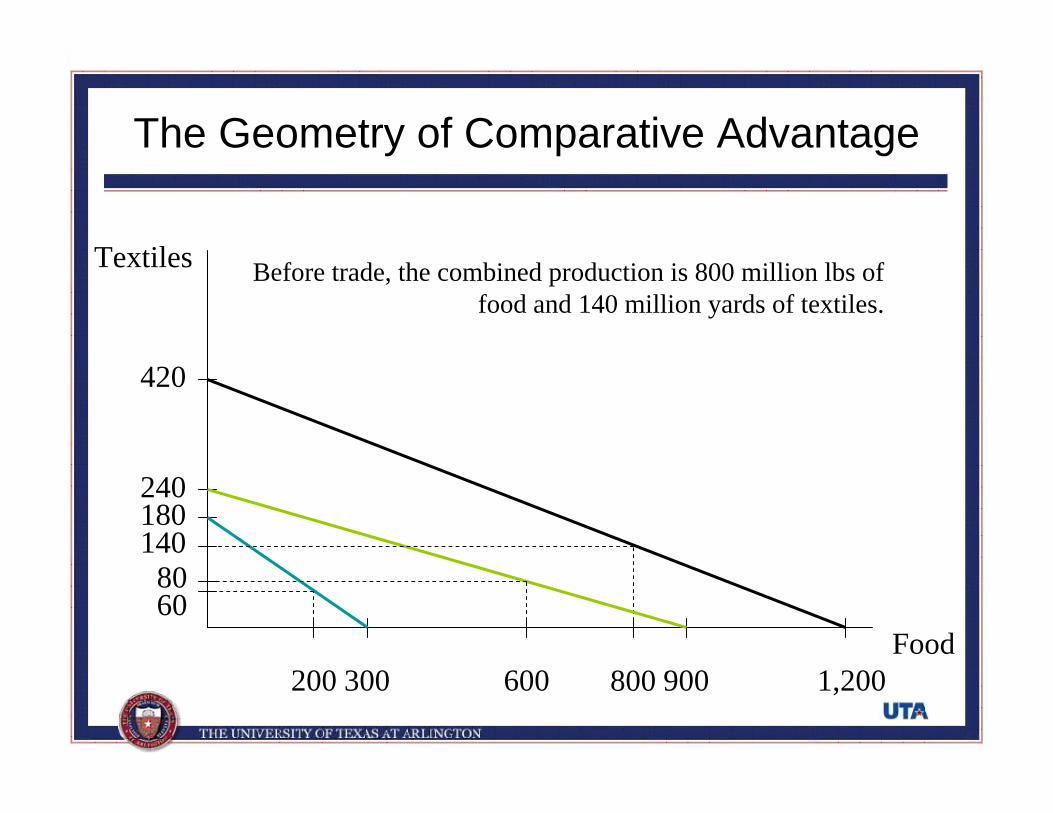
Before trade, the combined production is 800 million lbs of food and 140 million yards of textiles.
140
The Geometry of Comparative Advantage
1,200300Food
Textiles
420
800
140
900
240
60
200 600
80
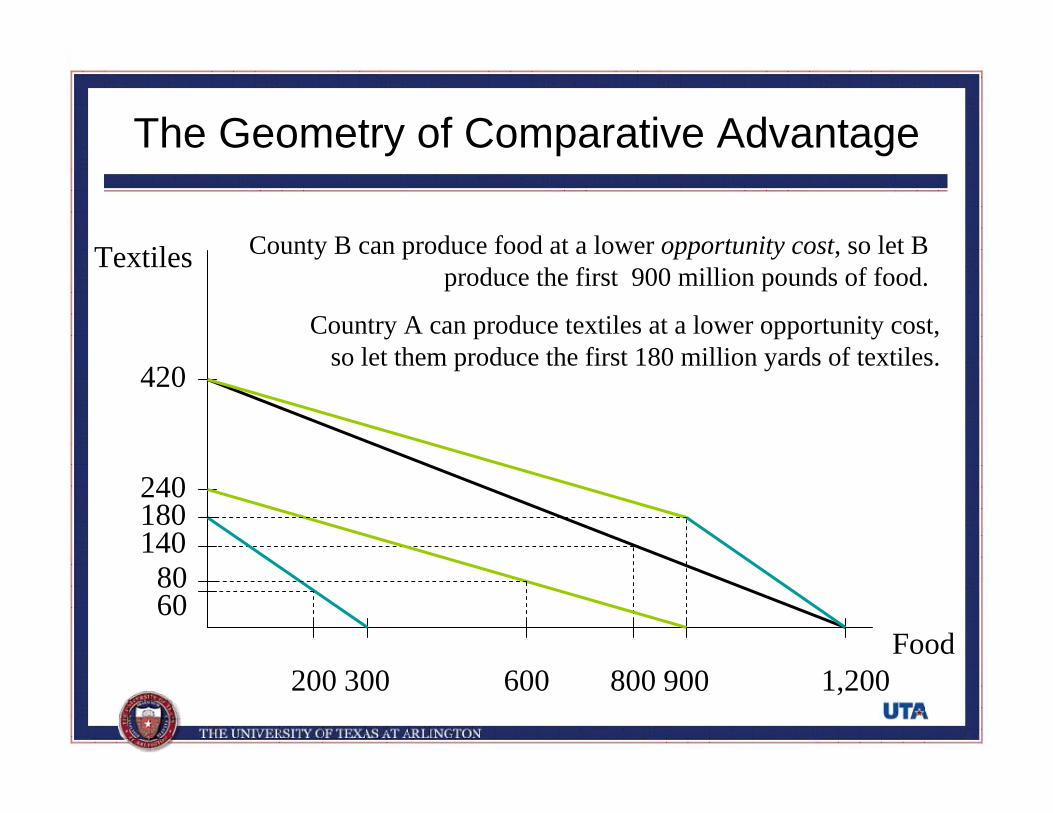
County B can produce food at a lower opportunity cost, so let B produce the first 900 million pounds of food.
Country A can produce textiles at a lower opportunity cost, so let them produce the first 180 million yards of textiles.
180
The Geometry of Comparative Advantage
1,200300Food
Textiles
420
800
140180
900
240
60
200 600
80
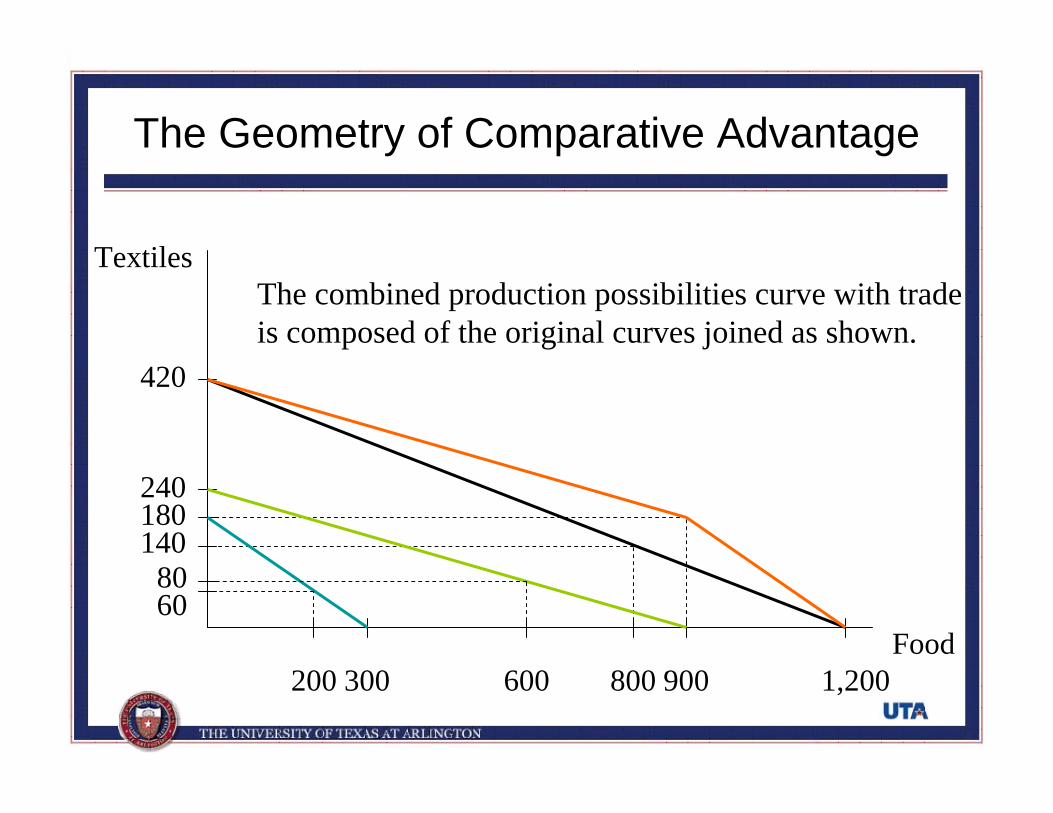
The combined production possibilities curve with trade is composed of the original curves joined as shown.
The Geometry of Comparative Advantage
1,200300Food
Textiles
420
800
140180
900
240
60
200 600
80
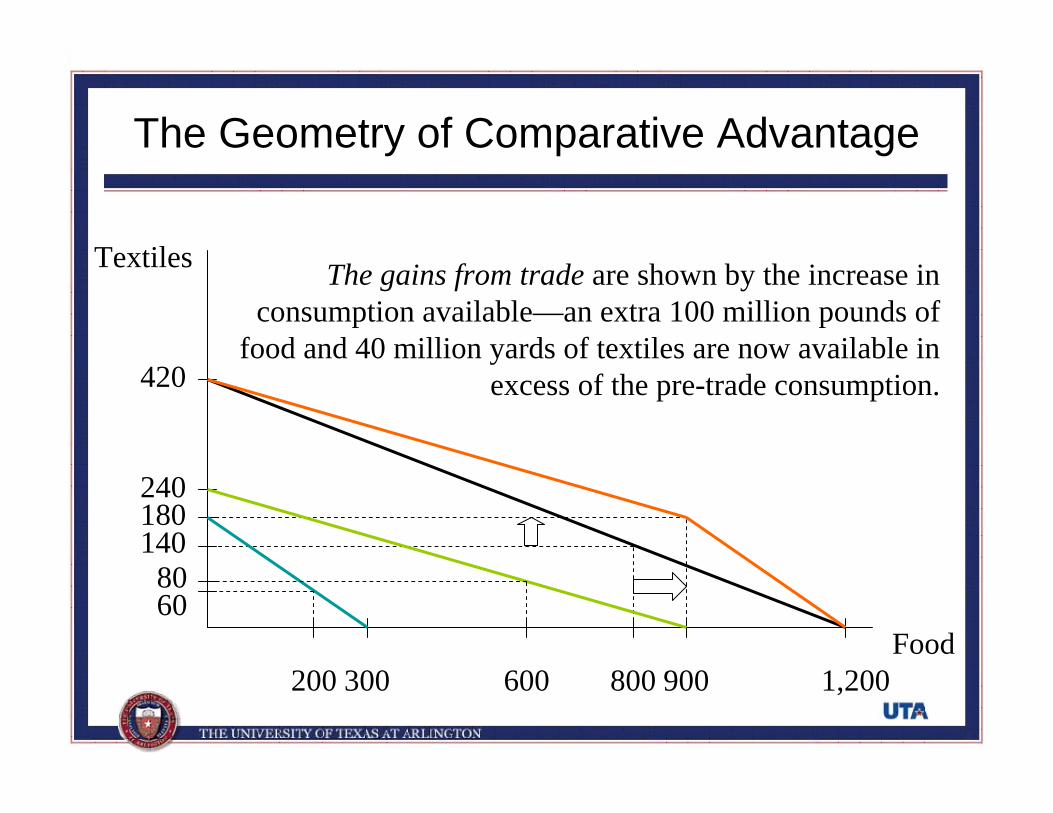
The gains from trade are shown by the increase in consumption available—an extra 100 million pounds of
food and 40 million yards of textiles are now available in excess of the pre-trade consumption.
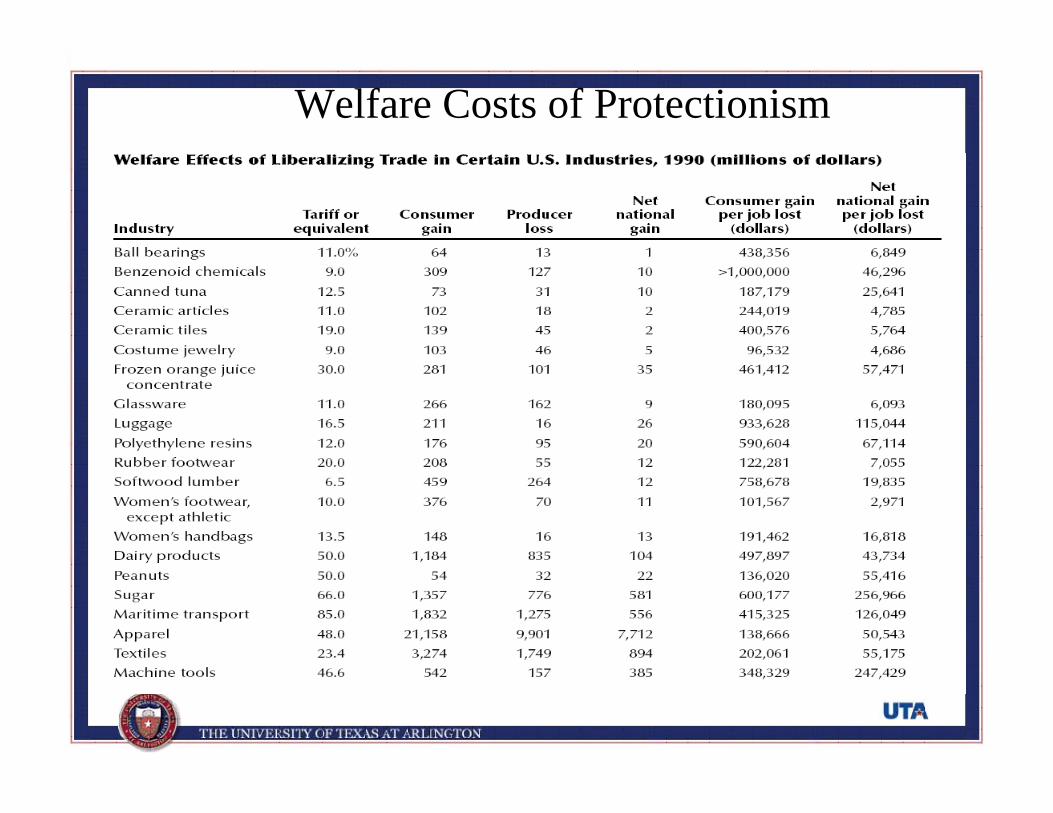
Welfare Costs of Protectionism