finaccess geospatial mapping survey, 2015 dissemination events3-eu-central-1.amazonaws.com ›...
TRANSCRIPT
FinAccess Geospatial Mapping Survey, 2015Dissemination Event
29th October 2015

Geo-Spatial Analysis: 3 Components
1). Access point data collection
2). Add Poverty and other layers
3). Mapping Software
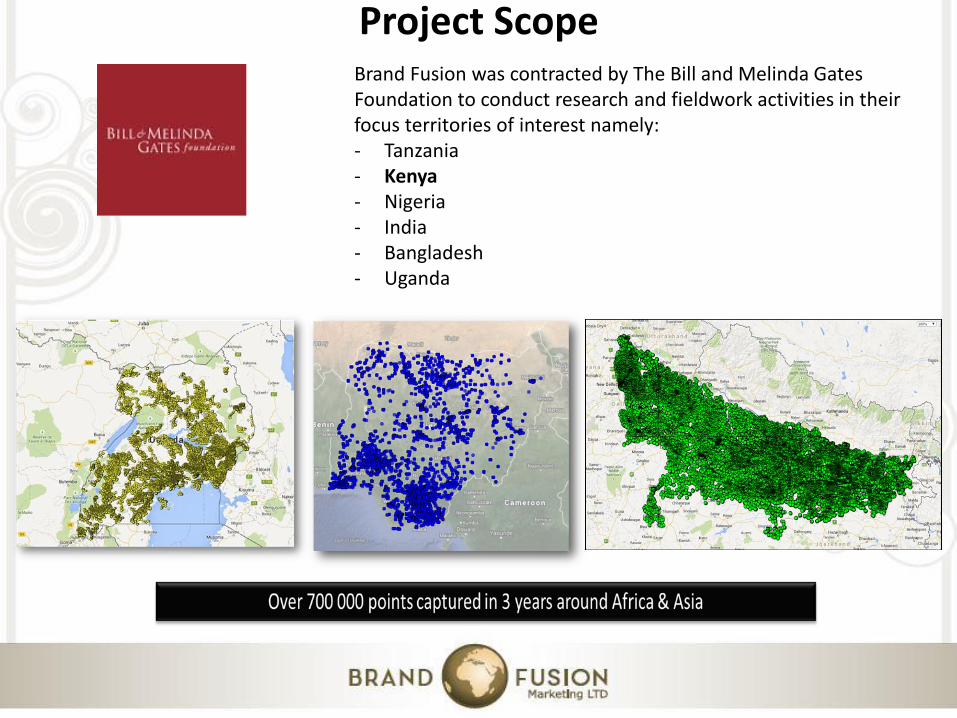
Project ScopeBrand Fusion was contracted by The Bill and Melinda Gates Foundation to conduct research and fieldwork activities in their focus territories of interest namely:- Tanzania- Kenya- Nigeria- India- Bangladesh- Uganda

Project Methodology
• The questionnaire was loaded onto a Huawei Y330 device which each Enumerator was given
• All outlet information was submitted in real time• GPS average accuracy was < 15m in Rural areas and < 10m in Urban areas• Outlets were able to be captured even in areas with no Network coverage• Operational and transaction data is based on the interviewees perceptions

Letters of Authorisation Examples

Fieldwork Approach
• Designed questionnaire to capture operational and transactional data as well as GIS data
• The questionnaire is specific to each financial service intermediary
• Profile is to interview all open and operational touch-points at that point of time of the fieldwork. Active points were considered to have done a transaction in the last 30 days
• Not all points are captured due to several factors including:i) non-location of the pointsii) security areasiii) resistance or lack of cooperationiv) dormancyv) safety of fieldwork staff
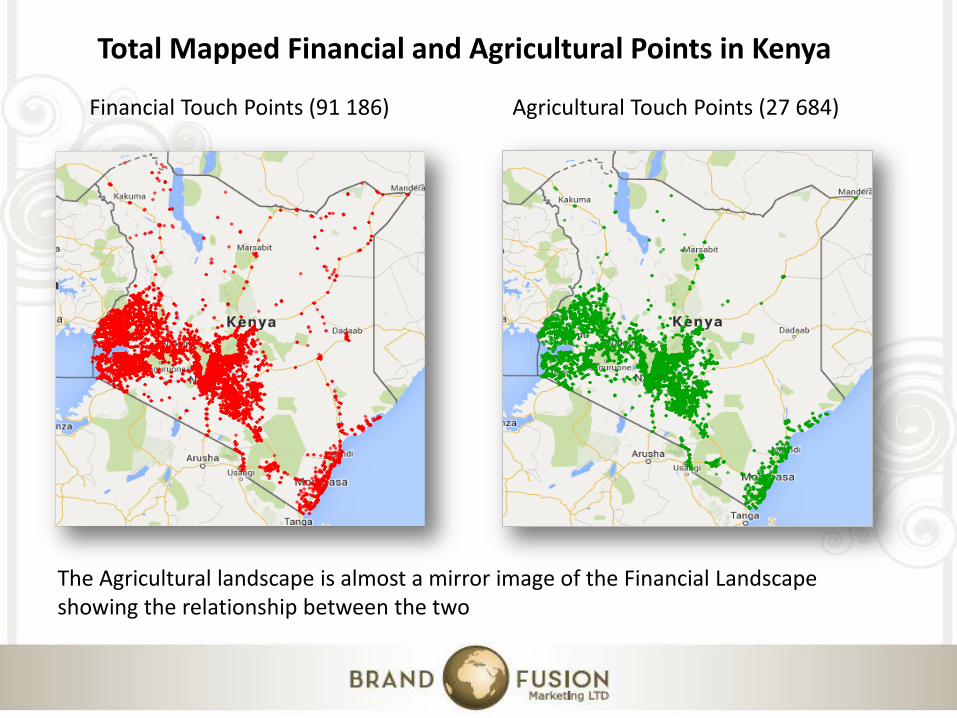
Total Mapped Financial and Agricultural Points in Kenya
Financial Touch Points (91 186) Agricultural Touch Points (27 684)
The Agricultural landscape is almost a mirror image of the Financial Landscape showing the relationship between the two
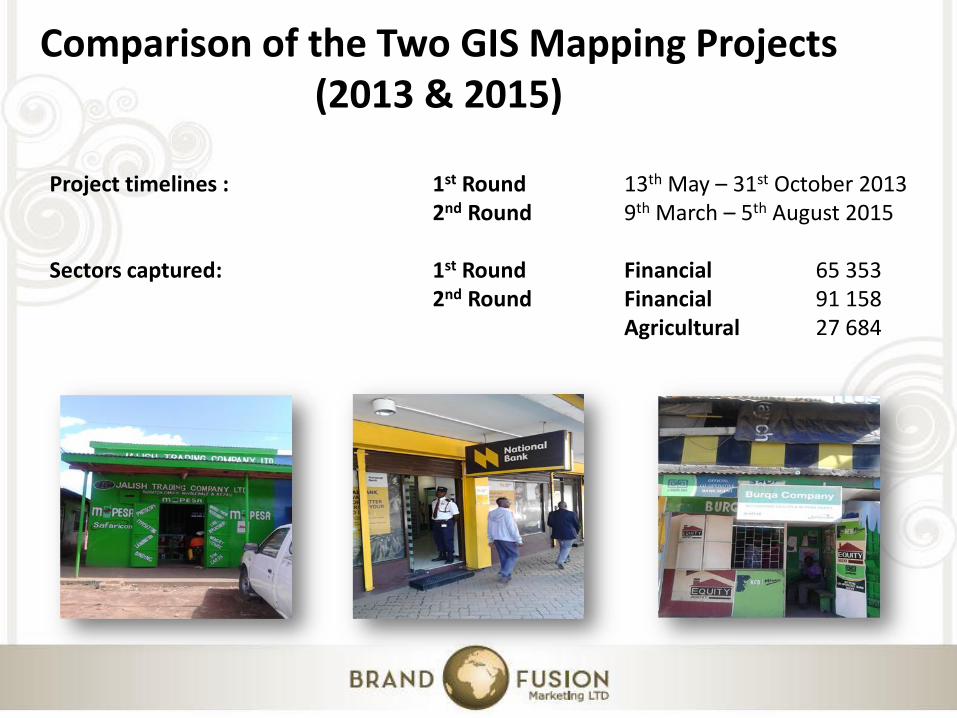
Comparison of the Two GIS Mapping Projects (2013 & 2015)
Project timelines : 1st Round 13th May – 31st October 20132nd Round 9th March – 5th August 2015
Sectors captured: 1st Round Financial 65 3532nd Round Financial 91 158
Agricultural 27 684

N=91186
Total Project Comparisons 2013 -2015 – Financial Institutions
49417
8083
2484
1313
878
121
706
503
68141
13428
3778
1272
1014
976
744
624
Mobile Money Agent
Bank Agent
Money Transfer Service
Commercial Bank and Mortgage Finance
Insurance Service Provider
Forex Bureaus
Savings and Credit Co-operative (SACCO)
Stand alone ATM
2013
2015
15.49%
706.61%
5.38%
24.06%
37.89%
66.13%
-3.12%
52.09%

N=91186
364
500
82
57
93
139
613
346
293
174
136
91
90
79
Post Office
Micro Finance Institution
Micro Finance Banks
Hire Purchase/Leasing/Factoring
Development Finance Service Provider
Pension Provider
Capital Markets Service Provider
Bus Stands
2013
2015
-6.60%
65.85%
59.65%
-3.23%
-43.17%
-4.95%
Total Project Comparisons 2013 -2015 – Financial Institutions

Mobile Money Agents
Useful information that can be gathered using GIS Data

93.45%
5.64%0.77%
0.14%
Safaricom
Airtel
Mobi Cash
Orange
Summary – Mobile Money Service Providers
Total
Base 68 141
Safaricom Agents 63 681
Airtel Agents 3 843
Mobi Cash Agents 525
Orange Agents 92

93%
7%
Mobile Money AgentsUnique Vs Multiple (n=68141)
Unique
Multiple
Unique vs Multiple Agents
87%
13%
Mobile Money Agents and Bank Agents Unique Vs Multiple
Unique
Multiple

93.34%
6.16%0.33%
0.16%
Number of times an Agent would run out of cash (n=68141)
Never
Monthly
Weekly
Daily
How often does a Agent run out of physical cash
Mobile Money Service Providers
How often does a Agent run out of e-float
93.20%
6.25%
0.39%
0.16%
Agent run out of e-float (n=68141)
Never
Monthly
Weekly
Daily
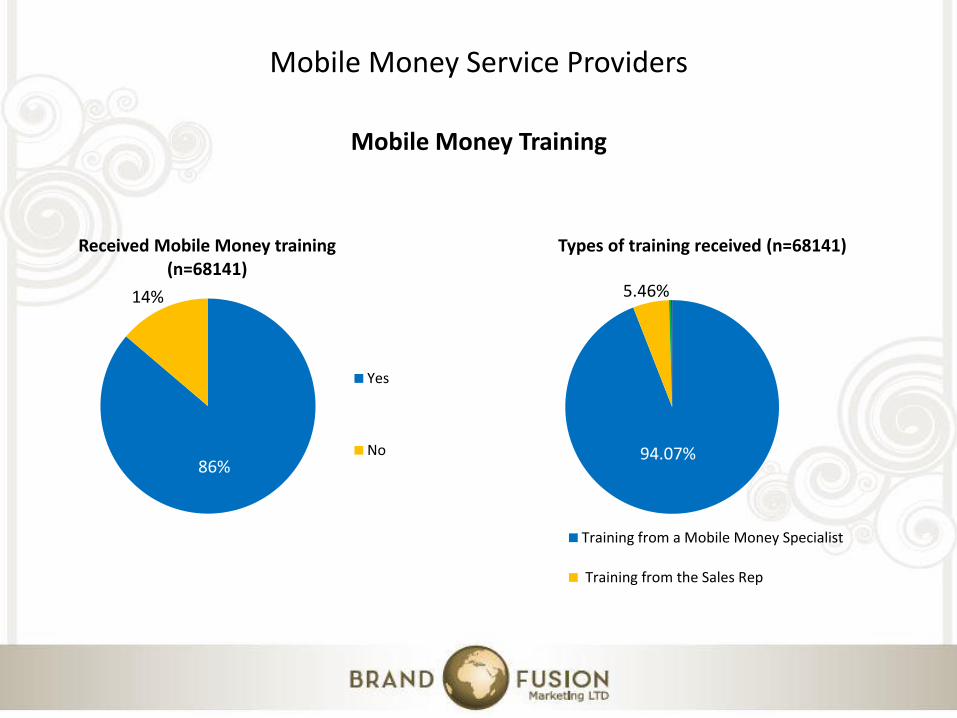
Mobile Money Training
86%
14%
Received Mobile Money training (n=68141)
Yes
No
Mobile Money Service Providers
94.07%
5.46%
Types of training received (n=68141)
Training from a Mobile Money Specialist
Training from the Sales Rep

Fraud Statistics
37%
63%
Experienced cases of Fraud (n=68141)
Yes
No
Mobile Money Service Providers
97%
2%
Types of Fraud (n=25322)
Counterfeit Money Direct Handset Fraud

94%
3%
1%
1%
1%
Counterfeit Money
Direct Handset Fraud
Fake sms
Robbery
Fake Identification
Types of Fraud (n=27845)
31%
69%
Experienced cases of Fraud
Yes No
Fraud Stats Across all Financial Access Points

Fraud Stats Across all Financial Access Points
BaseCounterfeit
Money
Direct Handset
Fraud Fake sms Robbery
Fake Identification
Forged Cheques
Loan Defaulting
False Documentation
Mobile Money Agents25322 97% 2% 0% 0% 0% 0% 0% 0%
Bank Agents 1297 77% 13% 5% 4% 1% 0% 0% 0%
Capital Markets Service Providers
19 7% 0% 0% 7% 54% 32% 0% 0%
Development Finance Service Providers
22 49% 5% 14% 5% 9% 0% 18% 0%
Forex Bureaus 121 61% 0% 5% 15% 15% 4% 0% 0%
Hire Purchase/Leasing/Factoring
24 42% 4% 0% 13% 21% 21% 0% 0%
Insurance Service Provider 107 15% 2% 5% 11% 15% 13% 0% 40%
Micro Finance Institution 52 45% 9% 0% 36% 9% 0% 0% 0%
Money Transfer Services 35 47% 8% 0% 36% 9% 0% 0% 0%
Pension Providers 8 0% 0% 0% 0% 6% 50% 0% 44%
Savings and Credit Co-operative (SACCO)
119 30% 9% 3% 19% 0% 15% 11% 13%

ATM Comparison at Commercial and Mortgage Bank Branches and Micro Finance Bank Branches
86%
14%
Does the Commercial and Mortgage Bank Branch have an ATM Machine (n=1272)
Yes
No
26%
74%
Does the MFB Branch have an ATM Machine (n=168)
Yes
No
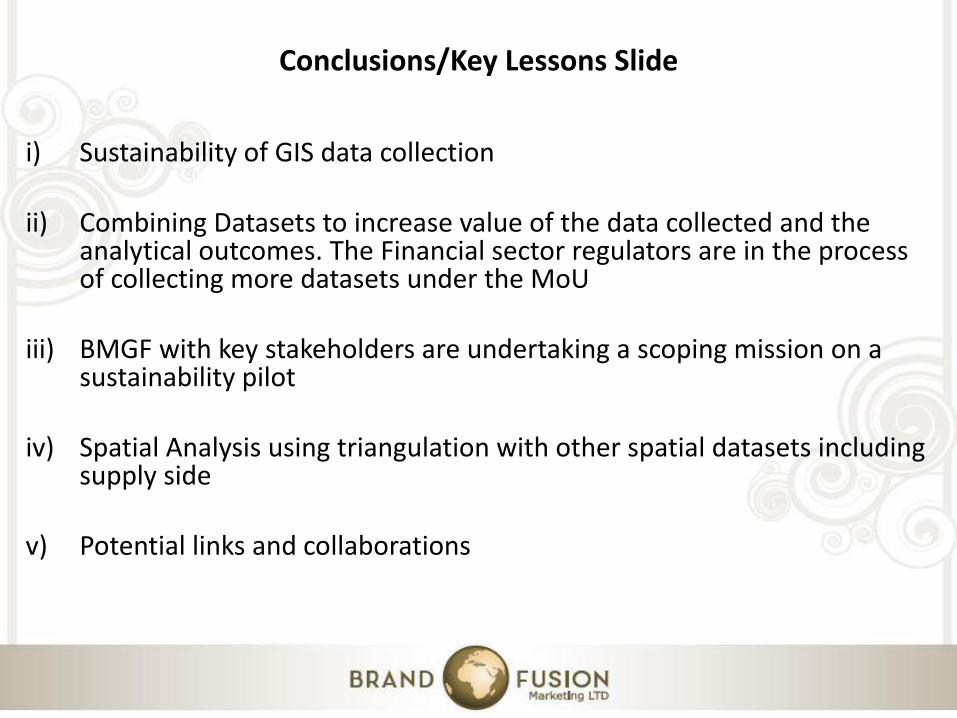
i) Sustainability of GIS data collection
ii) Combining Datasets to increase value of the data collected and the analytical outcomes. The Financial sector regulators are in the process of collecting more datasets under the MoU
iii) BMGF with key stakeholders are undertaking a scoping mission on a sustainability pilot
iv) Spatial Analysis using triangulation with other spatial datasets including supply side
v) Potential links and collaborations
Conclusions/Key Lessons Slide

Full Project Report and Databases
• A Full Project Report as well as individual databases areavailable on written request to CBK
FSPmaps Demo Tool
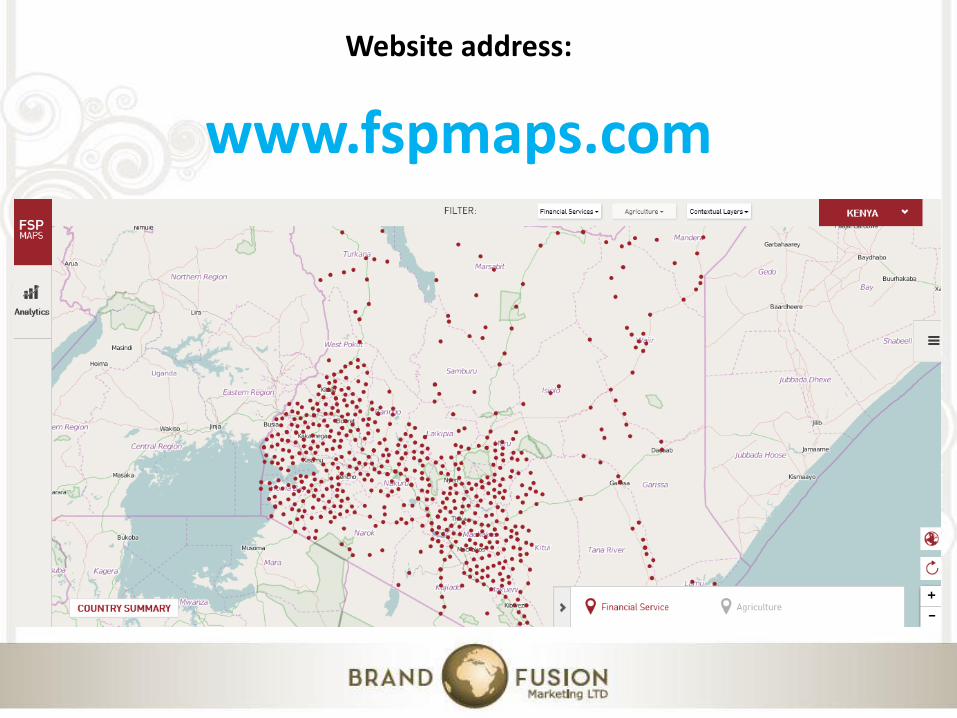
Website address:
www.fspmaps.com
Functions on Fspmaps
1. Clicking on Individual Points
2. Selecting Base Maps
3. Selecting Contextual Layers
4. Analytical tools4.1 Pin drop Radius Buffer4.2 Upload Data

Clicking on Individual Points

Selecting Base Maps

Selecting Contextual Layers

Analytical Tools
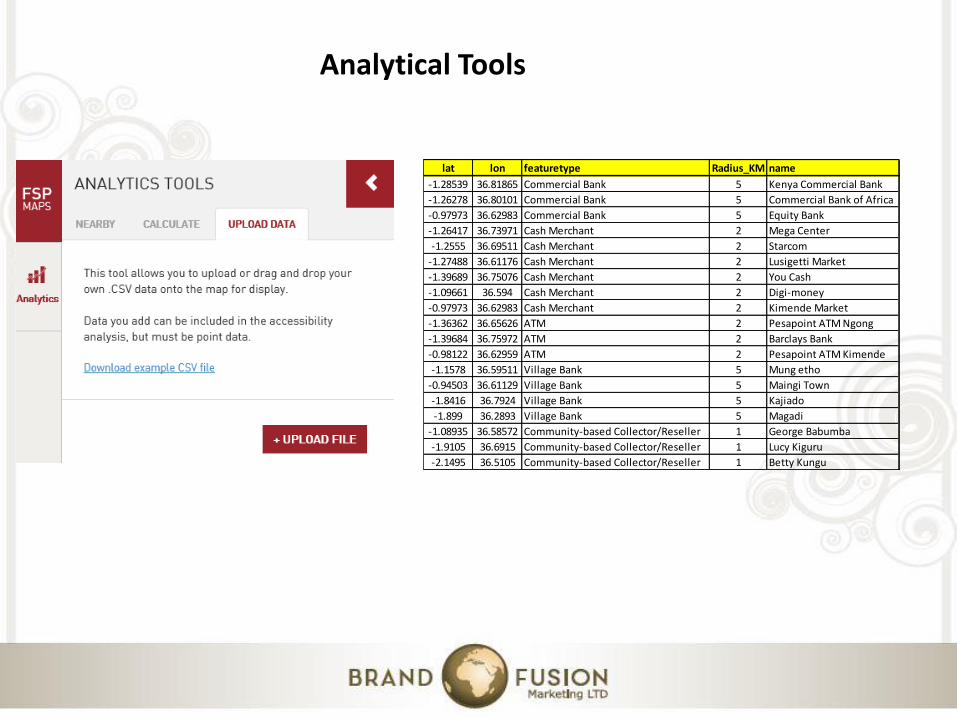
Analytical Tools
lat lon featuretype Radius_KM name
-1.28539 36.81865 Commercial Bank 5 Kenya Commercial Bank
-1.26278 36.80101 Commercial Bank 5 Commercial Bank of Africa
-0.97973 36.62983 Commercial Bank 5 Equity Bank
-1.26417 36.73971 Cash Merchant 2 Mega Center
-1.2555 36.69511 Cash Merchant 2 Starcom
-1.27488 36.61176 Cash Merchant 2 Lusigetti Market
-1.39689 36.75076 Cash Merchant 2 You Cash
-1.09661 36.594 Cash Merchant 2 Digi-money
-0.97973 36.62983 Cash Merchant 2 Kimende Market
-1.36362 36.65626 ATM 2 Pesapoint ATM Ngong
-1.39684 36.75972 ATM 2 Barclays Bank
-0.98122 36.62959 ATM 2 Pesapoint ATM Kimende
-1.1578 36.59511 Village Bank 5 Mung etho
-0.94503 36.61129 Village Bank 5 Maingi Town
-1.8416 36.7924 Village Bank 5 Kajiado
-1.899 36.2893 Village Bank 5 Magadi
-1.08935 36.58572 Community-based Collector/Reseller 1 George Babumba
-1.9105 36.6915 Community-based Collector/Reseller 1 Lucy Kiguru
-2.1495 36.5105 Community-based Collector/Reseller 1 Betty Kungu