final accounts proj-2
DESCRIPTION
Accounts projectTRANSCRIPT

ACCOUNTING FOR MANAGEMENT
PROJECT ON
FINANCIAL STATEMENT ANALYSIS OF
HINDUSTAN UNILEVER LIMITED (HUL)
SUBMITTED TO: DR ROSY KALRA
SUBMITTED BY: GROUP – 5
Saumyah Roll # B- 27
Payal Roll # B- 28
Ruhi Roll # B- 31
Shobhna Roll # B- 32
Nikita Roll # B- 33
Harpreet Roll # B- 34
Anil Roll # B- 45
Saikat Roll # B- 50
Ishween Roll # B- 51
Amity Business SchoolAmity University Uttar Pradesh

TABLE OF CONTENTS
Topics Acknowledgement
Chapter-1
Introduction to HUL
Chapter-2
Profit and Loss Account of HUL
Chapter-3 -
Balance Sheet and Trend Analysis of HUL
Chapter-4
Common –Size Balance Sheet of HUL
Chapter -5
Comparative Statements
Chapter-6
Cash Flow Statement
Chapter -7
Ratio Analysis
Chapter -8
CONCLUSION

ACKNOWLEDGEMENT
We would like to take this opportunity to extend our gratitude to our esteemed faculty
Dr . Rosy Kalra , (Faculty at ABS , MBA-HR) for extending her full support to us throughout this
project. Our heartiest thanks to her for giving us the guidance and support to make this project possible.
We feel privileged to offer our sincere thanks and deep sense of gratitude to our respected
A.D.G Sir - Dr. Sanjay Srivastava , for providing us an environment that helped us in the completion of this
project.
We are grateful for the co-operation , valuable suggestions and hard work rendered by our group members.
This has been a tremendous learning experience for us.
We regret any inadvertent omissions.

Introduction

INTRODUCTION TO HINDUSTAN UNILEVER LIMITED (HUL)
Hindustan Unilever Limited (HUL) is India's largest Fast Moving Consumer Goods Company with a heritage of
over 75 years in India and touches the lives of two out of three Indians.
HUL works to create a better future every day and helps people feel good, look good and get more out of life
with brands and services that are good for them and good for others.
With over 35 brands spanning 20 distinct categories such as soaps, detergents, shampoos, skin care, toothpastes,
deodorants, cosmetics, tea, coffee, packaged foods, ice cream, and water purifiers, the Company is a part of the
everyday life of millions of consumers across India. Its portfolio includes leading household brands such as
Lux, Lifebuoy, Surf Excel, Rin, Wheel, Fair & Lovely, Pond’s, Vaseline, Lakmé, Dove, Clinic Plus, Sunsilk,
Pepsodent, Closeup, Axe, Brooke Bond, Bru, Knorr, Kissan, Kwality Wall’s and Pureit.
The Company has over 15,000 employees and has an annual turnover of Rs.17,523 crores (financial year 2009 -
2010). HUL is a subsidiary of Unilever, one of the world’s leading suppliers of fast moving consumer goods
with strong local roots in more than 100 countries across the globe with annual sales of about €44 billion in
2011. Unilever has about 52% shareholding in HUL.
VISION AND MISSION STATEMENT OF HUL
THEIR VISION
Unilever products touch the lives of over 2 billion people every day – whether that's through feeling great
because they've got shiny hair and a brilliant smile, keeping their homes fresh and clean, or by enjoying a great
cup of tea, satisfying meal or healthy snack.
The four pillars of HUL’s vision set out the long term direction for the company – where they want to go and how they are going to get there:
They work to create a better future every day
They help people feel good, look good and get more out of life with brands and services that are good
for them and good for others.
They will inspire people to take small everyday actions that can add up to a big difference for the world.
They will develop new ways of doing business with the aim of doubling the size of their company while
reducing their environmental impact.
They have always believed in the power of their brands to improve the quality of people’s lives and in doing the
right thing. As their business grows, so do their responsibilities. They recognise that global challenges such as
climate change concern us all. Considering the wider impact of their actions is embedded in their values and is a
fundamental part of who they are.

MISSION STATEMENT OF HUL
HUL’s corporate purpose states that to succeed requires "the highest standards of corporate behaviour towards
everyone they work with, the communities they touch, and the environment on which they have an impact."
ALWAYS WORKING WITH INTEGRITY
Conducting their operations with integrity and with respect for the many people, organisations and
environments HUL’s business touches have always been at the heart of their corporate responsibility.
POSITIVE IMPACT
They aim to make a positive impact in many ways: through their brands, their commercial operations and
relationships, through voluntary contributions, and through the various other ways in which they engage with
society.
CONTINUOUS COMMITMENT
HUL is also committed to continuously improving the way they manage their environmental impacts and are
working towards their long-term goal of developing a sustainable business.
SETTING OUT OUR ASPIRATIONS
Their corporate purpose sets out their aspirations in running their business. It's underpinned by their code of
business Principles which describes the operational standards that everyone at Unilever follows, wherever they
are in the world. The code also supports their approach to governance and corporate responsibility.
WORKING WITH OTHERS
They want to work with suppliers who have values similar to their own and work to the same standards they do.
Their Business partner code, aligned to their own Code of business principles, comprises ten principles covering
business integrity and responsibilities relating to employees, consumers and the environment.

COMPANY STRUCTURE OF HUL
Hindustan Unilever Limited is India's largest Fast Moving Consumer Goods (FMCG) company. It is present in
Home & Personal Care and Foods & Beverages categories. HUL has about 15,000 employees, including over
1400 managers
The fundamental principle determining the organisation structure is to infuse speed and flexibility in decision-
making and implementation, with empotheyred managers across the company’s nationwide operations.
Board of Directors
The Board of Directors as repositories of the corporate powers act as a guardian to the Company as also the protectors of shareholder’s interest.
Management Committee
The day-to-day management of affairs of the Company is vested with the Management Committee which is subjected to the overall superintendence and control of the Board.

INVESTOR RELATIONS OF HUL
“Ensuring returns through sustainable growth”
The company created history when it was listed in the Bombay, Calcutta, and Madras Stock Exchanges in 1956
and offered 10% of its equity to Indian shareholders. It became the first subsidiary of a foreign company in
India to offer equity to the Indian public. Today, HUL shares are listed on the Bombay Stock Exchange and the
National Stock Exchange.
WHAT THEY DO
With their portfolio of strong brands, HUL’s presence across the country, and their long-standing commitment
to ‘shared value creation’, they believe they can achieve their most ambitious goals. They ensure a successful
future by adopting good governance practices and embedding the principle of sustainability in all their business
strategies.
WELL-POISED FOR GROWTH
HUL’s brands – Lifebuoy, Lux, Surf Excel, Rin, Wheel, Fair & Lovely, Sunsilk, Clinic, Close-up, Pepsodent,
Lakme, Brooke Bond, Kissan, Knorr, Annapurna, Kwality Wall’s, and many more –are household names across
the country and span many categories, such as soaps, detergents, personal care, tea, coffee, staples, ice-cream
and culinary products.
Seven hundred million consumers use HUL brands in India in their daily lives. They hold leading market
positions in most of the categories they operate in. They are market leaders in terms of value share in eight
categories and a strong number two in three others. They have an extensive distribution network covering 6.3
million retail outlets, including direct reach to over one million outlets. Their structure is designed to infuse
speed and flexibility in decision-making and implementation, with empowered managers across the company’s
nationwide operations.
REWARDING SHAREHOLDERS
At HUL, they believe in creating long term value for their shareholders. HUL has a history of consistent
dividend payment to its shareholders. As on March 31, 2011, HUL had over 3.5 lakh shareholders, of which
more than 3.4 lakh are retail investors.

To mark the completion of the 75th year of their operation in India, HUL, in 2007, declared a special Platinum
Jubilee Dividend to the shareholders at the rate of INR 3 per share. A share buy-back scheme, announced in the
same year, further strengthened the Earning Per Share (EPS) for the shares of the Company. For 2009-10, HUL
had declared a total dividend of INR 6.5 per share of INR 1 each.
COMMUNICATION TO SHAREHOLDERS
Effective communication of information is an essential component of corporate governance. It is a process of
sharing information, ideas, thoughts, opinions and plans to all stakeholders, and promotes management
shareholder relations. HUL regularly interacts with shareholders through multiple channels of communication,
such as the results announcement, annual report, media releases, company website and other subject specific
communications. Quarterly, half-yearly and annual results are published in leading newspapers. The results are
also made available on the website www.hul.co.in. The website also has vital information related to the
company, official press releases and presentations for analysts.
The Annual General Meeting of Shareholders is an important annual event where the shareholders of the
Company come in direct communication with the Board of Directors and management. The Board engages with
shareholders and answers their queries on varied subjects whether relating to financials, performance of the
Company or otherwise.

Profit and Loss Account of HUL

PROFIT AND LOSS ACCOUNT
Income statement (also referred to as profit and loss statement (P&L), statement of financial performance,
earnings statement, operating statement or statement of operations) is a company's financial statement that
indicates how the revenue (money received from the sale of products and services before expenses are taken
out) is transformed into the net income (the result after all revenues and expenses have been accounted for). It
displays the revenues recognized for a specific period, and the cost and expenses charged against these
revenues, including write-offs (e.g., depreciation and amortization of various assets) and taxes. The purpose of
the income statement is to show managers and investors whether the company made or lost money during the
period being reported.
The important thing to remember about an income statement is that it represents a period of time. This contrasts
with the balance sheet, which represents a single moment in time.
The importance of Profit and Loss account lies in the fact that it provides accounting date which can be used for
some managerial decisions as given below:
Net Result:
It provides information about net profit or net loss earned or incurred by the business during a particular period.
Accounting data for determining efficiency:
Net results provided by the Profit and Loss Account can be compared with the net results of the previous years
and the efficiency of the business can be determined by such inter-period comparison of results.
Control over expenses:
Profit and Loss Account provides information about various kinds of expenses. The expenses of the current year
can be compared with the expenses of the previous year and effective steps can be taken for the control of
expenses, where it becomes necessary.
Future Profit Planning:
Net profit of various years can be taken as basis for future profit-planning. It helps the business in the allocation
of sources and future expansion.

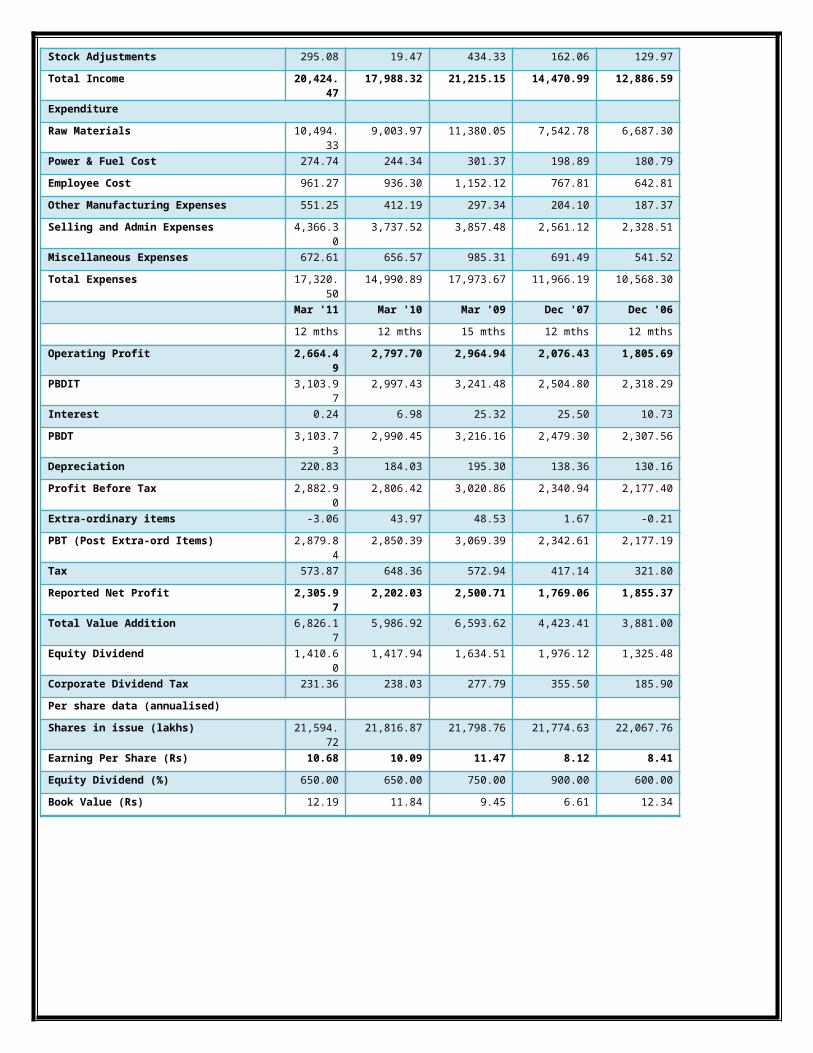
Profit & Loss account of HUL ------------------- in Rs. Cr. -------------------
Mar '11 Mar '10 Mar '09 Dec '07 Dec '06
12 mths 12 mths 15 mths 12 mths 12 mths
Income
Sales Turnover 20,598.89
18,462.34 21,927.23 14,937.88 13,189.70
Excise Duty 908.98 693.22 1,422.95 1,057.32 945.68
Net Sales 19,689.91
17,769.12 20,504.28 13,880.56 12,244.02
Other Income 439.48 199.73 276.54 428.37 512.60
Stock Adjustments 295.08 19.47 434.33 162.06 129.97
Total Income 20,424.47
17,988.32 21,215.15 14,470.99 12,886.59
Expenditure
Raw Materials 10,494.33
9,003.97 11,380.05 7,542.78 6,687.30
Power & Fuel Cost 274.74 244.34 301.37 198.89 180.79
Employee Cost 961.27 936.30 1,152.12 767.81 642.81
Other Manufacturing Expenses 551.25 412.19 297.34 204.10 187.37
Selling and Admin Expenses 4,366.30 3,737.52 3,857.48 2,561.12 2,328.51
Miscellaneous Expenses 672.61 656.57 985.31 691.49 541.52
Total Expenses 17,320.50
14,990.89 17,973.67 11,966.19 10,568.30
Mar '11 Mar '10 Mar '09 Dec '07 Dec '06
12 mths 12 mths 15 mths 12 mths 12 mths
Operating Profit 2,664.49 2,797.70 2,964.94 2,076.43 1,805.69
PBDIT 3,103.97 2,997.43 3,241.48 2,504.80 2,318.29
Interest 0.24 6.98 25.32 25.50 10.73
PBDT 3,103.73 2,990.45 3,216.16 2,479.30 2,307.56
Depreciation 220.83 184.03 195.30 138.36 130.16
Profit Before Tax 2,882.90 2,806.42 3,020.86 2,340.94 2,177.40
Extra-ordinary items -3.06 43.97 48.53 1.67 -0.21
PBT (Post Extra-ord Items) 2,879.84 2,850.39 3,069.39 2,342.61 2,177.19
Tax 573.87 648.36 572.94 417.14 321.80
Reported Net Profit 2,305.97 2,202.03 2,500.71 1,769.06 1,855.37
Total Value Addition 6,826.17 5,986.92 6,593.62 4,423.41 3,881.00
Equity Dividend 1,410.60 1,417.94 1,634.51 1,976.12 1,325.48
Corporate Dividend Tax 231.36 238.03 277.79 355.50 185.90
Per share data (annualised)
Shares in issue (lakhs) 21,594.72
21,816.87 21,798.76 21,774.63 22,067.76
Earning Per Share (Rs) 10.68 10.09 11.47 8.12 8.41
Equity Dividend (%) 650.00 650.00 750.00 900.00 600.00
Book Value (Rs) 12.19 11.84 9.45 6.61 12.34

BALANCE SHEET OF HUL
&
TREND ANALYSIS OF HUL
BALANCE SHEET

In financial accounting, a balance sheet or statement of financial position is a summary of the financial
balances of a sole proprietorship, a business partnership or a company. Assets, liabilities and ownership equity
are listed as of a specific date, such as the end of its financial year. A balance sheet is often described as a
"snapshot of a company's financial condition". Of the four basic financial statements, the balance sheet is the
only statement which applies to a single point in time of a business' calendar year.
A standard company balance sheet has three parts: assets, liabilities and ownership equity. The main categories
of assets are usually listed first, and typically in order of liquidity. Assets are followed by the liabilities. The
difference between the assets and the liabilities is known as equity or the net assets or the net worth or capital
of the company and according to the accounting equation, net worth must equal assets minus liabilities.
The balance sheet assists external users of financial statements in assessing a company's liquidity, financial
flexibility, and operating capabilities, as well as in evaluating the earnings performance for the period. Liquidity
describes the amount of time that is expected to elapse until an asset is realized or otherwise converted into cash
or until a liability has to be paid. Financial flexibility is the ability of an enterprise to take effective action to
alter the amounts and timing of cash flows so it can respond to unexpected needs and opportunities. Operating
and performance capabilities refer to the capability and effectiveness of a company related to its major or
ongoing revenue producing activities.
TREND ANALYSISThe term "trend analysis" refers to the concept of collecting information and attempting to spot a pattern, or trend, in the information. In some fields of study, the term "trend analysis" has more formally-defined meanings. Although trend analysis is often used to predict future events.
Trend analysis is by observing the successive phases of the accounting statements, comparing the amount of the related projects, analyze changes in some indicators of change, on this basis, determine trends, which may occur in the future to anticipate the results of an analytical method. The use of trend analysis, report users can learn the basic trend of changes in the project to determine whether or not this is a favorable trend of change, and to predict the future development of enterprises.
Trend analysis is a method of preparation of financial statements over the years, at least the last 3 years or 5 years, or even 10 years of financial statements are to be tied together in order to observe trends. Observed for several of the financial statements, more than just look at a report on the financial statements, can learn more information and circumstances, and facilitate the analysis of trends.
Trend analysis should be calculated using the percentage trend. There are two trends in the percentage of that ratio and chain set. Fixed ratio is selected as the base period of a year, and then the rest of the year and the base period to calculate the trends in percentage, this can clearly reflects the project and the base period had not changed much. Chain refers to the number of projects this year compared to the number of the previous year, while the percentage of the calculated trend. Because of its previous one as a base, which more clearly illustrates the development of the project the rate of change.
Balance Sheet of HUL ------------------- in Rs. Cr. -------------------
Mar '11 Mar '10 Mar '09 Dec '07 Dec '06
12 mths 12 mths 15 mths 12 mths 12 mths
Sources Of Funds
Total Share Capital 215.95 218.17 217.99 217.75 220.68
Equity Share Capital 215.95 218.17 217.99 217.75 220.68
Reserves 2,417.30
2,364.68 1,842.85 1,220.82 2,502.14
Revaluation Reserves 0.67 0.67 0.67 0.67 0.67
Networth 2,633.92
2,583.52 2,061.51 1,439.24 2,723.49
Secured Loans 0.00 0.00 144.65 25.52 37.13
Unsecured Loans 0.00 0.00 277.30 63.01 35.47
Total Debt 0.00 0.00 421.95 88.53 72.60
Total Liabilities 2,633.92
2,583.52 2,483.46 1,527.77 2,796.09
Mar '11 Mar '10 Mar '09 Dec '07 Dec '06
12 mths 12 mths 15 mths 12 mths 12 mths
Application Of Funds
Gross Block 3,759.62
3,581.96 2,881.73 2,669.08 2,462.69
Less: Accum. Depreciation 1,590.46
1,419.85 1,274.95 1,146.57 1,061.94
Net Block 2,169.16
2,162.11 1,606.78 1,522.51 1,400.75
Capital Work in Progress 299.08 273.96 472.07 185.64 110.26
Investments 1,260.68
1,264.08 332.62 1,440.81 2,522.22
Inventories 2,811.26
2,179.93 2,528.86 1,953.60 1,547.71
Sundry Debtors 943.20 678.44 536.89 443.37 440.37
Cash and Bank Balance 281.91 231.37 190.59 200.11 170.80
Total Current Assets 4,036.37
3,089.74 3,256.34 2,597.08 2,158.88
Loans and Advances 1,099.72
1,068.31 1,196.95 1,083.28 1,150.06
Fixed Deposits 1,358.10
1,660.84 1,586.76 0.75 246.15
Total CA, Loans & Advances 6,494.19
5,818.89 6,040.05 3,681.11 3,555.09
Deffered Credit 0.00 0.00 0.00 0.00 0.00
Current Liabilities 6,264.21
5,493.97 4,440.08 4,028.41 3,362.52
Provisions 1,324.98
1,441.55 1,527.98 1,273.90 1,429.71
Total CL & Provisions 7,589.19
6,935.52 5,968.06 5,302.31 4,792.23
Net Current Assets -1,095.0
0
-1,116.63 71.99 -1,621.20 -1,237.14
Total Assets 2,633.92
2,583.52 2,483.46 1,527.76 2,796.09
Contingent Liabilities 663.00 468.49 417.26 494.46 476.40
Book Value (Rs) 12.19 11.84 9.45 6.61 12.34

TREND ANALYSIS OF HULTrend analysis calculates the percentage change for one account over a period of time of two years or more.
TREND ANALYSIS OF HUL Mar '11 Mar '10
12 mths 12 mths TREND VALUES IN %
Sources Of Funds
Total Share Capital 215.95 218.17 98.98
Equity Share Capital 215.95 218.17 98.98
Reserves 2,417.30 2,364.68 102.23
Revaluation Reserves 0.67 0.67 100
Networth 2,633.92 2,583.52 101.95
Total Debt 0.00 0.00 -
Total Liabilities 2,633.92 2,583.52 101.95
Mar '11 Mar '10
12 mths 12 mths
Application Of Funds
Gross Block 3,759.62 3,581.96 104.96
Less: Accum. Depreciation 1,590.46 1,419.85 112.02
Net Block 2,169.16 2,162.11 100.33
Capital Work in Progress 299.08 273.96 109.17
Investments 1,260.68 1,264.08 99.73
Inventories 2,811.26 2,179.93 128.96
Sundry Debtors 943.20 678.44 139.02
Cash and Bank Balance 281.91 231.37 121.84
Total Current Assets 4,036.37 3,089.74 130.64
Loans and Advances 1,099.72 1,068.31 102.94
Fixed Deposits 1,358.10 1,660.84 81.77
Total CA, Loans & Advances 6,494.19 5,818.89 111.61
Current Liabilities 6,264.21 5,493.97 114.02
Provisions 1,324.98 1,441.55 91.91
Total CL & Provisions 7,589.19 6,935.52 109.42
Net Current Assets -1,095.00 -1,116.63 98.06
Total Assets 2,633.92 2,583.52 101.95
Contingent Liabilities663.00 468.49 141.52
Book Value (Rs) 12.19 11.84 102.96
The TREND VALUES shown in the 3rd column were obtained as follows
¿ Amount of 2011Amount of 2010
X 100
eg¿Total share capital=¿
= 215.95218.17
X 100=¿98.98 %
Similarly we found the %s for the following:
LIABILITIES SIDE:
SOURCEs OF FUND : Total share capital , Reserves , Net worth , Secured loans , Unsecured loans , Total debt , Total Liabilities .
ASSET SIDE:
APPLICATION OF FUNDS : Gross Profit , LESS: Accum. Depreciation , Net Block , Working capital (or) Capital work in progress , Investments ,Inventories , Sundry Debtors , Cash and bank balance , Total current assets , Loans and advances , Fixed deposits , Total CA , Loans and advances , Current Liabilities , Provisions , Total CA and provisions , Net current assets , Total assets , Contingent Liabilities , Book value .

INTREPRETATION OF TREND ANALYSISThe base year trend percentage is always 100.0%. A trend percentage of less than 100.0% means the balance
has decreased below the base year level in that particular year. A trend percentage greater than 100.0% means
the balance in that year has increased over the base year. A negative trend percentage represents a negative
number.

COMMON SIZE BALANCE SHEET OF HUL

COMMON SIZE BALANCE SHEET OF HUL
A common size balance sheet presents not only the standard information contained in a balance sheet, but also a
column that notes the same information as a percentage of the total assets (for asset line items) or as a
percentage of total liabilities and shareholders' equity (for liability or shareholders' equity line items).
It is extremely useful to construct a common size balance sheet that itemizes the results as of the end of multiple
time periods, so that you can construct trend lines to ascertain changes over longer time periods. The common
size balance sheet is also useful for comparing the proportions of assets, liabilities, and equity between different
companies, particularly as part of an industry analysis.
Comparative Balance Sheet of HUL Mar '11% of balance
sheet total ‘11Mar '10 % of balance
sheet total ‘10
12 mths12 mths
Sources Of Funds
Total Share Capital 215.95 8.19 218.17 8.44
Equity Share Capital 215.95 8.19 218.17 8.44
Reserves 2,417.30 91.78 2,364.68 91.53
Networth 2,633.92 100 2,583.52 100
Total Liabilities 2,633.92 100 2,583.52 100
Mar '11 Mar '10
12 mths 12 mths
Application Of Funds
Gross Block 3,759.62 3,581.96
Less: Accum. Depreciation (1,590.46) (1,419.85)
Net Block 2,169.16 82.35 2,162.11 83.69
Capital Work in Progress 299.08 11.35 273.96 10.60
Investments 1,260.68 47.86 1,264.08 48.93
Inventories 2,811.26 106.73 2,179.93 84.38
Sundry Debtors 943.20 35.81 678.44 26.26
Cash and Bank Balance 281.91 10.70 231.37 8.96
Total Current Assets 4,036.37 153.25 3,089.74 119.60
Loans and Advances 1,099.72 41.75 1,068.31 41.35
Fixed Deposits 1,358.10 51.56 1,660.84 64.29
Total Assets 2,633.92 100 2,583.52 100
METHOD
Here we need to calculate the % of the following items out of 100.
Hence we take total liabilities and total assets as 100 %
Eg) to calculate for total share capital we do:
=215. 95
2633 .92X 100
¿8.19
Thus we write 8.19 in the column of “ % of balance sheet” therefore total share capital is 8.19% of 100 % and so on wedo the rest.

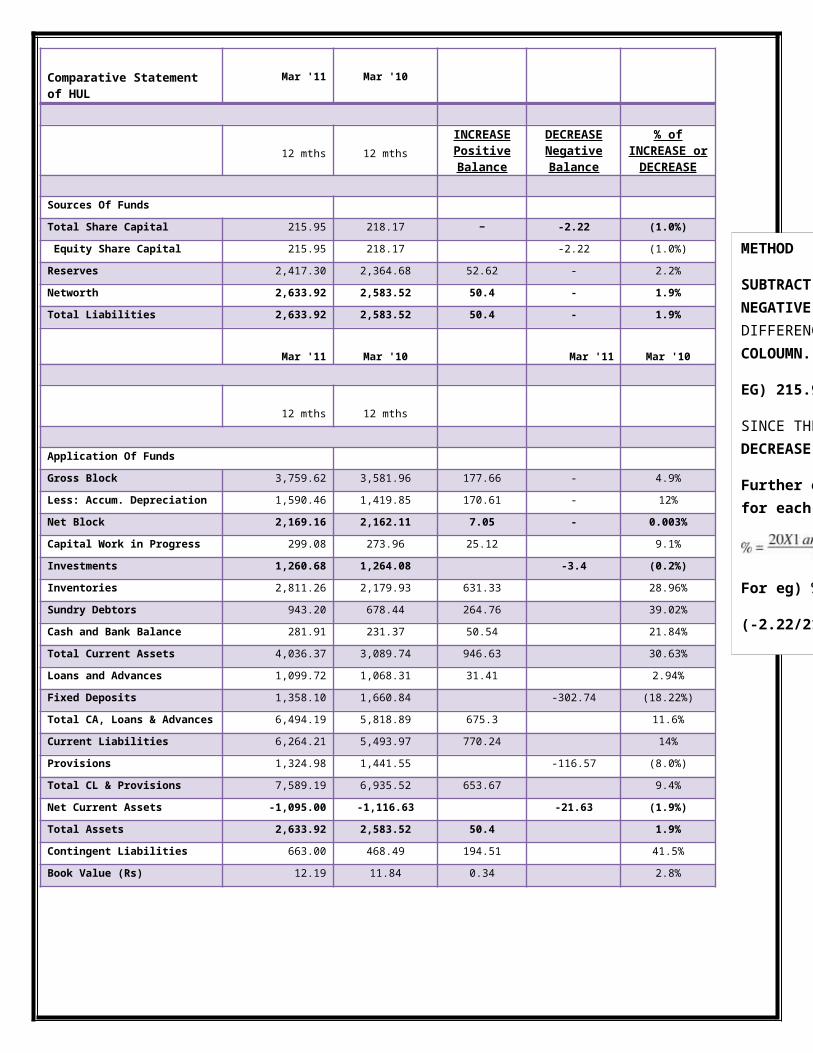
COMPARATIVE STATEMENT OF HUL
COMPARATIVE STATEMENT ANALYSIS :
Comparative Financial Statement analysis provides information to assess the direction of change in the
business. Financial statements are presented as on a particular date for a particular period. The financial
statement Balance Sheet indicates the financial position as at the end of an accounting period and the financial
statement Income Statement shows the operating and non-operating results for a period. But financial managers
and top management are also interested in knowing whether the business is moving in a favorable or an
unfavorable direction. For this purpose, figures of current year have to be compared with those of the previous
years. In analyzing this way, comparative financial statements are prepared.
Comparative Financial Statement Analysis is also called as Horizontal analysis. The Comparative Financial
Statement provides information about two or more years' figures as well as any increase or decrease from the
previous year's figure and it's percentage of increase or decrease. This kind of analysis helps in identifying the
major improvements and weaknesses. For example, if net income of a particular year has decreased from its
previous year, despite an increase in sales during the year, is a matter of serious concern. Comparative financial
statement analysis in such situations helps to find out where costs have increased which has resulted in lower
net income than the previous year.
The benefits of a comparative statement are varied for a corporation. Because of the uniform format of the
statement, it is a simple process to compare the gross sales of a given product or all products of the
company with the gross sales generated in a previous month, quarter, or year. Comparing generated
revenue from one period to a different period can add another dimension to analyzing the effectiveness of
the sales effort, as the process makes it possible to identify trends such as a drop in revenue in spite of an
increase in units sold.To calculate the Comparative Financial Statement percentage change between two
periods:
Calculate the amount of the increase/(decrease) for the period by subtracting the earlier year(2010) from the later year(2011). If the difference is negative, the change is a decrease and if the difference is positive, it is an increase.
Divide the change by the earlier year's balance(,i.e., 2010). The result is the percentage change.
2010 is the earlier year so the amount in the 2010 column is subtracted from the amount in the 2011 column.
The percent change is the increase or decrease divided by the earlier amount (20X0 in this example) times 100. Written as a formula, the percent change is:
If the earliest year is zero or negative, the percent calculated will not be meaningful. N/M is used in the above table for not meaningful.

METHOD
SUBTRACT values of 2011 from 2010: AMOUNT IN THEFIGURE IN THE
EG) 215.95 – 218.17 = -2.22
SINCE THE amount obtained is
Further on for % increase or decreas we divide the difference so obtained for each item by the amount of 2010 and multiply with 100.
For eg) % decrease of Total Share Capital from 2010 to 2011 is
(-2.22/218.7 x 100) = (1.0%)
Comparative Statement of HUL Mar '11 Mar '10
12 mths 12 mthsINCREASE
Positive Balance
DECREASENegative Balance
% of INCREASE or DECREASE
Sources Of Funds
Total Share Capital 215.95 218.17 − -2.22 (1.0%)
Equity Share Capital 215.95 218.17 -2.22 (1.0%)
Reserves 2,417.30 2,364.68 52.62 - 2.2%
Networth 2,633.92 2,583.52 50.4 - 1.9%
Total Liabilities 2,633.92 2,583.52 50.4 - 1.9%
Mar '11 Mar '10 Mar '11 Mar '10
12 mths 12 mths
Application Of Funds
Gross Block 3,759.62 3,581.96 177.66 - 4.9%
Less: Accum. Depreciation 1,590.46 1,419.85 170.61 - 12%
Net Block 2,169.16 2,162.11 7.05 - 0.003%
Capital Work in Progress 299.08 273.96 25.12 9.1%
Investments 1,260.68 1,264.08 -3.4 (0.2%)
Inventories 2,811.26 2,179.93 631.33 28.96%
Sundry Debtors 943.20 678.44 264.76 39.02%
Cash and Bank Balance 281.91 231.37 50.54 21.84%
Total Current Assets 4,036.37 3,089.74 946.63 30.63%
Loans and Advances 1,099.72 1,068.31 31.41 2.94%
Fixed Deposits 1,358.10 1,660.84 -302.74 (18.22%)
Total CA, Loans & Advances 6,494.19 5,818.89 675.3 11.6%
Current Liabilities 6,264.21 5,493.97 770.24 14%
Provisions 1,324.98 1,441.55 -116.57 (8.0%)
Total CL & Provisions 7,589.19 6,935.52 653.67 9.4%
Net Current Assets -1,095.00 -1,116.63 -21.63 (1.9%)
Total Assets 2,633.92 2,583.52 50.4 1.9%
Contingent Liabilities 663.00 468.49 194.51 41.5%
Book Value (Rs) 12.19 11.84 0.34 2.8%

CASH FLOW STATEMENT OF HUL

CASH FLOW STATEMENT
Complementing the balance sheet and income statement, the cash flow statement (CFS), a mandatory part of a
company's financial reports since 1987, records the amounts of cash and cash equivalents entering and leaving a
company. The CFS allows investors to understand how a company's operations are running, where its money is
coming from, and how it is being spent.
The cash flow statement is partitioned into three segments, namely: 1) cash flow resulting from operating activities; 2) cash flow resulting from investing activities;and 3) cash flow resulting from financing activities.
The money coming into the business is called cash inflow, and money going out from the business is called cash outflow.
Operating activities
Operating activities include the production, sales and delivery of the company's product as well as collecting payment from its customers. This could include purchasing raw materials, building inventory, advertising, and shipping the product
Investing activities
Examples of Investing activities are purchase or sale of an asset (assets can be land, building, equipment, marketable securities, etc.) , loans made to suppliers or received from customers , payments related to mergers and acquisitions
Financing activities
Financing activities include the inflow of cash from investors such as banks and shareholders, as well as the outflow of cash to shareholders as dividends as the company generates income. Other activities which impact the long-term liabilities and equity of the company are also listed in the financing activities section of the cash flow statement.
A company can use a cash flow statement to predict future cash flow, which helps with matters in budgeting. For investors, the cash flow reflects a company's financial health: basically, the more cash available for business operations, the better. However, this is not a hard and fast rule. Sometimes a negative cash flow results from a company's growth strategy in the form of expanding its operations.

By adjusting earnings, revenues, assets and liabilities, the investor can get a very clear picture of what some people consider the most important aspect of a company: how much cash it generates and, particularly, how much of that cash stems from core operations.
Cash Flow StatementFor the year ended 31st March, 2011
For the year ended31st March, 2011
For the year ended31st March, 2010
A Cash Flow from Operating Activities :Profit before taxation and exceptional / extra-ordinary items
2,730.18 2,707.07
Adjustments for :Depreciation 220.83 184.03Surplus on disposal of investment(net)
(60.21) (19.54)
Deficit on disposal of fixed assets(net)
5.93 7.19
Interest income (115.68) (93.91)Dividend income (76.06) (34.65)Interest expenditure 0.24 6.98
(24.95) 50.10
Operating Profit before Working Capital Changes
2,705.23 2757.17
Adjustments for :Trade and Other Receivables
(319.06) (7.47)
Inventories (631.33) 348.92
Trade Payables and Other Liabilities
796.96 1,096.14
(153.43) 1,437.59Cash generated from operations
2,551.80 4,194.76
Taxes paid (net of refunds) (652.41) (661.74)Cash flow before exceptional / extraordinary items
1,899.39 3,533.02
Exceptional :Compensation paid under Voluntary Separation Schemes (previous yearincludes amount paid for an industrial dispute relating to a closed factory)
(0.86) (84.97)
Transitional cost due to consolidation of offices / factories
– (6.65)
Amounts paid for other restructuring activities
(7.96) (0.38)
Net Cash from Operating Activities ..........................A
1,890.57 3,441.02
B Cash Flow from Investing Activities :Purchase of fixed assets (309.65) (570.08)
Sale of fixed assets 10.46 13.27
Purchase of investments (15,658.70) (6,128.94)
Investment in subsidiary Company
(10.10) (5.15)
Advances to subsidiaries (18.30) (9.65)Advances repaid by subsidiaries
- 1.00
Sale of investments 15,743.54 5,207.15
Interest received 97.00 96.55
Dividend received 76.06 34.65Cash flow before exceptional / extraordinary items
(69.69) (1,361.20)
Exceptional :Consideration received on disposal of unused land and building (includingresidential properties)
160.41 100.77
Consideration received on disposal of a long term investment
44.27 91.13
Consideration received on sale of a business to a subsidiary (includingnon-compete fees)
– 3.30
Consideration received on disposal of a subsidiary
– 19.89
Net Cash from Investing Activities ............................B
134.99 (1,146.11)
C Cash Flow from Financing Activities :Dividends paid (1,420.03) (1,523.27)
Tax on distributed profits (235.58) (259.39)
Interest paid (0.24) (6.98)
Bank overdrafts, etc (net) – (49.37)
Proceeds from share allotment under Employee Stock Option Scheme
6.51 31.27
Payment towards Buyback of Shares
(625.30) –
Repayments of borrowings – (372.58)Exceptional :Costs incurred for Share buyback activity
(3.11) –
Net Cash used in Financing Activities........................C
(2,277.75) (2,180.32)

Net Increase in Cash and Cash equivalents....... (A+B+C)
(252.19) 114.59
Cash and Cash equivalents as at 1st April (Opening Balance)
1,892.21 1,777.35
Cash and Cash equivalents as at period end (Closing Balance)
1,640.01 1,892.21
Cash and Cash equivalents comprise:
Cash on hand 1.02 1.06
Cheques on hand 1.35 49.11
Balance with Scheduled banks
1,637.64 1,842.04
1,640.01 1,892.21
RATIO ANALYSIS OF HUL

FINANCIAL RATIOS :
A tool used by individuals to conduct a quantitative analysis of information in a company's financial statements.
Ratios are calculated from current year numbers and are then compared to previous years, other companies, the
industry, or even the economy to judge the performance of the company. Ratio analysis is predominately used
by proponents of fundamental analysis.
Financial Ratios can be divided into five categories:
Liquidity (Solvency) ratios
Financial Leverage (Debt) ratios
Asset Efficiency (Management or turnover) ratios
Profitability ratios
Market value ratios
The liquidity or solvency ratios focus on a firm's ability to pay its short-term debt obligations. As such,
they focus on the firm's current assets and current liabilities on the balance sheet.
The most common liquidity ratios are the current ratio, the quick ratio, and the burn rate (interval
measure).
The financial leverage or debt ratios focus on a firm's ability to meet its long-term debt obligations. It
looks at the firm's long term liabilities on the balance sheet such as bonds.
The most common financial leverage ratios are the total debt ratios, the debt/equity ratio, the long-term
debt ratio, the times interest earned ratio, the fixed charge coverage ratio, and the cash coverage ratio.
The asset efficiency or turnover ratios measure the efficiency with which the firm uses its assets to
produce sales. As a result, it focuses on both the income statement (sales) and the balance sheet (assets).
The most common asset efficiency ratios are the inventory turnover ratio, the receivables turnover ratio,
the days' sales in inventory ratio, the days' sales in receivables ratio, the net working capital ratio, the
fixed asset turnover ratio, and the total asset turnover ratio.

The profitability ratios are just what the name implies. They focus on the firm's ability to generate a
profit and an adequate return on assets and equity. They measure how efficiently the firm uses its assets
and how effectively it manages its operations.
The market value ratios can only be calculated for publicly traded companies as they relate to stock
price. The most commonly used market value ratios are the price/earnings ratio and the market-to-book
ratio.
These ratios allow you to compare your firm to others in your industry. They also allow you to compare
different time periods of data for your firm to each other.
ANALYZING THE BALANCE SHEET WITH RATIOS
With a greater understanding of the balance sheet and how it is constructed, we can look now at some
techniques used to analyze the information contained within the balance sheet. The main way this is done is
through financial ratio analysis.
Financial ratio analysis uses formulas to gain insight into the company and its operations. For the balance sheet,
using financial ratios (like the debt-to-equity ratio) can show you a better idea of the company’s financial
condition along with its operational efficiency. It is important to note that some ratios will need information
from more than one financial statement, such as from the balance sheet and the income statement.
The main types of ratios that use information from the balance sheet are financial strength ratios and activity
ratios. Financial strength ratios, such as the working capital and debt-to-equity ratios, provide information on
how well the company can meet its obligations and how they are leveraged. This can give investors an idea of
how financially stable the company is and how the company finances itself. Activity ratios focus mainly on
current accounts to show how well the company manages its operating cycle (which include receivables,
inventory and payables). These ratios can provide insight into the company's operational efficiency.

RATIOS:
CURRENT RATIO =Current asset/Current liabilities
2011 20104036.37/6264.21=0.64 3089.74/5493.97=0.56
LIQUIDITY RATIO= liquid assets/ Current liabilities
liquid assets= Current assets-stock-prepaid expenses
2011 20101225.11/6264.21=0.195 910.41/5493.97=0.165
PROFITIBILITY RATIO
a) GROSS PROFIT MARGIN
Gross profit/net sales* 100
G.P. = net sales- COGS
COGS=stock+ purchases+ direct expense
b) NET PROFIT MARGIN
net profit ratio: net profit/net sales *100
2011 201011.71 (2169.16/19689.91)*100 12.39 (2202.3/17769.12)*100
Share holder’s equity ratio:
shareholder’s equity/ total assets
March 11 March 10215.95/2633.92 =0.081
218.17/2583.52 =0.084

RETURN ON CAPITAL EMPLOYED= PBIT/CAPITA EMPLYOED*100
Capital employed= Net fixed asset + current assets – current liabilities
March 11 March 103103.97/2468.24+4036.37-6264.21 =1291.16
2997.43/2436.07+3089.74-5493.97 =9414.03
TURNOVER RATIO
DEBTORS TURNOVER RATIO = NET CREDIT SALES/AVERAGE ACC RECEIVABLE
STOCK TURNOVER RATIO = COGS/AVERAGE STOCK
TOTAL ASSETS TURNOVER RATIO=NET SALES/NET FIXED ASSET
March 11 March 1019689.91/2468.24 =7.97
17769.12/2436.07 =7.29
LEVERAGE RATIO
DEBT EQUITY RATIO= DEDT/ EQUITY
= 0/215.35+2417.30+0.67 = 0 FOR 2011 AND 2010
VALUATION RATIO
RETURN ON EQUITYEARNINGS PER SHARE=
NET PROFIT AFTER TAX- PREFERENCE DIVIDEND/NO OF EQUITY SHARE
March 11 March 102305.97/21594.72 =10.68
2202.03/21816.87 =10.09
PRICE TO EARNINGS RATIO =MARKET PRICE PER SHARE/EPS
