final cip update sfy 2020-2024 - massachusetts
TRANSCRIPT

1
Final CIP Update SFY 2020-2024 Joint Boards presentationJune 17, 2019
Draft 6/14/19

2
Overview
• Since last meeting:• Held public meetings and completed comment period• Complete draft equity analysis• Updated sources• Updated projects / spending
• Today:• Need vote on final CIP by Joint Boards

3
Stateplans
Regional plans
Prioritization
Investment plans
Projects in CIP
Implementation
Modal Planning/Corridor Studies• Commuter Rail Vision• Bicycle and Pedestrian Plans• Freight and Rail Plans• Water Transportation Study• !-91 Viaduct Study• Cape Cod Canal Study• Focus40
Regional Transportation Plans• Long Range Transportation Plan• Commuter Rail Vision
Project Specific Planning• Lynn Transit Action Plan• Better Bus Project• Green Line Capacity• Mattapan High Speed Line
Investment Plans• Capital Investment Plan• State Transportation Improvement Plan
Planning Processes and Public OutreachState/Regional Modal/Project PlanningOpportunities for public input
Public participation at the local level to identify needs in their communities and participate in planning exercises
Public participation at projectspecific planning to help shape project concepts or plans
Public can weigh in at MPO meetings where regional prioritiesare set
Public can weigh in at CIP public meetings as draft plans are presented
CIP Investments• List of prioritized projects for each Division• Included for funding over the five years

4
Public engagementPhase 1:• Focus on stakeholders – both established and newly identified, across all divisions and modes
• These efforts included non-traditional attendees such as civic organizations, councils on aging, community organizations, and faith groups
• Direct outreach in person and electronically • Outreach was focused on educating general public about the CIP and how they can get involved in the CIP
process
Phase 2:• 13 public meetings across the Commonwealth
• The kickoff meeting (held in Boston) was live-streamed and made available for replay to encourage participation from those who could not be physically present at a meeting
• The meeting has received 106 views as of June 10th
• One meeting held jointly with MPO (Berkshire)• MPOs participated in public meetings (Boston, Braintree, Falmouth, Springfield, Leominster, Pittsfield)• Modest turnout at each meeting: approximately 12 participants/meeting
• Additional Meetings• Legislative Briefing - 46 participants• Massachusetts Municipal Association – 9 participants
• Two online comment tools – online maps and participate tab in the CIP document• Letters, emails, and phone calls• 934 Comments received through June 11th (meetings, letters, emails, phone, and online from CIP document)

5
Public input process and CIP Public Meeting Schedule• 13 public meetings across the Commonwealth
• Tuesday May 21th – Boston(This meeting was streamed live and recorded for future viewing)
• Tuesday May 21th – Danvers • Wednesday May 22th – Falmouth• Thursday May 23rd – Braintree• Thursday May 23rd – Fall River• Tuesday May 28th – Pittsfield (with Berkshire MPO)• Wednesday May 29th – Natick• Thursday May 30th – Lowell• Thursday May 30th – Chelsea• Monday June 3rd – Leominster• Tuesday June 4th – Roxbury• Wednesday June 5th – Worcester• Thursday June 6th – Springfield
• Online comment tools• Comments accepted directly on proposed projects• Emails & letters

6
Recap of Public comments: Key Highlights by Division• Aeronautics
• No comments received
• Highway• Support for replacement of the Sagamore and Bourne Bridges over the Cape Cod Canal • Requests for installation of suicide prevention barriers on French King Bridge to address serious public
safety concerns• Positive feedback on the increased prioritization of investments in bicycle/pedestrian accommodations and
rail trails across the Commonwealth• Support for study to bring the Quequechan River and Falls in Fall River back to the surface (previously
buried by roadway projects)• Requests for reconstruction of McGrath Highway at grade in Somerville• Requests for signals at three intersections along Main Street in Medford
• Registry of Motor Vehicles• Support for relocation of RMV South Yarmouth facility to Hyannis Cape Cod Regional Transit Authority
facility
• Rail Group• Continued support for electric option (full build) for South Coast Rail• General Support for East-West Rail with requests to extend to the Berkshires
• Transit Group• Support for accessible transit infrastructure improvements on RTA buses• Support for greater connectivity between RTA networks (PVTA and WRTA)
• General• Requests for increased annual funding for Chapter 90 program to address increases in construction costs
and materials (level funding results in few dollars available for eligible projects)• Support for additional pre-apprenticeship program funding to support training programs in underserved
communities, particularly for women, and men of color• Program has been extremely beneficial in training and providing job opportunities in the construction industry for
individuals in underserved communities

7
Recap of Public comments: Key Highlights by Division• MBTA
• Positive feedback on the Red/Blue Connector to support connectivity, reduce crowding, reduce congestion, and promote economic growth Increasing First/Last Mile connections
• Support for Bus improvements, including electric bus procurements, bus shelters, dedicated bus lanes, and route improvements
• Mattapan Trolley (High Speed Line):• Support for historic nature of the Mattapan Trolleys
• Support for upgrading it to a rapid transit line and/or extension of Ashmont Branch
• Station Improvements and Accessibility:• Wakefield Station• Broadway Station• Forest Hills Station• Auburndale, West Newton and Newtonville Stations• First/Last Mile options for the elderly and riders with disabilities• General support for redesigning and/or building stations to be fully accessible
(Elevator Program, Plan for Accessible Transit Infrastructure [PATI])• Haverhill City Council unanimously endorsed relocation of Bradford MBTA Layover Station• Comments on different Automated Fare Collection 2.0 fare policy approaches• Support for Green Line Extension and Capacity Study and 14’ feet width for Community Path• Support for electrification of Commuter Rail• Support for North-South Rail Link• Support for third track feasibility study for Framingham-Worcester Commuter Rail

8
Public Meeting Attendance
0
5
10
15
20
25
30
35
1 2 3 4 5 6 7 8 9 10 11 12 13
Public Meeting Attendance
Series1 Series2

9
Public Meeting Outreach

10
CIP comments received*
*As of June 11, 2019, a total of 934 were received
4
104
118
243
564
0
100
200
300
400
500
600
1 2 3 4 5 6
Number of Comments Received
221
934
1 2
Comments By CIP Year

11
Distribution of CIP Comments by Division
1, 410
2, 313
3, 37
4, 51%
5, 20%
6, 167
Chart Title
1 2 3 4 5 6
18%
44%
33%
4%

12
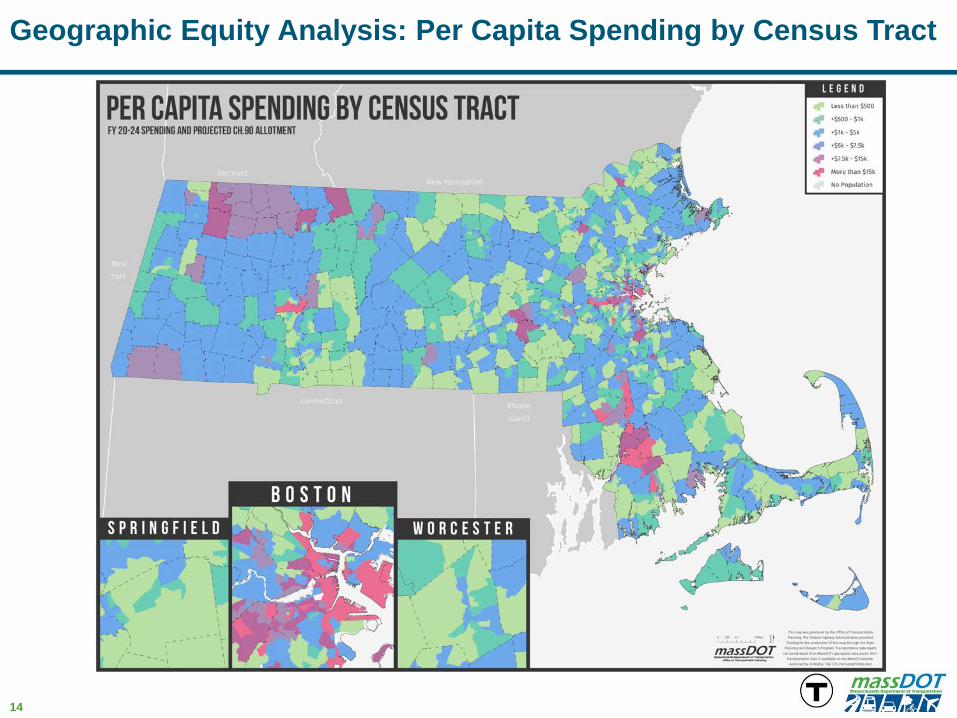
Equity Analysis: Conclusions2020-2024 CIP Equity Analysis: • This year’s analysis continues to represent an incremental evolution of the process, including:
• Investments analyzed not only in the aggregate but also by mode and by investment category • Variable buffering was used to analyze impacts of CIP investments depending upon the location (rural, suburban,
urban) and mode (Transit – RTA/MBTA, Highway, Rail, Aeronautics)• Any disparities in aggregate funding levels are below the 20% DI/DB Threshold
• MBTA investments vis-à-vis disability communities are the only outlier, at 33%, though this analysis does not currently incorporate accessibility project scores, PATI project identification and prioritization, nor recent significant accessibility improvements to the MBTA system, such as station reconstruction (Government Center)
• The totality of investments appear to distribute funding in a manner that effectively benefits the diverse populations of theCommonwealth
• At the modal and project category levels of analysis, there are examples of investments that benefit Title VI and EJ communities as well as those that benefit non-Title VI and non-EJ communities, suggesting overall equity in the capital investment strategy
Process Improvements for Future CIP Equity Analyses: • Review prior capital plans (starting with the 2017-2021 CIP) to compare investments made across the Commonwealth for both
geographic and social equity analyses
• Municipal portal is under development that will provide additional clarity to investments made for Chapter 90, Complete Streets and Small Municipal Bridge projects at the municipal level
• Investments made under these programs at the municipal level will then be captured as part of the equity analysis• Variable buffers will be used at the project type level to further understand impacts of investments• Total universe of assets will be analyzed and compared to proposed investments
• Total universe of potential projects will be digitized to facilitate development of future plans and analysis; universe to be linked to online comment tool to solicit public feedback
• Further work on conceptualizing how to capture investments made by the individual RTAs in their system routes• Analysis and capture of the universe of eligible funding at the municipal level

13
• Communities with 24% minority or more• Total MassDOT investments in non-minority
communities are approximately 18% greater per capita than minority communities.
• Total difference is less than 20% DI/DB* threshold
• Highway investments are nearly equal • RTA investments provide 22% more funding to
minority communities. • MBTA investments in minority communities are
approximately 52% greater than non-minority communities.
• Communities with 6.25% or more of population that are LEP
• Total MassDOT investments in non-LEP communities are approximately 18% greater per capita than LEP communities.
• Total difference is less than 20% DI/DB threshold
• MBTA investments in LEP communities are approximately 34% greater per capita than non-LEP communities.
• Median income at or below $44,100** • Total MassDOT investments in low-income
communities are approximately 12% greater per capita than non-low-income communities.
• Low-income communities receive 75% greater per capita investment in RTAs, and 24% greater per capita investment from the Highway Division
• MBTA investments in non-low-income communities are approximately 6% greater per capita than low-income communities.
• Total difference is less than 20% DI/DB threshold*
• Communities with 11% or more of individuals with disabilities
• Total MassDOT investments in disability communities are approximately 25% greaterper capita than non-disability communities.
• MBTA investments in non-disability communities are approximately 33% greaterper capita than disability communities.
• This exceeds the 20% DI/DB threshold* but only reflects investments directly in disability communities as defined, and does not adequately capture system-wide improvements to accessibility.
Minority communities* Low-income*
Limited English Proficiency* Disability communities*
*DI/DB threshold stands for Disparate Impact/Disproportionate BurdenThreshold
Social Equity Analysis: Summary
14
Geographic Equity Analysis: Per Capita Spending by Census Tract

15
Social Equity: Per Capita Spending in Environmental Justice Area
16
Sources update
• Other state funds• Commonwealth (DEP) has received funds from settlement of the
lawsuit against Volkswagen for falsification of emissions data• Funds can be used on eligible investments that reduce emissions e.g.
electric buses and charging facilities• MassDOT has been allocated $10.9 million for FY 20 for transit
investments in electric vehicles and supporting infrastructure
17
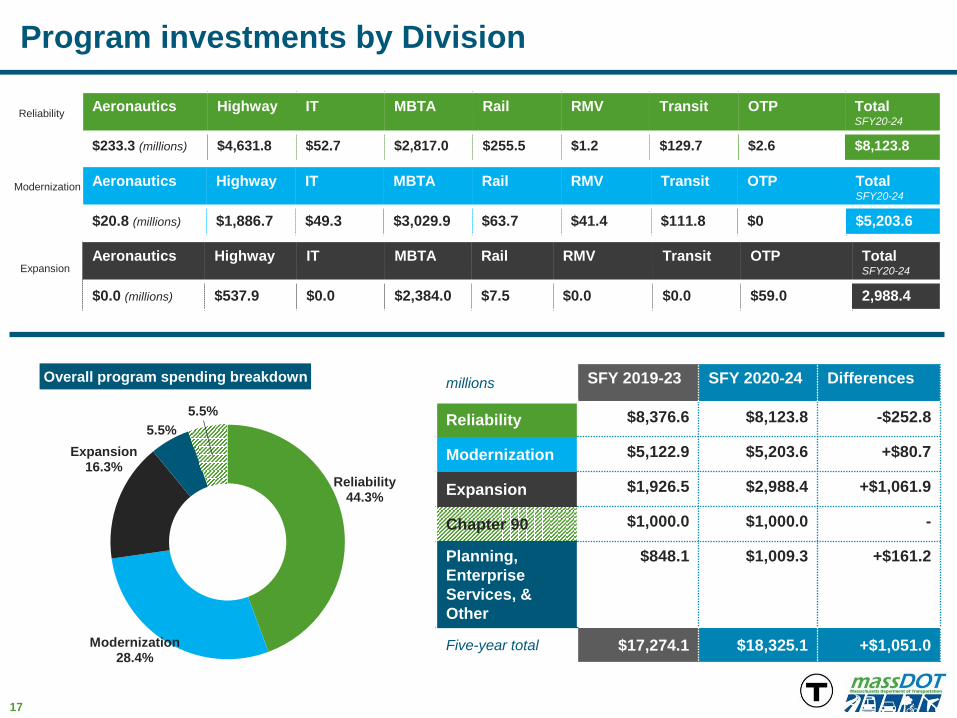
Program investments by Division
Aeronautics Highway IT MBTA Rail RMV Transit OTP Total SFY20-24
$20.8 (millions) $1,886.7 $49.3 $3,029.9 $63.7 $41.4 $111.8 $0 $5,203.6
Aeronautics Highway IT MBTA Rail RMV Transit OTP Total SFY20-24
$0.0 (millions) $537.9 $0.0 $2,384.0 $7.5 $0.0 $0.0 $59.0 2,988.4
Reliability44.3%
Modernization28.4%
Expansion16.3%
5.5%5.5%
Overall program spending breakdown millions SFY 2019-23 SFY 2020-24 Differences
Reliability $8,376.6 $8,123.8 -$252.8
Modernization $5,122.9 $5,203.6 +$80.7
Expansion $1,926.5 $2,988.4 +$1,061.9
Chapter 90 $1,000.0 $1,000.0 -
Planning,EnterpriseServices, & Other
$848.1 $1,009.3 +$161.2
Five-year total $17,274.1 $18,325.1 +$1,051.0
Aeronautics Highway IT MBTA Rail RMV Transit OTP Total SFY20-24
$233.3 (millions) $4,631.8 $52.7 $2,817.0 $255.5 $1.2 $129.7 $2.6 $8,123.8
Reliability
Modernization
Expansion
18
Spending updates• Aeronautics Division – no changes• Highway Division
• MPOs have endorsed all TIPs and they will be reflected in the final draft CIP Update presented to the Joint Boards on June 17
• IT – no changes• MBTA – no significant changes• Rail and Transit Division
• VW funds will be used to procure electric buses and supporting facilities for Greater Attleboro-Taunton Regional Transit Authority ($4.6 million)

19
MassDOT spending by source (Draft vs. Final)Projected sources (in millions) Draft FY 20 Final FY 20 Delta Draft
5-year TotalFinal
5-year Total Delta
Federal sources of funds
Federal Highway (FHWA) reimbursements $775.3 $771.4 ($3.9) $4,137.0 $4,139.0 $2.0
Federal Transit (FTA) reimbursements** $6.0 $6.0 $ - $30.2 $30.2 $ -
Federal Aviation (FAA) reimbursements and grant draws $36.2 $36.2 $ - $176.1 $176.1 $ -
Federal Rail (FRA) reimbursements and grant draws $5.9 $5.9 $ - $13.1 $13.1 $ -
Subtotal federal sources* $823.4 $819.5 ($3.9) $4,356.4 $4,358.4 $2.0
Bond cap $854.8 $854.8 $ - $4,315.0 $4,315.0 $ -
Accelerated Bridge bonds $5.1 $7.2 $2.1 $5.1 $7.2 $2.1
Rail enhancement bonds $34.4 $16.9 ($17.5) $65.3 $40.4 ($24.9)
CARM $29.4 $23.8 ($5.6) $227.4 $223.4 ($4.0) Metropolitan Highway system (MHS) pay-go $74.7 $72.6 ($2.1) $437.4 $423.4 ($14.0)
Western Turnpike (WT) pay-go $104.0 $59.7 ($44.6) $559.2 $558.6 ($0.6)
Tobin Bridge (Tobin) pay-go $27.4 $24.3 ($3.1) $102.7 $103.0 $0.3
Reimbursable and 3rd parties $6.3 $6.3 $ - $25.4 $25.4 $ -
Municipal and local funds $ - $ - $ - $17.5 $14.3 ($3.2)
Public private partnerships $ - $ - $ - $ - $ - $ -
Other State Funds*** $ 10.9 $ 0.0 ($10.9) $10.9 $4.6 ($6.3)
Subtotal of non-federal sources* $1,146.9 $1,065.6 ($81.3) $5,765.9 $5,715.4 ($50.9)
Total sources* $1,970.4 $1,885.1 ($85.3) $10,122.3 $10,073.4 ($48.9)
* Totals may not add due to rounding | ** FTA reimbursements for MassDOT projects only; RTA federal funds are not included | *** New funding source made available to MassDOT.

20
MBTA spending by source (Draft vs. Final)Projected sources (in millions) Draft FY 20 Final FY 20 Delta Draft
5-year TotalFinal
5-year Total Delta
Federal sources of funds
Federal Highway (FHWA) reimbursements $61.1 $61.1 $ - $84.5 $84.5 $ -
Existing FTA reimbursements and grant draws $265.6 $361.4 $95.8 $2,878.5 $2,883.1 $4.6
FTA Full funding grant agreement(GLX FFGA) $320.5 $320.5 $ - $761.6 $761.6 $ -
Other federal funds $10.6 $10.6 $ - $14.1 $14.0 ($0.1)
Subtotal federal sources $657.8 $753.6 $95.8 $3,738.7 $3,743.2 $4.5
Bond cap (including lockbox) $115.2 $115.2 $ - $461.5 $461.5 $ -
Accelerated Bridge bonds $0.1 $0.1 $ - $0.1 $0.1 $ -
Rail enhancement bonds $232.8 $233.2 $ - $1,798.3 $1,809.7 $11.4
MBTA Revenue bonds $200.0 $107.6 ($92.4) $1,171.6 $1,016.6 ($155.0)Metropolitan Highway system (MHS) pay-go $0.0 $0.0 $ - $0.0 $0.0 $ -
Municipal and local funds (GLX) $15.0 $15.0 $ - $75.0 $75.0 $ -
Reimbursable and 3rd parties $13.8 $14.5 $0.7 $100.5 $101.0 $0.5Positive/Automatic Train Control (PTC/ATC) financing $24.3 $99.9 $75.6 $170.7 $169.9 ($0.8)
Pay-Go Lockbox (Bond Cap) $60.0 $60.0 $ - $300.0 $300.0 $ -
Pay-Go lockbox (MBTA) $90.0 $90.0 $ - $394.2 $568.4 $174.2
Capital maintenance fund $4.4 $4.1 ($0.3) $6.2 $5.9 ($0.3)
Subtotal of non-federal sources $755.6 $739.6 ($16.4) $4,478.1 $4,508.1 $30.0
Total Sources $1,413.4 $1,493.2 ($79.4) $8,216.8 $8,251.3 $34.5
* Totals may not add due to rounding |
21
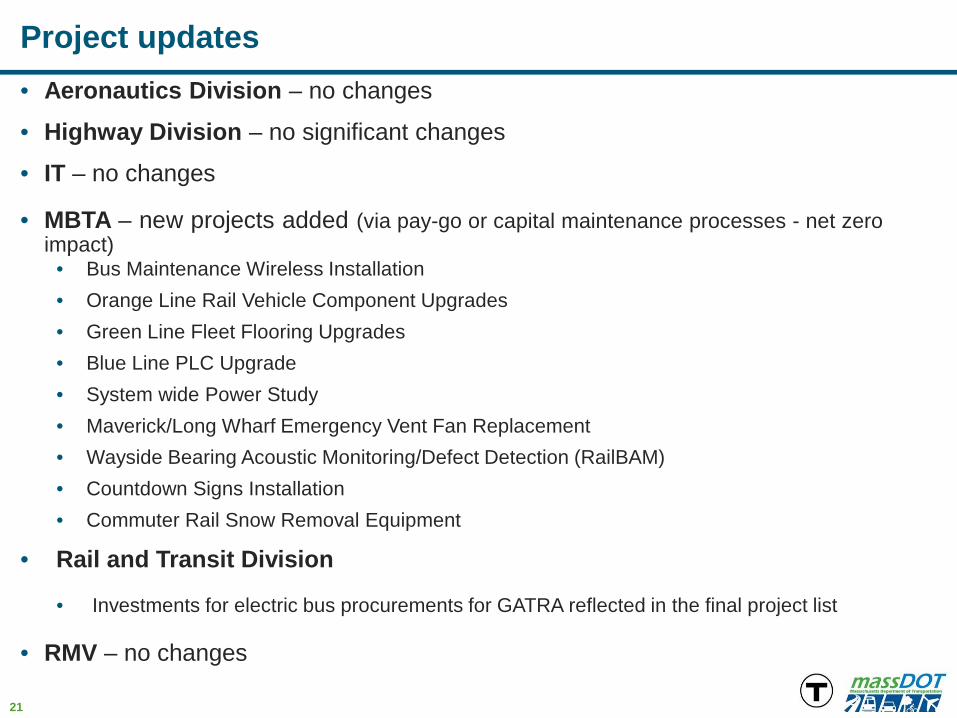
Project updates• Aeronautics Division – no changes
• Highway Division – no significant changes
• IT – no changes
• MBTA – new projects added (via pay-go or capital maintenance processes - net zeroimpact)
• Bus Maintenance Wireless Installation • Orange Line Rail Vehicle Component Upgrades • Green Line Fleet Flooring Upgrades • Blue Line PLC Upgrade • System wide Power Study• Maverick/Long Wharf Emergency Vent Fan Replacement• Wayside Bearing Acoustic Monitoring/Defect Detection (RailBAM)• Countdown Signs Installation• Commuter Rail Snow Removal Equipment
• Rail and Transit Division
• Investments for electric bus procurements for GATRA reflected in the final project list
• RMV – no changes
Next steps and discussion
• Incorporate input from Joint Boards
• Finalize CIP content for final publication

FY2020-2024 CIP update: AppendixProgram sizesJune 12, 2019
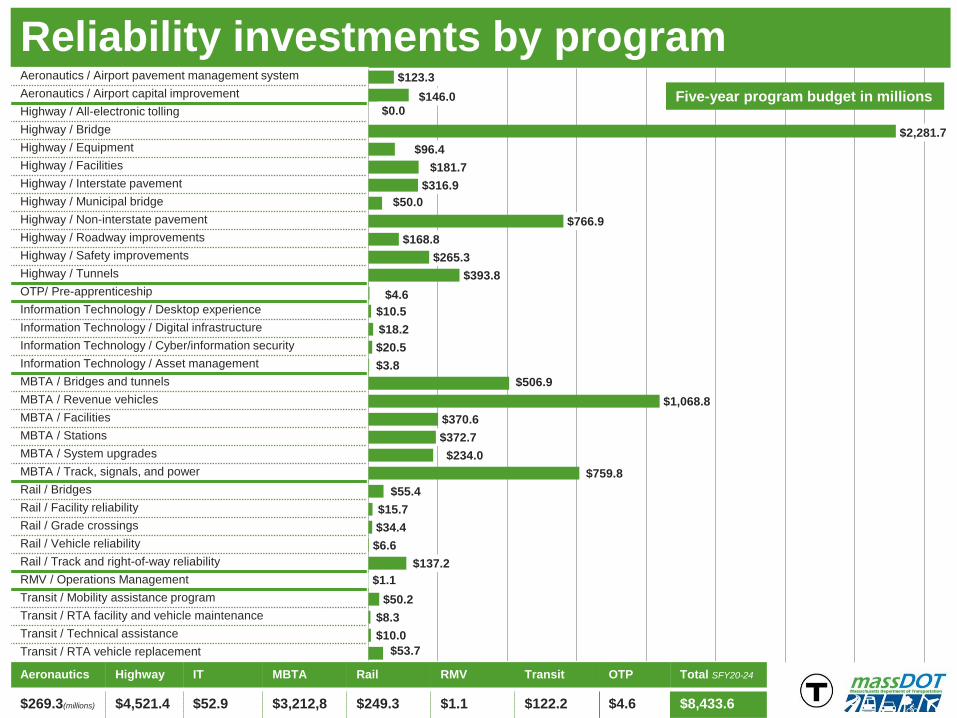
Reliability investments by program
$53.7$10.0$8.3
$50.2$1.1
$137.2$6.6$34.4$15.7
$55.4$759.8
$234.0$372.7$370.6
$1,068.8$506.9
$3.8$20.5$18.2$10.5
$4.6$393.8
$265.3$168.8
$766.9$50.0
$316.9$181.7
$96.4$2,281.7
$0.0$146.0
$123.3Aeronautics / Airport pavement management systemAeronautics / Airport capital improvementHighway / All-electronic tollingHighway / BridgeHighway / EquipmentHighway / FacilitiesHighway / Interstate pavementHighway / Municipal bridgeHighway / Non-interstate pavementHighway / Roadway improvementsHighway / Safety improvementsHighway / TunnelsOTP/ Pre-apprenticeshipInformation Technology / Desktop experienceInformation Technology / Digital infrastructureInformation Technology / Cyber/information securityInformation Technology / Asset managementMBTA / Bridges and tunnelsMBTA / Revenue vehiclesMBTA / FacilitiesMBTA / StationsMBTA / System upgradesMBTA / Track, signals, and powerRail / BridgesRail / Facility reliabilityRail / Grade crossingsRail / Vehicle reliabilityRail / Track and right-of-way reliabilityRMV / Operations ManagementTransit / Mobility assistance programTransit / RTA facility and vehicle maintenanceTransit / Technical assistanceTransit / RTA vehicle replacement
Five-year program budget in millions
Aeronautics Highway IT MBTA Rail RMV Transit OTP Total SFY20-24
$269.3(millions) $4,521.4 $52.9 $3,212,8 $249.3 $1.1 $122.2 $4.6 $8,433.6
$8.1$0.0
$97.2$2.3$4.8$35.1
$61.1$15.0$8.2$13.2
$184.4$209.8
$1,580.7$925.0
$510.7$68.5
$243.9$19.3$25.1
$4.7$21.0
$1,418.6$180.8
$81.6$50.0$21.8$25.0
$0 $250 $500 $750 $1,000 $1,250
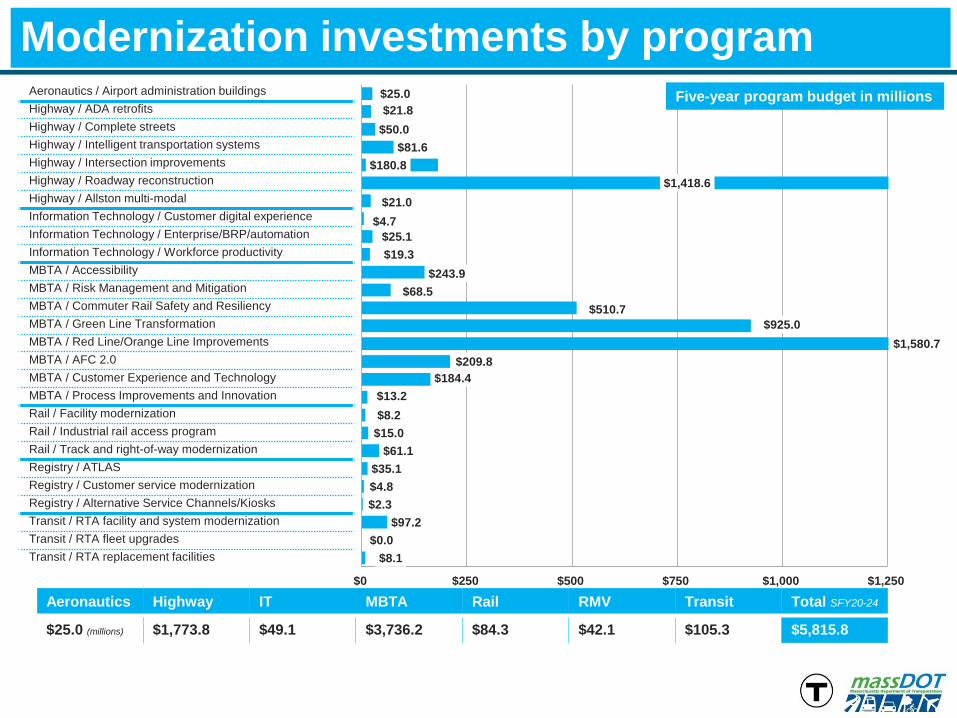
Modernization investments by programFive-year program budget in millionsAeronautics / Airport administration buildings
Highway / ADA retrofitsHighway / Complete streetsHighway / Intelligent transportation systemsHighway / Intersection improvementsHighway / Roadway reconstructionHighway / Allston multi-modalInformation Technology / Customer digital experienceInformation Technology / Enterprise/BRP/automationInformation Technology / Workforce productivityMBTA / AccessibilityMBTA / Risk Management and MitigationMBTA / Commuter Rail Safety and ResiliencyMBTA / Green Line TransformationMBTA / Red Line/Orange Line ImprovementsMBTA / AFC 2.0MBTA / Customer Experience and TechnologyMBTA / Process Improvements and InnovationRail / Facility modernizationRail / Industrial rail access programRail / Track and right-of-way modernizationRegistry / ATLASRegistry / Customer service modernizationRegistry / Alternative Service Channels/KiosksTransit / RTA facility and system modernizationTransit / RTA fleet upgradesTransit / RTA replacement facilities
Aeronautics Highway IT MBTA Rail RMV Transit Total SFY20-24
$25.0 (millions) $1,773.8 $49.1 $3,736.2 $84.3 $42.1 $105.3 $5,815.8
$31.0$43.0
$25.0$1,009.6
$1,326.4$308.1
$203.2$60.0
$0 $250 $500 $750 $1,000 $1,250 $1,500
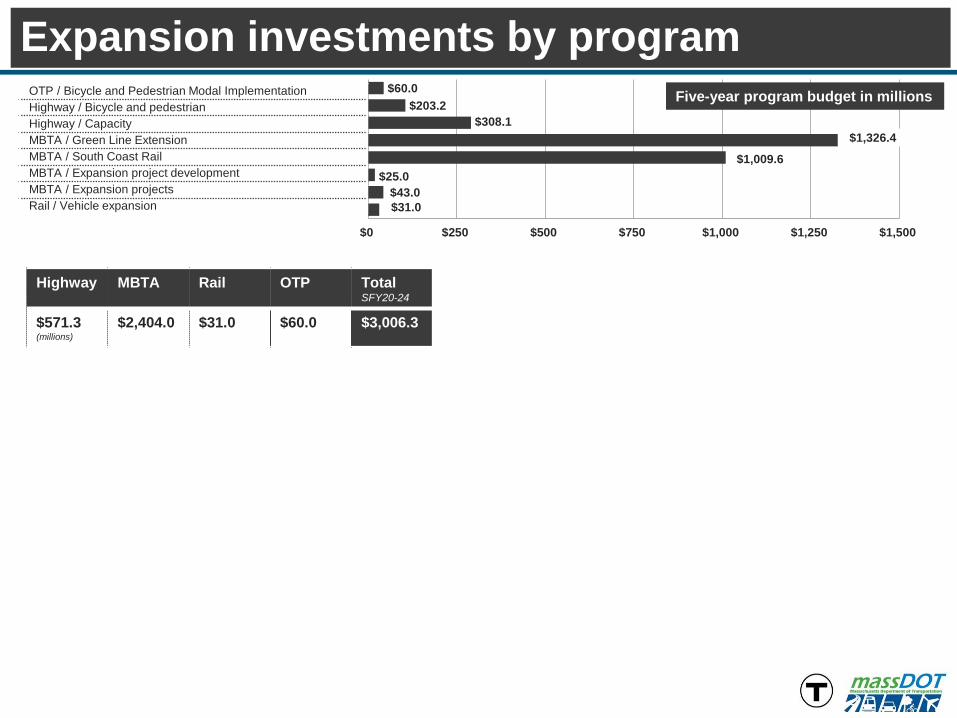
Expansion investments by programFive-year program budget in millionsOTP / Bicycle and Pedestrian Modal Implementation
Highway / Bicycle and pedestrianHighway / CapacityMBTA / Green Line ExtensionMBTA / South Coast RailMBTA / Expansion project developmentMBTA / Expansion projectsRail / Vehicle expansion
Highway MBTA Rail OTP Total SFY20-24
$571.3 (millions)
$2,404.0 $31.0 $60.0 $3,006.3