final-crisosto - maturity...
TRANSCRIPT

1
Outline• Definitions
• Maturity Indices
• Why do we need a Maturity Index? Examples
• One or two maturiry indices
• How to put it to work?
Stages of Fruit Development
DEVELOPMENT
GROWTH
MATURATION
PHYSIOLOGICAL MATURITY
RIPENING
SENESCENCE
John O’Neill
Crisosto - Maturity & Maturity Indices 1

2
Development
Growth
Maturation
Physiological Maturity
Ripening
Senescence
Watada et al., 1984
Developmental Continuum
Sprouts
CucumberBeansSweet corn
AppleBananaCitrus*MelonPearPineapple*Tomato
Development
• The series of processes from the initiation of growth to death of a plant or plant part.
Growth
• The irreversible increase in physical attributes (characteristics) of a developing plant or plant part.
Stages of Fruit Development
John O’Neill
CO2
CalvinCycle Sugars Sugars
Glycolysis
More carb.
AcidsProteins
Pigments
Volatiles
Crisosto - Maturity & Maturity Indices 2

3
Maturation • The stage of development leading to the attainment of physiological or horticultural maturity.
Physiological maturity • The stage when a plant or plant part will continue developing even if detached.
Horticultural maturity • The stage of development when a plant or plant part possesses the prerequisites for utilization by consumers for a particular purpose
Stages of Fruit Development
John O’Neill
Days from
Anthesis
Shell Color
Chlmg/g
Dry wt.%
Soluble solids
%
Titratable acidity
%
Total sugar
%
Vit Cmg/100g
Sensory score*
115-120 Green 0.77 12.97 7.9 0.66 6.49 13.7 3.0
135-140 1/8 0.76 15.26 12.6 0.74 8.87 13.9 4.6
141-145 1/4 0.63 16.09 18.2 0.77 11.25 14.4 5.4
146-150 1/2 0.53 17.65 18.9 0.77 11.99 14.9 6.8
151-155 2/3 0.21 17.76 18.0 0.83 12.44 15.3 6.7
156-160 Full 0.14 19.89 16.3 0.96 12.74 14.5 6.4
LSD.05 0.01 0.17 0.87 0.07 0.08 0.5 0.2
Deka et al. 2005. Standardization of maturity indices of ‘Kew’ pineapple. Acta Hort. 682: 2215.
Indian Kew Pineapples and Composition at Different Stages of Ripeness
TIME AFTER ANTHESIS (weeks)0 10 20 30 40T
OT
AL
SU
GA
R :
SO
LU
BL
E S
OL
IDS
:
ST
AR
CH
: T
OT
AL
AC
IDS
(% f
resh
wei
gh
t)
0
2
4
6
8
10
FL
ES
H F
IRM
NE
SS
(kg
f)
7
8
9
10
FR
UIT
WE
IGH
T (
g)
0
40
80
120
160Soluble Solids
Total Sugars
Fruit Weight
FirmnessTotal Acids
Starch
Seed Color
White Tan DarkBrown
Black
Beever and Hopkirk, 1990
Physical and Compositional Changes during Development
Crisosto - Maturity & Maturity Indices 3

4
Harvest Maturity for Fruits: A balancing Act
Too often we err on the side of shelf-life at the expense of good eating quality
Poor flavorShrivel
No repeat buys
Never ripens
Too soft
Decay Poor shelf-life
Bruises
Maturity Index
Maturity IndicesRequirements to establish
Simple, easy to carry out
Objective vs subjective indicators
Related to quality
Related to storage life
Represents a progressive change with maturity
Permits prediction of maturity from year to year
Use of inexpensive tools
California strawberries and cherriesDistribution Center Singapore May 16, 2008
Strawberries from Oxnard; Cherries from LodiAir-shipped
Crisosto - Maturity & Maturity Indices 4

5
Fruit Minimum maturity indices
Pomegranate Red juice color and below 1.85% acid in juice
Grape 14 to 17.5% SS (depending on cultivar and production area) or a SS/A ratio of 20 or higher
Strawberry >3/4 of fruit surface showing a pink or red color
SS=soluble solids, A=acidity
California Minimum Maturity Indices for Selected Fruits
Strawberries must be picked fully-ripe because they do not continue to ripen after harvest.
Maturity Stages of Strawberries
Fruit Minimum maturity indices
Apple Starch pattern, above 10.5 to 12.5% SS and below 18 to 23 lb-force firmness (depending on cultivar)
Pear (Bartlett) Yellowish-green color, and/or below 23 lb-force firmness, and/or above 13% SS
Persimmon Yellowish-green to orange color (depending on cultivar)
SS=soluble solids
California Minimum Maturity Indices for Pome Fruits
Crisosto - Maturity & Maturity Indices 5

6
M
Nectarine and Peach Ground Color Guides of the California
Tree Fruit Agreement
(CTFA)
The Easy Ones
CA Well Mature
Hue Angle Color CriterionResearch has shown that Hue angle is the most effective instrumental method of determining fruit maturity.
0
45
270
180
90
8080 degrees
CIE hue angle
Crisosto - Maturity & Maturity Indices 6

7
11
22
33 55
44
Maturity and Ripeness Stages of Apricots
Cherry Color Categories
Full Dark Plums and Full Red Nectarines
and Peaches
The Difficult Ones
Crisosto - Maturity & Maturity Indices 7
8
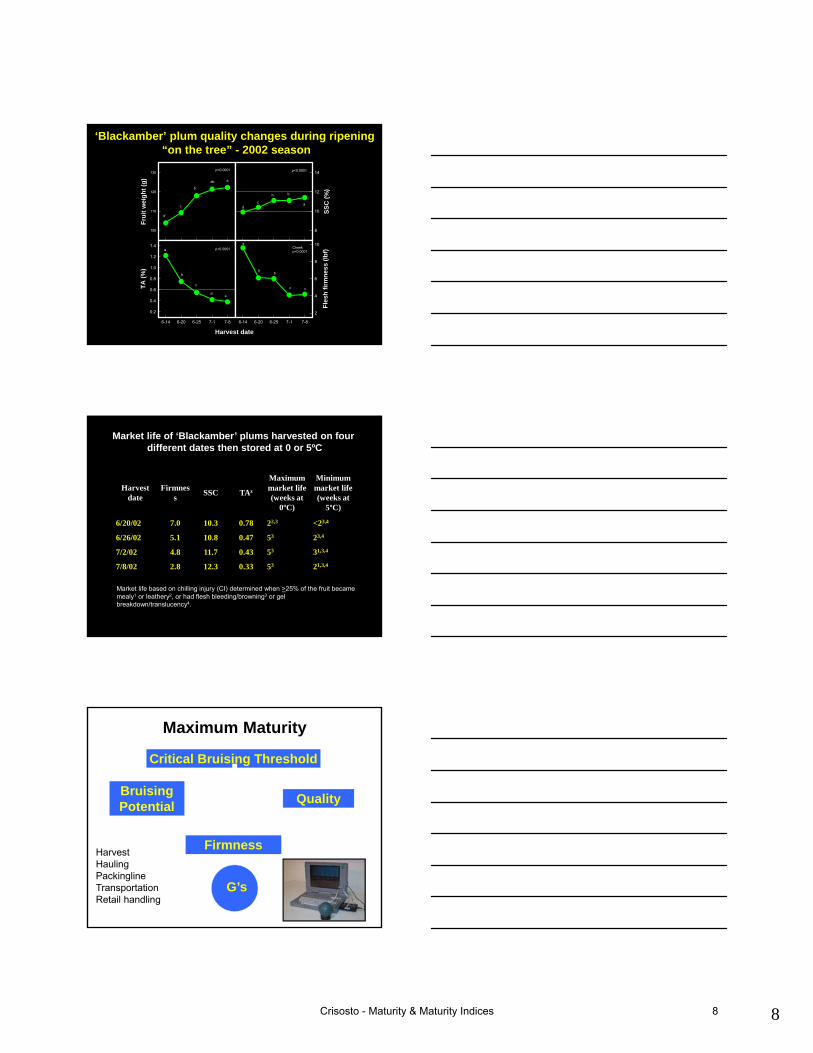
‘Blackamber’ plum quality changes during ripening“on the tree” - 2002 season
Fru
it w
eig
ht
(g)
100
110
120
130
d
c
b
ab a
p<0.0001
SS
C (
%)
8
10
12
14
dc
b b
a
p<0.0001
Harvest date
6-14 6-20 6-25 7-1 7-8
TA
(%
)
0.2
0.4
0.6
0.8
1.0
1.2
1.4
d
c
b
e
a p<0.0001
6-14 6-20 6-25 7-1 7-8F
lesh
fir
mn
ess
(lb
f)
2
4
6
8
10
c
b
aCheekp<0.0001
c
b
Market life of ‘Blackamber’ plums harvested on four different dates then stored at 0 or 5ºC
Harvest date
Firmness
SSC TAz
Maximum market life(weeks at
0ºC)
Minimum market life(weeks at
5ºC)
6/20/02 7.0 10.3 0.78 22,3 <23,4
6/26/02 5.1 10.8 0.47 53 23,4
7/2/02 4.8 11.7 0.43 53 31,3,4
7/8/02 2.8 12.3 0.33 53 21,3,4
Market life based on chilling injury (CI) determined when >25% of the fruit became mealy1 or leathery2, or had flesh bleeding/browning3 or gel breakdown/translucency4.
Maximum Maturity
Critical Bruising Threshold
Bruising Potential
Quality
Firmness
G’s
HarvestHaulingPackinglineTransportationRetail handling
Crisosto - Maturity & Maturity Indices 8

9
Developing Tree Ripe Standards
Crisosto, et al., 2001. Journal American Pomological Society 55(2): 76-81
Proposed harvest maturity/quality indices based on firmness and minimum SSC for different plum cultivars.
CultivarFirmness
(lb)Minimum
SSC(%)
Blackamber 7-9 10-12Z
Fortune 7-9 11
Friar 7-9 11
Royal D. 7-9 11
Angeleno 6-9 12
Betty Anne 7-9 12
ZBlackamber plums with TA 0.60% after ripening have a high consumer acceptance. If plums have > 12.0% SSC, TA does not play a role.
The Good vs. The Bad and Ugly
Mechanical Pitter Damage
Crisosto - Maturity & Maturity Indices 9

10
Fruit Cheek Firmness (lbf.)0 2 4 6 8 10 12 14 16
Pitt
ing
Dam
age
(%)
0
20
40
60
80
100
'Andross' 'Carson''Ross'
N
S
E
W
Upper
Lower
3.4 2.8
*2.53.5
5.2 4.5
4.45.0
Can
opy
Fir
mne
ss
*Mean fruit shoulder flesh firmness (lbf.) of 50 'Andross' fruit per sector.
Crisosto - Maturity & Maturity Indices 10

11
The Tedious Ones
• For many products, it is necessary to use several indices to accurately determine maturity.
How to Measure Maturity
• Minimum Maturity (6.5% SSC)
• Maximum Maturity (≤14 pounds)
Impact Bruising
Hard ControlSoft
Gatti, R. 1983
Crisosto - Maturity & Maturity Indices 11

12
StoragePotential
Ethylene free
Kiwifruit Internal Breakdown after 3 Months of Cold Storage
HARVEST SSC (%)
4 5 6 7 8 9
KIW
IFR
UIT
INT
ER
NA
LB
RE
AK
DO
WN
(%
)
0
20
40
60
80
100Sacramento Valley, 1998
San Joaquin Valley, 1998
San Joaquin Valley, 1999
Sacramento Valley, 2000
San Joaquin Valley, 2000
15.1-16.1 % DW
Consumer Acceptance (‘in-store’)
Crisosto - Maturity & Maturity Indices 12

13
How to assure Consumer Quality • Minimum Maturity (6.5% SSC)• Maximum Maturity (≤14 pounds)• Consumer Quality (≥12.5% RSSC)• Fruit Handler Quality (≥ 15.1% DW)
Crisosto - Maturity & Maturity Indices 13

14
Composition of fig cultivars separated by stage of maturity.
CultivarMaturity stage Weight,
gFirmness,
NSoluble
solids, %Titratable acidity, %
Black Mission Under-ripe 29.9 12.1 14.3 0.38
Commercial maturity 32.2 7.2 17.5 0.19
Tree ripe 34.5 4.0 21.0 0.22
Kadota Under-ripe 45.1 11.0 15.2 0.36
Commercial maturity 56.3 4.4 15.9 0.34
Tree ripe 57.6 2.4 17.9 0.28
LSD.05 3.7 1.3 1.9 0.05
(Cantwell & Crisosto, 2010)
Mango maturity indices
Fullness of shoulders
Internal and external color
Starch content
Makani et., al.
Crisosto - Maturity & Maturity Indices 14

15
Indicators of Harvest MaturityAPPLES
• Days from full bloom
• Time/temp (heat units) from anthesis
• Days from harvest to onset of ethylene production
• Ground color
• Soluble solids content (SSC)
• Flesh firmness and SSC
• Starch disappearance pattern
• Internal ethylene concentration
• Changes in firmness or starch content
Streif Index considers starch, sugar, firmness
Starch Content is an Indicator of Apple Harvest Maturity
Use of Maturity IndicesLimitations
• Soil conditions, nutrition, irrigation
• Season, climate
• Position on the plant
• Pruning, other cultural practices
• Varieties
Crisosto - Maturity & Maturity Indices 15