final design review report: electronics design for a ... final... · a brushless linear dc motor...
TRANSCRIPT

- 0 -
Final Design Review Report:
Electronics Design for a Tomographic Photometer
ECE 4850 Design III
Thursday, April 16, 2009
Steven Burr Keith Bradford
Instructor’s Approval ____________________________________ ___________
Dr. YangQaun Chen Date
Department of Electrical & Computer Engineering
Utah State University Sponsor’s Approval ___________________________________ __________
Dr. Charles Swenson Date
Center for Space Engineering
Utah State University

- 1 -
Abstract A tomographic photometer in development by students at Utah State University.
The photometer will be able to retrieve two dimensional profiles of the ionosphere
in the 1356 Å band by means of tomographic reconstruction (similar to a CAT scan only in the atmosphere). Such profiles would be the first of their kind and of great worth to the science community and public in general as well as improving satellite communications. The profiles would increase our understanding of Equatorial Plasma Bubbles (EQBs), which disrupt satellite communications especially GPS signals. The mechanical design of the photometer has been completed. A design solution for integrating the Photomultiplier Tube (PMT) and a brushless linear DC motor (BLDC) with an external system. This report contains the detailed design of an optical-electrical system featuring a PMT and photon counting system. It also contains design for the control of a BLDC motor and integration and test into the system.

- 2 -
Table of contents
List of tables....................................................................................................................- 3 -
List of figures..................................................................................................................- 3 -
Acknowledgements.........................................................................................................- 3 -
1.0 Introduction.........................................................................................................- 4 -
1.1 Problem statement and design objectives ...........................................................- 5 -
2.0 Review of Conceptual and Preliminary Design..................................................- 6 -
2.1 Problem Analysis ................................................................................................- 8 -
2.2 Summary of specifications..................................................................................- 9 -
2.3 Technical Approach ..........................................................................................- 10 -
3.0 Basic Solution Description ...............................................................................- 14 -
4.0 Performance Optimization and Design of System Components ......................- 14 -
6.0 Final Scope of Work Statement ........................................................................- 16 -
6.1 Lessons learned and suggestions for future activities.......................................- 19 -
7.0 Other Issues.......................................................................................................- 20 -
8.0 Project Budget and Costs ..................................................................................- 21 -
9.0 Project Management Summary.........................................................................- 22 -
10.0 Conclusion ........................................................................................................- 22 -
REFERENCES .............................................................................................................- 24 -
Appendices....................................................................................................................- 25 -

- 3 -
List of tables Table 1. Measured Pulse Properties....................................................................................................................... - 10 - Table 2. Motor Measurements................................................................................................................................ - 17 - Table 3. Budget and Component List...................................................................................................................... - 21 - Table 6. Field of View............................................................................................................................................. - 33 - Table 7. Orbital Parameter Spreadsheet ................................................................................................................ - 34 - Table 8. Dynamic Range Spreadsheet .................................................................................................................... - 35 - Table 9. Motor Parameter Spreadsheet.................................................................................................................. - 39 -
List of figures Figure 1. Plasma Bubbles in the Ionosphere _____________________________________________________ - 4 - Figure 2. Photometer Box____________________________________________________________________ - 5 - Figure 3. Workings of a Photomultiplier Tube [2]_________________________________________________ - 7 - Figure 4. Photon System Concept Diagram ______________________________________________________ - 8 - Figure 5. Measured Current Pulse (axis units are not correct, peak ~50nA) ___________________________ - 10 - Figure 6. Current Pulse Thresholding and Distribution [2] ________________________________________ - 11 - Figure 7. Photon Counting System [2]_________________________________________________________ - 12 - Figure 8. Measured Pulse Heights ____________________________________________________________ - 13 - Figure 9. Measured Pulse Heights and Histogram _______________________________________________ - 13 - Figure 10. Amplifier and Detection System _____________________________________________________ - 14 - Figure 13. Measured Pulses of Amplifier System_________________________________________________ - 18 - Figure 14. Comparator Output to Digital System ________________________________________________ - 19 - Figure 15. Project Schedule _________________________________________________________________ - 22 - Figure 16. Photon Counting System Schematic __________________________________________________ - 26 - Figure 17. Motor Controller Schematic ________________________________________________________ - 27 - Figure 18. Photometer Assembled ____________________________________________________________ - 28 - Figure 19. Photometer Optical-Mechanical System_______________________________________________ - 29 - Figure 20. Code Example for MSP430 Photon Counter Interface____________________________________ - 30 - Figure 21. M-Code for Measurement Script_____________________________________________________ - 36 - Figure 22. Test Setup for Measuring Pulses_____________________________________________________ - 38 -
Acknowledgements

- 4 -
A special thanks to Texas Instruments for donating parts for the project.
1.0 Introduction
Figure 1. Plasma Bubbles in the Ionosphere
The ionosphere plays a very important part
in satellite and ground communications. Equatorial
Plasma Bubbles (EQBs) and other ionospheric
processes known as space weather can cause
disruption to any kind satellite communications,
which can cause problems for society. This process occurs when a region of low plasma densities
is topped by a region of high density, the lower plasma flows upward and creates a bubble. This
process creates a “lens” for radio waves and distorts communications signals, similar to the way
a bubble of oil in a glass of water distorts images on the other side. The new Wide Area
Augmentation System (WAAS) was developed to guide planes with use of the GPS system was
initially thought that accuracies would not be affected in the higher latitudes from EQBs.
However, the system was recently found to come under direct effects from EQBs as they spread
up to higher latitudes and reduce the accuracies of the system [1]. Even most financial
transactions could be effected as they use GPS for a time stamp. As society comes to rely more
upon satellite communications we need to fully understand the space weather by which our
communications are being affected. It has been proposed that a tomographic can help fill this
void of understanding about the atmosphere and yield new discoveries since the measurements it
is taking are unique. Upon launch the photometer would be the first remote atmospheric imager
to retrieve a two dimensional cross section of the ionosphere. These profiles of the atmosphere
could then be used to improve modeling and the prediction of space weather. If the density of the
- 5 -
atmosphere were known corrective action could be taken such as improving correction and
accuracy of GPS systems. Warnings could also be issued by the science community and action
taken in the event of extreme space weather.
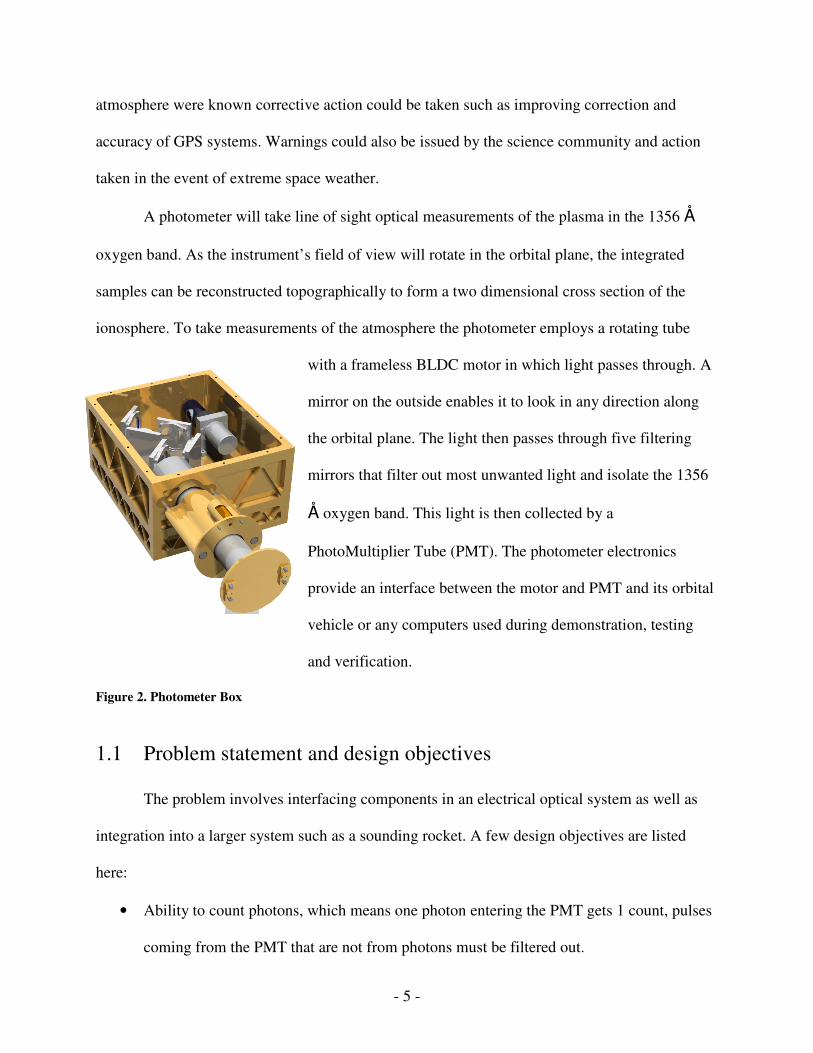
A photometer will take line of sight optical measurements of the plasma in the 1356 Å
oxygen band. As the instrument’s field of view will rotate in the orbital plane, the integrated
samples can be reconstructed topographically to form a two dimensional cross section of the
ionosphere. To take measurements of the atmosphere the photometer employs a rotating tube
with a frameless BLDC motor in which light passes through. A
mirror on the outside enables it to look in any direction along
the orbital plane. The light then passes through five filtering
mirrors that filter out most unwanted light and isolate the 1356
Å oxygen band. This light is then collected by a
PhotoMultiplier Tube (PMT). The photometer electronics
provide an interface between the motor and PMT and its orbital
vehicle or any computers used during demonstration, testing
and verification.
Figure 2. Photometer Box
1.1 Problem statement and design objectives
The problem involves interfacing components in an electrical optical system as well as
integration into a larger system such as a sounding rocket. A few design objectives are listed
here:
• Ability to count photons, which means one photon entering the PMT gets 1 count, pulses
coming from the PMT that are not from photons must be filtered out.

- 6 -
• The individual counts must be counted with respect to time (counts/sec) and have the
ability to be monitored by an external system
• The BLDC must also have an interface for control via an external system for the rotating
mirror.
2.0 Review of Conceptual and Preliminary Design
Originally the design was for a mission on a student satellite, the program was cancelled.
It was decided that the project may be flown on a future satellite or sounding rocket mission. In
the aerospace industry in is desirable to have a high Technology Readiness Level (TRL), which
is a scale of 1 to 9 of how well developed a technology or subsystem is. The completion of this
project would bring a TRL of level 6 which means the design has been demonstrated with a
prototype. The prototype design does not work in the ultraviolet (UV) spectrum since the optics
and PMT are well over $30,000. To mitigate the cost and the risk of damage the components that
work in the visible range are substituted in place of the UV components. These cost only 300$
and are electrically interchangeable. Upon verification and testing of the electronics the visible
components may be replaced for those that work in the UV range and the design could then be
used on a space mission.
Many of the design specifications are known, such as the PMT power and signal
requirements. Power usage is an issue because it also increases cost since power is expanded by
adding solar cells or batteries Another consideration is in prototyping is finding parts that can
work in the industrial temperature range or mil-spec parts. These parts can be adapted for use in
the hostile space environment.

- 7 -
The system collects light by means of a rotating mirror that is rotated by the BLDC
motor, this enables it to look out along the orbital path in 360 degrees. The light then hits a series
of filter mirrors which isolate a wavelength of light in the UV. The filtered light then enters a
PMT. Most photons incident on the PMT's windows are converted to electrons, which hit
subsequent dynodes which cause a shower of electrons and collected by an anode. Multiple
spreadsheets in the appendix are included to calculate the instruments field of view,
Figure 3. Workings of a Photomultiplier Tube [2]
One photon causes a shower of electrons, which produce a current spike; these spikes can then
be counted by electronic methods and used to find a count of photons entering the detector. This
photon count can then be used as the measurement for the tomographic reconstruction.
The BLDC motor needs a controller to drive it since it needs a pulse width modulated
(PWM) signal for power control and commutation As part of the optical specifications the
motor has been specifically selected to not produce jitter also known as cogging torque. This
jitter causes the rotating mirror to point in the wrong direction which can increase noise in the
optical measurements. Although no requirement exists for jitter it must be kept to a minimum. A
figure of the total system can be seen below. BLDC control is a project in of itself if the
controller is hand built. Although it is desirable to customize the controller to the application, for
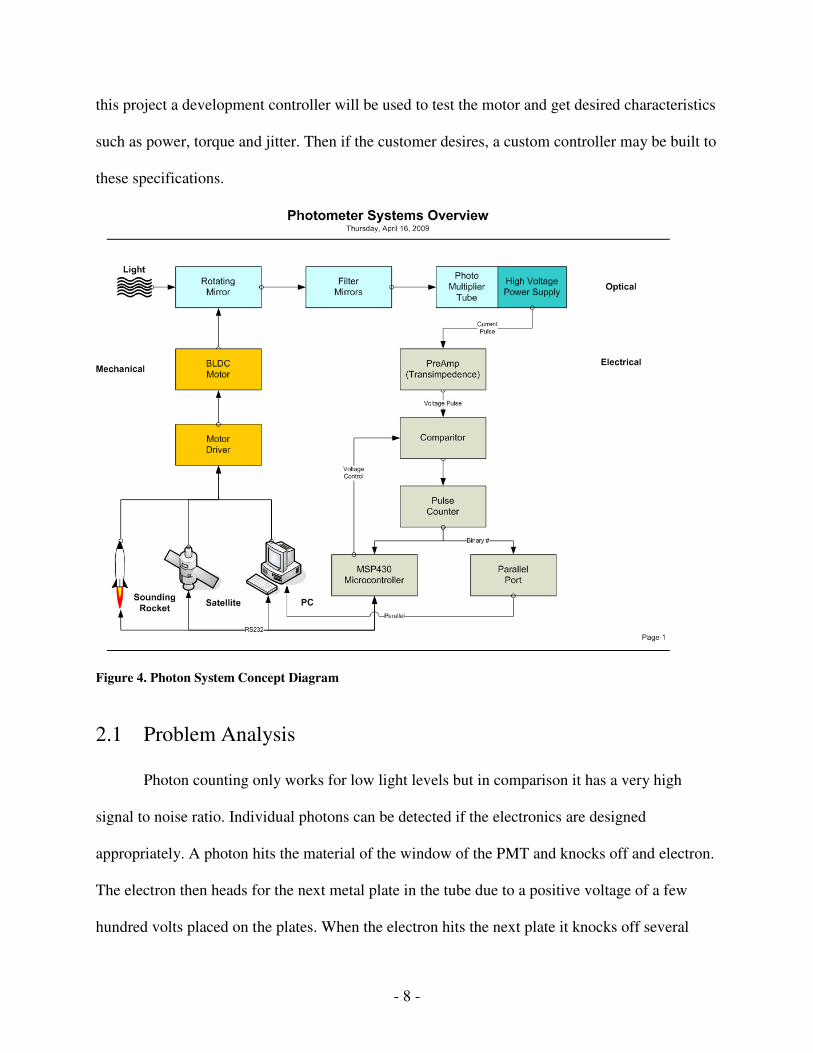
- 8 -
this project a development controller will be used to test the motor and get desired characteristics
such as power, torque and jitter. Then if the customer desires, a custom controller may be built to
these specifications.
Figure 4. Photon System Concept Diagram
2.1 Problem Analysis
Photon counting only works for low light levels but in comparison it has a very high
signal to noise ratio. Individual photons can be detected if the electronics are designed
appropriately. A photon hits the material of the window of the PMT and knocks off and electron.
The electron then heads for the next metal plate in the tube due to a positive voltage of a few
hundred volts placed on the plates. When the electron hits the next plate it knocks off several

- 9 -
electrons and multiplies the effect. This effect continues with each plate multiplying the electrons
where they can be collected on the last plate as a current pulse. This current pulse can then be
amplified and detected using digital electronics. All pulses from the PMT do not correspond to
photons, these come from electrons, ions and cosmic rays. Electrons can jump off from the lower
stages of the PMT and cause a pulse that is lower than height than a photon. Ions and cosmic
rays have a higher voltage than normal photons due to their higher energies and thus have a pulse
height that is higher than that of a photon. Pulse height discrimination is needed to 'filter' out
these noisy pulses so that only photons are counted. This pulse can then be converted to a digital
pulse using a retriggerable one shot to maintain timing and then passed on to a digital counting
system.
2.2 Summary of specifications
• 1 photon to 1 5 volt pulse – the optoelectronic system must be able to convert the pulses
from the PMT and convert them to 5 volt pulses to be read by digital electronics.
• Thresholding – The system must be able to distinguish between dark pulses, radiation
pulses and regular photons.
• Counting and output– Must be able to count photons with respect to time or counts per
second, this is done with timer
• Motor control, needs to be able to rotate the motor at a rate between 1-2 Hz at the motors
voltage of 24v, the motor system cannot draw more than 1.5A

- 10 -
2.3 Technical Approach
The approach was to model the system in software, the build the system and compare the
results with the real world values. Measurements were taken with an oscilloscope and current
amplifier to characterize the signal. The current preamplifier had filter modes to determine
source frequencies of noise. Several parameters were noted such as:
• Pulse heights
• Pulse width
• Frequency
• Noise
Figure 5. Measured Current Pulse (axis units are not correct, peak ~50nA)
Table 1. Measured Pulse Properties
Typical photon current pulse measured before amplification Frequency 5 MHz Pulse Width 5 ns Pulse Height N/A nA
Typical photon current pulse measured after amplification Frequency 200 to 500 kHz Pulse Width 2 to 5 µs Pulse Height 500 uA

- 11 -
A useful source was Hamamatsu's "Photon Counting Using Photomultiplier Tubes", which give
a systems level perspective of photon counting systems and how to overcome common problems.
Wayne Sanderson an expert from the Space Dynamics Laboratory (SDL) was drawn upon for
expert opinion. Previous designs related to photon counting systems were discussed. Most of
these designs had two things in common: a transimpedance amplifier and method of
discriminating voltages. The amplifier system was then patterned after this design with a few
additions. The amplifier was changed to a two stage design using the same op amp. One side
functions as a preamp converting current to voltage and the other side pulls the voltage up to the
5V level. It was decided that a comparator would be best to filter pulses by their height.
Figure 6. Current Pulse Thresholding and Distribution [2]
The ability to filter out high pulses in addition to low pulses was added so the system can keep
the only the pulses that come from measured photons. The figure above shows how voltage
thresholding can be beneficial in eliminating noisy pulse signals from the system. A 74321
retriggerable one shot is then used to make sure that if two pulses come in they are accurately

- 12 -
registered by the counter. It was decided that the best system for counting the digital output
would be an MSP430 development board. It has the ability to read voltages with and A/D
converter and also output the count on an LCD screen or RS232 port. Low power is also a
consideration and the MSP430 family is built to conserve power which made it an excellent
choice.
Figure 7. Photon Counting System [2]
2.4 Decision Analysis
A few specifications needed to be finalized before the design could continue. The gains
of the op amps and the comparator voltages. It was decided that the best method of design would
be to model the system then build the system. A digital storage oscilloscope was used to take
measurements and run them through a Pspice simulation and develop and simulate a model of
the system. The manufacturer of the op amps provides a Pspice model but it was not detailed
enough to work in the nano-amp range. A different approach using calculation and hand tuning
was used. The approximate gain was found and then a variable resistor was used to fine tune the
gain to it's appropriate range. Although this method is simple it works and a better pulse shape
can be obtained than calculations from a simulation. The data was also used to find the relative
thresholding voltages to filter out the high and low pulses that did not correspond to photons.

- 13 -
The data was imported into Matlab and a peak detection algorithm was used to find the peak of
each pulse. A pulse height distribution was then used to find the relative high and low voltages
for the comparators.
Figure 8. Measured Pulse Heights
Figure 9. Measured Pulse Heights and Histogram

- 14 -
3.0 Basic Solution Description
The basic solution of the system is the op amps to provide a gain of 10^8 to get the pulse
heights to 5volts. Comparators in a window circuit configuration can be used to discriminate the
pulse heights, the approximate voltages are shown. The voltages will be provided by a two 1k
potentiometers, this will also allow for easy optical calibration of the system. The output from
the comparators will be from 0-5 volts and will then be fed out to a digital system for counting.
Figure 10. Amplifier and Detection System
4.0 Performance Optimization and Design of System Components
After trouble with the first Pspice simulation, it was decided to build the preamplifier and
measure the characteristics of the amplifier. A simple hand calculation of a transimpedance
amplifier yields V_out = I_in * R, so the gain of the amplifier is all in selecting the right resistor
value. The preamplifier needs to go from 50nA of the current pulses to 150mA. This places the
gain 3x10^5 hence the resistor value in the 300k range. The circuit was then built and the
appropriate resistor value was substituted in, but the shape of the current pulse was changed.
Instead of a nice pulse the circuit was ringing, which means the circuit is unstable. This creates
several problems for the rest of the system including false counts and reduced bandwidth
(counts/sec).

- 15 -
It was then discovered that the coax cable had enough stray capacitance to drive the
circuit unstable due to reflection in the coaxial transmission line. A document from Texas
Instruments called "Compensate Transimpedance Amplifiers Intuitively" [4], helped avoid the
ringing by compensation. A capacitor placed in parallel with the gain resistor can match the
impedance of the line. This can be applied to photodiodes, but the same principle applies to
transmission lines and matching the impedance of the line and the high voltage power supply
connected to the PMT. From equation 6 in the document we get
Figure 11. Measured Ringing of Current Pulse

- 16 -
Our desired frequency is at least 200kHz so substituting in the parameters and solving for C_d
gives us a value around 10pF. A capacitor was substituted in and the ringing was avoided. It may
be mentioned that the better the pulse shape the more photons can be counted because the width
is smaller.
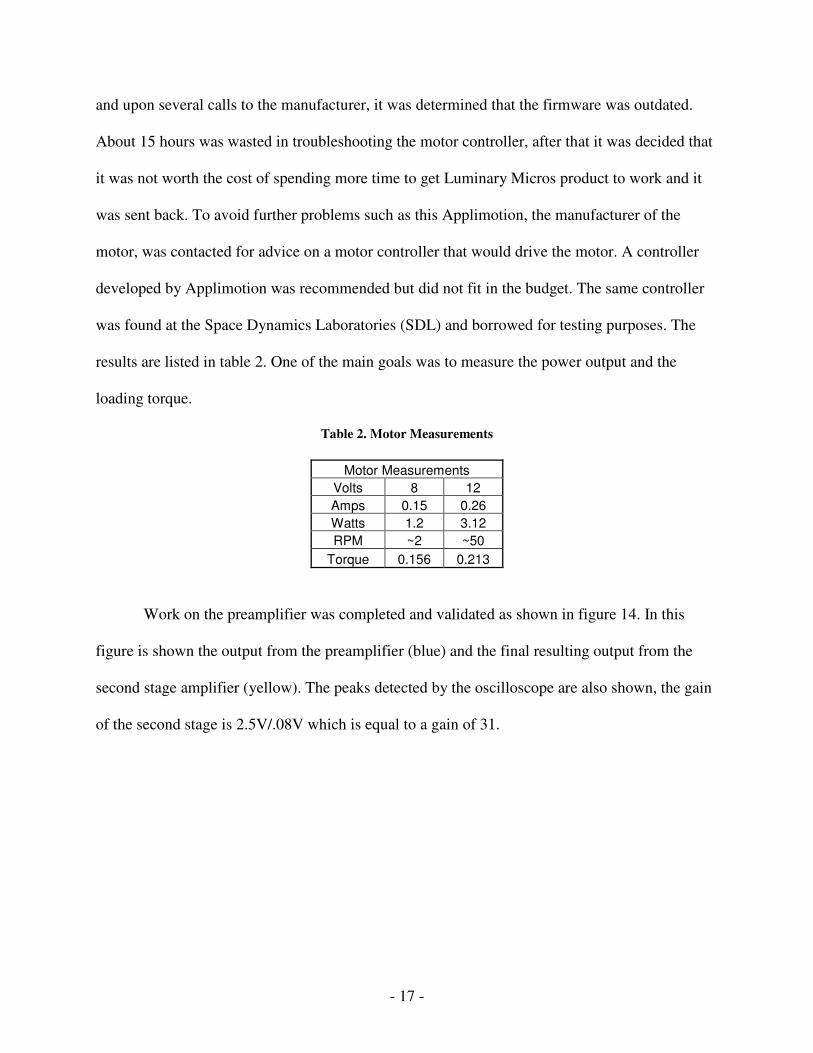
6.0 Final Scope of Work Statement
The motor was not operational at the time of this report although much work went in to
finding the appropriate BLDC motor controller for it. Motor controllers from several companies
that matched the voltage and current specifications of the motor were found. The model with the
least cost was purchased from Luminary Micro. Upon receipt the motor controller was tested for
connectivity since it operated over a LAN or in a standalone mode. It did not function correctly
Figure 12. Measured Pulses After Correction
- 17 -
and upon several calls to the manufacturer, it was determined that the firmware was outdated.
About 15 hours was wasted in troubleshooting the motor controller, after that it was decided that
it was not worth the cost of spending more time to get Luminary Micros product to work and it
was sent back. To avoid further problems such as this Applimotion, the manufacturer of the
motor, was contacted for advice on a motor controller that would drive the motor. A controller
developed by Applimotion was recommended but did not fit in the budget. The same controller
was found at the Space Dynamics Laboratories (SDL) and borrowed for testing purposes. The
results are listed in table 2. One of the main goals was to measure the power output and the
loading torque.
Table 2. Motor Measurements
Motor Measurements Volts 8 12 Amps 0.15 0.26 Watts 1.2 3.12 RPM ~2 ~50
Torque 0.156 0.213
Work on the preamplifier was completed and validated as shown in figure 14. In this
figure is shown the output from the preamplifier (blue) and the final resulting output from the
second stage amplifier (yellow). The peaks detected by the oscilloscope are also shown, the gain
of the second stage is 2.5V/.08V which is equal to a gain of 31.

- 18 -
Figure 13. Measured Pulses of Amplifier System
The comparator was tested and the results are shown in Figure 14. The yellow pulse is an
incoming pulse after the preamplifier and the blue pulse is after the comparator stage. This pulse
is then sent into an input port of the MSP430 Experimenter board. The board was tested using
the button to simulate an incoming pulse and example code is shown in Figure 14.

- 19 -
Figure 14. Comparator Output to Digital System
6.1 Lessons learned and suggestions for future activities
There are many lessons that were learned that can be applied to future designs, especially
since a fabricated board will be designed for the system in the future. The location of the input
terminal to the PMT's high voltage amplifier needs to be as close to the amplifier as possible, and
the ground terminal also needs to be connected to the amplifier. Long wires carrying the initial
pulse signal can generate noise as well as change the input impedance of the coaxial transmission
line.

- 20 -
7.0 Other Issues
Although the amplifier design functions fully, a better understanding of it could be made.
The capacitor value to dampen out the ringing in the input line was selected based on
compensating the amplifier. A better solution would be to model the amplifier and find the poles
and zeros of the system to ensure system instabilities such as ringing do not occur. This could
also be done with an end to end simulation in Pspice with a model of the transmission line. This
may not be possible if more information from Hamamatsu could not be obtained about the
impedance of the high voltage amplifier. In this case the capacitor values could be hand tuned to
find the best pulse 'shape'.
Another issue would be verification, although simple verification of the amplifier stages
has been obtained, more can be done. The TDS7704B oscilloscope has 4 input ports and can be
used as a DSO. A probe could be placed at each of the amplifier stages, after the comparator and
before the digital counting system. The pulses could then be recorded at each stage through the
system. This data could then be imported into Matlab and a script similar to the peak detection
script to validate the data. If a pulse from a photon was detected on the input but no digital pulse
was seen on the exit of the system then it would be known that the system was not functioning
correctly.

- 21 -
8.0 Project Budget and Costs
The project had a budget of $1200. Cost estimation was fairly straightforward since the
most of the photometer components were fairly inexpensive. Chips were acquired Texas
Instruments which helped stay under the budget cap of $1200. Time spent on the project was
300 hours, which at a students wage is around $3000 for the development costs.
Table 3. Budget and Component List

- 22 -
9.0 Project Management Summary
Time was a limiting factor in the design, as manpower was limited. Mechanical design
work also affected the design as the motor and the PMT had to be selected before and integrated
into the mechanical design. The electrical portion of the project was done in about the space of
three months.
Figure 15. Project Schedule
10.0 Conclusion
Integrating the electrical components of a photometer was not extremely difficult but
there are a few items that need to be worked on. Although all not all of the ideas were
implemented all of the design goals were reached at the time of writing except for the motor
controller, which a schematic has been included for future work. The prototyping of the
amplifier was completed and verified to some extent. More testing and verification can be done,
but this can happen during the optical calibration and testing. Prototype analog hardware was
developed. Although the design could potentially be used for testing it would be recommended

- 23 -
that the schematic be used for a PCB design. The project went well with the exception of timing
and the design goals were met.

- 24 -
REFERENCES [1] Stening, R. J.: 2003, ‘SPACEWEATHER IN THE EQUATORIAL IONOSPHERE’, J. Space Science Reviews. 107: 263–271.
[2] “Photon Counting Using Photomultiplier Tubes” Hamamatsu Photonics http://sales.hamamatsu.com/assets/applications/ETD/PhotonCounting_TPHO9001E04.pdf
[3] “Op Amps For Everyone Design Guide.” Texas Instruments. http://focus.ti.com/lit/an/slod006b/slod006b.pdf
[4] “Compensate Transimpedance Amplifiers Intuitively.” Texas Instruments. http://focus.ti.com/lit/an/sboa055a/sboa055a.pdf

- 25 -
Appendices
- 26 -
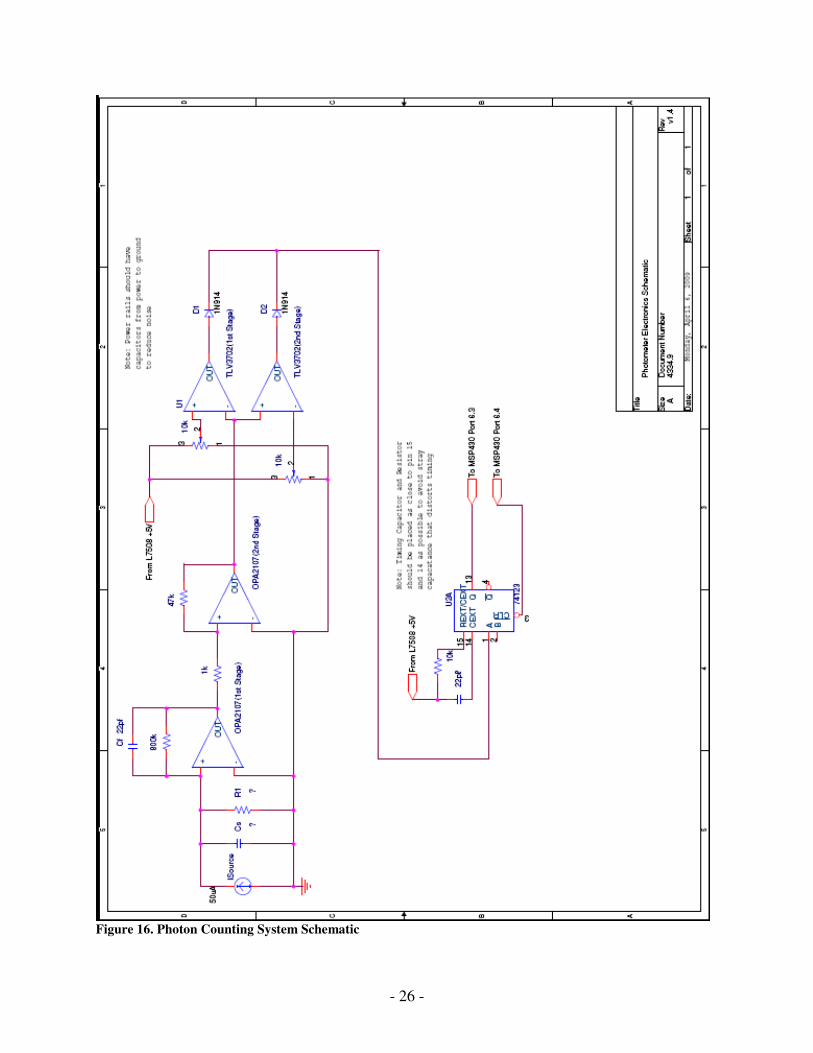
Figure 16. Photon Counting System Schematic

- 27 -
Figure 17. Motor Controller Schematic

- 28 -
Figure 18. Photometer Assembled
- 29 -
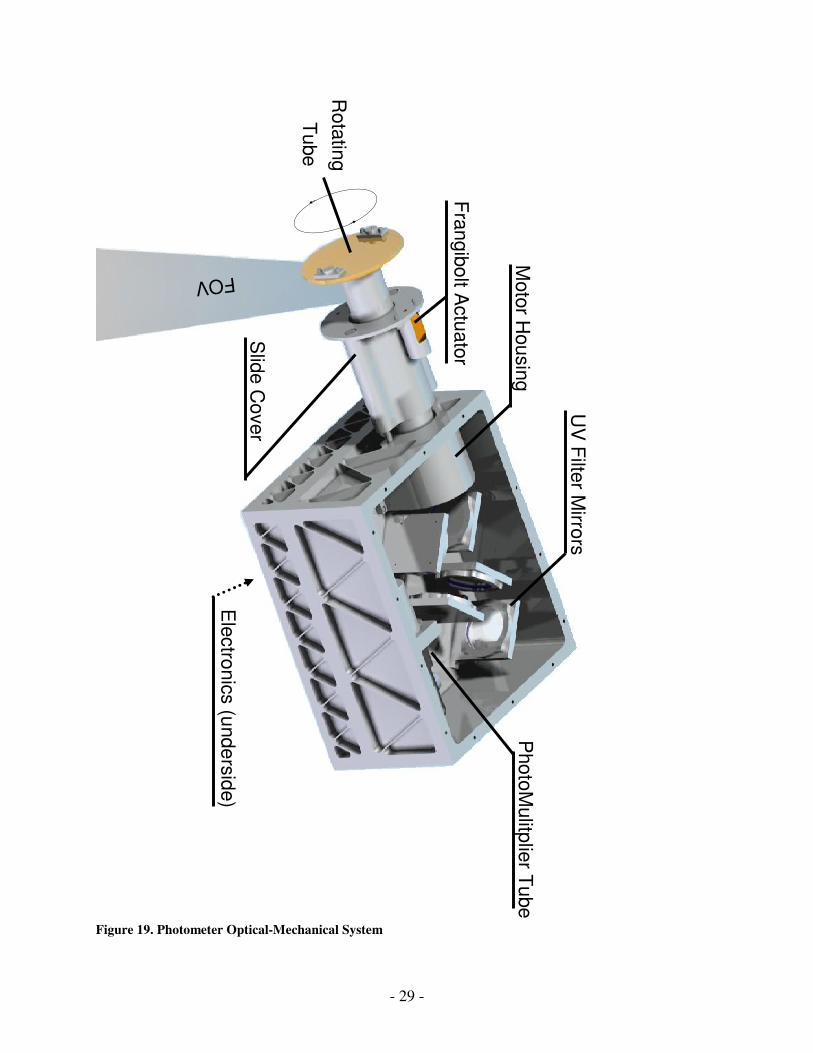
Figure 19. Photometer Optical-Mechanical System
Frangibolt A
ctuator
Slide C
over
Motor H
ousing
UV
Filter M
irrors
PhotoM
ulitplierT
ube
Rotating
Tube
Electronics (underside)
FOV

- 30 -
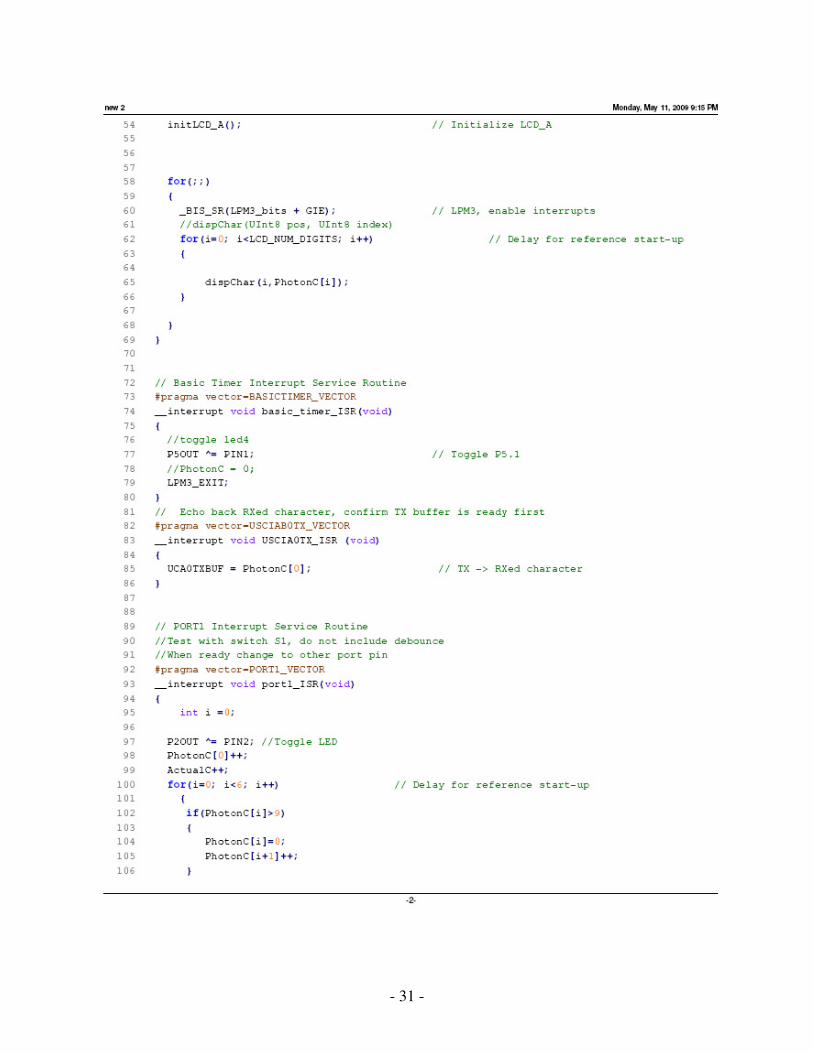
Figure 20. Code Example for MSP430 Photon Counter Interface
- 31 -

- 32 -

- 33 -
Table 4. Field of View

- 34 -
Table 5. Orbital Parameter Spreadsheet

- 35 -
Table 6. Dynamic Range Spreadsheet

- 36 -
Figure 21. M-Code for Measurement Script

- 37 -
- 38 -
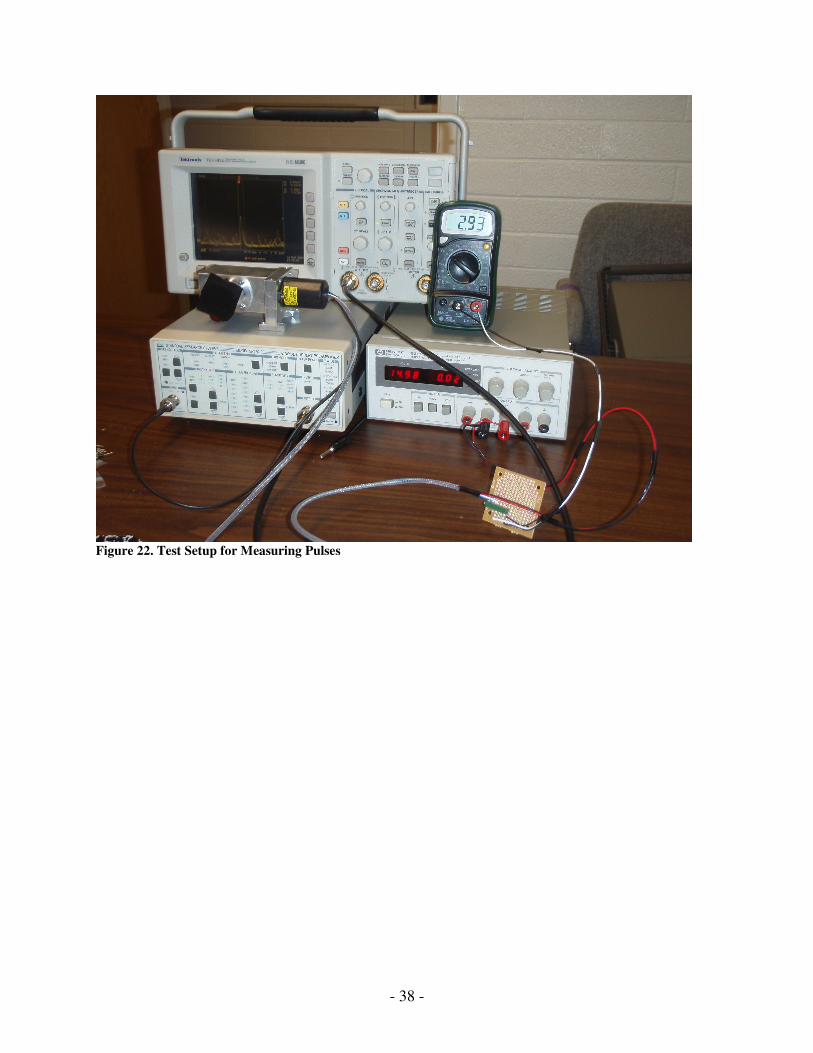
Figure 22. Test Setup for Measuring Pulses

- 39 -
Table 7. Motor Parameter Spreadsheet