final draft of task 2 and task 3 memo 08-01-07 - deq.utah.gov · runoff from snow pack in the...
TRANSCRIPT
Utah Lake TMDL: Pollutant Loading
Assessment &
Designated Beneficial Use
Impairment Assessment
FINAL DRAFT
Prepared For:
State of Utah Division of Water Quality
Prepared By: PSOMAS
4179 Riverboat Road, Suite 200 Salt Lake City, Utah 84123
SWCA
257 East 200 South, Suite 200 Salt Lake City, Utah 84111 August 2007

FINAL DRAFT
Utah Lake TMDL August 2007 Final Draft Lake Loading Pollutant Assessment & 2 of 88 Designated Beneficial Use Impairment Assessment
TABLE OF CONTENTS INTRODUCTION ........................................................................................................................................ 4 WATER BUDGET ....................................................................................................................................... 7
SOURCES OF DATA ..................................................................................................................................... 7 METHODOLOGY.......................................................................................................................................... 7
Inflows................................................................................................................................................... 8 Provo River ....................................................................................................................................................... 9 Spanish Fork River............................................................................................................................................ 9 Benjamin Slough............................................................................................................................................. 10 Mill Race Creek .............................................................................................................................................. 10 Powell Slough ................................................................................................................................................. 10 Hobble Creek .................................................................................................................................................. 11 Precipitation .................................................................................................................................................... 11 Groundwater and Springs................................................................................................................................ 11
Outflows.............................................................................................................................................. 12 WATER BUDGET RESULTS........................................................................................................................ 12 OTHER HYDROLOGIC ANALYSES.............................................................................................................. 18
State Water Plan for Utah Lake Basin................................................................................................ 18 Utah Lake System (ULS) EIS .............................................................................................................. 18 Utah Lake Comprehensive Management Plan (CMP)........................................................................ 19
LOADING ANALYSIS.............................................................................................................................. 20 Total Phosphorus Loading Methodology............................................................................................ 20
TOTAL PHOSPHORUS LOADING RESULTS ................................................................................................. 23 TOTAL DISSOLVED SOLIDS LOADING METHODOLOGY............................................................................. 28 TOTAL DISSOLVED SOLIDS LOADING RESULTS ........................................................................................ 28
BENEFICIAL USE IMPAIRMENT ASSESSMENT – INTRODUCTION.......................................... 31 BENEFICIAL USE IMPAIRMENT ASSESSMENT – SECONDARY CONTACT RECREATION (2B)....................... 32 BENEFICIAL USE IMPAIRMENT ASSESSMENT – WARM WATER GAME FISHERY (3B) ............................... 33
Water Quality Criteria – Based Support Status Determination.......................................................... 33 Fishery Population – Based Support Status Determination ............................................................... 53
Current Population Estimates.......................................................................................................................... 55 Commercial Fishery ........................................................................................................................................ 56 Stocking .......................................................................................................................................................... 56
Habitat Assessment – Based Support Status Determination ............................................................... 56 Correlation of Water Quality and Fish Population Trends ................................................................ 59 Conclusions......................................................................................................................................... 59 Algal Characterization and Biomass .................................................................................................. 60
BENEFICIAL USE IMPAIRMENT ASSESSMENT – OTHER AQUATIC LIFE (3D) ............................................. 61 BENEFICIAL USE IMPAIRMENT ASSESSMENT – AGRICULTURE (4)............................................................ 63
Methodology ....................................................................................................................................... 63 Area of Water Use from Utah Lake ................................................................................................................ 63 Utah Lake Irrigation Water - Deliveries via Canal.......................................................................................... 63 Canal Irrigated Acreage .................................................................................................................................. 67 Crops Breakdown Determination for Canal Deliveries................................................................................... 67 Utah Lake Irrigation Water - Direct Withdrawals........................................................................................... 68 Direct Withdrawal Irrigated Acreage and Crop Breakdown ........................................................................... 68 Agricultural Salinity Tolerances ..................................................................................................................... 68 Water Quality Assessment for Total Dissolved Solids (TDS) and Conductivity (SC).................................... 69
Irrigation Water Results ..................................................................................................................... 70 Utah Lake Irrigation Water Use Acreages ...................................................................................................... 70 Area Irrigated by Utah Lake Water................................................................................................................. 71 Crop Breakdown Determination ..................................................................................................................... 74
Agricultural Salinity Tolerances ......................................................................................................... 74 Water Quality at Utah Lake Outlet ..................................................................................................... 76
Secondary Irrigation........................................................................................................................................ 78

FINAL DRAFT
Utah Lake TMDL August 2007 Final Draft Lake Loading Pollutant Assessment & 3 of 88 Designated Beneficial Use Impairment Assessment
Conclusions......................................................................................................................................... 80 BIBLIOGRAPHY ...................................................................................................................................... 82

FINAL DRAFT
Utah Lake TMDL August 2007 Final Draft Lake Loading Pollutant Assessment & 4 of 88 Designated Beneficial Use Impairment Assessment
Introduction
Utah Lake is located in north-central Utah near the cities of Orem and Provo. With a surface area of 145 sq mi (380 sq km), Utah Lake is the largest freshwater lake in the state, as well as the largest naturally occurring freshwater lake in the western United States, and is used by both Utah Valley and Salt Lake Valley as a water source for a variety of uses. The lake is 24 miles (39 km) long and 13 miles (21 km) wide, at its greatest, with a surface area of approximately 96,600 acres (390 km²) and a volume of just under a million acre-feet (902,400 ac-ft). The relatively small volume of the lake is due to the fact that despite its large surface area, the lake is very shallow. Maximum depth is approximately 18 feet (5.5 m) and the average depth is between 9 and 10 feet (3 m).
Utah Lake's watershed includes areas east and west of the Wasatch Fault, in both the Basin and Range province and the Rocky Mountains. The lake itself and Utah Valley are part of the Basin and Range province, while the mountains east of the valley are part of the Rocky Mountains (See Appendix A). Elevation in the watershed ranges from about 4,000 feet (1,219 m) at the lake surface to over 10,000 feet (3,048 m) in the Wasatch Front. The watershed receives between 9 and 60 inches (23 to 152 cm) of precipitation annually (WRCC, 2006).
Runoff from snow pack in the Wasatch Mountains represents the main source of water to Utah Lake, together with numerous small creeks and streams. Primary inflows to Utah Lake are the American Fork River, the Provo River, Mill Race Creek, Hobble Creek, the Spanish Fork River, and Currant Creek, with the Provo River contributing the greatest flow. Many other tributaries that once contributed water to Utah Lake during spring runoff have been diverted for culinary or agricultural uses. Most tributaries to the lake today are diverted to some degree prior to entering the lake, either for agricultural or culinary uses or as a mechanism to regulate the flow of water into the lake (GSLB 2004). The Jordan River, located at the north end of the lake and flowing into Great Salt Lake, is the lake’s only major outlet.
Utah Lake is a remnant of prehistoric Lake Bonneville, which once covered much of the state. While it is large in surface area, the average depth of the lake is only about 10 feet, allowing wind action to constantly stir up and remix bottom sediments. There are several hot springs around the lake that are popular with local residents, such as those located near Lincoln Beach and Saratoga Springs.
The lake contains one small island, Bird Island, located near Lincoln Beach at the south end of the lake. The island is relatively low and may be completely submerged during high water years.
The lake wetlands are recognized locally and nationally for their critical importance to fish and wildlife resources. The Utah Lake wetland ecosystem is important as a breeding area and stopover for many migratory birds in the Pacific Flyway. The Utah Lake Wetland Preserve is located at the south end of the lake, in and around Goshen Bay. Approximately 226 species of birds are known to use Utah Lake wetlands, as well as 49 mammalian species, 16 species of amphibians and reptiles and 18 species of fish (URMCC 2006).

FINAL DRAFT
Utah Lake TMDL August 2007 Final Draft Lake Loading Pollutant Assessment & 5 of 88 Designated Beneficial Use Impairment Assessment
Fishing occurs year-round in Utah Lake for channel catfish, walleye, white bass, black bass and several different species of panfish. The June sucker (Chasmistes liorus), an endangered species, is found naturally only in Utah Lake and the inflowing Provo River. The lake was also formerly home to the Utah Lake sculpin, believed to be extinct. Many non-native fish have been introduced into Utah Lake, including common carp, walleye, channel catfish, smallmouth and largemouth bass, crappie, bluegill, and green sunfish.
Land use in the watershed is predominantly multiple use public land managed by the US Bureau of Land Management (BLM), State of Utah, or the US Forest Service (USFS); followed by privately owned agricultural lands and urban/suburban lands which include areas immediately adjacent to the lake.
Historic and current human influences on the watershed and the lake include changes to the aquatic biota in the lake, logging and grazing in the watershed, agricultural and stormwater runoff, industrial and municipal discharges, increases in paved surfaces in the watershed, and the diversion of natural inflows to the lake.
Utah Lake is a highly productive lake that experiences extensive algal blooms in the late summer and fall. Trophic state calculations identify the lake as being hypereutrophic, or very nutrient-rich, characterized by frequent and severe nuisance algal blooms and low transparency.
The Utah Lake Total Maximum Daily Load (TMDL) is one of many TMDLs currently planned or in progress in the State of Utah. The TMDL process is described in §303(d) of the Clean Water Act (40 CFR 130.7), the rules implementing §303(d), and Utah State Code (Utah Administrative Code R317-2). The PSOMAS team was selected by the Utah Division of Water Quality (DWQ) to perform the TMDL analysis for the Utah Lake-Jordan River Watershed. The first step in the TMDL process was to gather the available data to use in the impairment assessment of the lake. Data were presented in the Task 1 Memo. This memorandum fulfills the requirements of Task 2 and Task 3 of this contract, described as "Lake Pollutant Loadings" and “Beneficial Use Impairment Assessment”, respectively.
The TMDL for Utah Lake will identify the amount of pollutants that the lake can assimilate without causing the lake to exceed the water quality standards that have been set to protect its designated beneficial uses. This plan will identify the causes of beneficial use impairment and estimate reductions in pollutant loads necessary to meet the water quality standards and restore impaired beneficial uses.
Utah Lake is listed on Utah’s 2004 §303(d) list for exceedances of state criteria for total phosphorus (TP) and total dissolved solids (TDS) concentrations. These concentrations, along with inflow rates, determine the pollutant load into the lake. The goal of Task 2 is to establish a water budget for the lake and to quantify the TP and TDS loadings into Utah Lake.
Total phosphorus is a nutrient that contributes to plant growth in aquatic systems in much the same way as it promotes the growth of agricultural crops and gardens. At low concentrations, it is critical to sustaining a healthy ecosystem but at elevated concentrations it can have detrimental effects. General concerns associated with elevated total phosphorus concentrations include the growth of nuisance algae and periphyton, low dissolved oxygen, elevated pH, and the potential for cyanotoxin
FINAL DRAFT
Utah Lake TMDL August 2007 Final Draft Lake Loading Pollutant Assessment & 6 of 88 Designated Beneficial Use Impairment Assessment
production by cyanobacteria (blue-green algae). Utah Lake regularly experiences large algal blooms, generally during the late summer and fall.
TDS is a measurement of the concentration of mineral salts in water. Most salts are highly soluble and water flowing through salt deposits or salty soils often becomes saline very quickly because the salt dissolves easily. Elevated TDS concentrations are a significant problem for irrigation and stock watering. Some crops do not produce well when irrigated with high TDS water, and irrigation management is often more difficult. If the TDS concentrations in stock water are too high, it can result in reduced milk production in dairy cattle, and illness in beef cattle.
Beneficial uses of Utah Lake are designated by the State of Utah and include secondary contact recreation (activities like boating, wading, or similar uses); warm water game fish and associated food chain; waterfowl, shore birds and other water-oriented wildlife and associated food chains; and agricultural water supply (Utah Administrative Code R317-2-13-12, June 01, 2006).
The warm water fishery beneficial use of the lake is identified as being impaired due to excess total phosphorus. The agricultural beneficial use is listed as being impaired due to high concentrations of TDS. The analyses discussed in this document address the support status of the designated beneficial uses and characterize the level of impairment (if any) specific to the listed pollutants.

FINAL DRAFT
Utah Lake TMDL August 2007 Final Draft Lake Loading Pollutant Assessment & 7 of 88 Designated Beneficial Use Impairment Assessment
Water Budget
A water budget for Utah Lake was prepared as part of this study. A water budget is an account of all inflows and outflows from a hydrologic system. Since pollutant loading calculations are heavily influenced by stream flows, it is extremely important that the water budget be accurate so that the resulting nutrient and salt loads are accurate. The Utah Lake watershed covers approximately 3,000 square miles, including mountains and valleys, urban and rural areas. The valleys are generally arid and slope gently to the lake. Mountainous areas in the watershed receive greater levels of precipitation and consequently have more lush vegetation. The watershed contains a variety of soil types, vegetation, and land uses, and has been heavily influenced by man-made structures such as dams/impoundments, irrigation diversions, and trans-basin diversions.
This chapter will address the data and methodology used to determine the Utah Lake water budget, present the water budget results, and compare results to other published hydrologic studies of Utah Lake.
Sources of Data To generate a detailed water budget, flows for all surface tributaries, groundwater fluxes, precipitation, evaporation, and surface outflows must be included.
Data for Utah Lake and contributing tributaries are available from the US Environmental Protection Agency (EPA) and the US Geological Survey (USGS). The STORET database is the EPA’s national repository for water quality, biological, and physical data. Flow measurements were measured or estimated at the time water quality samples were collected. Other flow data are available from USGS flow gages. USGS flow coverage is excellent where available, however few of Utah Lake’s many tributaries are gauged.
In the early 1970s, researchers in the Civil & Environmental Engineering Department at Brigham Young University (BYU) developed the Utah Lake Water Quality Salinity Model (LKSIM) computer model in order to create a complete hydrologic analysis of Utah Lake. The LKSIM model’s objective is to enhance estimates of hydrologic data and model the water and salinity balances of Utah Lake. The model is used to predict in-lake salinity concentrations based on several inputs such as tributary flows, evaporation, and precipitation. These inputs are calculated outside of the model. Real flow measurements are used when available and unmeasured flows are calculated using a variety of correlations developed from existing measured flow data.
The LKSIM model uses calculated monthly data for precipitation, evaporation, and available measured inflows and outflows. Precipitation data and other climatic data such as air temperature, relative humidity, and solar radiation are then used to calculate evaporation through the application of an evaporation model with results entered into the LKSIM model.
Methodology The hydrologic analysis for the Utah Lake TMDL was based entirely on the LKSIM model since it incorporates actual measured flow data with estimates of other flows (e.g. surface drains, groundwater, springs) to create a comprehensive water budget for the lake. During the 1970s researchers at BYU conducted a large sampling effort that
FINAL DRAFT
Utah Lake TMDL August 2007 Final Draft Lake Loading Pollutant Assessment & 8 of 88 Designated Beneficial Use Impairment Assessment
provided actual flow data for tributaries that were previously unmeasured. The data for these flows were then correlated to precipitation or to flow at other locations in the watershed. These correlations were used to generate input flow data for the LKSIM model. The input flow database has been updated several times over the years as precipitation stations were discontinued or flow conditions changed. Because it is continually updated, the model progressively improves estimates for uncertain components of the water budget such as evaporation, mineral spring inflow and unmeasured fresh water inflow.
The LKSIM model uses monthly average flows for a combination of 74 inflows and 3 outflows, in addition to precipitation and evaporation. These flows are either direct inputs from existing flow records or calculated from correlation equations. Most flows in the model were calculated based on statistical regression correlations of precipitation or flow at other locations in the watershed. In this case, new precipitation or associated flow data are used in the correlation to calculate new flows. Some exceptions are the Provo River, which has a continuous flow recorder, and WWTP flows, which were obtained directly from plant records.
Monthly averages for the entire period of study (1980 through 2003) for each individual flow were obtained from the LKSIM model output and used to create a monthly water budget. Appendix A contains a map of the general hydrology of Utah Lake with the location of inflow tributaries.
Storm water inputs were not addressed in the LKSIM modeling report (Appendix B) due to lack of available data. Currently, only the City of Provo has a separate storm water plan and report available for review. All of the remaining municipal stormwater discharges within the area operate under the required general permit for municipal separate storm sewer systems (MS4) for small operators.
The hydrologic analysis spans a time period from 1980 to 2003 for the Utah Lake TMDL study. This range of data provides a historical look at the lake including periods of normal, above normal, and below normal precipitation conditions.
The following sections discuss some of the inflows and outflows incorporated in the LKSIM model analysis and provide an explanation of how the data were calculated or obtained. Only the primary inflows and outflow are summarized here. A complete description of the model analysis is included in Appendix B.
Inflows
Primary inflows to Utah Lake are the American Fork River, the Provo River, Mill Race Creek, Hobble Creek, the Spanish Fork River, and Currant Creek. These flows are joined by many minor inflows, both perennial and intermittent. Most of the major inflows have been modified from their pre-settlement conditions and contain water from other watersheds not previously connected as discussed below.
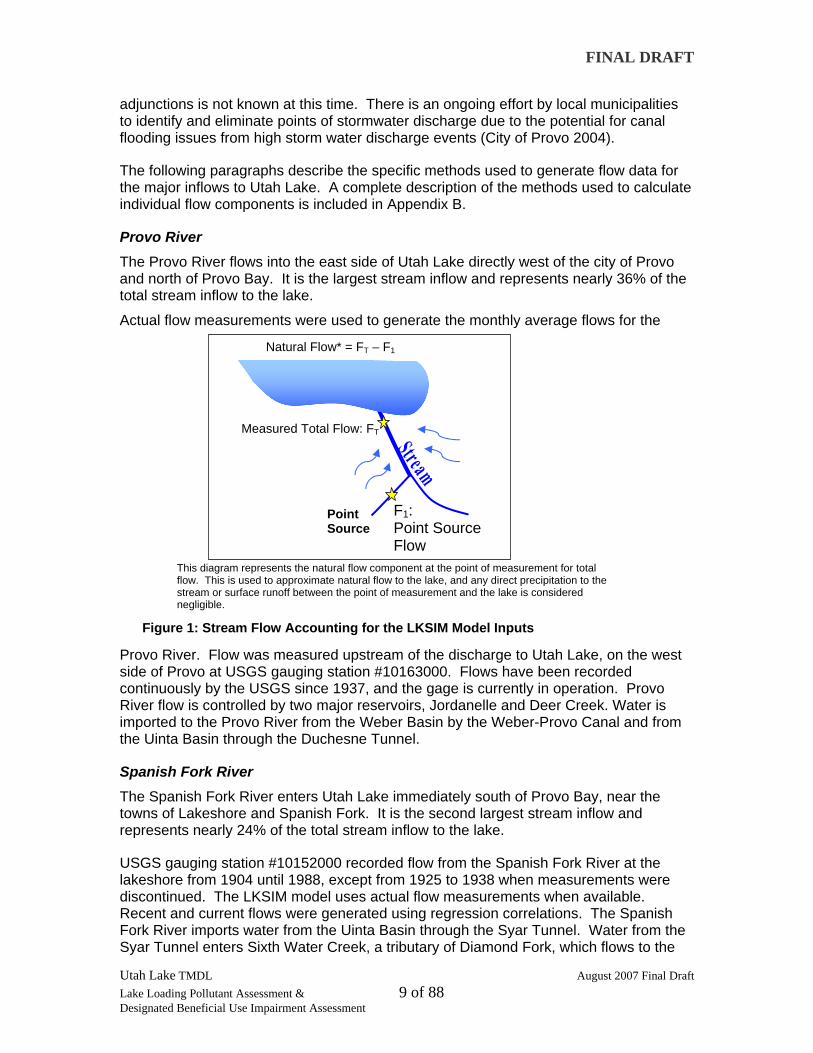
The LKSIM model incorporates flows for 74 surface and ground water inflows. Examples of these surface flows are streams, point source discharges, ditches, and land drains. It is important to note that, in general, LKSIM tracks the natural flow of a stream separately from any discharges into the stream such as point source discharges (Figure 1). It is known that some canals within the watershed have storm water inputs that are directly integrated to the canal diversion flows. The exact amount of these flow
FINAL DRAFT
Utah Lake TMDL August 2007 Final Draft Lake Loading Pollutant Assessment & 9 of 88 Designated Beneficial Use Impairment Assessment
adjunctions is not known at this time. There is an ongoing effort by local municipalities to identify and eliminate points of stormwater discharge due to the potential for canal flooding issues from high storm water discharge events (City of Provo 2004).
The following paragraphs describe the specific methods used to generate flow data for the major inflows to Utah Lake. A complete description of the methods used to calculate individual flow components is included in Appendix B.
Provo River The Provo River flows into the east side of Utah Lake directly west of the city of Provo and north of Provo Bay. It is the largest stream inflow and represents nearly 36% of the total stream inflow to the lake.
Actual flow measurements were used to generate the monthly average flows for the
Provo River. Flow was measured upstream of the discharge to Utah Lake, on the west side of Provo at USGS gauging station #10163000. Flows have been recorded continuously by the USGS since 1937, and the gage is currently in operation. Provo River flow is controlled by two major reservoirs, Jordanelle and Deer Creek. Water is imported to the Provo River from the Weber Basin by the Weber-Provo Canal and from the Uinta Basin through the Duchesne Tunnel.
Spanish Fork River The Spanish Fork River enters Utah Lake immediately south of Provo Bay, near the towns of Lakeshore and Spanish Fork. It is the second largest stream inflow and represents nearly 24% of the total stream inflow to the lake.
USGS gauging station #10152000 recorded flow from the Spanish Fork River at the lakeshore from 1904 until 1988, except from 1925 to 1938 when measurements were discontinued. The LKSIM model uses actual flow measurements when available. Recent and current flows were generated using regression correlations. The Spanish Fork River imports water from the Uinta Basin through the Syar Tunnel. Water from the Syar Tunnel enters Sixth Water Creek, a tributary of Diamond Fork, which flows to the
This diagram represents the natural flow component at the point of measurement for total flow. This is used to approximate natural flow to the lake, and any direct precipitation to the stream or surface runoff between the point of measurement and the lake is considered negligible.
Point Source
F1: Point Source Flow
Measured Total Flow: FT
Natural Flow* = FT – F1
Figure 1: Stream Flow Accounting for the LKSIM Model Inputs

FINAL DRAFT
Utah Lake TMDL August 2007 Final Draft Lake Loading Pollutant Assessment & 10 of 88 Designated Beneficial Use Impairment Assessment
Spanish Fork River. Diamond Fork Creek flows include water from Upper Stillwater Reservoir, the Duchesne River, Currant Creek, Layout Creek and Water Hollow Creek, all of which is drained through the Strawberry Tunnel.
Because the flow in the Spanish Fork River is heavily influenced by irrigation diversions, different correlations were used to calculate flow during the irrigation season than for the rest of the year. Outside of irrigation season (October through May), when diversions have minimal effect on the Spanish Fork River, direct inflows were calculated from a correlation developed using flows measured at the USGS gauging station #10150500 located upstream at Castilla.
During irrigation season (June through September), when irrigation diversions draw most flow out of the river, flows were calculated using a more complex relationship. Since the Provo River gage (#10163000) has an excellent period of record and both rivers are heavily influenced by irrigation diversions, flow in the Spanish Fork River was estimated from measured Provo River flows using the following correlations. First a ratio was developed for the Provo River relating flow at locations before and after most of the water was diverted. Using the same method, a ratio was developed using USGS flow data for Spanish Fork River before and after most flow was diverted. Then the ratio for the Spanish Fork River was correlated to the ratio for the Provo River.
Benjamin Slough Benjamin Slough enters Utah Lake near Lincoln Point, located on the southeast side of the lake, immediately north of the town of Payson. The slough functions as part of the Utah Lake Wetlands Preserve and contains the inflows of Beer Creek, Spring Creek and Peteetneet Creek. The total inflow from Benjamin Slough represents approximately 9% of the total stream inflow to the lake.
Benjamin Slough drains the eastern slope of West Mountain and the areas of Payson, Salem, and Benjamin. It also carries effluent from Salem and Payson WWTPs. To calculate a natural flow through the area, WWTP flows were subtracted from measured flow from the area, and the resulting component was correlated with precipitation.
Mill Race Creek Mill Race Creek is located on the east side of the lake, near the Provo Wetlands area, between the towns of Springville and Provo. It drains an area adjacent to the Provo WWTP and discharges into Provo Bay east of Interstate 15. The inflow of Mill Race Creek represents approximately 8% of the total stream inflow to the lake.
Mill Race Creek receives water from Provo WWTP and some land drains. Similar to Benjamin Slough, the WWTP and drain flows were removed before correlating natural flow with precipitation.
Powell Slough Powell Slough is a small, slow moving stream that enters Utah Lake just south of the former Geneva Steel location, west of the town of Orem. The slough flows through the Powell Slough Waterfowl Management Area, a large marshy area near the Orem Waste Water Treatment Plant that provides habitat for a variety of shore birds and other waterfowl.

FINAL DRAFT
Utah Lake TMDL August 2007 Final Draft Lake Loading Pollutant Assessment & 11 of 88 Designated Beneficial Use Impairment Assessment
The inflow from Powell Slough represents approximately 6% of the total stream inflow to the lake. The flow from Powell Slough into Utah Lake was calculated using the Average Valley Precipitation Index.
Hobble Creek Hobble Creek enters Utah Lake through Provo Bay on the east side of the lake, flowing between the towns of Provo and Springville.
The inflow from Hobble Creek represents approximately 5% of the total stream inflow to the lake. Flow data for Hobble Creek prior to 1991 were calculated by correlation with Spanish Fork River flows at the Lakeshore gage. In 1991, the Lakeshore gauging station was removed and flow calculation using this correlation was not possible. Recent flows were calculated using the Santaquin precipitation index to update the Hobble Creek flows.
Minor tributaries include the Mill Pond, Dry Creek (located south of Provo Bay), Spring Creek, White Lake overflow, Big Dry Creek, the American Fork River, Minnie Creek, Little Dry Creek and another Dry Creek located near Lehi, Utah, which account for approximately 13% of the total inflow collectively.
The method of flow correlation for the above listed minor tributaries varied dependant upon the location of the tributary within the watershed and included the Average Valley Precipitation Index, nearby measured precipitation indices, and streamflow correlations. The complete correlation method used for each tributary is described in Appendix B.
Precipitation Direct precipitation into the lake was calculated on a monthly basis. The precipitation values were generated based upon weather stations over the area of the lake using the Theissen Polygon method (see Appendix B). Precipitation stations used to generate the precipitation index include those located at Lehi, Orem, Provo, Payson, and Santaquin. The three polygons derived from the Theissen Polygon Method include the Main Lake, Provo Bay, and Goshen Bay polygons.
Groundwater and Springs Flow from all thermal springs throughout the lake was calculated using salinity properties of the springs. The model uses calculated inflows from springs such as Saratoga Springs, Goshen Bay, and numerous main lake springs. A listing of thermal springs near Utah Lake may be found at the following interactive mapping website http://geology.utah.gov/geothermal/interactive/index.html.
LKSIM generates a salinity budget and a hydrologic budget for the lake. Thermal flows were calculated based on the salt mass balance for the lake, and salinity properties of thermal springs. Once thermal flows were calculated, freshwater ground water and seepage flows were calculated based on the water balance for the LKSIM hydrologic budget.
From the final budget for surface and groundwater/spring flows, evaporation, precipitation, and changes in lake stage, based on the calculated water budget, were calculated using the LKSIM model. The model used these input parameters, as well as water quality inputs to calculate the balance of salts coming into and going out of the lake.

FINAL DRAFT
Utah Lake TMDL August 2007 Final Draft Lake Loading Pollutant Assessment & 12 of 88 Designated Beneficial Use Impairment Assessment
Model calibration was carried out through establishment of the primary water budget (discussed above), followed by adjustment and refinement of less measurable processes (such as evaporation, localized mixing, transport and processing, and others), until the results reflected measured water quality. A more detailed description of the LKSIM hydrologic and salinity budget and calibration process is included in Appendix B.
Outflows The LKSIM model generated monthly average flows for the Jordan River (flowing out of Utah Lake), groundwater seepage and evaporation. From 1935 to 1991, the flow for the Jordan River was recorded at the USGS gauging station at the Narrows, and at canals that bypass the gage including Utah and Salt Lake Canal and the East Jordan Canal. These monthly flows are recorded in the Jordan River Commissioner’s annual report. Since the gage was discontinued in 1991, flows for the Jordan River were obtained from the Jordan River/Utah Lake Water Commissioner's Office via Utah’s Division of Water Rights. Evaporation was calculated by the Morton model (Morton 1986), which is based on air temperature, relative humidity, and solar radiation. Further discussion of the model used to calculate evaporation is included in Appendix B.
Water Budget Results
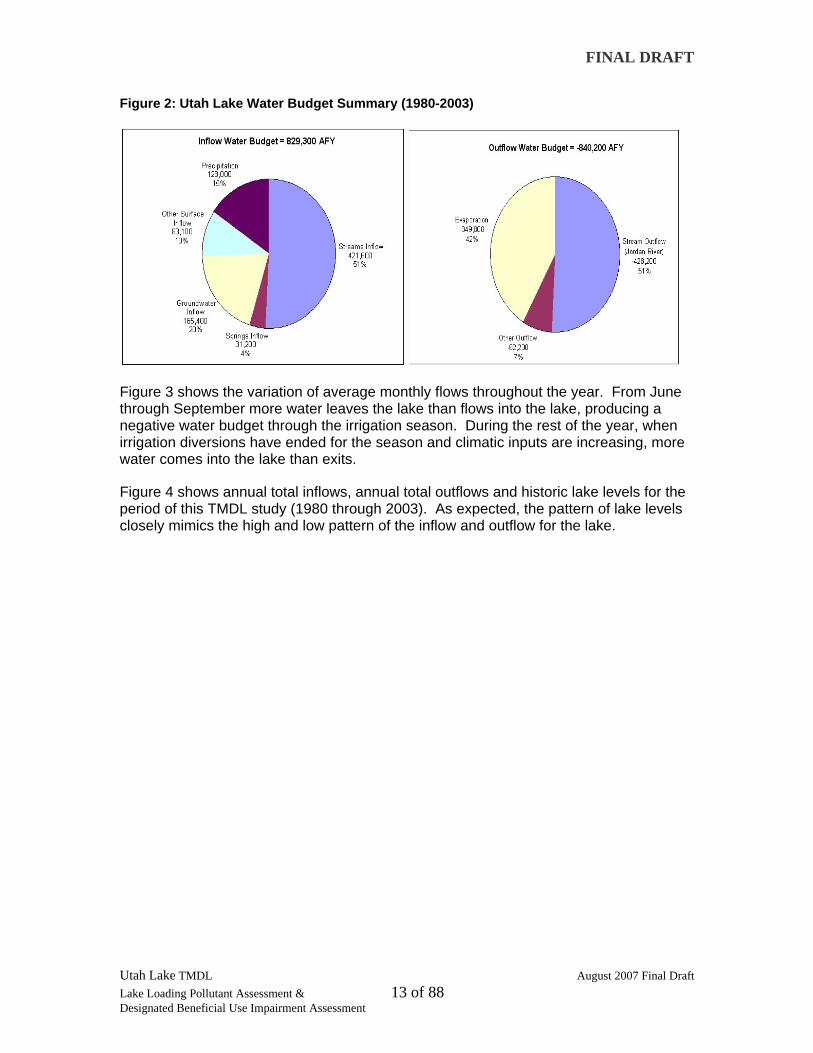
The Utah Lake water budget is summarized by month and based on average flow data from 1980 through 2003. Table 1 and Figure 2 show a summary of the water budget by category.
Streams contribute more flow to Utah Lake than any other inflow category. The Provo River, Spanish Fork River, Beer Creek (flows into Benjamin Slough), Mill Race Creek, Powell Slough, and Hobble Creek together comprise roughly 43 percent of all inflow into the lake with a total stream inflow for all streams at about 51 percent.
Groundwater and springs together contribute approximately 24 percent of the total inflow to the lake, and precipitation accounts for an additional 15 percent. The remaining 10 percent of inflow is contributed by miscellaneous surface drains and direct discharge of overland surface flow to the lake.
Water exits Utah Lake in two primary ways: through the Jordan River, and through direct evaporation. Together, these two processes account for approximately 51 percent and 42 percent of the total lake outflow respectively. The remaining 7 percent seeps to groundwater.
FINAL DRAFT
Utah Lake TMDL August 2007 Final Draft Lake Loading Pollutant Assessment & 13 of 88 Designated Beneficial Use Impairment Assessment
Figure 2: Utah Lake Water Budget Summary (1980-2003)
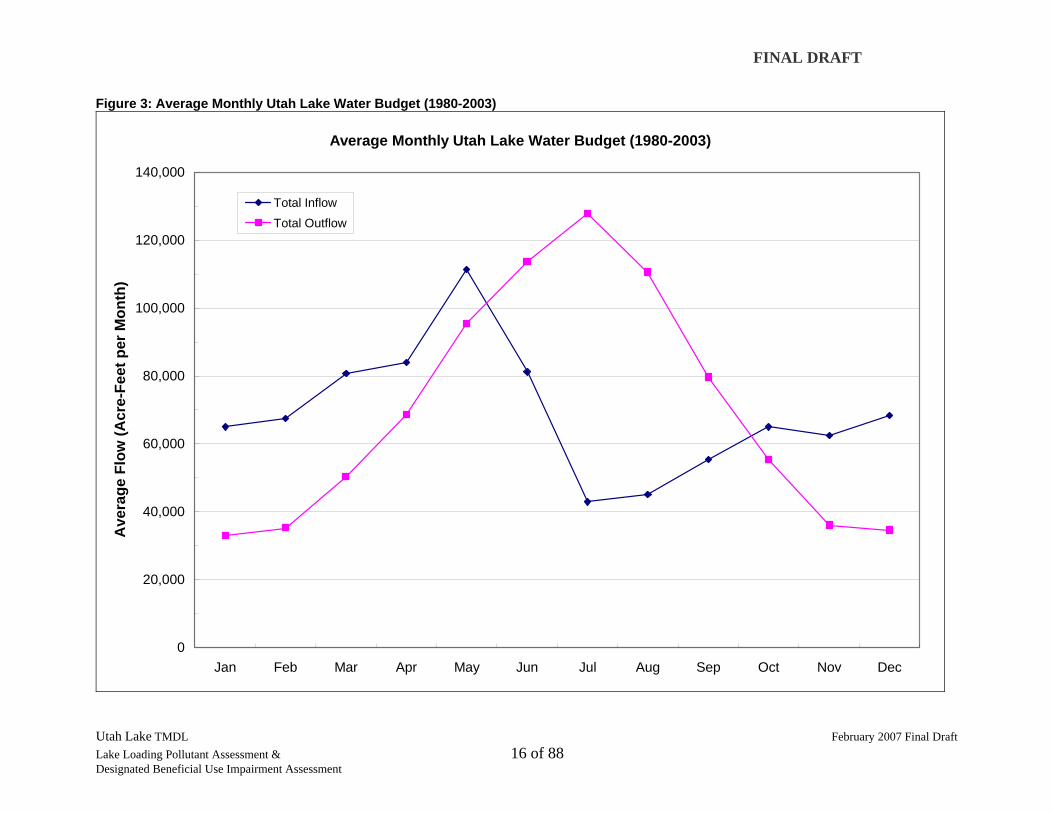
Figure 3 shows the variation of average monthly flows throughout the year. From June through September more water leaves the lake than flows into the lake, producing a negative water budget through the irrigation season. During the rest of the year, when irrigation diversions have ended for the season and climatic inputs are increasing, more water comes into the lake than exits.
Figure 4 shows annual total inflows, annual total outflows and historic lake levels for the period of this TMDL study (1980 through 2003). As expected, the pattern of lake levels closely mimics the high and low pattern of the inflow and outflow for the lake.

FINAL DRAFT
Utah Lake TMDL February 2007 Final Draft Lake Loading Pollutant Assessment & 14 of 88 Designated Beneficial Use Impairment Assessment
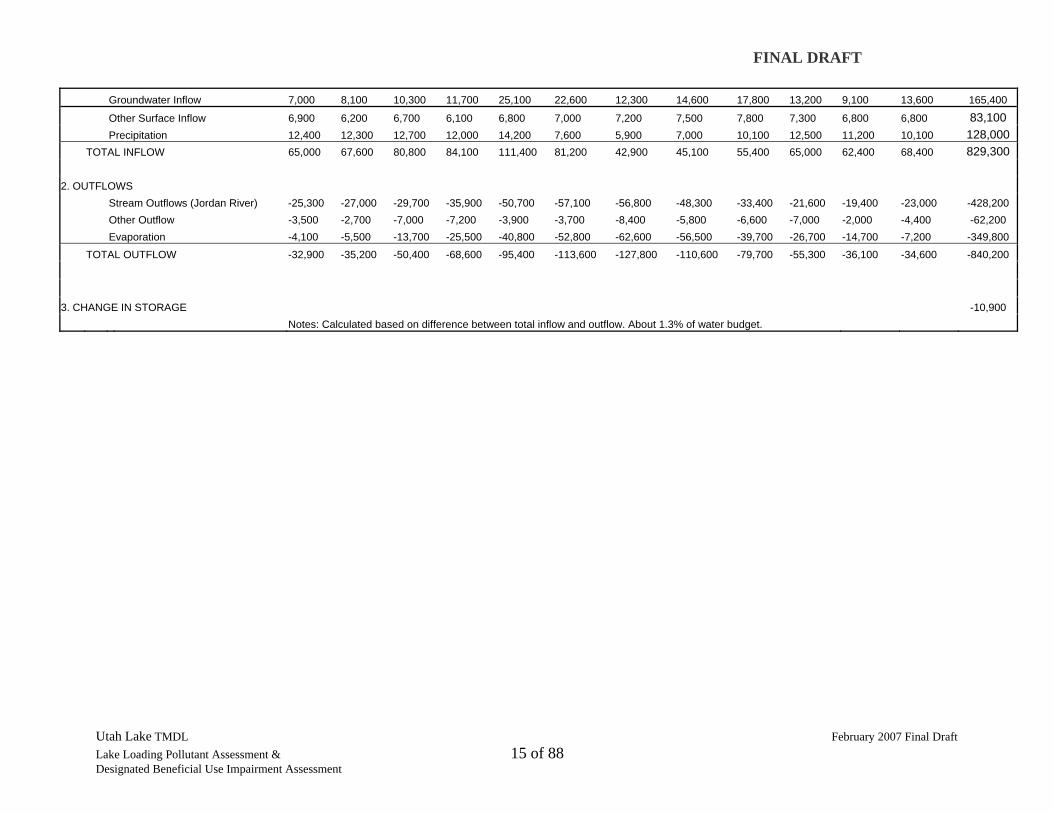
Table 1: Utah Lake Water Budget (Monthly Averages 1980-2003) Flow Rate (Acre-Feet per Month)
Description Jan Feb Mar Apr May Jun Jul Aug Sep Oct Nov Dec Total 1. INFLOWS Provo River 11,500 12,500 16,500 18,300 25,900 21,700 3,600 2,500 5,400 10,700 10,300 12,100 151,000 Provo River (natural) 11,400 12,400 16,300 18,200 25,900 21,700 3,600 2,500 5,300 10,700 10,200 12,000 150,200 Drain 100 100 200 100 0 0 0 0 100 0 100 100 800
Spanish Fork River 8,300 8,800 12,100 16,100 22,100 5,800 1,400 1,400 1,500 5,800 8,100 8,300 99,700 Benjamin Slough 4,200 4,200 5,800 4,000 3,100 1,800 800 1,000 1,700 2,900 3,500 3,700 36,700 Benjamin Slough (natural) 4,000 4,000 5,600 3,800 2,900 1,600 600 800 1,500 2,700 3,300 3,500 34,300 Salem WWTP 100 100 100 100 100 100 100 100 100 100 100 100 1,200 Payson WWTP 100 100 100 100 100 100 100 100 100 100 100 100 1,200 Mill Race Creek 2,800 2,500 2,700 2,400 2,600 2,900 3,400 3,200 2,800 2,900 2,800 2,500 33,500 Provo WWTP 1,200 1,100 1,200 1,200 1,600 1,800 2,000 2,000 1,700 1,400 1,200 1,100 17,500 Mill Race Creek (natural) 1,100 1,100 1,100 800 500 500 600 600 500 800 900 900 9,400 Drains 500 300 400 400 500 600 800 600 600 700 700 500 6,600 Powell Slough 2,300 2,500 2,200 2,000 1,900 1,700 1,900 2,000 2,100 2,100 2,000 2,200 24,900 Powell Slough (natural) 1,600 1,800 1,500 1,300 1,100 900 1,100 1,100 1,200 1,200 1,300 1,400 15,500 Orem (WWTP) 700 700 700 700 800 800 800 900 900 900 700 800 9,400
Hobble Creek 2,400 2,400 3,400 4,100 2,200 700 100 100 200 800 1,300 2,100 19,800
Mill Pond 1,100 1,000 1,100 900 900 1,100 900 900 1,000 1,000 1,100 1,100 12,100 Dry Creek (South of Provo Bay) 1,100 1,100 1,300 900 600 500 400 400 700 1,100 1,300 1,200 10,600 Dry Creek (natural) 900 900 1,000 700 300 200 100 100 400 800 1,000 900 7,300 Spanish Fork WWTP 200 200 300 200 300 300 300 300 300 300 300 300 3,300 Spring Creek (East of Provo Bay) 700 700 800 700 700 800 800 700 700 700 800 700 8,800 Spring Creek (natural) 500 400 500 400 400 400 400 300 300 400 500 500 5,000 Springville WWTP 200 300 300 300 300 400 400 400 400 300 300 200 3,800
White Lake Overflow to Goshen Bay 900 1,800 1,100 600 300 100 0 0 0 300 600 500 6,200 Big Dry Creek 300 300 400 400 500 700 700 700 600 600 400 400 6,000 American Fork River 100 100 200 500 1,000 3,000 500 100 100 100 100 100 5,900 Minnie Creek 300 300 500 300 400 400 300 300 200 300 300 300 3,900 Little Dry Creek 100 100 200 200 200 200 100 100 100 100 100 100 1,600 Dry Creek (Lehi) 0 100 200 300 300 0 0 0 0 0 0 0 900
Streams Inflow 36,100 38,400 48,500 51,700 62,700 41,400 14,900 13,400 17,100 29,400 32,700 35,300 421,600
Springs Inflow 2,600 2,600 2,600 2,600 2,600 2,600 2,600 2,600 2,600 2,600 2,600 2,600 31,200
FINAL DRAFT
Utah Lake TMDL February 2007 Final Draft Lake Loading Pollutant Assessment & 15 of 88 Designated Beneficial Use Impairment Assessment
Groundwater Inflow 7,000 8,100 10,300 11,700 25,100 22,600 12,300 14,600 17,800 13,200 9,100 13,600 165,400
Other Surface Inflow 6,900 6,200 6,700 6,100 6,800 7,000 7,200 7,500 7,800 7,300 6,800 6,800 83,100 Precipitation 12,400 12,300 12,700 12,000 14,200 7,600 5,900 7,000 10,100 12,500 11,200 10,100 128,000 TOTAL INFLOW 65,000 67,600 80,800 84,100 111,400 81,200 42,900 45,100 55,400 65,000 62,400 68,400 829,300 2. OUTFLOWS Stream Outflows (Jordan River) -25,300 -27,000 -29,700 -35,900 -50,700 -57,100 -56,800 -48,300 -33,400 -21,600 -19,400 -23,000 -428,200 Other Outflow -3,500 -2,700 -7,000 -7,200 -3,900 -3,700 -8,400 -5,800 -6,600 -7,000 -2,000 -4,400 -62,200 Evaporation -4,100 -5,500 -13,700 -25,500 -40,800 -52,800 -62,600 -56,500 -39,700 -26,700 -14,700 -7,200 -349,800 TOTAL OUTFLOW -32,900 -35,200 -50,400 -68,600 -95,400 -113,600 -127,800 -110,600 -79,700 -55,300 -36,100 -34,600 -840,200
3. CHANGE IN STORAGE -10,900 Notes: Calculated based on difference between total inflow and outflow. About 1.3% of water budget.
FINAL DRAFT
Utah Lake TMDL February 2007 Final Draft Lake Loading Pollutant Assessment & 16 of 88 Designated Beneficial Use Impairment Assessment
Figure 3: Average Monthly Utah Lake Water Budget (1980-2003)
Average Monthly Utah Lake Water Budget (1980-2003)
0
20,000
40,000
60,000
80,000
100,000
120,000
140,000
Jan Feb Mar Apr May Jun Jul Aug Sep Oct Nov Dec
Ave
rage
Flo
w (A
cre-
Feet
per
Mon
th)
Total InflowTotal Outflow

FINAL DRAFT
Utah Lake TMDL February 2007 Final Draft Lake Loading Pollutant Assessment & 17 of 88 Designated Beneficial Use Impairment Assessment
Figure 4: Annual Flows and Annual Average Utah Lake Levels
Utah Lake Flows and Lake Levels
0
200,000
400,000
600,000
800,000
1,000,000
1,200,000
1,400,000
1,600,000
1,800,000
1980
1981
1982
1983
1984
1985
1986
1987
1988
1989
1990
1991
1992
1993
1994
1995
1996
1997
1998
1999
2000
2001
2002
2003
Acr
e-Fe
et p
er Y
ear
4476
4477
4478
4479
4480
4481
4482
4483
4484
4485
4486
4487
4488
4489
4490
4491
4492
4493
4494
Lake
Lev
el (f
t)
Total Annual Inflow
Total Annual Outflow
Average Annual Lake Elevation
FINAL DRAFT
Utah Lake TMDL August 2007 Final Draft Lake Loading Pollutant Assessment & 18 of 88 Designated Beneficial Use Impairment Assessment
Other Hydrologic Analyses There have been a few studies and programs that have determined the hydrologic balance for Utah Lake in addition to the Utah Lake TMDL study including:
Study Source Utah State Water Plan for Utah Lake Basin State of Utah, Division of Water Resources
Central Utah Project (CUP) Utah Lake System Environmental Impact Statement (ULS EIS)
Central Utah Water Conservancy District
Utah Lake Comprehensive Management Plan Resource Document
State of Utah, Division of Forestry, Fire, and State Lands.
A brief description of each study and its application relative to the Utah Lake TMDL follows.
State Water Plan for Utah Lake Basin This study included a general hydrologic analysis for the entire basin. According to the Division of Water Resources, the water budget used to generate this report was completed in the 1970s. Due to the complexity of water rights, exchanges, and scarce flow monitoring data, flow in the basin was calculated on a basin-wide level that included Utah Lake. Specific to Utah Lake, data for the Jordan River were recorded at the Narrows USGS gauging station (#10167000) immediately downstream from the outflow of Utah Lake, from 1936 to1991. The average flow recorded during that time period of 310,000 acre-feet per year (AFY) was similar to but not directly comparable to the LKSIM model average from 1980 to 2003 of 428,200 AFY. In general, Utah Lake inflows were back-calculated using historical data from the Jordan River outflow gage, the lake’s elevation, and estimates of precipitation and evaporation for the Basin. Because this analysis was not limited to the Utah Lake boundary, it is not comparable to the Utah Lake TMDL water budget that focuses specifically on Utah Lake.
Utah Lake System (ULS) EIS Unlike the Utah Lake TMDL water budget analysis, the ULS EIS baseline hydrologic analysis does not reflect historical conditions. Rather, this study predicted flows under full Central Utah Project (CUP) delivery scenarios. The Central Utah Project (CUP), a joint effort between the U.S. Bureau of Reclamation (USBR) and the Central Utah Water Conservancy District (CUWCD) is located in the central and east central part of Utah. CUP water developed by the Central Utah Project will be used for municipal, industrial, irrigation, hydroelectric power, fish, wildlife, conservation, and recreation, and will improve flood control capability and assist in water quality control (USBR 2006).
The ULS EIS analysis was based on a 50-year historical average (1950 through 1999) of LKSIM data and modified to reflect future CUP changes. While the ULS EIS hydrologic analysis and the Utah Lake TMDL water budget are not directly comparable, the most significant differences between the two assessments are apparent in the Provo and Spanish Fork River flows. This illustrates the difference between historical and future water uses as future Provo River flow will be significantly decreased in exchange for increasing Spanish Fork River flow as stated in the ULS EIS.

FINAL DRAFT
Utah Lake TMDL August 2007 Final Draft Lake Loading Pollutant Assessment & 19 of 88 Designated Beneficial Use Impairment Assessment
Utah Lake Comprehensive Management Plan (CMP) The Utah Lake Comprehensive Management Plan (Horns 2005) summarizes the current conditions of Utah Lake and was prepared by Utah Valley State College for the State of Utah, Division of Forestry, Fire, and State Lands. The hydrologic analysis section of this report relies on the LKSIM model. Therefore, the resulting values are very similar to those used for the Utah Lake TMDL. Minor differences can be attributed to different averaging periods. The CMP analysis uses multiple time periods. For example, some parts of the CMP analysis use the 1930 to 2003 time period, and others use the 1979 water year. The TMDL process for Utah Lake used the 1980 to 2003 time period.

FINAL DRAFT
Utah Lake TMDL August 2007 Final Draft Lake Loading Pollutant Assessment & 20 of 88 Designated Beneficial Use Impairment Assessment
Loading Analysis
One of the principal objectives of the TMDL process is to quantify the amount, or loading, of pollutants that enter the water body. The stream load represents the total mass of a pollutant that passes a given point in the stream during the time period considered. The loading into a lake or reservoir represents the total of the loads from all of the inflows. For Utah Lake, total phosphorus (TP) and total dissolved solids (TDS) loads into the lake were calculated. This section describes the methodology and results of the loading analyses.
Total Phosphorus Loading Methodology UDEQ has identified a water quality pollution indicator threshold value of 0.05 mg/L for rivers and streams and 0.025 mg/L total phosphorus for lakes and reservoirs (Utah Administrative Code R317-2-14, June 01, 2006). Observed concentrations above this threshold act as an indication that further assessment is necessary to determine if nutrient concentrations or algal populations are sufficient to impair beneficial uses.
As summarized in Table 1, the water budget consists of average monthly flow values averaged over the period of study (1980 through 2003) for 74 inflows, the Jordan River outflow, evaporation and ground-water seepage. These monthly flow components were then paired with monthly TP concentrations. Average monthly TP loads were calculated for each component of the water budget for the entire period of study. The total load for a stream with multiple components was calculated by summing the component loads (L1, L2). This assumes that any unknown load addition or removal (L*) is negligible (Figure 5).
When available, flows were matched directly with concentration data from a STORET station at the same location to calculate TP loading. Where monthly concentrations were missing for no more than one consecutive month, an average monthly concentration was calculated from the preceding and following month’s average concentrations.
Point Source
Natural Flow
L1 L2
Total Load = L1 + L2 (± L*)
L*
Figure 5. Total Phosphorus Loading Calculations for Utah Lake Inflows

FINAL DRAFT
Utah Lake TMDL August 2007 Final Draft Lake Loading Pollutant Assessment & 21 of 88 Designated Beneficial Use Impairment Assessment
Where TP concentrations from STORET were not available, flows were grouped according to watershed characteristics with the potential to influence water quality and were assigned a TP concentration based on available grab sample data, TP concentrations observed in similar systems or recorded in literature and the best professional judgment of researchers familiar with the hydrologic and loading budgets of Utah Lake. For example, surface drains receiving agricultural runoff were assumed to have higher concentrations of TP than lake overflows or groundwater based on data collected in other, similar watersheds and studies cited in current literature.
Table 2 lists the TP concentrations by category that were assigned where sufficient data were not directly available. The flows with assigned TP concentrations comprise approximately 36 percent of the water budget. The lake overflows category includes 2 flows accounted for in the LKSIM model, White Lake overflow into Goshen Bay and Mill Pond overflow.
Table 2: Assumed Water Quality Group Concentrations
Water Quality Group TP mg/L
Drains & Small Natural Inflows 0.15
Lake Overflows 0.10
Groundwater 0.02
Average TP concentrations from STORET were calculated at each station for each month of each year where data were available. Specific average monthly concentrations for each separate year were averaged over the period of study where five or more years of data were available in order to remove bias caused by heavy sampling in any individual year and to improve statistical reliability. This methodology allowed the calculation of mean monthly TP concentrations that were more robust and representative of average conditions occurring in the watershed. The TP concentrations calculated for all available STORET stations are shown in Table 3.
Table 4 shows the matching flow and water quality data used to calculate each load component. All STORET stations exactly match the associated flow, with one exception. Benjamin Slough receives natural flow from two main components, Beer Creek and Spring Creek; however adequate STORET data were only available for Beer Creek (STORET #499545). Therefore, water quality in Spring Creek was assumed to be equal to water quality in Beer Creek.
It should be noted that this analysis did not address in-stream nutrient cycling of TP. It has been demonstrated in research that nutrients in stream ecosystems are alternately taken up by organisms and released back to water many times as they are transported downstream (ORNL, 1994). This process is known as spiraling. With efficient biological uptake, spiraling will increase the biological productivity of the stream ecosystem. Spiraling occurring in the tributary inflows may have an influence on total nutrient levels being delivered to the lake and should be examined in greater detail for a complete analysis of surface water loading delivered to Utah Lake.

FINAL DRAFT
Utah Lake TMDL August 2007 Final Draft Lake Loading Pollutant Assessment & 22 of 88 Designated Beneficial Use Impairment Assessment
Table 3: Average Monthly Total Phosphorus Concentrations (mg/L) Calculated from Available STORET Data
Station STORET Description Type Jan Feb Mar Apr May Jun Jul Aug Sep Oct Nov Dec 499460 JORDAN R AT BLUFFDALE ROAD XING S 0.058 0.072 0.063 0.097 0.097 0.087 0.112 0.150 0.146 0.108 0.069 0.074 499472 JORDAN R AT NARROWS - PUMP STATION S 0.081 0.096 0.082 0.070 0.121 0.130 0.168 0.168 0.212 0.111 0.075 0.053 499479 JORDAN RIVER S 0.072 0.053 0.073 0.105 0.175 0.160 0.197 0.212 0.208 0.102 0.070 0.044
499504 TIMPANOGOS WWTP F 4.085 4.146 4.659 4.879 4.916 3.328 3.700 3.621 4.805 4.589 4.777 4.189 499525 OREM WWTP F 5.858 6.245 5.890 6.538 7.209 5.900 6.109 5.928 6.520 6.552 5.639 499541 PAYSON WWTP F 5.985 6.233 6.149 5.839 5.223 4.955 3.863 3.702 4.610 5.601 6.154 499542 BEER CK AB PAYSON WWTP AT U115 XING S 0.340 0.384 0.297 0.218 0.241 0.347 0.305 0.195 0.256 0.284 0.318 499544 SALEM WWTP F 2.500 2.845 2.080 2.706 2.311 2.658 3.263 2.165 1.951 2.580 2.444 499545 BENJAMIN SLOUGH S 0.068 0.072 0.092 0.081 0.154 0.092 0.101 0.082
499558 SPANISH FORK R AB UTAH L (LAKESHORE) S 0.101 0.082 0.089 0.354 0.158 0.233 0.125 0.152 0.278 0.101 0.067 0.071
499602 SPANISH FORK WWTP F 2.693 3.208 2.594 2.897 2.767 2.680 2.184 2.025 2.039 2.888 2.631 2.993 499603 DRY CK (S OF PROVO BAY) S 0.229 0.297 0.194 0.157 0.199 0.269 0.245 0.168 0.141 0.170 0.211 0.258 499610 HOBBLE CK S 0.037 0.061 0.057 0.063 0.061 0.086 0.132 0.109 0.109 0.031 0.034 0.031
499628 SPRINGVILLE WWTP F 2.812 3.408 3.317 2.872 3.076 2.325 1.748 1.919 2.387 2.494 3.133 2.529 499631 SPRING CK (E OF PROVO BAY) S 0.127 0.107 0.102 0.059 0.138 0.105 0.072 0.094
499648 IRONTON CNL AB REILLY TAR & CHEM & BL FISH HATCHERY S 0.080 0.073 0.069 0.079 0.073 0.064 0.081 0.050 0.088 0.073 0.053 0.068
499651 SPRING CK AT DIST. BOX AB SPRINGVILLE HATCHERY S 0.028 0.021 0.034 0.033 0.073 0.059 0.043 0.041 0.036 0.032 0.036
499654 MILL RACE CREEK AT I-15 CROSSING (2 MI S PROVO COURTHOUSE) S 1.147 1.141 1.224 0.926 0.845 0.916 0.948 1.072 1.207 1.212 1.192 1.090
499656 PROVO WWTP S 3.592 3.642 3.434 3.478 2.991 2.441 2.240 2.391 3.166 3.123 3.850 2.976 499657 MILLRACE CK S 0.111 0.109 0.094 0.129 0.143 0.117 0.115 0.120 0.149 0.097 0.115 0.116 499669 DRAIN (PROVO BOAT HARBOR) S 0.039 0.030 0.035 0.031 0.048 0.042 0.042 0.054 0.046 0.042 0.038 0.028 *Stations not present in this table had less than five samples in the time period considered. For a list of all stations evaluated see Table 1. *Average monthly concentrations that exceed the state water quality pollution indicator threshold value of 0.05 mg/L are shown in red bold font. This exceedance is specific to instream conditions in tributary inflows only and should not be interpreted as non-compliance with discharge permit requirements. *L = Lake, S = Stream, F = Facility

FINAL DRAFT
Utah Lake TMDL August 2007 Final Draft Lake Loading Pollutant Assessment & 23 of 88 Designated Beneficial Use Impairment Assessment
Table 4: Data Sources for Total Phosphorus Concentration and Flowa
DescriptionWater Quality (Category or STORET Station)
American Fork River 499496Benjamin Slough (natural) 499545Big Dry Creek Drains & Small Natural InflowsDrain (Provo Boat Harbor) 499669Drain near Geneva Cannery 499512Dry Creek (Lehi) Drains & Small Natural InflowsDry Creek (South of Provo Bay, natural flow) 499603Geneva Steel Drain 499520Hobble Creek 499610Jordan River 499479Little Dry Creek Drains & Small Natural InflowsMill Pond Lake OverflowsMill Race Creek (natural flow) 499657Minnie Creek DrainOrem WWTP 499525Payson WWTP 499541Powell Slough (natural flow) Drains & Small Natural InflowsProvo River 499669Provo WWTP 499656Salem WWTP 499544Spanish Fork River 499558Spanish Fork WWTP 499602Spring Creek (East of Provo Bay, natural) 499631Springville WWTP 499628Timpanogos WWTP 499504White Lake Overflow to Goshen Bay Lake OverflowsMisc. small flows likely receiving agricultural runoff Drains & Small Natural InflowsMisc. groundwater, thermal springs, flowing wells Groundwater
a TP concentrations for locations not identified by a specific STORET station number are found in Table 2.
Total Phosphorus Loading Results
The results of TP loading calculations are shown in Figures 6 and 7, and Table 5, including TP loading from streams, springs, ground water, drains, wastewater treatment plants (WWTP) and other sources, such as miscellaneous loads not part of any other category. TP loads were calculated for each component of the water budget, with the exception of precipitation and evaporation, which were assumed to have negligible TP loading.
WWTP discharges were found to contribute the largest portion of the calculated TP loading to the lake (76.5%). Streams without WWTP discharges were found to contribute an additional 20.7 percent of the calculated TP load. The remaining 2.8 percent of the calculated load is from miscellaneous surface drains, ground water sources, and springs.

FINAL DRAFT
Utah Lake TMDL August 2007 Final Draft Lake Loading Pollutant Assessment & 24 of 88 Designated Beneficial Use Impairment Assessment
A dramatic difference in the total mass of the incoming and outgoing loading is apparent in Figure 6, indicating that the lake is acting as a sink for TP. Figure 7 shows the yearly fluctuations and differences in the import and export values within Utah Lake. The curves described in Figure 7 indicate that while export of TP increases during the summer season, it at no time is equal to or greater than the incoming loading, and the lake acts as a sink for TP year-round.
Figure 6: Total Phosphorus Load Summary
Annual Total Phosphorus Inflow Load = 297.6 tons/yr
WWTPs76.5%
Groundwater1.2%
Miscellaneous Surface
1.5%
Springs0.0%
Streams (without WWTPs)
20.7%
Annual Total Phosphorus Export = 83.5 tons/yr
Miscellaneous2%
Jordan River98%
Figure 7: Average Monthly Total Phosphorus Loads (1980-2003)
0.0
5.0
10.0
15.0
20.0
25.0
30.0
35.0
Jan Feb Mar Apr May Jun Jul Aug Sep Oct Nov Dec
Load
(ton
s)
Total Load Total Export

FINAL DRAFT
Utah Lake TMDL August 2007 Final Draft Lake Loading Pollutant Assessment & 25 of 88 Designated Beneficial Use Impairment Assessment
Table 5: Calculated Average Total Phosphorus Loads (tons/year) Based on Average Flows (1980-2003)
Jan Feb Mar Apr May Jun Jul Aug Sep Oct Nov Dec Total
1. INFLOWS
Powell Slough 5.9 6.3 5.9 6.5 8.0 6.6 6.8 7.5 7.8 8.2 6.5 6.4 82.4
Powell Slough (natural) 0.3 0.4 0.3 0.3 0.2 0.2 0.2 0.2 0.2 0.2 0.3 0.3 3.1
Orem WWTP 5.6 5.9 5.6 6.2 7.8 6.4 6.6 7.3 7.6 8.0 6.2 6.1 79.3
Provo River 0.6 0.5 0.8 0.8 1.7 1.2 0.2 0.2 0.3 0.6 0.5 0.5 7.9
Dry Creek (Lehi) 0.0 0.0 0.0 0.1 0.1 0.0 0.0 0.0 0.0 0.0 0.0 0.0 0.2
Little Dry Creek 0.0 0.0 0.0 0.0 0.0 0.0 0.0 0.0 0.0 0.0 0.0 0.0 0.0
Big Dry Creek 0.1 0.1 0.1 0.1 0.1 0.1 0.1 0.1 0.1 0.1 0.1 0.1 1.2
Mill Race Creek 6.2 5.6 5.8 5.9 6.7 6.2 6.4 6.7 7.5 6.2 6.6 4.6 74.4
Mill Race Creek (natural) 0.2 0.2 0.1 0.1 0.1 0.1 0.1 0.1 0.1 0.1 0.1 0.1 1.4
Provo WWTP 5.9 5.4 5.6 5.7 6.5 6.0 6.1 6.5 7.3 5.9 6.3 4.4 71.6
Drains 0.1 0.0 0.1 0.1 0.1 0.1 0.2 0.1 0.1 0.2 0.2 0.1 1.4
Spring Creek (East of Provo Bay) 0.9 1.5 1.5 1.3 1.4 1.3 1.0 1.1 1.3 1.0 1.3 0.8 14.4
Spring Creek (natural) 0.1 0.1 0.1 0.1 0.1 0.0 0.0 0.1 0.0 0.0 0.0 0.1 0.7
Springville WWTP 0.8 1.4 1.4 1.2 1.3 1.3 1.0 1.0 1.3 1.0 1.3 0.7 13.7
Hobble Creek 0.1 0.2 0.3 0.3 0.2 0.1 0.0 0.0 0.0 0.0 0.1 0.1 1.4
Dry Creek (South of Provo Bay) 1.0 1.3 1.4 0.9 1.2 1.2 0.9 0.8 0.9 1.4 1.4 1.5 13.9
Dry Creek (natural) 0.3 0.4 0.3 0.1 0.1 0.1 0.0 0.0 0.1 0.2 0.3 0.3 2.2
Spanish Fork WWTP 0.7 0.9 1.1 0.8 1.1 1.1 0.9 0.8 0.8 1.2 1.1 1.2 11.7
Spanish Fork River 1.1 1.0 1.5 7.7 4.7 1.8 0.2 0.3 0.6 0.8 0.7 0.8 21.2
Benjamin Slough 1.5 1.6 1.6 1.6 1.4 1.3 1.0 1.0 1.1 1.3 1.7 1.5 16.6
Benjamin Slough (natural) 0.4 0.4 0.5 0.4 0.4 0.2 0.1 0.2 0.2 0.4 0.5 0.4 4.1
Salem WWTP 0.3 0.4 0.3 0.4 0.3 0.4 0.4 0.3 0.3 0.3 0.4 0.3 4.1
Payson WWTP 0.8 0.8 0.8 0.8 0.7 0.7 0.5 0.5 0.6 0.6 0.8 0.8 8.4
White Lake Overflow to Goshen 0.1 0.2 0.1 0.1 0.0 0.0 0.0 0.0 0.0 0.0 0.1 0.1 0.7
Minnie Creek 0.1 0.1 0.1 0.1 0.1 0.1 0.1 0.1 0.0 0.1 0.1 0.1 1.1
Mill Pond 0.1 0.1 0.1 0.1 0.1 0.1 0.1 0.1 0.1 0.1 0.1 0.1 1.2
Streams 18.7 19.8 20.6 26.4 26.9 21.2 17.7 18.7 20.6 21.2 20.6 18.1 250.5
Natural Flows/Drains 4.6 5.0 5.8 11.3 9.2 5.3 2.2 2.3 2.7 4.2 4.5 4.6 61.7
WWTPs 14.1 14.8 14.8 15.1 17.7 15.9 15.5 16.4 17.9 17.0 16.1 13.5 188.8
Springs 0.0 0.0 0.0 0.0 0.0 0.0 0.0 0.0 0.0 0.0 0.0 0.0 0.0
Groundwater 0.1 0.2 0.2 0.2 0.5 0.5 0.2 0.3 0.4 0.3 0.2 0.4 3.5
Other Surface 3.6 2.7 2.9 3.0 2.5 1.9 5.5 3.4 4.3 5.3 4.8 3.7 43.6
Timpanogos WWTP 3.3 2.3 2.5 2.7 2.0 1.4 5.0 3.0 3.9 5.0 4.5 3.4 39.0
Miscellaneous Surface 0.3 0.4 0.4 0.3 0.5 0.5 0.5 0.4 0.4 0.3 0.3 0.3 4.6
TOTAL INFLOW LOAD 22.4 22.7 23.7 29.6 29.9 23.6 23.4 22.4 25.3 26.8 25.6 22.2 297.6
OUTLFOWS
Jordan River -2.5 -1.9 -3.0 -5.1 -12.0 -12.4 -15.2 -13.9 -9.5 -3.0 -1.8 -1.4 -81.7
Miscellaneous -0.1 -0.1 -0.2 -0.2 -0.1 -0.1 -0.2 -0.2 -0.2 -0.2 -0.1 -0.1 -1.8
TOTAL OUTFLOW LOAD -2.6 -2.0 -3.2 -5.3 -12.1 -12.5 -15.4 -14.1 -9.7 -3.2 -1.9 -1.5 -83.5

FINAL DRAFT
Utah Lake TMDL February 2007 Final Draft Lake Loading Pollutant Assessment & 26 of 88 Designated Beneficial Use Impairment Assessment
For those tributaries where natural flows dominate such as the Provo and Spanish Fork Rivers, flow volume into the lake decreases substantially during June through September and TP concentrations show a similar decrease over the same time period, equating to lower overall summer loading (Tables 1 and 3, Figure 3).
For inflowing TP loading from tributary systems where permitted discharge flows dominate or represent a substantial portion of summer season flow,natural flow volume into the lake decreases substantially from June through September while discharge flows remain relatively constant. These tributaries include Powell Slough, Mill Race Creek, Spring Creek (east of Provo Bay), Dry Creek (south of Provo Bay) and to a lesser extent, Benjamin Slough. TP concentrations also remain relatively constant over this same time period, resulting in elevated loading during the summer.
For the Jordan River, a comparison of outflow volumes (Table 1, Figure 3) and calculated TP concentrations (Table 3) indicates that both flow and TP concentration increase during April through September. While there is an increased export of TP downstream during the summer months, it is not sufficient to offset the incoming loading. Therefore total phosphorus is observed to be accumulating in the lake at a rate of approximately 214 tons per year. However, due to the lake’s complex internal chemistry and water management, characterization of the effect of this internal loading is difficult and many internal processes are not fully understood.
Utah Lake is a shallow, highly turbid lake. The turbidity is due in part to resuspended bottom sediments (a result of wind action and fish feeding), and the precipitation of calcium carbonate (CaCO3) and other minerals. During the summer season, biological activity in the lake raises the pH of the lake water, which increases the formation of CaCO3 precipitates. The high concentration of CaCO3 in the lake waters has an effect on pH and on the adsorption and dissolution of sediment-bound phosphorus and may influence biological uptake of dissolved phosphorus as well.
Availability of dissolved phosphorus (a critical component for algal growth) has been shown to decrease by more than 30 times in lakes with high TDS and sulfate concentrations over freshwater systems with low TDS and sulfate (Weiser and Robarts 1995 and associated references). A similar effect may be operating in Utah Lake which, when combined with the observed elevated turbidity, may be limiting both algal growth and decomposition, thus reducing the short-term effects of internal loading on water quality and the existing fishery.
According to Grobbelarr and House (1995) the transfer of TP to lake sediments occurs through deposition of particulate material and mineral precipitates. The enriched sediment generally acts as a sink in lentic TP cycling but resuspension of reactive phosphorus can provide seasonal release of nutrients in shallow lentic environments. This seasonal release may explain a portion of the increased export of TP during the summer months.
Seasonal fluctuation of in-lake TP concentrations may result from a change in water temperature. As water temperatures increase during the summer months, mineralization and release of nutrients from sediments occur at a higher rate, increasing TP concentration levels in the water column.

FINAL DRAFT
Utah Lake TMDL February 2007 Final Draft Lake Loading Pollutant Assessment & 27 of 88 Designated Beneficial Use Impairment Assessment
Total nutrient loading and in-lake nutrient concentrations in a water body can have both direct and indirect effects on water quality and aquatic life habitat. Algal blooms occur when nutrient concentrations, sunlight and water temperatures are high enough to promote excessive algal growth. When aquatic organisms expire, they sink and collect on the bottom sediments. Decomposition of algae removes oxygen from the surrounding water, reducing dissolved oxygen concentrations near the bottom thereby increasing internal nutrient loading. Important factors influencing internal TP cycling include water temperature, disturbance and resuspension of sediments from bottom feeding fish, redox potential of the overlying water column and mineralogy of the sediment.
Research has shown that limiting the introduction of nutrients to a system influences overall productivity of a system but the individual lake system must be understood to comprehend the internal processes that may influence the cycling of TP and to identify the appropriate mechanisms for limiting TP in a watershed. Shallow lakes are more sensitive to internal loading, and do not respond as readily to land-based nutrient reductions as deeper lakes do. Shallow lakes are more susceptible to sediment and nutrient resuspension from wind action, carp activity, and invasive nuisance plant species (Sondergaard 2003).
As the TMDL process continues, better characterization of the internal TP loading is central to understanding the needs of the lake. A more comprehensive characterization of the relationship between dissolved and total phosphorus in the inflows and in the lake will be critical, as will the collection of consistent, diurnal and seasonal data on dissolved oxygen. The availability of these data will help to provide a better understanding of how organic matter is processed within the lake and the relative effect of the buffering capacity of CaCO3 on pH and the dissolution and uptake potential of sediment-attached nutrients. UDEQ has started collecting some of these data with the deployment of continuous sensors for dissolved oxygen, temperature and conductivity at various locations in the lake.

FINAL DRAFT
Utah Lake TMDL February 2007 Final Draft Lake Loading Pollutant Assessment & 28 of 88 Designated Beneficial Use Impairment Assessment
Total Dissolved Solids Loading Methodology UDEQ has established water quality criteria for TDS that is protective of agricultural water uses specific to irrigation and stock watering of 1,200 mg/L and 2,000 mg/L respectively (Utah Administrative Code R317-2-14, June 01, 2006). Concentrations above these values indicate that TDS levels may impair agricultural beneficial uses.
Simulated TDS loads were obtained directly from the LKSIM model. The model results were evaluated against actual data to determine how well they fit. Adjustments were made to the model as necessary to ensure that model output was as representative as possible of observed conditions.
For each tributary, monthly data for 24 years were averaged to calculate a mean annual TDS load for the period of study (1980-2003). For most tributaries, a typical monthly TDS concentration based on available data were assigned and applied over the entire year. For those tributaries where sufficient monthly data were not available equations predicting seasonal trends of TDS concentrations were used to estimate monthly concentrations. For both methods, monthly concentrations were combined with LKSIM flow data to determine TDS loads. Yearly loading values were averaged over the 24-year period.
Total Dissolved Solids Loading Results Results of the TDS loading analysis are shown in Table 6 and Figure 8. TDS load contributions were calculated for streams, springs, groundwater, and permitted point source dischargers. The remaining inflows were grouped together in an “other” category. This group includes various drains, ditches, flowing wells and point sources that flow directly into the lake and do not discharge to natural drainages.
As shown in Figure 8, those streams dominated by natural flow, particularly the Provo River and Spanish Fork River, contribute the largest percentage (43%) of the total TDS load into the lake, while WWTP discharges represent only a small percentage (5%) of the TDS load to the lake.
Calculated TDS loading from springs is estimated to contribute 26 percent of the total TDS load to the lake. This load represents a combination of the spring water budget determined by the LKSIM hydrologic model and calculated water quality values.
Due to the highly saline nature of many watershed soils, much of the water flowing into Utah Lake contains dissolved salts. Water flowing through salt deposits or salty soils often becomes saline very quickly because the salt dissolves easily.
About 50% of the calcium (Ca) and bicarbonate (HCO3) ions in waters flowing into Utah Lake are precipitated in the lake (Merritt et al. 2004). The turbidity resulting from the dominant calcium carbonate (CaCO3) and other trace mineral precipitates causes a milky to milky-brown mineral turbidity that is heaviest during the summer when biological activity raises the pH, which in turn converts more HCO3 to carbonate (CO3) which then bonds with Ca forming CaCO3. These fine-grained particulates are then resuspended by daily wave action.
The LKSIM TDS budget has been calibrated against yearly measured values in the lake. The model output has been shown to compare well with measured values, as displayed in Figure 9 where they are plotted along with lake stage elevation. Water depth can be

FINAL DRAFT
Utah Lake TMDL February 2007 Final Draft Lake Loading Pollutant Assessment & 29 of 88 Designated Beneficial Use Impairment Assessment
American Fork River 2,600Powell Slough 15,600
Orem WWTP 6,200Powell Slough (natural) 9,300
Provo River 61,900Drain 700Provo River (natural) 61,200
Dry Creek (Lehi) 200Little Dry Creek 1,000Big Dry Creek 3,100Mill Race 18,900
Mill Race Creek (natural) 5,100Provo WWTP 10,200Drains 3,700
Spring Creek (South of Provo Bay) 6,200Spring Creek (natural) 3,900Springville WWTP 2,200
Hobble Creek 7,700Dry Creek (South of Provo Bay) 13,100
Dry Creek (natural) 8,800Spanish Fork WWTP 4,400
Spanish Fork River 60,500Benjamin Slough 38,200
Benjamin Slough (natural) 36,500Salem WWTP 700Payson WWTP 1,100
White Lake Overflow to Goshen Bay 26,600Minnie Creek 2,500
Lehi WWTP 0Minnie Creek 2,500
Mill Pond 7,000Streams TDS Load 265,200
WWTP TDS Load 24,800Natural Flows and Drains 240,400
Springs TDS Load 146,800Groundwater TDS Load 77,200Other TDS Loads 72,300
Miscellaneous TDS Loads 67,300Timpanogos WWTP TDS Load 5,000
TOTAL TDS LOAD 561,500
Description TDS Load (tons/y)
seen as having a significant impact upon TDS levels with the lake environment because of the resuspension of sediment from shallow depths and wave action. Table 6: Calculated Total Dissolved Solids Loading in tons per year (1980 – 2003)

FINAL DRAFT
Utah Lake TMDL February 2007 Final Draft Lake Loading Pollutant Assessment & 30 of 88 Designated Beneficial Use Impairment Assessment
Figure 8: Total Dissolved Solids Loads (1980 – 2003)
TDS Load = 561,500 tons/y
Springs 146,800 tons/y
26%
Groundw ater 77,200 tons/y
14%
Other 67,300 tons/y
12%
Streams240,400 tons/y
43%
WWTP 29,800 tons/y
5%
Total Dissolved Solids and Water Levels in Utah Lake
0
500
1000
1500
2000
2500
3000
1930.000 1940.000 1950.000 1960.000 1970.000 1980.000 1990.000 2000.000 2010.000
Beginning of Water Year
TDS
Con
cent
ratio
n (m
g/L)
4440
4450
4460
4470
4480
4490
Lake
Sta
ge (f
t)
Lake Stage
Simulated TDS
Measured TDS
Figure 9. Annual Modeled and Measured TDS and Lake Stage Elevation

FINAL DRAFT
Utah Lake TMDL February 2007 Final Draft Lake Loading Pollutant Assessment & 31 of 88 Designated Beneficial Use Impairment Assessment
Beneficial Use Impairment Assessment – Introduction
Utah Lake is listed on Utah’s 2002 303(d) list for exceedances of the state water quality pollution indicator threshold value for total phosphorus (TP) of 0.025 mg/L, and the total dissolved solids (TDS) criteria for irrigation and stock watering of 1,200 mg/L and 2,000 mg/L respectively (Utah Administrative Code R317-2-14, June 01, 2006).
The warm water fishery beneficial use of the lake is identified as being impaired due to excess TP and blue-green algal dominance and the agricultural beneficial use is listed as impaired due to high concentrations of TDS (Table 9). Because the warm water game fishery and the agricultural uses were the only ones identified as impaired, they are the only ones that were evaluated in depth. The other designated uses are discussed only briefly.
Utah Lake is a highly productive lake that experiences extensive algal blooms in the late summer and fall. Trophic state calculations identify the lake as being hypereutrophic although dissolved oxygen levels remain relatively high in most parts of the lake and the shallow nature of the lake, combined with strong prevailing winds, acts to discourage thermal stratification.
Table 9 – Beneficial Use Designations for Utah Lake
Recreational uses of the lake include boating, water skiing and fishing. Warm water game fish species present in Utah Lake include carp, channel catfish, walleye, white bass, black bass, smallmouth and largemouth bass, crappie, bluegill, green sunfish and several different species of panfish. The June sucker (Chasmistes liorus), an endangered species, is found in Utah Lake and the inflowing Provo River. Utah Lake’s associated wetlands are home to approximately 226 species of birds, 49 mammalian species, and 16 species of amphibians and reptiles.
Utah Lake water is utilized extensively for agricultural and secondary irrigation, both from within the watershed and from the Jordan River outflow.
Beneficial Use Designation
Description
2B Protected for secondary contact recreation such as boating, wading, or similar uses.
3B Protected for warm water species of game fish, including the necessary aquatic organisms in their food chain.
3D Protected for other aquatic wildlife.
4 Protected for agricultural uses including irrigation of crops and stock watering.

FINAL DRAFT
Utah Lake TMDL February 2007 Final Draft Lake Loading Pollutant Assessment & 32 of 88 Designated Beneficial Use Impairment Assessment
Beneficial Use Impairment Assessment – Secondary Contact Recreation (2B)
Utah Lake experienced heavy recreational use in the late 1800s through the mid 1990s, with the development of more than 20 resorts, including the Saratoga, Geneva and Provo Lake resorts which opened in the late 1880s to 1890s. The resorts offered boating, picnicking, dancing, overnight accommodations and touted the best of everything, including "bass fishing ... superior to any in the territory", and reportedly drawing crowds of thousands (Daily Herald June 25, 2006).
While crowds of thousands no longer gather routinely, the lake remains popular for fishing, boating, sailing, and water-skiing, and recreational facilities are well developed. Utah Lake State Park, located near Provo, provides major access to the lake for power boating, sailing, canoeing, kayaking, and also provides camping and day-use facilities. The park offers 70 campsites, a marina, boat ramps, flush toilets, a handicap accessible fishing area and an ice rink. The park has large grassy areas for picnicking and camping, and is a locally popular birding spot. The southern jetty, which is parallel to the Provo River outlet, is identified as best for viewing waterfowl, while the north jetty offers an opportunity to view shore birds. Lincoln Point is a public beach on the south end of Utah Lake, and a popular area for viewing shore birds, hosting a variety of species during migration. Other developed recreational areas include the American Fork Marina and Saratoga Springs Resort. Lake access is available at most sites where roadways parallel the lakeshore. While a formal survey of recreational use of the lake was not part of the scope of this project, many informal contacts with recreational users have occurred during the evaluation and assessment of water quality in the lake. The most common recreation-based complaint received has been the perception that the noticeable turbidity is an indication of pollution. The grayish or brownish green color, a product of calcium carbonate and algae, has repeatedly been the focus of water quality questions from recreational users, but has not deterred them from using the lake as most conversations occurred with individuals that were unloading water-skiing, windsurfing, boating, or fishing equipment. The results of these informal conversations should not be interpreted as a formal assessment of the support status of the designated secondary contact recreation use, but may help to focus future investigations or public education and outreach activities to gather additional information as warranted.

FINAL DRAFT
Utah Lake TMDL February 2007 Final Draft Lake Loading Pollutant Assessment & 33 of 88 Designated Beneficial Use Impairment Assessment
Beneficial Use Impairment Assessment – Warm Water Game Fishery (3B)
The support status of the warm water game fishery in Utah Lake was evaluated using two separate mechanisms, the basis of water quality criteria for dissolved oxygen and temperature, and fish population and sustainability status as based on available fish population information. This assessment should be viewed as a preliminary assessment given the lack of comprehensive fish population data for the lake and should be reviewed and refined as new data are collected. Additionally, it should not be viewed as a stand alone analysis, but should be evaluated in the context of the detailed water quality and biological assessments completed as part of the overall TMDL document.
Accurate population surveys based on total fish counts are not available for Utah Lake. However, a general characterization of relative populations, based on a variety of collection techniques, indicates that carp and white bass account for the majority of the biomass and numbers of fish present in Utah Lake. White bass, black bullhead, channel catfish, black crappie and walleye make up the top game fish populations in the lake.
Recent population estimates completed in 2005 (UDNR, 2005) as part of the June Sucker Recovery Implementation Program and based on carp-specific harvest methods indicate that carp (age 2+ fish) represent nearly 74% of the total population harvested. Other species harvested include black bullhead (17.4%), channel catfish (6.1%), white bass (1.3%), black crappie (0.5%) and walleye (0.4%). While the carp-specific collection methods of this current study do not allow a direct, quantitative translation of the study results to the general population distribution in the lake, they do indicate that the species remains dominant. Population studies are ongoing for Utah Lake as part of the June Sucker Recovery Implementation Program and will provide additional information to the TMDL effort in the future.
Carp, especially adult carp in concentrated populations, can have a negative effect on water quality and shoreline habitat. Since native plants provide habitat, sediment stabilization, nutrient uptake and many other important functions, removal of aquatic rooted plants can have a severe impact on the waterbody. Carp have been observed to remove aquatic vegetation through feeding action, resulting in poor cover and spawning habitat for other species. They have also been associated with increased turbidity and suspended sediment concentrations through both physical disturbance of bottom sediments and removal of vegetation. Most of the water quality impacts due to carp are attributed to the removal of the plants rather than direct impacts of the fish (Bonar et al. 2002, 1996).
Water Quality Criteria – Based Support Status Determination
Utah State Code identifies temperature and dissolved oxygen as water quality parameters critical to the support of warm water game fish. Water quality standards specific to the support of warm water game fisheries requires water temperatures of no greater than 27o C, dissolved oxygen concentrations of no less than 5.5 mg/L as a 30-day average, 6.0 mg/L for early life stages or 4.0 mg/L for all life stages as a 7-day average and 5.0 mg/L for early life stages or 3.0 mg/L for all life stages as a 1-day

FINAL DRAFT
Utah Lake TMDL February 2007 Final Draft Lake Loading Pollutant Assessment & 34 of 88 Designated Beneficial Use Impairment Assessment
average (Utah State Code R317-2-14 Table 2.14.2, April 2005). There are no aquatic life-based criteria for turbidity, total dissolved solids or total suspended solids.
Nutrient loading and in-lake nutrient concentrations can have both direct and indirect effects on water quality and aquatic life habitat. Algal blooms occur where nutrient concentrations and environmental conditions such as sunlight and temperature are present at sufficient levels to support excessive growth. Commonly, these blooms appear as extensive algal mats on the surface of the water. Nuisance aquatic growth, including free floating phytoplankton and attached periphyton, can adversely affect both aquatic life and recreational water uses. When algae and other aquatic plants die, they sink and collect on the bottom. The biochemical processes of decomposition consume oxygen from the surrounding water. Because most decomposition occurs within the lower levels of the water column, dissolved oxygen concentrations near the bottom of a water body can be substantially depleted by a large algal bloom.
Both living and dead (decomposing) algae can also affect the pH of the water due to the release of various acid and base compounds during respiration and photosynthesis. Additionally, low dissolved oxygen levels caused by decomposing organic matter can lead to changes in water chemistry and release sorbed phosphorus from bottom sediments to the water column. The relative effect of these processes depends on the pH and buffering capacity of the waterbody and water temperature.
Water quality data available for this assessment included primarily dissolved oxygen and temperature data collected monthly or less frequently (US EPA STORET database). Therefore, evaluation of accurate, representative 30-day or 7-day averages was not possible. The identified criteria of no less than 3.0 mg/L dissolved oxygen as a 1-day average was selected as the best fit for evaluation of the available data, with the assumption that grab sample concentrations were representative of daily average dissolved oxygen concentrations.
This assumption is somewhat conservative due to the collection times of the available data. Photosynthesis (where plants take in carbon dioxide and release oxygen) occurs during daylight hours and increases dissolved oxygen in surface waters. During nighttime hours when there is no sunlight, plants respire (take in oxygen and release carbon dioxide) which can deplete dissolved oxygen in the upper water column. As the majority of data were collected between late morning and early afternoon, they are representative of time periods when photosynthesis was occurring, and nighttime periods of oxygen depletion are generally not as well characterized.
The available water quality data set (1989 through 2003) is more representative of drought conditions than average or high water year conditions. Water years 2001 through 2003 are in the lower 25th percentile for precipitation and precipitation-induced flows in the watershed as based on the 30-year precipitation averages. Physical water quality characteristics such as temperature and dissolved oxygen concentrations measured during these water years will be representative of critical watershed conditions as drought generally exacerbates such conditions within the watershed.
Water quality data specific to beneficial use support were available from a number of sites in and around the lake and at major tributary inflows. Eight in-lake and six tributary sites (Table 10) were selected for in-depth beneficial use status assessment as they had

FINAL DRAFT
Utah Lake TMDL February 2007 Final Draft Lake Loading Pollutant Assessment & 35 of 88 Designated Beneficial Use Impairment Assessment
relatively robust data sets and described water quality conditions in both in-lake and shoreline/bay habitats and those of waters flowing into the lake.
Table 10: Monitoring Sites Assessed for Determination of Designated Beneficial Use Support Status
Station ID Description Location in Utah Lake
In-Lake Sites
491762 Goshen Bay midway off main point on east shore Southern end 491750 3 miles west-northwest of Lincoln Beach Southern end 491777 Outside entrance to Provo Bay East side
491739 4 miles west of Provo Airport, 4 miles north of Lincoln Point Midsection
491734 East of Provo Boat Harbor, 6 miles north of Lincoln Beach Midsection
491737 4 miles north of Pelican Point, 5 miles west of Geneva Northern end 491731 0.5 miles west of Geneva discharge #15-A North-eastern end 491752 2 miles east of Saratoga Springs #12 Northern end
Tributary Sites
591986 Beer Creek South shore near Lincoln Point 499558 Spanish Fork River (Lakeshore) East shore south of Provo Bay 499600 Dry Creek at Count Road 77 Crossing Southeast shore of Provo Bay 499669 Provo River at Utah-114 crossing East shore north of Provo Bay
499496 American Fork Creek 2.5 miles south of American Fork City South shore
499479 Jordan River at Utah Lake outlet, Utah-121 crossing South shore
A map showing the location of these sites is presented in Appendix A.
Dissolved oxygen and temperature data for in-lake sites are presented in Figure 10 through Figure 17. Data from 1989 through 2003 are displayed. All water years were grouped and displayed in a seasonal distribution to better characterize seasonal trends in water temperature and dissolved oxygen at each site. Data were categorized as deep if sampled in the bottom half of the water column and shallow if sampled in the top half.
Exceedances of dissolved oxygen and temperature criteria were observed to occur only rarely at in-lake sites and were generally isolated to the late summer months of July and August.

FINAL DRAFT
Utah Lake TMDL February 2007 Final Draft Lake Loading Pollutant Assessment & 36 of 88 Designated Beneficial Use Impairment Assessment
Figure 10: Temperature and dissolved oxygen data for in-lake site # 491762 (1989-2003). Dashed lines represent State of Utah temperature (upper) criteria of 27oC, and dissolved oxygen (two lower) criteria of 5 mg/L and 3 mg/L respectively
Figure 11: Temperature and dissolved oxygen data for in-lake site # 491750 (1989-2003). Dashed lines represent State of Utah temperature (upper) criteria of 27oC, and dissolved oxygen (two lower) criteria of 5 mg/L and 3 mg/L respectively
Site # 491762 - UTAH LAKE GOSHEN BAY
0
5
10
15
20
25
3022
-Jan
4-A
pr
7-M
ay
23-M
ay
5-Ju
n
2-Ju
l
6-Ju
l
10-J
ul
11-J
ul
31-J
ul
14-A
ug
28-A
ug
12-S
ep
18-O
ct
16-N
ov
DO =
mg/
L, T
emp
= de
gree
s C
DO (mg/L) shallow DO (mg/L) deep Temp (C) shallow Temp (C) deep
Site # 491750 - UTAH LAKE 3 MI WNW OF LINCOLN BEACH
0
5
10
15
20
25
30
22-J
an
4-A
pr
7-M
ay
23-M
ay
5-Ju
n
14-J
un
3-Ju
l
6-Ju
l
10-J
ul
11-J
ul
15-J
ul
19-J
ul
31-J
ul
31-J
ul
1-A
ug
14-A
ug
19-A
ug
28-A
ug
11-S
ep
12-S
ep
21-S
ep
2-O
ct
18-O
ct
16-N
ov
DO =
mg/
L, T
emp
= de
gree
s C
DO (mg/L) shallow DO (mg/L) deep Temp (C) shallow Temp (C) deep

FINAL DRAFT
Utah Lake TMDL February 2007 Final Draft Lake Loading Pollutant Assessment & 37 of 88 Designated Beneficial Use Impairment Assessment
Figure 12: Temperature and dissolved oxygen data for in-lake site # 491777 (1989-2003). Dashed lines represent State of Utah temperature (upper) criteria of 27oC, and dissolved oxygen (two lower) criteria of 5 mg/L and 3 mg/L respectively.
Figure 13: Temperature and dissolved oxygen data for in-lake site # 491739 (1989-2003). Dashed lines represent State of Utah temperature (upper) criteria of 27oC, and dissolved oxygen (two lower) criteria of 5 mg/L and 3 mg/L respectively.
Site # 491777 - UTAH LAKE PROVO BAY OUTSIDE ENTRANCE
0
5
10
15
20
25
3022
-Jan
4-A
pr
7-M
ay
23-M
ay
5-Ju
n
19-J
un
2-Ju
l
6-Ju
l
10-J
ul
11-J
ul
26-J
ul
31-J
ul
14-A
ug
28-A
ug
12-S
ep
27-S
ep
2-O
ct
18-O
ct
16-N
ov
DO =
mg/
L, T
emp
= de
gree
s C
DO (mg/L) shallow DO (mg/L) deep Temp (C) shallow Temp (C) deep
Site # 491739 - UTAH LAKE 4 MI W OF AIRPORT, 4 MI N OF LINCOLN POINT
0
5
10
15
20
25
30
22-J
an
4-A
pr
7-M
ay
23-M
ay
5-Ju
n
14-J
un
19-J
un
2-Ju
l
3-Ju
l
6-Ju
l
10-J
ul
11-J
ul
15-J
ul
19-J
ul
31-J
ul
31-J
ul
1-A
ug
14-A
ug
19-A
ug
28-A
ug
12-S
ep
11-S
ep
21-S
ep
2-O
ct
18-O
ct
16-N
ov
DO =
mg/
L, T
emp
= de
gree
s C
DO (mg/L) shallow DO (mg/L) deep Temp (C) shallow Temp (C) deep

FINAL DRAFT
Utah Lake TMDL February 2007 Final Draft Lake Loading Pollutant Assessment & 38 of 88 Designated Beneficial Use Impairment Assessment
Figure 14: Temperature and dissolved oxygen data for in-lake site # 491734 (1989-2003). Dashed lines represent State of Utah temperature (upper) criteria of 27oC, and dissolved oxygen (two lower) criteria of 5 mg/L and 3 mg/L respectively.
Figure 15: Temperature and dissolved oxygen data for in-lake site # 491737 (1989-2003). Dashed lines represent State of Utah temperature (upper) criteria of 27oC, and dissolved oxygen (two lower) criteria of 5 mg/L and 3 mg/L respectively.
Site # 491734 - UTAH LAKE E OF PROVO BOAT HARBOR
0
5
10
15
20
25
30
22-J
an
4-A
pr
7-M
ay
23-M
ay
5-Ju
n
19-J
un
10-J
ul
26-J
ul
31-J
ul
14-A
ug
28-A
ug
12-S
ep
27-S
ep
2-O
ct
18-O
ct
16-N
ov
DO =
mg/
L, T
emp
= de
gree
s C
DO (mg/L) shallow DO (mg/L) deep Temp (C) shallow Temp (C) deep
Site # 491737 - UTAH LAKE 4 MI N OF PELICAN POINT
0
5
10
15
20
25
30
4-A
pr
7-M
ay
23-M
ay
5-Ju
n
14-J
un
19-J
un
3-Ju
l
6-Ju
l
11-J
ul
10-J
ul
15-J
ul
19-J
ul
31-J
ul
31-J
ul
1-A
ug
14-A
ug
19-A
ug
28-A
ug
11-S
ep
12-S
ep
21-S
ep
18-O
ct
16-N
ov
DO =
mg/
L, T
emp
= de
gree
s C
DO (mg/L) shallow DO (mg/L) deep Temp (C) shallow Temp (C) deep

FINAL DRAFT
Utah Lake TMDL February 2007 Final Draft Lake Loading Pollutant Assessment & 39 of 88 Designated Beneficial Use Impairment Assessment
Figure 16: Temperature and dissolved oxygen data for in-lake site # 491731 (1989-2003). Dashed lines represent State of Utah temperature (upper) criteria of 27oC, and dissolved oxygen (two lower) criteria of 5 mg/L and 3 mg/L respectively.
Figure 17: Temperature and dissolved oxygen data for in-lake site # 491752 (1989-2003). Dashed lines represent State of Utah temperature (upper) and dissolved oxygen (two lower) criteria of 27oC, 5 mg/L and 3 mg/L respectively.
Site # 491731 - UTAH LAKE 0.5 MI W OF GENEVA DISCHARGE
0
5
10
15
20
25
3022
-Jan
4-A
pr
7-M
ay
23-M
ay
5-Ju
n
14-J
un
19-J
un
2-Ju
l
3-Ju
l
6-Ju
l
10-J
ul
15-J
ul
19-J
ul
26-J
ul
31-J
ul
31-J
ul
1-A
ug
19-A
ug
28-A
ug
11-S
ep
12-S
ep
21-S
ep
27-S
ep
18-O
ct
16-N
ov
DO =
mg/
L, T
emp
= de
gree
s C
DO (mg/L) shallow DO (mg/L) deep Temp (C) shallow Temp (C) deep
Site # 491752 - UTAH LAKE 2 MI E OF SARATOGA SPRINGS #12
0
5
10
15
20
25
30
22-J
an
4-A
pr
7-M
ay
23-M
ay
5-Ju
n
14-J
un
2-Ju
l
3-Ju
l
6-Ju
l
10-J
ul
15-J
ul
19-J
ul
31-J
ul
31-J
ul
1-A
ug
14-A
ug
19-A
ug
28-A
ug
11-S
ep
12-S
ep
21-S
ep
18-O
ct
16-N
ov
DO =
mg/
L, T
emp
= de
gree
s C
DO (mg/L) shallow DO (mg/L) deep Temp (C) shallow Temp (C) deep

FINAL DRAFT
Utah Lake TMDL February 2007 Final Draft Lake Loading Pollutant Assessment & 40 of 88 Designated Beneficial Use Impairment Assessment
Four exceedances (1.5 percent) of the warm water game fish temperature criteria of no greater than 27oC were observed at monitoring sites in Utah Lake #491762 (southern end of the lake), #491750 (in-lake site), #491777 (east side of the lake), and #491739 (mid-lake) as shown in Figures 10 through 13. All in-lake temperature exceedances occurred on July 6, 1999 and ranged from 27.4 to 28.5oC.
Two exceedances (0.8 percent) of the warm water game fish criteria for dissolved oxygen concentrations of no less than 3.0 mg/L for all life stages as a 1-day average were observed at monitoring sites in Utah Lake #491734 (mid-lake) and #491731 (northeastern end of the lake), as shown in Figure 14 and Figure 16. In-lake dissolved oxygen exceedances (less than 3 mg/L) occurred in January, 1991 (0.8 mg/L) and July, 1995 (1.9 mg/L).
Eight exceedances (3.1 percent) of the warm water game fish criteria for dissolved oxygen concentrations of no less than 5.0 mg/L for early life stages as a 1-day average were observed primarily during late summer months (July through September) at monitoring sites #491750 (south end of the lake), #491777 (east side of the lake), #491739 (mid-lake) and #491731 (northeastern end of the lake) as shown in Figures 11 through 13 and Figure 16. Dissolved oxygen concentrations at site # 491731 were observed to be less than 5.0 mg/L on three separate dates. All exceedances ranged from 3.7 to 4.4 mg/L.
The relatively low incidence of criteria exceedance observed in this data set suggests that direct water quality impairment of the warm water game fishery as defined by dissolved oxygen criteria is not occurring in Utah Lake.
As fish and most other aquatic life species are mobile and can relocate to areas of suitable habitat in the event of a localized criteria exceedance, the State has further defined the support status of game fish populations relative to the percentage of the total water column experiencing depressed dissolved oxygen concentrations. Where less than 25 percent of the water column depth exhibits dissolved oxygen concentrations of 3.0 mg/L or greater, a non-support status has been defined; where 25 to 50 percent of the water column depth exhibits dissolved oxygen concentrations of 3.0 mg/L or greater, a partial-support status has been defined, and where greater than 50 percent of the water column depth exhibits dissolved oxygen concentrations of 3.0 mg/L or greater, a full-support status has been defined (Table 11).
Table 11: State of Utah designated beneficial use status support definitions for warm water game fish specific to water column depth-based dissolved oxygen exceedances % of the water column meeting the dissolved oxygen criteria
Minimum dissolved oxygen concentration
Support status
25% or less 3.0 mg/L non-support 25% to 50% 3.0 mg/L partial support 50% or greater 3.0 mg/L full support
Due to limitations in depth information, exact percent volume of water quality exceedances could not be calculated as fluctuations (short and long-term) in lake depths were common over the period of data collection. However, sufficient depth information was available to allow the calculation of relative average depths for each site and monitoring date (deep vs. shallow). The data were then divided specific to the calculated relative depth into two categories, those collected in deep (greater than 50

FINAL DRAFT
Utah Lake TMDL February 2007 Final Draft Lake Loading Pollutant Assessment & 41 of 88 Designated Beneficial Use Impairment Assessment
percent depth) waters and those collected in shallow (less than 50 percent depth) as displayed in Figure 10 through Figure 17 above.
Applying the depth distribution of shallow and deep data collection allowed the determination of beneficial use support status (as outlined in Table 11) for the in-lake sites. All observed exceedances of both the temperature and the dissolved oxygen criteria were isolated to either the shallow or the deep layer and did not occur simultaneously, providing appropriate refugia for warm water game fish at alternate depths within the water column. (For example, if a temperature exceedance was observed in the shallow water column, dissolved oxygen and temperature measured at the same time and place in the deep water column were in the suitable range, allowing fish to move lower in the water column to avoid the warmer water above.)
All observed in-lake temperature exceedances occurred in the shallow water layer. With two exceptions (#491734 and #491752), all observed in-lake dissolved oxygen exceedances occurred in the deep-water layer. Temperature and dissolved oxygen exceedances were not observed to occur simultaneously at any one site over the period of record evaluated.
All in-lake sites assessed retained a minimum of 50 percent of the water column at suitable (non-exceedance) water quality conditions, thereby providing full support of the designated warm water game fishery at all sites.
Using the water quality conditions described by the available data set for each in-lake site (presented in Figure 10 through Figure 17), the numeric water quality criteria, and support status as defined by the proportion of the water column experiencing criteria exceedances; support status determinations specific to the in-lake monitoring stations are identified in Table 12.
Assessment of the relative magnitude of exceedances of the support status for early life stages is somewhat more complicated than that for the 3 mg/L dissolved oxygen criterion. Exceedances at the in-lake sites were not observed to occur in both the shallow and the deep locations simultaneously. All in-lake sites assessed retained a minimum of 50 percent of the water column at suitable water quality conditions, thereby providing full support of the designated warm water game fishery at all sites as defined by dissolved oxygen criteria.

FINAL DRAFT
Utah Lake TMDL February 2007 Final Draft Lake Loading Pollutant Assessment & 42 of 88 Designated Beneficial Use Impairment Assessment
Table 12: Designated Beneficial Use Support Status for Warm Water Game Fish as Based on Water Column Dissolved Oxygen and Temperature Conditions
With the mixed fishery population in Utah Lake, spawning and early life stages may be present throughout most of the year (March through November) as identified in Table 13. Although exceedances of the 5 mg/L dissolved oxygen criteria for early life stages occurred in only 3.1 percent of the data, exceedances of dissolved oxygen criteria and water temperatures greater than preferred spawning conditions were observed during late summer months, potentially coinciding with the spawning seasons for black crappie, black bullhead, large and smallmouth bass, bluegill, green sunfish, and brown trout. Additionally, as many species prefer littoral vegetation or shallow backwaters and side channels for spawning and nursery habitat, the in-lake sites are not necessarily representative of early life stage habitat needs for all species of game fish present in the lake (Table 13).
Site Support Status Basis for Status Call
#491731 0.5 MI W OF GENEVA DISCHARGE #15-A
Full A minimum of 50% of water column in compliance with dissolved oxygen (>3mg/L) and temperature criteria (<27oC)
#491734 E OF PROVO BOAT HARBOR 6 MI N OF LINCOLN BEACH
Full A minimum of 50% of water column in compliance with dissolved oxygen (>3mg/L) and temperature criteria (<27oC)
#491737 4 MI NORTH OF PELICAN POINT 5 MI WEST OF GENEVA
Full A minimum of 50% of water column in compliance with dissolved oxygen (>3mg/L) and temperature criteria (<27oC)
#491739 4 MI WEST OF PROVO AIRPORT 4 MI NORTH OF LINCOLN P
Full A minimum of 50% of water column in compliance with dissolved oxygen (>3mg/L) and temperature criteria (<27oC)
#491750 3 MI WNW OF LINCOLN BEACH
Full A minimum of 50% of water column in compliance with dissolved oxygen (>3mg/L) and temperature criteria (<27oC)
#491752 2 MI E OF SARATOGA SPRINGS #12
Full A minimum of 50% of water column in compliance with dissolved oxygen (>3mg/L) and temperature criteria (<27oC)
#491762 GOSHEN BAY MIDWAY OFF MAIN POINT ON EAST SHORE
Full A minimum of 50% of water column in compliance with dissolved oxygen (>3mg/L) and temperature criteria (<27oC)
#491777 PROVO BAY OUTSIDE ENTRANCE TO PROVO BAY
Full A minimum of 50% of water column in compliance with dissolved oxygen (>3mg/L) and temperature criteria (<27oC)

FINAL DRAFT
Utah Lake TMDL February 2007 Final Draft Lake Loading Pollutant Assessment & 43 of 88 Designated Beneficial Use Impairment Assessment
Table 13: Spawning and rearing information for fishes of Utah Lake. (Adapted from SWCA, 2002)
Species Spawning Season
Spawning time
Spawning Temperature Spawning Habitat Nursery
Habitat
June sucker May-June Night 11.6–17 o C (53–63 o F)
shallow riffles 0.3 to 0.8 m deep; water velocity about 0.6 ft/sec; mixture of coarse gravel and cobble
littoral habitat with cover
carp March-April Day and Night
18–22o C (64–72o F)
shallow lake margins, submerged vegetation
littoral habitat with cover
white bass mid April-mid June
Day and Night
14–21o C (58–69o F)
rocky substrate, Lincoln Beach and tributaries including Provo River
littoral habitat with cover
black crappie
March-July Day 15–20o C (59–68o F)
nest in or near shallow vegetated backwaters and littoral areas over soft mud, sand, or gravel
nest guarded by the male, fry are pelagic
yellow perch mid March-mid April
Night 8–11o C (46–52o F)
submerged vegetation larvae are pelagic
channel catfish
May- mid June
Night 21–24o C (70–75o F)
nest cavities or burrows guarded by the male
walleye
mid March-mid April
Night 4–10o C (40–50o F)
rocky substrate, Lincoln Beach and tributaries including Provo River
larvae and juveniles are pelagic
black bullhead
June-August
Night 21–30o C (70–86o F)
sandy substrate, shallow backwaters or lake margin in 1-4 feet depth
young form large pelagic schools
largemouth bass
June-July Day 15–17o C (59–62o F)
nest in or near shallow vegetated backwaters and littoral areas over soft mud, sand, or gravel substrates
nest guarded by the male, juveniles form pelagic schools
smallmouth bass
June-July Day 15–17o C (59–62o F)
nest in or near shallow vegetated backwaters and littoral areas over soft mud, sand, or gravel substrates near cover
nest guarded by male
fathead minnow
mid May-mid August
Day 15–32o C (59–90o F)
build nest on the underside of submerged objects
guarded by the male

FINAL DRAFT
Utah Lake TMDL February 2007 Final Draft Lake Loading Pollutant Assessment & 44 of 88 Designated Beneficial Use Impairment Assessment
Species Spawning Season
Spawning time
Spawning Temperature Spawning Habitat Nursery
Habitat
bluegill May-September
Day 20–28o C (68–82o F)
nest in or near shallow vegetated backwaters and littoral areas over firm sand or gravel substrates, often nest in colonies
nest guarded by the male, juveniles remain in littoral habitats
green sunfish
May-September
Day 20–28o C (68–82o F)
nest in or near shallow vegetated backwaters and littoral areas over firm sand or gravel substrates
nest guarded by the male, juveniles remain in littoral habitats
brown trout mid September-November
Day 2–6o C (36–43o F)
builds redds in riffle areas of tributaries including the Provo River
backwaters and small side channels
mosquitofish May-September
Day 18–32o+ C (65–90o+ F)
warm shallow water with dense vegetation, livebearer
warm shallow water with dense vegetation
rainbow trout
March-April Day 12–13o C (54–56o F)
builds redds in riffle areas of tributaries including the Provo River
backwaters and small side channels
Based upon water temperature and dissolved oxygen levels within the water column, the spawning criteria for each of the warm water fish were evaluated at 8 in-lake sites and 1 tributary site to determine the percentage of instances where spawning criteria has been met in Utah Lake. The results of this analysis are displayed in Table 14. The range of results varied from species to species as well as site-to-site with a range from 0% to 100% of spawning requirements being met.
Water quality data collected at tributary inflow sites were assessed in addition to in-lake sites in an attempt to better characterize the potential for early life stage beneficial use support. Some of the selected tributary sites were identified as representing direct spawning and nursery habitat for a number of warm water species (UDNR 2002a). All were selected as having the potential to more closely approximate water quality conditions occurring in the littoral and shallow water locations in-lake. The tributary sites selected were those located closest to their outlet into Utah Lake.
Dissolved oxygen and temperature data for inflow sites from 1989 through 2003 are presented in Figures 18 through 23. Data were grouped and displayed seasonally to better characterize trends in water temperature and dissolved oxygen at each site. Exceedances of dissolved oxygen and temperature criteria were observed to occur only rarely at inflow sites and were generally isolated to the months of July and August.
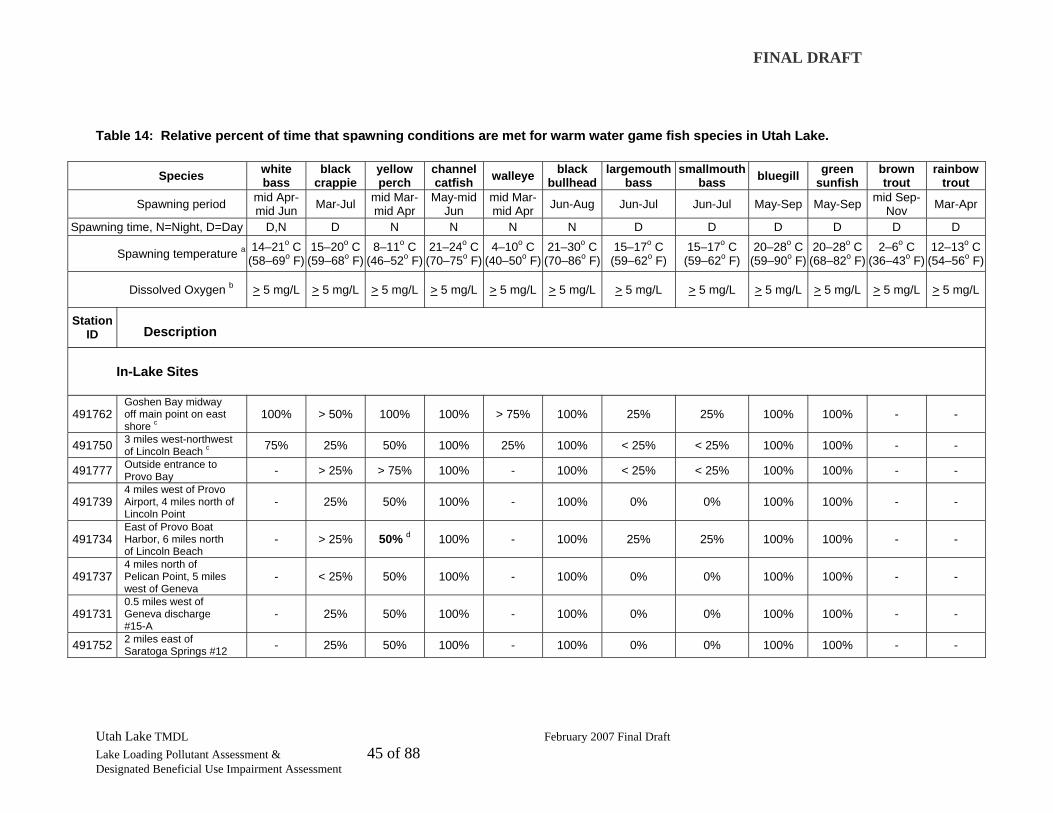
FINAL DRAFT
Utah Lake TMDL February 2007 Final Draft Lake Loading Pollutant Assessment & 45 of 88 Designated Beneficial Use Impairment Assessment
Table 14: Relative percent of time that spawning conditions are met for warm water game fish species in Utah Lake.
Species white bass
black crappie
yellow perch
channel catfish walleye black
bullheadlargemouth
bass smallmouth
bass bluegill green sunfish
brown trout
rainbow trout
Spawning period mid Apr-mid Jun Mar-Jul mid Mar-
mid Apr May-mid
Jun mid Mar-mid Apr Jun-Aug Jun-Jul Jun-Jul May-Sep May-Sep mid Sep-
Nov Mar-Apr
Spawning time, N=Night, D=Day D,N D N N N N D D D D D D
Spawning temperature a 14–21o C (58–69o F)
15–20o C(59–68o F)
8–11o C (46–52o F)
21–24o C (70–75o F)
4–10o C (40–50o F)
21–30o C(70–86o F)
15–17o C (59–62o F)
15–17o C (59–62o F)
20–28o C(59–90o F)
20–28o C(68–82o F)
2–6o C (36–43o F)
12–13o C (54–56o F)
Dissolved Oxygen b > 5 mg/L > 5 mg/L > 5 mg/L > 5 mg/L > 5 mg/L > 5 mg/L > 5 mg/L > 5 mg/L > 5 mg/L > 5 mg/L > 5 mg/L > 5 mg/L
Station ID Description
In-Lake Sites
491762 Goshen Bay midway off main point on east shore c
100% > 50% 100% 100% > 75% 100% 25% 25% 100% 100% - -
491750 3 miles west-northwest of Lincoln Beach c 75% 25% 50% 100% 25% 100% < 25% < 25% 100% 100% - -
491777 Outside entrance to Provo Bay - > 25% > 75% 100% - 100% < 25% < 25% 100% 100% - -
491739 4 miles west of Provo Airport, 4 miles north of Lincoln Point
- 25% 50% 100% - 100% 0% 0% 100% 100% - -
491734 East of Provo Boat Harbor, 6 miles north of Lincoln Beach
- > 25% 50% d 100% - 100% 25% 25% 100% 100% - -
491737 4 miles north of Pelican Point, 5 miles west of Geneva
- < 25% 50% 100% - 100% 0% 0% 100% 100% - -
491731 0.5 miles west of Geneva discharge #15-A
- 25% 50% 100% - 100% 0% 0% 100% 100% - -
491752 2 miles east of Saratoga Springs #12 - 25% 50% 100% - 100% 0% 0% 100% 100% - -

FINAL DRAFT
Utah Lake TMDL February 2007 Final Draft Lake Loading Pollutant Assessment & 46 of 88 Designated Beneficial Use Impairment Assessment
Species white bass
black crappie
yellow perch
channel catfish walleye black
bullheadlargemouth
bass smallmouth
bass bluegill green sunfish
brown trout
rainbow trout
Tributary Sites
591986 Beer Creek > 75% - - - < 25% - - - - - <25% 75%
499558 Spanish Fork River (Lakeshore) > 75% - - - 75% - - - - - <25% > 75%
499600 Dry Creek at Count Road 77 Crossing > 75% - - - 50% - - - - - 0% 100%
499669 Provo River at Utah-114 crossing 100% - - - 100% - - - - - <25% 100%
499496 American Fork Creek 2.5 miles south of American Fork City
> 75% - - - ND - - - - - <25% ND
499479 Jordan River at Utah Lake outlet, Utah-121 crossing
> 75% - - - > 50% - - - - - <25% > 50% a Preferred spawning conditions are listed on a species-specific basis and do not represent state water quality criteria. The State of Utah has not defined criteria for water temperature of spawning warm water game fish species. b The dissolved oxygen data available to this process were instantaneous readings only. Therefore, construction of accurate, representative 30-day or 7-day averages was not possible. The identified criteria of no less than 5.0 mg/L dissolved oxygen as a 1-day average for early life stages was selected as the best fit for evaluation of the available data, with the assumption that grab sample concentrations were representative of daily average dissolved oxygen concentrations. c These two sites represented the closest monitoring locations to Lincoln Beach where white bass and walleye have been observed to spawn. They were therefore used as surrogates to assess possible temperature and dissolved oxygen conditions at Lincoln Beach. It was assumed that the water quality conditions at these locations would not deviate substantially from those at Lincoln Beach during the respective spawning periods. d Bold text indicates both temperature and dissolved oxygen concentrations are outside of the range of preferred spawning conditions for at least a portion of the spawning period.
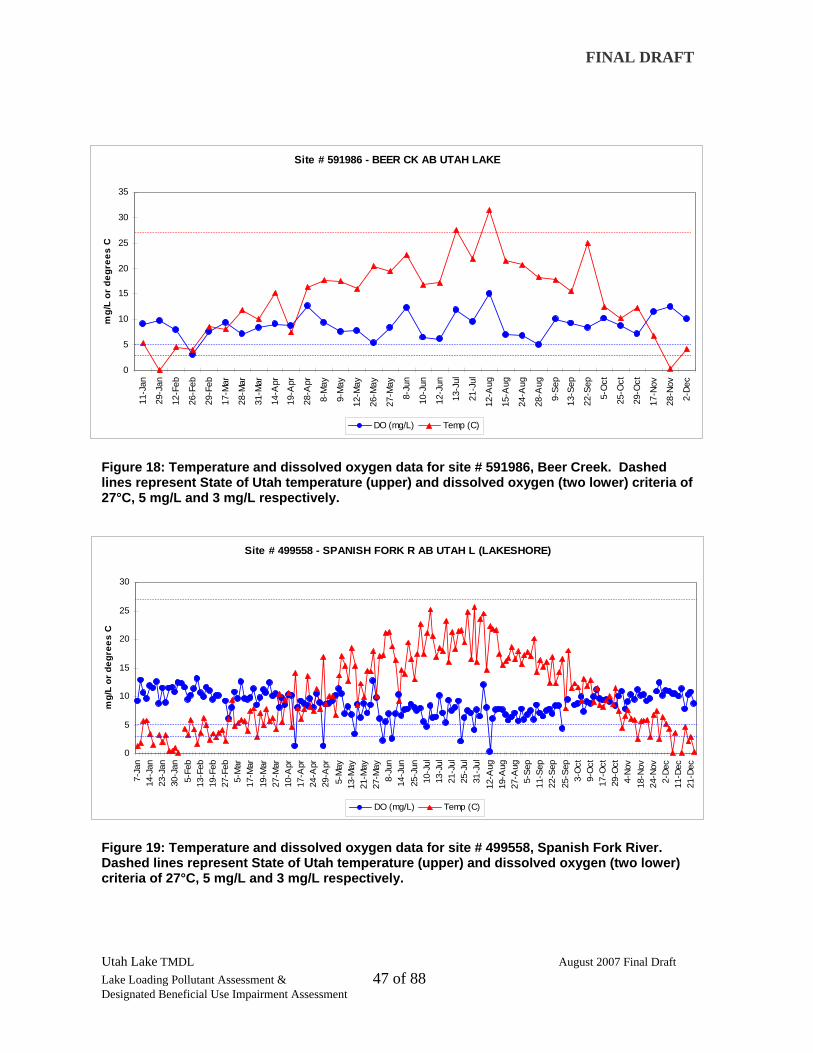
FINAL DRAFT
Utah Lake TMDL August 2007 Final Draft Lake Loading Pollutant Assessment & 47 of 88 Designated Beneficial Use Impairment Assessment
Figure 18: Temperature and dissolved oxygen data for site # 591986, Beer Creek. Dashed lines represent State of Utah temperature (upper) and dissolved oxygen (two lower) criteria of 27°C, 5 mg/L and 3 mg/L respectively.
Figure 19: Temperature and dissolved oxygen data for site # 499558, Spanish Fork River. Dashed lines represent State of Utah temperature (upper) and dissolved oxygen (two lower) criteria of 27°C, 5 mg/L and 3 mg/L respectively.
Site # 499558 - SPANISH FORK R AB UTAH L (LAKESHORE)
0
5
10
15
20
25
30
7-Ja
n14
-Jan
23-J
an30
-Jan
5-Fe
b13
-Feb
19-F
eb27
-Feb
5-M
ar17
-Mar
19-M
ar27
-Mar
10-A
pr17
-Apr
24-A
pr29
-Apr
5-M
ay13
-May
21-M
ay27
-May
8-Ju
n14
-Jun
25-J
un10
-Jul
13-J
ul21
-Jul
25-J
ul31
-Jul
12-A
ug19
-Aug
27-A
ug5-
Sep
11-S
ep22
-Sep
25-S
ep3-
Oct
9-O
ct17
-Oct
29-O
ct4-
Nov
18-N
ov24
-Nov
2-De
c11
-Dec
21-D
ec
mg/
L or
deg
rees
C
DO (mg/L) Temp (C)
Site # 591986 - BEER CK AB UTAH LAKE
0
5
10
15
20
25
30
35
11-J
an
29-J
an
12-F
eb
26-F
eb
29-F
eb
17-M
ar
28-M
ar
31-M
ar
14-A
pr
19-A
pr
28-A
pr
8-M
ay
9-M
ay
12-M
ay
26-M
ay
27-M
ay
8-Ju
n
10-J
un
12-J
un
13-J
ul
21-J
ul
12-A
ug
15-A
ug
24-A
ug
28-A
ug
9-Se
p
13-S
ep
22-S
ep
5-O
ct
25-O
ct
29-O
ct
17-N
ov
28-N
ov
2-De
c
mg/
L or
deg
rees
C
DO (mg/L) Temp (C)

FINAL DRAFT
Utah Lake TMDL August 2007 Final Draft Lake Loading Pollutant Assessment & 48 of 88 Designated Beneficial Use Impairment Assessment
Figure 20: Temperature and dissolved oxygen data for site # 499600, Dry Creek. Dashed lines represent State of Utah temperature (upper) and dissolved oxygen (two lower) criteria of 27oC, 5 mg/L and 3 mg/L respectively.
Figure 21: Temperature and dissolved oxygen data for site # 499669, Provo River. Dashed lines represent State of Utah temperature (upper) and dissolved oxygen (two lower) criteria of 27oC, 5 mg/L and 3 mg/L respectively.
Site # 499600 - DRY CK @ CR 77 XING AB UTAH LAKE
0
5
10
15
20
25
30
7-Ja
n10
-Jan
14-J
an22
-Jan
23-J
an2-
Feb
5-Fe
b12
-Feb
13-F
eb29
-Feb
17-M
ar14
-Apr
17-A
pr18
-Apr
27-A
pr29
-Apr
2-M
ay4-
May
10-M
ay26
-May
27-M
ay3-
Jun
9-Ju
l13
-Jul
27-J
ul27
-Jul
29-J
ul29
-Jul
2-A
ug7-
Aug
11-A
ug31
-Aug
5-Se
p7-
Sep
5-O
ct4-
Oct
9-O
ct13
-Oct
16-O
ct22
-Oct
26-O
ct27
-Oct
8-No
v
mg/
L or
deg
rees
C
DO (mg/L) Temp (C)
Site # 499669 - PROVO R AT U114 XING
0
5
10
15
20
25
30
5-Ja
n14
-Jan
23-J
an31
-Jan
8-Fe
b13
-Feb
23-F
eb4-
Mar
13-M
ar19
-Mar
23-M
ar30
-Mar
10-A
pr19
-Apr
24-A
pr28
-Apr
5-M
ay13
-May
23-M
ay27
-May
8-Ju
n12
-Jun
28-J
un11
-Jul
15-J
ul21
-Jul
29-J
ul11
-Aug
20-A
ug25
-Aug
30-A
ug5-
Sep
14-S
ep25
-Sep
3-O
ct9-
Oct
16-O
ct25
-Oct
31-O
ct9-
Nov
17-N
ov25
-Nov
4-De
c12
-Dec
mg/
L or
deg
rees
C
DO (mg/L) Temp (C)

FINAL DRAFT
Utah Lake TMDL August 2007 Final Draft Lake Loading Pollutant Assessment & 49 of 88 Designated Beneficial Use Impairment Assessment
Figure 22. Temperature and dissolved oxygen data for site # 499496, American Fork Creek. Dashed lines represent State of Utah temperature (upper) and dissolved oxygen (two lower) criteria of 27oC, 5 mg/L and 3 mg/L respectively.
Figure 23: Temperature and dissolved oxygen data for site # 499479, Jordan River. Dashed lines represent State of Utah temperature (upper) and dissolved oxygen (two lower) criteria of 27oC, 5 mg/L and 3 mg/L respectively.
Two exceedances of the warm water game fish temperature criteria were observed at the Beer Creek monitoring site (#591986) tributary to Utah Lake in July and August as shown in Figure 18.
Summer water temperatures routinely exceed the preferred spawning temperatures for black crappie (15-20oC), and large and smallmouth bass (15-17oC) at most in-lake and tributary sampling locations in July. Water temperatures in the upper range were observed for black bullhead (21-30oC) in June through August, bluegill (20-28oC) May through September, and green sunfish (20-28oC) May through September, but remained within acceptable spawning conditions. Brown trout require much lower spawning temperatures
Site # 499496 - AMERICAN FK CK 2.5MI S OF AM FK CITY
0
5
10
15
20
25
30
12-M
ay
27-M
ay
12-J
un
16-J
ul
15-J
ul
21-J
ul
19-A
ug
11-S
ep
22-S
ep
25-O
ct
mg/
L or
deg
rees
C
DO (mg/L) Temp (C)
Site # 499479 - JORDAN R AT UTAH L OUTLET U121 XING
0
5
10
15
20
25
30
5-Ja
n9-
Jan
19-J
an2-
Feb
11-F
eb15
-Feb
26-F
eb6-
Mar
13-M
ar23
-Mar
31-M
ar13
-Apr
18-A
pr27
-Apr
4-M
ay9-
May
10-M
ay21
-May
24-M
ay7-
Jun
14-J
un25
-Jun
30-J
un10
-Jul
15-J
ul21
-Jul
29-J
ul10
-Aug
21-A
ug29
-Aug
10-S
ep20
-Sep
24-S
ep5-
Oct
10-O
ct23
-Oct
30-O
ct12
-Nov
14-N
ov24
-Nov
1-De
c11
-Dec
17-D
ec
mg/
L or
deg
rees
C
DO (mg/L) Temp (C)

FINAL DRAFT
Utah Lake TMDL August 2007 Final Draft Lake Loading Pollutant Assessment & 50 of 88 Designated Beneficial Use Impairment Assessment
(2-6oC), but are identified to spawn upstream in tributaries rather than in-lake and so were not assessed here.
Six exceedances (0.9 percent) of the warm water game fish criteria for dissolved oxygen concentrations of no less than 3.0 mg/L for all life stages as a 1-day average were observed at a single monitoring site tributary to Utah Lake. All exceedances occurred at #499558 (Spanish Fork River), as shown in Figure 19. Inflow dissolved oxygen exceedances observed at this site (less than 3 mg/L) occurred throughout the year in 1992 and ranged from 0.3 mg/L to 2.6 mg/L.
Exceedances of the warm water game fish criteria for dissolved oxygen concentrations of no less than 5.0 mg/L for early life stages as a 1-day average were observed primarily during July through September at monitoring sites tributary to Utah Lake. Exceedances occurred at three sites: #591986 (Beer Creek); #499558 (Spanish Fork River); and #499600 (Dry Creek) as shown in Figures 18 through 20.
Dissolved oxygen concentrations can be influenced by a number of factors including both natural and man-made causes. Temperature affects the concentration of oxygen in water since warm water cannot contain as much dissolved oxygen as cold water. The maximum amount of dissolved oxygen in water under average summertime temperatures is approximately 9 mg/L and 14 mg/L during winter months. Dissolved oxygen concentrations over 100% are considered supersaturated and can occur in correlation with the growth of a large algal bloom. During the daylight, photosynthesis occurs which can produce oxygen so rapidly that it is not able to escape into the atmosphere, resulting in short-term supersaturation. During the night, when light is not available to fuel photosynthesis, algae and other organisms in the water and bottom sediments consume oxygen from the water. The result of this diurnal process is daily dissolved oxygen variations with maximum saturation values generally occurring in late afternoon and minimums at dawn. These daily swings can be quite large when algae blooms are present, and can result in fish kills if the oxygen concentrations drop below critical levels. As noted previously, low dissolved oxygen concentrations are not routinely observed in the available data set, however diurnal variations have not been well characterized. To better understand the potential for diurnal variation in dissolved oxygen and the associated dissolved oxygen sags, saturation values were calculated from dissolved oxygen concentration data available for Utah Lake. High levels of supersaturation may indicate correspondingly large drops in dissolved oxygen during the night. A conservative saturation threshold of 110% was used to account for rounding error in the calculations. Dissolved oxygen concentrations over 110% occurred in 27% of the stream data and 20% of the in-lake data. Maximum observed dissolved oxygen saturation for stream data was 245% (#591986 8/12/1992, Beer Creek). Maximum observed dissolved oxygen saturation for in-lake data was 207% (#491731 8/28/1991, northeastern end of the lake). The highest saturation levels observed in both data sets occurred during July and August although stream data showed much higher variation throughout the year. All but two of the occurrences of supersaturation observed in the in-lake data occurred in the surface sample.
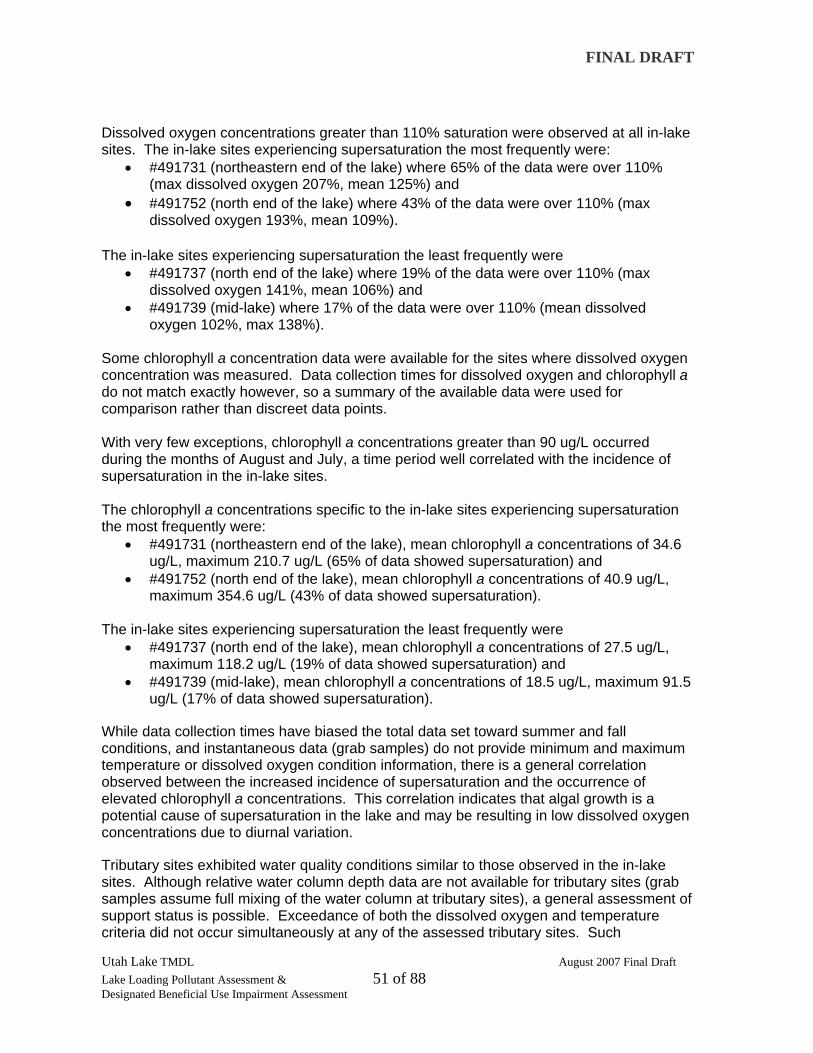
FINAL DRAFT
Utah Lake TMDL August 2007 Final Draft Lake Loading Pollutant Assessment & 51 of 88 Designated Beneficial Use Impairment Assessment
Dissolved oxygen concentrations greater than 110% saturation were observed at all in-lake sites. The in-lake sites experiencing supersaturation the most frequently were:
• #491731 (northeastern end of the lake) where 65% of the data were over 110% (max dissolved oxygen 207%, mean 125%) and
• #491752 (north end of the lake) where 43% of the data were over 110% (max dissolved oxygen 193%, mean 109%).
The in-lake sites experiencing supersaturation the least frequently were
• #491737 (north end of the lake) where 19% of the data were over 110% (max dissolved oxygen 141%, mean 106%) and
• #491739 (mid-lake) where 17% of the data were over 110% (mean dissolved oxygen 102%, max 138%).
Some chlorophyll a concentration data were available for the sites where dissolved oxygen concentration was measured. Data collection times for dissolved oxygen and chlorophyll a do not match exactly however, so a summary of the available data were used for comparison rather than discreet data points. With very few exceptions, chlorophyll a concentrations greater than 90 ug/L occurred during the months of August and July, a time period well correlated with the incidence of supersaturation in the in-lake sites. The chlorophyll a concentrations specific to the in-lake sites experiencing supersaturation the most frequently were:
• #491731 (northeastern end of the lake), mean chlorophyll a concentrations of 34.6 ug/L, maximum 210.7 ug/L (65% of data showed supersaturation) and
• #491752 (north end of the lake), mean chlorophyll a concentrations of 40.9 ug/L, maximum 354.6 ug/L (43% of data showed supersaturation).
The in-lake sites experiencing supersaturation the least frequently were
• #491737 (north end of the lake), mean chlorophyll a concentrations of 27.5 ug/L, maximum 118.2 ug/L (19% of data showed supersaturation) and
• #491739 (mid-lake), mean chlorophyll a concentrations of 18.5 ug/L, maximum 91.5 ug/L (17% of data showed supersaturation).
While data collection times have biased the total data set toward summer and fall conditions, and instantaneous data (grab samples) do not provide minimum and maximum temperature or dissolved oxygen condition information, there is a general correlation observed between the increased incidence of supersaturation and the occurrence of elevated chlorophyll a concentrations. This correlation indicates that algal growth is a potential cause of supersaturation in the lake and may be resulting in low dissolved oxygen concentrations due to diurnal variation.
Tributary sites exhibited water quality conditions similar to those observed in the in-lake sites. Although relative water column depth data are not available for tributary sites (grab samples assume full mixing of the water column at tributary sites), a general assessment of support status is possible. Exceedance of both the dissolved oxygen and temperature criteria did not occur simultaneously at any of the assessed tributary sites. Such

FINAL DRAFT
Utah Lake TMDL August 2007 Final Draft Lake Loading Pollutant Assessment & 52 of 88 Designated Beneficial Use Impairment Assessment
exceedances, occurring infrequently and separately, present less of a potential impact to both eggs and early life stages as they affect less of the overall water column and allow the occurrence of refugia within the inflow region, providing a greater degree of support for the designated warm water game fishery at all sites and for all life stages specific to water quality criteria.
This assessment indicates that suitable habitat and/or adequate refugia are available to all life stages of warm water aquatic life throughout the lake and immediate tributary inflows/outflows for most species. While the identified in-lake monitoring sites are not necessarily located in areas where warm water game fish species in Utah Lake are observed to spawn, they represent the most appropriate data available. They were therefore used as surrogates to assess possible temperature and dissolved oxygen conditions in the lake during spawning periods and it was assumed that the water quality conditions at these locations would not deviate substantially from those where spawning would occur. Preferred spawning conditions (species-specific temperatures as shown in Table 13 and no less than 5 mg/L dissolved oxygen from Utah State water quality criteria for early life stages), are met at most locations, for most species of in-lake spawners, the majority of the time (Table 14). A single site (#491734, mid-lake) exhibited low dissolved oxygen concentration for a portion of the spawning season for yellow perch.
Dissolved oxygen concentrations appeared to meet early life stage criteria for the remaining sites and species assuming that the grab-sample data available were representative of the 1-day average dissolved oxygen concentrations. Late season (July) water temperature spawning preferences for black crappie and large and smallmouth bass do not appear to be met consistently and are the exception to this finding. Early season (March – May) spawning conditions for these species are within the required parameters, indicating that successful spawning for these species can occur (relative to water quality conditions) but only in the early portion of the spawning period.
The assessments made in Table 14 are specific to conditions observed at the water quality monitoring sites. The majority of warm water game fish species spawning in Utah Lake prefer shallow, vegetated backwaters and lake margins. Therefore, while the water quality monitoring sites represent the best information available at this time, they are for the most part located well off-shore and do not necessarily reflect site-specific conditions in the preferred spawning areas.
Preferred spawning conditions for warm water game fish are supported in-lake with the exception of elevated water temperatures that occur during the latter portion of the spawning periods for black crappie and large and smallmouth bass. Tributary spawning conditions for brown and rainbow trout show a similar pattern of elevated temperatures. However, the preferred spawning temperatures for these species are recommended values only and are not identified as water quality criteria by the State.
Although available data show water column dissolved oxygen and temperatures that exceed criteria at specific monitoring stations, criteria are being met concurrently at other stations within the lake, and at alternate depths at each station. Excursions from the full support temperature and dissolved oxygen regime appear to be short term, of relatively low magnitude, and not representative of a chronic or continual condition. Additionally, refugia is present in the form of inflowing and outflowing tributaries, and may also include springs

FINAL DRAFT
Utah Lake TMDL August 2007 Final Draft Lake Loading Pollutant Assessment & 53 of 88 Designated Beneficial Use Impairment Assessment
or other ground water inflows where localized water temperatures are cooler than those observed for the system as a whole. Tributaries to the lake are cooler during the critical summer months than some lake waters and can provide refugia to warm water species. Support of the warm water game fishery, in part due to the joint use of both lake and tributary systems, appears adequate based on the existing data set and specific to the defined water quality parameters at this time.
Available water quality data were evaluated for trends in water temperature and dissolved oxygen over time. In most in-lake sites, a gradual increase in water temperature was observed from 1991 to 2003. A similar trend in dissolved oxygen concentrations was not evident, as concentrations remained relatively stable at all sites over the period of record assessed. The increasing trend in water temperature was evident at sites #491731, #491734, #491762 and #491777. A less marked trend was observed for sites #491737, #491739 and #491750. In all cases, the increasing trend was less apparent in the deep waters. Site #491752 was the only exception to this observed increase and did not show an increasing trend of temperature in either the shallow or deep waters over time. Due to the relatively even collection of data over seasonal transitions throughout the period of record, the observed increase is most likely a result of lower stream flows, lake levels and elevated air temperatures.
Fishery Population – Based Support Status Determination
To better characterize the support status of the warm water game fishery in Utah Lake, a species/population assessment was undertaken using available fish population and species data (White and Dabb 1970, UDNR 2002 and 2005, Crowl et. al. 1998, Crowl et. al. 1995, Heckmann et. al. 1981, Keleher 1996, Radant and Sakaguchi 1981, Sigler and Sigler1996, SWCA 2002, UDWR 1998 and 1999).
Fishery viability in Utah Lake is influenced by water quality and water quantity issues, habitat availability in littoral areas and in tributary streams, fluctuations in angler success, and infestations of competitive non-game fish, mostly carp, (UDWR 1998 and 1999). Utah Lake has a long history of fishery management, harvest and stocking extending over 130 years and starting soon after the arrival of white settlers to the area. Preferred food fishes from Utah Lake were trout (Bonneville cutthroat trout) and suckers (June sucker and Utah sucker).
Fishery management in Utah Lake began as early as 1870 with the establishment of a committee on fish propagation to request fish from the U.S. Fish Commission for release as a food supply in the territory. Until 1899, the majority of fish introductions into Utah were part of this program. By the late 1800's year-round fishing and unrestricted harvest had greatly reduced the numbers of fish in Utah Lake (Carter 1969). After 1900, most introductions of nonnative fishes were instituted by demands of sportsmen (SWCA 2002). Of the species introduced, several exist as self-sustaining populations in Utah Lake, some of which represent the most abundant game species in the basin and the main basis of the recreational sport fishery in Utah Lake (black bullhead, black crappie and white bass). Common introduced species include carp and yellow perch (Crowl and Thomas 1997).
Many native fish species have been extirpated (gone locally extinct) or do not exist in viable populations in Utah Lake including Bonneville cutthroat trout, June sucker, Utah sucker,

FINAL DRAFT
Utah Lake TMDL August 2007 Final Draft Lake Loading Pollutant Assessment & 54 of 88 Designated Beneficial Use Impairment Assessment
Utah chub, leatherside chub and redside shiner (SWCA 2002). Multi-agency conservation plans are currently in place to manage Bonneville cutthroat trout and least chub; the leatherside chub is considered a species of special concern by the State of Utah. The June sucker is federally listed as endangered.
Table 15 presents a listing of fish species currently present in Utah Lake and a brief description of the current population status.
Table 15: Common and scientific names, and status of fish species in Utah Lake. (Adapted from SWCA, 2002) Common Name Scientific Name Status
Native Species
June sucker Chasmistes liorus Federally endangered; rare in Utah Lake; small numbers of spawners in Provo River in spring
Utah sucker Catostomus ardens Rare in Utah Lake; small numbers of spawners in Provo River in spring; common in tributaries
Non-native Species
black bullhead Ameiurus melas Introduced in 1871. Common in Utah Lake and tributaries; locally common statewide
common carp Cyprinus carpio Introduced in 1881. Abundant in Utah Lake and tributaries; common to abundant statewide
green sunfish Lepomis cyanellus Introduced in 1890. Locally common in Utah Lake; locally common statewide
bluegill Lepomis macrochirus
Introduced in 1890. Locally common in Utah Lake; locally common statewide
largemouth bass Micropterus salmoides Introduced in 1890. Locally common in Utah Lake
black crappie
Pomoxis nigromaculatus
Introduced in 1890. Locally common in Utah Lake; locally common statewide
yellow perch Perca flavescens Introduced in 1890. Common in Utah Lake; locally common in some lakes statewide
channel catfish Ictalurus punctatus Introduced in 1911. Common in Utah Lake and tributaries; locally common statewide
smallmouth bass Micropterus dolomieu
Introduced in 1912. Rare in Utah Lake, present in Jordanelle and Deer Creek Reservoirs
red shiner Cyprinella lutrensis Introduced in 1920. Rare in Utah Lake
western mosquitofish Gambusia affinis
Introduced about 1930. Common to abundant in wetlands and marshes surrounding Utah Lake; still distributed for mosquito control
walleye Stizostedion vitreum Introduced in 1952. Common in Utah Lake

FINAL DRAFT
Utah Lake TMDL August 2007 Final Draft Lake Loading Pollutant Assessment & 55 of 88 Designated Beneficial Use Impairment Assessment
Common Name Scientific Name Status
white bass
Morone chrysops Introduced in 1956. Abundant in Utah Lake; present in the Sevier River drainage
fathead minnow Pimephales promelas
Introduced in 1968. Locally common in Utah Lake and tributaries
Current Population Estimates
Current, recent or comprehensive population surveys are not available for Utah Lake. The population information presented here is based on data collected using subsampling techniques (gill and trap nets, and trawling), normalized to represent the populations in the lake as a whole. The subsampling techniques available exhibit some inherent bias towards certain species and age classes. The information presented should therefore be interpreted as a general characterization of relative populations, not a quantitative evaluation of absolute fish numbers.
Catch rates (number of fish per hour) of the more common fish species in gill nets (1958-1993), trap nets (1995-2000) and seine hauls (2004) in Utah Lake show a predominance of carp, black bullhead, channel catfish and white bass, which account for the majority of the biomass and numbers of fish present in Utah Lake. These populations have been dominant from 1958 through the present, although the relative population densities have fluctuated somewhat. (Additional information on these studies and the relative fish populations observed is included in Technical Memo 1 prepared earlier in the TMDL process.)
Fish population data from the 1950s show channel catfish as the third most abundant species captured between 1958 and 1989. Black bullhead catch rates ranked fourth in the late 1950s. Both populations experienced a substantial drop in relative population density in the 1980s but remained dominant populations relative to other fish species in the lake.
Fish population data available from 1995 through 2000 show carp populations at approximately 36.2% relative abundance, black bullhead and white bass at approximately 20.2% and 21.6% respectively and black crappie at slightly below 15% relative abundance. Channel catfish are observed at less than 1% relative abundance in this data set. It is noted that white bass, channel catfish, and carp have been present in greater abundance in past decades, suggesting that their populations vary over time.
Average trawl rates for young-of-the-year and adult fish species in Utah Lake (1995 through 2000) also identify the predominance of carp, white bass, and black bullhead, and to a lesser extent channel catfish although the trawling gear utilized selectively emphasizes the capture of young-of-the-year white bass and adult carp (SWCA 2002). Adult carp captured using this technique represent 36.7% of the population, adult white bass represent 23.8% of the population and black bullhead represent 29.8% of the population as averaged from 1995 to 1999. Adult channel catfish were observed at approximately 2% relative abundance. Yellow perch were also present as young-of-the-year (9%) and adults (5%) in this data set.
FINAL DRAFT
Utah Lake TMDL August 2007 Final Draft Lake Loading Pollutant Assessment & 56 of 88 Designated Beneficial Use Impairment Assessment
A recent fish composition study (UDNR 2005) showed these same four species as representing the majority of biomass in Utah Lake (UDNR 2005). The study, completed in May and June of 2004, includes fishery information collected from locations specific to preferred carp habitat. While the data collected cannot be interpreted as an unbiased survey of all populations (the survey method was designed to target carp and therefore has the potential to miss much of those game fish populations with habitat preferences substantially different from carp) it does provide additional information on fish species present in the lake. The survey found ten species of fish including carp (74% of total catch), black bullhead (17.4%), channel catfish (6.1%), white bass (1.3%), black crappie (0.5%) and walleye (0.4%). Other species included bluegill, June sucker (3 fish), Utah sucker and largemouth bass. Young fish, able to exit the 2-inch mesh of the nets, were not included in the population surveys so no recent age class information was available from this study.
Commercial Fishery
In the mid-1800s, Utah Lake supported a large commercial fishery focusing on native Bonneville cutthroat trout. In the late 1800's, the commercial fishing industry in Utah Lake suffered a collapse of the cutthroat trout population due to over-fishing, habitat alteration, and introduction of nonnative species. Eventually the commercial fishery switched to other native fish such as June sucker, Utah sucker, and Utah chub, and introduced warm water species like largemouth bass and channel catfish through the early 1900's (Carter 1969). In the 1930’s drought and low lake levels greatly reduced fish populations. Following the drought, fish populations were dominated by commercially undesirable fish such as carp and small-bodied game fish.
A single commercial fishing venture operated until 2006 on Utah Lake, capturing primarily carp and white bass to be marketed for human consumption. Between 1996 and 2000, this operation harvested an average of 376,000 pounds of carp and 4,700 pounds of white bass per year (SWCA 2002).
Stocking Current stocking programs in Utah Lake are focused on the re-establishment and maintenance of the endangered June sucker. In 2005 more than 8,500 June sucker were added to the lake from Red Butte Reservoir (UDWR 2005).
Additional June sucker stock is being bred at the Fisheries Experiment Station in Logan, Utah for eventual release to Utah Lake and the Provo River (UDWR 2005). The ultimate goal of this hatchery program is to produce 33,000 fish to eight inches annually for stocking in Utah Lake. June sucker and Rainbow trout are also stocked in tributaries of Utah Lake.
Habitat Assessment – Based Support Status Determination
Distribution of fish within Utah Lake varies between species. Carp, white bass, black crappie, yellow perch, channel catfish, walleye, and black bullhead feed in a variety of habitats including pelagic (open water), littoral (near shore), and benthic (deep water) zones. Open water habitat is dominated by carp and white bass adults, while littoral zones and vegetated areas have greater concentrations of young-of-the-year of all species.

FINAL DRAFT
Utah Lake TMDL August 2007 Final Draft Lake Loading Pollutant Assessment & 57 of 88 Designated Beneficial Use Impairment Assessment
Habitat with adequate cover for young-of-the-year is an element of concern for all species. Major tributary inflows to Utah Lake (American Fork Creek, Hobble Creek, Spanish Fork River, Spring Creeks near Lehi and Springville and Beer Creek) were assessed in 2002 to determine their potential for spawning and rearing as part of the June sucker recovery program (UDNR 2002a). These streams were classified on their potential to provide spawning habitat for June Sucker based on the presence of flow, pools, runs and riffles, water clarity, channel width, depth and other pertinent observations relative to future land use.
The outlet of American Fork Creek to Utah Lake exhibits an active gravel bed and abundant aquatic vegetation (bulrush, reeds and willows). Trap-netting at the mouth of the river in 2000 (UDNR) captured most of the fish species known to occur in Utah Lake (carp, white bass, bluegill, green sunfish, yellow perch, channel catfish, and black bullhead), indicating that there is potential for use of this inflow (UDNR 2002a).
Hobble Creek’s outlet is characterized by extensive wetland habitat that extends for miles in each direction. Vegetation is predominantly cattails, bulrush, and yellow nutgrass, providing cover and habitat for young fish. However, access to the outlet from the lake is obstructed by debris, beaver dams and diversion structures. Trap-netting at the mouth of the river in 2000 (UDNR) captured most of the fish species known to occur in Utah Lake indicating that there is potential for use of this inflow (UDNR 2002a).
The outlet of the Spanish Fork River is essentially a barren mudflat with little or no aquatic vegetation or cover. It does not provide adequate habitat for young fish although several sampling efforts found most of the species within the lake indicating that there is substantial use of this inflow by adult populations (UDNR 2002a). Electroshocking surveys in the lower mile of the river in 1997 and 1998 found Utah sucker, walleye, mountain whitefish, redside shiner, carp, white bass, green sunfish, and brown trout. Trap-netting at the mouth of the river in 2000 captured most of the fish species known to occur in Utah Lake; carp, white bass, bluegill, green sunfish, yellow perch, largemouth bass, brown trout, Utah sucker, channel catfish, walleye, rainbow trout and black bullhead.
The inflow of Spring Creek near Lehi is of reasonable size but cobble substrate was limited and low flows were common. The inflow of Spring Creek near Springville is also of reasonable size and has good habitat at its outlet into Utah Lake but cobble substrate was limited, low flows were common and habitat was limited by development. The outlet of Beer Creek also exhibited good habitat but cobble substrate was limited, habitat quality was poor, water clarity was low, and low flows were common (UDNR 2002a).
Habitat within the bottom reach of the Provo River is affected by the marina and its associated jetties and breakwaters. Aquatic vegetation is limited, flows are slack and channel substrate is predominantly fine silt and sand providing little cover and habitat. Immediately above this section of the Provo River there is more aquatic vegetation and cobble substrate. Water is still slow to slack but more pools and riffles are present than in the bottom reach. The river above this reach is inaccessible to fish species in all but very high flows due to the presence of a diversion dam (UDNR 2002b).
Development surrounding Utah Lake has resulted in a loss of shoreline vegetation and habitat based upon historic aerial photographs and land use and development records.

FINAL DRAFT
Utah Lake TMDL August 2007 Final Draft Lake Loading Pollutant Assessment & 58 of 88 Designated Beneficial Use Impairment Assessment
Stream channelization and loss of diffuse inflow influences the temperature, clarity and flow velocity of inflowing tributaries, especially in small and/or intermittent streams. These impacts also reduce the density and health of aquatic vegetation and the amount of available spawning and nursery habitat. Characterization of current and historic littoral habitat is anticipated to be a powerful tool in the recruitment and support of game and non-game fish in Utah Lake. Observed changes in littoral habitat, when combined with watershed activity and historic fish population data will help to identify the relative impact of carp, storm water runoff, changes in surface and subsurface recharge, and other factors on the health and viability of fish populations in Utah Lake.
Several studies have cited the decrease of appropriate spawning habitat and predation to be the major cause of decline in June sucker and other native populations in Utah Lake (SWCA 2002 and associated references). The decline in young June sucker and other small-bodied native fish, such as Utah chub and redside shiner, also appears to correspond with the introduction and expansion of white bass and walleye populations in the mid-1950s. White bass and walleye are known to be voracious pelagic and littoral zone predators of small fish. Channelization and flood control efforts in the mid-1950's reduced habitat complexity in the lower Provo River and along the shoreline of Utah Lake, further exposing larval and young-of-the-year June suckers to predation by these and other nonnative fish species. Channelization and dredging of the lower Provo River has also reduced food supplies and placed habitat limitations on larval and young-of-the-year June sucker (Heckman et al. 1981; Wilson and Thompson 2001).
Common carp, the most populous fish species in Utah Lake, are omnivorous bottom feeding fish that eat both plant and animal material. As bottom-dwelling fish, carp prefer quiet shallow waters with a soft floor and dense aquatic vegetation. They feed on the tender roots and shoots of aquatic plants and are known to disturb large areas while feeding, increasing turbidity. Their feeding habits can result in the removal of vegetative cover, macroinvertebrate food sources and nest sites for other fish and birds (Barton et al. 2000, Bonar et al. 2002, 1996, Frodge et al. 1995, Mitchell et al. 1984, Pauley et al. 1995). Based on the findings of recent studies the current population of carp in Utah Lake is estimated at 7.5 million age 2+ fish (UDNR 2005, p vii). Assuming an even distribution of fish throughout the lake, this equates to approximately 77 fish per acre, a conservative estimate in some areas as carp congregate in the shallow littoral zone of the lake where habitat is more favorable.
The suggested stocking rate for carp to remove unwanted aquatic vegetation is 20 to 25 age 2+ fish per acre (Bonar et al. 2002, 1996, Frodge et al. 1995, Pauley et al. 1995). At this stocking rate substantial to complete removal of unwanted vegetation was observed in the majority of studies. With the estimated carp population density of 77 fish per acre or greater the potential for vegetation removal and sediment disturbance in Utah Lake is substantial, especially in the shallow areas. The carp population could be affecting spawning and rearing habitat quality, connectivity from tributary mouths to lake shorelines for young fish and foraging efficiency for other species in the lake.
Insufficient data is available to quantify the extent and identify the specific causes of the loss of littoral habitat/vegetative cover. It is reasonable to assume however that given the dominance of carp some of the loss is due to foraging. However, given the altered

FINAL DRAFT
Utah Lake TMDL August 2007 Final Draft Lake Loading Pollutant Assessment & 59 of 88 Designated Beneficial Use Impairment Assessment
structure of much of the immediate drainage and shoreline, direct and indirect anthropogenic effects are an additional cause.
Current population trends of dominant fish species (carp, black bullhead, white bass and channel catfish) have remained relatively stable and appear to be supported by habitat and water quality conditions. However, native species such as the June sucker and Utah sucker are not expanding populations outside of stocking and protective programs. This may be due to lack of appropriate spawning and rearing habitat in the lake and associated tributary inflows.
Correlation of Water Quality and Fish Population Trends
An assessment of available water quality data shows that exceedances of water quality criteria occurred rarely at in-lake and tributary sites (Figure 10 through Figure ). In-lake sites were determined to be fully supporting of warm water fisheries based on the temperature criteria of no greater than 27oC and the dissolved oxygen criteria of no less than 3 mg/L. Fish population data show stable populations of carp, black bullhead, white bass and channel catfish but are not sufficient to determine support status. No apparent correlation could be found between water quality and fish population trends in Utah Lake. The water quality data does not indicate preferential selection for dominant populations or the decline of native species. Furthermore, during recent drought years no substantial fish kills have been reported in the lake, indicating that water quality conditions are supporting the maintenance of fish populations under stressful climatic conditions.
While water quality conditions are definitely not ideal in some areas of the lake at certain times, such conditions do not occur long enough to be fatal to fish populations. Eventually, water quality conditions improve later in the year.
Rehabilitation and restoration of tributary and shoreline habitat is ongoing within the watershed. Due to implementation of best management practices for agricultural, storm water and riparian management and other habitat rehabilitation projects, conditions in a number of tributary streams have improved dramatically over the last ten years (UDEQ 2004). Continued implementation will improve both spawning habitat and warm water refugia within the watershed.
Conclusions
Evaluation of the available data for Utah Lake indicate that while some parts of the lake experience short term exceedances of the water quality criteria, the warm water game fish population is not impaired due to water quality exceedances. In-lake sites are fully supporting of the warm water fisheries beneficial use based on the temperature criteria of no greater than 27oC and the dissolved oxygen criteria of no less than 3 mg/L.
At all stations where monitoring data were available, a portion of the water column maintained fully supporting temperature and dissolved oxygen conditions throughout the year. These areas of supporting water quality conditions and the inflowing tributaries may be utilized by warm water game fish populations as refugia during those times when water quality exceedances occur in other parts of the lake. The available data show stable

FINAL DRAFT
Utah Lake TMDL August 2007 Final Draft Lake Loading Pollutant Assessment & 60 of 88 Designated Beneficial Use Impairment Assessment
populations of some warm water game fish populations including black bullhead, white bass and channel catfish.
Preferred spawning conditions for warm water game fish are available in-lake with the exception of elevated water temperatures during the latter portion of the spawning periods for black crappie and large and smallmouth bass. Tributary spawning conditions for brown and rainbow trout show a similar pattern of elevated temperatures. However, the preferred spawning temperatures for these species are recommended values only and are not water quality criteria set by the State. Tributary inflows provide additional habitat but may not be sufficiently extensive or diverse to meet the needs of all resident species.
The quality and amount of spawning and nursery habitat is limited in Utah Lake. High quality shoreline vegetation is very limited due to channelization and loss of diffuse inflow. Alterations in flow patterns influence the temperature, turbidity, clarity and flow velocity of inflowing waters, especially small and/or intermittent streams, reducing the density and health of aquatic vegetation and, consequently, the amount of available spawning and nursery habitat. An additional cause of limited shoreline vegetation are the feeding habits of the dominant carp population.
The assessment of full support based on water quality parameters should be considered preliminary, and additional data currently being collected can be used to further refine the support status of designated uses over time.
Algal Characterization and Biomass
Utah Lake is a large, shallow, semi-terminal water body that is fed by a very large, mostly Mesozoic-aged nutrient-rich sediment basin. The lake bottom is comprised largely of loosely compacted, watery sediments (generally precipitated calcium carbonate, clay and others), which are re-suspended in the water column by persistent and often strong winds that contribute to the highly turbid waters of the lake. Often the lake appears gray-green depending upon the time of year due to the combination of suspended sediments, precipitated calcium carbonate and dense algal and cyanobacteria blooms.
Utah Lake is a highly productive ecosystem with the majority of algal production occurring as massive open-water cyanobacteria blooms in the late summer and fall. While the lake overall has high algal species diversity, these blooms are very low in diversity. Often the blooms are dominated by extremely large numbers of as few as three to five species. These include Aphanizomenon flos-aquae (A. flos.aquae), which obtain maximum population development under eutrophic conditions and may prefer waters with elevated pH. Under the right conditions, this organism can create serious water degradation and may cause taste and odor problems, and has the potential to cause fish kills and poison mammalian species. However, there is no record of Utah Lake having experienced large fish kills or mammalian poisoning from cyanobacterial toxins.
A. flos.aquae may be replaced by Anabaena spiroides var. crassa during some years, or occasionally the two may co-exist. The dinoflagellate Ceratium hirundinella and the diatom Melosira granulata var. crassa are also common in Utah Lake. All of these taxa reach their maximum density in nutrient-rich waters and are most often considered to be indicators of eutrophic or hypereutrophic water conditions.

FINAL DRAFT
Utah Lake TMDL August 2007 Final Draft Lake Loading Pollutant Assessment & 61 of 88 Designated Beneficial Use Impairment Assessment
Utah Lake is often considered to be a hyper-eutrophic ecosystem, although the unusually high species diversity is atypical. Lake algal diversity is highest in spring and early summer, decreasing with the progression of the seasons.
In many aquatic ecosystems with similar dominant late summer and fall blooms of Aphanizomenon, Anabaena, Ceratium, and Melosira, severe impairment of water quality occurs, making the waters unusable or even lethal to aquatic life for drinking or habitat. Fish kills often are the result of oxygen deprivation in the water column due to respiration of the cyanobacteria and algae during nighttime hours and the production of metabolites and toxic breakdown products of the cyanobacteria themselves.
Utah Lake has not exhibited large fish kills or mammalian poisoning from cyanobacterial toxins, and impairment due to the presence of such toxins has not been observed to occur. Due to the shallow nature of the lake, and the constant wind-mixing of the water column, oxygen deprivation has not been observed to occur on a large scale in Utah Lake. Consequently, substantial fish kills due to oxygen deprivation have not been observed to occur in the lake. Likewise, due to the wind and water mixing, toxins produced by cyanobacteria have not reached concentrations high enough to poison animals that drink from it.
A study of diatoms in Utah Lake sediment indicates the diatom assemblages closely mirrors the diatom floras of the lake during recent history. Most species are present in low numbers both in the water column and bottom sediment samples. A relatively small number of taxa dominated the assemblage of diatoms present in the recent bottom samples as compared to the past few thousand years and include species of Melosira, Stephanodiscus and Cyclotella. No changes in type or abundance of diatoms were noted when compared to other studies completed in the Utah Lake ecosystem.
It should be noted that the above conclusions are tentative and will require more research to fully substantiate. Biological water quality is reflected by phytoplankton floras in an aquatic ecosystem. It is important to perform biological studies to establish a baseline of data for comparison with changes in lake and reservoir systems due to system perturbations that may occur over time. It is critical that Utah Lake be the subject of further studies of this type in order to continue to examine algal and cyanobacterial communities, to illuminate current algal and cyanobacterial floras, to determine if cyanobacterial produced toxins are present in the lake or Jordan River, to determine if Aphanizomenon or Anabaena produces more toxins, and to determine what environmental conditions foster the development of which genus.
Beneficial Use Impairment Assessment – Other Aquatic Life (3D)
Utah Lake’s associated wetlands are recognized locally and nationally for their critical importance to fish and wildlife resources. The wetland ecosystem is an important breeding area and stopover for many migratory birds in the Pacific Flyway. Approximately 226 species of birds are known to use Utah Lake wetlands, as well as 49 mammalian species, 16 species of amphibians and reptiles and 18 species of fish (URMCC 2006).
The Utah Lake Wetland Preserve, a network of wetland and interspersed upland habitats near the southern end of Utah Lake, was recently established to partially mitigate for past

FINAL DRAFT
Utah Lake TMDL August 2007 Final Draft Lake Loading Pollutant Assessment & 62 of 88 Designated Beneficial Use Impairment Assessment
and anticipated future impacts of the Central Utah Project. The goal of the Preserve is to provide habitat for wetland and upland-dependent species and will be managed by the Utah Division of Wildlife Resources (URMCC 2006).
While some areas of Utah Lake support critical wetlands, the shoreline of the lake is lacking in riparian vegetation. There are few areas with established cottonwoods and shrubs common to desert riparian areas, possibly due to fluctuating lake levels.
As discussed in previous sections, high quality shoreline vegetation may also be limited due to channelization and loss of diffuse inflow and the feeding action of carp. A more detailed assessment of flow alterations and historic fish population data may help to identify the role of each of these and other factors on the health and viability of waterfowl, shore birds and other water-oriented wildlife populations in Utah Lake.

FINAL DRAFT
Utah Lake TMDL August 2007 Final Draft Lake Loading Pollutant Assessment & 63 of 88 Designated Beneficial Use Impairment Assessment
Beneficial Use Impairment Assessment – Agriculture (4)
Methodology
The determination of Utah Lake’s beneficial use support will focus on TDS concentrations in the lake and the potential effects to irrigated crops. State water quality criteria for total dissolved solids (TDS) concentrations are no greater than 2,000 mg/L for stock watering, and no greater than 1,200 mg/L for irrigation (Utah Administrative Code R317-2-14, June 01, 2006).
To determine the support status or level of impairment for crop irrigation specific to Utah Lake water, the types and acreages of irrigated crops were determined, along with an assessment of the TDS concentrations tolerated by each crop type. These tolerances were then compared to the TDS concentrations observed in Utah Lake and an estimate of crop response was identified.
Area of Water Use from Utah Lake
Irrigation water from Utah Lake is diverted from several different canals on the Jordan River and directly from the lake. The method used to determine acreages of land irrigated by the canal system differs from the method used for the determination of direct withdrawal because of the complexity of the canal and diversion system and the variation in use as well as differences in the availability of appropriate data.
Utah Lake Irrigation Water - Deliveries via Canal
The fate of irrigation water originating from Utah Lake was determined from information provided by Utah’s Department of Natural Resources, Division of Water Resources (DWR). This data, provided spatially in GIS format, includes agricultural water rights for crops, pasture and orchards, but excludes wetlands and wildlife areas.
The location of agricultural land irrigated by Utah Lake water was only available to the nearest 16th of a section (40-acres). If any part of the 40 acres contained agricultural land irrigated by Utah Lake waters, the entire area is included in the agricultural irrigation boundary as shown in Figure 24.

FINAL DRAFT
Utah Lake TMDL August 2007 Final Draft Lake Loading Pollutant Assessment & 64 of 88 Designated Beneficial Use Impairment Assessment
Canal Deliveries (Total Possible Irrigated Acres)
Seepage Loss in Canals
Via Jordan River to Canals
Actual Areas irrigated by Canal Delivery (Utah County and Salt Lake County)
Areas irrigated by Direct Withdrawals (Utah County)
Secondary Irrigation (residential lawns & gardens)
Crop Irrigation (farms, orchards, etc.)
Utah Lake
Via Direct Withdrawal
Canal Flows
Figure 24. Irrigation Diversion from Utah Lake

FINAL DRAFT
Utah Lake TMDL August 2007 Final Draft Lake Loading Pollutant Assessment & 65 of 88 Designated Beneficial Use Impairment Assessment
Irrigation water diverted from Utah Lake to the agricultural irrigation boundary area were summarized by DWR (Figure 25). The summary consists of measured irrigation canal deliveries from eight canals between 1999 and 2003. An inventory of the actual canal flows diverted from Utah Lake is presented in Table 16. These recent diversions were used to represent current average conditions.
Table 16: Summary of Irrigation Water Diverted from Utah Lake Year Actual AFY1999 123,0772000 148,3752001 165,5082002 160,6762003 146,739
Average 148,875
It should be noted that during the 1999 to 2003 time period, the Utah Lake watershed and much of the Intermountain West experienced below normal precipitation, which would be expected to impact total canal flow volumes.
Normalization of the canal deliveries is complicated because of the complex relationship between deliveries and annual precipitation. Depending on the season and local precipitation, the supply and demand can either be inversely related or directly proportionate. Assuming that excess storage water in Utah Lake is available, drier years would see increased canal deliveries for irrigation to offset the lack of precipitation. Therefore, using the canal delivery data for the specified time period without normalization actually overestimates the flow that crops would receive in an average year. This analysis uses unnormalized canal deliveries as a conservative estimate of average canal irrigation deliveries.
The amount of water delivered via the canals was measured at the head of each canal. The measured amount does not account for seepage losses, which can be significant in unlined canals. Hely and others (1971) estimated seepage loss in canals in the Salt Lake Valley at 48,000 AFY, based on extrapolating measured losses for one canal to other major canals. A more in-depth study, measuring losses in six of the Salt Lake Valley canals, estimated seepage losses at 28,000 AFY during 1982 and 1983 (Herbert 1985). These estimates indicate that seepage losses may account for between 19% and 32% of the average total irrigation water diverted annually from Utah Lake.
In order to accurately adjust the 1999 to 2003 canal deliveries to account for seepage losses, the published seepage losses for individual canals were normalized to average precipitation during that period. This assumes that wetter years experience higher water tables causing less seepage losses and even recharge into the canals. Conversely, drier years experience more seepage losses. An average of 65 percent of normal precipitation was received from 2001 to 2003. The normalized seepage losses during this time frame were calculated at approximately 36,000 AFY, representing approximately 24% of the average volume of water diverted from the lake.

FINAL DRAFT
Utah Lake TMDL August 2007 Final Draft Lake Loading Pollutant Assessment & 66 of 88 Designated Beneficial Use Impairment Assessment
Figure 25: Agricultural Irrigation Boundary

FINAL DRAFT
Utah Lake TMDL August 2007 Final Draft Lake Loading Pollutant Assessment & 67 of 88 Designated Beneficial Use Impairment Assessment
Total annual precipitation at the Provo BYU weather station was calculated from daily precipitation records collected by the Utah Climate Center. The 30-year normal for the Provo BYU weather station was obtained from Golden Gate Weather Services (http://ggweather.com/normals/UT.htm) (Figure 26).
Figure 26: Precipitation recorded at BYU Provo Weather Station
Irrigated Acreage
To estimate the actual amount of land irrigated by Utah Lake water the corrected average annual canal delivery was converted to an acreage using a duty value (acre-feet of water required to irrigate each acre of land). The duty values for Salt Lake County and Utah County are 5 and 4 acre feet per acre respectively. Flow was converted using a weighted duty value (4.92), since approximately 92 percent of the bounded area lies within Salt Lake County and 8 percent lies within Utah County. Based on this method, 121,641 AFY was used to irrigate approximately 24,724 acres of land within the study area.
Crop Types
DWR provided water related land use (WRLU) GIS data for Salt Lake County and Utah County. Salt Lake County data (2002) and Utah County data (2003) were used to find acreages of individual crop types irrigated by Utah Lake water. The WRLU classifications include irrigated lands, non-irrigated lands, riparian areas, commercial/industrial developments and open water.
0
4
8
12
16
20
24
28
32
36
40
1981
1982
1983
1984
1985
1986
1987
1988
1989
1990
1991
1992
1993
1994
1995
1996
1997
1998
1999
2000
2001
2002
2003
Ann
ual P
reci
pita
tion
(in.)
0
20
40
60
80
100
120
140
160
180
200
% o
f 30
Year
Nor
mal
Pre
cipi
tatio
n
Annual Precipitation 30 Year Normal % of Normal Precipitation

FINAL DRAFT
Utah Lake TMDL August 2007 Final Draft Lake Loading Pollutant Assessment & 68 of 88 Designated Beneficial Use Impairment Assessment
The identification of crop types irrigated by Utah Lake water via canals was determined using ArcGIS software. The 2002 Water Resources WRLU survey data were overlaid by the land irrigated by canal deliveries. It was assumed that all irrigated areas identified by the WRLU surveys receive water from Utah Lake. Some areas of the Salt Lake Valley, such as Herriman and Magna, may be serviced by groundwater wells so these areas are not included within the DWR boundary irrigated by Utah Lake. The rest of Salt Lake Valley relies mainly upon surface water to meet irrigation demands.
Utah Lake Irrigation Water - Direct Withdrawals
In addition to canal deliveries, direct withdrawals from the lake used for irrigation were taken into account. A summary of direct Utah Lake withdrawals used for irrigation is presented in Table 17. Table 17: Summary of Direct Withdrawal Irrigation Water from Utah Lake
Year Actual AFY1999 6,2402000 6,9172001 6,9172002 6,8492003 1,616
Average 5,708
DWR provided a summary of measured irrigation water for two direct withdrawals from Utah Lake between 1999 and 2003 from which an average annual flow was determined.
Irrigated Acreage and Crop Types
According to DWR, one farm and one orchard use water directly from Utah Lake. The total acreage irrigated by direct withdrawals is 1,747 acres. The acreage of orchards were determined from property parcel area information obtained from the Utah County GIS Department. The crop breakdown for the farm was determined using a method similar to determining the crop types within the Salt Lake Valley.
Agricultural Salinity Tolerances Crop salinity tolerances were obtained from Water Quality for Agriculture (Ayers and Westcot 1985) and the Utah State University State Extension Service. Salinity tolerances for crops that are irrigated by any method are reported as specific conductivity of the irrigation water (SCw). The published tolerances are based on several assumptions including a 15–20% leaching fraction, 40-30-20-10% water use pattern for the upper to lower quarters of the root zone and semi-arid irrigated agriculture (evaporation exceeds precipitation).
Irrigation water salinity, along with the sodium absorption ratio (SAR) value can have a significant impact on the infiltration rate of water through the soil profile. SAR is the ratio of sodium versus calcium and magnesium. The higher the value the more sodium will be accumulated in the soil and plant leaves after the plant has transpired water. High sodium concentrations in the leaves can reduce growth because of plant toxicity.

FINAL DRAFT
Utah Lake TMDL August 2007 Final Draft Lake Loading Pollutant Assessment & 69 of 88 Designated Beneficial Use Impairment Assessment
The greater the amount of salinity in the applied irrigation water, and the lower the SAR ratio, the greater the amount of irrigation infiltration that may occur within the soil. At the same time the higher the amount of salinity within the soil, the harder it is for plant roots to extract water from the soil. At certain salinity levels the plant will not be able to extract the moisture needed and crop productivity will be decreased. In extreme cases, the decrease in productivity can result in plant mortality. The leaching factor discussed above is extremely important to the use of irrigation water with elevated salinity levels.
The SAR ratio for Utah Lake water is quite low at a value of about 3 and therefore is not considered a significant problem for irrigation water (Merritt et al, 2004). Irrigation water with a SAR greater than 3 will have a moderate impact upon crop yield and SAR values greater than 9 will have a severe impact upon crop yield.
SCw values are available for 100%, 90%, 75%, 50% and 0% yield potentials for several crops. The 100% value represents the specific conductivity values for irrigation water where the full crop yield is attained and there are no observed effects. The highest specific conductivity at which 100% yield occurs represents a threshold value for SCw. At SCw values greater than that threshold, salinity levels are associated with reduced yield potentials (90%, 75% and 50%). The SCw related to 0% yield potential is a theoretical value at which crop growth ceases.
Water Quality Assessment for Total Dissolved Solids (TDS) and Conductivity (SC) Water quality data gathered from the STORET database were statistically analyzed in the Task 1 Technical Memorandum. Of all irrigation water drawn from Utah Lake, 96% is delivered via canals from the Jordan River, and only 4% is removed via direct withdrawals. Although the south end of the lake may have higher concentrations of TDS, this analysis compares crop salinity tolerances to the outlet water of Utah Lake. Since the goal of this analysis is to determine if the lake water itself is supporting its designated beneficial uses, circumstances downstream of Utah Lake that may influence the TDS concentration or irrigation water before its final destination were considered to be outside the scope of the Utah Lake TMDL process. Water quality data from Jordan River at the Utah Lake outlet (STORET #499479) was used to complete the agricultural impairment assessment.
To convert plant salinity tolerances published as SC concentrations to TDS, a correlation between SC and TDS was developed using data available from STORET stream stations. The correlation uses all SC and TDS data measured at the same location on the same day. The correlation is presented in Figure 27. After calculating an equivalent TDS tolerance, crop impairment levels were compared directly to TDS levels in Utah Lake outlet water.

FINAL DRAFT
Utah Lake TMDL August 2007 Final Draft Lake Loading Pollutant Assessment & 70 of 88 Designated Beneficial Use Impairment Assessment
Figure 27: Correlation between SC and TDS
TDS:SC Stream Correlation
y = 0.6096x + 45.143R2 = 0.8681
0
500
1000
1500
2000
2500
0 500 1000 1500 2000 2500 3000 3500
SC (umho/cm)
TDS
(mg/
L)
Data for SC and TDS measurements shown in Figure 27 are predominantly from the outlet of Utah Lake to the Jordan River. No other in-lake sites contained a large enough data set of both measurements to allow an accurate correlation to be calculated separately. As the outflow data are reflective of overall, cumulative conditions in the lake and represent the vast majority (96%) of irrigation water from the lake, this correlation was used for identification of irrigation effects.
Irrigation Water Results
Utah Lake Irrigation Water Use Acreages Utah Lake water is used for agricultural purposes via canals and direct withdrawals. Of the area within the irrigated boundary, WRLU data shows that a little over 12 percent of available lands are irrigated. These lands are assumed to be irrigated by Utah Lake water canal deliveries shown in Figure 28a. Table 19 lists the irrigated land by crop type within the study boundary based on overlaying the irrigation boundary on the 2002 WRLU surveys.

FINAL DRAFT
Utah Lake TMDL August 2007 Final Draft Lake Loading Pollutant Assessment & 71 of 88 Designated Beneficial Use Impairment Assessment
a Total acre with land use/ crop separation b Irrigation acres for lands that have been converted from agriculture to urban/suburban land uses
Area Irrigated by Utah Lake Water
The bounded area potentially irrigated by water from Utah Lake is illustrated in Figure 28a and b.
Table 19. Acreage of Agricultural Land and Other uses
Land Use Category
Canal Withdrawal
(ac)
Direct LakeWithdrawal
(ac) Total Irrigation
Acres % Irrigationa 10,611 1,747 12,358 47
Alfalfa 4,370 750 5,120 19 Pasture 2,647 225 2,872 11 Grain 1,670 150 1,820 7 Corn 901 375 1,276 5 Orchard 32 247 247 1 Grass Hay 432 0 432 2 Grass/Turf 281 0 281 1 Other Vegetables 226 0 226 1 Sorghum 39 0 39 <1 Onions 7 0 0 <1 Tomatoes 6 0 6 <1
Secondary Irrigationb 4,945 NA 4,945 19 Unused 9,168 NA 9,168 35 Total 26,471
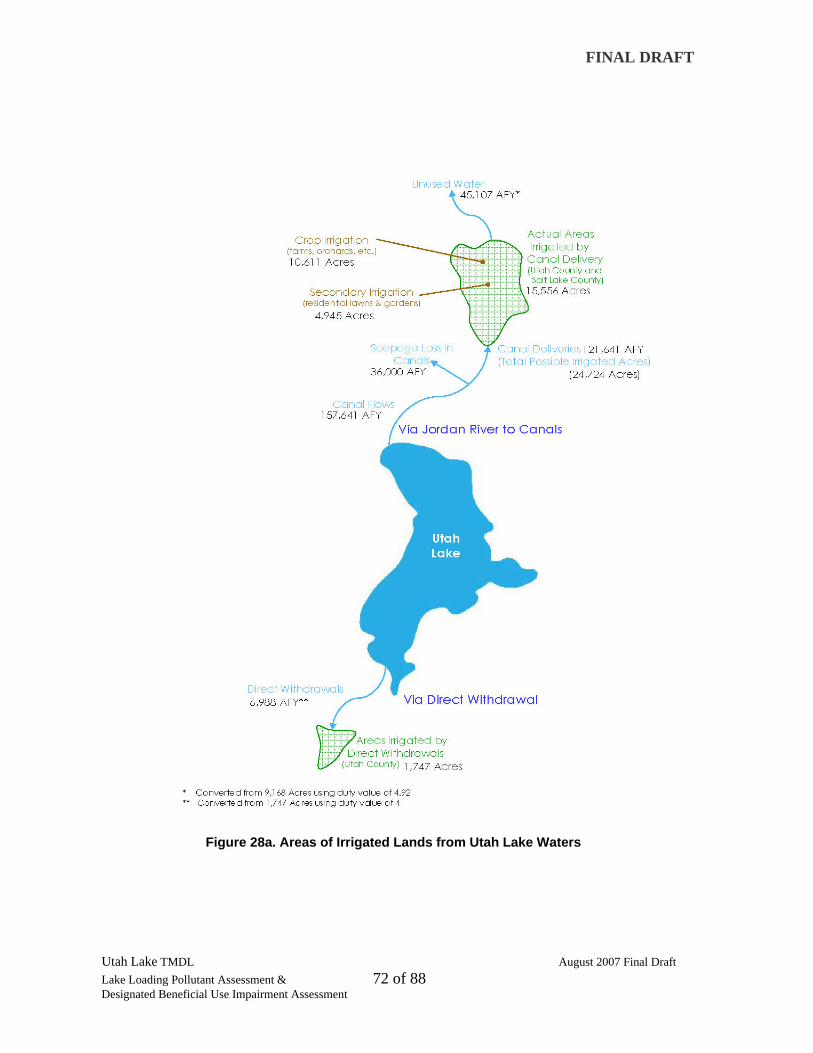
FINAL DRAFT
Utah Lake TMDL August 2007 Final Draft Lake Loading Pollutant Assessment & 72 of 88 Designated Beneficial Use Impairment Assessment
Figure 28a. Areas of Irrigated Lands from Utah Lake Waters

FINAL DRAFT
Utah Lake TMDL August 2007 Final Draft Lake Loading Pollutant Assessment & 73 of 88 Designated Beneficial Use Impairment Assessment
Figure 28b. Map of Irrigated Land Use Downstream of Utah Lake

FINAL DRAFT
Utah Lake TMDL August 2007 Final Draft Lake Loading Pollutant Assessment & 74 of 88 Designated Beneficial Use Impairment Assessment
The area covers 85,807 acres, although only portions of the area are actually irrigated (Table 20). According to measured irrigation deliveries via canal and duty values determined by DWR, approximately 24,724 acres within the boundary would be irrigated if all water deliveries were fully used. In addition to canal deliveries, about 1,747 acres are irrigated by direct withdrawal of Utah Lake waters. A total of approximately 26,471 acres are irrigated by Utah Lake water.
Crop Breakdown Determination
Table 19 shows a breakdown of this irrigated land by crop type within the irrigation boundaries based on the 2002 WRLU surveys.
According to DWR WRLU surveys, only 10,611 acres of the potential 24,724 acres are actually irrigated. The remaining portions of land within the study area consists of residential, commercial/industrial, non-irrigated, riparian, water, and not classified (Table 20). The 14,113 acre difference within the WRLU irrigated cropland survey and the calculated acreage based upon diverted flow and the duty value is most likely made up of the secondary irrigation area which lack official records of use and are not included in “irrigated” land use and the partial use of water deliveries.
Table 20: Land Use within Canal Delivery Boundary
Land Use Category Acres % Acres
Residential 49,832 58 Commercial/Industrial 13,157 15 Irrigated 10,611 12 Non-Irrigated 6,696 8 Not Classified 3,832 4 Riparian 1,471 2 Water 208 <1 Total 85,807
Specific records on partial use of water deliveries are also largely unavailable. Best estimates based on preliminary data approximate as much as 50 to 60 percent of total irrigation water deliveries are not used. This study assumes any irrigation water deliveries that cannot be accounted for are unused (37%). After reviewing the analysis, DWR corroborates that this is a reasonable estimate.
Agricultural Salinity Tolerances Once agricultural uses of irrigation water were identified, crop impairment was assessed by calculating TDS tolerances to Utah Lake water quality. Salinity tolerances converted to TDS levels for relevant crops are listed in Table 21 with TDS levels that coincide with yield potential, 90%, 75%, 50% and 0% levels of production.

FINAL DRAFT
Utah Lake TMDL August 2007 Final Draft Lake Loading Pollutant Assessment & 75 of 88 Designated Beneficial Use Impairment Assessment
Table 21: Individual Crop Tolerances to TDS Levels (mg/L) % Yield Potential at Specific TDS Levels Irrigation Water Application Threshold* 90 75 50 0** Alfalfa 838 1,386 2,240 3,642 6,141 Pasture 1,508 2,057 2,971 4,495 7,421 Grain 2,179 2,727 3,581 5,044 7,909 Corn 716 1,081 1,569 2,423 4,129 Grass Hay 1,508 2,057 2,971 4,495 7,421 Grass/Turf 1,264 Other Vegetables 899 1,264 1,813 2,727 4,617 Orchard 655 838 1,203 1,752 2,788 Sorghum 2,788 3,093 3,459 4,129 5,349 Onions 533 777 1,142 1,813 3,093 Tomatoes 1,081 1,447 2,118 3,093 5,166
* Yield potential begins to be affected ** Theoretical value at which crop growth ceases
Based on these converted tolerances, correlations were developed to estimate percent yield potential at any given TDS concentration for each crop type. The correlations between concentration and percent yield potential are shown in Figure 29.
TDS Tolerances for Common Utah Crops
0
10
20
30
40
50
60
70
80
90
100
0 1,000 2,000 3,000 4,000 5,000 6,000 7,000 8,000 9,000
TDS mg/L
% Y
ield
Pot
entia
l
Alfalfa Pasture Grain CornGrass Hay Other Vegetables Orchard SorghumOnions Tomatoes
Figure 29: TDS Concentration Tolerances for Crops Irrigated by Utah Lake

FINAL DRAFT
Utah Lake TMDL August 2007 Final Draft Lake Loading Pollutant Assessment & 76 of 88 Designated Beneficial Use Impairment Assessment
These correlations are used to estimate yield potentials for individual crops at varying concentrations of TDS within the irrigation water as shown in Table 22. Also, the average percent yield for all agricultural land irrigated by Utah Lake water was calculated by weighting the percent yield potentials by the percent of total irrigated agricultural land (see Table 22).
Table 22: Yield Potential for Individual Crops Irrigated by Utah Lake
Irrigation %
Affected % Yield Potential at various TDS Concentrations (mg/L) Crop Type Acres Acresa 800 900 1000 1100 1200 1300 1400 1500 Alfalfa 5,120 42.5 100 99.9 98 96.2 94.4 92.6 90.8 89 Pasture 2,872 23.8 100 100 100 100 100 100 100 100 Grain 1,820 15.1 100 100 100 100 100 100 100 100 Corn 1,276 10.6 98 95.1 92.3 89.5 86.6 83.8 81 78.1 Grass Hay 432 3.6 100 100 100 100 100 100 100 100 Other Vegetables 226 1.9 100 100 97.4 94.8 92.2 89.6 87 84.4
Sorghum 247 2.0 100 100 100 100 100 100 100 100 Orchard 39 0.3 100 98.3 95.6 92.9 90.2 87.4 84.7 82 Onions 7 0.1 89.3 85.6 81.8 78.1 74.3 70.6 66.8 63.1 Tomatoes 6 0.0 100 100 100 99.5 97.2 94.8 92.4 90.1
Average Weighted % Yield Potentialb 99.8 99.6 98.6 97.6 96.6 95.7 94.7 93.0
a Based on total 12,045 acres b Rounded to the nearest 0.1%
Water Quality at Utah Lake Outlet Once crop responses to TDS levels were established, they were compared to TDS levels and EC coefficients at the Utah Lake outlet. Average monthly TDS concentrations for Jordan River at the Utah Lake outlet (STORET Station 499479) is illustrated in Figure 31. With the exception of December, the monthly averages are below 1,200 mg/L. Average TDS levels at the Utah Lake Outlet inside and outside of irrigation season are compared to the response to salinity for all crops irrigated by Utah Lake water in Figure 32.

FINAL DRAFT
Utah Lake TMDL August 2007 Final Draft Lake Loading Pollutant Assessment & 77 of 88 Designated Beneficial Use Impairment Assessment
Based on the identified uses of irrigation water from Utah Lake and the average historical TDS levels at the Utah Lake outlet, the average yield potential during irrigation season is about 99 percent (or 1 percent reduction in yield). During an average irrigation season the yield can fluctuate 2% from about 97.5% to 99.5% yield potential.
700
800
900
1000
1100
1200
1300
1400
1500
Jan Feb Mar Apr May Jun Jul Aug Sep Oct Nov Dec
TDS
(mg/
L)
499479 Jordan River at Utah Lake Outlet
TDS Agricultural Criteria
Figure 30: Average Monthly TDS Concentrations – Jordan River (1980-2003)

FINAL DRAFT
Utah Lake TMDL August 2007 Final Draft Lake Loading Pollutant Assessment & 78 of 88 Designated Beneficial Use Impairment Assessment
Secondary Irrigation Secondary irrigation is a fast growing use of water in Salt Lake and Utah Valleys as farms are converted to residential areas.
Utah’s Department of Natural Resources, Division of Water Resources provided WRLU GIS data for Salt Lake County and Utah County for multiple years. Salt Lake County data were available for 1988, 1994, 2001, and 2002. Utah County surveys were available for 1988, 1995, 2001, and 2003. These data were used to show trends in water related land use over time. According to the WRLU survey data, urban/urban residential has grown about 21 percent since 1994 and irrigated lands have decreased about 32 percent. Water related land use trends are shown in Figure 33.
80
81
82
83
84
85
86
87
88
89
90
91
92
93
94
95
96
97
98
99
100
700 800 900 1000 1100 1200 1300 1400 1500 1600
TDS Concentration (mg/L)*
% T
otal
Cro
p Yi
eld
Pote
ntia
l
Average of Average Monthly
Concentrations during Irrigation Season(April - October)
Minimum Average Monthly Concentration (May)
Maximum Average Monthly Concentration (December)
* Note: TDS Concentrations measured at STORET Station 499497 Jordan River at Utah Lake Outlet
Range of Average Monthly Concentrations during
Irrigation Season (April - October)
AgriculturalTD
SC
riteria1200
mg/L
Average response of all land irrigated by Utah Lake water
Figure 31. Yield Potential of all Land Irrigated by Utah Lake Water

FINAL DRAFT
Utah Lake TMDL August 2007 Final Draft Lake Loading Pollutant Assessment & 79 of 88 Designated Beneficial Use Impairment Assessment
The WRLU surveys identify land uses such as agricultural (irrigated and non-irrigated), riparian, residential, and urban. Much of the water used to irrigate lawn grass is not included under agriculture areas, but instead under the residential areas. Only a small amount of irrigated turf (281 acres) is accounted for in the agricultural land use, however, irrigation water used for secondary irrigation in residential areas is not differentiated from indoor residential use and records of secondary irrigation use are not available. This analysis assumes that secondary irrigation comprises 20 percent of irrigation water delivered by canal. This assumption was based on preliminary data of a case study on secondary irrigation and personal communication with Utah’s Division of Water Rights.
Since secondary irrigation is not considered a traditional agricultural use it was considered separately from the traditional agricultural impairment assessment in this report.
Secondary irrigation is not factored into the average response of all crops irrigated by Utah Lake water, but according to the threshold TDS tolerance for sensitive grasses (1,264 mg/L for Kentucky Bluegrass), secondary irrigation is currently not being impaired. During the lawn-watering season, the irrigation water leaving Utah Lake is below the threshold at which turf begins to be affected.
Because the threshold (1,264 mg/L) is above the current agricultural TDS standard (1,200 mg/L), it does not appear that turf watered with Utah Lake water via secondary irrigation systems would see any reduction in health (Figure 34).
Figure 32. Water Related Land Use Trends
0
5
10
15
20
25
30
35
40
1986 1988 1990 1992 1994 1996 1998 2000 2002 2004
% o
f WR
LU A
cera
ge
Irrigated Not Irrigated Riparian Urban/Urban Residential

FINAL DRAFT
Utah Lake TMDL August 2007 Final Draft Lake Loading Pollutant Assessment & 80 of 88 Designated Beneficial Use Impairment Assessment
Private garden vegetable crops common to the area are also expected to be relatively unaffected by the TDS levels present in Utah Lake water during the growing season (April through September), with less than a 3% reduction in yield projected at observed TDS levels.
Conclusions The average response of all crops irrigated with Utah Lake water shows a one percent yield reduction due to salinity, fluctuating from an average of 0.5 percent to 2.5 percent reduction throughout the irrigation season. These results represent average conditions, and actual yields vary significantly with regional conditions and management practices. At the 1,200 mg/L criteria for TDS, approximately 96.5 percent crop yield of the threshold level would be expected (3.5 percent reduction in yield). Based on average irrigation season conditions, lands irrigated by Utah Lake water experience about a one percent reduction in yield due to TDS concentrations in the water, assuming that adequate leaching and ground water drainage occurs to prevent salt accumulation in the soil.
On average, most crops will not be affected by the current TDS concentrations. However, crops such as onions, orchards, and corn may be affected because of lower salinity tolerances. The average yield potential during irrigation season is about 99 percent for all crops. Therefore, Utah Lake water does support its beneficial use for 99 percent of the identified agricultural lands (yield is ~100%).
700
800
900
1000
1100
1200
1300
1400
1500
Jan Feb Mar Apr May Jun Jul Aug Sep Oct Nov Dec
TDS
(mg/
L)
TDS Tolerance for Sensitive Grass
* Note: TDS Concentrations from STORET Station 499497 Jordan River at Utah Lake Outlet (1980 -
Figure 33. Turf Tolerance to TDS Concentrations

FINAL DRAFT
Utah Lake TMDL August 2007 Final Draft Lake Loading Pollutant Assessment & 81 of 88 Designated Beneficial Use Impairment Assessment
Secondary irrigation using Utah Lake water for lawns and private gardens does appear to result in a substantial risk to productivity as based on the sensitivity of Kentucky Bluegrass and garden vegetable types common to the area.

FINAL DRAFT
Utah Lake TMDL August 2007 Final Draft Lake Loading Pollutant Assessment & 82 of 88 Designated Beneficial Use Impairment Assessment
Bibliography
Amacher, Jan Kotuby-, Rich Koenig and Boyd Kitchen. 1997. Salinity and Plant Tolerance. Utah State University Extension Services, Logan, Utah. Available online at: http://extension.usu.edu/publica/agpubs/salini.htm
Ayers, R. S. and D.W. Westcot. 1985. Water Quality for Agriculture: FAO Irrigation and Drainage Paper 29 Rev. 1. Food and Agriculture Organization of the United Nations.
Barton, DR., Kelton, N., Eedy, RI. 2000. The effects of carp (Cyprinus carpio L.) on sediment export from a small urban impoundment. Journal of Aquatic Ecosystem Stress and Recovery (Formerly Journal of Aquatic Ecosystem Health), Volume 8, Number 2, December 2000, pages 155 – 159.
Bonar, S.A., Bolding, B., and Divens, M. 2002. Effects of Triploid Grass Carp on Aquatic
Plants, Water Quality, and Public Satisfaction in Washington State. North American Journal of Fisheries Management 2002;22:96–105
Bonar, S.A., Bolding, B., and Divens, M. 1996. Management of aquatic plants in
Washington State using grass carp: effects on aquatic plants, water quality, and public satisfaction 1990-1995. Washington Department of Fish and Wildlife Research Report No. 1F96-05.
Carter, D. 1969. A history of commercial fishing on Utah Lake. M.A. Thesis. Brigham Young University. Provo, Utah. 142 pp.
City of Provo, Utah, Provo City Storm Water Service District, Storm Water Management Program, Storm Water Division, September 30, 2004, 17pp.
Crowl, T.A. and H.M. Thomas. 1997. June sucker studies 1995-1996: Provo River and Utah Lake fisheries management studies. Contract F-47-R; Segment 11. Utah Division of Wildlife Resources. Salt Lake City, Utah.
Crowl, T.A., H.M. Thomas, and D. Vinson. 1998. June sucker and Utah Lake fisheries management studies: 1995-1997. Final report submitted to Utah Division of Wildlife Resources, Salt Lake City, Utah and Central Utah Commission, Salt Lake City, Utah. 112 pp.
Crowl, T.A., H.M. Thomas, and G.P. Thiede. 1995. June sucker studies - 1995: Provo River and Utah Lake fisheries management studies. Annual report submitted to Utah Division of Wildlife Resources. Salt Lake City, Utah. 184 pp.
Frodge, J. D., Thomas, G.L., and Pauley, G. B. 1995. Chapter 6 - Water quality effects of stocking sterile triploid grass carp in Keevies Lake and Bull Lake. In: The Biology Management and Stocking Rates of Triploid Grass Carp Ctenophyaryngodon idella, and Their Effects on the Plant Community, Fish Assemblage, and Water Quality of Several Pacific Northwest Lakes. Final Report to the Washington Department of Ecology.

FINAL DRAFT
Utah Lake TMDL August 2007 Final Draft Lake Loading Pollutant Assessment & 83 of 88 Designated Beneficial Use Impairment Assessment
Great Salt Lake Basin Hydrologic Observatory (GSLB). 2004. Web site created by the Environmental Management Research Group, Utah State University in collaboration with the University of Utah. Accessible on the web at: http://greatsaltlake.utah.edu/description/utahlake/
Grobbelaar, J.U., and W.A. House, 1995. Phosphorus As A Limiting Resource In Inland Waters; Interactions With Nitrogen, Scientific Committee On Problems of the Environment (SCOPE) 54, Phosphorus in a Global Environment – Transfers, Cycles, and Management, Edited by H. Tiessen, Publication No. 16, 20 pp.
Heckmann, R.A., C.W. Thompson, and D.A. White. 1981. Fishes of Utah Lake. Great Basin Naturalist Memoirs, No.5: Utah Lake Monograph. Provo, Utah: Brigham Young University. 169 pp.
Hely, AG., Mower, R.W., and Harr, C.A. 1971. Water Resources of Salt Lake County, Utah: Department of Natural Resources Technical Publication No. 31.
Herbert, L.R., Cruff, R.W., and Waddell, K.M. 1985. Seepage Study of six canals in Salt Lake County, Utah 1982-83: Utah Department of Natural Resources Technical Publication No. 82.
Horns, D. 2005. The Utah Lake Comprehensive Management Plan. Daniel Horns, editor. Utah Valley State College, Department of Earth Science. Prepared for State of Utah, Division of Forestry, Fire, and State Lands. May, 2005.
Keleher, C.J. 1996. Utah Lake creel survey: Annual report based on 1995 season. Utah Division of Wildlife Resources, Springville, Utah.
Merritt, L.B. and A.W. Miller, Overview: LKSIM Model, Utah Lake Salinity Simulations, Nutrient Evaluations and Recommended Sampling for Utah Lake TMDL Study, Brigham Young University, Provo, Utah, July 2004.
Mitchell, CP., Fish, GR., Burnet, AMR. 1984 Limnological changes in a small lake stocked
with grass carp. New Zealand Journal of Marine and Freshwater Research abstracts. 1984.
Morton, F.I., Practical Estimates of Lake Evaporation, Journal of Climate and Applied
Meteorology, v25, p371-387, 1986. Oak Ridge National Laboratory Review, Oak Ridge National Laboratory, Vol. 26, No. 1,
January 1994, ORNL Review, Oak Ridge, TN 378312-6144. Pauley, G.B., Marino, D.A., Thiesfeld, S.L., Vecht, S.A., Thomas, G.L., Beauchamp, D.A.,
and Bonar, S.A. 1995. Chapter 9 - Impacts of triploid grass carp grazing on the game fish assemblages of Pacific Northwest Lakes. In: The Biology Management and Stocking Rates of Triploid Grass Carp Ctenophyaryngodon idella, and Their Effects on the Plant Community, Fish Assemblage, and Water Quality of Several Pacific Northwest Lakes. Final Report to the Washington Department of Ecology.

FINAL DRAFT
Utah Lake TMDL August 2007 Final Draft Lake Loading Pollutant Assessment & 84 of 88 Designated Beneficial Use Impairment Assessment
Radant, R.D. and D.K. Sakaguchi. 1981. Utah Lake fisheries inventory. U.S. Bureau of Reclamation Contract 8-07-40-50634. Utah Division of Wildlife Resources. Salt Lake City, Utah. 244 pp.
Sigler, W.F. and J.W. Sigler. 1996. Fishes of Utah. University of Utah Press, Salt Lake City.
Sondergaard, M., E. Jeppesen, and J. P. Jensen, 2003, Internal Phosphorus Loading and the resilience of Danish Lakes, Lakeline, Volume 23, No. 1, Spring 2003, North American Lake Management Society, Madison, WI., pg. 17-20.
SWCA Environmental Consultants, Inc. 2002. Nonnative Fish Control Feasibility Study to Benefit June Sucker in Utah Lake. June Sucker Recovery Implementation Program. Utah Department of Natural Resources, Salt Lake City, UT.
Utah Reclamation, Mitigation and Conservation Commission (URMCC). 2006. Utah Lake Wetland Preserve information as accessed from the URMCC website, July 2006, at http://www.mitigationcommission.gov/wetlands/wetlands_ulwp.html
US Bureau of Reclamation (USBR), Upper Colorado Region, Provo Area Office. 2006. Dams, Projects and Powerplants: Central Utah Project Overview website at http://www.usbr.gov/dataweb/html/cupoverview.html
Utah Department of Environmental Quality. UDEQ 2005. Utah's Watershed Management program. Jordan River Watershed. Subwatershed Activities. Utah Department of Environmental Quality, Division of Water Quality. Available online at: http://waterquality.utah.gov/watersheds/jordan/jordan.htm
Utah Department of Natural Resources. UDNR 2002a. Feasibility Analysis of Establishing an Additional Spawning Location to Benefit Endangered June Sucker. July 2002. Submitted to Reed Harris, June Sucker Recovery Implementation Program Director, Utah Department of Natural Resources, Salt Lake City, Utah. Submitted by M. Stamp, P. Abate, T. Welker, S. Hill, D. Olsen, BIO-WEST, Inc., Logan, Utah. 71 pages + appendices.
Utah Department of Natural Resources. UDNR 2002b. June Sucker Habitat Enhancement Alternatives in the Lower Provo River and Its Interface with Utah Lake. June 2002. Submitted to Reed Harris, June Sucker Recovery Implementation Program Director, Utah Department of Natural Resources, Salt Lake City, Utah. Submitted by D. Olsen, T. Welker, P. Abate, and M. Stamp, BIO-WEST, Inc., Logan, Utah. 78 pages + appendices.
Utah Department of Natural Resources. UDNR 2005. A Feasibility Study of Mechanical Control and Use of Common Carp (Cyprinus Carpio) on Utah Lake. March 2005. Prepared for Reed Harris, June Sucker Recovery Implementation Program Director, Utah Department of Natural Resources, Salt Lake City, Utah. Prepared by SWCA Environmental Consultants, Albuquerque, New Mexico. 118 pages.
FINAL DRAFT
Utah Lake TMDL August 2007 Final Draft Lake Loading Pollutant Assessment & 85 of 88 Designated Beneficial Use Impairment Assessment
Utah Division of Wildlife Resources. UDWR 1998. 1997 Utah Lake fish population monitoring report. Utah Division of Wildlife Resources. Springville, Utah.
Utah Division of Wildlife Resources . UDWR 1999. 1998 Utah Lake fish population monitoring report. Utah Division of Wildlife Resources. Springville, Utah.
Utah Division of Wildlife Resources . UDWR 2005. 2004 and 2005 Fish Stocking Information. Available online at: http://wildlife.utah.gov/fishing/ and at: http://www.outdoorsgonewild.com/dwr/stocking_report.php
Waiser, M.J., & R.D. Robarts. 1995. Microbial nutrient limitation in saline prairie lakes with high sulfate concentrations. Limnol. Oceanogr. 40:566-574
White, J., and B. Dabb. 1970. Fish population studies, Utah Lake. Division of Wildlife Resources. Springville, Utah. 45 pp.
Wilson, K.W., and C.W. Thompson. 2001. Evaluation of June sucker larvae movement (Chasmistes liorus) in the Provo River in 1998. Publication Number 01-18. Utah Division of Wildlife Resources, Salt Lake City, Utah.
Western Regional Climate Center (WRCC). 2006. Western U.S. Climate Historical Summaries for temperature, sunshine, sky cover, station pressure, humidity, precipitation and wind. Available for download at: http://www.wrcc.dri.edu/climsum.html

FINAL DRAFT
Appendix A – Utah Lake TMDL Hydrologic Map
FINAL DRAFT
Appendix B – LKSIM Model Report

FINAL DRAFT