final ebook after download
TRANSCRIPT

PLANNING FOR A
HOW TO ADDRESS SALES DATA CHALLENGES
+
STRONG 2015

Planning for a Strong 2015: How to Address Sales Data Challenges
InsightSquared and HourlyNerd have teamed up to produce an all-encompassing eBook intended to alleviate your sales data concerns. We’ve joined forces because we recognize how advancements in technology andnever-ending CRM updates have made staying abreast of sales data tedious and quite often baffling. Whether you have a PhD in data science or seldom deal with data, everyone has questions about data management, and concerns around how much time and effort is required to effectively manage varying data sources. This eBook was written to help you better leverage your data efficiently. The inner workings of this eBook will guide you through what sales data really is, and how to work with it. It will also demonstrate how one real world case study can change your entire approach to data. Every tip and insight in this eBook is backed by the trends, observations, and real life experiences InsightSquared and HourlyNerd encountered in 2014 after working with thousands of SMB clients. By no means will this eBook solve all your sales data issues. That is not the intention of this eBook. Just like how no two snowflakes are alike, every business’ sales data is only applicable to that specific business. Therefore this eBook will provide you with real world experiences, data, and observations that can help you understand what your own sales data is telling you. We hope these stories and past business examples will help move you toward data supremacy and a strong 2015.
INTRODUCTION
Advancements in technology and never-ending CRM updates have made staying abreast of sales data
tedious and quite often baffling.“
”Page 1
- HourlyNerd & InsightSquared
+

Introductionto
SalesData
1

?Before we dive deep into data, it’s important to know how imperative data is to the growth of your company. For obvious reasons, in this first section we briefly explain two key areas of data management that we consider important first steps toward achieving a strong 2015.
Why track sales data?
Timeliness of Sales Data
Why Track Sales Data?What does your pipeline look like right now? Is it strong? Deep? Weak? Of the leads you have in the hopper, what can be closed in the near future? What resources do you have at your fingertips that you can deploy to help you achieve your sales goal? Tracking sales data allows for you to easily gain insight into any question you can think of. You see, that’s the power of tracking data, it allows you to answer business related questions in a blink of an eye.
Timeliness of Sales DataEvery sales team member should be held accountable for diligently tracking their own data (perhaps aside from only the most senior leaders), and inputting it to the sales management tool. CRM’s will only allow for enhanced decision making if the detail is fresh.
Timeliness and urgency is crucial to effective data management. This is because data is most accurate when it’s input soon after the sales interaction is made, so make sure your team records sales interactions right away.
Here is a 2014 case study that demonstrates how tracking and interpreting sales data can power critical decision making.
INTRO TO SALES DATA
Planning for a Strong 2015: How to Address Sales Data Challenges
Made a Phone call
Connected with a Client
Sent an Email
Followed Up
Etc.
Page 2
+

Introductionto
SalesData
2014Case
Study2

?Using Data to Make Better Decisions
Nowadays, as the global economy becomes increasingly connected, sales teams face the ever-evolving challenge of understanding complex data. We’ve seen sales data improve teams, and we’ve seen twice as many get crippled from misunderstanding it. Ascertaining your data takes time, patience, and a little elbow grease. It requires the right minds, and the right tools. While this may seem daunting, there are plenty of ways to easily evaluate your current situation and change it fast. Here’s an example of how InsightSquared used its own product to make its sales prospecting team more efficient.
A few years ago, InsightSquared was convinced it had an exceptional prospector on its outbound sales prospecting team. By nearly all the metrics the company was measuring, this prospector (who we’ll call Marie Curie) was killing it. She was making the most dials every day and connecting with a ton of prospects. Clearly, the sales managers at InsightSquared thought to themselves, this is the prospector they should hold up as an example of how to generate leads and grow the company. They gave Curie a raise and proudly displayed her activity totals for the other reps to emulate.
Before long, most of the prospectors on the teamhad raised their activity totals to mirror Curie’s.
There was only one problem: The results weren’t there. Despite the team’s high activity numbers, the company’s pipeline wasn’t growing, its Sales Cycle was lengthening and its Win Rate was actually dropping.
Facing this dilemma, the manager of the prospecting team and the Sales VP decided to put their heads together and solve this thorny problem. Luckily, the company had a product that could help them get to the bottom of the issue. In fact, it was the very product the company makes: an elegant and flexible sales analytics solution to help companies just like them gain insight into their sales process and effectively coach their reps.
2014 CASE STUDY
Planning for a Strong 2015: How to Address Sales Data Challenges Page 3
+

What Was the Data Saying?For starters, the sales managers learned that simply measuring the number of dials and connects their prospectors were making was a red herring. They realized that Marie Curie, despite making the most dials, was actually performing very poorly in terms of downstream metrics like opportunity creation and deals sourced.
In fact, when they looked at the efficiency of their reps’ activities, they learned that Marie Curie was actually one of their worst-performing prospectors. Despite her thousands of dials, she had only sourced one deal and had booked a ton of “no show” meetings. They quickly realized that simply inflating sales prospecting activities like dials was not a reliable path to revenue.
This insight was supported by what the company’s own product was showing them. Over the last few months, the prospecting team’s “Meeting Scheduled: Opportunity” ratio was stalling and the team’s “Meeting Scheduled: No Show” ratio was rapidly rising.
It didn’t take the managers long to figure out what was going on. Their emphasis on baseline activity metrics (like dials) was actually hurting the sales team’s overall success. Displaying Marie Curie as the team’s model and encouraging the other prospectors to follow her example was resulting in poorly qualified opportunities and vacant meetings.
When the managers looked at the prospector’s individual activity ratios (“Call : Connect,” “Connect : Meeting Scheduled,” “Meeting Scheduled : Deal,” etc.)
Image 1: Prospecting Activities from Q4 2012
Image 2: No Show Meetings spike in Q4 2012
Planning for a Strong 2015: How to Address Sales Data Challenges Page 4
2014 CASE STUDY+
Marie Curie
Max Planck
Louis Pasteur
Neils Bohr
Total
SDRs Dials Connects Opps Deals Dial : Connect Dial : opp Opp : Deal Dial : Deal
3,844 333 11 1 12:1 349:1 11:1 3,844:1
4,285 339 15 2 13:1 286 :1 8:1 2,143:1
2,911 251 27 4 12:1 108 :1 7:1 238:1
3,973 342 20 6 12:1 199:1 3:1 622:1
15,017 1,265 73 18 12:1 206:1 6:1 1155:1
Jun 2012 July 2012 Aug 2012 Sept 2012 Oct 2012 Nov 2012
Activity Date
20
15
10
5
Meeting Schd.: No Show
Meeting Schd.: Opp Sourced
Connect: Meeting Schd.Call: Connected
What is the efficiency of our recentactivity?Activity ratios using activity date

they saw the same story. It wasn’t necessarily the reps who were “working the hardest” (i.e. making the most dials) that were helping the company the most, it was the reps who were “working the smartest.”
When they talked to the reps with high downstream ratios, they started to see the whole picture. These reps weren’t just blindly dialing to boost their activity totals, they were doing call research, accurately and compellingly describing their product’s value props, and booking high-quality meetings. Seems simple, but when management incentivizes call volume, things like this happen.
When the managers set out to coach their reps and improve the effectiveness (and efficiency!) of their prospecting team, they had hard data to support their theories.
As soon as the managers began preaching efficiency instead of just more dials, the sales prospecting team immediately became more productive. The meetings they booked were more reliable and the opportunities they sourced had a higher Win Rate. After stagnating for months, the company’s pipeline was suddenly full of high-quality opportunities with shorter Sales Cycles and higher Win Rates.
In the image above, you can see how different sales reps compare in terms of how effectively their activities are leading to downstream results. Image 3: Activity Efficiency Ratios by Employee
Planning for a Strong 2015: How to Address Sales Data Challenges Page 5
2014 CASE STUDY+

+
Planning for a Strong 2015: How to Address Sales Data Challenges
While this case study is tremendously valuable, one question still remains, how does this relate to you, your sales data, and your CRM?
If you don’t have a Marie Curie on your team, it’s hard to relate to this example. So, in this next section, we dive one level deeper and explain how you can harness data for yourself.
Page 6
2014 CASE STUDY

CRM,Data,
Sales,andYou
3

Don’t Focus Solely on RevenueJust like how Marie Curie was praised for focusing solely on call volume, focusing entirely on the almighty dollar, and following the “always be closing” mentality, does not consistently drive results. A good way to manage your sales activities is to focus on these three aspects: Business results are organizational outcomes that cannot be managed whatsoever (e.g. revenue, market share). They can be influenced, but not controlled.
Sales objectives are objectives that require ‘consent’ but can be influenced (e.g. territory coverage, customer retention).
Sales activities and manager activities can be proactively managed (e.g. call volume, call type)
+
Planning for a Strong 2015: How to Address Sales Data Challenges
Understanding CRMsLet’s face it, CRMs are valuable, but without fully understanding how to read and use the data, they’re useless. Don’t worry, we won’t let this happen to you, that’s why we cover two key ideas of data understanding that will help you gain the most out of your CRM data. After that we’ll discuss how to effectively present your sales data.
CRM = Decision ToolTake a look at your CRM, it really isn’t an analytics tool or a database, it’s simply a decision-making tool. The information provided by your CRM should be the framework for all decisions.
In fact, the best part of your CRM data is that it doesn’t need to guide broad sweeping generalizations about your sales team, but rather you can use the data to be creative. Use it to manage their activities, provide insight into how they can better perform their job, or even set up games that you know are achievable that will boost morale and overall satisfaction of your sales team. Use your data to relieve the monotony of cold calling.
Page 7
CRM, DATA, SALES, AND YOU
Plan A
Plan B

+
Planning for a Strong 2015: How to Address Sales Data Challenges
Effectively Presenting DataWhat’s the point of knowing your sales data if you can’t explain it to anyone else? Being able to relay your data to colleagues for better decision-making is where the value truly lies. In this section, we’ll cover how to properly and effectively relay sales information.
DownloadOne Pager
Page 8
CRM, DATA, SALES, AND YOU
The Power of 3
The rule of three has been around since Aristotle’s “pathos, logos, and ethos,” and continues to be the silver bullet for why some sales presentations are strong, and why others simply aren’t.
Humans tend to remember in clusters of three thus we advocate breaking sales data into three sections.
Start with your overall purpose for presenting the material. Keep the introduction short and brief. Then jump into your three main points describing what your data is indicating. No need to fluff it up, tell your audience what they need with one graph that depicts your data and move one. Repeat for data points 2 and 3. Seem simple? That’s because it is. We’ve provided you with one sample sheet tomodel your data off of.

Planning for a Strong 2015: How to Address Sales Data Challenges
At every stage of growth, there are various data metrics businesses miss. This occurs not because they’re being careless, but rather because there is such a diverse set of metrics to focus on. How do you keep track of them all?
We compiled 3 metrics many businesses fail to build into their data analysis.
Qualitative Insights
Sales teams rarely try to understand their qualitative data for the reason that it’s often perplexing to decipher. Qualitative data is just as important as quantitative data because it’s more rich and nuanced. However, even though qualitative data is rich, it’s not as accurate due to its subjectivity. Here’s a quick remedy for solving this issue and making your qualitative data both valid and accurate.
Have a sales member distribute their qualitative data to 3 or 5 other team members (make sure the number is odd for if there is ever a vote, you’llalways be able to get an answer with the majority). Then have each sales member score, on a scale of 1-10, 1 being will never close and 10 being will close today. Take the mean of all the scores and compile it. And there you have it; you just turned your qualitative data into a measurement that’s honest, accurate, and reliable.
Sales Cycle
Ask any young company their sales cycle and you will get answers filled with, “ums” and “ahs.” Sales cycles are often not measured for the reason that they’re simply hard to understand, and young companies don’t have the time or the resources to do so accurately. However, understanding this cycle will prove valuable in not only your sales outreach, but also your marketing strategy.
Page 9
+
3 Key Data Metrics Most Businesses Ignored in 2014
CRM, DATA, SALES, AND YOU

Planning for a Strong 2015: How to Address Sales Data Challenges
We suggest breaking up your sales cycle into three sections:
At the top of the funnel your only concern should be awareness. The middle of your funnel is where understanding occurs. The more people understand the faster they’ll move down the funnel. Finally, at the bottom of the funnel, your hard work and effort is converted into closes and revenue
If you’re still having difficulty defining your sales funnel, we suggest two things:
If you don’t have time, hire HourlyNerd for on-demand project based work. If
you do have the time, download InsightSquared’s free app that will help you
better define and understand your funnel.
Lifetime Value
LTV helps you answer three primary questions:
Are you spending appropriately to acquire customers?
Are your customers as valuable as you think?
Are you spending enough to keep these customers interested?
Evaluate your LTV (by customer segment) with this equation:
Page 10
+ CRM, DATA, SALES, AND YOU
Discovery
Qualification
Evaluation
Number of repeat transactions
based on historicals per month or year
Average retention time in months or years
for a typical customer
Average margin per
sale XX = LTV
People who are interacting with you for the first time
People who have had a handful of positive interactions with you
People who are ready to buy your product/service

4Leveraging
theRightData

21
Planning for a Strong 2015: How to Address Sales Data Challenges
One invaluable aspect of sales data is that it enables you to learn the ins and outs of your customers. We’ve compiled a few metrics to help you better understand them.
Metric #1: Referral-Sourced pipeline
What is it? Value of open opportunities sourced from customer referrals.
What it Tells You How much your sales rep has in the pipeline via customer referrals and how these referrals have changed over time, as well as what stage each lead is in.
Why use it? Customers trust what other product users say. If you can gauge how your customer base is talking about your brand, then you’ll be 3 steps ahead your competition.
Metric #2: Time elapsed between first touch and purchase
What is it? The time it takes from your first contact with a prospect, either through marketing or sales outreach, to the time they purchase your product.
What it Tells You How long you reasonably expect it will take a customer to convert. Why use it? This will enable you to plan and project results more effectively while also allowing you to test the effect of different conversion tactics.
Page 11
+ LEVERAGING THE RIGHT DATA
Metrics for Understanding Your Customer

3
21
Planning for a Strong 2015: How to Address Sales Data Challenges
Metric #3: Number of people involved in the customer purchase decision
What is it? The number of people at the client organization that were consulted during the buying process.
What it Tells You What titles from specific industries have buying power and how many people need to be involved.
Why use it? You’ll be better suited to allocate your sales team’s time to leads that have more buying power.
Page 12
+ LEVERAGING THE RIGHT DATA
2Time elapsed between first touch
and purchase1Referral-Sourced pipeline 3# of people
involved in the customer purchase
decision
Customer Insights

3
Planning for a Strong 2015: How to Address Sales Data Challenges
Now that you have these metrics in your reports, what exactly should you do with them? If you would like to internally distribute the data (which we suggest) we’ve provided advice for how to do so effectively.
Distributing data within your company informs, guides and helps various departments make effective changes to their work that in the long run, will benefit your customer.
In the final section of this eBook. HourlyNerd and InsightSquared combine their 2014 knowledge to provide tips for how to make your business flourish in 2015.
Consider your sales team as your boots on the ground, they’re frequently interacting with the people who keep the lights on in your office. By sharing both the quantitative and qualitative data, you’re providing valuable insight for how everyone can adapt and improve their work to then satisfy your customer. If you don’t believe that everyone in your company has a part in how your clients feel about you, you’re wrong. Everyone, and we mean everyone, affects how customers react to your product or service.
Sharing sales data helps build a sense of shared purpose amongst the team in ways that many other data points can’t. However, be very cautious when doing this, as not everyone is motivated by money. In a new study released by Forbes, money only motivated 7% of respondents. Peer motivation (20%) and intrinsic desire (17%) were the top two factors in employee motivation.
Finally, sharing sales data can help create urgency when appropriate. When but time is short, you have your sales goal within reach, disseminating sales data to relevant team members may be a powerful motivational tool to get your team over the edge. If you haven’t shared data for this purpose yet, give it a try. It just may get you to where you want to be.
Page 13
+ LEVERAGING THE RIGHT DATA
Distributing Your Data

5How to
Excel in 2015

Planning for a Strong 2015: How to Address Sales Data Challenges
5 Ways Sales Data Will Boost ConversionsLet’s face it, the reason tracking and understanding sales data is important is because of revenue. When you brush away the fluff, data boils down to conversions. Therefore, effectively tracking it will affect your conversions in 5 unique ways.
HOW TO EXCEL IN 2015
Page 14
Tactics
This will allow your sales team to understand what tactics have been successful in both generating leads and closing them, which is critical to scaling.
Urgency
Urgency spurs action amongst the sales force. It’s hard to argue with numbers when they're put in front of you. And when CRM data can be used in such a way, it’s motivational.
Trend Analysis
This allows managers to understand new improvements which enables them to then effectively provide feedback to their sales team.
Structure
Helps provide structure around follow-ups so you can close clients quickly and easily.
Segmentation
Allows managers to hone in and penetrate core customer segments rather than blindly casting a wide net.
+
Planning for a Strong 2015: How to Address Sales Data Challenges
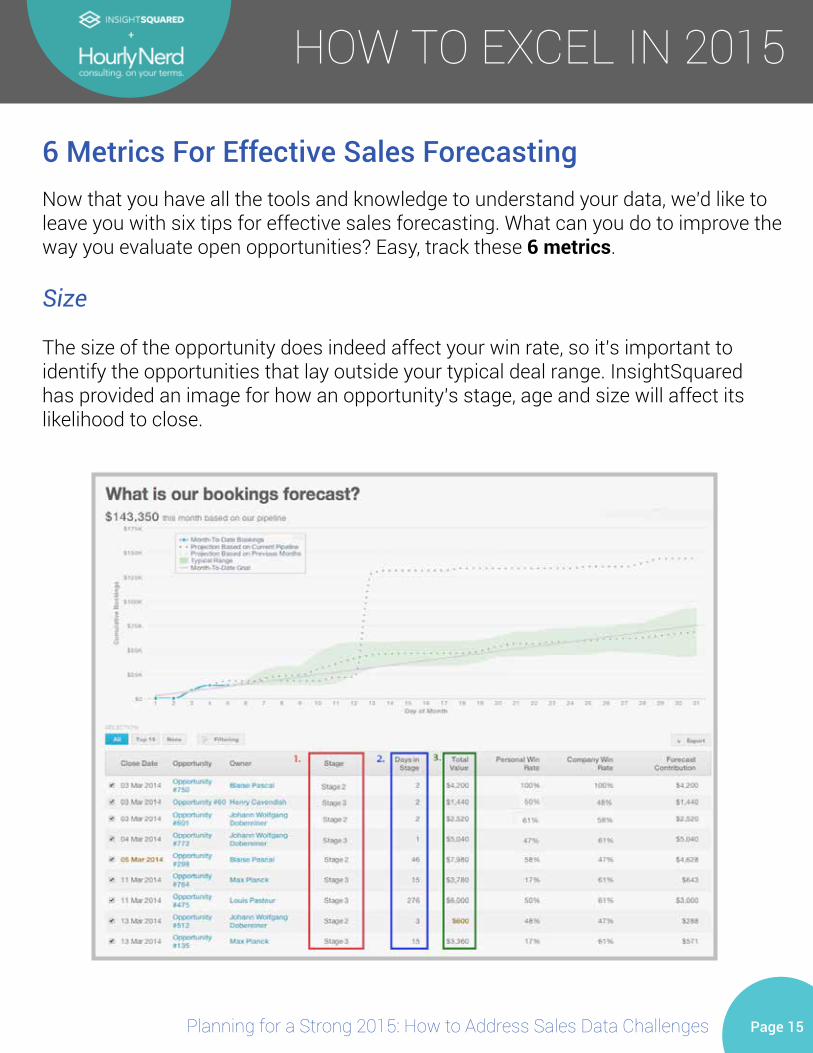
Now that you have all the tools and knowledge to understand your data, we’d like to leave you with six tips for effective sales forecasting. What can you do to improve the way you evaluate open opportunities? Easy, track these 6 metrics.
Size
The size of the opportunity does indeed affect your win rate, so it’s important to identify the opportunities that lay outside your typical deal range. InsightSquared has provided an image for how an opportunity’s stage, age and size will affect its likelihood to close.
Page 15
+ HOW TO EXCEL IN 2015
6 Metrics For Effective Sales Forecasting

Planning for a Strong 2015: How to Address Sales Data Challenges Page 16
+
Stage
Every client you have is in a specific stage of your sales funnel, and every sales rep you have has different win rates. Matching both the the client and sales rep up based on stage and win rate will boost your overall conversion rate. Use your CRM and analytics software to determine this.
Engagement
Sales is all about relationships – the expression “out of sight out of mind” is just as relatable to sales as it is to human interaction, and every rep should always be monitoring their engagement rates.
HOW TO EXCEL IN 2015

Planning for a Strong 2015: How to Address Sales Data Challenges
Slippage
Leads can change very quickly – especially when close date is pushed back or sales price drops. Both these factors affect the closing rate of a lead. Flag these changes and review them with the sales rep for if they should be included in the forecast.
+
Page 17
HOW TO EXCEL IN 2015

Planning for a Strong 2015: How to Address Sales Data Challenges
Effort
Research shows that the effort a rep puts into closing a sale, does indeed affect the likelihood that the client will buy. However, it is worth mentioning that many sales experts have argued against this, saying that typically reps put more effort into leads that they feel slipping away. Thus, flagging when large quantities of effort are put into a sale can be a valuable measurement for sales managers. Also, it’s important to note that effort is highly circumstantial and changes from industry to industry and rep to rep.
Age
Typically, the longer leads sit in your funnel the less likely they’ll close. Evaluate where your leads are in the process and prioritize the opportunities you have. No need to waste time on leads that have a smaller chance of closing.
Congratulations! You now have the knowledge and skills to take your sales data to new heights. We hope this eBook has provided you with helpful ideas, examples and
metrics for making your sales data work for you. Use this knowledge to your advantage and have a successful and healthy 2015.
Page 18
+
CONCLUSION
HOW TO EXCEL IN 2015

At InsightSquared, our mission is to help small and mid-market companies run their business by the numbers. Our turn-key business analytics unlock million dollar insights for teams without million dollar budgets. Based in Cambridge, MA, InsightSquared is the world's most popular app for business leaders who need to understand the numbers that drive team performance.
ABOUT THE AUTHORS
HourlyNerd offers a flexible consulting platform bringing experienced professionals directly to your business. With over 10,000 premier consultants and alumni from the top 40 global MBA programs, our on-demand offering accommodates any and all project needs from SMBs to Fortune 50 enterprises. Simply post your project, select the most qualified candidates and manage your deliverable with the help of our intuitive software or client services team. Founded in 2013 in Harvard Business School, HourlyNerd is based in Boston and backed by Mark Cuban, Greylock Partners, Highland Capital Partners, GE Ventures, Intuit founder ScottCook, the Kraft Group, angel investor Semil Shaw, former Etsy CEO Maria Thomas, Rent the Runway Founder/CEO Jennifer Hyman and Boston VC Suffolk Equity Partners.
Planning for a Strong 2015: How to Address Sales Data Challenges Page 19