final evidence report...cardiac stents – re-review final evidence report december 11, 2015 20,...
TRANSCRIPT

Cardiac Stents – Re-Review
Final Evidence Report
December 11, 2015
20, 2012
Health Technology Assessment Program (HTA)
Washington State Health Care Authority
PO Box 42712
Olympia, WA 98504-2712
(360) 725-5126
hca.wa.gov/hta
Health Technology Assessment

Cardiac Stents (Re-Review)
Provided by:
Spectrum Research, Inc.
Prepared by:
Andrea C. Skelly, PhD, MPH
Robin E. Hashimoto, PhD Erika D. Brodt, BS
December 11, 2015
With assistance from: Krystle Pagarigan, BS
Eric Schnell, BS Mark Junge, BS
Erin Anthony-Fick Elena Dodge

Cardiac Stents – Re-Review: Final Evidence Report i
This technology assessment report is based on research conducted by a contracted technology
assessment center, with updates as contracted by the Washington State Health Care Authority. This
report is an independent assessment of the technology question(s) described based on accepted
methodological principles. The findings and conclusions contained herein are those of the
investigators and authors who are responsible for the content. These findings and conclusions may
not necessarily represent the views of the HCA/Agency and thus, no statement in this report shall be
construed as an official position or policy of the HCA/Agency.
The information in this assessment is intended to assist health care decision makers, clinicians,
patients and policy makers in making sound evidence-based decisions that may improve the quality
and cost-effectiveness of health care services. Information in this report is not a substitute for sound
clinical judgment. Those making decisions regarding the provision of health care services should
consider this report in a manner similar to any other medical reference, integrating the information
with all other pertinent information to make decisions within the context of individual patient
circumstances and resource availability.

WA - Health Technology Assessment December 11, 2015
Cardiac Stents – Re-Review: Final Evidence Report ii
Table of Contents
EXECUTIVE SUMMARY .......................................................................................................................1
1. APPRAISAL ................................................................................................................................... 39
1.1. RATIONALE ........................................................................................................................................ 39 1.2. KEY QUESTIONS ................................................................................................................................. 39 1.3. OUTCOMES ASSESSED ......................................................................................................................... 41 1.4. KEY CONSIDERATIONS HIGHLIGHTED BY EXPERTS ..................................................................................... 43
1.4.1. Interventions ................................................................................................................................... 43 1.4.2. Costs ................................................................................................................................................ 45 1.4.3. Patient considerations..................................................................................................................... 45 1.4.4. Professional and ethical considerations .......................................................................................... 46
1.5. WASHINGTON STATE UTILIZATION AND COST DATA ................................................................................. 47
2. BACKGROUND ............................................................................................................................. 51
2.1. EPIDEMIOLOGY AND BURDEN OF DISEASE ............................................................................................... 51 2.2. PATIENT PRESENTATION AND PATHOPHYSIOLOGY .................................................................................... 51 2.3. OVERVIEW OF DIAGNOSIS AND TREATMENT OPTIONS .............................................................................. 52 2.4 PERCUTANEOUS CORONARY INTERVENTION (PCI) WITH STENTING ............................................................. 52
2.4.1. Bare metal stents (BMS) ................................................................................................................. 53 2.4.2. Drug-eluting stents (DES) ................................................................................................................ 53 2.4.3. Indications and contraindications ................................................................................................... 54 2.4.4. Proposed benefits of stenting ......................................................................................................... 56 2.4.5. Potential complications and harms ................................................................................................. 57 2.4.6. Trials in progress ............................................................................................................................. 57
2.5. GUIDELINE-DIRECTED MEDICAL THERAPY ............................................................................................... 58 2.5.1. Components .................................................................................................................................... 58 2.5.2. Proposed benefits ............................................................................................................................ 58 2.5.3. Indications and contraindications ................................................................................................... 58
2.6. CLINICAL GUIDELINES .......................................................................................................................... 58 2.7. PREVIOUS SYSTEMATIC REVIEWS/TECHNOLOGY ASSESSMENTS .................................................................. 69 2.8. MEDICARE AND REPRESENTATIVE PRIVATE INSURER COVERAGE POLICIES .................................................... 73
2.9 SELECT INTERNATIONAL COVERAGE RECOMMENDATIONS ....................................................................... 78
3. THE EVIDENCE.............................................................................................................................. 79
3.1. METHODS OF THE SYSTEMATIC LITERATURE REVIEW ................................................................................ 79 3.1.1. Objectives and key questions .......................................................................................................... 79 3.1.2. Inclusion and exclusion criteria ....................................................................................................... 79 3.1.3. Critical and primary outcomes ........................................................................................................ 84 3.1.4. Data sources and search strategy ................................................................................................... 84 3.1.5. Data extraction ............................................................................................................................... 85 3.1.6. Quality assessment: study risk of bias, overall strength of evidence and QHES evaluation ........... 86 3.1.7. Analysis ........................................................................................................................................... 87
4. RESULTS ...................................................................................................................................... 88
4.1. KEY QUESTION 1: PCI WITH STENTING AND MEDICAL THERAPY VERSUS MEDICAL THERAPY ALONE IN
PATIENTS WITH STABLE CAD ................................................................................................................ 88 4.1.1. Study characteristics ....................................................................................................................... 88 4.1.2. Efficacy and Effectiveness ............................................................................................................... 93

WA - Health Technology Assessment December 11, 2015
Cardiac Stents – Re-Review: Final Evidence Report iii
4.1.3. Safety ............................................................................................................................................ 107 4.1.4. Differential efficacy or safety ........................................................................................................ 110 4.1.5. Cost Effectiveness .......................................................................................................................... 116
4.2. KEY QUESTION 2: PCI WITH DES VERSUS BMS IN PATIENTS WITH STABLE OR UNSTABLE CAD ..................... 127 4.2.1. Study characteristics ..................................................................................................................... 127 4.2.2. Efficacy and Effectiveness ............................................................................................................. 136 4.2.3. Safety ............................................................................................................................................ 150 4.2.4. Differential efficacy or safety ........................................................................................................ 163 4.2.5. Cost Effectiveness .......................................................................................................................... 164
5. SUMMARY BY KEY QUESTION .................................................................................................... 169
5.1. KEY QUESTION 1B: SAFETY OUTCOMES FOR PCI WITH STENTING AND MEDICAL THERAPY COMPARED WITH
MEDICAL THERAPY ALONE FOR STABLE CAD......................................................................................... 180 5.2. KEY QUESTION 1C: DIFFERENTIAL EFFICACY AND SAFETY FOR PCI WITH STENTING AND MEDICAL THERAPY
COMPARED WITH MEDICAL THERAPY ALONE FOR STABLE CAD ................................................................ 183 5.3. KEY QUESTION 1D: ECONOMIC OUTCOMES FOR PCI WITH STENTING AND MEDICAL THERAPY COMPARED
WITH MEDICAL THERAPY ALONE FOR STABLE CAD ................................................................................ 185 5.4. KEY QUESTION 2A: PRIMARY EFFICACY OUTCOMES FOR NEWER GENERATION DES COMPARED WITH BMS
FOR STABLE OR UNSTABLE CAD .......................................................................................................... 187 5.5. KEY QUESTION 2B: SAFETY OUTCOMES FOR NEWER GENERATION DES COMPARED WITH BMS FOR STABLE
OR UNSTABLE CAD ........................................................................................................................... 194 5.6. KEY QUESTION 2C: DIFFERENTIAL EFFICACY AND SAFETY FOR NEWER GENERATION DES COMPARED WITH
BMS FOR STABLE OR UNSTABLE CAD .................................................................................................. 201 5.7. KEY QUESTION 2D: COST-EFFECTIVENESS OUTCOMS FOR NEWER GENERATION DES COMPARED WITH BMS
FOR STABLE OR UNSTABLE CAD .......................................................................................................... 201
REFERENCES .................................................................................................................................. 202
Tables
Table 1. Outcome measures used in included studies ................................................................................ 41
Table 2. Indications and contraindications for DES ..................................................................................... 55
Table 3. Indications and contraindications for BMS .................................................................................... 56
Table 4. ACC/AHA Guidelines ...................................................................................................................... 59
Table 5. Guideline-Directed Medical Therapy Guidelines ........................................................................... 60
Table 6. CAD Revascularization Guidelines ................................................................................................. 62
Table 7. Chronic Stable Angina Guidelines .................................................................................................. 64
ACC/AHA* 42 ................................................................................................................................................. 64
Table 8. Routine Medical Therapy Guidelines in STEMI .............................................................................. 65
Table 9. Percutaneous Coronary Intervention Guidelines in STEMI ........................................................... 66
Table 10. Unstable angina/NSTEMI-ACS Guidelines .................................................................................... 67
Table 11. Additional PCI Guidelines for Specific Cardiac Conditions ........................................................... 68
Table 12. Appropriate Use Criteria for PCI .................................................................................................. 69

WA - Health Technology Assessment December 11, 2015
Cardiac Stents – Re-Review: Final Evidence Report iv
Table 13. Overview of previous meta-analyses of comparing PCI and stenting with medical therapy versus
medical therapy alone ................................................................................................................. 70
Table 14. Overview of previous meta-analyses comparing newer generation DES with BMS .................... 72
Table 15. Overview of payer technology assessments and policies for percutaneous coronary
intervention.................................................................................................................................. 74
Table 16. Summary of inclusion and exclusion criteria ............................................................................... 81
Table 17. PCI versus medical therapy: Patient demographics and study characteristics ............................ 91
Table 18. PCI versus medical therapy: All-cause mortality .......................................................................... 94
Table 19. PCI versus medical therapy: Cardiac mortality ............................................................................. 95
Table 20. PCI versus medical therapy: Myocardial infarction ...................................................................... 97
Table 21. PCI versus medical therapy: Freedom from angina .................................................................... 101
Table 22. PCI versus medical therapy: Clinically significant improvement* in SAQ ................................... 102
Table 23. PCI versus medical therapy: Clinically significant improvement* in RAND-36 ........................... 103
Table 24. PCI versus medical therapy: Revascularization (PCI or CABG) .................................................... 106
Table 25. PCI versus medical therapy: Adverse events .............................................................................. 108
Table 26. PCI versus medical therapy: Subgroups that modified treatment effect ................................... 115
Table 27. COURAGE trial cost effectiveness: Cost of improvement stratified by baseline SAQ domain
scores ......................................................................................................................................... 118
Table 28. PCI versus Medical therapy: Summary of results and limitations of included economic studies
.................................................................................................................................................... 124
Table 29. DES versus BMS: Patient demographics for randomized controlled trials ................................. 129
Table 29 Continued. DES versus BMS: Patient demographics and study characteristics ......................... 131
Table 30. DES versus BMS: Patient demographics for nonrandomized comparative studies ................... 134
Table 31. Summary of results for comparison of DES with BMS: All-cause and cardiac mortality data not
included in the meta-analysis .................................................................................................... 141
Table 32. Summary of results for comparison of DES with BMS: Myocardial infarction data not included in
the meta-analysis ....................................................................................................................... 144
Table 33. Cumulative incidence of the composite outcome of death or MI from randomized controlled
trials............................................................................................................................................ 146
Table 34. Comparison of newer generation DES with BMS from nonrandomized comparative studies:
Definite stent thrombosis .......................................................................................................... 154
Table 35. Comparison of newer generation DES with BMS from nonrandomized comparative studies: All-
cause and cardiac mortality (≤30 days) ..................................................................................... 157
Table 36. Comparison of newer generation DES with BMS from RCTs: Stroke/cerebrovascular accident 159
Table 37. Comparison of newer generation DES with BMS from RCTs: Target lesion and target vessel
revascularization (≤ 30 days) ...................................................................................................... 161
Table 38. Adverse events related to mechanical factors from included case-series ................................. 162
Table 39. Summary of results and limitations of included economic studies ........................................... 167

WA - Health Technology Assessment December 11, 2015
Cardiac Stents – Re-Review: Final Evidence Report v
Figures
Figure 1. Analytic framework ...................................................................................................................... 40
Figure 2. Flow chart of literature search results for KQ 1 (PCI with stenting versus medical therapy alone)
and KQ 2 (newer generation DES vs. BMS) ............................................................................... 85
Figure 3. Comparison of newer-generation DES with BMS for all-cause mortality at 12 months* ......... 137
Figure 4. Comparison of newer-generation DES with BMS for cumulative all-cause mortality in studies
with follow-up >12 months to 48 months* ............................................................................ 138
Figure 5. Comparison of newer-generation DES with BMS for cardiac death at 12 months* ................. 140
Figure 6. Comparison of newer-generation DES with BMS for cardiac death at 24 months* ................. 140
Figure 7. Comparison of newer-generation DES with BMS for any myocardial infarction, cumulative to 12
months* .................................................................................................................................. 144
Figure 8. Comparison of newer-generation DES with BMS for target lesion revascularization cumulative
to 12 months* ......................................................................................................................... 149
Figure 9. Comparison of newer-generation DES with BMS for target lesion revascularization cumulative
to 24 months* ......................................................................................................................... 149
Figure 10. Comparison of newer-generation DES with BMS for target vessel revascularization cumulative
to 12 months ........................................................................................................................... 150
Figure 11. Comparison of newer-generation DES with BMS for target vessel revascularization cumulative
to 24 months ........................................................................................................................... 150
Figure 12. Comparison of newer-generation DES with BMS for definite stent thrombosis from RCTs: ≤ 30
days and from 1-12 months* .................................................................................................. 152
Figure 13. Comparison of newer-generation DES with BMS for definite stent thrombosis from RCTs:
Cumulative to 12 months and to 24 months* ........................................................................ 153
Figure 14. Comparison of newer-generation DES with BMS from RCTs: All-cause mortality (≤30 days)*
................................................................................................................................................ 155
Figure 15. Comparison of newer-generation DES with BMS from RCTs: Cardiac mortality (≤30 days)* . 156
Figure 16. Comparison of newer-generation DES with BMS from RCTs: Myocardial infarction (≤30 days)*
................................................................................................................................................ 157
Figure 17. Comparison of newer-generation DES with BMS from RCTs: Major bleeding (any time)* ..... 160

WA - Health Technology Assessment December 11, 2015
Cardiac Stents – Re-Review: Final Evidence Report vi
Abbreviations
ACE: Angiotensin converting enzyme
ACS: Acute coronary syndrome
ARB: Angiotensin receptor blocker
BARI 2D: Bypass Angioplasty Revascularization Investigation in Type 2 Diabetes
BASKET-PROVE: Basel Stent Kosten Effektivitats Trial—Prospective Validation Examination
BMI: body mass index
BMS: bare metal stent
BP: Blood pressure
CABG: coronary artery bypass grafting
CAD: coronary artery disease
CHF: congestive heart failure
CoE: Class of Evidence
COURAGE: Clinical Outcomes Utilization Revascularization and Aggressive Drug Evaluation
CVA: cerebrovascular accident
DAPT: dual antiplatelet therapy
DASI: Duke Activity Status Index
DES: drug eluting stent
ECG: electrocardiography
EES: everolimus eluting stent
EF: Ejection fraction
ENDEAVOR II: The Medtronic Endeavor Drug Eluting Coronary Stent System in Coronary Artery Lesions
EXAMINATION: Clinical Evaluation of Everolimus Eluting Coronary Stents in the Treatment of Patients
with ST-Segment Elevation Myocardial Infarction
f/u: follow-up
FDA: United States Food and Drug Administration
GDMT: Guideline directed medical therapy
HF: Heart failure
HR: hazard ratio
HTA: health technology assessment
IQR: interquartile range
IVUS: intravascular ultrasound
KAMIR: Korea Acute Myocardial Infarction Registry
KQ: key question
LAD: left anterior descending artery
LMWH: low molecular weight heparin
LVEF: Left ventricular ejection fraction
MACE: major adverse cardiovascular events
MASS II: Medicine, Angioplasty, or Surgery Study
MCID: minimal clinically important difference

WA - Health Technology Assessment December 11, 2015
Cardiac Stents – Re-Review: Final Evidence Report vii
MI: myocardial infarction
MT: medical therapy
NC: non calculable
NR: not reported
NSTEMI: non ST-segment elevation MI
OMT: optimal medical therapy
OR: Odds ratio
PCI: percutaneous coronary intervention
PCI: Percutaneous coronary intervention
PRODIGY: Prolonging Dual Antiplatelet Treatment After Grading stent-induced Intimal hyperplasia study
PTCA: percutaneous transluminal coronary angioplasty
QHES: Quality of Health Economic Studies
RCA: right circumflex artery
RCT: randomized controlled trial
RD: risk difference
RR: relative risk/risk ratio
SAQ: Seattle Angina Questionnaire
SCAAR: Swedish Coronary Angiography and Angioplasty Registry
SD: standard deviation
SF-36: Medical Outcomes Study 36-Item Short-Form Health Survey
SIHD: Stable ischemic heart disease
SOE: Strength of Evidence
SR: Systematic review
STEMI: ST-segment elevation MI
TLR: target lesion revascularization
TVR: target vessel revascularization
UA: Unstable angina
XIMA: Xience or Vision Stents for the Management of Angina in the Elderly
X-MAN: Xience vs. Multi-Link Stent in Acute Myocardial Infarction Trial
ZES: zotarolimus eluting stent
ZEUS: Zotarolimus-eluting Endeavor Spring Stent in Uncertain DES Candidates Study

WA - Health Technology Assessment December 11, 2015
Cardiac Stents – Re-Review: Final Evidence Report Page 1
Executive Summary
Introduction Coronary artery disease (CAD), also referred to as coronary heart disease (CHD) or ischemic heart
disease (IHD), is the single leading cause of death for both men and women in the U.S. and is the most
common form of cardiovascular disease; thus the economic and public health burden of CAD is
considerable. In 2014, heart diseases were found to be the second leading cause of death in
Washington state residents, following cancer.8 Atherosclerosis is the most common underlying cause of
CAD. It is a disease process in which plaque (comprised of lipids, inflammatory cells, smooth muscle
cells, and connective tissue) builds up on artery walls. Partial or complete blockage of coronary arteries
can occur with plaque formation and may prevent the portions of the heart muscle from receiving
blood, oxygen, and vital nutrients. Atherosclerosis can cause blockage by two mechanisms: 1)
progressive narrowing of the artery due to the plaque narrowing the vessel lumen, and 2) thrombotic
occlusion of the artery, which occurs when the hard surface of a plaque tears or breaks off, exposing the
inner fatty pro-thrombotic, platelet-attracting components to the site, resulting in enlargement of the
blockage. Coronary atherosclerotic plaque disruption and associated intraluminal platelet-fibrin
thrombus formation are responsible for the acute coronary syndromes of acute MI, unstable angina
(UA), and probably for sudden death.
Chest pain is the most common symptom of obstructive CAD which may be the first presenting
symptom in at least 50% of patients with CAD.32 Because of the poor correlation between symptoms
and CAD, clinicians must rely on a careful history and other modalities to detect and confirm a suspicion
of CAD. Classic cardiac chest pain (angina) is characterized by retrosternal chest discomfort, often
described as a crushing pressure. The discomfort may radiate to the jaw, neck, back, shoulder or arm. It
can be accompanied with dyspnea, diaphoresis, nausea and syncope. If the discomfort presents (1) in a
predictable pattern, (2) is brought on by physical or mental stress, and (3) subsides with rest or angina
medication such as nitroglycerin, it is called stable angina, which is consistent with stable CAD. One can
have stable CAD but not have angina with optimal medical therapy. Angina that occurs with decreasing
levels of exertion, increases in frequency or intensity, or takes longer than 20 minutes to subside may be
an ominous warning of critical ischemia and has been termed unstable angina. Unstable angina is
classified as part of acute coronary syndrome (ACS). In general, persons with angina already have CAD
lesions with at least 75% obstruction and are at increased risk of MI, heart failure and sudden death due
to plaque destabilization and thrombosis. Evidence-based recommendations for medical management
are now advised for all persons with CAD. Optimal medical therapy, or the newer term, guideline
directed medical therapy, includes lifestyle modifications (physical activity, smoking cessations, weight
management and dietary changes) as well as treatment of secondary conditions within current
guidelines (diabetes and hypertension), risk modification with antiplatelet drugs and management of
lipid levels and treatment of angina symptoms if present. For patients with stable CAD with low risk for
coronary events, guideline directed medical therapy may be the only treatment. For patients with stable
CAD determined to be at high risk for coronary events, treatment may involve both medical therapy and
revascularization therapy, with the goal of reducing mortality risk and/or improving symptoms. For
patients considered at high risk of coronary events (e.g. those with acute coronary syndrome and
elevated troponin levels), invasive coronary angiography for further risk stratification and assessment of
appropriateness for revascularization may be the next logical steps in addition to medical therapy.

WA - Health Technology Assessment December 11, 2015
Cardiac Stents – Re-Review: Final Evidence Report Page 2
Overall, consideration of revascularization is based on the clinical presentation (acute coronary syndrome or stable angina), the severity of the angina (based on Canadian Cardiovascular Society Classification), the extent of ischemia on noninvasive testing, and the presence or absence of other prognostic factors including congestive heart failure, depressed left ventricular function, and diabetes, the extent of medical therapy, and the extent of anatomic disease. Revascularization methods include coronary artery bypass graft surgery (CABG) and percutaneous coronary interventions (PCI). This report will focus on PCI with stenting. A stent is a stainless mesh tube that can be collapsed and attached to the end of a balloon catheter. When the catheter tip is floated to an area of stenosis, the balloon is inflated to expand the stent. The balloon is then deflated and detached from the stent. The stent remains in the artery permanently to act as a physical scaffold to help keep the artery open. There are two general types of stent that have been FDA approved: Bare metal stents (BMS) and Drug Eluting Stents (DES). DES are essentially BMS that have been coated with a polymer containing an antiproliferative drug. These drugs inhibit vascular smooth cell proliferation and migration and are intended to prevent the neo-intimal hyperplasia that appeared to cause the restenosis observed with BMS implantation. All three treatment approaches (medical therapy, PCI and CABG) have seen important improvements over the years. Only stenting (with concomitant medical therapy) and medical therapy are considered in this report. In the spring of 2009, a health technology assessment comparing DES with BMS was completed for the State of Washington Health Technology Assessment Program. At that time, the majority of studies focused on first generation DES. Since the publication of that report, studies evaluating newer (2nd generation) DES have been published suggesting improved efficacy and safety with the use of newer DES. An updateto the 2009 HTA report was commissioned to bring the latest evidence on FDA approved newer generation DES to assess the latest evidence comparing these stents to bare metal stents and to evaluate the efficacy, safety and cost-effectiveness of stenting versus optimal medical therapy in patients with stable CAD.
Policy context
This technology was originally reviewed May 2009 and was selected for re-review based on new literature identified, changing standards of practice. In addition to re-review of the original report, the Health Technology Assessment Program requested evaluation comparing stenting plus medical therapy versus medical therapy alone.
Objectives
The aim of this assessment is to systematically review, critically appraise and analyze research evidence
comparing the safety and efficacy of: 1) percutaneous coronary intervention with stenting (PCI) with
medical therapy versus medical therapy alone in patients with stable CAD, and 2) percutaneous
coronary intervention with newer generation FDA-approved drug eluting stents (DES) with bare metal
stent (BMS) as an update to the 2009 report.

WA - Health Technology Assessment December 11, 2015
Cardiac Stents – Re-Review: Final Evidence Report Page 3
Key Questions
1. In patients with stable CAD:
a. Is PCI with stenting and medical therapy more effective than medical therapy in reducing
death and MI and/or improving symptoms, functional status and health-related quality of
life? Does the effect vary by (a) BMS versus medical therapy (b) DES versus medical
therapy
b. What is the comparative safety of PCI with stenting versus medical therapy (including
evaluation of bleeding, renal insufficiency and serious adverse events such as nonfatal MI,
death)?
c. If there is benefit to PCI compared with medical therapy alone, is there evidence of
differential benefit or harm based on specific patient characteristics or subgroups (e.g. sex,
diabetes, left main CAD, age)
d. What is the evidence of cost-effectiveness of PCI with stenting versus medical therapy?
2. In patients with CAD (stable or unstable presentation) is there updated evidence subsequent to
the previous (May 2009) report that
a. Newer generation DES are more efficacious than BMS in reducing MI and death and/or
improving symptoms, functional status and patient quality of life?
b. Newer generation DES are safer than BMS (including evaluation of thrombosis, serious
adverse events)?
c. There is differential efficacy or safety of newer generation DES versus BMS based on specific
patient characteristics or subgroups (e.g. sex, diabetes, left main CAD, age)
d. Newer generation DES are more cost effective than BMS
Inclusion and exclusion criteria are summarized as follows:
Population:
o Key Question 1: Eligible studies included patients with stable CAD; post-MI patients who
were within 1 month post-MI were excluded.
o Key Question 2: Eligible studies included patients with CAD (stable or unstable
presentation) undergoing stenting of de novo coronary vessels; patients presenting for
treatment of restenosis, stent thrombosis, or revascularization after initial PCI or CABG
or rescue PCI were excluded.
Intervention:
o Key Question 1: Included studies evaluated FDA approved BMS or DES; studies
evaluating drug-eluting balloons or in which less than 70% of patients received stenting
as the PCI intervention were excluded.

WA - Health Technology Assessment December 11, 2015
Cardiac Stents – Re-Review: Final Evidence Report Page 4
o Key Question 2: Included studies evaluated FDA approved second or third generation
DES; studies evaluating drug-eluting balloons or DES that are no longer in routine use
were excluded.
Comparators:
o Key Question 1: Medical therapy; studies which did not describe more contemporary
components of medical therapy to include pharmacological therapy as well as lifestyle-
related factors (e.g. diet, exercise) and studies in which at least 50% of patients did not
receive statins were excluded
o Key Question 2: FDA-approved bare metal stents; studies comparing different drug-
eluting stenting types which do not compare to BMS, and studies comparing
pharmacological regimens or adjunctive medical devices were excluded.
Outcomes:
o Efficacy/effectiveness
Primary outcomes: Eligible studies reported on at least one the following the primary clinical outcomes: all-cause mortality, cardiac mortality, myocardial infarction, and patient reported outcomes (quality of life, symptom relief, functional outcomes using standardized measures such as the Seattle Angina Questionnaire, Patient Health Questionnaire, Rose Dyspnea Score).
Secondary or intermediate outcomes: Repeat revascularizations (KQ 2 only)
o Safety and harms: Thrombosis at any time-point, pharmacological, surgical or
procedural complications, including serious adverse events (e.g., nonfatal MI, stroke,
death within 30 day peri-procedural time, emergent CABG, vascular complications
requiring intervention), bleeding, renal insufficiency, stent fracture, loss, perforation,
dissection, or structural problems.
o Economic: Cost-effectiveness (e.g., cost per improved outcome), cost-utility (e.g., cost
per quality adjusted life year (QALY), incremental cost effectiveness ratio (ICER))
outcomes.
Study design:
This report focuses on evidence that evaluated efficacy and has the least potential for bias. High
quality systematic reviews and meta-analyses of head to head trials were considered appraised
and incorporated if feasible. RCTs (with at least 40 patients per arm for KQ 2) and prospective
comparative cohort studies (with at least 100 patents for KQ 2) with low risk of bias published
subsequent to such reviews will be evaluated based on the PICO inclusion/exclusion criteria. For
Key Question 2b, only nonrandomized comparative studies design specifically to evaluate safety
and which controlled for possible confounding factors will be considered. As Key Question 2
serves to update the 2009 assessment, only comparative studies published subsequent to that
review which focus on newer generation, FDA-approved DES were included and described;
results will be described based on the context of previous findings. For Key Questions 1c and 2c,
RCTs which stratify on patient or other characteristics and formally evaluate statistical
interaction (effect modification) were sought. Comparative observational studies designed

WA - Health Technology Assessment December 11, 2015
Cardiac Stents – Re-Review: Final Evidence Report Page 5
specifically to evaluate safety were considered. For Key Questions 1d and 2d, only full, formal
economic studies (i.e., cost-effectiveness, cost-utility, cost-minimization, and cost-benefit
studies) will be considered. Because randomized controlled trials and/or meta-analyses of head-
to-head trials are available and provide direct comparative evidence of (a) stents to optimal
medical therapy and (b) BMS to DES, network meta-analyses were excluded as part of the
evidence base for this report but were summarized as appropriate in Section 2.
Methods
The scope of this report and final key questions were refined based on input from clinical experts from a variety of disciplines and were posted for public comment in July 2014; no public comments were received. Clinical expert input was sought to confirm critical outcomes on which to focus. A full description of the systematic review and analysis methods is contained in the full report. Briefly, a formal, structured systematic search of the peer-reviewed literature across a number of databases including PubMed and other sources was performed to identify relevant peer reviewed literature and as well as pertinent clinical guidelines and previously performed assessments. Search dates for KQ 1 were 2003 to July 9, 2015. For KQ2 data bases were searched from 2009 to July 9, 2015 to identify studies on newer-generation DES published subsequent to our previous report. Bibliographies of included studies were hand searched for relevant citations. Studies were selected for inclusion based on pre-specified criteria detailed in the full report with a focus on studies with the least potential for bias that were written in English and published in the peer-reviewed literature. Pertinent studies were critically appraised independently by two reviewers based on Spectrum’s Risk of Bias system. An overall Strength of Evidence (SoE) combines the appraisal of study limitations with the consistency across studies, directness and precision of the findings to describe an overall confidence regarding the stability of estimates as further research is available. Included economic studies were also formally appraised based on criteria for quality of economic studies and pertinent epidemiological precepts. An attempt to pool results was made when two or more randomized controlled trials of similar quality presented identical outcomes over similar time periods. Due to differences in study quality, RCTs were not pooled with comparative observational studies. Outcomes Assessed Emphasis was placed on hard clinical outcomes that are directly related patient health outcomes. For purposes of this report the following primary/critical outcomes are discussed under efficacy and the overall quality (strength) of evidence was assessed: Death (all cause), cardiac death, myocardial infarction (any), and patient reported quality of life (e.g. Seattle Angina Questionnaire). Target lesion revascularization (TLR) and target vessel revascularization (TVR) were considered intermediate, secondary outcomes; overall strength of evidence was assessed for these outcomes. The following outcomes constitute the primary/critical safety outcomes for which quality (strength) of evidence was assessed: Definite stent thrombosis within the stented segment, confirmed by angiography or post-mortem based on the Academic Research Consortium (ARC) criteria, peri-procedural (≤ 30days) complications (e.g. death, MI), stroke and major bleeding.

WA - Health Technology Assessment December 11, 2015
Cardiac Stents – Re-Review: Final Evidence Report Page 6
Results: Summary of evidence with least potential of bias on critical outcomes
The following summaries of evidence are presented by key questions and are based on studies with the least potential for bias available for the critical primary outcomes. Additional information on lower quality studies and other outcomes is available in the report. Results for KQ 1 comparing stenting with medical therapy versus medical therapy alone are presented first. Primary results for KQ 2 for this updated HTA are then presented in the executive summary alongside the findings from the original report to assist the reader in identifying differences.
Key Question 1. PCI with stenting and medical therapy versus medical therapy alone in patients with stable CAD
Studies Selected
The literature search yielded 489 potentially relevant citations based on the search strategy. Of these for
Key Question 1 parts a, b, and c, a total of 32 citations (from four trials) were included after full-text
review.1-7,9-12,18,21,23-25,31,33-37,41,46-51,53,57,61
Studies included:
Key KQ Original 2009 Report
Update Total
PCI vs. Medical Therapy
KQ 2a: Efficacy Not included 4 trials/11 follow-up studies* 0 observational
4 trials/11 follow-up studies* 0 observational
KQ 2b: Safety Not included 4 trials/5 follow-up studies* 0 observational
4 trials/5 follow-up studies* 0 observational
KQ 2c: Differential effects Not included 3 trials/13 follow-up studies* 0 observational
3 trials/13 follow-up studies* 0 observational
KQ 2d: Cost-effectiveness Not included 4 full economic studies 4 full economic studies
Summary of evidence
KQ 1a. Efficacy: Four index randomized controlled trials provide the primary evidence base for the
following outcomes; Table 1 summarizes the results and strength of evidence for the primary outcomes.
All-cause mortality: Four RCTs provided data on all-cause mortality, and all reported no statistically
significant differences between treatment groups, with outcomes reported between 12 months and
120 months.1,3,21,25,58
Cardiac death: There was no statistically significant difference between PCI and medical therapy
groups in cardiac death as reported by all four RCTs, with outcomes reported between 12 months
and 120 months.1,3,21,25,58

WA - Health Technology Assessment December 11, 2015
Cardiac Stents – Re-Review: Final Evidence Report Page 7
Myocardial infarction: All four trials reported this outcome and found no statistically significant
difference the incidence of myocardial infarction at one or more time points between 12 and 60
months1,3,21,25,58; however one trial (MASS-II) reported that nonfatal MI was significantly less
common in the PCI versus medical therapy group through 120 months.23
Patient-reported outcomes: Three trials reported patient-reported outcomes, which included
angina symptoms, angina-related quality of life using the Seattle Angina Questionnaire (SAQ),
quality of life using the SF-36 and RAND outcome measures, and activity using the Duke Activity
Status Index. Results were mixed, with the COURAGE trial (general population) reporting greater
improvement in the SAQ angina frequency domain at 6, 12, and 36 months; the trial also reported
that more PCI patients had significantly greater improvement in other SAQ and RAND-36 domains at
6 (and to some extent 12) months but there were no longer statistically meaningful differences
between groups by 36 months.61 The MASS-II trial (general population) found that the PCI group had
significantly better scores in the SF-36 physical functioning and vitality domains at 12 months but
there were no differences between groups in any other domains at 12 months.18 In contrast, the
BARI 2D trial (type 2 diabetes) found no differences between groups in the modified RAND domains
for energy, health distress, or self-rated help through 48 months. This trial also found similar results
between groups in the DASI through 48 months.6 Regarding freedom from angina symptoms, the
COURAGE trial (general population) found that significantly more PCI patients were angina-free at
both 12 and 36 month,3 the MASS-II trial (general population) similarly reported significantly more
angina-free patients in the PCI group at 12, 60, and 120 months.21,23-25 The BARI 2D trial (type 2
diabetes) reported that in the subset of patients with classic angina at baseline, freedom from
angina symptoms occurred in more patients in the PCI group during the first year, although there
was no difference between groups in subsequent years through the fifth year of follow-up.12 The
trial also reported that worsening angina occurred in significantly fewer PCI patients during the first
and third year of follow-up, but there was no difference between groups in the second, fourth, or
fifth years. In the subset of patients without classic angina at baseline, there were no differences
between groups in the percentages of patients with new angina during follow-up through the fifth
year follow-up.12 Trials were not blinded, thus the extent to which a placebo effect may influence
results for patient reported outcomes is unclear.
Revascularization: All four trials reported on revascularization, and results varied.1,3,21,25 The
Hambrecht trial (males only)21 found that the PCI group had a significantly greater risk of
revascularization than the medical therapy group through 12 months; the MASS-II trial (general
population) reported similar 12-25 and 60-month24 results although statistical significance was not
achieved. In contrast, the COURAGE (general population)3 and BARI 2D (type 2 diabetes)1 trials both
found that the PCI group had a significantly lower risk of revascularization compared with the
medical therapy groups through a median of 55 months (COURAGE)3 and 60 months (BARI 2D).12
Through 120 months, the MASS-II trial found no difference in revascularization rates between
treatment groups.23 Across included trials, the extent to which revascularization was “clinically
driven” was not uniformly described, nor did studies generally describe any threshold/criteria for
revascularization overall, with the exception of the BAR 2D trial.

WA - Health Technology Assessment December 11, 2015
Cardiac Stents – Re-Review: Final Evidence Report Page 8
Table 1. Key Question 1a: Strength of evidence for primary efficacy outcomes.
Population Outcome Number of Studies (N)
Strength of Evidence
Absolute Risk Effect Size (95% CI)
Conclusions
General population
Mortality (all-cause) through 12 months
1 RCT (MASS-II) (N=408)
⨁⨁◯◯ LOW
PCI 4.4%, Med 1.5% RD 2.9% (-0.4% to 6.2%) RR 3.0 (0.8 to 10.8)
Mortality up to 12 months was slightly higher in the PCI group compared with the Med group; however, this difference was not statistically meaningful.
Special population: Males
Mortality (all-cause) through 24 months
1 RCT (Hambrecht) (N=101)
⨁⨁◯◯ LOW
PCI 4%, Exercise 2% RD 2% (-5% to 9%) RR 2.0 (0.2 to 21.8)
A difference was not detected due to low power.
General population
Mortality (all-cause) through median of 55.2 months
1 RCT (COURAGE) (N=2287)
⨁⨁⨁◯ MODERATE
PCI 7.4%, Med 8.4% RD -1.0% (-3.2% to 1.3%) RR 0.89 (0.67 to 1.17)
Mortality was similar between PCI and Med groups through a median of 55 months
General population
Mortality (all-cause) through 60 months
1 RCT (MASS-II) (N=408)
⨁⨁◯◯ LOW
PCI 11.7%, Med 12.3% RD -0.6% (-6.9% to 5.7%) Adjusted RR 0.92 (0.46 to 1.86)
Mortality up to 60 months was similar between PCI and Med groups
Special population: Type 2 Diabetes
Mortality (all-cause) through mean of 63.6 months
1 RCT (BARI 2D) (N=1605)
⨁⨁⨁◯
MODERATE
PCI 12.8%, Med 11.9% RD 0.9% (-2.3% to 4.1%) RR 1.1 (0.8 to 1.4)
Mortality was similar between PCI and Med groups through a mean of 63.6 months
General population
Mortality (all-cause) through 120 months
1 RCT (MASS-II) (N=408)
⨁⨁◯◯
LOW
PCI 25.1%, Med 31.0% RD -7.1% (-15.7% to 1.5%) RR 0.8 (0.6 to 1.1)
Mortality through 120 months was slightly lower in the PCI group compared with the Med group, however, this difference was not statistically meaningful.
General population
Cardiac death through 12 months
1 RCT (MASS-II) (N=408)
⨁⨁◯◯ LOW
PCI 4.4%, Med 1.5% RD 2.9% (-0.4% to 6.2%) RR 3.0 (0.8 to 10.8)
Cardiac death through 12 months was similar between PCI and Med groups
Special population: Males
Cardiac death through 24 months
1 RCT (Hambrecht) (N=101)
⨁⨁◯◯ LOW
PCI 0%, Exercise 0%
There were no cardiac deaths in either group through 24 months.
General population
Cardiac death through median of 55.2 months
1 RCT (COURAGE) (N=2287)
⨁⨁⨁◯ MODERATE
PCI 2.0%, Med 2.2% RD -0.2% (-1.4% to 1.0%) unadjusted HR 0.87 (0.65 to 1.16)
Cardiac death through a median of 55.2 months was similar between PCI and Med groups
General population
Cardiac death through 60
1 RCT (MASS-II)
⨁⨁◯◯ LOW
PCI 11.6%, Med 12.3%
Cardiac death through 60 months was similar between

WA - Health Technology Assessment December 11, 2015
Cardiac Stents – Re-Review: Final Evidence Report Page 9
Population Outcome Number of Studies (N)
Strength of Evidence
Absolute Risk Effect Size (95% CI)
Conclusions
months (N=408) RD -0.6% (-6.9% to 5.7%) RR 1.0 (0.6 to 1.6)
PCI and Med groups
Special population: Type 2 Diabetes
Cardiac death through mean of 63.6 months (special population: type 2 diabetes)
1 RCT (BARI 2D) (N=1605)
⨁⨁⨁◯ MODERATE
PCI 5.5%, Med 4.1% RD 1.4% (-0.7% to 3.5%) RR 1.3 (0.9 to 2.1)
Cardiac death through a mean of 63.6 months was similar between PCI and Med groups
General population
Cardiac death through 120 months
1 RCT (MASS-II) (N=408)
⨁⨁◯◯ LOW
PCI 14.3%, Med 20.7% RD -6.5% (-13.9% to 0.8%) RR 0.7 (0.4 to 1.1)
Cardiac death occurred in fewer PCI patients through 120 months, however this difference was not statistically meaningful.
General population
Nonfatal MI through 12 months
1 RCT (MASS-II) (N=408)
⨁⨁◯◯ LOW
PCI 8.3%, Med 5.0% RD 2.9% (-1.9% to 7.6%) RR 1.6 (0.7 to 2.4)
Nonfatal MI through 12 months was similar between PCI and Med groups
Special population: Males
Nonfatal MI through 12 months
1 RCT (Hambrecht) (N=101)
⨁⨁◯◯ LOW
PCI 2%, Exercise 0% RD 2%
A difference was not detected due to low power.
Special population: Males
Nonfatal MI through 24 months
1 RCT (Hambrecht) (N=101)
⨁⨁◯◯ LOW
PCI 2%, Exercise 2% RD 0% (-6% to 6%) RR 1.0 (0.1 to 15.9)
A difference was not detected due to low power.
General population
Nonfatal MI (post-peri-procedural through median of 55.2 months
1 RCT (COURAGE) (N=2287)
⨁⨁⨁◯ MODERATE
PCI 9.4%, Med 10.5% RD -1.1% (-3.5% to 1.4%) RR 0.9 (0.9 to 1.2)
A difference was not detected.
Special population: Type 2 Diabetes
MI (post-peri-procedural, fatal & nonfatal) through mean of 55.2 months
1 RCT (BARI 2D) (N=1605)
⨁⨁⨁◯ MODERATE
PCI 8.5%, Med 9.6% RD -1.0% (-3.8% to 1.8%) RR 0.9 (0.7 to 1.2)
Non-periprocedural MI was similar between PCI and Med groups through a mean of 55.2 months
General population
Nonfatal MI through 60 months
1 RCT (MASS-II) (N=408)
⨁⨁◯◯ LOW
PCI 11.2%, Med 15.3% RD -4.1% (-10.6% to 2.5%) RR 0.7 (0.44 to 1.2)
Nonfatal MI through 60 months was similar between PCI and Med groups
General population
Nonfatal MI through 120 months
1 RCT (MASS-II) (N=408)
⨁⨁◯◯ LOW
PCI 13.2%, Med 20.7% RD -7.5% (-17.8% to -
Nonfatal MI through 120 months was less common in the PCI versus Med group

WA - Health Technology Assessment December 11, 2015
Cardiac Stents – Re-Review: Final Evidence Report Page 10
Population Outcome Number of Studies (N)
Strength of Evidence
Absolute Risk Effect Size (95% CI)
Conclusions
0.3%) RR 0.64 (0.41 to 0.991)
General population
Revascular-ization (any) through 12 months
1 RCT (MASS-II) (N=408)
⨁⨁◯◯ LOW
PCI 12.2%, Med 7.9% RD 4.3% (-1.5% to 10.1%) RR 1.55 (0.85 to 2.81)
Revascularization up to 12 months was statistically similar between PCI and Med groups.
Special population: Males
Revascular-ization (any) through 12 months
1 RCT (Hambrecht) (N=101)
⨁⨁◯◯ LOW
PCI 20%, Exercise 6% RD 14% (1% to 27%) RR 3.4 (1.0 to 11.6)
Revascularization was performed in more PCI versus Exercise groups through 12 months.
General population
Revascular-ization (any) through median of 55.2 months
1 RCT (COURAGE) (N=2287)
⨁⨁⨁◯ MODERATE
PCI 19.8%, Med 30.6% RD -10.7% (-14.3% to -7.2%) RR 0.65 (0.56 to 0.75)
Revascularization was performed in fewer patients in the PCI group than in the Med group through a median of 55 months
Special population: Type 2 Diabetes
Revascular-ization (any) through 60 months
1 RCT (BARI 2D) (N=1605)
⨁⨁⨁◯ MODERATE
PCI 26.8%, Med 39.1% RD -12.3% (-16.9% to -7.8%) RR 0.68 (0.59 to 0.79)
Revascularization was performed in fewer patients in the PCI group than in the Med group through 60 months
General population
Revascular-ization (any) through 60 months
1 RCT (MASS-II) (N=408)
⨁⨁◯◯ LOW
PCI 32.2%, Med 24.1% RD 8.1% (-0.6% to 16.8%) RR 1.33 (0.97 to 1.83)
Revascularization through 60 months was more common in the PCI group, however this difference was not statistically significant.
General population
Revascular-ization (any) through 120 months
1 RCT (MASS-II) (N=408)
⨁⨁◯◯ LOW
PCI 41.5%, Med 39.4% RD 2.1% (-7.5% to 11.6%) RR 1.05 (0.83 to 1.33)
Revascularization through 120 months was similar between PCI and Med groups
General population
Clinically-significant improve-ment* in SAQ domains at 6 months
1 RCT (COURAGE) (N=1698-1738)
⨁⨁◯◯ LOW
At 6 months, more patients in the PCI versus Med group had clinically significant improvement in the SAQ domains for angina frequency (50% vs. 44%, RR 1.14, 95% CI 1.03 to 1.26), physical limitation (51% vs. 42%, RR 1.21, 95% CI 1.10 to 1.35), and in quality of life (64% vs. 56%, RR 1.14, 95% CI 1.06 to 1.24), while there were no differences between groups in treatment satisfaction (30% vs. 31%) or angina stability (56% vs. 52%).
General population
Clinically-significant improve-ment* in SAQ domains at 12 months
1 RCT (COURAGE) (N=1653-1692)
⨁⨁◯◯ LOW
At 12 months, more patients in the PCI versus Med group had clinically significant improvement in the SAQ domains for angina frequency (52% vs. 46%, RR 1.13, 95% CI 1.03 to 1.25) and treatment satisfaction (39% vs. 33%, RR 1.18, 95% CI 1.04 to 1.34), while there were no differences between groups in the domains physical limitation, quality of life, or angina stability.

WA - Health Technology Assessment December 11, 2015
Cardiac Stents – Re-Review: Final Evidence Report Page 11
Population Outcome Number of Studies (N)
Strength of Evidence
Absolute Risk Effect Size (95% CI)
Conclusions
General population
Clinically-significant improve-ment* in SAQ domains at 36 months
1 RCT (COURAGE) (N=1156-1179)
⨁◯◯◯ INSUFFICIENT
At 36 months, more patients in the PCI versus Med group had clinically significant improvement in the SAQ angina frequency domain (57% versus 50%, RR 1.14, 95% CI 1.02 to 1.27) but not in any other SAQ domain. Firm conclusions cannot be made due to low follow-up (51%).
General population
Clinically-significant improve-ment† in RAND-36 domains at 6 and 12 months
1 RCT (COURAGE) (N=1653-1738)
⨁⨁◯◯ LOW
More patients in the PCI versus Med group had improvement in the physical functioning domain (50% versus 43%, RR 1.16, 95% CI 1.05 to 1.28) and role limitation-physical domain (48% versus 43%, RR 1.11, 95% CI 1.00 to 1.23) at 6 months; otherwise there were no significant differences between groups in any other domain at 6 or 12 months.
General population
Clinically-significant improvement† in RAND-36 domains at 36 months
1 RCT (COURAGE) (N=1156-1179)
⨁◯◯◯ INSUFFICIENT
At 36 months, there was no difference between groups in the percentage of patients with clinically meaningful improvement in any of the RAND-36 domains. Firm conclusions cannot be made due to low follow-up (51%).
General population
SF-36 scores at 12 months
1 RCT (MASS-II) (N=408)
⨁⨁◯◯ LOW
The PCI group had significantly better mean scores in the SF-36 physical functioning and vitality subdomains compared with the medical therapy group at 12 months (p<0.001). There were no other significant differences in mean scores between the groups at 12 months for any of the other subdomains (general health, role functioning-physical, role functioning-emotional, mental health, pain, social functioning). Data was only provided in graph form thus additional data are not available.
Special population: Type 2 Diabetes
Duke Activity Status Index through 48 months
1 RCT (BARI 2D) (N=1602)
⨁⨁◯◯ LOW
PCI and Med groups had similar percent improvement from baseline over 48 months in the Duke Activity Status Index (OR 1.07, p=0.40).
Special population: Type 2 Diabetes
Energy, health distress, and self-rated health (modified RAND domains) through 48 months
1 RCT (BARI 2D) (N=1602)
⨁⨁◯◯ LOW
PCI and Med groups had similar percent improvement from baseline over 48 months in the modified RAND domains for energy (OR 1.12, p=0.17), health distress (OR 0.97, p=0.69), and self-rated health (OR 0.92, p=0.36).
General population
Freedom from angina (not defined) at 12 and 36 months
1 RCT (COURAGE) (N=1644-2041)
⨁⨁◯◯ LOW
Significantly more PCI than Med patients were angina-free at 12 months (66.0% vs. 58.9%, RR 1.11, 95% CI 1.04 to 1.19, p=0.001) and 36 months (73.4% versus 67.7%. RR 1.08, 95% CI 1.01 to 1.15, p=0.01).

WA - Health Technology Assessment December 11, 2015
Cardiac Stents – Re-Review: Final Evidence Report Page 12
Population Outcome Number of Studies (N)
Strength of Evidence
Absolute Risk Effect Size (95% CI)
Conclusions
General population
Freedom from angina (not defined) at 12, 60, and 120 months
1 RCT (MASS-II) (N=408)
⨁⨁◯◯ LOW
At all follow-ups, more PCI versus Med patients were angina-free (not further defined), including 12 months (52.2% versus 36.5%, RR 1.43, 95% CI 1.1 to 1.8, p=0.001), 60 months (77.3% versus 54.8%, RR 1.28, 95% CI 1.06 to 1.55, p=0.0102), and 120 months (58.5% versus 43.3%, RR 1.35, 95% CI 1.11 to 1.64, p=0.0022).
Special population: Type 2 Diabetes
Patient-reported worsening angina (overall angina that was worse in severity and/or frequency or a change from no angina to any angina or to unstable angina) through 12 months
1 RCT (BARI 2D) (N=1502)
⨁⨁◯◯
LOW
Worsening angina occurred in fewer PCI versus Med patients through 12 months (17.7% versus 24.5%; RD -6.8%, 95% CI -10.9% to -2.7%; RR 0.7, 95% CI 0.6 to 0.9; p=0.0012).
Special population: Type 2 Diabetes
Patient-reported worsening angina (overall angina that was worse in severity and/or frequency or a change from no angina to any angina or to unstable angina) between 24-60 months
1 RCT (BARI 2D) (N=1502)
⨁⨁◯◯ LOW
Worsening angina occurred similarly between groups during the second year follow-up (~14% in both groups), but favored the PCI group again as measured during the third year of follow-up (~11% vs. 15%, p=0.019). Results were similar between groups during the fourth (~10% vs. ~11%) and fifth (~9% in both groups) years of follow-up.
Special population: Type 2 Diabetes
Freedom from patient-reported angina (in subset of patients with classic angina at baseline)
1 RCT (BARI 2D) (N=961)
⨁⨁◯◯ LOW
In the subset of patients with classic angina at baseline, significantly more PCI than Med group patients did not report new angina during the first year follow-up (~40% versus ~24%, p<0.001). There were no significant differences between groups in the second, third, fourth, or fifth years of follow-up.

WA - Health Technology Assessment December 11, 2015
Cardiac Stents – Re-Review: Final Evidence Report Page 13
Population Outcome Number of Studies (N)
Strength of Evidence
Absolute Risk Effect Size (95% CI)
Conclusions
Special population: Type 2 Diabetes
New classic angina (in subset of patients without classic angina at baseline)
1 RCT (BARI 2D) (N=641)
⨁⨁◯◯ LOW
In the subset of patients without classic angina at baseline, cumulative new angina rates were not statistically significant between groups through 60 months follow-up.
* Clinical significance defined as a difference of 8 points or more on the physical-limitation scale, 25 or more on the angina-stability scale, 20 or more on the angina-frequency scale, 12 or more on the treatment-satisfaction scale, and 16 or more on the quality-of-life scale.
† Clinical significance defined as a difference of 10 points or more in a given domain.
KQ 1b. Safety and adverse events: Four index randomized controlled trials provide the primary
evidence base for the following outcomes: Table 2 summarizes the results and strength of evidence for
the primary outcomes.
Periprocedural: Periprocedural MI occurred in approximately 2% more patients in the PCI group compared with the medical therapy group as reported by the COURAGE3 and BARI 2D trials.5 The MASS-II trial reported that major in-hospital adverse events (death, MI, stroke, etc.) occurred in 1.0% to 2.4% of PCI patients.25
Adverse events >30 days: Regarding events occurring after 30 days post-treatment, there was no difference between treatment groups in the incidence of stroke as reported by all four RCTs, with outcomes reported between 12 months and 120 months.1,3,21,25
Table 2. Key Question 1b: Strength of evidence for primary safety outcomes
Population Outcome Number of Studies (N)
Strength of evidence
Absolute Risk Effect Size (95% CI)
Conclusions
General
population
In-hospital
adverse
events
1 RCT
(MASS-II)
(N=205)
⨁⨁◯◯ LOW
PCI 1% to 2.4%, Med NA
During the index PCI
procedure, in-hospital
events were relatively rare
and included death (2.4%),
Q-wave MI (1.0%),
emergency CABG (1.0%),
emergency PCI (1.0%), and
stroke (1.0%).
General
population
Peri-
procedural
MI
1 RCT
(COURAGE)
(N=2287)
⨁⨁⨁◯
MODERATE
PCI 3.0%, Med 0.8%
RD 2.3% (1.1% to 3.4%)
RR 3.85 (1.86 to 7.98)
Periprocedural MI occurred
in significantly more
patients randomized to PCI
versus Med

WA - Health Technology Assessment December 11, 2015
Cardiac Stents – Re-Review: Final Evidence Report Page 14
Population Outcome Number of Studies (N)
Strength of evidence
Absolute Risk Effect Size (95% CI)
Conclusions
Special
population:
Type 2
Diabetes
Peri-
procedural
MI
1 RCT
(BARI 2D)
(N=1602)
⨁⨁⨁◯
MODERATE
PCI 3.4%, Med 1.4%
RD 2.0% (0.5% to 3.5%)
RR 2.48 (1.24 to 4.96)
Periprocedural MI was
significantly more common
in the PCI group
Special
population:
Type 2
Diabetes
30-day
mortality
1 RCT
(BARI 2D)
(N=798)
⨁⨁◯◯ LOW
PCI 0.5%, Med NR
30-day mortality occurred
in 0.5% of PCI patients; no
data were reported for the
control group.
Special
population:
Type 2
Diabetes
Peri-
procedural
stroke
1 RCT
(BARI 2D)
(N=1605)
⨁⨁◯◯
LOW
PCI 0.4%, Med 0.2%
RD 0.1% (-0.4% to 0.7%)
RR 1.52 (0.25 to 9.04)
Periprocedural stroke was
similar between PCI and
Med groups
Special
population:
Males
Stroke
through 12
months
1 RCT
(Hambrecht)
(N=101)
⨁⨁◯◯ LOW
PCI 6%, Exercise 4%
RD 2% (–6% to 10%)
RR 1.5 (0.3 to 8.8)
A difference was not
detected due to low power.
General
population
Stroke
through
median of
55.2 months
1 RCT
(COURAGE)
(N=2287)
⨁⨁⨁◯
MODERATE
PCI 1.9%, Med 1.2%
RD 0.7% (–0.3% to 1.7%)
RR 1.56 (0.80 to 3.03)
Stroke through a median of
55.2 months occurred
similarly between groups.
Special
population:
Type 2
Diabetes
Stroke
through
mean of 55.2
months
1 RCT
(BARI 2D)
(N=1605)
⨁⨁⨁◯
MODERATE
PCI 2.6%, Med 2.6%
RD 0.03% (-1.5% to 1.6%)
RR 1.0 (0.6 to 1.8)
Stroke through a mean of
55.2 months occurred
similarly between groups.
General
population
Stroke
through 120
months
1 RCT (MASS-
II) (N=408)
⨁⨁◯◯
LOW
PCI 5.4%, Med 6.9%
RD –1.5% (–6.2% to 3.1%)
RR 0.8 (0.4 to 1.7)
Stroke through 120 months
occurred similarly between
groups; similar results were
found when assessed
through 12 and 60 months.
KQ1c. Differential efficacy or safety (Table 3)
Healthcare system modified the treatment effect of revascularization through a median of 55.2 months
(interaction p<0.001) such that revascularization rates were different in different healthcare systems.10
In the COURAGE trial, the SAQ angina stability domain was modified in terms of treatment group,
patient sex, and time (through 36 months) (interaction p=0.0041).61 Similarly, the SAQ angina frequency
and quality of life domains were modified in terms of treatment group, prior CABG, and time (through
36 months) (interaction p=0.0113 & p=0.0270, respectively). However, no additional data were reported
and it is unclear how the results varied according to the characteristics evaluated (sex, history of CABG)
and time, which were both used as interaction variables. In a post-hoc analysis of data from the
COURAGE trial, baseline scores of the SAQ angina frequency, physical limitation, and quality of life
domains (divided into tertiles) and time (through 36 months) modified treatment effect with respect to

WA - Health Technology Assessment December 11, 2015
Cardiac Stents – Re-Review: Final Evidence Report Page 15
the percentage of patients with clinically significant improvement in the same domain (interaction
p<0.001 for all) and with respect to mean scores in the same domain (interaction p<0.008 for all) such
that patients with lower baseline scores had greater improvement.61
Otherwise, there was no evidence that the effect of PCI+MT versus MT alone on any of the included
efficacy outcomes or safety outcomes was modified by any baseline characteristic evaluated, including:
sex,3,61 age,3,11,31,53,61 race,3,61 baseline angiographic risk,5 baseline Framingham risk,5 baseline CCS
scores,3,61 baseline angina,12 baseline SAQ domain scores,60,63 baseline Myocardial Index Jeopardy
score,5,12,34 baseline ischemia,50 number of diseased vessels,3,5,12,34 number of lesions,5 total occlusion,5
proximal LAD,5 prior revascularization,5,12 prior CABG,3,61 LVEF,5 ejection fraction,3 history of MI,3,61
current smoking status,3 diabetes,3,31,51,61 chronic kidney disease,42,46,47 or healthcare system.3,10 There
was evidence that age modified the composite outcome of death/MI and that healthcare system
modified treatment effect in terms of the need for revascularization, however, neither of these were
considered to be primary outcomes of interest.
Table 3. Key Question 1c: Strength of evidence for studies reporting differential efficacy and safety.
Population
Baseline
characteristic,
Outcome
Number of
Studies
(N)
Strength of
evidence
Absolute Risk
Effect Size (95% CI) Conclusions
General
population
Healthcare
system (US-VA vs.
US-non VA vs.
Canada)
Outcome:
Revascularization
(any) through
median of 55.2
(range, 30 to 84)
months
1 RCT
(COURAGE)
(N=2158)
⨁◯◯◯ INSUFFICIENT
US-VA: PCI 28.1%, Med
32.6%
US-nonVA: PCI 23.4%,
Med 34.8%
Canada: PCI 12.9%, Med
32.5%
US-VA: RD -4.5%
(-10.5% to 1.6%)
US-nonVA: RD -11.5% (-
20.8% to -2.2%)
Canada: RD -19.6%
(-24.9% to -14.3%)
US-VA: RR 0.86 (0.71 to
1.05)
US-nonVA: 0.67 (0.48 to
0.93)
Canada: RR 0.40 (0.30
to 0.52)
Healthcare system
modified the treatment
effect of
revascularization
through a median of 55.2
months (interaction
p<0.001) such that
revascularization rates
were different in
different healthcare
systems
KQ1 d: Cost-effectiveness
Four economic analyses (published across seven citations)17,21,22,56,59,60,63 met the inclusion criteria and
were conducted alongside the trials included in Key Question 1 parts a, b, and c. None found that an
initial strategy of PCI plus medical therapy was more cost-effective than an initial strategy of medical
therapy alone. The studies are summarized in Table 4.

WA - Health Technology Assessment December 11, 2015
Cardiac Stents – Re-Review: Final Evidence Report Page 16
Table 4. Key Question 1d: Strength of evidence for formal economic evaluations
Population Interventions Studies Time horizon
Countries QHES Range
Overall quality of evidence
Conclusions
General population
PCI+Med vs. Med
COURAGE (Weintraub 2008, Zhang 2011) Median 4.6 years & Lifetime horizon
US and Canada
90/100 Moderate The authors concluded that an initial treatment of PCI + optimal medical therapy for stable CAD was not more cost effective than an initial treatment strategy of optimal medical therapy alone, with a cost per QALY gained (ICER) of $206,229 with PCI and the cost per life-year gained with PCI was $299,518 for the in-trial period of 4.6 years; the cost per life-year gained with PCI was $299,518 over the same time horizon. Over the lifetime horizon, the ICER was $168,019 with PCI and the cost per life-year gained was $262,116. The QALY took into account both survival (including that following non-fatal events) and angina-related quality of life using SAQ scores; direct costs were used. Additional analyses of the cost of clinically meaningful improvement in different SAQ domains yielded similar conclusions, even after stratifying by baseline angina severity. Sensitivity analyses supported the conclusion that PCI was not cost-effective as an initial treatment.
General population
PCI+Med vs. Med
MASS-II (Favarato 2003, Vieira 2012) 1 year & 5 years
Brazil 48/100 Insufficient The authors concluded that an initial treatment of PCI + optimal medical therapy for stable multivessel CAD was not more cost effective than an initial treatment strategy of optimal medical therapy alone for the time horizons of 1 and 5 years. At 5 years, the cost per year of event-free survival (which appeared to include freedom from death, MI, stroke, and revascularization) was $10,896 higher in the PCI group ($19,967

WA - Health Technology Assessment December 11, 2015
Cardiac Stents – Re-Review: Final Evidence Report Page 17
Population Interventions Studies Time horizon
Countries QHES Range
Overall quality of evidence
Conclusions
versus $9,071, p<0.001); the cost of event-free and angina-free survival through 5 years was $9278 higher in the PCI group ($25,831 versus $16,553, p<0.001). No sensitivity analyses were done. Direct costs were used.
Special population: Males
PCI+Med vs. Exercise + Med
Hambrecht 2003 1 year
Germany 35/100 Insufficient The average cost to improve one CCS class between baseline and 12 months was significantly higher in the PCI group compared with the control group ($6956 versus $3249; p<0.001). No sensitivity analyses were done. Direct costs were used.
Special population: Type 2 Diabetes
PCI+Med vs. Med
BARI 2D (Hlatky 2009) 4 years Lifetime horizon
US 79/100 Moderate The authors concluded that an initial treatment of PCI + medical therapy for stable CAD was not more cost effective than an initial treatment strategy of medical therapy alone. Direct costs were used, and the main outcome was survival. Over a 4-year time horizon, PCI was dominated by medical therapy (i.e., medical therapy was more effective and cost less) when cost per life-years gained was calculated. Similarly, medical therapy dominated in terms of the 4-year cost per QALY, which was based on trial data for DASI, CCS class, health rating, and self-reported health status (no further details reported). In the lifetime projected cost-effectiveness analysis, the PCI group had slightly lower costs than the control group ($237,900 versus $238,100) but fewer life-years of survival (13.70 versus 14.03), so that medical therapy alone resulted in an additional cost of $600 per life-year gained over this time

WA - Health Technology Assessment December 11, 2015
Cardiac Stents – Re-Review: Final Evidence Report Page 18
Population Interventions Studies Time horizon
Countries QHES Range
Overall quality of evidence
Conclusions
horizon. Similar results were found for the lifetime horizon when evaluated in terms of cost per QALY gained; the cost per life year gained was $700 for medical therapy alone. Similar results were found in additional sensitivity analyses.
Key Question 2. Newer generation DES compared with BMS
Studies Selected
The literature search yielded 3408 potentially relevant citations based on the search strategy. Of these,
for Key Question 1 parts a, b, and c, a total of 21 citations – 7 RCTs (12 publications),13-16,20,26,28,38,42,43,54,55
3 registries (4 publications),19,39,44,45 and 5 case series27,29,30,40,62 – were included after full-text review.
Studies included:
Key KQ Original 2009 Report Update Total
Newer Generation DES vs BMS
KQ 2a: Efficacy 52 publications, 9 HTA reports*
6 trials/2 follow-up studies* 0 observational
9 HTAs 75 publications (2009 Report = 54; 2015 Update = 21) KQ 2b: Safety 52 publications, 9 HTA
reports* 6 trials/2 follow-up studies* 9 observational
KQ 2c: Differential effects
52 publications, 9 HTA reports*
3 trials/1 follow-up studies* 0 observational
KQ 2d: Cost-effectiveness
2 full economic studies, 9 HTA reports*
1 full economic studies
* The 2009 report included numerous, meta-analyses, systematic reviews, randomized controlled trials, and comparative observational studies, as well as prior Health Technology Assessments (HTAs) which contributed data to all Key Questions. Differential efficacy was evaluated as part of Key Question 1 not a separate question.
A summary of the primary efficacy results for KQ 2 (update of comparison DES with BMS) from the
current report for the update section are presented next to the summary from the 2009 report. Tables
5-11 detail the strength of evidence and summary of findings for the comparison of newer-generation
DES with BMS for these and additional outcomes.

WA - Health Technology Assessment December 11, 2015
Cardiac Stents – Re-Review: Final Evidence Report Page 19
Table 5. Key Question 2a: Summary of Findings for Efficacy of DES vs. BMS
Key Results From 2009 HTA Report Results From This 2015 Updated Report: Efficacy of Newer DES vs. BMS
Efficacy and effectiveness (up to 4 years) General population All-cause mortality: There was HIGH evidence that there was no difference between DES and BMS. Previously published HTAs and recent meta-analyses of up to 35 RCTS consistently report no statistically significant difference in mortality. Pooled rates for DES 4.1% and 4.7% for BMS up to 4 years follow-up
Cardiac death: There was HIGH evidence that there was no difference between DES and BMS. Previously published HTAs and recently published meta-analyses of up to 35 RCTS consistently report not statistically significant difference in cardiac mortality. Pooled rates for DES were 2.4% compared with 2.7% for BMS. Myocardial infarction: There was HIGH evidence that there was no difference between DES and BMS. Previously published HTAs and recently published meta-analyses of up to 35 RCTS with follow-up to 4 years consistently report not statistically significant difference in myocardial infarction based on the conventional meta-analysis which is may be more conservative HR, 0.86 (0.67-1.09). Pooled rates for MI from the network meta-
Efficacy: All populations
All-cause mortality: There was HIGH evidence from RCTs that there was no difference between newer-generation DES and BMS at 12 or up to 48 months in pooled analyses. Despite clinical heterogeneity in study populations, no statistical heterogeneity was observed. At 12 months, across four RCTs pooled rates were: for DES 6.2%, BMS 5.9%; RD 0.46% (95% CI -0.44% to 1.4%).13,16,43,54 Up to 48 months across three trial pooled rates were: for DES 4.2%, BMS 4.8%; RD -0.78% (95% CI -2.0% to 0.5%).15,28,42 There was MODERATE evidence of no difference between newer-generation DES and BMS at 60 months from one trial; rates were 6.2% for DES, 7.6 % BMS, RD -1.3% 95% (CI -4.2 to 1.6).16 There was LOW evidence from 1 meta-analysis of individual patient data in women that mortality was similar for DES (5.3%) and BMS (6.3%) at 36 months based on unadjusted Kaplan Meier estimates; adjusted effect sizes were not provided.52 Cardiac death: There was HIGH evidence of no differences between newer-generation DES and BMS in cumulative cardiac death across four RCTs at 12 months, pooled estimates: 4.1% DES, 4.4% BMS; RD 0.09% (-0.44% to 1.4%).13,16,43,54 There was MODERATE evidence of no difference at 24 months across two RCTs (pooled estimates 2.7 DES, 3.3 BMS; RD-1.0% (-2.0% to 0%)28,42 or at 60 months in one RCT (DES 3.1%, 3.6% BMS; RD -0.9%, 95% CI, -3.3% to 1.3%).16
Myocardial infarction: Differences in MI classification and reporting time frames limited the ability to pool data across five trials.13,16,28,43,54 There was LOW evidence from data pooled across three trials that “any” MI was less common when DES were employed (2.6%) compared with BMS (5.9%), however the observed association was within the limits of chance given no true difference in risk (RD -3.3% (95% CI -7.2% to 0.6%)

WA - Health Technology Assessment December 11, 2015
Cardiac Stents – Re-Review: Final Evidence Report Page 20
Key Results From 2009 HTA Report Results From This 2015 Updated Report: Efficacy of Newer DES vs. BMS
analysis were 4.5% for DES compared with 5.2% for BMS based on cumulative incidence up to 4 years.
Revascularization (Secondary outcome): There was high evidence that there was a statistically significant decrease in TVR or TLR favoring DES. Previously published HTAs and recently published meta-analyses of up to 35 RCTS consistently report a statistically significant decrease in TVR or TLR favoring DES. There is significant overlap in the trials used for HTAs and meta-analysis. TVL and TLR rates in RCTs may be partially a reflection of protocol driven angiographic follow-up. Rates of TVR ranged from 6% - 9% for DES and were estimated at 19% for BMS based on cumulative incidence up to 4 years. Rates after the first year were lower for all stent types.
Heterogeneity in study populations may contribute to this finding. Considering the studies individually, the trial in octogenarians (XIMA) and the trial in candidates of uncertain DES eligibility (ZEUS) reported statistically significant differences favoring DES while the trial in patients with STEMI (EXAMINATION) did not (Table 5). There was HIGH evidence from other RCTs that there was no difference between newer-generation DES and BMS for target vessel MI at 12 or 24 months in two trials16,43; for Q-wave MI and non-Q-wave MI at 12 or 24 months in one trial42,43; or for nonfatal MI at 24 or 48 months in two trials,15,28 with risk differences between groups ranging from -1.2% to -0.1% (Table X) There was LOW evidence from an individual patient data meta-analysis of RCT data in women only suggesting that that MI was less common with newer DES (4.8% vs. 7.7% , p = 0.03) at 36 months based on unadjusted Kaplan Meier estimates, however, adjusted effect size estimates were not reported and substantial baseline differences between treatment groups were noted.52
Revascularization (Secondary, intermediate outcome): There was MODERATE evidence that target lesion revascularization (TLR) was significantly less common with DES 4.3% versus BMS (9.2%) at 12 months across three RCTs, pooled RD -4.8% (-7.4% to - 2.1%).16,43,54 Evidence was LOW across two RCTS that although TLR was less common with newer-generation DES (6.1%) use compared with BMS (10.2%), the risk difference was not statistically significant at 24 months, RD -5.5% ( -12.2% to 1.2%).42,55 Differences in patient populations may partially explain heterogeneity. Evidence was LOW an individual patient data meta-analysis of RCT data in women only that TLR was significantly less common in women receiving newer-generation DES compared with those receiving BMS at three years based on analyses adjusted for difference in baseline factors, HR 0.44, 95% CI 0.31 to 0.64.52

WA - Health Technology Assessment December 11, 2015
Cardiac Stents – Re-Review: Final Evidence Report Page 21
Key Results From 2009 HTA Report Results From This 2015 Updated Report: Efficacy of Newer DES vs. BMS
1.b.1) Effectiveness(up to 4 years)- Overall population (nonrandomized studies) There was low evidence that there were no statistically significant differences in overall mortality, or cardiac mortality however there was inconsistency in the evidence with newer studies (3 of 10) suggesting lower mortality with DES. There was low evidence that there were no statistically significant differences in MI. There was low evidence that TVR was statistically significantly less common with DES
Effectiveness: This report focused on efficacy of newer DES compared with BMS based on data from RCTs; nonrandomized studies were included for safety only.

WA - Health Technology Assessment December 11, 2015
Cardiac Stents – Re-Review: Final Evidence Report Page 22
Table 6. Key Question 2a: Strength of evidence for primary efficacy outcomes
Outcome Number of Studies (N)
Strength of Evidence
Absolute Risk Effect Size (95% CI)
Conclusions
Mortality (all cause) cumulative to 12 months
4 RCTs (EXAMINATION, XIMA, ENDEAVOR II, ZEUS) (N = 5084)
⨁⨁⨁⨁ HIGH
DES 6.2%, BMS 5.9% RD 0.46% (-0.44% to 1.4%) RR 1.04 (0.84 to 1.28)
Mortality up to 12 months was similar between DES and BMS groups
Mortality (all cause) cumulative with follow-up > 12 months to 48 months
3 RCTs (BASKET PROVE, EXAMINATION ENDEAVOR II) (N= 4204)
⨁⨁⨁⨁ HIGH
DES 4.1%, BMS 4.8% RD-0.98% (-2.4% to 0.4%) RR 0.85 (0.64 to 1.12)
Mortality was similar between DES and BMS groups from 12 to 48 months
Mortality (all cause) cumulative at 36 months (women)
1 Individual patient data meta-analysis from RCT data (N = 6278)
⨁⨁◯◯ LOW
DES 5.3%, BMS 6.3% Mortality was similar for DES and BMS based on unadjusted Kaplan Meier estimates; adjusted effect size estimates were not reported.
Mortality (all cause) cumulative to 60 months
1 RCT (ENDEAVOR II) (N =1167)
⨁⨁⨁◯ MODERATE
DES 6.2% , BMS 7.6 % RD -1.3% (-4.2% to 1.6%) RR 0.8 (0.5 to 1.3)
No differences in cumulative all-cause mortality
Cardiac death at 12 months (cumulative)
4 RCTs (EXAMINATION, XIMA, ENDEAVOR, ZEUS) (N = 5084)
⨁⨁⨁⨁ HIGH
DES 4.1%, BMS 4.4% RD 0.09% (-0.44% to 1.4%) RR 1.04 (0.84, 1.28)
At 12 months cumulative risk of cardiac death was similar for DES and BMS.
Cardiac death (cumulative) at 24 months
2 RCTs (BASKET-PROVE, EXAMINATION) (N = 3037)
⨁⨁⨁◯ MODERATE
DES 2.7%, BMS 3.3% RD -1.0% (-2.0% to 0%) RR 0.8 (0.48 to 1.34)
Cardiac death risk was similar for DES and BMS recipients.
Cardiac death at 24 months (excluding periprocedura events, i.e. ≤30 days)
1 RCT (EXAMINATION) (N =1498)
⨁⨁⨁◯ MODERATE
DES 2.3 %, BMS 1.9% RD 0.4% (-0.4% to 1.8%) RR 1.2 (0.6 to 2.4)
Risk of cardiac death was similar between DES and BMS at 24 months following exclusion of periprocedureal events.
Cardiac death (cumulative) at 60 months
1 RCT (ENDEAVOR II) (N =1167)
⨁⨁⨁◯ MODERATE
DES 3.1%, BMS 3.6% RD -0.9% (-3.3% to 1.3%) RR 0.9 (0.5 to 1.6)
Risk of cardiac death was similar for DES and BMS groups at 60 months
Myocardial infarction (any, 6 months) Octogenarians
1 RCT (XIMA) (N = 800)
⨁◯◯◯ INSUFFICIENT
Cumulative to 6 months DES 3.5%, BMS 7.7 % RD -4.2% (-7.4% to -1.0%) RR 0.5 (0.4 to 1.5); 1-6 months (excluding
Cumulative risk of MI was less with use of DES compared with BMS in octogenarians at 6 months; Similarly risk of

WA - Health Technology Assessment December 11, 2015
Cardiac Stents – Re-Review: Final Evidence Report Page 23
Outcome Number of Studies (N)
Strength of Evidence
Absolute Risk Effect Size (95% CI)
Conclusions
events ≤30 days) DES 1.0%, BMS 4.2% RD -3.2% (-5.4% to -1.0%) RR 0.2 (0.8 to 0.7)
MI was less with DES after exclusion of periprocedural (<30 day) MI.
Myocardial infarction (any, cumulative) to 12 months.
3 RCTs (ZEUS, XIMA, EXAMINATION) (N = 3904)
⨁⨁◯◯ LOW
DES 2.6%, BMS 5.9 % RD -3.3 % (-7.2% to 0.6%) RR 0.44 (0.32 to 0.61)
MI was less common when DES were employed compared with BMS, however the observed association was within the limits of chance given no true difference in risk. Some heterogeneity is noted which may be due to the individual study populations.
Myocardial infarction (any, 24 months)
1 RCT (EXAMINATION) (N =1498)
⨁⨁⨁⨁ HIGH
Cumulative to 24 months DES 1.9%, BMS 2.4% RD -0.6% (-2.0% to 0.9%) RR 0.8 (0.4 to .15); Excluding events ≤ 30 days DES 1.2%%, BMS 1.2% RD -0.1% (-1.1% to 1.1% ) RR 1.0 (0.4 to 2.5)
At 24 months, there was no difference in risk of any MI between DES and BMS groups, when cumulative events were considered or when periprocedural events were excluded.
Myocardial infarction, cumulative at 36 months (women)
1 Individual patient data meta analysis of RCT data (N = 6278)
⨁⨁◯◯ LOW
DES 4.8% vs. BMS 7.7% Risk of MI was lower in women receiving DES compared with those receiving BMS (p-value, 0.03) based on unadjusted Kaplan Meier estimates; adjusted effect size estimates were not reported
Myocardial infarction - Target Vessel (12 months)
2 RCTs (EXAMINATION, ENDEAVOR II) (N = 2665)
⨁⨁⨁⨁ HIGH
Cumulative (2 trials) EXAMINATION DES 1.1%, BMS 2.0% RD -0.9 % (-2.2% to 0.3%) ENDEAVOR II DES 2.7%, BMS 3.9% RD -1.2% (-3.2% to 0.9%) Excluding events ≤30 days (1 trial) EXAMINATION DES 0.4%, BMS 0.8%
Risk of target vessel MI was similar between DES and BMS recipients up to 12 months across 2 trials and remained similar following exclusion of periprocedural events (≤ 30days) in one trial.

WA - Health Technology Assessment December 11, 2015
Cardiac Stents – Re-Review: Final Evidence Report Page 24
Outcome Number of Studies (N)
Strength of Evidence
Absolute Risk Effect Size (95% CI)
Conclusions
RD -0.4% (-1.2% to 0.4%)
Myocardial infarction - Target Vessel (>12 months)
2 RCTs (EXAMINATION, ENDEAVOR II) (N = 2665)
⨁⨁⨁⨁ HIGH
Cumulative (2 trials) EXAMINATION 24 months DES 1.5%, BMS 2.1% RD -0.7 % (-2.0% to 0.7%) ENDEAVOR II (60 months) DES 3.8%, BMS 4.8% RD -1.0% (-3.3% to 1.3%) Excluding events ≤30 days (1 trial) EXAMINATION 24 months DES 0.8%, BMS 0.9% RD -0.q% (-1.1% to 0.8%)
Risk of target vessel MI was similar between DES and BMS recipients up to 24 months in one trial and remained similar following exclusion of periprocedural events (≤ 30days) in that same trial. Similarly, there were no differences at 60 months in the other trial.
Myocardial infarction - Q-wave MI (target vessel, cumulative)
1 RCT (ENDEAVOR II) (N = 1167)
⨁⨁⨁⨁ HIGH
12 Months DES 0.3%, BMS 0.8% RD -0.5 % (-1.4% to 0.3%) RR 0.4(0.8 to 2.1); 60 months DES 0.3%, BMS 1.2% RD -0.9% (-1.9% to 0.2%) RR 0.3 (0.1 to 1.4)
There were no differences between DES and BMS in Q-wave MI at either 12 or 60 months
Myocardial infarction - non-Q-wave MI (in target vessel, cumulative)
1 RCT (ENDEAVOR II) (N = 1167)
⨁⨁⨁⨁ HIGH
12 Months DES 2.4%, BMS 3.1% RD -0.7 % (-2.5% to 1.2%) RR 0.8 (0.4 to 1.5); 60 months DES 3.5%, BMS 3.6% RD -0.1% (-2.3% to 2.0%) RR 1.0 (0.5 to 1.8)
There were no differences between DES and BMS in non-Q-wave MI at either 12 or 60 months
Nonfatal MI (cumulative) 24months
1 RCT (BASKET-PROVE) (N = 1539)
⨁⨁◯◯ LOW
DES 1.7%, BMS 2.6% RD -0.9% (-2.4% to 0.5%) RR 0.6 (0.3 to 1.3)
Nonfatal MI risk was similar between DES and BMS groups at 24 months in one trial
Nonfatal MI (cumulative) 48 months
1 RCT (ENDEAVOR II) (N = 1167)
⨁⨁⨁⨁ HIGH
DES 3.3%, BMS 4.5% RD -1.2 % (-3.4% to 1.0%) RR 0.7 (0.4 to 1.3)
Nonfatal MI risk was similar between DES and BMS groups at 48 months in one trial

WA - Health Technology Assessment December 11, 2015
Cardiac Stents – Re-Review: Final Evidence Report Page 25
Outcome Number of Studies (N)
Strength of Evidence
Absolute Risk Effect Size (95% CI)
Conclusions
Target lesion revascular-ization to 12 months
3 RCTs (EXAMINATION, ENDEAVOR II, ZEUS) (N= 4284)
⨁⨁⨁◯ MODERATE
DES 4.3%, BMS 9.2% RD -4.8% (-7.4% to - 2.1%) I2 = 68% RR 0.47 (0.37 to 0 .60)
At 12 months, significantly fewer DES recipients required revascularization compared with BMS recipients.
Target lesion revascular-ization to 24 months
2 RCTs (EXAMINATION, PRODIGY) (N = 2996)
⨁⨁◯◯ LOW
DES 6.1 %, BMS 10.2% RD -5.5% ( -12.2% to 1.2%) RR 0.5 (0.39 to 0.64)
Although TLR was less common with DES use compared with BMS, the risk difference was not statistically significant at 24 months. Differences in patient populations may partially explain heterogenity.
Target lesion revascularization to 36 months (Women)
1 Individual patient data meta-analysis (N = 6278)
⨁⨁◯◯ LOW
HR 0.44, 95% CI 0.31 to 0.64
Target-lesion revascularization was significantly less common in women receiving newer-generation DES compared with those receiving BMS at three years based on analyses adjusted for difference in baseline factors.
Target vessel revasucular-ization to 12 months
5 RCTs (EXAMINATION, ENDEAVOR II, XIMA, PRODIGY ZEUS) (N = 6582)
⨁⨁◯◯ LOW
DES 5.7%, BMS 10.6 % RD -5.1% (-6.6% to -3.5%) RR 0.51 (CI 0.43 to 0.61)
TVR was significantly less common in DES recipients compared with BMS recipients.
Target vessel revasucular-ization to 24 months
3 RCTs (BASKET-PROVE, EXAMINATION, PRODIGY (N = 4535)
⨁◯◯◯ INSUFFICIENT
DES 5.3%, BMS 7.0% RD -3.1%, -7.8% to 1.5% RR 0.65 (0.41 to 1.0)
Based on pooled risk difference, the observed association was within the limits of chance given no true difference in risk.

WA - Health Technology Assessment December 11, 2015
Cardiac Stents – Re-Review: Final Evidence Report Page 26
Table 7. Key Question 2b: Summary of Findings for Safety of DES vs. BMS
Key Results from 2009 HTA Report Results from This 2015 Updated Report: Newer DES
2.a) Safety- Overall population ARC-defined definite stent thrombosis up to 4 years: There was MODERATE evidence from meta-analysis of no statistically significant differences in stent thrombosis in studies with up to 4 years follow-up; however, small numbers of events coupled with heterogeneity across included trials suggested that estimates could change as additional data are collected. Previously published HTAs and recently published meta-analyses of up to 35 RCTS draw somewhat different conclusions. Most HTAs indicate that that there were no statistically significant differences in stent thrombosis when DES were compared with BMS, particularly at longer follow-up times, several note that studies and even some meta-analyses may have been underpowered to detect statistically significant differences between treatment groups. In the most recent meta-analysis no statistically. Based on ARC definition of definite thrombosis, rates from the most recent meta-analysis based on up to 4 years of follow-up were 1.4% for SES, 1.7% for PES and 1.2% for BMS.
Late stent thrombosis: There was MODEREATE evidence regarding this outcome. Previously published HTAs and meta-analyses of up to 35 RCTS draw somewhat different conclusions. Many HTAs concluded that significant differences between treatment groups may not have been evident because of small sample size and suggest DES are associated with long term risk of stenosis. Based on meta-analysis of RCT data, a statistically significant differences in ARC defined definite stent thrombosis was seen between > 30 days and 4 years when PES were compared with BMS., HR 2.11 (0.19, 4.23). Wide confidence intervals and moderate heterogeneity across included studies were noted. No statistically significant differences for the SES versus BMS comparison were seen for this same (or any other) time period. Rates from 5 non-randomized studies ranged from 0- 0.9% for DES and 0.1%-3.5% for BMS
Safety and adverse events:
ARC-defined definite stent thrombosis (ST): Across RCTs reporting definite stent thrombosis at any time frame there was likely insufficient power to detect differences between newer-generation DES and BMS or this rare outcome. Results from each trial individually were within the limits of chance given no true difference in risk. The timing of this outcome was variably reported across five RCTs.13,14,28,43,54 Definite ST ≤ 30 days: There is LOW evidence across three RCTs for no difference at ≤ 30 days13,14,43: A difference between DES (0.4%) and BMS 1.1%, pooled RD 0% (-2.0 % to 1.0%) was not detected likely due to lack of power. Across two registry studies rates ranged from 0.5% to 1.0% for DES and 0.9% to 1.7%.19,45 Definite ST 1 to 12 months: There is LOW evidence across two RCTs of a 0.2% risk in each group; a difference between DES and BMS was not detected likely due to lack of power.13,43
Definite ST cumulative to 12 months: Evidence across two trials was INSUFFICIENT across two RCTs13,54; a difference between DES (0.8%) and BMS (1.5%) was not detected likely due to lack of power. Individually was within the limits of chance given no true difference in risk as was the pooled RD (0% (-2.0% to 2.0 %). Evidence was LOW an individual patient data meta-analysis of RCT data in women only that definite ST up to 12 months was not similar for DES (0.5%) versus BMS (0.6%).52 It is not clear if this represents a clinically significant difference. Authors report p-values of 0.007, based on unadjusted Kaplan-Meier estimates; adjusted effect size estimates were not provided and there were substantial baseline differences between groups.

WA - Health Technology Assessment December 11, 2015
Cardiac Stents – Re-Review: Final Evidence Report Page 27
Key Results from 2009 HTA Report Results from This 2015 Updated Report: Newer DES
Bleeding: There was VERY LOW evidence from 3 case series providing cumulative incidence for bleeding ranged from 1.8%-4.0% up to 18 months of follow-up Stent fracture: There was very low evidence from 6 case series providing risk for stent fractnure of 1.9%-7.7% and one case series reported 18% in patients with in-stent stenosis
Definite ST cumulative 12 to 36 months Evidence was LOW an individual patient data meta-analysis of RCT data in women only that definite ST from 12 to 36 months was lower for DES (0.07%) versus BMS (0.3%).52 Author report p-values of 0.002, based on unadjusted Kaplan-Meier estimates; adjusted effect size estimates were not provided and there were substantial baseline differences between groups.
Bleeding: Four RCTS reported on major bleeding at any time. Across studies and time frames, risk of major bleeding was similar in those receiving DES (0.9%) and those receiving BMS (1.4%), pooled RD -0.44 (95% CI -1.1% to 0.18%).13,14,43,54 Stent Fracture: No comparative data were identified. There is INSUFFICIENT evidence from case series that the incidence of complete or partial stent fracture was reported by three series and ranged from 2.6% to 3.8% of patients (2.0% to 2.9% of lesions); all patients received an everolimus-eluting stent.27,29,30 The incidence of stent strut fracture was 8.1% (6.2% of lesions) in one study27; longitudinal stent deformation ranged from 0.2% to 1.5% in three case series.27,40,62 Stroke: Stroke was uncommon across studies and time frames (0.8% to 1.7% for DES and 0% to 1.5% for BMS) and individual studies may not have had sufficient power to detect a difference between DES and BMS.13,15,54 There were no differences in any stroke (MODERATE evidence) or ischemic stroke (LOW evidence) between newer generation DES and BMS across studies and time frames with the exception of one trial in octogenarians (XIMA) which reported a risk of 1% in DES recipients compared with 0% in BMS recipient, p =-.04) after exclusion of periprocedural stroke (LOW evidence).13 Periprocedural (≤30day): (See Table 6)- There was MODERATE evidence that there were no difference between newer DES and BMS for the following outcomes across two trials13,43: All-cause mortality

WA - Health Technology Assessment December 11, 2015
Cardiac Stents – Re-Review: Final Evidence Report Page 28
Key Results from 2009 HTA Report Results from This 2015 Updated Report: Newer DES
≤30 days, cardiac mortality ≤30 day, any myocardial infarction ≤30 days
Table 8. Key Question 2b: Strength of evidence for primary safety outcomes
Outcome Number of Studies (N)
Strength of Evidence
Effect Size Conclusions
Definite stent thrombosis ≤30 days
3 RCTs (XMAN, EXAMINATION, XIMA) (N = 2405)
⨁⨁◯ ◯ LOW
DES 0.4%, BMS 1.1% RD 0% (-2.0% to 1.0%) RR 0.95 (0.14 to 6.48);
A difference between DES and BMS was not detected likely due to lack of power. Estimates for individual trials were somewhat inconsistent, perhaps due to differences in populations.
Definite stent thrombosis ≤30 days STEMI
2 Registry studies (Garg, N = 1939; Sarno 2014, patients at risk 29,500)
⨁◯ ◯ ◯ INSUFFICIENT
DES (0.5% to 1.0%); BMS (0.9% to 1.7%)
Risk of definite stent thrombosis appears to be similar between DES and BMS across two studies, however, neither provided effect sizes and one reported p=0.20.
Definite stent thrombosis 1-12 months
2 RCTs (XIMA, EXAMINATION) (N = 2298)
⨁⨁◯ ◯ LOW
DES 0.2 %, BMS 0.2% RD 0%
This outcome was rare. There may be insufficient power to detect differences between DES and BMS in these trials.
Definite stent thrombosis cumulative to 12 months
2 RCTS (XIMA, ZEUS) (N = 1306)
⨁◯ ◯ ◯ INSUFFICIENT
DES 0.8%, BMS 1.5% RD 0% (-2.0% to 2.0 %) RR 0.95 (0.1 to 8.79);
Effect estimates for the trials were in opposite directions, but each individually was within the limits of chance given no true difference in risk as was the pooled RD. Inconsistency in effect estimates may be due to clinical differences in these populations. Sample size may be insufficient to detect differences for this rare outcome.
Definite stent thrombosis (women only) *Cumulative to 12 months *12 to 36 months
1 Individual patient data meta-analysis of RCT data (N = 6278)
⨁⨁◯ ◯ LOW
Cumulative to 12 months DES 0.5 %, BMS 0.6% 12 months to 36 months DES 0.07%, BMS 0.3%;
Risks between DES and BMS are based on unadjusted Kaplan-Meier estimates; adjusted effect size estimates were not provided and there were substantial baseline differences between groups. Although risks appear similar for DES and BMS, author report p-values of 0.007 and 0.002 for the 12 month and 12-36 month estimates respectively. It is not clear if the risk differences are clinically important.
Definite stent thrombosis
2 RCTs (BASKET-PROVE,
⨁⨁◯ ◯ LOW
DES 0.5%, BMS 1.5% RD -1.0%, (-2.0% to 0%)
Effect estimates for each trial were within the limits of chance

WA - Health Technology Assessment December 11, 2015
Cardiac Stents – Re-Review: Final Evidence Report Page 29
Outcome Number of Studies (N)
Strength of Evidence
Effect Size Conclusions
cumulative to 24 months
EXAMINATION) (n= 3037)
RR 0.36 (0.16 to 0.81)
given no true difference in risk as was the pooled risk difference estimate; sample size may be inadequate to demonstrate statistical difference.
All-cause mortality ≤30 days
2 RCTs (XIMA, EXAMINATION) (N = 2298)
⨁⨁⨁◯ MODERATE
DES 1.5%, BMS 1.7% RD -0.15% (-1.2% to 0.86%) RR 0.89(0.46 to 1.7);
Periprocedural (≤ 30 day) all-cause mortality was in similar in the DES and BMS groups.
Cardiac mortality ≤30 days
2 RCTs (XIMA, EXAMINATION) (N = 2298)
⨁⨁⨁◯ MODERATE
DES 1.1 %, BMS 1.6% RD -0.37% (-1.2% to 0.48%) RR 0.72 (0.36 to 1.46);
Periprocedural (≤ 30 day) cardiac mortality was in similar in the DES and BMS groups.
Myocardial infarction ≤30 days
2 RCTs (XIMA, EXAMINATION) (N = 2298)
⨁⨁⨁◯ MODERATE
DES 1.3%, BMS 2.0% RD -0.60% (-1.5% to 0.30%); RR 0.66 (95% CI 0.19, 1.25)
Periprocedural (≤ 30 day) MI was in similar in the DES and BMS groups
RE-infarction ≤30 days (non-randomized studies)
1 Registry study (Garg 2014) (N = 1939)
⨁◯ ◯ ◯
INSUFFICIENT
In one study, significantly fewer DES recipients experienced re-infarction (1.4% vs. 2.1% of BMS recipients, p=0.23) in patients with STEMI.
Stroke (Any) Cumulative ≤ 30 days; (Octo-genarians)
1 RCT (XIMA) (N=800)
⨁⨁◯ ◯ LOW
DES 0%, BMS 0.8% RD 0.8%, p=0.08 RR (NC)
Periprocedural stroke was rare, occurring in only three patients (BMS); it is likely that differences between groups was not detected due to low power.
Stroke (Any) 6 months and 12 months (Octo-genarians)
1 RCT (XIMA) (N=800)
⨁⨁◯ ◯ LOW
Cumulative 6 month DES 1.0 %, BMS 0.7%; RD 0.3% (-1.0% to 1.6%) 6 month excluding events ≤30 days DES 1.0 %, BMS 0%; RD 1.0%; p =0.04; Cumulative 12 months: DES 1.5%, BMS 1.2%; RD 0.3% (-1.4% to 1.9%) 12 months excluding events ≤30 days DES 1.5%, BMS 0.5%; RD 0.5% (-0.4% to 2.4%)
Cumulative stroke risk was similar between groups at six months; after exclusion of periprocedural stroke, although statistically significant, it is not clear whether the 1% RD is clinically significant. No differences were seen between DES and BMS at 12 months, regardless of exclusion of periprocedural events. Stroke was rare across time frames and sample size was likely too small to detect stable differences between stent types.
Stroke (Any) Cumulative to 48 Months
1 RCT (ENDEAVOR II) (N=1167)
⨁⨁⨁◯ MODERATE
DES 1.7 %, BMS 1.5% RD -1.2% (-3.4% to 1.0%) RR 0.7 (0.4 to 1.3) );
Risk of stroke at 48 months was similar between DES and BMS groups. There may have been insufficient power to detect differences between groups.

WA - Health Technology Assessment December 11, 2015
Cardiac Stents – Re-Review: Final Evidence Report Page 30
Outcome Number of Studies (N)
Strength of Evidence
Effect Size Conclusions
Ischemic Stroke 1 RCT at 6 months (XIMA) (N = 800); 2 RCTs at 12 months (XIMA, ZEUS) (N = 2406)
⨁⨁◯ ◯ LOW
Ischemic Stroke 6 months (Cumulative): DES 0.8%, BMS 0.7%; RD 0% (-1.2% to 1.2%) RD following exclusion of events ≤30 days: DES 0.8%, BMS 0% Ischemic stroke 12 months (Cumulative, 2 trials) DES range 0.8% to1.1%, BMS range 0%to 1.5%; RDs were similar for both trials -0.3% (-1.5% to 1.0%) and -0.4% (-1.5% to 0.7%)
There were no differences between DES and BMS were observed at either 6 or 12 months when ischemic stroke was evaluated separately or when periprocedural events were excluded from the analysis if ischemic stroke in the trial among octogenarians; Failure to detect differences between treatment may be due to lack of power
Major bleeding (any time)
4 RCTs (XIMA, XMAN, EXAMINATION, ZEUS) (N=4054)
⨁⨁⨁◯ MODERATE
DES 0.9%, BMS 1.4% RD -0.44% (-1.1% to 0.18%) RR 0.64 (0.36, 1.16)
The risk of major bleeding was similar between groups across studies and time frames
Stent Fracture and mechanical complications
5 case series (N range 136 to 1035)
⨁◯ ◯ ◯ INSUFFICIENT
Comparative data for were not available; Complete or partial stent fracture across three studies ranged from 2.6% to 3.8% of patients (2.0% to 2.9% of lesions) over 6 to 15 months of follow-up; all patients received an everolimus-eluting stent. The incidence of stent strut fracture was 8.1% (6.2% of lesions) over a mean 15-month period in one case series (N=136).Longitudinal stent deformation (mix of everolimus- and zotarolimus-eluting stents) and ranged from 1.4% to 1.5% patients over 6 to 15 month follow-up in two studies (N = 136 and 1000) and from 0.2% to 1.1% of lesions over 15 to 48 month follow-up two studies (N = 177 and 4585);). All studies associated mechanical complications such as stent fracture and longitudinal stent deformation to an increased risk of stent thrombosis

WA - Health Technology Assessment December 11, 2015
Cardiac Stents – Re-Review: Final Evidence Report Page 31
Table 9. Key Question 2c: Summary of Findings for Differential Efficacy or Safety of DES vs. BMS for primary outcomes
To evaluate the presence of differential efficacy or safety, the potential than chance may explain
differences (i.e. modification of treatment) between subgroups needs to be statistically tested via a test
for interaction in RCTs with sufficient power.
Key Results from 2009 HTA Report Results from This 2015 Updated Report: Newer DES
Differential effectiveness or safety Based on one meta-analysis, there was no modification of treatment with respect to percent stenosis (<50% vs. >50 %) for MI or TLR. No other test for differential effects was reported. Special populations Efficacy in diabetic patients: This was the primary special population with evidence described in the 2009 report. There was MODERATE evidence of a 2 fold increase in overall and cardiac morality was associated with SES use compared with BMS if patients had less than 6 months of dual anti-platelet therapy but significant differences when ≥ 6 months were used. There was MODERATE evidence that no differences in the risk of myocardial infarction regardless of dual anti-platelet therapy in the largest and most complete recent meta-analysis at up to 4 years. Two analyses with fewer trials suggest that at shorter follow-up times (6-24 months), DES may result in a lower risk of MI. There was HIGH evidence that there was a statistically significant decrease in TVR or TLR favoring DES. Safety in diabetic patients: There was low evidence from meta-analyses of no statistically significant difference in stent thrombosis by last follow-up regardless of dual anti-platelet therapy. One registry stated that in-stent thrombosis was more frequent in DES patients (2.4%-4.4%) versus BMS recipients (0.8%). Studies may be insufficiently powered to evaluate difference in rare outcomes No statistically significant differences in stent thrombosis were seen between treatments either early (0-30 days) or late (>30 days to 4 years) in
Differential effectiveness or safety Only one study in patients with STEMI (N = 1498) reported post-hoc analysis on the effect of age (≥75 (n = 245) vs. <75 years) finding no evidence of modification for primary outcomes of all-cause death (interaction p=0.092), cardiac death (interaction p= 0.277), and bleeding (interaction p=0.75) through 12 months (LOW evidence).26 Special populations Efficacy and safety in diabetic patients: No data specific to diabetic patients for the primary outcomes for this report were identified from included trials. Women: A meta-analysis of individual patient data reported adjusted estimates for TLR, finding it significantly less common (HR 0.44, 95% CI 0.313 to 0.64) in newer-generation DES recipients compared with those receiving BMS at three years (LOW evidence).52 As described under KQ 2a and b, based on unadjusted estimates at 3 years all-cause mortality was similar between groups and MI was less common with newer DES recipients. While they report stent thrombosis as being statistically different between groups at 12 months, (0.5% vs. 0.6%) it is unclear if this is clinically significant. Between 12 and 36 months, estimated risk of stent thrombosis was 0.07% for DES, 0.3% for BMS with p=0.002); the unadjusted estimates are considered at high risk of bias given substantial baseline differences in groups. Other special populations: Of the seven index trials included in this report, only two were in general (mixed) populations (ENDEAVOR II and PRODIGY).16,55 Special populations studied

WA - Health Technology Assessment December 11, 2015
Cardiac Stents – Re-Review: Final Evidence Report Page 32
Key Results from 2009 HTA Report Results from This 2015 Updated Report: Newer DES
network meta-analysis of RCTs when restricted to those who had ≥ 6 months dual anti-platelet therapy. However, wide confidence intervals indicate lack of estimate stability and small numbers of events.
included: One trial (XIMA) was in octogenarians,13 two in patients with STEMI (EXAMINATION, XMAN),14,43 one in patients with large vessels (≥ 3 mm) requiring stenting (BASKET-PROVE)28 and one in persons whose candidacy for DES was uncertain due to bleed risk concerns (ZEUS).55 For most outcomes, effect-size estimates were similar across studies and thus studies were considered together. For some outcomes noted in the report, the effect size estimates were heterogeneous, perhaps owing to the clinical differences, but other factors (e.g. stent type) may also have played a role. Where effect estimates differed and a statistical association was found, these are noted in the summary tables below and in the main report.
Key Question 2c
Only one study in patients with STEMI (N = 1498) reported post-hoc analysis on the effect of age (≥75 vs. <75 years) finding no evidence of modification for primary outcomes of all-cause death (interaction p=0.092), cardiac death (interaction p= 0.277), and bleeding (interaction p=0.75) through 12 months (LOW evidence).26 Post-hoc analyses from three RCTs evaluated modification of treatment effect by various demographic and clinical factors on composite outcomes as did one meta-analysis of individual patient data. As composites were not considered as primary outcome for this report, they are not summarized here but are described in the report.

WA - Health Technology Assessment December 11, 2015
Cardiac Stents – Re-Review: Final Evidence Report Page 33
Table 10. Key Question 2d: Summary of Findings for Cost-effectiveness of DES v. BMS
Key Results from 2009 HTA Report Results from This 2015 Updated Report:
Newer DES
Economic analyses There was very low evidence regarding the cost-effectiveness of DES versus BMS
HTA reviews of 43 cost effectiveness studies, and from 5 additional full cost effectiveness analyses suggest that DES in comparison with BMS are not cost effective across populations.
Most HTAs concluded that DES may be cost effective in selected groups of higher risk patients, with multiple risk factors, such as long lesions, narrow vessels, complex lesions, diabetics and patients recently post MI
There is significant variability with regard to methodological quality and consistency of findings across studies.
Economic analyses A moderate quality economic analysis was conducted from a U.S. healthcare provider perspective.15 Survival and quality-adjusted survival at 4 years were not statistically different between DES (zotarolimus) and BMS groups. Incremental cost-effectiveness ratios could not be calculated as there were no significant differences in key elements of these ratios. Briefly, compared with BMS, DES reduced target vessel revascularization through 4-years of follow-up with no difference in cumulative medical costs and was associated with nonsignificant differences in discounted survival and quality-adjusted survival
Table 11. Key Question 2d: Strength of evidence for formal economic evaluations.
Population Interventions Studies Time Horizon
Countries QHES Range
Overall Quality of Evidence
Conclusions
General DES (zotarolimus) BMS
ENDEAVOR II (Einstein)2009 4 year horizon
United States
87/100 Moderate Survival and quality-adjusted survival at 4 years were not statistically different among groups. Incremental cost-effectiveness ratios could not be calculated as there were no significant differences in key elements of these ratios. Briefly, compared with BMS, DES reduced TVR through 4-years of follow-up with no difference in cumulative medical costs and was associated with nonsignificant differences in discounted survival and quality-adjusted survival. . There was substantial variability (i.e., large confidence intervals) for cost and quality adjusted

WA - Health Technology Assessment December 11, 2015
Cardiac Stents – Re-Review: Final Evidence Report Page 34
Population Interventions Studies Time Horizon
Countries QHES Range
Overall Quality of Evidence
Conclusions
survival estimates.
References
1. BARI 2D Study Group, Frye RL, August P, et al. A randomized trial of therapies for type 2 diabetes and coronary artery disease. N Engl J Med 2009;360:2503-15.
2. Boden WE, O'Rourke R A, Teo KK, et al. Design and rationale of the Clinical Outcomes Utilizing Revascularization and Aggressive DruG Evaluation (COURAGE) trial Veterans Affairs Cooperative Studies Program no. 424. Am Heart J 2006;151:1173-9.
3. Boden WE, O'Rourke RA, Teo KK, et al. Optimal medical therapy with or without PCI for stable coronary disease. N Engl J Med 2007;356:1503-16.
4. Boden WE, O'Rourke RA, Teo KK, et al. Impact of optimal medical therapy with or without percutaneous coronary intervention on long-term cardiovascular end points in patients with stable coronary artery disease (from the COURAGE Trial). The American journal of cardiology 2009;104:1-4.
5. Brooks MM, Chaitman BR, Nesto RW, et al. Clinical and angiographic risk stratification and differential impact on treatment outcomes in the Bypass Angioplasty Revascularization Investigation 2 Diabetes (BARI 2D) trial. Circulation 2012;126:2115-24.
6. Brooks MM, Chung SC, Helmy T, et al. Health status after treatment for coronary artery disease and type 2 diabetes mellitus in the Bypass Angioplasty Revascularization Investigation 2 Diabetes trial. Circulation 2010;122:1690-9.
7. Bypass Angioplasty Revascularization Investigation 2 Diabetes Study G. Baseline characteristics of patients with diabetes and coronary artery disease enrolled in the Bypass Angioplasty Revascularization Investigation 2 Diabetes (BARI 2D) trial. Am Heart J 2008;156:528-36, 36 e1-5.
8. Center for Health Statistics: Washington State Department of Health. Mortality Table C2: Leading Causes of Death for Residents, 2014. In: Mortality C Leading Causes of Death Overview and Selected Causes of Death Tables 1980 - 2014, ed. Washington: Washington State Department of Health; 2015.
9. Chaitman BR, Hardison RM, Adler D, et al. The Bypass Angioplasty Revascularization Investigation 2 Diabetes randomized trial of different treatment strategies in type 2 diabetes mellitus with stable ischemic heart disease: impact of treatment strategy on cardiac mortality and myocardial infarction. Circulation 2009;120:2529-40.
10. Chaitman BR, Hartigan PM, Booth DC, et al. Do major cardiovascular outcomes in patients with stable ischemic heart disease in the clinical outcomes utilizing revascularization and aggressive drug evaluation trial differ by healthcare system? Circulation Cardiovascular quality and outcomes 2010;3:476-83.
11. Chung SC, Hlatky MA, Faxon D, et al. The effect of age on clinical outcomes and health status BARI 2D (Bypass Angioplasty Revascularization Investigation in Type 2 Diabetes). J Am Coll Cardiol 2011;58:810-9.

WA - Health Technology Assessment December 11, 2015
Cardiac Stents – Re-Review: Final Evidence Report Page 35
12. Dagenais GR, Lu J, Faxon DP, et al. Effects of optimal medical treatment with or without coronary revascularization on angina and subsequent revascularizations in patients with type 2 diabetes mellitus and stable ischemic heart disease. Circulation 2011;123:1492-500.
13. de Belder A, de la Torre Hernandez JM, Lopez-Palop R, et al. A prospective randomized trial of everolimus-eluting stents versus bare-metal stents in octogenarians: the XIMA Trial (Xience or Vision Stents for the Management of Angina in the Elderly). J Am Coll Cardiol 2014;63:1371-5.
14. Dharma S, Wardeh AJ, Soerianata S, Firdaus I, Jukema JW. A Randomized Comparison between Everolimus-Eluting Stent and Cobalt Chromium Stent in Patients with Acute ST-Elevation Myocardial Infarction Undergoing Primary Percutaneous Coronary Intervention Using Routine Intravenous Eptifibatide: The X-MAN (Xience vs. Multi-Link Stent in Acute Myocardial Infarction) Trial, A Pilot Study. Int J Angiol 2014;23:93-100.
15. Eisenstein EL, Wijns W, Fajadet J, et al. Long-Term Clinical and Economic Analysis of the Endeavor Drug-Eluting Stent Versus the Driver Bare-Metal Stent. 4-Year Results From the ENDEAVOR II Trial (Randomized Controlled Trial to Evaluate the Safety and Efficacy of the Medtronic AVE ABT-578 Eluting Driver Coronary Stent in De Novo Native Coronary Artery Lesions). JACC: Cardiovascular Interventions 2009;2:1178-87.
16. Fajadet J, Wijns W, Laarman GJ, et al. Long-term follow-up of the randomised controlled trial to evaluate the safety and efficacy of the zotarolimus-eluting driver coronary stent in de novo native coronary artery lesions: five year outcomes in the ENDEAVOR II study. EuroIntervention 2010;6:562-7.
17. Favarato D, Hueb W, Gersh BJ, et al. Relative cost comparison of treatments for coronary artery disease: the First Year Follow-Up of MASS II Study. Circulation 2003;108 Suppl 1:II21-3.
18. Favarato ME, Hueb W, Boden WE, et al. Quality of life in patients with symptomatic multivessel coronary artery disease: a comparative post hoc analyses of medical, angioplasty or surgical strategies-MASS II trial. Int J Cardiol 2007;116:364-70.
19. Garg A, Brodie BR, Stuckey TD, et al. New generation drug-eluting stents for ST-elevation myocardial infarction: a new paradigm for safety. Catheter Cardiovasc Interv 2014;84:955-62.
20. Gomez-Lara J, Brugaletta S, Gomez-Hospital JA, et al. Everolimus-eluting stent versus bare metal stent in proximal left anterior descending ST-elevation myocardial infarction: insights from the EXAMINATION trial. Am Heart J 2013;166:119-26.
21. Hambrecht R, Walther C, Mobius-Winkler S, et al. Percutaneous coronary angioplasty compared with exercise training in patients with stable coronary artery disease: a randomized trial. Circulation 2004;109:1371-8.
22. Hlatky MA, Boothroyd DB, Melsop KA, et al. Economic outcomes of treatment strategies for type 2 diabetes mellitus and coronary artery disease in the Bypass Angioplasty Revascularization Investigation 2 Diabetes trial. Circulation 2009;120:2550-8.
23. Hueb W, Lopes N, Gersh BJ, et al. Ten-year follow-up survival of the Medicine, Angioplasty, or Surgery Study (MASS II): a randomized controlled clinical trial of 3 therapeutic strategies for multivessel coronary artery disease. Circulation 2010;122:949-57.
24. Hueb W, Lopes NH, Gersh BJ, et al. Five-year follow-up of the Medicine, Angioplasty, or Surgery Study (MASS II): a randomized controlled clinical trial of 3 therapeutic strategies for multivessel coronary artery disease. Circulation 2007;115:1082-9.

WA - Health Technology Assessment December 11, 2015
Cardiac Stents – Re-Review: Final Evidence Report Page 36
25. Hueb W, Soares PR, Gersh BJ, et al. The medicine, angioplasty, or surgery study (MASS-II): a randomized, controlled clinical trial of three therapeutic strategies for multivessel coronary artery disease: one-year results. J Am Coll Cardiol 2004;43:1743-51.
26. Ielasi A, Brugaletta S, Silvestro A, et al. Everolimus-eluting stent versus bare-metal stent in elderly ((greater-than or equal to) 75 years) versus non-elderly (< 75 years) patients with ST-elevation myocardial infarction undergoing primary percutaneous coronary intervention: Insights from the examination trial. International Journal of Cardiology 2015;179:73-8.
27. Inaba S, Mintz GS, Yun KH, et al. Mechanical complications of everolimus-eluting stents associated with adverse events: an intravascular ultrasound study. EuroIntervention 2014;9:1301-8.
28. Kaiser C, Galatius S, Erne P, et al. Drug-eluting versus bare-metal stents in large coronary arteries. N Engl J Med 2010;363:2310-9.
29. Kuramitsu S, Hiromasa T, Enomoto S, et al. Incidence and Clinical Impact of Stent Fracture After PROMUS Element Platinum Chromium Everolimus-Eluting Stent Implantation. JACC Cardiovasc Interv 2015;8:1180-8.
30. Kuramitsu S, Iwabuchi M, Haraguchi T, et al. Incidence and clinical impact of stent fracture after everolimus-eluting stent implantation. Circ Cardiovasc Interv 2012;5:663-71.
31. Lima EG, Hueb W, Garcia RM, et al. Impact of diabetes on 10-year outcomes of patients with multivessel coronary artery disease in the Medicine, Angioplasty, or Surgery Study II (MASS II) trial. Am Heart J 2013;166:250-7.
32. Lloyd-Jones D, Adams RJ, Brown TM, et al. Heart disease and stroke statistics--2010 update: a report from the American Heart Association. Circulation 2010;121:e46-e215.
33. Lopes NH, Paulitsch FS, Pereira AC, et al. Impact of metabolic syndrome on the outcome of patients with stable coronary artery disease: 2-year follow-up of the MASS II study. Coron Artery Dis 2008;19:383-8.
34. Mancini GB, Bates ER, Maron DJ, et al. Quantitative results of baseline angiography and percutaneous coronary intervention in the COURAGE trial. Circulation Cardiovascular quality and outcomes 2009;2:320-7.
35. Mancini GB, Hartigan PM, Bates ER, et al. Angiographic disease progression and residual risk of cardiovascular events while on optimal medical therapy: observations from the COURAGE Trial. Circ Cardiovasc Interv 2011;4:545-52.
36. Maron DJ, Boden WE, O'Rourke RA, et al. Intensive multifactorial intervention for stable coronary artery disease: optimal medical therapy in the COURAGE (Clinical Outcomes Utilizing Revascularization and Aggressive Drug Evaluation) trial. J Am Coll Cardiol 2010;55:1348-58.
37. Maron DJ, Boden WE, Spertus JA, et al. Impact of metabolic syndrome and diabetes on prognosis and outcomes with early percutaneous coronary intervention in the COURAGE (Clinical Outcomes Utilizing Revascularization and Aggressive Drug Evaluation) trial. J Am Coll Cardiol 2011;58:131-7.
38. Pedersen SH, Pfisterer M, Kaiser C, et al. Drug-eluting stents and bare metal stents in patients with NSTE-ACS: 2-year outcome from the randomised BASKET-PROVE trial. EuroIntervention 2014;10:58-64.
39. Piao ZH, Jeong MH, Li Y, et al. Comparison of second-generation drug-eluting versus bare-metal stents in octogenarian patients with ST-segment elevation myocardial infarction. Int J Cardiol 2014;177:1081-4.

WA - Health Technology Assessment December 11, 2015
Cardiac Stents – Re-Review: Final Evidence Report Page 37
40. Pitney M, Pitney K, Jepson N, et al. Major stent deformation/pseudofracture of 7 Crown Endeavor/Micro Driver stent platform: incidence and causative factors. EuroIntervention 2011;7:256-62.
41. Rezende PC, Hueb W, Garzillo CL, et al. Ten-year outcomes of patients randomized to surgery, angioplasty, or medical treatment for stable multivessel coronary disease: effect of age in the Medicine, Angioplasty, or Surgery Study II trial. The Journal of thoracic and cardiovascular surgery 2013;146:1105-12.
42. Sabate M, Brugaletta S, Cequier A, et al. The EXAMINATION trial (Everolimus-Eluting Stents Versus Bare-Metal Stents in ST-Segment Elevation Myocardial Infarction): 2-year results from a multicenter randomized controlled trial. JACC Cardiovasc Interv 2014;7:64-71.
43. Sabate M, Cequier A, Iniguez A, et al. Everolimus-eluting stent versus bare-metal stent in ST-segment elevation myocardial infarction (EXAMINATION): 1 year results of a randomised controlled trial. Lancet 2012;380:1482-90.
44. Sarno G, Lagerqvist B, Frobert O, et al. Lower risk of stent thrombosis and restenosis with unrestricted use of 'new-generation' drug-eluting stents: a report from the nationwide Swedish Coronary Angiography and Angioplasty Registry (SCAAR). Eur Heart J 2012;33:606-13.
45. Sarno G, Lagerqvist B, Nilsson J, et al. Stent thrombosis in new-generation drug-eluting stents in patients with STEMI undergoing primary PCI: a report from SCAAR. J Am Coll Cardiol 2014;64:16-24.
46. Sedlis SP, Jurkovitz CT, Hartigan PM, et al. Optimal medical therapy with or without percutaneous coronary intervention for patients with stable coronary artery disease and chronic kidney disease. The American journal of cardiology 2009;104:1647-53.
47. Sedlis SP, Jurkovitz CT, Hartigan PM, et al. Health status and quality of life in patients with stable coronary artery disease and chronic kidney disease treated with optimal medical therapy or percutaneous coronary intervention (post hoc findings from the COURAGE trial). The American journal of cardiology 2013;112:1703-8.
48. Shah B, Srinivas VS, Lu J, et al. Change in enrollment patterns, patient selection, and clinical outcomes with the availability of drug-eluting stents in the Bypass Angioplasty Revascularization Investigation 2 Diabetes trial. Am Heart J 2013;166:519-26.
49. Shaw LJ, Berman DS, Maron DJ, et al. Optimal medical therapy with or without percutaneous coronary intervention to reduce ischemic burden: results from the Clinical Outcomes Utilizing Revascularization and Aggressive Drug Evaluation (COURAGE) trial nuclear substudy. Circulation 2008;117:1283-91.
50. Shaw LJ, Weintraub WS, Maron DJ, et al. Baseline stress myocardial perfusion imaging results and outcomes in patients with stable ischemic heart disease randomized to optimal medical therapy with or without percutaneous coronary intervention. Am Heart J 2012;164:243-50.
51. Soares PR, Hueb WA, Lemos PA, et al. Coronary revascularization (surgical or percutaneous) decreases mortality after the first year in diabetic subjects but not in nondiabetic subjects with multivessel disease: an analysis from the Medicine, Angioplasty, or Surgery Study (MASS II). Circulation 2006;114:I420-4.
52. Stefanini GG, Baber U, Windecker S, et al. Safety and efficacy of drug-eluting stents in women: a patient-level pooled analysis of randomised trials. Lancet 2013;382:1879-88.

WA - Health Technology Assessment December 11, 2015
Cardiac Stents – Re-Review: Final Evidence Report Page 38
53. Teo KK, Sedlis SP, Boden WE, et al. Optimal medical therapy with or without percutaneous coronary intervention in older patients with stable coronary disease: a pre-specified subset analysis of the COURAGE (Clinical Outcomes Utilizing Revascularization and Aggressive druG Evaluation) trial. J Am Coll Cardiol 2009;54:1303-8.
54. Valgimigli M, Patialiakas A, Thury A, et al. Zotarolimus-eluting versus bare-metal stents in uncertain drug-eluting stent candidates. J Am Coll Cardiol 2015;65:805-15.
55. Valgimigli M, Tebaldi M, Borghesi M, et al. Two-year outcomes after first- or second-generation drug-eluting or bare-metal stent implantation in all-comer patients undergoing percutaneous coronary intervention: a pre-specified analysis from the PRODIGY study (PROlonging Dual Antiplatelet Treatment After Grading stent-induced Intimal hyperplasia studY). JACC Cardiovasc Interv 2014;7:20-8.
56. Vieira RD, Hueb W, Hlatky M, et al. Cost-effectiveness analysis for surgical, angioplasty, or medical therapeutics for coronary artery disease: 5-year follow-up of medicine, angioplasty, or surgery study (MASS) II trial. Circulation 2012;126:S145-50.
57. Walther C, Mobius-Winkler S, Linke A, et al. Regular exercise training compared with percutaneous intervention leads to a reduction of inflammatory markers and cardiovascular events in patients with coronary artery disease. Eur J Cardiovasc Prev Rehabil 2008;15:107-12.
58. Weichman KE, Broer PN, Thanik VD, et al. Patient-Reported Satisfaction and Quality of Life following Breast Reconstruction in Thin Patients: A Comparison between Microsurgical and Prosthetic Implant Recipients. Plastic and reconstructive surgery 2015;136:213-20.
59. Weintraub WS, Barnett P, Chen S, et al. Economics methods in the Clinical Outcomes Utilizing percutaneous coronary Revascularization and Aggressive Guideline-driven drug Evaluation (COURAGE) trial. Am Heart J 2006;151:1180-5.
60. Weintraub WS, Boden WE, Zhang Z, et al. Cost-effectiveness of percutaneous coronary intervention in optimally treated stable coronary patients. Circulation Cardiovascular quality and outcomes 2008;1:12-20.
61. Weintraub WS, Spertus JA, Kolm P, et al. Effect of PCI on quality of life in patients with stable coronary disease. N Engl J Med 2008;359:677-87.
62. Williams PD, Mamas MA, Morgan KP, et al. Longitudinal stent deformation: a retrospective analysis of frequency and mechanisms. EuroIntervention 2012;8:267-74.
63. Zhang Z, Kolm P, Boden WE, et al. The cost-effectiveness of percutaneous coronary intervention as a function of angina severity in patients with stable angina. Circulation Cardiovascular quality and outcomes 2011;4:172-82.

WA - Health Technology Assessment December 11, 2015
Cardiac Stents – Re-Review: Final Evidence Report Page 39
1. Appraisal
1.1. Rationale
Cardiac stents provide one option for treating coronary artery disease. Since their inception, they have become used widely for a variety of indications and lesion characteristics and much research has been done on both BMS and a variety of DES. The literature overall is voluminous and complex. The technology has undergone rapid change in the past decade. In the spring of 2009, a health technology assessment comparing DES with BMS was completed for the State of Washington Health Technology Assessment Program. At that time, the majority of studies focused on first generation DES using sirolumus or paclitaxel as the antiproliferative agents embedded in permanent polymer coatings. These coatings have been associated with inflammation and local toxicity. Most of these stents have now been withdrawn from the market. Since the publication of the 2009 report, studies evaluating newer (2nd generation) DES have been published suggesting improved efficacy and safety with the use of newer DES. The second generation stents are thinner, may have permanent or biodgradeable coatings and employ newer antiproliferative agents (zotarolimus, everlimus). Compared with first generation DES, more recent literature suggest that these newer DES may have improved efficacy and safety. An update to the 2009 HTA report was therefore commissioned to evaluate the latest evidence on FDA approved newer, FDA-approved second generation DES to assess the latest evidence comparing these stents to bare metal stents and to evaluate the efficacy, safety and cost-effectiveness of stenting versus optimal medical therapy in patients with stable CAD. The key questions listed below were posted for public comment in July 2014; no comments were received.
The current report provides a snap shot of the technology and it is recognized that, as with all technologies, reports in the medical research literature lag a bit behind the changes in clinical practice.
1.2. Key Questions
1. In patients with stable CAD:
a. Is PCI with stenting and medical therapy more effective than medical therapy in reducing death and MI and/or improving symptoms, functional status and health-related quality of life? Does the effect vary by (a) BMS versus medical therapy (b) DES versus medical therapy
b. What is the comparative safety of PCI with stenting versus medical therapy (including evaluation of bleeding, renal insufficiency and serious adverse events such as nonfatal MI, death)?
c. If there is benefit to PCI compared with medical therapy alone, is there evidence of differential benefit or harm based on specific patient characteristics or subgroups (e.g. sex, diabetes, left main CAD, age)
d. What is the evidence of cost-effectiveness of PCI with stenting versus medical therapy?
2. In patients with CAD (stable or unstable presentation) is there updated evidence subsequent to the previous (May 2009) report that
a. Newer generation DES are more efficacious than BMS in reducing MI and death and/or improving symptoms, functional status and patient quality of life?
b. Newer generation DES are safer than BMS (including evaluation of thrombosis, serious adverse events)?

WA - Health Technology Assessment December 11, 2015
Cardiac Stents – Re-Review: Final Evidence Report Page 40
c. There is differential efficacy or safety of newer generation DES versus BMS based on specific patient characteristics or subgroups (e.g. sex, diabetes, left main CAD, age)
d. Newer generation DES are more cost effective than BMS
Figure 1. Analytic framework
BMS: bare metal stents; CAD: coronary artery disease; DES: drug-eluting stents.

WA - Health Technology Assessment December 11, 2015
Cardiac Stents – Re-Review: Final Evidence Report Page 41
1.3. Outcomes Assessed
A list of the outcome measures used in studies included in this report is provided in Table 1.
Table 1. Outcome measures used in included studies
Measure
PRO or CRO
Instrument
Type
Reported
in These
RCTs
Components
Score Range Interpretation Validity & Reliability MCID
Seattle Angina Questionnaire (SAQ) PRO Disease
Specific
Weintraub
2008
(COURAGE)
5 subscales (19 items)
Physical limitation (PL)
Anginal stability (AS)
Anginal frequency (AF)
Treatment Satisfaction (TS)
Disease Perception (DP)
Score range: 0-100 for each
subscales, no summary score
Higher score =
better quality
of life
Intraclass correlation coefficients
120:
PL: 0.83
AS: 0.24
AF: 0.76
TS: 0.44
DP: 0.78
Internal consistency reliability (Cronbach’s alpha)
62:
PL: 0.91
AS: NA
AF: 0.69
TS: 0.72
DP: 0.67
10
points*119,120
RAND-36 PRO General Health
Weintraub
2008
(COURAGE)
8 subscales (35 items):
Physical functioning (10 items)
Role limitations due to physical health (4 items)
Role limitations due to emotional health (3 items)
Energy / fatigue (4 items)
Emotional well-being/ mental health (5 items)
Social functioning (2 items)
Pain (2 items)
General health (5 items)
Score range: 0-100
Higher score =
more
favorable
health state
Alpha values133
:
Physical functioning 0.92
Role- physical: 0.90
Role- emotional: 0.86
Vitality: 0.82
Mental health: 0.85
Social functioning: 0.71
Pain: 0.88
General health: 0.81
Mann-Whitney U Test
142:
Summary Scores:
Physical Summary: 448.0
Mental Summary: 976.0
3-5 points104

WA - Health Technology Assessment December 11, 2015
Cardiac Stents – Re-Review: Final Evidence Report Page 42
Measure
PRO or CRO
Instrument
Type
Reported
in These
RCTs
Components
Score Range Interpretation Validity & Reliability MCID
(NS)
Not significant (NS) when p>0.005 Pearson correlation between mental health component in a Multiple Sclerosis Population
87:
Expanded Disability Status Scale (EDSS): -0.4
SF-36 mental: 0.88
Pearson correlation between physical health component in a Multiple Sclerosis Population
87:
EDSS: -0.58
SF-36 physical: 0.95
Modified RAND PRO General Health
Brooks
2010
(BARI-2D)
3 subscales (10 items):
Health distress (4 items)
Energy (5 items)
Self-rated Health (1 item)
Score range: 0-100 for each subscale
Higher score =
more
favorable
health state
NR 5 points76
Medical Outcomes Study 36-Item Short-Form Health Survey (SF-36) PRO General Health
Hueb 2004,
2007, 2010
(MASS-II)
8 subscales (36 items):
Physical functioning
Bodily pain
Physical role limitations
General health
Vitality
Social functioning
Emotional role limitations
Mental health
Lower score =
greater
disability
Cronbach’s alpha: >0.75
Intraclass correlation coefficient: 0.28
29
NR
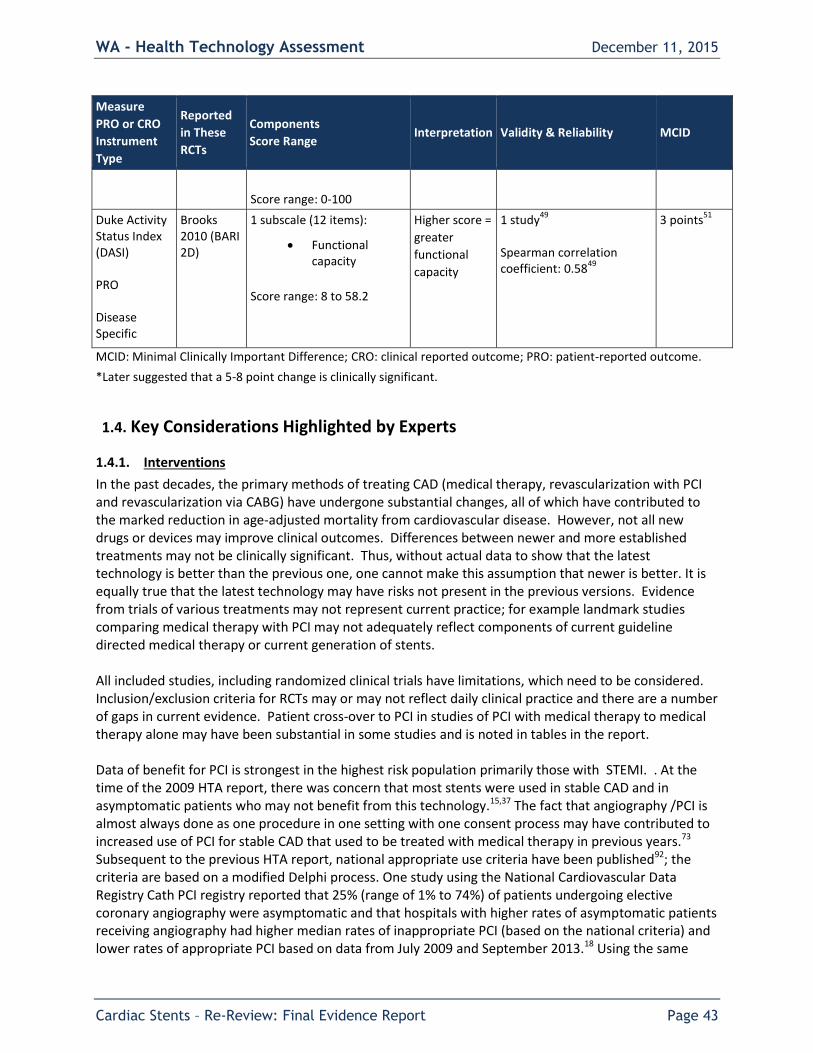
WA - Health Technology Assessment December 11, 2015
Cardiac Stents – Re-Review: Final Evidence Report Page 43
Measure
PRO or CRO
Instrument
Type
Reported
in These
RCTs
Components
Score Range Interpretation Validity & Reliability MCID
Score range: 0-100
Duke Activity Status Index (DASI) PRO Disease Specific
Brooks 2010 (BARI 2D)
1 subscale (12 items):
Functional capacity
Score range: 8 to 58.2
Higher score =
greater
functional
capacity
1 study49
Spearman correlation coefficient: 0.58
49
3 points51
MCID: Minimal Clinically Important Difference; CRO: clinical reported outcome; PRO: patient-reported outcome.
*Later suggested that a 5-8 point change is clinically significant.
1.4. Key Considerations Highlighted by Experts
1.4.1. Interventions
In the past decades, the primary methods of treating CAD (medical therapy, revascularization with PCI and revascularization via CABG) have undergone substantial changes, all of which have contributed to the marked reduction in age-adjusted mortality from cardiovascular disease. However, not all new drugs or devices may improve clinical outcomes. Differences between newer and more established treatments may not be clinically significant. Thus, without actual data to show that the latest technology is better than the previous one, one cannot make this assumption that newer is better. It is equally true that the latest technology may have risks not present in the previous versions. Evidence from trials of various treatments may not represent current practice; for example landmark studies comparing medical therapy with PCI may not adequately reflect components of current guideline directed medical therapy or current generation of stents. All included studies, including randomized clinical trials have limitations, which need to be considered. Inclusion/exclusion criteria for RCTs may or may not reflect daily clinical practice and there are a number of gaps in current evidence. Patient cross-over to PCI in studies of PCI with medical therapy to medical therapy alone may have been substantial in some studies and is noted in tables in the report. Data of benefit for PCI is strongest in the highest risk population primarily those with STEMI. . At the time of the 2009 HTA report, there was concern that most stents were used in stable CAD and in asymptomatic patients who may not benefit from this technology.15,37 The fact that angiography /PCI is almost always done as one procedure in one setting with one consent process may have contributed to increased use of PCI for stable CAD that used to be treated with medical therapy in previous years.73 Subsequent to the previous HTA report, national appropriate use criteria have been published92; the criteria are based on a modified Delphi process. One study using the National Cardiovascular Data Registry Cath PCI registry reported that 25% (range of 1% to 74%) of patients undergoing elective coronary angiography were asymptomatic and that hospitals with higher rates of asymptomatic patients receiving angiography had higher median rates of inappropriate PCI (based on the national criteria) and lower rates of appropriate PCI based on data from July 2009 and September 2013.18 Using the same

WA - Health Technology Assessment December 11, 2015
Cardiac Stents – Re-Review: Final Evidence Report Page 44
registry, another study reports a decrease in the proportion of non-acute PCI from 26.2% to 13.3% between July 2009 and December 31, 2014.31 Within Washington State, a recent study reported a 6.8% decrease in the overall number of PCI performed between 2010 through 2013 as well as significant decreases in use of “elective” PCI (43%) and proportion of in appropriate PCI (16% to 13%).17 More recent data from the COAP website (http://www.coap.org/COAPPublicReporting/) over the last two quarters of 2014 and first two quarter of 2015, among sites with at least 50 PCI cases per quarter shows a range of elective (non-acute) PCI from 0% to 72% and proportion of procedures reported as not classified based on the national criteria of 0 to 25%. Variation across sites may in part due to difference in reporting. The 2012 ACCF/AHA guideline on diagnosis and management of stable ischemic heart disease outlines current treatment recommendations. This and other pertinent guidelines are summarized elsewhere in this report. In general, patients who do not have acute coronary syndrome will have some sort of noninvasive functional stress testing to stratify patients at higher risk of mortality and myocardial infarction. Per the guidelines, all patients with CAD should receive guideline directed medical therapy and patient education. As stated in the 2012 guideline “Revascularization recommendations have been formulated to address issues related to 1) improved survival and/or 2) improved symptoms”.39 In stable patients with moderate or severe ischemia, there is uncertainty regarding the extent to which routine revascularization (in addition to guideline directed medical therapy) impacts quality of life or decreased death or MI verses guideline directed medical therapy alone; opinions on both sides are strong and evidence has been used to support both perspectives.123 The ongoing ISCHEMIA trial will likely provide insights into this but will not be completed until 2019. Current ACCF/AHA guidelines indicate that in general, consideration of improved survival takes precedence over improved symptoms. While invasive coronary angiography (ICA) is the standard method of determining coronary artery obstruction to guide stent placement, there is substantial interobserver variability and it does not distinguish between vulnerable plaque and stable plaque, nor does it provide information on the functional impact of obstruction. Adjunctive diagnostic methods such as intravascular ultrasound (IVUS) and optical coherence tomography (OCT) can enhance visualization of coronary anatomy and determination of fractional flow reserve (FFR) facilitates determination of the functional significance of the observed obstruction. The use of FFR to guide decision making regarding stent use in patients with stable CAD does not appear to be routine practice, with anecdotal estimates of its use in 10%-15% of procedures. The 2014 update to the ACCF/AHA guideline on stable CAD38 considered results newer date from the Fractional Flow Reserve versus Angiography for Multivessel Evaluation 2 Trial (FAME 2) described for context below, but did not alter the recommendations in the full 2012 guideline text. The 2014 update states that: “FFR can assess the hemodynamic significance of angiographically “intermediate” or “indeterminant” lesions and allows one to decide when PCI may be beneficial or safely deferred” and that several studies suggest “a PCI strategy guided by FFR may be superior to a strategy guided by angiography alone.” Fractional flow reserve (FFR) is defined as the ratio of maximal achievable blood flow in an obstructed vessel to the hypothetical maximal achievable blood flow in the same vessel in the absence of obstruction, with 1 considered to be a “normal” ratio. The ACCF/AHA guideline recommendations about revascularization consider coronary stenoses with FFR ≤ 0.80 to be considered to be “significant”. The Fractional Flow Reserve versus Angiography for Multivessel Evaluation 2 (FAME 2) randomized controlled trial compared FFR-guided PCI using second generation DES plus medical therapy versus

WA - Health Technology Assessment December 11, 2015
Cardiac Stents – Re-Review: Final Evidence Report Page 45
medical therapy alone in 888 stable CAD patients with at least one large epicardial vessel stenosis with an FFR of ≤ 0.80. It is described here for context; data on the primary outcomes of interest for this HTA report are found in Appendix Table G10. There were no differences between FFR-guided PCI with medical therapy versus medical therapy alone for the following primary outcomes: All –cause mortality (24 month HR 0.74, 95% CI 0.26 to 2.14), cardiac death (24 month HR 0.99, 95% CI 0.20 to 4.90), MI (after the periprocedural period to 24 months 0.85, 95% CI 0.50 to 1.45) or stroke (24 month HR 1.74, 95% CI 0.51 to 5.94). With regard to the intermediate outcome of revascularization, FFR-guided PCI was associated with significantly lower risk of any revascularization (24 month HR 0.16, 95% CI 0.11 to 0.22) and urgent revascularization (24 month HR 0.23, 95% CI 0.14 to 0 .38). Frequency of MI within the first seven days was 2% for FFR-PCI patients and 0.9% for medical therapy patients. The frequency of serious cardiovascular events was 17% in the FFR-PCI group compared with 25.4% of the medical therapy group. There was substantial cross –over from medical therapy to PCI (40%) and the study may have lacked sufficient power to detect the primary clinical outcomes of death or MI. Authors did not report definite stent thrombosis or on health-related quality of life measures. (See Appendix G, Table G10).
1.4.2. Costs
Subsequent to the 2009 report, experts have indicated that the price differential between DES and BMS has narrowed and may be only a few hundred dollars and that clopidogrel is not available generically thus reducing the cost of dual antiplatelet therapy. Evaluation of cost-effectiveness is a complex process and historically there have been conflicting results across studies comparing older generation DES and BMS. Better efficacy and safety of second-generation DES may improve cost-effectiveness of DES compared with BMS. Some experts have questioned the cost effectiveness PCI with medical therapy versus medical therapy alone if there are no differences in survival and effect sizes related to symptom relief are small and of short duration.72
1.4.3. Patient considerations
Management of patients with CAD is complex and there are a number of controversies regarding how to best manage patients with stable CAD in particular.123 Based on current clinical guidelines, treatment of stable CAD focuses on minimizing mortality and maximizing patient quality of life. Guideline directed medical therapy is considered the foundation of CAD treatment, but may not be sufficient to relieve symptoms and revascularization may be considered. Adherence to GDMT, including medication and lifestyle changes may be challenge to some patients and medications may have side effects that lead to lack of adherence. Relief of symptoms and a desire to avoid extensive procedures may be the most important factors to patients. Placement of stents during angiography instead of having a separate procedure may be attractive to many patients. Patients may have an inaccurate or incomplete understanding of the benefits and risks of PCI compared with alternative treatments.72,101 Groups such as the Foundation for Medical Decision Making (FMDM) and Health Dialog have developed and use patient decision making aids for stable CAD. Shared decision making with the patient should involve surgeons as well as internationalists and include detail of the benefits and risks associated with treatment alternatives. The current ACCF/AHA guidelines suggest a multidisciplinary “heart team” approach to decision making39 that includes interventional cardiologist as well as a cardiac surgeon. The team reviews the patient’s condition and coronary anatomy to determine feasibility of revascularization and discusses revascularization options with the patient prior to selection of treatment strategy.

WA - Health Technology Assessment December 11, 2015
Cardiac Stents – Re-Review: Final Evidence Report Page 46
1.4.4. Professional and ethical considerations
The American College of Cardiology Foundation (ACCF) Appropriateness Criteria Task force, together with the American Heart Association (AHA), Society for Cardiovascular Angiography and Interventions (SCAI), have shown leadership in the development of professional guidelines in general, and in guidelines for use of PCI in particular. These are summarized in this report. Patients often sign a consent for “cardiac catheterization, possible PCI” without understanding the benefits and risk of their treatment choices – medical therapy, PCI and CABG. Generally, the consent for PCI is obtained before the patient is sedated for the cardiac catheterization, and the patient is not woken up to discuss treatment options before proceeding to PCI in the same catheter lab setting. Some have suggested that catheter and PCI should not be done as one procedure, to allow an informed discussion of patient choices after anatomy is determined by angiography. The SYNTAX trial provides a possible model for patient risk assessment and cross-disciplinary evaluation of treatment options.110

WA - Health Technology Assessment December 11, 2015
Cardiac Stents – Re-Review: Final Evidence Report Page 47
1.5. Washington State Utilization and Cost Data
Parameters: This cardiovascular stent analysis includes utilization data from the:
Public Employees Benefit Board Uniform Medical Plan, (PEBB/UMP)
PEBB Medicare
Department of Labor and Industries (L&I); and
Medicaid Fee for Service and Managed Care
The analysis periods for the populations are PEBB and L&I: calendar year 2011 through 2014.
Population primary inclusion criteria included: age was greater than 17 years old at time of service AND one of the following:
CPT/MS-DRGs/ICD-9 Proc codes: M246, M347, M248, M249; or 36.06 or 36.07; or one of the following CPTs alone or in conjunction with one of the following HCPCS:
92980 92933 92941 G0291 G0291 C9607
92981 92934 92943 C9600 C9600 C9608
92928 92937 92944 C9601 C9601
92929 92938 G0290 C9602 C9602
Codes were identified as drug-eluting (drug) or non-drug-eluting (bare). Coding was inclusive in order to account for code updates in 2013.
Costs included all professional, inpatient, and ancillary claims for the MS-DRG/CPT/ICD-9 proc.
Claims that included a $0 allowed amount and a $0 paid were excluded.
Table 1 PEBB/UMP
Population: Members Number and Distribution by Gender and by Age Cohort
2011 2012 2013 2014
Total PEBB Members 227,755 230,723 239,855 246,950
% PEBB/UMP Members >17 yrs
171,071 (84%)
194,688 (84%)
202,223 (84%)
208,330 (84%)
Gender All Males (%) 45% 45% 45% 45%
All Females (%) 55% 55% 55% 55%

WA - Health Technology Assessment December 11, 2015
Cardiac Stents – Re-Review: Final Evidence Report Page 48
Table 2
Medicaid Fee-for-Service and Managed Care Population: Members
Number and Distribution by Gender and by Age Cohort
2011 2012 2013 2014
Total Medicaid 1,342,639 1,344,853 1,367,708 1,774,651
% Medicaid Members >17 yrs
519,971 (39%)
517,451 (38%)
529,666 (39%)
905,451 (51%)
Gender All Males (%) 32% 33% 33% 41%
All Females (%) 68% 67% 67% 59%
Table 3
PEBB/UMP Utilization: Cardiac Stents 2011 – 2014 (Does not include Medicare)
Year Type Stent
Unique Patients
Procedures Submitted Amt (Rounded)
Allowed Amt (Rounded)
Paid Amt (Rounded)
AveragePd/ Procedure
2011 Bare 22 23 $1,647,000 $827,000 $796,000 $35,992
Drug 108 110 $10,142,000 $3,979,000 $3,765,000 $36,181
2011 Total 130 133 $11,790,000 $4,807,000 $45,617,000 $36,148
2012 Bare 19 19 $1,504,000 $598,000 $591,000 $31,503
Drug 122 126 $9,600,000 $4,395,000 $4,279,000 $34,885
2012 Total 141 145 $11,104,000 $4,994,000 $4,871,000 $34,442
2013 Bare 10 10 $839,000 $312,000 $308,000 $31,242
Drug 106 109 $9,447,000 $3,555,000 $3,451,000 $32,621
2013 Total 116 119 $10,287,000 $3,868,000 $3,760,000 $32,505
2014 Bare 13 13 $1,055,000 $400,000 $396,000 $30,792
Drug 83 88 $8,271,000 $3,385,000 $3,338,000 $38,467
2014 Total 96 101 $9,326,000 $3,785,000 $3,735,000 $37,480

WA - Health Technology Assessment December 11, 2015
Cardiac Stents – Re-Review: Final Evidence Report Page 49
Table 4 PEBB Medicare
Utilization: Cardiac Stents 2011 – 2014
Year Type Stent
Unique Patients
Procedures Submitted Amt
(Rounded) Allowed Amt
(Rounded) Paid Amt1 (Rounded)
Average Pd/ Procedure
2011 Bare 24 24 $2,123,635 $196,995 $27,574 $8,208
Drug 100 101 $9,366,103 $624,784 $152,731 $6,186
2011 Total 124 125 $11,489,738 $821,779 $180,305 $6,574
2012 Bare 24 25 $2,077,195 $402,231 $28,900 $16,089
Drug 112 114 $10,389,837 $1,804,521 $132,192 $15,829
2012 Total 136 139 $12,467,032 $2,206,752 $161,092 $15,876
2013 Bare 12 13 $1,095,895 $171,540 $15,392 $13,195
Drug 103 107 $9,727,086 $1,732,715 $126,688 $16,194
2013 Total 115 120 $10,822,981 $1,904,255 $142,080 $15,869
2014 Bare 17 17 $1,473,063 $270,901 $20,672 $15,935
Drug 91 91 $8,510,080 $1,445,700 $111,188 $15,887
2014 Total 108 108 $9,983,143 $1,716,601 $131,860 $15,894
1 PEBB/UMP pays secondary to Medicare; paid rates are an artifact
Table 5 Medicaid FFS
Utilization: Cardiac Stents 2011 – 2014
Year Type Stent
Unique Patients
Procedures Submitted Amt
(Rounded) Allowed Amt
(Rounded) Paid Amt
(Rounded) Average Pd/ Procedure
2011 Bare 149 151 $857,000 $3,292,000 $2,833,000 $18,764
Drug 322 320 $2,151,000 $7,500,000 $6,973,000 $21,793
2011 Total 471 $3,008,000 $10,792,000 $9,806,000
2012 Bare 138 143 $972,000 $3,713,000 $3,127,000 $21,873
Drug 279 288 $2,141,000 $6,571,000 $5,989,000 $20,797
2012 Total 431 $3,113,000 $10,284,000 $9,116,000
2013 Bare 85 88 $683,000 $2,072,000 $1,839,000 $20,909
Drug 186 190 $1,390,000 $4,224,000 $3,714,000 $19,549
2013 Total 278 $2,073,000 $6,296,000 $5,553,000
2014 Bare 100 100 $658,000 $2,610,000 $1,693,000 $16,934
Drug 256 257 $1,673,000 $5,892,000 $5,508,000 $21,435
2014 Total 357 $2,331,000 $8,502,000 $7,201,000

WA - Health Technology Assessment December 11, 2015
Cardiac Stents – Re-Review: Final Evidence Report Page 50
Chart 1 PEBB UMP, PEBB Medicare, Medicaid Fee for service
Utilization: Cardiac Stents 2011 – 2014 Average Distribution of Drug-Eluting and Non-Drug-Eluting Cardiac Stents by Program

WA - Health Technology Assessment December 11, 2015
Cardiac Stents – Re-Review: Final Evidence Report Page 51
2. Background
The previous report comparing drug-eluting and bare metal stents contains substantial additional background on the pathophysiology of CAD, myocardial infarction and history of PCI with stenting.115 A brief overview is provided for this update.
2.1. Epidemiology and Burden of Disease
Coronary artery disease (CAD) also referred to as coronary heart disease (CHD) or ischemic heart disease (IHD), is the leading cause of death in the U.S. In 2011, CAD accounted for 1 in every 7 deaths.82 82 In 2014, heart diseases were found to be the second leading cause of death in Washington state residents, following cancer.24 Approximately 635,000 Americans have a new heart attack each year, and roughly 300,000 have a recurrent attack. It has been reported the indirect costs due to CAD in 2006 were $142.5 billion, with $11.6 billion paid to Medicare beneficiaries.125 The costs associated with CAD are high: in 2010 the estimated direct and indirect cost of heart disease was $204.4 billion, and between 2013 and 2030, medical costs associated with CAD are predicted to increase by ~100%.82 Given the enormous burden of CAD, it is critical that efforts are made to reduce its prevalence, morbidity, and mortality.
2.2. Patient Presentation and Pathophysiology
Atherosclerosis is the most common underlying cause of CAD. It is a disease process in which plaque (comprised of lipids, inflammatory cells, smooth muscle cells, and connective tissue) builds up on artery walls. Partial or complete blockage of coronary arteries can occur with plaque formation and may prevent the portions of the heart muscle from receiving blood, oxygen, and vital nutrients. Atherosclerosis can cause blockage by two mechanisms: 1) progressive narrowing of the artery due to the plaque narrowing the vessel lumen, and 2) thrombotic occlusion of the artery, which occurs when the hard surface of a plaque tears or breaks off, exposing the inner fatty pro-thrombotic, platelet-attracting components to the site, resulting in enlargement of the blockage. Coronary atherosclerotic plaque disruption and associated intraluminal platelet-fibrin thrombus formation are responsible for the acute coronary syndromes (ACS) of acute MI, unstable angina (UA), and probably for sudden death. Endothelial erosion appears to be a major factor in MI and ACS, particularly in women.65 UA, non-ST-elevation myocardial infarction (NSTEMI) and ST-elevation myocardial infarction (STEMI) all signal a severe potential threat to the myocardium and are generally grouped together as acute coronary syndrome (ACS) for clinical assessment and management. Chest pain is the most common symptom of obstructive CAD and may be the first presenting symptom in at least 50% of patients with CAD.74 Because of the poor correlation between symptoms and CAD, clinicians must rely on a careful history and other modalities to detect and confirm a suspicion of CAD. Classic cardiac chest pain (angina) is characterized by retrosternal chest discomfort, often described as a crushing pressure. The discomfort may radiate to the jaw, neck, back, shoulder or arm. It can be accompanied with dyspnea, diaphoresis, nausea and syncope. If the discomfort presents (1) in a predictable pattern, (2) is brought on by physical or mental stress, and (3) subsides with rest or angina medication such as nitroglycerin, it is called stable angina, which is consistent with stable CAD. One can have stable CAD but not have angina with optimal medical therapy. Angina that occurs with less exertion, causes greater discomfort, or takes longer than 20 minutes to subside may be an ominous warning of critical ischemia and has been termed unstable angina. Unstable angina is classified as part of acute coronary syndrome (ACS). In general, persons with angina already have CAD lesions with at least 75% obstruction and are at increased risk of MI, heart failure and sudden death due to plaque destabilization and thrombosis.

WA - Health Technology Assessment December 11, 2015
Cardiac Stents – Re-Review: Final Evidence Report Page 52
2.3. Overview of Diagnosis and Treatment Options
Historically, invasive coronary angiography (ICA) has been considered the standard reference diagnostic test for anatomic CAD and provides information on coronary artery anatomy and lumen obstruction. ICA allows visualization of the size, position, and possible stenotic areas in vessels, and various thresholds for occlusion have been used (e.g., ≥ 50% or ≥ 70% occlusion) for diagnosis of CAD. Noninvasive tests are generally considered more appropriate as a first-line diagnostic test for patients presenting with chest pain or other symptoms of IHD and who are deemed to be stable and not experiencing acute coronary events. Noninvasive methods are used as diagnostic and prognostic tools to improve risk stratification of patients for CAD and to guide subsequent testing and interventions. Noninvasive diagnostic tests are broadly divided into two categories: functional tests and anatomic tests. Functional tests include exercise electrocardiography (ECG), exercise/pharmacologic stress echocardiography, exercise/pharmacologic cardiac nuclear imaging with single photon emission computed tomography (SPECT) or positron emission tomography (PET), pharmacologic stress magnetic resonance imaging (MRI), computed tomography (CT). In addition, information from blood test for cardiac biomarkers (e.g. troponin) provide information on myocardial damage. The ACCF/AHA guidelines indicate that if noninvasive testing suggests high risk coronary lesions referral for invasive coronary angiography may be made revascularization may be considered.39 Evidence-based recommendations for medical management are now advised for all persons with CAD as described in current clinical Guidelines.39 Optimal medical therapy, or the newer term, guideline directed medical therapy, includes lifestyle modifications (physical activity, smoking cessations, weight management and dietary changes) as well as treatment of secondary conditions within current guidelines (diabetes and hypertension), risk modification with antiplatelet drugs and management of lipid levels and treatment of angina symptoms if present. Medical treatment is optimized based for the individual patient based on their symptoms and presentation. For patients with stable CAD with low risk for coronary events, guideline directed medical therapy may be the only treatment. For patients with stable CAD determined to be at high risk for coronary events, treatment may involve both medical therapy and revascularization therapy, with the goal of reducing mortality risk and/or improving symptoms. For patients considered at high risk of coronary events, invasive coronary angiography for further risk stratification and assessment of appropriateness for revascularization may be the next logical steps in addition to medical therapy. Overall, consideration of revascularization is based on the clinical presentation (acute coronary syndrome or stable angina), the severity of the angina (based on Canadian Cardiovascular Society Classification), the extent of ischemia on noninvasive testing, and the presence or absence of other prognostic factors including congestive heart failure, depressed left ventricular function, and diabetes, the extent of medical therapy, and the extent of anatomic disease. Revascularization methods include coronary artery bypass graft surgery (CABG) and percutaneous coronary interventions (PCI). In current clinical practice PCI includes the placement of one or more stents. All three treatment approaches (medical therapy, PCI and CABG) have seen important improvements over the years. Only PCI with stenting and medical therapy are considered in this report.
1.1 Percutaneous Coronary Intervention (PCI) with Stenting
The term “percutaneous coronary intervention (PCI)” has been used to include balloon angioplasty, stenting and artherectomy. Except where noted, PCI will be used in this document to refer to PCI with stenting. Invasive coronary angiography is used to identify the area of stenosis and guide placement of coronary stents. Access to the heart and coronary arteries is typically obtained through the femoral artery. Access through the radial artery has increased and may be associated with fewer bleeding events versus the femoral approach.18 The catheter is advanced into the ascending aorta and then threaded into the

WA - Health Technology Assessment December 11, 2015
Cardiac Stents – Re-Review: Final Evidence Report Page 53
coronary artery. Angiography is then performed by injecting radiopaque dyes through the catheter tip to delineate the coronary artery anatomy and identify possible areas of stenosis. Percutaneous intervention (PCI) in general relieves coronary narrowing by utilizing a mechanical device (usually a balloon) at the end of a catheter to dilate an area of stenosis within the coronary artery. If a significant stenotic area is identified, the catheter tip can be advanced to that area and the balloon inflated to dilate the arterial lumen and compress the plaque. The balloon is then deflated and the catheter removed. This process, called a balloon angioplasty, was initially termed “percutaneous transluminal coronary angioplasty” (PTCA). PCI with stenting was first approved by the FDA in 1993. 84. A collapsed stent attached to the deflated balloon catheter is advanced to the area of stenosis. As described above, inflating the balloon expands the stent and compresses the plaque against the artery wall. Once the stent is in place, the balloon is deflated and removed. Currently used stents serve as permanent scaffolds to keep the existing plaque compressed and increase blood flow within the artery. A summary of currently use stents, their indications and contraindications is found in Tables 2 and 3. Invasive coronary angiography provides only anatomic information. Fractional flow reserve (FFR), defined as the ratio of maximal achievable blood flow in an obstructed vessel to the hypothetical maximal achievable blood flow in the same vessel in the absence of obstruction, may be used as an adjunct to angiography to determine the functional significance of stenosis. This may aid clinical decision making regarding revascularization by providing information on the hemodynamic significance of angiographically “intermediate” or “indeterminate” lesions allowing the clinician to decide if PCI may be beneficial or safely deferred. The ACCF/AHA guideline recommendations about revascularization consider coronary stenoses with FFR ≤ 0.80 to be considered to be “significant.”38,39 A value of 0.8 means that the maximum blood flow in the myocardial distribution of the vessel is 80% of what would be present if the vessel was completely normal. A value of 1 is considered “normal”. Additional context regarding FFR is contained in section 1.4 of this report. As an adjunct to invasive coronary angiography, intravascular ultrasound (IVUS) and optical coherence tomography (OCT) can enhance visualization of coronary anatomy and may also be used.
2.4.1. Bare metal stents (BMS)
BMS were the first stents approved by the FDA in 1993.84 These stents utilize only a metal “backbone” or scaffolding usually comprised of cobalt chromium, platinum chromium, or stainless steel, which compresses the plaque against the target vessel. Bare metal stents currently in use include Vision, Veriflex, Rebel, and Integrity BMS are those currently in practice. A limitation of BMS has been restenosis secondary to proliferation of cells from the vessel wall. Because stents were designed to prevent elastic recoil and negative remodeling, restenosis following a BMS is primarily caused by neointimal proliferation, an inflammatory response that results in vessel lumen encroachment. As reported by Newsome, a 10% decrease in restenosis rates, 32% to 22%, was observed in patients receiving BMS (versus percutaneous angioplasty alone) in premarket clinical trials that led to FDA-approval of these devices. Although many efforts were made to further decrease the incidence of restenosis, rates within six months of BMS implantation remained high at 20-25%. Addition of dual-antiplatelet therapy (e.g. clopidogrel and aspirin), usually for 30 days, as well as refinement of the stent placement procedure reduced the occurrence of BMS thrombosis a rate of 1.2%.61,126,139 In addition BMS designs have evolved.
2.4.2. Drug-eluting stents (DES)
Continued difficulties with early restenosis and thrombosis with BMS led investigators to explore ways to modify the stent to minimize these adverse outcomes, leading to the conception of drug-eluting stents (DES). DES are essentially BMS that have been coated with a polymer containing an antiproliferative drug. The first generation drug-eluting stents were FDA-approved in 2003128 and were

WA - Health Technology Assessment December 11, 2015
Cardiac Stents – Re-Review: Final Evidence Report Page 54
coated with a permanent polymer containing sirolumus or paclitaxel as the antiproliferative agent. The drug slowly elutes from the polymer and begins during and continues after the procedure to block cell proliferation and limit intimal hyperplasia. Inflammatory responses and local toxicity have been associated with the permanent presence of the polymer. Compared with BMS, first generation DES reduced neointimal hyperplasia and restenosis, however, reports of high rates of subacute in-stent thrombosis (clot formation) after DES placement became cause for concern soon after FDA approval of these devices.100,127 Use of dual-antiplatelet therapy (e.g. clopidogrel and aspirin) therefore became standard with placement of DES. The optimal duration of dual antiplatelet therapy has never been conclusively determined, but it is likely to be more than a year as this device has been associated with a fourfold t to fivefold risk for very late (after one year) stent thrombosis compared with bare metal stents in some studies.131 First generation DES have now largely been withdrawn from the market. Newer (2nd) generation DES employ more recently developed antiproliferative drugs and are generally thinner, more biocompatible and may be coated with either permanent or bioabsorbable polymers. The most recently approved agents for DES are zotarolimus and everolimus. The most recently approved DES (June 2015) is the PROMUS Element stent which utilizes everolimus. Studies comparing these second generation DES with first-generation DES suggest that the newer devices have been associated with lower risk of stent thrombosis. Dual antiplatelet therapy is also required with the 2nd generation stents, but optimal duration of use has not been firmly established.131 Thrombotic occlusion of stents has been and remains a concern since the early days of stenting. Although not most have not yet been FDA approved, technologies such as drug-eluting balloon and bioabsorbable stents are being investigated for their use in patients with CAD. These technologies may provide more long-lasting drug effects without the use of a permanent metal scaffold, and may allow for the use of multiple restenosis prevention drugs in one procedure. Only the aforementioned second generation stents (and not these third generation stent procedures) will be examined by this report. As of October 2015, the Synergy everolimus stent is the first FDA-approved stent using biodgradeable material.
2.4.3. Indications and contraindications
Tables 2 and 3 summarize the indications and contraindications for FDA-approved second generation DES and BMS. DES are indicated in patients with symptomatic ischemic heart disease and native de novo lesions up to 27-35 mm in length and 2.25-4.20 mm in diameter, depending on the specific stent. BMS are indicated in the same patient population with native de novo lesions with lengths up to 25-30 mm and diameters of 2.25-5.0 mm, depending on the specific stent. Anecdotally, experts have indicated that most DES use is off-label. Both DES and BMS are contraindicated in patients with allergies or hypersensitivity to metals and/or polymers which are used in the structure of the stent, patients who cannot receive anti-platelet and/or anticoagulant therapy, and lesions which do not allow for proper placement of the stent or balloon. DES are contraindicated in patients who are hypersensitive or allergic to the drug used in the stent or associated analogues or derivatives.

WA - Health Technology Assessment December 11, 2015
Cardiac Stents – Re-Review: Final Evidence Report Page 55
Table 2. Indications and contraindications for DES
Name Scaffold Material
Drug Indications/Contraindications
Drug Eluting Stents in Use
Taxus Ion Platinum Chromium
Paclitaxel Indications: native de novo lesions with length of ≤34mm and 2.25 to 4.00mm diameter Contraindications: inability to take anti-platelet or anti-coagulation therapy, lesions which do not allow proper balloon or stent placement, hypersensitivity or allergy to stainless steel, platinum, paclitaxel, or polymer
Xience Cobalt Chromium
Everolimus Indications: symptomatic heart disease due to de novo lesions, reference vessel diameter 2.25 to 4.25mm Contraindications: inability to take anti-platelet or anti-coagulant therapy, lesions preventing proper stent or balloon delivery, hypersensitivity or contraindication to everolimus, cobalt, chromium, nickel, tungsten, acrylic, and/or fluoropolymers
Promus Element
Platinum Chromium
Everolimus Indications: diabetes mellitus, symptomatic heart disease, or silent ischemia with reference vessel diameter ≥2.25 to 4.00 mm in lesions ≤34mm in length Contraindications: inability to take anti-platelet or anti-coagulant therapy, lesions which do not allow proper balloon or stent placement, hypersensitivity to stainless steel, platinum, and/or everolimus
Endeavor Cobalt Chromium
Zotarolimus Indications: ischemic heart disease due to de novo lesions ≤27mm long with reference vessel diameters of ≥2.5 to ≤3.5mm Contraindications: inability to take anti-platelet or anti-coagulant therapy, lesions which do not allow proper balloon or stent placement, hypersensitivity to zotarolimus, cobalt, nickel, chromium, molybdenum, and/or phosphorylcholine polymer
Resolute Cobalt Chromium
Zotarolimus Indications: diabetes mellitus or ischemic heart disease due to de novo lesions of ≤35mm length and reference vessel diameters of 2.25 to 4.20mm Contraindications: inability to take anti-platelet or anti-coagulation therapy, lesions which do not allow for proper placement of balloon or stent, allergy or hypersensitivity to aspirin, heparin, bivalirudin, clopidogrel, prasugrel, ticagrelor, ticlopidine, zotarolimus, tacrolimus, sirolimus, and/or everolimus
Drug Eluting Stents No Longer In Use
Cypher Stainless Steel
Sirolimus Indications: symptomatic ischemic heart disease due to de novo lesions in native arteries ≤30mm in length and with reference vessel diameter of ≥2.5mm to ≤3.5mm Contraindications: lesions which prevent complete proper placement of balloon or stent, inability to take anti-platelet or anti-coagulation therapy, hypersensitivity or allergy to sirolimus, polymethacrylates, or polyolefin copolymers
Taxus Express
Stainless Steel
Paclitaxel Indications: native de novo lesions with ≤28mm length and 2.25 to 4.00mm diameter Contraindications: inability to take anti-platelet or anti-coagulation therapy, lesions which prevent proper placement of stent or balloon, allergy or hypersensitivity to paclitaxel or polymer of stent
Promus Cobalt Chromium
Everolimus Indications: symptomatic heart disease due to de novo lesions with ≤28mm length and reference vessel diameter of 2.25 to 4.25mm

WA - Health Technology Assessment December 11, 2015
Cardiac Stents – Re-Review: Final Evidence Report Page 56
Name Scaffold Material
Drug Indications/Contraindications
Contraindications: inability to take anti-platelet or anti-coagulation therapy, lesions which prevent proper placement of stent or balloon, allergy or hypersensitivity to paclitaxel or polymer of stent
Drug Eluting Biodegradable Stents (FDA Approved October 2015)
Name Materials Drug Indications/Contraindications
Scaffold: Platinum Chromium Polymer: Poly (D,Llactide-co-glycolide) (PLGA)
Everolimus Indications: symptomatic heart disease or stable/unstable angina due to atherosclerotic lesions in native vessels with ≥2.25 mm to ≤4.0 mm diameter and ≤34 mm length Contraindications: inability to take anti-platelet or anti-coagulation therapy, lesions which do not allow proper balloon or stent placement, hypersensitivity or allergy to stainless steel platinum, chromium, iron, nickel, molybdenum, and/or everolimus
* Information gathered from FDA and manufacturers’ websites.
Table 3. Indications and contraindications for BMS
Name Scaffold Material
Indications/Contraindications
Vision Cobalt Chromium
Indications: symptomatic ischemic heart disease due to de novo or restenotic lesions or in saphenous vein bypass grafts of <25mm length and reference vessels with diameter of 3.0 to 4.0mm Contraindications: inability to take anti-platelet or anti-coagulation therapy, lesion that does not allow proper placement of balloon or stent
Veriflex Stainless Steel Indications: symptomatic ischemic heart disease associated with stenotic lesions of ≤28mm in length and reference diameter of 2.75 to 5.0mm Contraindications: inability to take anti-platelet or anti-coagulation therapy, allergy to stainless steel, lesion that does not allow proper placement of balloon or stent
Rebel Platinum Chromium
Indications: de novo lesions ≤28mm in length with a reference vessel diameter of ≥2.25 to ≤4.50mm Contraindications: inability to take anti-platelet or anti-coagulation therapy, lesions which do not allow proper placement of balloon or stent, hypersensitivity or allergy to platinum, stainless steel, and/or contrast agents
Integrity Cobalt Chromium
Indications: symptomatic ischemic heart disease due to de novo or restenotic lesions with reference vessel lengths of ≤30mm and diameters of 2.25 to 4.0mm Contraindications: inability to take anti-platelet or anti-coagulation therapy, lesions which do not allow proper balloon or stent placement
* Information gathered from FDA and manufacturers’ websites.
2.4.4. Proposed benefits of stenting
All stent types are designed to widen the coronary vessel and thus increase blood flow, which in turn can help relieve symptoms such as angina and shortness of breath. Further, because coronary stenting is less invasive than CABG, a shorter recovery time is often needed. Clinical studies indicate that use of DES reduces risk of repeat revascularization compared with BMS.

WA - Health Technology Assessment December 11, 2015
Cardiac Stents – Re-Review: Final Evidence Report Page 57
2.4.5. Potential complications and harms
Coronary artery stenting of any type carries a number of risks, including death, MI, vascular complications, and bleeding events. One of the primary adverse events due to coronary artery stent insertion is stent thrombosis, as the procedure may damage the arterial walls and lead to clotting in the artery. If serious enough, stent thrombosis can lead to MI or death. Antiplatelet and anticoagulant therapies must be administered post-procedurally to help prevent stent thrombosis and have associated risks related to bleeding. Dual antiplatelet therapy (DAPT) consisting of aspirin plus platelet
P2Y12 receptor blocker such as clopidogrel) is generally used. The optimal duration of DAPT has not been conclusively determined.131 A recent metaanalysis reported that the odds of MI and stent thrombosis were lower with extended DPAT but more bleeding occurred.83 (Review of DAPT is not within the scope of this HTA.) Allergic reactions to the drugs used in DES are an additional potential harm exclusive to that stent type.
2.4.6. Trials in progress
A total of 33 ongoing clinical trials were identified that are comparing the use of DES and BMS for treatment of CAD. The majority of these trials (22 total) have been completed, seven have an unknown status, one was terminated due to early completion, two are currently recruiting, and one is not yet recruiting. The most recently completed trial (“A Randomized Trial of Bare Metal Stent (Cronus©) - Cobalt Chromium Versus Stent Coating with Sirolimus (DES)”) was completed in July of 2015; results are not yet available for this study. A total of 12 clinical trials were identified that compare stenting to optimal medical therapy, five of which compare DES to medical therapy; no trials were identified that explicitly compare BMS to medical therapy. The remaining seven trials did not explicitly report which stent type was compared to medical therapy. The majority of the studies are currently recruiting (eight trials), one is ongoing, one has an unknown status, and one was terminated early due to low enrollment. One trial was identified as completed in April 2006 (“TOSCA-2: An Angiographic Substudy (Ancillary) of the Occluded Artery Trial (OAT)” however no results are currently available.129 A total of 32 clinical trials were identified that are examining the use of bioabsorbable stents versus drug eluting stents in patients with CAD, ten of which are ongoing, fourteen are recruiting, four are not yet recruiting, and three are completed. One trial was terminated due to poor patient recruitment. The most recently completed trial (“Bioresorbable Vascular Scaffold in Patient with ST Elevation Myocardial Infarction: a Randomized Comparison with Everolimus Eluting Stent) was completed in October 8014; no publication for this trial is currently available. There are 51 clinical trials utilizing drug-eluting balloons, which are not yet approved by the FDA. No clinical trials were identified that are evaluting Biolimus DES (currently not FDA approved). The International Study of Comparative Health Effectiveness with Medical and Invasive Approaches (ISCHEMIA) Trial (ClinicalTrials.gov number NCT01471522) primary objective is to determine whether an initial invasive strategy of cardiac catheterization and optimal revascularization in addition to guideline-directed medical therapy reduced the incidence of the composite of cardiovascular death or non-fatal MI compared with a conservative strategy of guideline-directed medical therapy alone with catheterization and revascularization done if medical therapy fails in patients with at least moderate ischemia on ischemia testing. This RCT projects enrollment of 8000 patients across 500 sites worldwide with an estimated completion date for the primary outcome measure of May 2018 and study completion date of May 2019.

WA - Health Technology Assessment December 11, 2015
Cardiac Stents – Re-Review: Final Evidence Report Page 58
2.5. Guideline-Directed Medical Therapy
Guideline-directed medical therapy for the treatment of CAD is fully described in the current ACCF/AHA guideline.39 A summary of clinical guideline recommendations for GDMT is provided in section 2.6.
2.5.1. Components
In general, guideline-directed medical therapy includes lifestyle modifications (physical activity, smoking cessations, weight management and dietary changes) as well as treatment of secondary conditions within current guidelines (diabetes and hypertension), risk modification with antiplatelet drugs and management of lipid levels and treatment of angina symptoms if present. Treatment is optimized on a per-patient basis depending on patient characteristics and guideline recommendations. Advice regarding lifestyle change in addition to one of the other two components is an integral component of guideline-directed practice. Lifestyle changes, which modify patient risk, include physical activity regimens, diet alterations and weight management, as well as cessation of alcohol and cigarette consumption. Treatments to prevent MI and death include the use of antiplatelet therapies (i.e. aspirin) to reduce the likelihood of clotting within the coronary vessels, lipid-lowering medications (i.e. statins) to minimize cholesterol-related effects by stabilizing existing plaque and reducing new plaque development, beta-blockers, and renin-angiotensin-aldosterone blockers to aid in the reduction of hypertension. Symptom-relieving treatments include those which have anti-ischemic effects. Beta-blockers are generally the initial treatment chosen for reducing symptoms of angina, followed by use of calcium channel blockers, nitrates, and/or Ranolazine if found to be ineffective.39
2.5.2. Proposed benefits
Guideline-directed medical therapy is non-invasive and when optimized to the individual, assists with secondary and tertiary prevention of CAD and relief of symptoms. Guideline directed medical therapy is considered standard for all persons with CAD.
2.5.3. Indications and contraindications
Guideline-directed medical therapy is indicated for all patients with CAD. It may the primary treatment in patients whose symptoms are stable as well as in those who are unable to receive invasive procedures (e.g., an allergy to the metal of a stent). In general, guideline-directed medical therapy is continued unless patients have angina that cannot be controlled on maximal medical therapy. For patients with stable CAD determined to be at high risk for coronary events, treatment may involve both medical therapy and revascularization. Each of the pharmaceutical agents used in GDMT have specific indications and contraindications and where necessary alternative need to be considered.
2.6. Clinical Guidelines
A number of clinical guidelines for treating patients with CAD are available on the National Guideline Clearinghouse (NGC), the primary repository for evidence-based clinical guidelines [http://www.guideline.gov]. These guidelines include those on stable CAD, UA/NSTEMI and STEMI, and use of PCI. Unfortunately, no guidelines for clinical care or appropriateness have been published regarding the use of BMS versus DES, the central focus of this technology assessment. However, the guidelines on CAD management provide an important perspective on the setting and issues involved in the decisions leading to coronary stent placement. The following overview updates section 1.7 of Appendix N in the 2009 report. National Guideline Clearinghouse (NGC) The NGC was searched for relevant guidelines for CAD management, including clinical management of various symptoms, clinical conditions and interventions. Guidelines were identified for possible inclusion by NGC searches for relevant terms including: “CAD”, “UA”, “NSTEMI”, “STEMI”, “PCI”, “BMS”, “DES”,

WA - Health Technology Assessment December 11, 2015
Cardiac Stents – Re-Review: Final Evidence Report Page 59
and “coronary stent”. A total of 22 guidelines were reviewed at full text and a total of 9 were found to be relevant and are summarized in this report. The most extensive and detailed guidelines were formulated by combined efforts of the American College of Cardiology (ACC) and the American Heart Association (AHA) in conjunction with other United States-based professional societies. These appear to be the most salient for patient care in Washington State. The most recent American College of Cardiology/ (ACC/AHA guidelines with focused updates are listed in Table 4 below.
Table 4. ACC/AHA Guidelines
Guideline Topic Reference
Chronic Stable Angina Initial guideline, 199944
Update 200243
Update 2007 on medical therapy40
Focused update 201438
Stable Ischemic Heart Disease Initial Guideline, 201239
Unstable angina/Non-ST-Segment Elevation Myocardial Infarction (NSTEMI)
Initial guideline, 200019
Update 200220
Update 20076
Update on antiplatelet/anticoagulant therapy 2011144
Update on antiplatelet/anticoagulant therapy 201259
NSTEMI guideline, 20144
ST-Segment Elevation Myocardial Infarction (STEMI) Initial guideline, 20047
Update 20078
Update 200968
Full text revision, 201388
Update, 201570
Percutaneous Coronary Angiography Initial guidelines, 2001116
Update 2005117
Update 200763
Full text revision, 201169
Special Populations NSTEMI in the elderly, Part I* 3
STEMI in the elderly, Part II* 2
Diabetes95
Valvular heart disease86
Atrial fibrillation58
Updated from Table 7 in Appendix N from the 2009 report.
ACC: American College of Cardiology; AHA: American Heart Association.
* Not guidelines, these are scientific statements that summarize the literature; no recommendations provided (included for completeness).
Selected recommendations from ACC/AHA clinical guidelines relevant to stenting are briefly summarized below, then are compared to guidelines from other professional organizations. The reader is advised to consult the full published guidelines to review the full recommendations, evidence supporting them and other recommendations made.
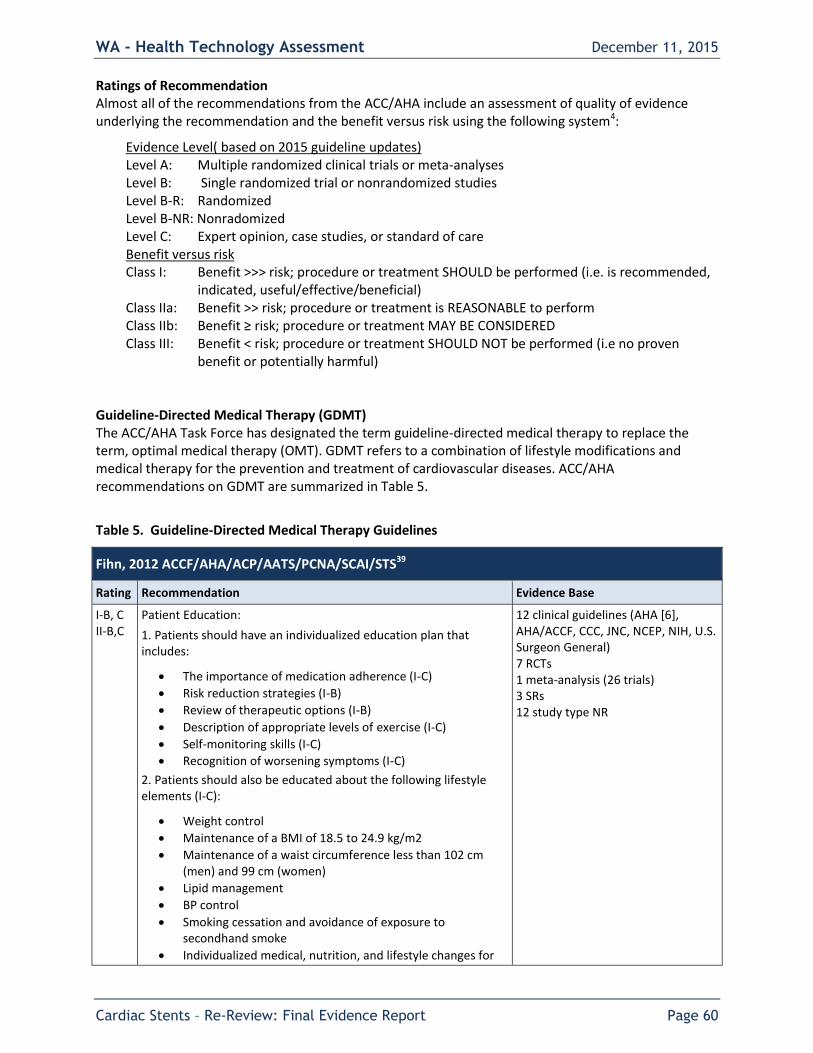
WA - Health Technology Assessment December 11, 2015
Cardiac Stents – Re-Review: Final Evidence Report Page 60
Ratings of Recommendation Almost all of the recommendations from the ACC/AHA include an assessment of quality of evidence underlying the recommendation and the benefit versus risk using the following system4:
Evidence Level( based on 2015 guideline updates) Level A: Multiple randomized clinical trials or meta-analyses Level B: Single randomized trial or nonrandomized studies Level B-R: Randomized Level B-NR: Nonradomized Level C: Expert opinion, case studies, or standard of care Benefit versus risk Class I: Benefit >>> risk; procedure or treatment SHOULD be performed (i.e. is recommended,
indicated, useful/effective/beneficial) Class IIa: Benefit >> risk; procedure or treatment is REASONABLE to perform Class IIb: Benefit ≥ risk; procedure or treatment MAY BE CONSIDERED Class III: Benefit < risk; procedure or treatment SHOULD NOT be performed (i.e no proven
benefit or potentially harmful) Guideline-Directed Medical Therapy (GDMT) The ACC/AHA Task Force has designated the term guideline-directed medical therapy to replace the term, optimal medical therapy (OMT). GDMT refers to a combination of lifestyle modifications and medical therapy for the prevention and treatment of cardiovascular diseases. ACC/AHA recommendations on GDMT are summarized in Table 5.
Table 5. Guideline-Directed Medical Therapy Guidelines
Fihn, 2012 ACCF/AHA/ACP/AATS/PCNA/SCAI/STS39
Rating Recommendation Evidence Base
I-B, C II-B,C
Patient Education:
1. Patients should have an individualized education plan that includes:
The importance of medication adherence (I-C)
Risk reduction strategies (I-B)
Review of therapeutic options (I-B)
Description of appropriate levels of exercise (I-C)
Self-monitoring skills (I-C)
Recognition of worsening symptoms (I-C)
2. Patients should also be educated about the following lifestyle elements (I-C):
Weight control
Maintenance of a BMI of 18.5 to 24.9 kg/m2
Maintenance of a waist circumference less than 102 cm (men) and 99 cm (women)
Lipid management
BP control
Smoking cessation and avoidance of exposure to secondhand smoke
Individualized medical, nutrition, and lifestyle changes for
12 clinical guidelines (AHA [6], AHA/ACCF, CCC, JNC, NCEP, NIH, U.S. Surgeon General) 7 RCTs 1 meta-analysis (26 trials) 3 SRs 12 study type NR
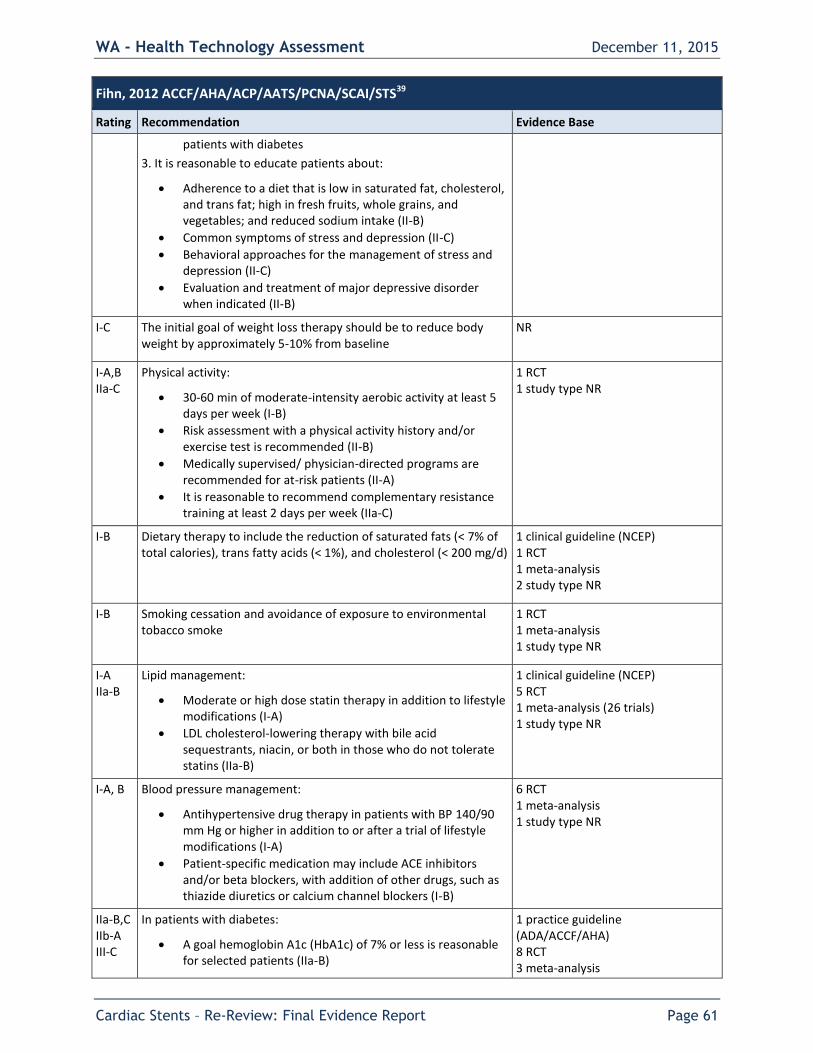
WA - Health Technology Assessment December 11, 2015
Cardiac Stents – Re-Review: Final Evidence Report Page 61
Fihn, 2012 ACCF/AHA/ACP/AATS/PCNA/SCAI/STS39
Rating Recommendation Evidence Base
patients with diabetes
3. It is reasonable to educate patients about:
Adherence to a diet that is low in saturated fat, cholesterol, and trans fat; high in fresh fruits, whole grains, and vegetables; and reduced sodium intake (II-B)
Common symptoms of stress and depression (II-C)
Behavioral approaches for the management of stress and depression (II-C)
Evaluation and treatment of major depressive disorder when indicated (II-B)
I-C The initial goal of weight loss therapy should be to reduce body weight by approximately 5-10% from baseline
NR
I-A,B IIa-C
Physical activity:
30-60 min of moderate-intensity aerobic activity at least 5 days per week (I-B)
Risk assessment with a physical activity history and/or exercise test is recommended (II-B)
Medically supervised/ physician-directed programs are recommended for at-risk patients (II-A)
It is reasonable to recommend complementary resistance training at least 2 days per week (IIa-C)
1 RCT 1 study type NR
I-B Dietary therapy to include the reduction of saturated fats (< 7% of total calories), trans fatty acids (< 1%), and cholesterol (< 200 mg/d)
1 clinical guideline (NCEP) 1 RCT 1 meta-analysis 2 study type NR
I-B Smoking cessation and avoidance of exposure to environmental tobacco smoke
1 RCT 1 meta-analysis 1 study type NR
I-A IIa-B
Lipid management:
Moderate or high dose statin therapy in addition to lifestyle modifications (I-A)
LDL cholesterol-lowering therapy with bile acid sequestrants, niacin, or both in those who do not tolerate statins (IIa-B)
1 clinical guideline (NCEP) 5 RCT 1 meta-analysis (26 trials) 1 study type NR
I-A, B Blood pressure management:
Antihypertensive drug therapy in patients with BP 140/90 mm Hg or higher in addition to or after a trial of lifestyle modifications (I-A)
Patient-specific medication may include ACE inhibitors and/or beta blockers, with addition of other drugs, such as thiazide diuretics or calcium channel blockers (I-B)
6 RCT 1 meta-analysis 1 study type NR
IIa-B,C IIb-A III-C
In patients with diabetes:
A goal hemoglobin A1c (HbA1c) of 7% or less is reasonable for selected patients (IIa-B)
1 practice guideline (ADA/ACCF/AHA) 8 RCT 3 meta-analysis

WA - Health Technology Assessment December 11, 2015
Cardiac Stents – Re-Review: Final Evidence Report Page 62
Fihn, 2012 ACCF/AHA/ACP/AATS/PCNA/SCAI/STS39
Rating Recommendation Evidence Base
A goal HbA1c of 7-9% is reasonable according to age and medical history (IIa-C)
Pharmacotherapy interventions to achieve target HbA1c might be reasonable (IIb-A)
Therapy with rosiglitazone should not be initiated in patients with SIHD (III-C)
2 SR 4 study type NR
IIa-B IIb-C
Psychological Factors:
It is reasonable to screen for depression and to refer or treat when indicated (IIa-B)
Treatment of depression has not been shown to improve cardiovascular disease outcomes but it might be reasonable for its other clinical benefits (IIb-C)
4 RCT 3 study type NR
AATS: American Association for Thoracic Surgery; ACCF: American College of Cardiology Foundation; ACE: Angiotensin-converting-enzyme inhibitor; ACP: American College of Physicians; ADA: American Diabetes Association; AHA: American Heart Association; BP: Blood pressure; BMI: Body mass index; CCC: Council on Clinical Cardiology; JNC: Joint National Committee on Prevention, Detection, Evaluation, and Treatment of High Blood Pressure; NCEP: National Cholesterol Education Program (NCEP); NIH: National Institutes of Health; NR: Not reported; PCNA: Preventive Cardiovascular Nurses Association; RCT: Randomized controlled trial ; SCAI: Society for Cardiovascular Angiography and Interventions; SR: Systematic review; STS: Society of Thoracic Surgeons; SIHD: Stable ischemic heart disease.
Revascularization (PCI or CABG) for CAD
Table 6. CAD Revascularization Guidelines
Fihn, 2012 ACCF/AHA/ACP/AATS/PCNA/SCAI/STS, 2014 Focused update and Levine, 2011 ACCF/AHA/SCAI38,39,69
Rating Recommendation Evidence Base
I-C
IIa-B
For unprotected left main or complex CAD, a Heart Team approach is recommended (1-C) and calculation of STS and SYNAX Scores is reasonable (IIa-B)
9 studies
I-B CABG is recommended for patients with significant left main coronary artery stenosis
2 RCT 5 study type NR
I-B CABG is beneficial in patients with significant stenosis (FFR ≤ 0.80 or ≥ 70% narrowing) in 3 major coronary arteries or in the proximal LAD artery plus 1 other major coronary artery
2 RCT 4 study type NR
IIa-B CABG is reasonable in patients with:
Significant stenosis in 2 major coronary arteries with severe or extensive myocardial ischemia or target vessels supplying a large area of viable myocardium
Mild- moderate LV systolic dysfunction and significant multivessel CAD or proximal LAD coronary artery stenosis when viable myocardium is present in the region of intended revascularization
2 RCT 8 study type NR
IIa-B,C PCI to improve survival is reasonable in patients with:
Significant unprotected left main CAD with conditions associated with low
3 RCT 2 meta-analysis

WA - Health Technology Assessment December 11, 2015
Cardiac Stents – Re-Review: Final Evidence Report Page 63
Fihn, 2012 ACCF/AHA/ACP/AATS/PCNA/SCAI/STS, 2014 Focused update and Levine, 2011 ACCF/AHA/SCAI38,39,69
Rating Recommendation Evidence Base
risk of procedural complications and a high likelihood of good outcomes (IIa-B)
UA/NSTEMI when an unprotected left main coronary artery is the culprit lesion and the patient is not a candidate for CABG (IIa-B)
Acute STEMI when an unprotected left main coronary artery is the culprit lesion, distal coronary flow is less than TMI grade 3 and PCI can be performed more rapidly and safely than CABG (IIa-C)
19 study type NR
I-A I-B I-C
CABG or PCI is beneficial:
In survivors of sudden cardiac death with presumed ischemia-mediated ventricular tachycardia caused by significant stenosis in a major coronary artery (CABG I-B, PCI I-C)
To improve symptoms in patients with 1 or more significant coronary artery stenosis amenable to revascularization and unacceptable angina despite GDMT (I-A)
5 RCTs 2 meta-analysis 6 study type NR
IIa-C CABG or PCI to improve symptoms is reasonable in patients with 1 or more significant coronary artery stenosis and unacceptable angina for whom GDMT cannot be implemented because of medication contraindications, adverse effects, or patient preferences
NR
IIa-B It is reasonable to choose CABG over PCI to improve survival or symptoms in patients with complex 3-vessel CAD with or without involvement of the proximal LAD artery who are good candidates for CABG
1 RCT 4 study type NR
I-B CABG is generally recommended in preference to PCI to improve survival in patients with diabetes mellitus and multivessel CAD for which revascularization is likely to improve survival, particularly if a LIMA graft can be anastomosed to the LAD artery, provided the patient is a good candidate for surgery
6 RCTs 1 meta-analysis 4 study type NR
IIb-B PCI may be reasonable as an alternative to CABG in selected stable patients with significant unprotected left main CAD with: 1) anatomic conditions associated with a low risk of PCI procedural complications and a high likelihood of good long-term; and 2) clinical characteristics that predict a significantly increased risk of adverse surgical outcomes
2RCT 2 meta-analysis 1 observational 16 study type NR
III-B PCI should not be performed:
In patients with significant unprotected left main CAD who have unfavorable anatomy for PCI and who are good candidates for CABG
with coronary stenting (BMS or DES) if the patient is not likely to be able to tolerate and comply with DAPT
4 RCT 8 study type NR
III-B CABG or PCI should not be performed with the primary or sole intent to improve survival in patients with SIHD with 1 or more coronary stenosis that are not anatomically or functionally significant, involve only the left circumflex or right coronary artery, or subtend only a small area of viable myocardium
4 RCT 5 NR
III-C CABG or PCI to improve symptoms should not be performed in patients who do not meet anatomic or physiological criteria for revascularization
NR
AATS: American Association for Thoracic Surgery; ACCF: American College of Cardiology Foundation; AHA: American Heart Association; ACP: American College of Physician; CAD: Coronary artery disease; CABG: Coronary artery bypass grafting; GDMT: Guideline directed medical therapy; LAD: Left anterior descending artery; LIMA: Left internal mammary artery; LV: Left ventricular; NR: Not reported; NSTEMI: Non-ST-segment-

WA - Health Technology Assessment December 11, 2015
Cardiac Stents – Re-Review: Final Evidence Report Page 64
elevation; PCI: Percutaneous coronary intervention; PCNA: Preventive Cardiovascular Nurses Association; RCT: Randomized controlled trial; SCAI: Society for Cardiovascular Angiography and Interventions; STS: Society of Thoracic Surgeons; UA: Unstable angina.
Chronic Stable Angina The following 2002 guideline summary is included for completeness. References to PCI in this guideline relate primarily to angioplasty, not to PCI with stenting and are out of date. The 2007 updated related only to medical therapy. It is assumed that the 2012 ACCF/AHA Guidelines elsewhere in this section are most relevant to both medical therapy and PCI.
Table 7. Chronic Stable Angina Guidelines
ACC/AHA* 42
Rating Recommendation Evidence Base
I-A CABG for left main coronary disease, 3 vessel disease, 2 vessel disease involving significant left anterior descending CAD or abnormal LV function
10 studies
IIa-B PCI for asymptomatic ischemia or CCS class I or II angina and with 1 or more significant lesions in 1 or 2 coronary arteries suitable for PCI with a high likelihood of success and a low risk of morbidity and mortality. The vessels to be dilated must subtend a moderate to large area of viable myocardium or be associated with a moderate to severe degree of ischemia on noninvasive
testing.
2 studies comparing arthrectomy with angioplasty, 1 study cmoparint angioplasty with stent placement
IIa-C PCI for asymptomatic ischemia or CCS class I or II angina, and recurrent
stenosis after PCI with a large area of viable myocardium or high-risk criteria
on noninvasive testing.
Same 3 studies as above
IIa-B PCI for asymptomatic ischemia or CCS class I or II angina with significant left main CAD (>50% diameter stenosis) who are candidates for revascularization but are not eligible for coronary artery bypass grafting (CABG).
Same as above
IIb-B The effectiveness of PCI for patients with asymptomatic ischemia or CCS class I or II angina who have 2- or 3-vessel disease with significant proximal LAD artery CAD who are otherwise eligible for CABG with 1 arterial conduit and
who have treated diabetes or abnormal LV function is not well established.
Same as above
IIb-C PCI might be considered for patients with asymptomatic ischemia or CCS class I or II angina with nonproximal LAD disease that subtends a moderate area of
viable myocardium and demonstrates ischemia on noninvasive testing.
Same as above
III-C PCI is not recommended in patients with asymptomatic ischemia or CCS class I or II angina who do not meet the criteria as listed above or who have 1 or more of the following:
Only a small area of viable myocardium at risk
No objective evidence of ischemia
Lesions that have a low likelihood of successful dilatation
Mild symptoms that are unlikely to be due to myocardial ischemia
Factors associated with increased risk of morbidity or mortality
Left main disease and eligibility for CABG
Insignificant disease (<50% coronary stenosis)
Same as above
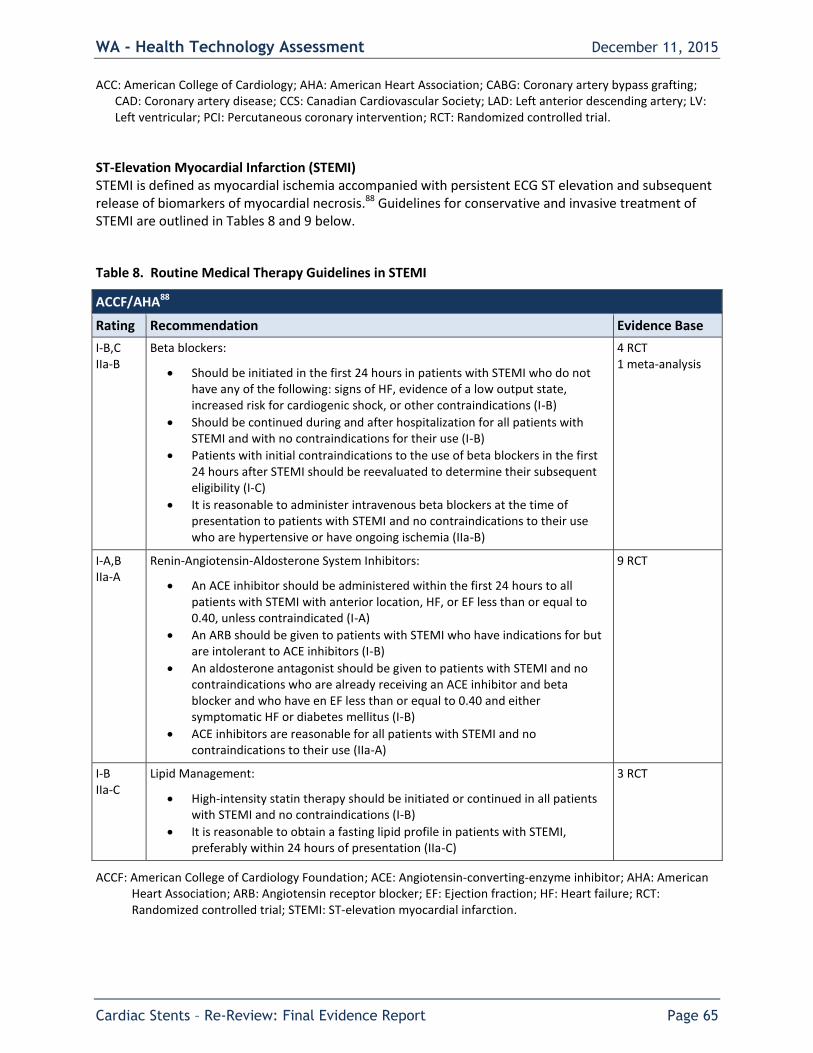
WA - Health Technology Assessment December 11, 2015
Cardiac Stents – Re-Review: Final Evidence Report Page 65
ACC: American College of Cardiology; AHA: American Heart Association; CABG: Coronary artery bypass grafting; CAD: Coronary artery disease; CCS: Canadian Cardiovascular Society; LAD: Left anterior descending artery; LV: Left ventricular; PCI: Percutaneous coronary intervention; RCT: Randomized controlled trial.
ST-Elevation Myocardial Infarction (STEMI) STEMI is defined as myocardial ischemia accompanied with persistent ECG ST elevation and subsequent release of biomarkers of myocardial necrosis.88 Guidelines for conservative and invasive treatment of STEMI are outlined in Tables 8 and 9 below.
Table 8. Routine Medical Therapy Guidelines in STEMI
ACCF/AHA88
Rating Recommendation Evidence Base
I-B,C IIa-B
Beta blockers:
Should be initiated in the first 24 hours in patients with STEMI who do not have any of the following: signs of HF, evidence of a low output state, increased risk for cardiogenic shock, or other contraindications (I-B)
Should be continued during and after hospitalization for all patients with STEMI and with no contraindications for their use (I-B)
Patients with initial contraindications to the use of beta blockers in the first 24 hours after STEMI should be reevaluated to determine their subsequent eligibility (I-C)
It is reasonable to administer intravenous beta blockers at the time of presentation to patients with STEMI and no contraindications to their use who are hypertensive or have ongoing ischemia (IIa-B)
4 RCT 1 meta-analysis
I-A,B IIa-A
Renin-Angiotensin-Aldosterone System Inhibitors:
An ACE inhibitor should be administered within the first 24 hours to all patients with STEMI with anterior location, HF, or EF less than or equal to 0.40, unless contraindicated (I-A)
An ARB should be given to patients with STEMI who have indications for but are intolerant to ACE inhibitors (I-B)
An aldosterone antagonist should be given to patients with STEMI and no contraindications who are already receiving an ACE inhibitor and beta blocker and who have en EF less than or equal to 0.40 and either symptomatic HF or diabetes mellitus (I-B)
ACE inhibitors are reasonable for all patients with STEMI and no contraindications to their use (IIa-A)
9 RCT
I-B IIa-C
Lipid Management:
High-intensity statin therapy should be initiated or continued in all patients with STEMI and no contraindications (I-B)
It is reasonable to obtain a fasting lipid profile in patients with STEMI, preferably within 24 hours of presentation (IIa-C)
3 RCT
ACCF: American College of Cardiology Foundation; ACE: Angiotensin-converting-enzyme inhibitor; AHA: American Heart Association; ARB: Angiotensin receptor blocker; EF: Ejection fraction; HF: Heart failure; RCT: Randomized controlled trial; STEMI: ST-elevation myocardial infarction.

WA - Health Technology Assessment December 11, 2015
Cardiac Stents – Re-Review: Final Evidence Report Page 66
Table 9. Percutaneous Coronary Intervention Guidelines in STEMI
ACCF/AHA70,88
Rating Recommendation Evidence Base
I-A,B Primary PCI should be performed in patients with:
STEMI and ischemic symptoms of less than 12 hours’ duration (I-A)
STEMI and ischemic symptoms of less than 12 hours’ duration who have contraindications to fibrinolytic therapy, irrespective of the time delay from FMC (I-B)
STEMI and cardiogenic shock or acute severe HF, irrespective of time delay from MI onset (I-B)
4 RCT 5 study type NR
IIa-B Primary PCI is reasonable in patients with STEMI if there is clinical and/or ECG evidence of ongoing ischemia between 12 and 24 hours after symptom onset
1 RCT 1 study type NR
IIb-B-R PCI of a noninfarct artery may be considered in selected patients with STEMI and multivessel disease who are hemodynamically stable, either at the time of primary PCI or as a planned staged procedure
10 RCT
4 study type NR
I-A Placement of a stent (BMS or DES) is useful in primary PCI for patients with STEMI
2 meta-analysis
I-C BMS should be used in patients with high bleeding risk, inability to comply with 1 year of DAPT or anticipated invasive or surgical procedures in the next 1 year
NR
III-B DES should not be used in primary PCI for patients with STEMI who are unable to comply with prolonged course of DAPT
1 RCT 1 clinical guideline (AHA/ACC/SCAI/ACS/ADA/ACP) 5 study type NR
I-B,C PCI of an anatomically significant stenosis in the infarct artery should be performed in patients with suitable anatomy and any of the following:
Cardiogenic shock or acute severe HF (I-B)
Intermediate- or high-risk findings on predischarge noninvasive ischemia testing (I-C)
MI that is spontaneous or provoked by minimal exertion during hospitalization (I-C)
3 RCT
IIa-B Delayed PCI is reasonable:
In patients with STEMI and evidence of failed reperfusion or reocclusion after fibrinolytic therapy.
If a significant stenosis in a patient infarct artery is reasonable in stable patients with STEMI after fibrinolytic therapy. PCI can be performed as soon as logistically feasible at the receiving hospital, and ideally within 24 hours, but should not be performed within the first 2-3 hours after administration of fibrinolytic therapy
7 RCT 1 meta-analysis 2 study type NR
IIa-B Delayed PCI of a significant stenosis in patient infarct artery greater than 24 hours after STEMI may be considered as part of an invasive strategy in stable patients
5 RCT 3 meta-analysis 1 NR
III-B Delayed PCI of a totally occulated infarct artery greater than 24 hours 1 RCT

WA - Health Technology Assessment December 11, 2015
Cardiac Stents – Re-Review: Final Evidence Report Page 67
ACCF/AHA70,88
Rating Recommendation Evidence Base
after STEMI should not be performed in asymptomatic patients with 1- or 2-vessel disease if they are hemodynamically and electrically stable and do not have evidence of severe ischemia
1 meta-analysis
ACCF: American College of Cardiology Foundation; ACC: American College of Cardiology; ACP: American College of Physicians; ACS: American College of Surgeons; ADA: American Diabetes Association; AHA: American Heart Association; BMS: Bare metal stent; DAPT: Dual antiplatelet therapy; DES: Drug eluting stent; HF: Heart failure; MI: Myocardial infarction; NR: Not reported; PCI: Percutaneous coronary intervention; RCT: Randomized controlled trial; SCAI: Society for Cardiovascular Angiography and Interventions; STEMI: ST-elevation myocardial infarction.
Non-ST-Segment Elevation–Acute Coronary Syndrome (NSTE-ACS) The ACC/AHA defines acute coronary syndrome (ACS) as a spectrum of disorders compatible with acute myocardial ischemia and/or infarction typically caused by an abrupt reduction in coronary blood flow.4 ACS in the absence of ST-elevation is now referred to in the updated ACC/AHA guideline as Non-ST-Segment Elevation-Acute Coronary Syndrome (NSTE-ACS). NSTE-ACS may be further subdivided into either unstable angina (UA) or non-ST-elevation myocardial infarction on the basis of cardiac biomarkers of necrosis. If cardiac biomarkers are elevated, the patient is determined to have NSTEMI, otherwise the NSTE-ACS are considered to be UA. The authors state that the change in terminology reflects the continuum between UA and NSTEMI, as the two conditions may be indistinguishable. In general the definition of ACS is broad. A concise definition of unstable angina is not provided. The presence of elevated cardiac biomarkers (e.g. troponin) appears to be a primary factor distinguishing UA from NSTEMI based on the authors’ Figure 1. The guideline indicates that most patient presenting within chest pain to the emergency department do not have ACS and that most are at low risk for major morbidity or mortality. Initial examination and risk stratification to assess the short term risk of death or nonfatal MI are described in the Fihn 2012 guideline on stable ischemic heart disease.
Table 10. Unstable angina/NSTEMI-ACS Guidelines
ACC/AHA 4
Rating Recommendation Evidence Base
IIa-B It is reasonable to choose CABG over PCI in older patients, particularly those with DM or multivessel disease, because of the potential for improved survival and reduced CVD events
Meta-analysis 5 study type NR
IIb-B A strategy of multivessel PCI, in contrast to culprit lesion only PCI, may be reasonable in patients undergoing coronary revascularization as part of treatment for NSTE- ACS
2 RCT 5 study type NR
IIb-B Invasive physiological assessment (coronary flow reserve) may be considered with normal coronary arteries if endothelial dysfunction is suspected
5 study type NR
IIb-B A strategy of multivessel PCI, in contrast to culprit lesion only PCI, may be reasonable in patients undergoing coronary revascularization as part of treatment for NSTE- ACS
2 RCT 5 study type NR
IIa-B It is reasonable to choose CABG over PCI in older patients, particularly those with DM or multivessel disease, because of the potential for improved survival and reduced CVD events
Meta-analysis 5 study type NR
ACS: American College of Surgeons; AHA: American Heart Association; CABG: Coronary artery bypass grafting; NR: Not reported; NSTE-ACS: Non-ST-Elevation Acute Coronary Syndromes; NSTEMI: Non-ST-segment-elevation; PCI: Percutaneous coronary intervention.

WA - Health Technology Assessment December 11, 2015
Cardiac Stents – Re-Review: Final Evidence Report Page 68
The guideline also provides recommendation the use of antiplatelet/anticoagulation therapy as well
those related to early versus ischemia driven intervention strategies, which were not included in the
scope of this review; the interested reader is directed to the full guideline for this information.
Specific Cardiac Conditions
Table 11. Additional PCI Guidelines for Specific Cardiac Conditions
ACC/AHA
Population (Organization) Search Dates
Rating Recommendation Evidence Base
Valvular heart disease (AHA/ACC)
86
Through 11/2011
IIa-C CABG or PCI is reasonable in patients undergoing valve repair or replacement with significant CAD
2 RCT 5 study type NR
Atrial fibrillation (AHA/ACC/HRS)
58
2006 to 10/2012
IIb-C In patients with AF undergoing PCI, BMS may be considered to minimize the required duration of DAPT. Anticoagulation may be interrupted at the time of the procedure to reduce the risk of bleeding at the site or peripheral arterial puncture.
NR
ACC: American College of Cardiology; AF: Atrial fibrillation; AHA: American Heart Association; BMS: Bare metal stent; CABG: Coronary artery bypass grafting; CAD: coronary artery disease; DAPT: Dual antiplatelet therapy; HRS: Heart Rhythm Society; NR: Not reported; PCI: Percutaneous coronary intervention; RCT: Randomized controlled trial.
Appropriateness Criteria for Interventions for CAD The AAC/SCAI/STS/AATS/AHA/ASNC/HFSA/SCCT Appropriate Use Criteria (AUC) for Coronary Revascularization was developed to assist clinicians caring for patients with cardiovascular diseases and in support of high-quality cardiovascular care.92 A modified Delphi approach and RAND/UCLA Appropriateness Methods were used. Each member of the 17-member technical panel rated indications for revascularization using the following definition of appropriate use:
Coronary revascularization is appropriate when the expected benefits, in terms of survival or health outcomes (symptoms, functional status, and/or quality of life) exceed the expected negative consequences of the procedure.
Each indication was rated by the technical expert group on a scale of 1 to 9 as described below: Median Score 7 to 9
Appropriate procedure for specific indication (procedure is generally acceptable and is a reasonable approach for the indication)

WA - Health Technology Assessment December 11, 2015
Cardiac Stents – Re-Review: Final Evidence Report Page 69
Median Score 4 to 6
Uncertain for specific indication (procedure may be generally acceptable and may be a reasonable approach for the indication). Uncertainty implies that more research and/or patient information is needed to classify the indication definitively.
Median Score 0 to 3
Inappropriate procedure for that indication (procedure is not generally acceptable and is not a reasonable approach for the indication).
Task force ratings in respect to PCI are summarized in Table 12 below.
Table 12. Appropriate Use Criteria for PCI
ACCF/SCAI/STS/AATS/AHA/ASNC/HFSA/SCCT92
Appropriate Use Score* (1-9)
Indication PCI CABG
Two-vessel CAD with proximal LAD stenosis A (7) A (8)
Three-vessel CAD with low CAD burden A (7) A (9)
Three vessel CAD with intermediate to high burden U (4) A (9)
Isolated left main stenosis U (6) A (9)
Left main stenosis and additional CAD with low CAD burden U (5) A (9)
Left main stenosis and additional CAD with intermediate to high CAD burden I (3) A (9)
*A = appropriate; I = inappropriate; U = uncertain.
AATS: American Association for Thoracic Surgery; ACCF: American College of Cardiology Foundation; AHA: American Heart Association; ASCN: American Society of Nuclear Cardiology; CABG: Coronary artery bypass grafting; CAD: Coronary artery disease; HFSA: Heart Failure Practice Guideline; LAD: left anterior descending artery; PCI: Percutaneous coronary intervention; SCAI: Society for Cardiovascular Angiography and Interventions; SCCT: Society of Cardiovascular Computed Tomography; STS: Society of Thoracic Surgeons.
Consensus Statement on the Use of Fractional Flow Reserve (SCAI, 2012) A SCAI 2013 expert committee reviewed recent literature on the use of fractional flow reserve (FFR) to develop a consensus statement regarding FFR utilization in clinical practice.77 The committee concluded that FFR was definitely beneficial to assess the functional significance of intermediate and severe stenosis in SIHD when noninvasive stress imaging is contraindicated or unavailable in order to guide PCI in multivessel coronary disease and to reclassify the number of vessels and/or SYNTAX score in patients with three-vessel coronary disease. They also indicated that in SIHD, PCI is indicated in lesions of FFR < 0.80 and medical therapy is indicated in lesions of FFR > 0.80. The committee found no proven benefit in FFR measurement of a culprit lesion in a patient with acute STEMI or any unstable ACS.
2.7. Previous Systematic Reviews/Technology Assessments
A total of three meta-analyses11,122,143 provided data on PCI and stenting with medical therapy versus medical therapy alone in stable CAD patients (KQ 1) and one meta-analysis131 using patient-level data provided information on newer generation DES compared with BMS in unstable or stable CAD (KQ 2). These reports are summarized, respectively, in Tables 13 and 14 below.
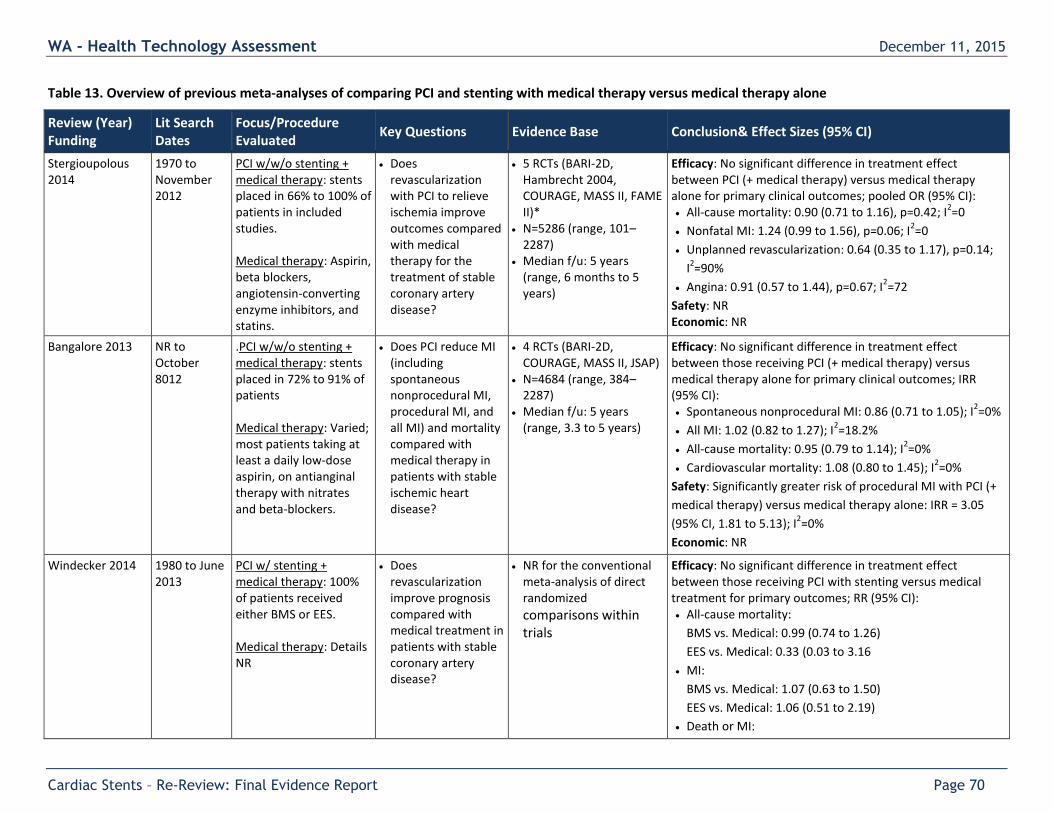
WA - Health Technology Assessment December 11, 2015
Cardiac Stents – Re-Review: Final Evidence Report Page 70
Table 13. Overview of previous meta-analyses of comparing PCI and stenting with medical therapy versus medical therapy alone
Review (Year) Funding
Lit Search Dates
Focus/Procedure Evaluated
Key Questions Evidence Base Conclusion& Effect Sizes (95% CI)
Stergioupolous 2014
1970 to November 2012
PCI w/w/o stenting + medical therapy: stents placed in 66% to 100% of patients in included studies. Medical therapy: Aspirin, beta blockers, angiotensin-converting enzyme inhibitors, and statins.
Does revascularization with PCI to relieve ischemia improve outcomes compared with medical therapy for the treatment of stable coronary artery disease?
5 RCTs (BARI-2D, Hambrecht 2004, COURAGE, MASS II, FAME II)*
N=5286 (range, 101–2287)
Median f/u: 5 years (range, 6 months to 5 years)
Efficacy: No significant difference in treatment effect between PCI (+ medical therapy) versus medical therapy alone for primary clinical outcomes; pooled OR (95% CI): All-cause mortality: 0.90 (0.71 to 1.16), p=0.42; I
2=0
Nonfatal MI: 1.24 (0.99 to 1.56), p=0.06; I2=0
Unplanned revascularization: 0.64 (0.35 to 1.17), p=0.14;
I2=90%
Angina: 0.91 (0.57 to 1.44), p=0.67; I2=72
Safety: NR Economic: NR
Bangalore 2013 NR to October 8012
.PCI w/w/o stenting + medical therapy: stents placed in 72% to 91% of patients Medical therapy: Varied; most patients taking at least a daily low-dose aspirin, on antianginal therapy with nitrates and beta-blockers.
Does PCI reduce MI (including spontaneous nonprocedural MI, procedural MI, and all MI) and mortality compared with medical therapy in patients with stable ischemic heart disease?
4 RCTs (BARI-2D, COURAGE, MASS II, JSAP)
N=4684 (range, 384–2287)
Median f/u: 5 years (range, 3.3 to 5 years)
Efficacy: No significant difference in treatment effect between those receiving PCI (+ medical therapy) versus medical therapy alone for primary clinical outcomes; IRR (95% CI): Spontaneous nonprocedural MI: 0.86 (0.71 to 1.05); I
2=0%
All MI: 1.02 (0.82 to 1.27); I2=18.2%
All-cause mortality: 0.95 (0.79 to 1.14); I2=0%
Cardiovascular mortality: 1.08 (0.80 to 1.45); I2=0%
Safety: Significantly greater risk of procedural MI with PCI (+
medical therapy) versus medical therapy alone: IRR = 3.05
(95% CI, 1.81 to 5.13); I2=0%
Economic: NR
Windecker 2014 1980 to June 2013
PCI w/ stenting + medical therapy: 100% of patients received either BMS or EES. Medical therapy: Details NR
Does revascularization improve prognosis compared with medical treatment in patients with stable coronary artery disease?
NR for the conventional meta-analysis of direct randomized comparisons within trials
Efficacy: No significant difference in treatment effect between those receiving PCI with stenting versus medical treatment for primary outcomes; RR (95% CI): All-cause mortality:
BMS vs. Medical: 0.99 (0.74 to 1.26)
EES vs. Medical: 0.33 (0.03 to 3.16
MI:
BMS vs. Medical: 1.07 (0.63 to 1.50)
EES vs. Medical: 1.06 (0.51 to 2.19)
Death or MI:

WA - Health Technology Assessment December 11, 2015
Cardiac Stents – Re-Review: Final Evidence Report Page 71
Review (Year) Funding
Lit Search Dates
Focus/Procedure Evaluated
Key Questions Evidence Base Conclusion& Effect Sizes (95% CI)
BMS vs. Medical: 1.04 (0.75 to 1.30)
EES vs. Medical: 0.87 (0.43 to 1.74)
Subsequent revascularization:
BMS vs. Medical: 0.76 (0.49 to 1.23)
EES vs. Medical: 0.16 (0.09 to 0.28)
Safety: NR Economic: NR
BMS: bare-metal stent.
*In a sensitivity analysis, the exclusion of data from FAME 2, which was the only study to exclusively use FFR rather than conventional stress testing (and was excluded from this report for that reason), the only study funded entirely by industry, the study with the shortest follow-up, and the only study that predominantly used drug-eluting stents, did not change the overall results for any end point.
Three network (mixed treatment) meta-analyses comparing PCI with medical therapy were identified in addition to the meta-analyses (using head-to-head comparisons of DES vs. BMS) listed in Table 13 above. These analyses rely on indirect comparisons of PCI with medical therapy versus medical therapy alone and include trials with differences in patient characteristics (including CAD stability), interventions (e.g. stents were not used in a large proportion of patients in some trials), co-interventions, outcome assessment as well as trials that did not meet the inclusion criteria for this review. Briefly, results from the network meta-analysis by Windecker et al. (100 trials; n=93,553; follow-up range 6 to 122 months)143 showed no statistical difference between PCI (alone, with BMS, and with early generation DES) and medical therapy for all-cause mortality and myocardial infarction, while subsequent revascularization was significantly reduced by PCI with and without stenting (any). Limited data from 21 RCTs of newer stents (n=15,557) may suggest that PCI with new generation drug-eluting stents is associated with improved survival and reduced myocardial infarction compared with medical treatment, however, there were no differences between groups when the head to head trials were reported.

WA - Health Technology Assessment December 11, 2015
Cardiac Stents – Re-Review: Final Evidence Report Page 72
Table 14. Overview of previous meta-analyses comparing newer generation DES with BMS
Review (Year) Funding
Lit Search Dates
Focus/Procedure Evaluated
Key Questions Evidence Base Conclusion & Effect Sizes (95% CI)
Valgimigli 2014 Through December 2013
Stable or unstable CAD DES: Cobalt-chromium EES BMS: NR
What is the comparative safety and efficacy of cobalt-chromium EES vs. BMS with regard to fatal and nonfatal cardiovascular outcomes?
5 RCTs (BASKET-PROVE, EXAMINATION, PRODIGY, SPIRIT I, XIMA)
N=4896 (range, 56–1539) Mean age: 67 ± 13 years Male: 75.5% Median f/u: 2 years
(range, 1–5 years)
Efficacy: Compared with patients receiving BMS, participants receiving cobalt-chromium EES had a significant reduction of cardiac mortality, fatal MI, and any MI but no significant differences between groups were seen in all-cause mortality, nonfatal MI and any MI: Cardiac mortality: 2.7% (67/2452) vs. 4.1% (99/2444)
o unadjusted HR 0.67 (95% CI, 0.49 to 0.91), p=0.01
o adjusted HR 0.69 (95% CI, 0.50 to 0.94); p=0.02
Fatal MI: 0.1% (2/2452) vs. 0.8% (18/2444)
o unadjusted HR 0.11 (95% CI, 0.03 to 0.48); p=0.003
o adjusted HR 0.11 (95% CI, 0.03 to 0.49); p=0.004
Any MI: 4.0% (98/2452) vs. 5.6% (136/2444)
o unadjusted HR 0.71 (95% CI, 0.55 to 0.93); p=0.01
o adjusted HR 0.71 (95% CI, 0.55 to 0.93); p=0.01
All-cause mortality: 4.9% (121/2452) vs. 5.9% (144/2444)
o unadjusted HR 0.83 (95% CI, 0.65 to 1.06); p=0.14
o adjusted HR 0.84 (95% CI, 0.66 to 1.07); p=0.16
Nonfatal MI: 3.9% (96/2452) vs. 4.8% (118/2444)
o unadjusted HR 0.81 (95% CI, 0.61 to 1.05); p=0.12
o adjusted HR 0.80 (95% CI, 0.61 to 1.05); p=0.12
Safety: Compared with patients receiving BMS, participants receiving cobalt-chromium EES had a significant reduction in definite stent thrombosis; 0.6% (14/2452) vs. 1.4% (33/2444)
o unadjusted HR 0.42 (95% CI, 0.22 to 0.78); p=0.006
o adjusted HR 0.41 (95% CI, 0.22 to 0.76); p=0.005
Economic: NR

WA - Health Technology Assessment December 11, 2015
Cardiac Stents – Re-Review: Final Evidence Report Page 73
Eight network (mixed treatment) meta-analyses which included evaluation of newer DES with BMS were identified in addition to the study using head-to-head comparisons listed in Table 14 above. Again, these rely on indirect comparisons with the aforementioned limitations. Briefly, results from the network meta-analysis by Palmerini et al. (22 trials, n=12,453)91 suggest that cobalt-chromium everolimus-eluting stents, but not zotarolimus-eluting stents, may be associated with lower 1-year rates of combined cardiac death or MI, all-cause death or MI, and MI only compared with BMS in patients with STEMI; these results were sustained at long-term follow for the composite outcomes only. Both everolimus- and zotarolimus-eluting stents were associated with significantly lower rates of early and late definite stent thrombosis, as well as lower 1-year and long-term rates, compared with BMS. Another network metaanalysis by Bangalore et al. (42 trials, n=10,841)10 conducted in patients with diabetes reported no significant differences in death, MI, and any stent thrombosis (including definite and very late stent thrombosis) between the DES (both everolimus- and zotarolimus-eluting stent) and BMS groups. Compared with BMS, only target lesion revascularization was significant reduced with everolimus-, but not zotarolimus-eluting, stents.
2.8. Medicare and Representative Private Insurer Coverage Policies
Variations exist in coverage policies for coronary stents for CMS and selected third-party payers. Table 9 in the 2009 report provides an overview of policy decisions and is updated below in Table 15. Medicare (National Coverage Determination) The Centers for Medicare and Medicaid Services (CMS) will cover PCI both with and without the placement of a stent when used in accordance with FDA- approved protocols for treatment of atherosclerotic lesions of a single coronary artery for patients for whom the likely alternative treatment is coronary bypass surgery and who have angina refractory to OMT, objective evidence of myocardial ischemia, lesions amenable to angioplasty. Coverage for all other is at the discretion of local CMS
contractors. Medicare (Regional Coverage Determination) The local regional CMS does not have a formal coverage determination for stent implantation. However, the local provider last updated their billing guidance in 2013, which includes the removal of two Healthcare Common Procedure Coding System (HCPCS) codes, G0290 and G0291, cited in the 2009 report. CMS replaces the HCPCS G-codes with nine HCPCS C-codes, C9600-C9608.
Aetna Aetna considers everolimus-, paclitaxel-, sirolimus-, and zotarolimus-eluting stents medically necessary for members with angina pectoris or silent ischemia and >50 % stenosis of one or more coronary arteries. All other indications are considered experimental. No information regarding the coverage of BMS was found. UnitedHealthcare UnitedHealthcare Medicare Advantage Plans will cover PTA when used in accordance with FDA-approved studies or FDA-approved Category B Investigational Device Exemption Clinical Trials for the treatment of a single coronary artery for patients for whom the likely alternative treatment is coronary bypass surgery and who have angina refractory to OMT, objective evidence of myocardial ischemia, lesions amenable to angioplasty or in patients at high risk for carotid endarterectomy (CEA).

WA - Health Technology Assessment December 11, 2015
Cardiac Stents – Re-Review: Final Evidence Report Page 74
Table 15. Overview of payer technology assessments and policies for percutaneous coronary intervention.
Payer (Year) Stent(s) Evaluated
Evidence Base Available
Specific Evaluation of DES vs. BMS Stent Use?
Policy Rationale
Centers for Medicare & Medicaid Services (CMS): National Coverage Determination Manual: 20.7 - PTA (2014)
NR NR No PTA (with and without the placement of a stent) is covered when used in accordance w/ FDA- approved protocols for treatment of atherosclerotic lesions of a single coronary artery for patients for whom the likely alternative treatment is coronary bypass surgery and who exhibit the following characteristics: (1) angina refractory to optimal medical management; (2) objective evidence of myocardial ischemia; and (3) lesions amenable to angioplasty. Coverage for all other indications for coronary PTA with stenting is at local Medicare contractor discretion. http://www.cms.gov/Regulations-and-
Guidance/Guidance/Manuals/downloads/ncd103c1_Part1.pdf
Rationale not provided
CMS Regional Coverage Article (2013)
NR NR No
HCPS codes:
C9600: Percutaneous transcatheter placement of drug eluting intracoronary stent(s), with coronary angioplasty when performed; single major coronary artery or branch
C9601: Percutaneous transcatheter placement of drug-eluting intracoronary stent(s), with coronary angioplasty when performed; each additional branch of a major coronary artery
C9602: PTCA, with drug eluting intracoronary stent, with coronary angioplasty when performed; single major coronary artery or branch
C9603: PTCA, with drug-eluting intracoronary stent, with coronary angioplasty when performed; each additional branch of a major coronary artery
C9604: Percutaneous transluminal revascularization of or through coronary artery bypass graft (internal mammary, free arterial, venous), any combination of drug-eluting intracoronary stent, atherectomy and angioplasty, including distal protection when performed; single vessel
C9605: Percutaneous transluminal revascularization of or through coronary artery bypass graft (internal mammary, free arterial, venous), any combination of drug-eluting intracoronary stent, atherectomy and angioplasty, including
Rationale not provided

WA - Health Technology Assessment December 11, 2015
Cardiac Stents – Re-Review: Final Evidence Report Page 75
Payer (Year) Stent(s) Evaluated
Evidence Base Available
Specific Evaluation of DES vs. BMS Stent Use?
Policy Rationale
distal protection when performed; each additional branch subtended by the bypass graft
C9606: Percutaneous transluminal revascularization of acute total/subtotal occlusion during acute myocardial infarction, coronary artery or coronary artery bypass graft, any combination of drug-eluting intracoronary stent, atherectomy and angioplasty, including aspiration thrombectomy when performed, single vessel
C9607: Percutaneous transluminal revascularization of chronic total occlusion, coronary artery, coronary artery branch, or coronary artery bypass graft, any combination of drug-eluting intracoronary stent, atherectomy and angioplasty; single vessel
C9608: Percutaneous transluminal revascularization of chronic total occlusion, coronary artery, coronary artery branch, or coronary artery bypass graft, any combination of drug-eluting intracoronary stent, atherectomy and angioplasty; each additional coronary artery, coronary artery branch, or bypass graft
http://www.cms.gov/outreach-and-education/medicare-learning-network-mln/mlnmattersarticles/downloads/mm8141.pdf
Aetna Clinical Policy Bulletin number 0621 (2015)
Cypher, Taxus Express, Rx Velocity, S.M.A.R.T Nitinol Self-expanding Stent, Xience V EES, Endeavor ZES
15 meta-analyses (6 months to 4 years f/u (NR for 2 studies), % f/u NR); N=115,557 (NR for 2 studies), 164 trials (NR for 2 studies) and N=182,901, 34 observational trials 7 RCTs (9-36 months f/u (NR for 1 study); % f/u NR); N=4891
Yes FDA-approved everolimus-eluting stents, paclitaxel-eluting
stents, sirolimus-eluting stents, and zotarolimus-eluting stents are considered medically necessary for members with angina pectoris or silent ischemia and > 50 % stenosis of one or more coronary arteries.
All other indications are considered experimental. Biodegradable polymer drug-eluting stents are considered
experimental.
http://www.aetna.com/cpb/medical/data/600_699/0621.html
Policy is in accordance with FDA- approved indications for sirolimus- eluting stents (Rx Velocity, Cordis, Johnson & Johnson) and paclitaxel- eluting stents (Taxus Express, Boston Scientific
Corporation).
The use of stents improves PCI outcomes, although in-stent restenosis occurs in
15-20% of stent patients.
Compared with BMS, DES are associated with a lower

WA - Health Technology Assessment December 11, 2015
Cardiac Stents – Re-Review: Final Evidence Report Page 76
Payer (Year) Stent(s) Evaluated
Evidence Base Available
Specific Evaluation of DES vs. BMS Stent Use?
Policy Rationale
4 network meta-analyses (f/u 1-4 yrs (NR for 1 study), % f/u NR); N=179,745, 237 trials 4 cohort studies (1-3 yrs f/u, % f/u NR); N=11,707 2 Systematic reviews (f/u NR, % f/u NR); N=20,021 (NR for 1 study), 39 trials
rate of repeat procedures
(PCI or CABG), restenosis
Compared with BMS, DES are associated with a similar or lower rate of adverse events, such as MI and death, although other studies and meta-analyses warn that first-generation DES may lead to an increased risk of MI, thrombosis, and non-cardiac-related death, especially at long term follow up.
Physicians urged to meet SCAI guidelines for stent
implantation and decide appropriate treatment on an individual-patient basis.
Rates of stent thrombosis may be higher in “real-world” patients than reported in RCTs
Well-designed RCTs assessing bifurcation techniques for stenting are
needed.
Comparisons with biodegradable polymer DES have not demonstrated clear benefit. Large RCTs with long-term follow up are needed.
United NR NR No PTA is covered under the following conditions: No rationale provided

WA - Health Technology Assessment December 11, 2015
Cardiac Stents – Re-Review: Final Evidence Report Page 77
Payer (Year) Stent(s) Evaluated
Evidence Base Available
Specific Evaluation of DES vs. BMS Stent Use?
Policy Rationale
Healthcare Policy Number P-002 (2015)
Treatment of atherosclerotic obstructive lesions of a single coronary artery for patients whom the likely alternative treatment is coronary bypass surgery and who exhibit the following characteristics (1) angina refractory to optimal medical management; (2) objective evidence of myocardial ischemia; and (3) lesions amenable to angioplasty
Concurrent with FDA-approved studies or FDA-approved Category B Investigational Device Exemption Clinical Trials
In patients at high risk for CEA
https://www.unitedhealthcareonline.com/ccmcontent/ProviderII
/UHC/en-US/Assets/ProviderStaticFiles/ProviderStaticFilesPdf/Tools%20and%20Resources/Policies%20and%20Protocols/UnitedHealthcare%20Medicare%20Coverage/Percutaneous_Transluminal_Angioplasty_Stenting_UHCMA_CS.pdf

WA - Health Technology Assessment December 11, 2015
Cardiac Stents – Re-Review: Final Evidence Report Page 78
2.9 Select International Coverage Recommendations
NHS (National Institute for Clinical Excellence) (UK) (2008) The NHS recommends the routine use of stents when PCI is clinically appropriate for patients with either stable or unstable angina or with acute MI. DES are recommended for the treatment of CAD according to their instructions for use if (1) the target artery is less than 3 mm in diameter or longer than 15 mm; and (2) there is no more than £300 price difference between DES and BMS. Conditions that are sufficiently managed with OMT, including many cases of stable angina, are excluded. https://www.nice.org.uk/guidance/ta71/documents/ta71-ischaemic-heart-disease-coronary-artery-stents-review-proposal-july-2014 Ontario Health Technology Advisory Committee (OHTAC) (2007) OHTAC recommends DES be offered to patients considered for stent placement who have (1) diabetes; and (2) long lesions (> 20 mm) and/or narrow lesions (<2.75 mm). OHTAC also recommends that the current support of DES not be increased at the time of report and that the Programs for Assessment of Technology in Health (PATH) continue to collect data on patients who received DES. http://www.hqontario.ca/english/providers/program/ohtac/tech/recommend/rec_des_20070330.pdf
WA - Health Technology Assessment December 11, 2015
Cardiac Stents – Re-Review: Final Evidence Report Page 79
3. The Evidence
3.1. Methods of the Systematic Literature Review
3.1.1. Objectives and key questions
The first aim of this assessment is to systematically review, critically appraise and analyze research evidence comparing the safety and efficacy of percutaneous coronary intervention with stenting (PCI) with medical therapy versus medical therapy alone in patients with stable CAD. The second aim is to update the 2009 HTA on coronary artery stenting by systematically reviewing, critically appraising and analyzing new research evidence comparing the safety and efficacy of percutaneous coronary intervention with newer generation (2nd or 3rd generation) FDA-approved drug eluting stents (DES) with bare metal stent (BMS). Key Questions:
KQ1: In patients with stable CAD:
a. Is PCI with stenting and medical therapy more effective than medical therapy in reducing death
and MI and/or improving symptoms, functional status and health-related quality of life? Does
the effect vary by (a) BMS versus medical therapy (b) DES versus medical therapy
b. What is the comparative safety of PCI with stenting versus medical therapy (including evaluation
of bleeding, renal insufficiency and serious adverse events such as nonfatal MI, death)?
c. If there is benefit to PCI compared with medical therapy alone, is there evidence of differential
benefit or harm based on specific patient characteristics or subgroups (e.g. sex, diabetes, left
main CAD, age)
d. What is the evidence of cost-effectiveness of PCI with stenting versus medical therapy?
KQ2: In patients with CAD (stable or unstable presentation) is there updated evidence subsequent to
the previous (May 2009) report that:
a. Newer generation DES are more efficacious than BMS in reducing MI and death and/or
improving symptoms, functional status and patient quality of life?
b. Newer generation DES are safer than BMS (including evaluation of thrombosis, serious adverse
events)?
c. There is differential efficacy or safety of newer generation DES versus BMS based on specific
patient characteristics or subgroups (e.g. sex, diabetes, left main CAD, age)
d. Newer generation DES are more cost effective than BMS
The objectives and key questions were refined based on input by clinical experts and were posted for public comment in July, 2014; no public comments were received.
3.1.2. Inclusion and exclusion criteria
The inclusion and exclusion criteria are summarized in Table 16. Population: For KQ 1, patients with stable CAD, for KQ 2, patients with CAD undergoing stenting of coronary vessels (stable or unstable presentation) for de novo lesions

WA - Health Technology Assessment December 11, 2015
Cardiac Stents – Re-Review: Final Evidence Report Page 80
Intervention: FDA approved bare-metal stent (BMS) or drug-eluting stent (DES)
Comparator(s): Medical therapy (KQ1), BMS versus DES (KQ2) Outcomes:
Efficacy/effectiveness
Primary outcomes: All-cause mortality and cardiac death, myocardial infarction (MI) and patient-reported outcomes: quality of life, symptom relief, functional status measured with standardized measures such as the Seattle Angina Questionnaire, Patient Health Questionnaire, and Rose Dyspnea Score
Secondary or intermediate outcomes: Repeat revascularizations (KQ 2 only)
Safety and harms outcomes: Thrombosis, pharmacological, or procedural complications, bleeding, renal insufficiency, stent fracture, loss, perforation, dissection, or structural problems; serious adverse events (e.g. nonfatal MI, death, stroke, need for emergent CABG, vascular complications requiring intervention)
Economic: Cost-effectiveness (e.g., cost per improved outcome), cost-utility (e.g., cost per quality adjusted life year (QALY), incremental cost effectiveness ratio (ICER)) outcomes
Study Design: This report focuses on evidence that evaluated efficacy and has the least potential for bias. High quality systematic reviews and meta-analyses of head to head trials were considered appraised and incorporated if feasible. RCTs and prospective comparative cohort studies with low risk of bias published subsequent to such reviews will be evaluated based on the PICO inclusion/exclusion criteria. As Key Question Q 2 serves to update the 2009 assessment, only comparative studies published subsequent to that review which focus on newer generation, FDA-approved DES were included and described; results will be described based on the context of previous findings. For Key Questions 1c and 2c, RCTs which stratify on patient or other characteristics and formally evaluate statistical interaction (effect modification) will be sought. Comparative observational studies designed specifically to evaluate safety were considered. For Key Questions 1d and 2d, only full, formal economic studies (i.e., cost-effectiveness, cost-utility, cost-minimization, and cost-benefit studies) will be considered. Because randomized controlled trials and/or meta-analyses of head-to-head trials are available and provide direct comparative evidence of (a) stents to optimal medical therapy and (b) BMS to DES, network meta-analyses were excluded as part of the evidence base for this report but were summarized as appropriate in Section 2. Briefly, network meta-analyses provide comparative evidence by utilizing both direct and indirect evidence across a group of randomized controlled trials that have at least one common intervention (e.g., a network of trials includes RCTs that directly compare treatments A to B as well as RCTs that directly compare treatments B to C can provide indirect comparative estimates for treatments A to C).57,97 Network meta-analyses are particularly useful when no RCTs available directly compare the interventions of interest.57 The primarily limitation of network meta-analyses stem from the use of indirect evidence, which may be susceptible to increased risk of bias due to intransivitiy (i.e., differences in study characteristics between trials that may function as effect modifiers; such as differences in patient characteristics, interventions, co-interventions, outcome assessment, etc.). The GRADE Working Group advises that when intransivity is suspected for a given indirect comparison the overall strength of evidence for the resulting effect estimate should be downgraded for indirectness and suggests a “low threshold” for grading down for indirectness.97

WA - Health Technology Assessment December 11, 2015
Cardiac Stents – Re-Review: Final Evidence Report Page 81
Table 16. Summary of inclusion and exclusion criteria
Study Component
Inclusion Exclusion
Population
KQ 1
Patients with stable CAD
KQ 2
Patients with CAD undergoing
stenting of coronary vessels (stable
or unstable presentation)
KQ1 and 2
Patients in whom stent placement would be
contraindicated
KQ 1
Patients with STEMI, NSTEMI patients with ST
depression of >1mm in >1 lead and troponin
elevation;
Patients with persistent CCS class IV angina or post
infarction angina
Patients with refractory heart failure, ejection
fraction <30%
Post MI patients who are within 1 month post MI
receiving stent
KQ 2
Patients presenting for treatment of restenosis,
stent thrombosis or revascularization after initial PCI
or CABG or rescue PCI
Intervention
KQ 1
FDA approved bare-metal or drug-
eluting stents
KQ 2
FDA approved 2nd
or 3rd
generation
drug eluting stents
KQ 1 and 2
Non-FDA approved stents
Drug eluting balloons
KQ 2
Studies of 1st
generation DES or those that are no
longer in routine use
Comparators KQ 1
Medical therapy
KQ 2
Bare metal stent (BMS vs. newer
DES)
KQ1
Studies which did not describe more contemporary
components of medical therapy to include
pharmacological therapy as well as lifestyle-related
factors (e.g. diet, exercise); studies in which at least
50% of patients did not receive statins
KQ1 and 2
Ultrasound guided stent placement
Non FDA Approved Stents
Drug Eluting Balloons
Comparison of “selective” vs. “routine”
revascularization or “early” vs. “delayed”
revascularization
Fractional flow reserve guided PCI
Studies in which < 70% of patients received stenting
as the PCI intervention will be excluded
KQ 2
Studies comparing different DES types which do not
compare to BMS

WA - Health Technology Assessment December 11, 2015
Cardiac Stents – Re-Review: Final Evidence Report Page 82
Study Component
Inclusion Exclusion
Studies comparing pharmacologic regimens, anti-
platelet medications or fibrinolysis or adjunctive
medical therapies or devices
Outcomes KQ 1 and 2
Primary clinical outcomes (efficacy and
effectiveness studies must report on
mortality and MI separately from MACE)
All-cause mortality and cardiac death
Myocardial infarction
Patient-reported outcomes (quality
of life, symptom relief, functional
outcomes using standardized
measures such as the Seattle Angina
Questionnaire, Patient Health
Questionnaire, Rose Dyspnea Score)
KQ 2
Secondary/intermediate outcome
Repeat revascularizations
KQ 1 and 2 Safety
Thrombosis (any time period)
Pharmacological, surgical or
procedural complications, including
serious adverse events (e.g., nonfatal
myocardial infarction, stroke, death
within 30 day periprocedural time,
emergent CABG, vascular
complications requiring intervention)
Bleeding
Renal insufficiency
Stent fracture, loss, perforation,
dissection, or structural problems
Economic
Cost-effectiveness (e.g., cost per
improved outcome), cost-utility (e.g.,
cost per QALY, incremental cost
effectiveness ratio (ICER)) outcomes
Study Design Systematic reviews, HTAs and
comparative effectiveness reviews,
with or without meta-analysis, with
the least potential for bias (based on
AMSTAR or similar accepted
Studies that randomize intervention and comparator
by vessel versus patient level randomization
Studies that do not allow comparison of intervention
and comparators for primary outcomes
Indirect analyses (including network meta-analyses)

WA - Health Technology Assessment December 11, 2015
Cardiac Stents – Re-Review: Final Evidence Report Page 83
Study Component
Inclusion Exclusion
assessment criteria). Meta-analyses
of head to head trials or individual
patient data will be the focus.
Only comparative studies (e.g. RCTs
and cohort studies with concurrent
controls and low potential for bias
will be considered for questions 1
and 2.
o Comparative nonrandomized
studies, which evaluate and
appropriately control for specific
potentially confounding factors
(e.g. age, smoking status) will be
considered for inclusion if they
are designed specifically to
evaluate safety. Preference will
be given to well-conducted
prospective studies.
Formal, full economic studies will be
sought for question 1d and 2d
if direct analyses are available.
For questions 1 and 2, studies other than
comparative studies with low risk of bias and
concurrent controls will be excluded
RCTs of fewer than 40 patients per arm;
Observational studies of fewer than 100 patients
Case reports
Case series
Costing studies, partial economic analyses
Publication Studies published in English in peer
reviewed journals or publically
available FDA reports
For Key Questions 1d and 2d, full
formal economic analyses (e.g. cost-
utility studies) published in English in
a peer-reviewed journal published
after those represented in previous
HTAs.
KQ 1 and KQ 2
Abstracts, editorials, letters
Duplicate publications of the same study which do
not report on different outcomes
Single reports from multicenter trials
White papers
Meeting abstracts, presentations or proceedings
Narrative reviews
Articles identified as preliminary reports when
results are published in later versions
Incomplete economic evaluations such as costing
studies
KQ 1
Studies published prior to June 1, 2003
KQ2
Studies published prior to December 1, 2008
BMS: bare metal stent; CABG: coronary artery bypass graft; CAD: coronary artery disease; CCS: Canadian Cardiovascular Society; DES: drug-eluting stent; FDA: Food and Drug Administration; HTA: health technology assessment; KQ: Key Question; MACE: major adverse cardiac events; NSTEMI: non-ST elevation myocardial infarction; PCI: percutaneous coronary intervention; QALY: quality-adjusted life years; RCT: randomized controlled trial; STEMI: ST elevation myocardial infarction.

WA - Health Technology Assessment December 11, 2015
Cardiac Stents – Re-Review: Final Evidence Report Page 84
3.1.3. Critical and primary outcomes
Emphasis was placed on hard clinical outcomes that are directly related patient health outcomes. The issues of safety and efficacy are intertwined and difficult to separate. This is particularly true for DES since the use of anti-proliferative drug which are an integral part of DES provide both the mechanism which can lead to the prevention of in-stent stenosis (as intended) and potentially the mechanism by which thrombosis may occur due to the interaction between the coagulation process and a non-endotheleized stent [KCE].85 The separation of efficacy and safety outcomes in this reports is thus, somewhat artificial. Since the primary focus of revascularization should be the improvement in clinical health outcomes (e.g. mortality, freedom from MI) and since such outcomes have been a primary focus in the previous technology assessment, they are the primary outcomes reported in this assessment. Composite outcomes reported were defined differently by different trials and combined critical outcomes like death with less serious outcomes like nonfatal MI, and included potentially non-objective outcomes which may have been protocol driven like revascularization. For these reasons, to avoid obscuring results of important component outcomes, and to be consistent with our previous report, in this assessment we are reporting the results of individual components, rather than composite outcomes. Overall quality (strength) of evidence was not assessed for composite outcomes. For purposes of this report the following primary/critical outcomes are discussed under efficacy and the overall quality (strength) of evidence was assessed: Death (all cause), cardiac death, myocardial infarction (any), and patient reported quality of life (e.g. Seattle Angina Questionnaire). Target lesion revascularization (TLR) and target vessel revascularization (TVR) were considered intermediate, secondary outcomes; overall strength of evidence was assessed for these outcomes. The following outcomes constitute the primary/critical safety outcomes for which quality (strength) of evidence was assessed: Definite stent thrombosis within the stented segment, confirmed by angiography or post-mortem based on the Academic Research Consortium (ARC) criteria, peri-procedural (≤ 30days) complications (MI, stroke) and major bleeding.
3.1.4. Data sources and search strategy
Electronic database were searched from 2003 to July 9, 2015 for KQ 1 and from 2009 to July 9, 2015 date for KQ 2. Electronic databased searched included PubMed, EMBASE, AHRQ, ClinicalTrials.gov and INAHTA for eligible studies, including health technology assessments (HTAs), systematic reviews, primary studies and FDA reports. Reference lists from eligible studies were hand searched for potentially relevant studies. The search strategies used for PubMed and EMBASE are shown in Appendix B. Figure 2 shows a flow chart of the results for all searches for included studies. For KQ 2, only studies published subsequent to the previous review were considered. Articles excluded at full-text review are listed in Appendix C.

WA - Health Technology Assessment December 11, 2015
Cardiac Stents – Re-Review: Final Evidence Report Page 85
Figure 2. Flow chart of literature search results for KQ 1 (PCI with stenting versus medical therapy alone) and KQ 2 (newer generation DES vs. BMS)
3.1.5. Data extraction
Reviewers extracted the following data from the included clinical studies: Study design, inclusion and exclusion criteria, country and number of centers, funding source, study population characteristics, study type, patient demographics and preoperative diagnoses, study interventions, follow-up time, and study outcomes. An attempt was made to reconcile conflicting information among multiple reports presenting the same data. For economic studies, data related to sources used, economic parameters and perspectives, results, and sensitivity analyses were abstracted. Detailed study characteristics and results are available in Appendix F and G; summaries of demographics and interventions are presented in Tables 17 and 29 in the results section.
5. Publications included
Key question 1 (n = 39)
KQ1a Efficacy (n = 15)
KQ1b Safety (n = 9)
KQ1c Differential efficacy and safety (n = 16)
KQ1d Cost effectiveness (n = 7)
Key question 2 (n = 21)
KQ2a Efficacy (n = 8)
KQ2b Safety (n = 17)
KQ2c Differential efficacy and safety (n = 4)
KQ2d Cost effectiveness (n = 1)
1. Total Citations
Key question 1 (n = 489)
Key question 2 (n = 3408)
2. Title/Abstract exclusion
Key question 1 (n = 434)
Key question 2 (n = 3293)
4. Excluded at full-text review
Key question 1 (n = 16)
Key question 2 (n = 94)
3. Retrieved for full-text evaluation
Key question 1 (n = 55)
Key question 2 (n = 115)

WA - Health Technology Assessment December 11, 2015
Cardiac Stents – Re-Review: Final Evidence Report Page 86
3.1.6. Quality assessment: study risk of bias, overall strength of evidence and QHES evaluation
The method used by Spectrum Research, Inc. (SRI) for assessing the quality of evidence of individual studies as well as the overall quality of evidence incorporates aspects of the rating scheme developed by the Oxford Centre for Evidence-based Medicine,1122 precepts outlined by the Grades of Recommendation Assessment, Development and Evaluation (GRADE) Working Group,9 and recommendations made by the Agency for Healthcare Research and Quality (AHRQ).140 Economic studies were evaluated according to The Quality of Health Economic Studies (QHES) instrument developed by Ofman et al.89 Details of the CoE and QHES methodology are available in Appendix D. Based on these quality criteria, each study chosen for inclusion for a Key Question was assessed for risk of bias and given a CoE (or QHES) rating; details of each rating are available in Appendix E. Standardized abstraction guidelines were used to determine the risk of bias (and related class of evidence CoE) or QHES for rating for each study included in this assessment. Observational studies were considered to have been conducted retrospectively unless clearly stated otherwise. The strength of evidence for the overall body of evidence for all critical health outcomes was assessed by one researcher and independently reviewed by a second researcher following the principles for adapting GRADE (Grades of Recommendation Assessment, Development and Evaluation) as outlined by the Agency for Healthcare Research and Quality (AHRQ).13 The strength of evidence was based on the highest quality evidence available for a given outcome. In determining the strength of body of evidence regarding a given outcome, the following domains were considered:
Risk of bias: the extent to which the included studies have protection against bias
Consistency: the degree to which the included studies report results that are similar in terms of range and variability.
Directness: describes whether the evidence is directly related to patient health outcomes.
Precision: describes the level of certainty surrounding the effect estimates.
Publication bias: is considered when there is concern of selective publishing.
Additional domains evaluated in studies performing a formal test of interaction for subgroup modification (i.e., heterogeneity of treatment effect, HTE) based on recommendations from Oxman and Guyatt90 and are detailed in Appendix D. Briefly, primary criteria considered include the following: sub group analyses/hypotheses should be developed a priori, including hypothesized direction of effect differences, subgroup differences should be evaluated within studies, statistical analysis evaluating the role of chance as an explanation for subgroup differences, number of hypotheses tested, consideration of subgroup difference consistency across studies for important outcomes and consideration of biological or sociological plausibility for the hypothesized subgroup difference. Bodies of evidence consisting of RCTs were initially considered as High strength of evidence, while those comprised of nonrandomized studies began as Low strength of evidence. The strength of evidence could be downgraded based on the limitations described above. There are also situations where the nonrandomized studies could be upgraded, including the presence of plausible unmeasured confounding and bias that would decrease an observed effect or increase an effect if none was observed, and large magnitude of effect (strength of association). The final strength of evidence was assigned an overall grade of high, moderate, low, or insufficient, which are defined as follows:
High - Very confident that effect size estimates lie close to the true effect for this outcome; there are few or no deficiencies in the body of evidence; we believe the findings are stable.

WA - Health Technology Assessment December 11, 2015
Cardiac Stents – Re-Review: Final Evidence Report Page 87
Moderate – Moderately confident that effect size estimates lie close to the true effect for this outcome; some deficiencies in the body of evidence; we believe the findings are likely to be stable but some doubt remains.
Low – Limited confidence that effect size estimates lie close to the true effect for this outcome; major or numerous deficiencies in the body of evidence; we believe that additional evidence is needed before concluding that findings are stable or the estimate is close to the true effect.
Insufficient – We have no evidence, are unable to estimate an effect or have no confidence in the effect estimate for this outcome; OR no available evidence or the body of evidence has unacceptable deficiencies precluding judgment.
Similar methods for determining the overall quality (strength) of evidence related to economic studies have not been reported, thus the overall strength of evidence for outcomes reported in Key Questions 1d and 2d was not assessed.
3.1.7. Analysis
An attempt to pool results was made when two or more randomized controlled trials of similar quality presented identical outcomes over similar time periods. Due to differences in study quality, RCTs were not pooled with comparative observational studies. For dichotomous outcomes that could be pooled, risk differences and figures as well as risk ratios were produced using Cochrane’s Review Manager v5.3 2014 after the difference within each study was weighted and pooled the Mantel-Haenszel method. DerSimonian and Laird Random Effects model assumed to incorporate inter-study variability. I2 statistics following a Chi-squared distribution were presented to show an approximated proportion of variability due to study heterogeneity not relating to sampling error. P-value of subgroup differences and test for overall difference in intervention effect was found assuming a standard normal distribution. Meta-analyses with small numbers of studies and small sample sizes using the DerSimonian and Laird Random Effects model may produce less accurate results in some instances.46,64 To confirm primary results, meta-analyses were repeated using profile likelihood methods48 and where potential differences in inference were identified between the two methods, the profile likelihood method was emphasized. For outcomes that could not be pooled, risk differences and risk ratios were calculated using the Rothman Episheet (www.krothman.org/episheet.xls). For continuous outcomes, mean differences (MD) and their respective 95% confidence intervals were calculated. Change in scores from baseline (mean ± SD) was calculated if not reported by the study authors. Change SD was calculated using the baseline SD (preSD) and follow-up SD (postSD) with the following formula: √[(preSD2 + postSD2) - (2 x 0.8 x preSD x post SD)].

WA - Health Technology Assessment December 11, 2015
Cardiac Stents – Re-Review: Final Evidence Report Page 88
3 Results
4.1. Key Question 1: PCI with Stenting and Medical Therapy versus Medical Therapy Alone in Patients with Stable CAD
4.1.1. Study characteristics
The literature search yielded 489 potentially relevant citations based on the search strategy outlined in Appendix A. Of these 436 were excluded based on title and abstract and 53 were reviewed at full text. For Key Question 1 parts a, b, and c, a total of 32 citations (from four trials) review.12,14-16,21-23,25-28,36,47,52-
54,71,75,78-81,99,108,109,112-114,118,124,135,138 were included after full-text review; 13 citations were excluded after full-text review (see Appendix C). No nonrandomized comparative studies were identified that focused on safety outcomes (see methods for how safety outcomes were defined in this report). For Key Question 1 part d (cost-effectiveness), four economic analyses also met the inclusion criteria and were published across seven citations35,47,50,134,136,137,145; three citations were excluded after full-text review (see Appendix C). All of the included economic studies employed the trials discussed in Key Question 1 parts a, b, and c.
Across the four included trials, common methodological limitations included inadequate detail regarding random sequence generation (Hambrecht, BARI 2D, and MASS-II trials) and allocation concealment (all four trials). Independent or blind assessment was typically done for the hard clinical outcomes but less commonly for patient-reported outcomes. Overall, one trial was considered to be at moderately low risk of bias (COURAGE); the other three were considered to be at moderately high risk of bias. See Appendix E for details regarding methodological limitations of individual studies.
Study, patient and intervention characteristics are found in Table 17. Detailed information, including inclusion/exclusion criteria, funding and patient characteristics is found in Appendix F. Two included trials were conducted in the general population (COURAGE, MASS-II), while two were conducted in special populations: males (Hambrecht) and type 2 diabetes (BARI 2D). The characteristics of and results from these trials were considered within these parameters.
General population
Two trials were conducted in the general population, the COURAGE trial14-16,26,78-81,108,109,113,114,124,138 and the MASS-II trial.36,52-54,71,75,99,118 The COURAGE trial14 was a large (N=2287) multicenter trial conducted in the US and Canada in which patients were randomized to PCI plus optimal medical therapy (n=1149) or optimal medical therapy alone (n=1138). Patients with stable CAD, Canadian Cardiovascular Society (CCS) class I to III angina, and angiographically confirmed stenosis (≥70% stenosis with documented ischemia or ≥80% stenosis with classic angina without stress testing) with lesions suitable for PCI were included; those requiring emergency revascularization, with persistent CCS class IV angina, or with a history of revascularization within the past 6 months were excluded. The MASS-II trial54 was a smaller (N=611) single-center trial conducted in Brazil and which randomized patients to either PCI plus optimal medical therapy (n=205), optimal medical therapy alone (n=203), or CABG plus optimal medical therapy; the latter group is beyond the scope of this report and will not be further considered. MASS-II included patients with stable CAD, CCS class II or III angina, and angiographically confirmed multivessel stenosis (>70%) with lesions suitable for either PCI or CABG; those requiring emergency revascularization or with any history of any revascularization were excluded. Additional criteria are specified in the Appendix F. The enrollment criteria between the two trials varied in that CCS class I patients, patients with single-vessel lesions, and patients with prior revascularization were included in the COURAGE trial but excluded from the MASS-II trial. Taken together, these study characteristics suggest that the patients in

WA - Health Technology Assessment December 11, 2015
Cardiac Stents – Re-Review: Final Evidence Report Page 89
the COURAGE trial had less severe disease in general than those enrolled in MASS-II. All patients received individualized medical therapy to improve signs and symptoms of disease (see Table 17 and Appendix F for details); in the COURAGE trial they also received counseling on lifestyle modifications including diet, weight loss, smoking cessation or prevention, and exercise, while in the MASS-II trial they were prescribed a low-fat diet. Stents were used in 72% to 87.6% of patients in the PCI groups: BMS were used in 72% and 84.9% of PCI patients in the MASS-II and COURAGE trials, respectively, while DES were used in only 2.7% of PCI patients in COURAGE. Baseline characteristics were similar between treatment groups in the COURAGE trial, however in the MASS-II trial significantly more PCI patients had had a prior MI (52% versus 39% in the medical therapy group, p=0.0072), significantly fewer PCI patients had diabetes (23% versus 36% in the medical therapy group, p=0.0039), and significantly more PCI patients had a positive treadmill test (47% versus 33%, p=0.0061); multivariate analysis was done to control for baseline differences in some analyses and are reported here when available. There are several differences in baseline characteristics between the COURAGE and MASS-II trials: more COURAGE patients were male (85% versus 68% in MASS-II), more COURAGE patients had single vessel disease as discussed above (31% versus 0% in MASS-II), fewer COURAGE patients had three or more diseased vessels (31% versus 59% in MASS-II), and more COURAGE patients had undergone prior PCI or CABG as discussed above (16% and 11%, respectively, versus 0% for both in MASS-II).
Special population: Males
Hambrecht et al.47,135 conducted a single-center trial that compared PCI to exercise therapy in 101 male patients aged 70 years or younger who had stable CAD. For inclusion, patients were required to have stenosis of 75% or more in at least one coronary artery, CCS class I to III angina, and stress-induced ischemia during noninvasive stress testing. Those with acute coronary syndrome, MI within the last two months, and/or revascularization within the previous 12 months were excluded; additional exclusion criteria are listed in the appendix. All patients underwent coronary angiography at baseline and again at 12 months to assess the degree of atherosclerosis. All patients received medical therapy, which was optimized for each patient based on the current guidelines at the time and administered by the patient’s private physicians. Patients randomized to PCI (n=50) received BMS, while those randomized to exercise training (n=51) undertook a 12-month bicycle ergometry program that consisted of an initial in-hospital training program (10 minutes at 70% of the symptom-limited maximum heart rate, six times a day for two weeks) followed by daily 20 minute exercise at the same heart rate plus one 60 minute group aerobic exercise session every week. Baseline characteristics were generally similar between groups; the one exception was that the mean baseline CCS class score was significantly higher (worse) in the PCI group (1.7 ± 0.1 versus 1.5 ± 0.1, MD -0.20, 95% CI -0.24 to -1.6, p<0.001). Mean age was 61 years. A history of myocardial infarction (occurring ≥2 months prior to enrollment) was documented for 45.5% of patients; the percentage of patients with prior revascularization (≥12 months prior to enrollment) was not reported. Outcomes were reported at 12 and 24 months. There was 100% follow-up for hard clinical outcomes (e.g., death, MI, stroke, and revascularization) and 76% follow-up for angina severity and exercise capacity outcomes. Additional patient and study characteristics are available in Table X.
Special population: Type 2 Diabetes
The BARI 2D was an international multi-center trial assessed the impact various treatment strategies for CAD in patients with diabetes.12,21-23,25,27,28,112 Adults with type 2 diabetes, ischemia, and angiographically confirmed stenosis (≥50% stenosis with stress-test verified ischemia or ≥70% stenosis plus angina on exertion); those requiring immediate revascularization or who had been revascularized within the past 12 months were excluded.23 Additional criteria are specified in Appendix F. Each of the enrolled 2368 patients were placed into one of two strata (PCI-intended or CABG-intended) by the treating physician based on angiography results. Overall, patients entered into the PCI-intended stratum had less severe
WA - Health Technology Assessment December 11, 2015
Cardiac Stents – Re-Review: Final Evidence Report Page 90
disease than those selected for the CABG stratum.25 The focus of this report is on those who were placed into the PCI-intended strata; these 1605 patients were randomized to receive either prompt PCI (n=798) or intensive medical therapy (n=807). (While patients were further randomized to one of two glycemic control treatments (insulin sensitization or insulin provision), the comparative impact of these treatments is beyond the scope of this report.) All patients received guideline-based medical therapy, which included optimized management of lipids and blood pressure, as well as counseling to support smoking cessation, exercise, and weight loss. Patients randomized to PCI underwent revascularization within four weeks and 90.7% received a stent (BMS in 56.0% and DES in 34.7% of patients).112 Patients randomized to medical therapy underwent revascularization only if it became medically necessary. The PCI and medical therapy groups were well-balanced in terms of baseline characteristics,28 with one exception: significantly more patients in the revascularization (PCI and CABG combined) group had worse angina (defined as CCS class 3 or 4) compared with those in the medical arms (of the PCI and CABG strata combined) (22% versus 15%, p=0.002).23 Mean patient age was 62.0 years, and 67.8% of patients were males. Patients with unstable angina comprised 10.7% of the population; the remainder of patients had stable angina class 1 or 2 (41.3%), stable angina class 3 or 4 (7.9%), angina equivalents or no angina (22.3%), or no angina nor angina equivalents (17.7%). Nearly a third (30.1%) of patients had a history of MI (timing not reported) and 28.6% had undergone prior revascularization. The mean duration of diabetes was 10.4 ± 8.8 years.

WA - Health Technology Assessment December 11, 2015
Cardiac Stents – Re-Review: Final Evidence Report Page 91
Table 17. PCI versus medical therapy: Patient demographics and study characteristics
Boden 2007 [COURAGE]
Hueb 2004 [MASS-II]
Hambrecht 2004 Chaitman 2009 [BARI-2D]
Characteristics
PCI (n = 1149)
Medical (n = 1138)
PCI (n = 205)
Medical (n = 203)
PCI (n = 50)
Medical (n = 51)
PCI (n=798)
Medical (n = 807)
Patient demographics Males, % (n) 85.0% (977) 85.0% (967) 67% (137) 69% (140) 100% (50) 100% (51) 68.6% (547) 67.0% (541) Age, years; mean (SD) 61.2 ± 10.1 61.8 ± 9.7 60 ± 9 60 ± 9 60 ± 1 62 ± 1 62.1 ± 9.0 62.0 ± 9.3 Subgroup None None None None Males Males Type 2 Diabetes Type 2 Diabetes
Number diseased vessels, % (n) One 31% (361) 30% (343) 0% (0) 0% (0) 60% (30) 57% (29) 45.2% (361) 43.8% (353) Two 39% (446) 39% (439) 42% (86) 41% (83) 28% (14) 26% (13) 34.5% (276) 35.7% (288) Three + 30% (341) 31% (355) 58% (119) 59% (120) 12% (6) 18% (9) 20.2% (161) 20.5% (165)
Comorbidities, % (n) Prior MI 38% (437) 39% (439) 52% (107) 39% (79) 39% (20) 52% (26) 30.8% (246) 29.5% (238) Prior PCI 15% (174) 16% (185) 0% (0) 0% (0) 0% (0) 0% (0) 23.7% (189) 22.5% (182) Prior CABG 11% (124) 11% (124) 0% (0) 0% (0) 0% (0) 0% (0) 8.0% (34) 9.9% (80) Diabetes 32% (367) 35% (399) 23% (47) 36% (73) 22% (11) 23% (12) 10.3 ± 8.7‡‡ 10.5 ± 8.9‡‡ Hyperlipidemia NR NR NR NR 86% (43) 77% (39) NR NR Hypertension 66% (757) 67% (764) 61% (125) 55% (112) 70% (35) 82% (42) 81.7% (652) 82.4% (665) Smoking 23% (260) 23% (259) NR NR 16% (8) 8% (9) 13.7% (109) §§ 12.6% (102) §§
Treatment PCI with stenting Received stents* 88% (1011) NR 72% (148) NR 100% (50) NR 87% (694) NR
No. stents per lesion, mean (SD)
NR NR NR NR NR NR NR NR
No. vessels stented, mean (SD) NR NR NR NR NR NR NR NR Glycoprotein IIb/IIIa inhibitors NR NR 0% (0) 0% (0) NR NR NR NR
Medical therapy Statins/Lipid lowering NR NR
HMG-CoA reductase inhibitors
% NR† % NR† 73% (150) 68% (138) 80% (40) 72% (36) - -
Statin, not further defined 86% (992) 89% (1014) NR NR NR NR NR NR Other antilipid 8% (89) 8% (94) NR NR NR NR NR NR
Hypertension treatment Beta-blockers 85% (975) 89% (1008) 61% (125) 68% (138) 86% (43) 88% (45) NR NR ACE inhibitors 58% (669) 60% (680) 30% (62) 29% (59) 88% (44) 74% (38) NR NR ARB 4% (48) 5% (54) NR NR NR NR NR
Anti-anginal medications Long-acting nitrates NR NR 41% (84) 73% (148) NR NR NR NR

WA - Health Technology Assessment December 11, 2015
Cardiac Stents – Re-Review: Final Evidence Report Page 92
Boden 2007 [COURAGE]
Hueb 2004 [MASS-II]
Hambrecht 2004 Chaitman 2009 [BARI-2D]
Characteristics
PCI (n = 1149)
Medical (n = 1138)
PCI (n = 205)
Medical (n = 203)
PCI (n = 50)
Medical (n = 51)
PCI (n=798)
Medical (n = 807)
Nitrates, not further defined 62% (714) 72% (825) NR NR NR NR NR NR Calcium channel antagonists 40% (459) 40% (415) 30% (62) 61% (124) NR NR NR NR
Other See footnote‡
See footnote‡ NR NR NR NR NR
NR
Insulin NR NR 9% (18) 13% (26) NR NR NR NR
Oral hypoglycemic agents NR NR 14% (29) 22% (45) NR NR NR NR
Aspirin 96% (1097) 95% (1077) 80% (164) 80% (162) 98% (49)** 98% (50)** NR NR
Other anti-platelet (duration) See footnote§
NR NR
NR 100% (49)†† NR NR NR
Crossover (%, N) NR 3 mos. (22%; 240)
Immediately after randomization
(1.5%; 3)
10 yrs. (14.3%; 29)
NR NR 5 yrs. (43.3%; 349) 5 yrs. (42.1%; 502)
Follow-up (% followed) 4.6 years (91%;
1042/1149)
4.6 years (91%;
1041/1138)
10 years (100%; 205/205)
10 years (100%;
203/203)
12 mos. (100%; 50/50)
12 mos. (100%; 51/51)
3 years (86.7%; 2053/2368)***
5 years (47.3%;
1121/2368)
3 years (86.7%; 2053/2368)***
5 years (47.3%;
1121/2368) Risk of bias (COE) Moderately Low (II) Moderately High (III) Moderately High (III) Moderately High (III)
ACE: Angiotensin converting enzyme; ARB: Angiotensin Receptor Blocker; CABG: Coronary Artery Bypass Grafting; COE: Class of Evidence; HMG-CoA: 3-hydroxy-3-methyl-glutaryl-CoA reductase; MI: Myocardial Infarction; N: Number; NR: Not Reported; PCI: Percutaneous Coronary Intervention; SD: Standard Deviation
* PCI patients receiving bare metal stents (BMS) and drug-eluting stents (DES) in each trial: COURAGE: 85% BMS, 3% DES; MASS II: 72% BMS, 0% DES; Hambrecht: 100% BMS, 0% DES; BARI 2D: 33% BMS, 54% DES
† Simvastin with or without ezetimibe was administered at dosage up to 80 mg/d.
‡ Anti-ischemic therapy included long-acting metoprolol, amlodipine, and isosorbide mononitrate, alone or in combination. Dose and frequency NR.
§ Aspirin at 81 to 351 mg/d or Clopidogrel at 75 mg/d (6 to 9 months).
** Aspirin administered at 100 mg/d throughout study period.
†† Clopidogrel administered at 75 mg/d for 4 weeks.
‡‡ Values represent duration of diabetes in years.
§§ Also reported are Former Smoker (PCI vs. Med): 52.2% vs 56.0%.
*** Follow-up not parsed by treatment group. This group also includes a CABG strata (n = 763), not included in this analysi

WA - Health Technology Assessment December 11, 2015
Cardiac Stents – Re-Review: Final Evidence Report Page 93
4.1.2. Efficacy and Effectiveness
All-cause mortality (primary outcome)
Summary
All four RCTs12,15,47,54 provided data on all-cause mortality, and all reported no statistically significant differences between treatment groups, with outcomes reported between 12 months and 120 months (Table 18).
General population
The MASS-II trial found no statistically significant differences between PCI and control groups in all-cause mortality through 12 months54 (4.4% versus 1.5%; RD 2.9%, 95% CI -0.4% to 6.2%; RR 3.0, 95% CI 0.8 to 10.8; p=0.0821), 60 months53 (11.7% versus 12.3%; adjusted RR 0.92, 95% CI 0.46 to 1.86, p=0.94), or 120 months (24.1% versus 31.0%; RD -7.1%, 95% CI -15.7% to 1.5%; RR 0.8, 95% CI 0.6 to 1.1, p=0.107). Estimates at 12 and 120 months were not adjusted for confounding variables between groups at baseline (i.e., MI, diabetes).
In the COURAGE trial,15 all-cause death occurred similarly between PCI and control groups through a median of 55.2 (range, 30 to 84) months (7.4% versus 8.4%; RD -1.0%, 95% CI -3.2% to 1.3%; RR 0.89, 95% CI 0.67 to 1.17; p=0.40). A follow-up report of this published after search dates for this HTA was brought to our attention and the following information is included for additional context only: At a median of 11.9 years (mean 10.5 years, range 0 to 15 .3 years), based extended follow-up information on 53% of the original study population, comprised primarily there was no difference in survival between groups. 107
Special population: Males
Hambrecht et al.47,135 found no difference in all-cause mortality through 24 months between the PCI plus medical therapy and exercise plus medical therapy groups (4% versus 2%; RD 2%, 95% CI -5% to 9%; RR 2.0, 95% CI 0.2 to 21.8, p=0.55), although the study was insufficiently powered to detect differences between groups.
Special population: Type 2 Diabetes
Through a mean of 63.6 (range, 40.8 to 93.6) months follow-up, death from any cause occurred similarly between groups in the BARI-2D trial,12,25 occurring in 12.8% of the PCI plus medical therapy group and in 11.9% of the medical therapy alone group (RD 0.9%, 95% CI -2.3% to 4.1%; RR 1.07, 95% CI 0.8 to 1.4; p=0.59). Sixty-month Kaplan-Meier estimates were similar, showing no difference between groups (10.8% versus 10.2%, p=0.48).
All-cause mortality rates through 48 months were reported according to type of stent received in the PCI group, with BMS used in 424 PCI patients and DES used in 245 PCI patients.112 There was no difference between the subgroup of patients who received BMS versus the medical therapy group in 48-month mortality (8.8% versus 7.0%; RD 1.8%, 95% CI -1.4% to 5.0%; RR 1.3, 95% CI 0.8 to 1.9; p=0.26) or between those who received DES versus the control group in the same outcome (7.8% versus 7.0%; RD 0.8%, 95% CI -3.0% to 4.6%; RR 1.1, 95% CI 0.7 to 1.8; p=0.66).

WA - Health Technology Assessment December 11, 2015
Cardiac Stents – Re-Review: Final Evidence Report Page 94
Table 18. PCI versus medical therapy: All-cause mortality
Time Point RCT PCI + MT MT Risk Difference
(95% CI)
Effect Size
(95% CI) p-value
12 months MASS II 4.4%
(9/205)
1.5%
(3/203)
2.9% (–0.4% to 6.2%) RR=3.0
(0.8 to 10.9)
0.08
24 months Hambrecht
(males)
4%
(2/50)
2%
(1/51)
2% (–5% to 9%) RR=2.0
(0.2 to 21.8)
0.55
55.2 months
(median)
COURAGE 7.4%
(85/1149)
8.3%
(95/1138)
–0.9% (–3.2% to 1.3%) HR=0.87
(0.65 to 1.16)
0.38
60 months MASS II 11.7%
(24/205)
12.3%
(25/203)
-0.6% (-6.9% to 5.7%) Adjusted RR=0.92
(0.46 to 1.86)
0.94
63.6 months
(mean)
BARI 2D
(type 2 diabetes)
12.8%
(102/798)
11.9%
(96/807)
0.9% (–2.3% to 4.1%) RR=1.1
(0.8 to 1.4)
0.59
120 months MASS II 24.1%
(49/205)
31.0%
(63/203)
–7.1% (–15.7% to 1.5%) RR=0.8
(0.6 to 1.1)
0.11
CI: confidence interval; MT: medical therapy; PCI: percutaneous coronary intervention; RCT: randomized controlled trial; RR: relative risk.
Cardiac death (primary outcome)
Summary
There was no statistically significant difference between PCI and medical therapy groups in cardiac death as reported by all four RCTs,12,15,47,54 with outcomes reported between 12 months and 120 months (Table 19).
General population
In the MASS-II trial, there was no statistically significant differences between the PCI and control groups in cardiovascular death through 12 months54 (4.4% versus 1.5%; RD 2.9%, 95% CI -0.4% to 6.2%; RR 3.0, 95% CI 0.8 to 10.8; p=0.0821), 60 months53 (11.6% versus 12.3%; RD -0.6%, 95% CI -6.9% to 5.7%; RR 1.0, 95% CI 0.6 to 1.6; p=0.85), or 120 months52 (14.3% versus 20.7%; RD -6.5%, 95% CI -13.9% to 0.8%; RR 0.7, 95% CI 0.4 to 1.1; p=0.0817). While cardiac death occurred in somewhat fewer patients in the PCI versus medical therapy group through 120 months, this difference was within the limits of chance given no true difference in risk. None of the estimates were adjusted for baseline differences between groups.
At a median of 55.2 (IQR range, 30 to 84) months follow-up in the COURAGE trial,15 there was no difference in cardiac death between PCI and control groups (2.0% versus 2.2%; unadjusted HR 0.87, 95% CI 0.65 to 1.16; p=0.36); the Kaplan-Meier estimated cumulative rate at 55.2 months was 7.6% in the PCI group and 8.3% in the medical therapy group.
Special population: Males
Hambrecht et al.47,135 reported no cardiac deaths in either treatment group through 12 and 24 months follow-up; the study was insufficiently powered to detect differences between groups.

WA - Health Technology Assessment December 11, 2015
Cardiac Stents – Re-Review: Final Evidence Report Page 95
Special population: Type 2 Diabetes
In the BARI 2D trial, both cardiac death (i.e., death occurring within one hour to 30 days following a cardiac event) and sudden cardiac death (i.e., death occurring within 60 minutes of a cardiac event) occurred similarly between treatment groups through five years.25 Specifically, there was no difference between the PCI plus medical therapy (“PCI”) group and the medical therapy alone (“control”) group in cardiovascular death through a mean of 63.6 (range, 40.8 to 93.6) months (5.5% versus 4.1%; RD 1.4%, 95% CI -0.7% to 3.5%; RR 1.3, 95% CI 0.9 to 2.1; p=0.18). Kaplan-Meier analyses were used to provide 60-month estimates, which were also similar between groups (5.0% versus 4.2%, p=0.16). There was also no difference between groups in sudden cardiac death through a mean of 63.6 months (4.3% versus 3.2%; RD 1.0%, 95% CI -0.8% to 2.9%; RR 1.3, 95% CI 0.8 to 2.2; p=0.27) or at 60 months using Kaplan-Meier estimates (3.8% versus 3.4%, p=0.25).
The same trial also reported that treatment with PCI significantly modified the impact of a nonprocedural MI with respect to cardiac death (p=0.003)25: PCI patients were significantly less likely die as a result of an MI than they was from other (unreported) causes (HR 0.33, 95% CI 0.17 to 0.65); in the control group, cardiac death was as likely to have resulted from an MI as it was from other causes (HR 1.36, 95% CI 0.69 to 2.69).
Table 19. PCI versus medical therapy: Cardiac mortality
Time Point RCT PCI + MT MT Risk Difference (95% CI)
Effect Size (95% CI)
p-value
Cardiac Death
12 months MASS II 4.4% (9/205)
1.5%
(3/203)
2.9%
(–0.4% to 6.2%)
RR=3.0
(0.8 to 10.8) 0.082
24 months Hambrecht
(males)
0.0%
(0/50)
0.0%
(0/51) Not calculable Not calculable 1.0
55.2 months
(median) COURAGE*
2.0%
(23/1149)*
2.2%
(25/1138)*
–0.2%
(–1.4% to 1.0%)
RR=0.9
(0.5 to 1.6) 0.74
60 months MASS II
11.6%
(24/205)
12.3%
(25/203)
–0.6%
(–6.9% to 5.7%)
RR=1.0
(0.6 to 1.6) 0.85
63.6 months
(mean)
BARI 2D
(type 2 diabetes)
5.5%
(44/798)
4.1%
(33/807)
1.4%
(–0.7% to 3.5%)
RR=1.3
(0.9 to 2.1) 0.18
120 months MASS II
14.3%
(29/205)
20.7%
(42/203)
–6.5%
(–13.9% to 0.8%)
RR=0.7
(0.4 to 1.0) 0.082
Sudden Cardiac Death
63.6 months (mean)
BARI 2D
(type 2 diabetes)
4.3%
(34/798)
3.2%
(26/807)
1.0%
(–0.8% to 2.9%)
RR=1.3
(0.8 to 2.2) 0.27
CI: confidence interval; MT: medical therapy; PCI: percutaneous coronary intervention; RCT: randomized controlled trial; RR: relative risk.
*As reported in Boden 2007 (the first results paper published for the COURAGE trial); note that Boden 2009 reported cardiac death in 3.4% (39/1149) PCI patients and 3.9% (33/1138) medical therapy patients (p=NS) for the same time period. It is unclear what led to this discrepancy in results.

WA - Health Technology Assessment December 11, 2015
Cardiac Stents – Re-Review: Final Evidence Report Page 96
Myocardial infarction (primary outcome)
Summary
All four trials RCTs 12,15,47,54 reported this outcome and found no statistically significant difference the incidence of myocardial infarction at one or more time points between 12 and 60 months; however one trial (MASS-II)52 reported that nonfatal MI was significantly less common in the PCI versus medical therapy group through 120 months (Table 20).
General population
The MASS-II trial reported no difference between PCI and medical therapy groups in the incidence of non-fatal MI through 12 months follow-up (8.3% versus 5.0%; RD 2.9%, 95% CI -1.9% to 7.6%; RR 1.6, 95% CI 0.7 to 3.4; p=0.23)54; it was unclear whether these data included the two in-hospital MI events in the PCI group. Similar results were found through 60 months follow-up (11.2% versus 15.3%; RD -4.1%, 95% CI -10.6% to 2.5%; RR 0.7, 95% CI 0.4 to 1.2; p=0.23).53 By 120 months, however, nonfatal MI had occurred in significantly fewer patients in the PCI group compared with the medical therapy alone group (13.2% versus 20.7%; RD -7.5%, 95% CI -14.8% to -0.3%; RR 0.6, 95% CI 0.41 to 0.991; p=0.0430).52 Estimates at 12 and 120 months were not adjusted for differences between groups in baseline characteristics.
In the COURAGE trial, nonfatal non-periprocedural MI occurred similarly between PCI and medical therapy groups through a median of 55.2 (IQR range, 30 to 84) months (9.4% versus 10.5%; RD -1.1%, 95% CI -3.5% to 1.4%; RR 0.9, 95% CI 0.7 to 1.2; p=0.40).15
Special population: Males
Hambrecht et al. found no difference between PCI plus medical therapy versus exercise plus medical therapy in the incidence of acute nonfatal MI through 12 months (2% versus 0%, RD 2%, 95% CI NC; RR infinity, 95% NC; p=0.32)47 or through 24 months (2% versus 2%, RD 0%, 95% CI -5% to 5%; RR 1.0, 95% CI 0.1 to 15.9; p=0.99).135 However, the study was insufficiently powered to detect differences between groups.
Special population: Type 2 Diabetes
Non-periprocedural MI (both fatal and non-fatal) occurred in a similar percentage of patients through a mean of 55.2 (range not reported) months between PCI plus medical therapy and medical therapy alone groups (8.5% versus 9.6%; RD -1.0%, 95% CI -3.8% to 1.8%; RR 0.9, 95% CI 0.7 to 1.2; p=0.47).21
MI incidence through 48 months was stratified by type of stent (i.e., BMS or DES) used in the PCI group (used in 424 and 245 patients, respectively).112 MI occurred similarly through 48 months between BMS patients and the medical therapy group (12.0% versus 10.0%; RD 2.0%, 95% CI -1.7% to 5.7%; RR 1.2, 95% CI 0.9 to 1.7; p=0.28) as well as between DES patients and the medical therapy group (9.1% versus 10.0%; RD -1.1%, 95% CI -5.2% to 3.1%; RR 0.9, 95% CI 0.6 to 1.4; p=0.63).

WA - Health Technology Assessment December 11, 2015
Cardiac Stents – Re-Review: Final Evidence Report Page 97
Table 20. PCI versus medical therapy: Myocardial infarction
Time Point RCT PCI + MT MT Risk Difference (95% CI)
Effect Size (95% CI)
p-value
Nonfatal MI
12 months MASS II 8.3% (16/205)
5.0% (10/203)
2.9% (–1.9% to 7.6%)
RR=1.6 (0.7 to 3.4)
0.23
24 months Hambrecht (males)
2% (1/50) 2% (1/51)
0% (–5% to 5%)
RR=1.0 (0.1 to 15.9)
0.99
55.2 months (median)
COURAGE* 9.4% (108/1149)*
10.5% (119/1138)*
–1.1% (–3.5% to 1.4%)
RR=0.9 (0.7 to 1.2)
0.40
60 months. MASS II 11.2% (23/205)
15.3% (31/203)
–4.1% (–10.6% to 2.5%)
RR=0.7 (0.4 to 1.2)
0.23
120 months MASS II 13.2% (27/205)
20.7% (42/203)
–7.5% (–14.8% to –0.27%)
RR=0.64 (0.41 to 0.99)
0.04
Fatal MI
12 months MASS II 4.5% (9/205) 1.5% (3/203)
2.9% (–0.4% to 6.2%)
RR=2.9 (0.82 to 10.82)
0.08
60 months MASS II 11.6% (24/205)
12.3% (25/203)
–0.61% (–6.9% to 5.7%)
RR=0.95 (0.56 to 1.61)
0.85
120 months MASS II 14.1% (29/205)
20.7% (42/203)
–6.5% (–13.9% to 0.79%)
RR=0.68 (0.44 to 1.1)
0.08
Total MI
55.2 months (mean)
BARI 2D (type 2 diabetes)
8.5% (69/797)
9.6% (77/805)
-1.0% (-3.8% to 1.8%)
RR=0.9 (0.7 to 1.2)
0.47
CI: confidence interval; MI: myocardial infarction; MT: medical therapy; PCI: percutaneous coronary intervention; RCT: randomized controlled trial; RR: relative risk.
*As reported in Boden 2007 (the first results paper published for the COURAGE trial); note that Boden 2009 reported non-periprocedural MI in 10.4% (109/1149) PCI patients and 9.5% (113/1138) medical therapy patients (p=NS) for the same time period. It is unclear what led to this discrepancy in results.
Composite outcomes
Because all four included trials reported on the primary outcomes of interest, composites that included these outcomes are not evaluated; however, the data are available in Appendix G.
Patient-reported outcomes (primary outcome)
Summary
Three trials reported patient-reported outcomes, which included angina symptoms, angina-related quality of life using the Seattle Angina Questionnaire (SAQ), quality of life using the SF-36 and RAND outcome measures, and activity using the Duke Activity Status Index (Tables 21 to 23). Results were mixed, with the COURAGE trial (general population) reporting greater improvement in the SAQ angina frequency domain at 6, 12, and 36 months138; the trial also reported that more PCI patients had significantly greater improvement in other SAQ and RAND-36 domains at 6 (and to some extent 12) months but there were no longer statistically meaningful differences between groups by 36 months. The
WA - Health Technology Assessment December 11, 2015
Cardiac Stents – Re-Review: Final Evidence Report Page 98
MASS-II trial (general population) found that the PCI group had significantly better scores in the SF-36 physical functioning and vitality domains at 12 months but there were no differences between groups in any other domains at 12 months.36 In contrast, the BARI 2D trial (type 2 diabetes) found no differences between groups in the modified RAND domains for energy, health distress, or self-rated help through 48 months.22 This trial also found similar results between groups in the DASI through 48 months. Regarding freedom from angina symptoms, the COURAGE trial (general population) found that significantly more PCI patients were angina-free at both 12 and 36 month,15 the MASS-II trial (general population) similarly reported significantly more angina-free patients in the PCI group at 12, 60, and 120 months.52-54 The BARI 2D trial (type 2 diabetes) reported that in the subset of patients with classic angina at baseline, freedom from angina symptoms occurred in more patients in the PCI group during the first year, although there was no difference between groups in subsequent years through the fifth year of follow-up.28 The trial also reported that worsening angina occurred in significantly fewer PCI patients during the first and third year of follow-up, but there was no difference between groups in the second, fourth, or fifth years. In the subset of patients without classic angina at baseline, there were no differences between groups in the percentages of patients with new angina during follow-up through the fifth year follow-up.28 Patients were not blinded to interventions and the impact of any placebo effect is unknown.
General population
Freedom from angina symptoms In the COURAGE trial,15 freedom from any angina (not further defined) was seen in significantly more PCI patients than medical therapy patients at 12 months (66.0% vs. 58.9%, RR 1.11, 95% CI 1.04 to 1.19, p=0.001); similar results were seen at 36 months (73.4% versus 67.7%. RR 1.08, 95% CI 1.01 to 1.15, p=0.01), however data were available for only 71.9% of patients at this time point (Table 21). By 60 months, a similar percentage of patients in both groups were angina free (74.7% versus 72.9%, RR 1.54, 95% CI 1.37 to 1.73, p=0.55), but the data were based on only the 36.3% of the original patient population and are thus highly susceptible to bias.
The MASS-II trial report found that significantly more patients in the PCI group were free from angina symptoms (not further defined) at 12 months (52.2% versus 36.5%, RR 1.43, 95% CI 1.1 to 1.8, p=0.001),54 60 months (77.3% versus 54.8%, RR 1.28, 95% CI 1.06 to 1.55, p=0.0102),53 and 120 months (58.5% versus 43.3%, RR 1.35, 95% CI 1.11 to 1.64, p=0.0022).52
Seattle Angina Questionnaire (SAQ)
In general, the COURAGE trial found greater improvement in the five domains of the SAQ in the PCI group compared with the medical therapy group.138 Table 22 contains data on the percentage of patients at 6, 12, and 36 months with clinically meaningful improvement in the domains of the SAQ; additional time points as well as mean scores are available in Appendix G. None of the data were reported for more than 80% of randomized patients, with 6-month data based on 74% to 76% of patents (exact number of patients available varied by outcome), 12-month data on 72% to 74% of patients, and 36-month data on only 51%; the 36-month data is at particularly high risk of bias due to high loss of follow-up. More patients in the PCI group than the medical therapy group had clinically-significant improvement in the SAQ angina frequency domain (defined as ≥20 point improvement from baseline) throughout follow-up, including at 6 months (50% versus 44%, RR 1.14, 95% CI 1.03 to 1.26, p=0.0130), at 12 months (52% versus 46%, RR 1.13, 95% CI 1.03 to 1.25, p=0.0126), and at 36 months (57% versus 50%, RR 1.14, 95% CI 1.02 to 1.27, p=0.0186).138

WA - Health Technology Assessment December 11, 2015
Cardiac Stents – Re-Review: Final Evidence Report Page 99
Clinically-significant improvement in the physical limitation domain (defined as ≥8 point improvement from baseline) occurred in significantly more PCI than medical therapy patients at 6 months (51% versus 42%), but the difference was no longer significant at 12 (48% versus 44%) or 36 months (45% versus 47%).138 Similar results were seen for improvement in the SAQ quality of life domain (defined as ≥16 point improvement from baseline), with 64% of PCI patients showing significant improvement at 6 months compared to 56% of control group patients (p=0.0006); there were no longer significant differences between groups at 12 (65% versus 61%) and 36 months (69% in both groups).
Clinically-significant improvement in the treatment satisfaction domain (defined as ≥12 point improvement from baseline) occurred more similarly between groups, although more PCI patients had improvement at 12 months than those in the control group. There were no differences between groups in the percentage of patients who achieved clinically-significant improvement in the angina stability domain (defined as ≥25 point improvement from baseline) at 6, 12, or 36 months.138
RAND-36 The COURAGE trial evaluated the percentage of patients with clinically meaningful improvement (defined as ≥10 improvement from baseline) in RAND-36 domain scores.138 While more patients in the PCI group versus medical therapy group had improvement in the physical functioning domain (50% versus 43%, RR 1.16, 95% CI 1.05 to 1.28) and role limitation-physical domain (48% versus 43%, RR 1.11, 95% CI 1.00 to 1.23) at 6 months, there were no other significant differences between groups in any other domain at 6, 12, or 36 months (Table 23). Additional time points as well as mean scores are available in Appendix G. As for SAQ data above, none of the data were reported for more than 80% of randomized patients, and 36-month data was based on only 51% of patients and is thus at especially high risk of bias.
SF-36 The MASS-II trial evaluated quality of life using the SF-36 outcome measure and found that the PCI group had significantly better mean scores in the physical functioning and vitality subdomains compared with the medical therapy group at 12 months (p<0.001).36 However, the study reported no other significant differences in mean scores between the groups at 12 months for any of the other subdomains (general health, role functioning-physical, role functioning-emotional, mental health, pain, social functioning). Data was only provided in graph form; estimated mean scores are available in Appendix G.
Special population: Males
No data were reported.
Special population: Type 2 Diabetes
Duke Activity Status, modified RAND domains There were no differences between PCI plus medical therapy (“PCI”) and medical therapy alone (“control”) groups in the percent improvement from baseline in any of the patient-reported health status outcomes evaluated through 48 months follow-up, including the Duke Activity Status Index (DASI) (OR 1.07, p=0.40) and three modified RAND domains (energy/fatigue (OR 1.12, p=0.17), health distress (OR 0.97, p=0.69), and self-rated health (OR 0.92, p=0.36).22 While data could be estimated from figures (see Appendix G), no other information was provided.

WA - Health Technology Assessment December 11, 2015
Cardiac Stents – Re-Review: Final Evidence Report Page 100
Angina Worsening angina, which was classified based on patient responses to a questionnaire, was defined as overall angina that was worse in severity and/or frequency or a change from no angina to any angina or to unstable angina. During the first year of follow-up, significantly fewer patients in the PCI group had worsening angina compared with those in the control group (17.7% versus 24.5%; RD -6.8%, 95% CI -10.9% to -2.7%; RR 0.7, 95% CI 0.6 to 0.9; p=0.0012).28 While there were no statistically significant differences between groups during the second year (approximately 14% in both groups), results favored the PCI group again as measured during the third year of follow-up (approximately 11% versus 15% in the control group, p=0.019). Results were similar between groups during the fourth (approximately 10% versus 11%) and fifth (approximately 9% in both groups) years of follow-up. In the subset of patients with classic angina at baseline (60.5% versus 59.4% for the PCI and control groups, respectively), freedom from any patient-reported angina occurred in significantly more patients in the PCI group than in the control group during the first year of follow-up (approximately 40% versus 24%, p<0.001) but the results were no longer statistically significant during the second (approximately 54% versus 48%, p=0.107), third (approximately 60% versus 55%, p=0.112), fourth (approximately 60% versus 57%, p=0.36), or fifth (approximately 62% versus 59%, p=0.69) years of follow-up.28
In the subset of patients without classic angina at baseline (39.5% versus 40.6% of the PCI versus control groups), the incidence of new classic angina showed a trend of being lower in the PCI group compared with the control group starting after the first few years, however the results did not reach statistical significance and loss to follow-up appeared to be high for this outcome.28 Overall, cumulative rates of new angina over 60 months follow-up were statistically similar between groups (p=0.053).
Patient-reported angina was reported for the subsets of patients who received BMS and DES. Significantly fewer DES versus control group patients reported angina symptoms through 24 months (29% versus 39%, p=0.0043) and 48 months (21% versus 28%, p=0.0253). Angina occurred similarly between BMS patients and the control group at both 24 months (37% versus 39%, p=0.49) and 48 months (24% versus 28%, p=0.14).112

WA - Health Technology Assessment December 11, 2015
Cardiac Stents – Re-Review: Final Evidence Report Page 101
Table 21. PCI versus medical therapy: Freedom from angina
Freedom From Angina* % (n/N)
Time Point RCT PCI + MT† MT† Risk Difference (95% CI)
Risk Ratio (95% CI)
p-value
12 months MASS II 52.2% (107/205)
36.5% (74/203) 15.7% (6.2% to 25.3%)
1.43 (1.14 to 1.79)
0.001
BARI 2D‡ (type 2 diabetes)
~41% (n NR)
~24% (n NR)
~17% NR <0.001
COURAGE 66.0% (680/1031)
58.9% (595/1010)
7.0% (2.8% to 11.2%)
1.11 (1.04 to 1.19)
0.001
24 months BARI 2D‡ (type 2 diabetes)
~54% (n NR)
~48% (n NR)
~6% NR 0.10
36 months BARI 2D‡ (type 2 diabetes)
~60% (n NR)
~55% (n NR)
~5% NR 0.11
COURAGE 73.4% (602/820)
67.7% (558/824)
5.5% (1.1% to 9.9%)
1.08 (1.01 to 1.15)
0.01
48 months BARI 2D‡ (type 2 diabetes)
~60% (n NR)
~57% (n NR)
~3% NR 0.36
60 months MASS II 77.3% (119/205)
54.8% (92/203)
12.7% (3.1% to 22.4%)
1.28 (1.06 to 1.55)
0.0102
BARI 2D‡ (type 2 diabetes)
~62% (n NR)
~59% (n NR)
~3% NR 0.69
COURAGE 74.7% (316/423)
72.9% (296/406)
1.8% (–4.1% to 7.7%)
1.54 (1.37 to 1.73)
0.55
120 months MASS II 58.5% (120/205)
43.3% (88/203)
15.2% (5.6% to 24.8%)
1.35 (1.11 to 1.64)
0.0022
CI: Confidence Interval; MT: Medical Therapy; NR: Not Reported; PCI: Percutaneous Coronary Intervention; RCT: Randomized Controlled Trial; SD: Standard Deviation
*Freedom from angina not further defined by any of the studies.
†Percentage with a “ ~ “ sign before them indicated that these data were estimated from figures; more precise data were not available.
‡BARI 2D: data reported for the subset of patients with classic angina at baseline; these patients comprise approximately 60% of the total study population.

WA - Health Technology Assessment December 11, 2015
Cardiac Stents – Re-Review: Final Evidence Report Page 102
Table 22. PCI versus medical therapy: Clinically significant improvement* in SAQ
SAQ
Time point RCT PCI + MT MT Risk difference (95% CI)
Effect Size (95% CI)
p-value
Angina Stability
6 months COURAGE 56% (495/883)
52% (430/827)
4.1% (–0.7% to 8.8%)
RR=1.08 (0.99 to 1.18)
0.0920
12 months COURAGE 51% (430/843)
50% (405/810)
1.0% (–3.8% to 5.8%)
RR=1.02 (0.93 to 1.12)
0.6820
36 months COURAGE 51% (294/576)
46% (267/580)
5.0% (–0.8% to 10.8%)
RR=1.11 (0.98 to 1.25)
0.0887
Angina Frequency
6 months COURAGE 50% (449/898)
44% (370/840)
6.0% (1.3% to 10.6%)
RR=1.14 (1.03 to 1.26)
0.0130
12 months COURAGE 52% (449/863)
46% (381/829)
6.1% (1.3% to 10.8%)
RR=1.13 (1.03 to 1.25)
0.0126
36 months COURAGE 57% (332/583)
50% (295/589)
6.9% (1.2% to 12.6%)
RR=1.14 (1.02 to 1.27)
0.0186
Treatment Satisfaction
6 months COURAGE 30% (268/894)
31% (260/839)
–1.0% (–5.4% to 3.3%)
RR=0.97 (0.84 to 1.12)
0.6476
12 months COURAGE 39% (336/861)
33% (274/829)
6.0% (1.4% to 10.5%)
RR=1.18 (1.04 to 1.34)
0.0106
36 months COURAGE 31% (182/586)
34% (202/593)
–3.0% (–8.4% to 2.3%)
RR=0.91 (0.77 to 1.07)
0.2710
Quality of Life
6 months COURAGE 64% (574/897)
56% (469/838)
8.0% (3.4% to 12.6%)
RR=1.14 (1.06 to 1.24)
0.0006
12 months COURAGE 65% (560/862)
61% (504/827)
4.0% (–0.6% to 8.6%)
RR=1.07 (0.99 to 1.15)
0.0871
36 months COURAGE 69% (404/586)
69% (408/591)
–0.1% (–5.4% to 5.2%)
RR=1.00 (0.93 to 1.08)
0.9723
Physical Limitation
6 months COURAGE 51% (448/878)
42% (344/820)
9.1% (4.4% to 13.8%)
RR=1.21 (1.10 to 1.35)
0.0002
12 months COURAGE 48% (405/844)
44% (357/812)
4.0% (–0.8% to 8.8%)
RR=1.09 (0.98 to 1.21)
0.1009
36 months COURAGE 45% (258/573)
47% (274/583)
–2.0% (–7.7% to 3.8%)
RR=0.96 (0.85 to 1.09)
0.5014
CI: Confidence Interval; MT: Medical Therapy; PCI: Percutaneous Coronary Intervention; RCT: Randomized Controlled Trial; RR: relative risk.
* Defined clinical significance as a difference of 8 points or more on the physical-limitation scale, 25 or more on the angina-stability scale, 20 or more on the angina-frequency scale, 12 or more on the treatment-satisfaction scale, and 16 or more on the quality-of-life scale.

WA - Health Technology Assessment December 11, 2015
Cardiac Stents – Re-Review: Final Evidence Report Page 103
Table 23. PCI versus medical therapy: Clinically significant improvement* in RAND-36
RAND-36 (mean ± SD)
Time Point RCT PCI + MT MT
Mean
Difference
(95% CI)
Effect Size (95%
CI) p-value
Physical Functioning
6 months COURAGE 50%
(450/899)
43%
(363/844)
7.0% (2.3% to
11.7%)
1.16 (1.05 to 1.28) 0.003
12 months COURAGE 47%
(403/857)
43%
(364/847)
4.9% (0.2% to
9.7%)
1.11 (1.01 to 1.23) 0.09
36 months COURAGE 42%
(250/596)
39%
(232/595)
2.9% (–2.6% to
8.5%)
1.07 (0.93 to 1.23) 0.29
Role Limitation - Physical
6 months COURAGE 48%
(431/897)
43%
(363/844)
5.0% (0.3% to
9.7%)
1.11 (1.00 to 1.23) 0.03
12 months COURAGE 47%
(402/856)
47%
(397/845)
0% (–4.7% to
4.7%)
0.99 (0.90 to 1.10) 0.99
36 months COURAGE 44%
(262/595)
46%
(273/595)
–1.8% (–7.5%
to 3.8%)
0.95 (0.84 to 1.08) 0.52
Role Limitation - Emotional
6 months COURAGE 37%
(331/894)
33%
(278/843)
4.0% (–0.4% to
8.5%)
1.12 (0.98 to 1.27) 0.07
12 months COURAGE 34%
(291/857)
34%
(287/845)
0% (–4.5% to
4.4%)
0.99 (0.87 to 1.14) 0.99
36 months COURAGE 33%
(195/592)
32%
(189/590)
0.9% (–4.4% to
6.2%)
1.02 (0.87 to 1.21) 0.73
Energy/Fatigue
6 months COURAGE 47%
(422/898)
45%
(380/844)
1.9% (–2.7% to
6.6%)
1.04 (0.94 to 1.15) 0.40
12 months COURAGE 47%
(403/858)
45%
(380/846)
2.0% (–2.6%to
6.7%)
0.98 (0.91 to 1.06) 0.79
36 months COURAGE 44%
(262/596)
42%
(249/594)
2.0% (–3.5% to
7.6%)
1.04 (0.91 to 1.19) 0.47
Emotional Well-being
6 months COURAGE 32%
(287/898)
28%
(236/844)
4.0% (–0.3% to
8.3%)
1.14 (0.98 to 1.32) 0.06
12 months COURAGE 29%
(249/858)
29%
(245/846)
0% (–4.2% to
4.3%)
0.99 (0.86 to 1.15) 0.99
36 months COURAGE 31%
(185/596)
27%
(160/594)
4.1% (–1.0% to
9.2%)
1.15 (0.96 to 1.37) 0.11
Social Functioning
6 months COURAGE 48%
(431/898)
45%
(380/845)
3.0% (–1.6% to
7.7%)
1.06 (0.96 to 1.18) 0.20
12 months COURAGE 45% 47% –2.0% (–6.7% 0.95 (0.86 to 1.06) 0.40

WA - Health Technology Assessment December 11, 2015
Cardiac Stents – Re-Review: Final Evidence Report Page 104
RAND-36 (mean ± SD)
Time Point RCT PCI + MT MT
Mean
Difference
(95% CI)
Effect Size (95%
CI) p-value
(386/857) (398/846) to 2.7%)
36 months COURAGE 41%
(244/596)
43%
(255/594)
–1.9% (–7.6%
to 3.6%)
0.95 (0.83 to 1.09) 0.48
Pain
6 months COURAGE 52%
(466/897)
49%
(414/844)
2.9% (–1.8% to
7.6%)
1.05 (0.96 to 1.16) 0.22
12 months COURAGE 51%
(437/857)
49%
(414/845)
2.0% (–2.7% to
6.7%)
1.04 (0.94 to 1.14) 0.41
36 months COURAGE 44%
(262/596)
47%
(279/594)
–3.0% (–8.6%
to 2.6%)
0.93 (0.82 to 1.06) 0.29
General Health
6 months COURAGE 39%
(350/898)
35%
(296/845)
3.9% (–0.5% to
8.4%)
1.11 (0.98 to 1.25) 0.08
12 months COURAGE 37%
(317/858)
36%
(305/847)
0.9% (–3.6% to
5.5%)
1.02 (0.90 to 1.16) 0.68
36 months COURAGE 37%
(221/596)
34%
(202/595)
3.1% (–2.3% to
8.5%)
1.09 (0.93 to 1.27) 0.25
CI: Confidence Interval; MT: Medical Therapy; NR: Not Reported; PCI: Percutaneous Coronary Intervention; RCT: Randomized Controlled Trial; RR: relative risk.
* A clinically significant change was defined as a difference of ≥10 points in a given domain.
Revascularization (secondary outcome)
Summary
All four trials12,15,47,54 reported on revascularization, and results varied (Table 24). The Hambrecht trial47 (males only) found that the PCI group had a significantly greater risk of revascularization than the medical therapy group through 12 months; the MASS-II trial (general population) reported similar 12- and 60-month results although statistical significance was not achieved.53,54 In contrast, the COURAGE (general population) and BARI 2D (type 2 diabetes) trials both found that the PCI group had a significantly lower risk of revascularization compared with the medical therapy groups through a median of 55 months (COURAGE)15 and 60 months (BARI 2D).28 Through 120 months, the MASS-II trial found no difference in revascularization rates between treatment groups.52
General population
In the MASS-II trial, revascularization was performed in slightly more patients in the PCI group compared with the medical therapy alone group through 12 months (12.2% versus 7.9%; RD 4.3%, 95% CI -1.5% to 10.1%; RR 1.55, 95% CI 0.85 to 2.81; p=0.15)54 and 60 months (32.2% versus 24.1%; RD 8.1%, 95% CI -0.6% to 16.8%; RR 1.33, 95% CI 0.97 to 1.83; p=0.071),53 although both observed associations were within the limits of chance given no true difference in risk.54 Revascularization was similar between groups through 120 months (41.5% versus 39.4%; RD 2.1%, 95% CI -7.5% to 11.6%; RR 1.05, 95% CI 0.83

WA - Health Technology Assessment December 11, 2015
Cardiac Stents – Re-Review: Final Evidence Report Page 105
to 1.33; p=0.67).52 The MASS-II trial did not indicate any specific indications for which revascularization was to be performed, nor was there a distinction between revascularization of one of the original target vessel (including revascularization for in-stent restenosis) and that of a new vessel. While there was no statistically significant difference between PCI and medical therapy groups in the need for CABG through 12 months (3.5% versus 6.0%; RD -2.5, 95% CI -6.6% to 1.6%; RR 0.6, 95% CI 0.2 to 1.4; p=0.23)54 or 60 months (9.3% versus 15.3%; RD -6.0%, 95% CI -12.4% to 0.3%; RR 0.6, 95% CI 0.4 to 1.0; p=0.065)53; significantly fewer patients in the PCI group had undergone CABG than did those in the medical therapy group through 120 months (13.2% versus 25.1%; RD -12.0%, 95% CI -19.5% to -4.4%; RR 0.5, 95% CI 0.3 to 0.8; p=0.0022).52 Subsequent PCI was performed in significantly more patients in the PCI group through all follow-up time points: 12 months (8.8% versus 2.0%; RD 6.8%, 95% CI 2.5% to 11.1%; RR 4.5, 95% CI 1.5 to 12.9; p=0.002),54 60 months (22.9% versus 8.9%; RD 14.1%, 95% CI 7.1% to 21.0%; RR 2.6, 95% CI 1.6 to 4.3; p=0.0001),53 and through 120 months (28.3% versus 14.3%; RD 14.0%, 95% CI 6.2% to 21.8%; RR 2.0, 95% CI 1.3 to 3.0; p=0.0006).52 None of these revascularization estimates were adjusted for differences in baseline characteristics between groups, however.
In the COURAGE trial,15 revascularization was performed in significantly fewer patients in the PCI versus medical therapy groups through a median of 55.2 (IQR range, 30 to 84) months (19.8% versus 30.6%; unadjusted HR 0.60, 95% CI 0.51 to 0.71, p < 0.001); Kaplan-Meier estimates of the 55.2-month event rate were 21.1% in the PCI group and 32.6% in the control group. This difference was driven by revascularization via PCI, which was needed in a lower proportion of patients in the PCI group than the medical therapy group through the same follow-up (13.1% versus 23.5%, RD -10.3%, 95% CI -13.5% to -7.2%; RR 0.56, 95% CI 0.47 to 0.67; p<0.0001). In contrast, CABG was performed similarly between treatment groups through a median of 55.2 months (6.7% versus 7.1%; RD -0.4%, 95% CI -2.5% to 1.7%; RR 0.94, 95% CI 0.70 to 1.27; p=0.69). In this trial, revascularization was performed if deemed necessary by the treating physician. Time to revascularization was similar between the PCI and medical therapy groups (median 10.0 (IQR 4.5-28.0) versus 10.8 (IQR 3.2-30.7) months).
Special population: Males
Through 12 months,47 revascularization was performed in significantly more PCI plus medical therapy patients than exercise plus medical therapy patients (20% versus 6%; RD 14%, 95% CI 1% to 27%; RR 3.4, 95% CI 1.0 to 11.6; p=0.0351). While CABG (2% versus 0%, p=0.31) and PCI of the target lesion (4% (for in-stent restenosis) versus 4%) were performed similarly in both groups, PTCA (whether this was PTCA or PCI was unclear in the study) of other coronary segments were seven times more common in the PCI group than in the control group (14% versus 2%; RD 12%, 95% CI 2% to 22%; RR 7.1, 95% CI 0.91 to 56; p=0.0258); no other information was reported. Through 24 months,135 PCI of the index lesion only was performed in 10% of PCI patients due to in-stent restenosis and in 14% of control group patients, a difference which was not statistically meaningful (p=0.56). Other revascularization events were not reported past the 12-month follow-up period. The reasons for performing revascularization for in-stent restenosis or of the target or other lesion were not stated.
Special population: Type 2 Diabetes
In the BARI 2D trial,28 revascularization by any method during the 60-month follow-up period was performed in significantly fewer patients in the PCI plus medical therapy (“PCI”) group compared with the medical therapy alone (“control”) group (26.8% versus 39.1%), with a risk difference of -12.3% (95% CI -16.9% to -7.8%) and a relative risk of 0.68 (95% CI 0.59 to 0.79) (p<0.001). Reasons for the first subsequent revascularization included acute coronary syndrome (26% versus 22%), severe angina symptoms (33% versus 45%), worsening ischemia (18% versus 20%), unsatisfactory results of recent intervention (3% versus 0%), objective evidence of CAD progression (13% versus 8%), or other reasons

WA - Health Technology Assessment December 11, 2015
Cardiac Stents – Re-Review: Final Evidence Report Page 106
(8% versus 6%). The percentage of patients in each treatment group that underwent revascularization via PCI or CABG were not reported. Revascularization rates through 48 months were stratified according to type of stent received, with revascularizations performed in 28.9% of the 424 BMS patients (p=0.0004 versus 39.3% in the control group) and in 20.8% of the 245 DES patients (p<0.0001 versus 39.3% in the control group).112 PCI revascularization was also significantly less common in PCI patients who received BMS versus medical therapy alone patients (23.9% vs. 32.4%, p=0.0018) as well as in PCI patients who received DES versus those in the medical therapy group (18.1% vs. 32.4%, p<0.001). Although there was no difference in CABG revascularization rates between BMS versus medical therapy patients (8.1% versus 9.9%, p=0.28), those who received DES had significantly lower incidence of CABG than those randomized to medical therapy alone (4.6% versus 9.9%, p<0.001).
Table 24. PCI versus medical therapy: Revascularization (PCI or CABG)
Time Point RCT PCI + MT MT Risk Difference
(95% CI)
Effect Size (95%
CI) p-value
12 months MASS II 12.2%
(25/205)
7.9%
(16/203)
4.3% (-1.5% to
10.1%)
RR=1.55 (0.85 to
2.81)
0.15
Hambrecht
(males)
20% (10/50) 6%
(3/51)
14% (1% to 27%) RR=3.4 (1.0 to
11.6)
0.0351
55.2 months
(median)
COURAGE 19.8%
(228/1149)
30.6%
(348/1138)
-10.7% (-14.3% to -
7.2%)
RR=0.65 (0.56 to
0.75)
<0.0001
60 months BARI 2D
(type 2 diabetes)
26.8%
(213/796)
39.1%
(315/806)
-12.3% (-16.9% to -
7.8%)
RR=0.68 (0.59 to
0.79)
<0.001
MASS II 32.2%
(66/205)
24.1%
(49/203)
8.1% (-0.6% to
16.8%)
RR=1.33 (0.97 to
1.83)
0.071
120 months MASS II 41.5%
(85/205)
39.4%
(80/203)
2.1% (-7.5% to
11.6%)
RR=1.05 (0.83 to
1.33)
0.67
CI: Confidence Interval; MT: Medical Therapy; NR: Not Reported; PCI: Percutaneous Coronary Intervention; RCT: Randomized Controlled Trial; RR: relative risk.
Other outcomes
General population The COURAGE trial reported that through a median of 55.2 months, hospitalization for acute coronary syndrome was needed in 11.7% of PCI patients and in 11.0% of medical therapy patients (RD 0.8%, 95% CI -1.8% to 3.4%; RR 1.07, 95% CI 0.85 to 1.35; p=0.56).15
In the MASS-II trial,54 significantly fewer PCI patients were considered to be CCS class II or III at 12 months compared with patients in the medical therapy group (45.3% versus 63.6%, RR 0.68, 95% CI 0.56 to 0.82, p=0.0001); how this outcome was evaluated was not described.

WA - Health Technology Assessment December 11, 2015
Cardiac Stents – Re-Review: Final Evidence Report Page 107
Special population: Males
Angina severity was reported as CCS class in the Hambrecht trial and was evaluated at 12 and 24 months by physicians blinded to treatment group. Only those patients who had not experienced a hard clinical outcome (e.g., MI, stroke, revascularization) through follow-up were included in the follow-up data. Because the PCI group had significantly lower CCS scores at baseline compared with the exercise group (1.7 ± 0.1 versus 1.5 ± 0.1, p<0.001), the mean change scores have been calculated since the baseline differences were not controlled for in the study. There were no significant differences between groups in the mean change in CCS class score from baseline to 12 months47 (-1.0 ± 0.1 (n=33) versus -1.1 ± 0.1 (n=43)) or 24 months135 (-1.1 ± 0.3 (n=32)) versus -1.1 ± 0.2 (n=37)). Exercise capacity (as measured by physical work capacity in watts with an ergospirometry test) was similar between groups at baseline47 (130 ± 5 (n=50) versus 133 ± 5 (n=51)) but became significantly lower in the PCI plus medical therapy group compared with the exercise plus medical therapy group by 12 months47 (130 ± 5 (n=33) versus 159 ± 5 (n=43), MD -29, 95% CI -31 to -27, p<0.0001) and 24 months135 (132 ± 7 (n=32) versus 164 ± 5 (n=37), MD -32, 95% CI -35 to -29, p<0.001). Similarly, ischemic thresholds, which reflect the threshold at which angina and/or ST-segment depression occurs during exercise, were also similar at baseline47 between groups (99 ± 5 (n=50) versus 98 ± 6 (n=51)) but became significantly worse in the PCI group versus the exercise group at 12 months47 (119 ± 7 (n=33) versus 127 ± 8 (n=43), MD -8, 95% CI -12 to -5, p<0.001) and at 24 months135 (128 ± 7 (n=32) versus 132 ± 7 (n=37), MD -4, 95% CI -7 to -1, p=0.02). These follow-up data reflect only those patients who had not experienced a hard clinical outcome (e.g., MI, stroke, revascularization).
Special population: Type 2 Diabetes
No other outcomes of interest were reported.
4.1.3. Safety
Summary
Periprocedural MI occurred in approximately 2% more patients in the PCI group compared with the medical therapy group as reported by the COURAGE15 and BARI 2D trials.21 The MASS-II trial reported that major in-hospital adverse events (death, MI, stroke, etc.) occurred in 1.0% to 2.4% of PCI patients.54 Regarding events occurring after 30 days post-treatment, there was no difference between treatment groups in the incidence of stroke as reported by all four RCTs,12,15,47,54 with outcomes reported between 12 months and 120 months (Table 25).
General population
≤30 day events
The MASS-II trial reported the following in-hospital events that occurred during the index procedure for
the PCI group54: death (2.4%), Q-wave MI (1.0%), emergency CABG (1.0%), emergency PCI (1.0%), and
stroke (1.0%). No additional details were reported regarding these events. No other adverse events
within 30 days were reported.
The COURAGE trial reported periprocedural MI occurred in significantly more patients randomized to PCI
versus medical therapy (3.0% versus 0.8%; RD 2.3%, 95% CI 1.1% to 3.4%; RR 3.85, 95% CI 1.86 to 7.98;
p=0.0001).15
WA - Health Technology Assessment December 11, 2015
Cardiac Stents – Re-Review: Final Evidence Report Page 108
In the PCI group of the COURAGE trial, 2.0% of patients had a lesion that the proceduralist could not
cross as it could not be dilated.15
Other adverse events
Stroke occurred similarly between PCI and medical therapy groups in the MASS-II trial through 12
months54 (1.0% versus 1.5%; RD -0.5%, 95% CI -2.6% to 1.6%; RR 0.7, 95% CI 0.1 to 3.9; p=0.65), 60
months53 (3.4% versus 3.5%; RD -0.03%, 95% CI -3.6% to 3.5%; RR 1.0, 95% CI 0.4 to 2.8; p=0.99), and
120 months52 (5.4% versus 6.9%; RD -1.5%, 95% CI -6.2% to 3.1%; RR 0.8, 95% CI 0.4 to 1.7; p=0.52).
None of these event rates were adjusted for confounding differences at baseline between the groups.
The COURAGE trial found no differences between PCI and medical therapy groups in the incidence of
stroke through a median of 55.2 (IQR range, 30 to 84) months (1.9% versus 1.2%; unadjusted HR 1.56,
95% CI 0.80 to 3.04, p=0.19); similarly, results were similar between groups for the 55.2-month Kaplan-
Meier estimate rate (2.1% versus 1.8%).15
Special population: Males
≤30 day events
Not reported.
Other adverse events
Hambrecht et al. reported no adverse events occurring during the bicycle exercise training programs through the 12 month follow-up period.47 Stroke occurred similarly between PCI plus medical therapy and exercise plus medical therapy groups through 12 months (6% versus 4%, RD 2%, 95% CI -6% to 10%; RR 1.5, 95% CI 0.3 to 8.8; p=0.63).
Special population: Type 2 Diabetes
≤30 day events
In the BARI 2D trial, periprocedural MI occurred in significantly more patients in the PCI plus medical therapy group compared with the medical therapy alone group (3.4% versus 1.4%; RR 2.48, 95% CI 1.24 to 4.96; p=0.0079).21 It was unclear whether these data included both fatal and nonfatal procedural MI. There was no difference between groups in the occurrence of periprocedural stroke (0.4% versus 0.2%, respectively; RR 1.52, 95% CI 0.25 to 9.04). The trial also reported that death occurred within 30-days of the PCI procedure in 0.5% of patients; 30-day mortality was not reported for the medical therapy group.12
Other adverse events
After the periprocedural period and through a mean of 55.2 months, stroke occurred similarly between groups (2.6% in both groups).21
There was no difference in the incidence of stroke through 48 months between the subgroup of patients in the PCI group that received BMS (n=424) and the medical therapy alone group (2.6% versus 2.7%, p=0.89).112 Similar results were found for this outcome when the DES patient subgroup (n=245) was compared to the medical therapy group (1.4% versus 2.7%, p=0.18).
Table 25. PCI versus medical therapy: Adverse events

WA - Health Technology Assessment December 11, 2015
Cardiac Stents – Re-Review: Final Evidence Report Page 109
Event RCT PCI + MT MT Risk Difference
(95% CI)
Effect Size
(95% CI) p-value
Peri-procedural MI BARI 2D
(type 2
diabetes)
3.4% (27/797) 1.4% (11/805) 2.0% (0.5% to
3.5%)
RR=2.48 (1.24
to 4.96)
0.0079
COURAGE* 3.0%
(35/1149)*
0.8% (9/1138)* 2.3% (1.1% to
3.4%)
RR=3.85 (1.86
to 7.98)
0.0001
MASS II 1.0% (2/205)† NA NC NC NC
Peri-procedural
Death
BARI 2D
(type 2
diabetes)
0.5% (4/798) NR NC NC NC
In-hospital death MASS II 2.4% (5/205) NR NC NC NC
Unable to dilate
lesion
COURAGE 2.0%
(27/1149)
NR NC NC NC
In-Hospital
Emergency CABG
MASS II 1.0% (2/205) NA NC NC NC
In-Hospital
Emergency PCI
MASS II 1.0% (2/205) NA NC NC NC
Peri-procedural stroke
BARI 2D (type 2 diabetes)
0.4% (3/797) 0.2% (2/805) 0.1% (-0.4% to 0.7%)
RR=1.52 (0.25 to 9.04)
0.65
In-hospital stroke MASS II 1.0% (2/205) NA NC NC NC
12 month stroke Hambrecht (males)
6% (3/50) 4% (2/51) 2% (–6% to 10%) RR=1.5 (0.3 to 8.8)
0.63
MASS II 1.0% (2/205) 1.5% (3/203) –0.5% (–2.6% to 1.6%)
RR=0.7 (0.1 to 3.9)
0.65
55.2 months (median) stroke
COURAGE 1.9% (22/1149)
1.2% (14/1138) 0.7% (–0.3% to 1.7%)
RR=1.56 (0.80 to 3.03)
0.19
60 months stroke MASS II 3.4% (7/205) 3.5% (7/203) –0.03% (–3.6% to 3.5%)
RR=1.0 (0.4 to 2.8)
0.99
55.2 months (mean) stroke
BARI 2D (type 2 diabetes)
2.6% (21/797) 2.6% (21/805) 0.03% (-1.5% to 1.6%)
1.0 (0.6 to 1.8) 0.97
120 months stroke MASS II 5.4% (11/205) 6.9% (14/203) –1.5% (–6.2% to 3.1%)
RR=0.8 (0.4 to 1.7)
0.52
MI: myocaridial infarction; NA: not applicable; NC: not calculable; NR: not reported; RR: relative risk.
* As reported in Boden 2007 (the first results paper published for the COURAGE trial); note that Boden 2009 reported periprocedural MI in 3.3% (38/1149) PCI patients and 1.1% (13/1138) medical therapy patients (p<0.001) for the same time period. It is unclear what led to this discrepancy in results.
†Q-wave MI (Hueb 2004). Favarato 2007 also reported that perioperative acute MI occurred in “1.5% (n=4) PCI patients”, although 1.5% of the PCI group would be 3 patients.

WA - Health Technology Assessment December 11, 2015
Cardiac Stents – Re-Review: Final Evidence Report Page 110
4.1.4. Differential efficacy or safety
General population:
In the COURAGE trial,15 patient sex appeared to modify treatment effect with respect to the composite outcome of death/MI through a median of 55.2 months (interaction p=0.03) such that PCI may be slightly favored over medical therapy in women (17.8% versus 26.0%; RD -8.3%, 95% CI -17.1% to 0.5%; RR 0.68, 95% CI 0.45 to 1.03;; p=0.0659) but not in men (19.0% versus 18.0%; RD 1.1%, 95% CI 1.1%, 95% CI -2.4% to 4.5%; RR 1.06, 95% CI 0.88 to 1.27; p=0.56) (Table X). Data from this trial also suggests that the healthcare system (US-VA versus US-nonVA versus Canada) modified treatment effect for the outcome of revascularization (PCI or CABG) through a median of 55.2 months (interaction p<0.001)26 (Table 26). Both patient sex and healthcare system were specified as factors of interest a priori.
In post-hoc analysis, the COURAGE trial found that baseline scores of the following SAQ domains (patients divided into three tertiles) and time (through 36 months) modified treatment effect with respect to outcomes of the same domain138:
Clinically significant improvement from baseline (defined as ≥20 points) (interaction p<0.001) in the SAQ angina frequency domain; similar results were found for mean scores (interaction p=0.008).
Clinically significant improvement from baseline (defined as ≥8 points) (interaction p<0.0001) in the SAQ physical limitation domain; similar results were found for mean scores (interaction p<0.0001).
Clinically significant improvement from baseline (defined as ≥16 points) (interaction p<0.0001) in the SAQ quality of life domain; similar results were found for mean scores (interaction p<0.0001).
In the COURAGE trial,138 the SAQ angina stability domain was modified in terms of treatment group, patient sex, and time (through 36 months), with an interaction p-value of 0.0041; however no other results were reported and it is unclear how the results varied according to patient sex and time, which were both used as interaction variables. Similarly, the SAQ angina frequency (and quality of life) domain was modified in terms of treatment group, prior CABG, and time (through 36 months), with an interaction p-value of 0.0113 (and p=0.0270 for the quality of life domain); however no other results were reported and it is unclear how the results varied according to history of CABG and time, which were both used as interaction variables.
The following baseline characteristics may impact treatment outcome, however no evidence for interaction was provided by the study. Further study is needed to assess the impact of these characteristics. Data are provided in Appendix G.
Baseline SAQ angina frequency domain145 (lowest versus middle versus highest tertile) for the following outcomes through a median of 55.2 months: death/nonfatal MI, death/nonfatal MI/stroke (interaction p-value NR) (COURAGE trial). However, this baseline characteristic did not appear to impact any of these outcomes when assessed individually (see below).
Baseline SAQ quality of life domain145(lowest versus middle versus highest tertile) for the composite of death/MI through a median of 55.2 months (interaction p-value NR) (COURAGE trial). However, this baseline characteristic did not appear to impact either of these outcomes when assessed individually (see below).

WA - Health Technology Assessment December 11, 2015
Cardiac Stents – Re-Review: Final Evidence Report Page 111
Stenosis of index lesion79(≥50% versus <50%) as evaluated only in the subgroup of patients in the COURAGE trial who required a symptom-driven angiogram during follow-up, for the outcomes of symptom progression, PCI revascularization, or the composite outcome of MI,ACS/PCI through a mean of 15.6 months (interaction p-value NR) (COURAGE trial).
None of the following characteristics modified (or appeared to modify in cases where the p-value for interaction was not reported) treatment effect of PCI plus medical therapy versus medical therapy alone based on data from the COURAGE and/or MASS-II trials:
Age (≥65 versus <65) for the outcome of all-cause mortality through a median of 55.2 months
(interaction p=0.21) (COURAGE trial)124 and through 120 months (interaction p=NR) (MASS-II
trial)71; cardiac death through 120 months (interaction p=NR) (MASS-II trial)71; MI through a
median of 55.2 months (interaction p=0.95) (COURAGE trial)124 and through 120 months
(interaction p=NR) (MASS-II trial)71; hospitalization for acute coronary syndrome through a
median of 55.2 months (interaction p=0.58) (COURAGE trial)124; the composite outcome of
death/MI through a median of 55.2 months (interaction p=0.66) (COURAGE trial124; or in the
composite outcome of death/MI/stroke through a median of 55.2 months (interaction p=0.66)
(COURAGE trial)124; in any domain of the SAQ outcome measure over 36 months (including
physical limitation, angina stability, angina frequency, treatment satisfaction, and quality of life)
(interaction p≥0.11) (COURAGE trial)138; or in any domain of the RAND-36 outcome measure over
36 months (including physical functioning, role limitation-physical, role limitation-emotional,
energy/fatigue, emotional well-being, social functioning, pain, and general health) (interaction
p≥0.13) (COURAGE trial).138
Sex for the following domains of the SAQ outcome measure through 36 months (physical
limitation, angina frequency, treatment satisfaction, and quality of life) (interaction p≥0.13)
(COURAGE trial)138; or any domain of the RAND-36 outcome measure over 36 months (including
physical functioning, role limitation-physical, role limitation-emotional, energy/fatigue,
emotional well-being, social functioning, pain, and general health) (interaction p≥0.08)
(COURAGE trial).138
Race (white versus nonwhite) for the composite outcome of death/MI through a median of 55.2
months (interaction p=0.66) (COURAGE trial)15
Race (stratification not reported) in any domain of the SAQ outcome measure over 36 months
(including physical limitation, angina stability, angina frequency, treatment satisfaction, and
quality of life) (interaction p≥0.13) (COURAGE trial)138; or in any domain of the RAND-36 outcome
measure over 36 months (including physical functioning, role limitation-physical, role limitation-
emotional, energy/fatigue, emotional well-being, social functioning, pain, and general health)
(interaction p≥0.35) (COURAGE trial).138
Baseline angina (CCS class) (CCS class 0-I versus II-III) for the composite outcome of death/MI
through a median of 55.2 months (interaction p=0.66) (COURAGE trial)15

WA - Health Technology Assessment December 11, 2015
Cardiac Stents – Re-Review: Final Evidence Report Page 112
Baseline angina (CCS class) (stratification not reported) in any domain of the SAQ outcome
measure over 36 months (including physical limitation, angina stability, angina frequency,
treatment satisfaction, and quality of life) (interaction p≥0.13) (COURAGE trial)138; or in any
domain of the RAND-36 outcome measure over 36 months (including physical functioning, role
limitation-physical, role limitation-emotional, energy/fatigue, emotional well-being, social
functioning, pain, and general health) (interaction p≥0.13 (COURAGE trial).138
Baseline SAQ physical limitation domain (lowest versus middle versus highest tertile) for the
following outcomes through a median of 55.2 months: all-cause mortality, MI, stroke,
death/nonfatal MI, death/nonfatal MI/stroke (interaction p=NR) (COURAGE trial)145
Baseline SAQ angina frequency domain (lowest versus middle versus highest tertile) for the
following outcomes through a median of 55.2 months: all-cause mortality, MI, stroke (interaction
p=NR) (COURAGE trial)145
Baseline SAQ quality of life domain (lowest versus middle versus highest tertile) for the following
outcomes through a median of 55.2 months: all-cause mortality, MI, stroke, death/nonfatal
MI/stroke (interaction p=NR) (COURAGE trial)145
Baseline ischemia (none/mild versus moderate/severe) for the following outcomes through a
median of 55.2 months: all-cause mortality, MI, or the composite of death/MI (interaction p=NR
for all) (COURAGE trial)112
Number of diseased vessels (1 versus 2 versus 3) for the composite outcome of death/non-
periprocedural MI through a median of 55.2 months (interaction p=0.96) (COURAGE trial)78
Number of diseased vessels (1 versus ≥2) for the composite outcome of death/MI through a
median of 55.2 months (interaction p=0.65) (COURAGE trial)15
Modified Duke Jeopardy Score to include ≥50% stenosis threshold (scores 0-1 versus 2-3 versus
4-6) for the composite outcome of death/MI through a median of 55.2 months (interaction
p=0.06) (COURAGE trial)78
Modified Duke Jeopardy Score to include ≥70% stenosis threshold (scores 0-1 versus 2-3 versus
4-6) for the composite outcome of death/MI through a median of 55.2 months (interaction
p=0.98) (COURAGE trial)78
Prior CABG (yes versus no) for the composite outcome of death/MI through a median of 55.2
months (interaction p=0.81) (COURAGE trial)15; for the following domains of the SAQ outcome
measure through 36 months (physical limitation, angina stability, and treatment satisfaction)
(interaction p≥0.25) (COURAGE trial)138; or in any domain of the RAND-36 outcome measure over
36 months (including physical functioning, role limitation-physical, role limitation-emotional,
energy/fatigue, emotional well-being, social functioning, pain, and general health) (interaction
p≥0.08) (COURAGE trial).138

WA - Health Technology Assessment December 11, 2015
Cardiac Stents – Re-Review: Final Evidence Report Page 113
Ejection fraction (>50% versus ≤50%) for the composite outcome of death/MI through a median
of 55.2 months (interaction p=0.72) (COURAGE trial)15
History of MI (yes versus no) for the composite outcome of death/MI through a median of 55.2
months (interaction p=0.15) (COURAGE trial)15; in any domain of the SAQ outcome measure
over 36 months (including physical limitation, angina stability, angina frequency, treatment
satisfaction, and quality of life) (interaction p≥0.13) (COURAGE trial)138; or in any domain of the
RAND-36 outcome measure over 36 months (including physical functioning, role limitation-
physical, role limitation-emotional, energy/fatigue, emotional well-being, social functioning, pain,
and general health) (interaction p≥0.12) (COURAGE trial).138
Current smoking status (smoker versus not smoker) for the composite outcome of death/MI
through a median of 55.2 months (interaction p=0.71) (COURAGE trial)15
Diabetes status (yes versus no) for the outcomes of all-cause mortality through 12, 60,118 and 120
months71 (interaction p=NR for all) in the MASS-II trial or for the outcome of cardiac death
through 120 months71 (interaction p=NR) in the MASS-II trial; or (in the COURAGE trial) for the
composite outcome of death/MI through a median of 55.2 months (interaction p=0.33)15; in any
domain of the SAQ outcome measure over 36 months (including physical limitation, angina
stability, angina frequency, treatment satisfaction, and quality of life) (interaction p≥0.12)
(COURAGE trial)138; or in any domain of the RAND-36 outcome measure over 36 months
(including physical functioning, role limitation-physical, role limitation-emotional, energy/fatigue,
emotional well-being, social functioning, pain, and general health) (interaction p≥0.05)
(COURAGE trial).138
Metabolic syndrome status/Diabetes status (no/no versus yes/no versus no/yes versus yes/yes)
for the composite outcome of death/MI through a median of 55.2 months (interaction p=NR)
(COURAGE trial)81
Chronic kidney disease (yes versus no) on any of the following outcomes through a median of
55.2 months follow-up in the COURAGE trial108: all-cause mortality (interaction p=0.78), cardiac
death (interaction p=0.39), MI (interaction p=0.42), stroke (interaction p=0.75), cardiac
hospitalization (interaction p=0.51), hospitalization for new acute coronary syndrome
(interaction p=0.84), or revascularization (interaction p=0.68). In addition, this subgroup did not
modify treatment effect in terms of clinically significant improvement in any of the SAQ domains
(physical limitation, quality of life, angina frequency, angina stability, and treatment satisfaction
evaluated individually) through 36 months (interaction p>0.08 for all) in the COURAGE trial.109
Healthcare system (Canada versus US non-VA versus US-VA) for the outcomes on any of the
following outcomes through a median of 55.2 months follow-up: all-cause mortality (interaction
p=0.55), hospitalization for acute coronary syndrome (interaction p=0.96), congestive heart
failure (interaction p=0.80), SAQ angina frequency domain scores (p=NR), the composite of
death/MI/stroke (interaction p=0.17),26 or the composite of death/MI (interaction p=0.17)15

WA - Health Technology Assessment December 11, 2015
Cardiac Stents – Re-Review: Final Evidence Report Page 114
Special population: Males
Differential efficacy and safety were not reported.47,135
Special population: Type 2 Diabetes
The BARI 2D trial of patients with type 2 diabetes reported that none of the following characteristics modified treatment effect:
Age (<60 versus 60-69 versus ≥70 years) for the outcome of revascularization through 60 months (interaction p=0.36).27 The authors also noted that for the PCI group, age (evaluated as above) did not modify the effect of PCI for all-cause mortality (p=0.28), however data were not provided.
Baseline angiographic risk categorized as low or high based on whether the patient’s angiographic risk score fell in the lower two tertiles (low risk) or top tertile (high risk) for the study population with respect to the following outcomes21: death (interaction p=NR) (mean 63.6 months follow-up), periprocedural MI (mean 55.2 months follow-up) (interaction p=NR), non-periprocedural MI (mean 55.2 months follow-up) (interaction p=NR), periprocedural stroke (mean 55.2 months follow-up) (interaction p=NR), or non-periprocedural stroke (mean 55.2 months follow-up) (interaction p=NR), or death/MI/stroke through 60 months (interaction p=0.87)
Baseline cardiovascular risk as stratified by Framingham risk scores into low Framingham risk (lower two tertiles) versus high Framingham risk (top tertile with respect to the following outcomes21: death/MI/stroke through 60 months (interaction p=0.16, respectively.
Baseline angiographic/cardiovascular risk as stratified according to both of the above risk factors (i.e., low angiographic risk/low Framingham risk, low angiographic risk/high Framingham risk, high angiographic risk/low Framingham risk, and high angiographic risk/high Framingham risk) for the following outcomes21: death/MI/stroke through 60 months (interaction p=0.58), death (60 months) (interaction p=NR), MI (60 months) (interaction p=NR), or stroke (60 months) (interaction p=NR).
Other individual cardiovascular risk factors in terms of their individual impact on the composite outcome of death/MI/stroke through 60 months21: number of diseased vessels (1 versus 2 versus 3, interaction p=0.83), Myocardial Jeopardy Index score (<55 versus ≥55, interaction p=0.40), number of lesions (<6 versus ≥6, interaction p=0.63), presence versus absence of any total occlusion (interaction p=0.99), presence versus absence of any proximal LAD (left anterior descending artery) (interaction p=0.53), history versus no history of revascularization (interaction p=0.70), or abnormal versus normal LVEF (left ventricular ejection fraction) (interaction p=0.17).
Other individual cardiovascular risk factors with respect to their individual impact on the three-year outcomes of worsening angina, freedom from angina (in those with classic angina at baseline only), new angina (in those without classic angina at baseline only); or on revascularization through 60 months28: number of diseased vessels (1 versus 2 versus 3) (interaction p=NR), Myocardial Jeopardy Index score (<55 versus ≥55) (interaction p=NR), history versus no history of revascularization (interaction p=NR), or angina at baseline (none, angina equivalents only, angina) (interaction p=NR); the last subgroup was assessed for worsening angina and revascularization only.

WA - Health Technology Assessment December 11, 2015
Cardiac Stents – Re-Review: Final Evidence Report Page 115
Table 26. PCI versus medical therapy: Subgroups that modified treatment effect
Outcome Subgroup PCI+MT % (n/N)
MT % (n/N)
Risk difference (95% CI)
Risk Ratio (95% CI)
p-value Interaction p-value
Primary outcomes
(none)
Secondary outcomes
Revascularization26
(median 55.2 months f/u)
Healthcare system (US-VA)
28.1% 124/441)
32.6% (146/448)
-4.5% (-10.5% to 1.6%)
0.86 (0.71 to 1.05)
0.1474
<0.001 Healthcare system (US-nonVA)
23.4% (43/184)
34.8% (62/178)
-11.5% (-20.8% to -2.2%)
0.67 (0.48 to 0.93)
0.0164
Healthcare system (Canada)
12.9% (61/473)
32.5% (141/434)
-19.6% (-24.9% to -14.3%)
0.40 (0.30 to 0.52)
<0.001
Composite outcomes
Death/MI15
(median 55.2 months f/u)
Sex (Male) 19.0% (186/979)
18.0% (174/968)
1.1% (-2.4% to 4.5%)
1.06 (0.88 to 1.27)
0.56
0.03
Sex (Female) 17.8% (30/169)
26.0% (44/169)
-8.3% (-17.1% to 0.5%)
0.68 (0.45 to 1.03)
0.0659
MI: myocaridial infarction; MT: medical therapy; NA: not applicable; NC: not calculable; NR: not reported; PCI: percutaneous coronary intervention.

WA - Health Technology Assessment December 11, 2015
Cardiac Stents – Re-Review: Final Evidence Report Page 116
4.1.5. Cost Effectiveness
Summary
Four economic analyses met the inclusion criteria and were conducted alongside the trials included in Key Question 1 parts a, b, and c. None found that an initial strategy of PCI plus medical therapy was more cost-effective than an initial strategy of medical therapy alone. The studies are summarized in Table 28. Detailed summary tables and the QHES analysis can be found in Appendix G and E, respectively.
General population
COURAGE Weintraub et al. (2008) conducted a cost-utility analysis alongside a cost-effectiveness analysis using data from the COURAGE trial, which was included as part of Key Question 1 parts a, b, and c and is discussed at more length in section 4.1.2. Briefly, patients with stable single- or multivessel CAD were randomized to receive PCI plus optimal medical therapy (n=1149) or optimal medical therapy alone (n=1138). In the PCI group, 87.6% of patients received at least one stent (84.9% received BMS and 2.7% received DES).15 Patients were followed for a median of 4.6 (IQR range, 3.3 to 5.7) years. The trial was conducted at 50 sites across US and Canada. The analyses were conducted from a societal perspective.136 Time horizons evaluated included both 4.6 years (median) as well as a lifetime horizon.137 Costs were based on direct costs for all hospitalizations, medications, outpatient care, and cardiovascular tests performed over the entire study period; all costs used were based on estimates from a number of different resources, including the Medicare Part A data file on average Medicare reimbursement rates, Medicare fee schedules, and medication Red Book wholesale prices. Lifetime costs were estimated using costs from the last year of the trial and an annual expenditure of $5219 based on the average 2004 Medicare cost per patient; the cost difference between the two groups from the final two years was also taken into consideration. All costs were reported in 2004 US dollars and were discounted 3% annually after the first year. Utility values were calculated using the U-Titer computer program and employed the standard gamble method and took into account Seattle Angina Questionnaire (SAQ) scores as well as patient preference.137 Utility values range from 0 (death) to 1 (perfect health). Utility values for the first two years of the lifetime horizon were based on those from the last two years of the trial, and it was assumed that there would no longer be between-group differences in subsequent years. To calculated quality-adjusted life years (QALYs), utility scores were multiplied by patient survival. Life expectancy was estimated using data from the Framingham Heart Study and were based on patient age, sex, and events that occurred during the trial. The trial found no differences in death, MI, or stroke (see Tables 18-20 and 25 in previous sections) between groups during the follow-up period, and survival estimates were similar between the PCI and medical therapy groups in terms of in-trial life years (4.15±1.50 versus 4.12±1.51, MD 0.03, 95% CI -0.09 to 0.15 years), event-related life-years lost (0.90±2.45 versus 0.95±2.47, MD 0.06, 95% CI -0.26 to 0.15 years), and total life expectancy (12.26±4.78 versus 12.22±4.82, MD 0.04, 95% CI -0.29 to 0.50 years).137 Utility values were not significantly different between the groups at any time point between one month and three years with one exception: at three months, the PCI group had a slightly higher utility value than the medical therapy group (0.93±0.17 versus 0.92±1.17, p=0.008). Utility values were available for only a fraction of randomized patients (32.5% to 55.4% of patients, varying over the follow-up period); the study found that there were not significant differences in baseline characteristics between patients

WA - Health Technology Assessment December 11, 2015
Cardiac Stents – Re-Review: Final Evidence Report Page 117
included in the utility calculations and those excluded due to incomplete data availability. Together, these results let to similar QALY estimates between the groups including in-trial QALYs (3.56±1.34 versus 3.51±1.36, MD 0.05, 95% CI -0.06 to 0.17) and quality-adjusted life expectancy (9.95±3.85 versus 9.89±3.89, MD 0.06, 95% CI -0.21 to 0.43).137 Overall, costs were higher in the PCI group compared with the medical therapy group. In-trial costs were $10,125 (95% CI $8082 to $12,167) higher for the PCI group; this cost difference was driven by the cost of the initial procedure and the associated hospitalization, as other costs were similar between the groups.137 Because estimated costs beyond the trial were similar between the PCI and medical therapy groups ($64,978 versus $65,651, MD -$673, 95% CI -$2781 to $1433), the resulting estimated lifetime costs were $9251 higher in the PCI group ($99,820 versus $90,370, MD $9451, 95% CI $6729 to $12,173) a difference which was statistically significant and again due to the cost difference of the initial procedure. The analysis found that the cost per QALY gained (i.e., the incremental cost-effectiveness ratio, or ICER) with PCI plus medical therapy over medical therapy alone for the in-trial period was $206,229.137 In 5,000 bootstrap replications, PCI was dominated by medical therapy alone 19.0% of the time (and dominated medical therapy 0% of the time), and the likelihood that PCI would cost less than $50,000 per QALY gained was 0% and less than $100,000 was 17.01%. Similar results were found for the cost per life-year gained (rather than cost per QALY gained), with an ICER of $299,518 for PCI. For the lifetime horizon, the cost per QALY gained with PCI (ICER) was $168,019 for PCI. Results of bootstrap replications suggested that PCI was dominated by medical therapy alone 27.7% of the time (and dominated medical therapy 0% of the time), and the likelihood that PCI would cost less than $50,000 (or $100,000) per QALY gained was 10.12% (or 35.43%). Similar results were found for the cost per life-year gained over the lifetime horizon, with an ICER of $262,116 for PCI. The authors concluded that medical therapy alone was more cost-effective than PCI plus medical therapy. Sensitivity analyses were performed, in which the life-years gained with PCI were varied by 40% more than that medical therapy alone to 40% less that that with medical therapy alone.137 The resulting estimates suggested that in order for PCI to be cost-effective at a threshold of $50,000, it would need to result in 0.38 additional life years (and 0.60 additional QALY) over medical therapy alone; for PCI to be cost-effective at a threshold of $100,000, it would need to lead to 0.19 additional life years (and 0.30 additional QALY) over medical therapy alone. Because the trial primarily used BMS, another sensitivity analysis evaluated the impact that use of DES would have on in-stent restenosis rates; the resulting in-trial ICER was $197,465 per QALY gained with PCI and the estimated lifetime ICER was $164,590 per QALY gained with PCI. Although there were no differences between PCI and medical therapy groups in terms of death or MI, the PCI group had significantly better angina-related quality of life compared with the medical therapy group (Table 22 in previous section). Using the in-trial costs calculated above, the ICER in terms of cost per one patient with clinically significant improvement (as defined in Table 27) were $112,876 for SAQ physical limitation, $154,580 for SAQ angina frequency, and $124,233 for SAQ quality of life.137 Zhang et al. (2011)145 published an extension of the above analysis, using same the methodology described in Weintraub et al. 2008.137 In this additional analysis, Zhang et al. evaluated the cost-effectiveness of PCI plus medical therapy versus medical therapy alone but stratified the analysis based on the baseline angina severity.

WA - Health Technology Assessment December 11, 2015
Cardiac Stents – Re-Review: Final Evidence Report Page 118
Baseline angina severity was stratified by tertiles of baseline SAQ scores. For each of the three SAQ domains evaluated, three tertiles (lowest, middle, and highest tertiles) were created based on baseline scores. Tertile thresholds for physical limitation were scores less than 53, 53 to 81, and greater than 81; those for angina frequency were less than 50, 50 to 80, and greater than 80; those for quality of life were less than 42, 42 to 59, and greater than 59.
Table 27. COURAGE trial cost effectiveness: Cost of improvement stratified by baseline SAQ domain scores
Bootstrap Replications
Tertile Cost Difference (PCI-MT)
% More Patients Improved* With PCI vs. MT
ICER (Cost Per Improved* Patient)
% <$50,000/ Improved* Patient
% <$100,000/ Improved* Patient
SAQ physical limitation (PL) (used for both tertiles and outcome)
All NR 8.97% $112,876 NR NR
Lowest (PL) $9392 11.82% $79,448 19.96% 66.87%
Middle (PL) $8691 8.73% $99,614 8.8% 46.80%
Highest (PL) $10,419 1.98% $526,560 0% 1.5%
SAQ angina frequency (AF) (used for both tertiles and outcome)
All NR 6.55% $154,580 NR NR
Lowest (AF) $13,070 4.05% $322,966 0% 1.7%
Middle (AF) $8468 8.15% $103,878 6.9% 46.15%
Highest (AF) $8272 0% NA NA NA
SAQ quality of life (QoL) (used for both tertiles and outcome)
All NR 8.15% $124,233 NR NR
Lowest (QoL) $11,577 10.16% $113,962 2.0% 37.96%
Middle (QoL) $10,036 9.69% $103,634 3.96% 47.47%
Highest (QoL) $7321 0.2% $3,704,391 0.5% 5.1%
ICER: incremental cost-effectivess ratio, MT: medical therapy; NA: not applicable; PCI: percutaneous coronary intervention
* Significant improvement defined as improvement from baseline in SAQ physical limitation domain scores ≥8 points, SAQ angina frequency domain scores ≥20 points; SAQ quality of life domain scores ≥16 points
The cost-effectiveness analysis reported the cost of clinically significant improvement (as defined in Table 27 in the same three SAQ domains (physical limitation, angina frequency, and quality of life) during the trial period (median 4.6 years) in each tertile as stratified by baseline scores.145 As shown in Table 27, significant improvement in SAQ physical domain scores (i.e., improvement by at least 8 points from baseline) with PCI versus medical therapy was greatest for the lower tertile (11.8% more PCI patients had significant improvement during the trial period) and lowest for the highest tertile (1.98% more PCI patients had significant improvement during the trial period.145 For the patients with the lowest baseline SAQ physical limitation domain scores, the resulting cost for significant improvement (ICER) with PCI for this tertile was $79,448. The ICER for PCI for the middle tertile was

WA - Health Technology Assessment December 11, 2015
Cardiac Stents – Re-Review: Final Evidence Report Page 119
higher ($99,614), and that for the third tertile (i.e., the tertile with the highest SAQ scores at baseline) was the highest ($525,560 for PCI). Based on bootstrap replications, the likelihood that PCI was cost-effective at a cost of less than $50,000 was 19.96% for the lowest tertile, 8.8% for the middle tertile, and 0% for the top tertile; the likelihood that PCI was cost-effective at a cost of less than $100,000 was 66.87% for the lowest tertile, 46.80% for the middle tertile, and 1.5% for the top tertile. Thus, the cost for significant improvement in SAQ physical limitation scores increases with baseline score. PCI was most likely to be cost effective in terms of this outcome in those patients with the lowest SAQ physical limitation scores at baseline (i.e., <53).
The cost of significant improvement in SAQ angina frequency domain scores (i.e., improvement by 20 points or more from baseline) with PCI for those patients with the lowest baseline SAQ angina frequency domain scores was $322,966; for this tertile, 4.05% more PCI patients had significant improvement from baseline, and the likelihood that PCI would cost less than $100,000 for improvement in this domain was only 1.5%.145 For those patients in the middle tertile, 8.15% more PCI patients had significant improvement in this score than medical therapy patients, and the ICER for PCI was $102,878; PCI was estimated to cost less than $50,000 per patient improved 6.9% of the time and less than $100,000 46.15% of the time. The ICER for the highest tertile could not be calculated, as there was no net benefit of PCI over medical therapy.
For the SAQ quality of life domain, patients in the lowest tertile showed the greatest likelihood of significant improvement (i.e., increase in score by at least 16 points) during follow-up, with 10.16% more PCI than medical therapy patients showing significant improvement; in the highest tertile, only 0.2% more of those treated with PCI had significant improvement in this domain compared with those treated with medical therapy.145 The cost of significant improvement in SAQ quality domain scores with PCI was $113,962 for the lowest tertile, $103,634 for the middle tertile, and $3,704,391 for the highest tertile. In bootstrap replications, the likelihood that PCI would cost less than $50,000 (or $100,000) for improvement in this domain was 2.0% to 3.96% (or 37.96% to 47.47%) for the lowest and middle tertiles; the likelihood that PCI would cost less than $100,000 for improvement in the SAQ quality of life domain was 5.1% for the top tertile.
Even after additional sensitivity analyses, although PCI generally led to greater improvement in angina quality of life as measured by various domain scores, the ICER for significant improvement in these scores remained relatively high.145 The cost of significant improvement in SAQ domains was generally lower for patients with lower (worse) baseline SAQ domain scores and highest in patients with the highest (best) baseline SAQ domain scores.
Overall, authors concluded that for patients with stable CAD, PCI with optimal medical therapy was not more cost-effective than treatment with optimal medical therapy alone with subsequent revascularization if medically necessary.137,145 Time horizons included a median of 4.6 years (i.e., in-trial period) and a lifetime horizon, and both cost utility (cost per QALY) and cost effectiveness (cost per survival, cost per improvement in angina-related quality of life) were both reported. In addition, the impact of baseline angina severity on the cost-effectiveness of PCI in terms of improvement in angina-related quality of life was examined. While the authors stated that a societal perspective was used, the rationale for choosing this perspective was not reported. In addition, it was not clear why indirect costs were not included in the analysis. There was no discussion of the direction and magnitude of potential biases. Overall, this was a well-conducted economic analysis (QHES 90/100).

WA - Health Technology Assessment December 11, 2015
Cardiac Stents – Re-Review: Final Evidence Report Page 120
MASS-II Two economic analyses were performed using data from the MASS-II trial,35,134 which was included as part of Key Question 1 parts a, b, and c and is discussed at more length in section 4.1.2. Briefly, patients with stable multivessel CAD were randomized to receive PCI plus optimal medical therapy (n=205), optimal medical therapy alone (n=203), or CABG (n=203); the latter group is beyond the scope of this report and was not considered. In the PCI group, 72% of patients received a BMS; DES were not employed in this trial. Patients were followed for 10 years, and outcomes were reported at 1, 5, and 10 years. This single-center trial was conducted in Brazil.
Favarato et al. (2003)35 performed a cost-effectiveness analysis alongside the MASS-II trial, reporting cost per event-free survival as well as cost per angina-free survival through one year follow-up. Costs were obtained from those of another trial (the ARTS study)111 and costs for the following were included: PCI (with stenting) procedure, one year of medication, coronary angiogram (in the PCI group only), hospitalization for acute MI. No discounting was performed, and costs were reported in terms of US dollars (year NR). The perspective was not clearly stated, although the analysis appeared to be conducted from a healthcare perspective. The clinical outcome used in this analysis was event-free survival through one year, which was not clearly defined but appeared to include freedom from death, MI, angioplasty, and revascularization. Data on clinical outcomes were obtained from the MASS-II trial. Mean actual costs through one year were $6390 higher in the PCI versus medical therapy group ($8676 ± $2797 versus $2285 ± $2991, p<0.001). The cost per year of event-free survival was significantly higher in the PCI group compared with the medical therapy group ($10,349 ± 3337 versus $2454 ± 3210), resulting in a calculated mean difference of $7895 (95% CI $7258 to $8532, p<0.001). When angina-free status was added to event-free survival, the difference remained statistically meaningful ($13,099 ± 4224 versus $5006 ± 6552, MD $8093, 95% CI $7021 to $9165, p<0.001). The conclusions and limitations of this analysis are discussed alongside the other economic analysis performed alongside the MASS-II trial (Vieira et al. 2012)134 as the two studies were similar in design and methodology.
Vieira et al. (2012)134 performed a cost-effectiveness analysis using data from the MASS-II trial, and reported cost per event-free survival as well as cost per angina-free survival at five years. Costs were based off average costs at the institution that conducted the trial, and included direct costs accumulated through five years: cost of treatment, additional interventions including revascularization, hospitalization, outpatient visits, and cardiovascular tests. Costs of medication were also included but were based off those reported in another trial (the ARTS study).111 No discounting was performed, and costs were reported in terms of US dollars (year NR). The perspective of the analysis was not stated but it appeared to be conducted from a healthcare perspective. Effectiveness data were obtained from the MASS-II trial and reported as QALYs, which was defined as event-free survival; since no utility values were used this has been referred to here as event-free survival. Event-free survival was not clearly defined but appeared to include freedom from death, MI, revascularization, and stroke. Median five-year costs were $7588 higher in the PCI group compared with the medical therapy group ($14,328 versus $6740). The mean number of years with event-free survival (i.e., time to the first event) was similar between groups (3.59 versus 3.79 years, p=NR). At five years, the cost per event-free survival was $10,896 higher in the PCI group compared with the medical therapy group, a difference which was statistically significant ($19,967 versus $9,071, p<0.001). Because more PCI patients were angina-free than those in the medical therapy group through five years, the analysis was repeated to include angina-free status as part of the definition of event-free survival; the number of event- and angina-free years was 0.70 years higher in the PCI group (2.77 versus 2.07 years). At five years, the cost per event- and angina-free survival was $9278 higher in the PCI group ($25,831 versus $16,553, p<0.001).

WA - Health Technology Assessment December 11, 2015
Cardiac Stents – Re-Review: Final Evidence Report Page 121
The cost-effectiveness analyses performed alongside the MASS-II trial were similar in methodologies with the exception of cost sources and timeframe.35,134 Both concluded that medical therapy was more cost-effective than PCI, with Favarato et al. reporting the analysis using a one-year time horizon and Vieira employing a five-year time horizon. Taken together, the analyses had a number of limitations, including use of a composite outcome to evaluate treatment effectiveness, lack of discounting, and lack of sensitivity analysis (QHES 48/100).
Special population: Males
Hambrecht et al.47 performed a cost-effectiveness analysis alongside a trial of 101 males with stable CAD randomized to receive PCI plus medical therapy (n=50) or exercise plus medical therapy (n=51). The trial is discussed in detail in section 4.1.2. Total costs were presented in dollars and reflect those of the initial treatment plus all costs incurred during the first 12 months of follow-up, including cost of the supervised exercise training classes, the bicycle ergometer used in the control group, coronary angiographies, and all hospitalizations. Costs were reported in US dollars. The trial was conducted in Germany at a single center, and patients were enrolled between 1997 and 2001; it is assumed that costs reflect 1997-2001 US dollars though this was not explicitly stated. No discounting was reported. CCS class was evaluated at baseline and 12 months by a physician blinded to treatment group. The authors reported that the average cost to improve one CCS class between baseline and 12 months was significantly higher in the PCI group compared with the control group ($6956 versus $3249; p<0.001). No cost-effectiveness analysis was performed for the 24-month follow-up period.
This cost-effectiveness analysis was very brief on details, and thus there were many limitations associated with it (QHES 35/100).
Special population: Type 2 Diabetes
Hlatky et al. (2009)50 published an economic analysis containing both cost-effectiveness (cost per improved outcome) and cost-utility (cost per quality adjusted life year (QALY)) analyses using data from the BARI 2D trial. This trial is discussed in greater detail in section 4.1. Briefly, 1605 patients with type 2 diabetes and stable CAD who were considered suitable for PCI were randomized to either PCI plus medical therapy (“PCI”, n=798) or to medical therapy alone (“control”, n=807); BMS or DES were used in 90.7% of patients in the PCI group. The trial also enrolled 763 patients who were considered better suited to CABG than PCI; data for these patients is not included here. The trial was conducted at 49 sites worldwide; 46 of these sites provided data for this economic evaluation, thus a fraction of the 1605 patients were not used for this economic evaluation, although the exact number was not provided.
The analyses were conducted from a healthcare perspective. Cumulative four-year direct costs were used in the evaluation and included costs of tests, procedures, hospitalization, prescription medications, outpatient visits, and rehabilitation or nursing home facilities; indirect costs were not considered. Costs were reported in 2007 US dollars and were calculated from a variety of sources including 2007 Medicare schedule physician fees and 2007 wholesale prescription drug prices. Costs were incurred every three months and were discounted at a 3% annual rate.
Patient follow-up data were reported for all BARI 2D patients enrolled in the economic analysis but not for those selected for the PCI arm only (i.e., versus the CABG arm). Patients were followed for four years; however, the percentage of patients with complete economic follow-up declined sharply over this time period, from 96% complete follow-up at one year and 88% follow-up at two years to 61% and 34% follow-up at three and four years, respectively. It was unclear how missing data were dealt with in

WA - Health Technology Assessment December 11, 2015
Cardiac Stents – Re-Review: Final Evidence Report Page 122
calculating the cumulative four-year cost outcomes used in the analysis. The survival outcomes were calculated from the five-year Kaplan-Meier survival estimates obtained from the trial (see section 4.1.2).
As a whole, four-year cumulative costs were $5700 higher for the PCI group compared with the control group ($73,400 versus $67,800, p=0.02).50 Costs that significantly differed between PCI and control groups included those for hospitalization ($35,400 versus $28,600, p<0.001), cardiovascular medications other than those for ischemia ($10,900 versus $$11,400, p=0.02), and cardiovascular-related test and procedures ($1,600 versus $1,900, p=0.04).
Four-year economic analyses were based on cost and outcome data from US patients only.50 In the PCI plus medical therapy group, cumulative four-year costs were $76,000, and patients gained a mean of 3.58 life-years. In the medical therapy alone group, cumulative four-year costs were $71,000 and patients gained 3.65 life-years. The results of this base case analysis suggest that over four years, medical therapy alone dominates PCI plus medical therapy, meaning that medical therapy alone was associated with both lower costs and greater survival. Sensitivity analysis was performed in which quality-adjusted life years (QALY) were calculated. These results were duplicated in 99.9% of the 1000 bootstrap re-analyses that were performed using a willingness to pay threshold of $50,000 per life-year gained. The utility estimates used to determine QALYs were based on trial data for the Duke Activity Status Index, self-reported health status, CCS angina class, and health rating; further details on how utility was calculated were not reported. Results of the sensitivity analysis were similar, with 3.221 QALY gained in the PCI group versus 3.48 QALY gained in the medical therapy group (and costs as described for the base case analysis), thus medical therapy alone still dominated.
The analysis was also conducted using a lifetime horizon, in which the calculated excess age/sex/race-specific mortality (versus the general US population) of trial patients was used to determine expected survival of those patients still alive at their final follow-up visit (i.e., at a mean of 5.3 years).50 Additional costs for this time horizon were assumed to be equivalent to those incurred during the four-year economic follow-up period. The lifetime projected cost-effectiveness for the base case analysis showed that the PCI group had slightly lower costs than the control group ($237,900 versus $238,100) but fewer life-years of survival (13.70 versus 14.03), so that medical therapy alone resulted in an additional cost of $600 per life-year gained over this time horizon. This cost effectiveness ratio was estimated to be preferred in 95% of bootstrap replications when the willingness to pay threshold was $50,000; similarly it was estimated to be preferred in 92% of bootstrap re-analyses when the threshold was $100,000. Sensitivity analysis for the lifetime horizon model suggested that when survival was adjusted by QALY utility scores (which again were based on activity, health status, and angina class), the cost per life year gained was $700 for medical therapy alone (compared with PCI plus medical therapy); bootstrap analysis of willingness to pay thresholds of $50,000 and $100,000 found that medical therapy alone was preferred in 94% and 90% of the replications, respectively. When the projected survival was decreased due to non-fatal MI (which was assumed to decrease survival by 2 years) or by non-fatal stroke (which was assumed to decrease survival by 3 years), the cost per life year gained in the medical therapy alone group was $1000, and this treatment was more cost effective than PCI plus medical therapy in 95% and 92% of bootstrap replications using willingness to pay ratios of $50,000 and $100,000, respectively. Sensitivity analysis was also used to vary costs. The first analysis assumed persistent cost differences, meaning that the cost differences seen between one and four years follow-up would persist over the entire lifetime horizon, and results suggested the cost per increased life year for the medical therapy group would be $57,000 and was preferred in only 39% of the bootstrap replications using a willingness to pay threshold of $50,000 and in 72% of the replications when the willingness to pay threshold was $100,000. The second sensitivity analysis assumed equal late costs, meaning that the cost differences seen between one and four years follow-up would end at four years, and results suggested that medical

WA - Health Technology Assessment December 11, 2015
Cardiac Stents – Re-Review: Final Evidence Report Page 123
therapy alone would cost $7000 more than PCI plus medical therapy per life year gained, and was preferred in 93-97% of bootstrap replications with the willingness to pay thresholds described above.
The authors concluded that for adult patients with type 2 diabetes and stable CAD, medical therapy alone (with revascularization performed only if needed) was more cost effective over a four-year period than treating with prompt PCI plus medical therapy when evaluated in terms of direct costs and life-years gained.50 Results were similar when direct costs and QALY gained (which assessed angina, activity, and health status) were evaluated in sensitivity analysis. The authors recognize the four-year time horizon as a limitation, and performed additional analyses using a lifetime horizon, although a number of assumptions needed to be made to perform these analyses, which may or may not be accurate. Lifetime analyses suggested that medical therapy alone was associated with a greater cost per life year gained compared with PCI, however the additional cost per life year gained was found to be cost effectiveness at willingness to pay thresholds of $50,000 and $100,000 per life year gained. Sensitivity analyses generally supported these results. Limitations included unclear follow-up for the PCI-intended strata, low follow-up for all patients (i.e., PCI and CABG strata combined) past two years follow-up as well as limited methodologic details. This was a moderately well-conducted economic evaluation (QHES 79/100).

WA - Health Technology Assessment December 11, 2015
Cardiac Stents – Re-Review: Final Evidence Report Page 124
Table 28. PCI versus Medical therapy: Summary of results and limitations of included economic studies
Author, Date, QHES
Country Perspective Currency
Time Horizon Discounting
Costs Difference in Costs
Outcome (QALY, utility, clinical )
Difference in Outcome
Primary Findings (e.g. ICER, other) Range
Primary Limitations
Weintraub 2008, Zhang 2011 (COURAGE) QHES
US, Canada Study stated societal perspective but only direct costs used 2004 US dollars
Median 4.6 years (in-trial period) & Lifetime horizon 3% annual rate
PCI vs. Med: 4.6 years (median): $34,843 vs. $24,718 Lifetime: $99,820 vs. $90,370
PCI vs. Med: 4.6 years (median): $10,125 (95% CI, 8082 to 12,167) Lifetime: $9451 (95% CI, 6729 to 12,173)
PCI vs. Med: 4.6 years (median): Life-years: 4.15±1.50 vs. 4.12±1.51 QALYs: 3.56±1.34 vs. 3.51±1.36 Lifetime: Life-years: 12.26±4.78 vs. 12.22±4.82 QALYs: 9.95±3.85 versus 9.89±3.89
PCI vs. Med: 4.6 years (median): Life-years: 0.03 (95% CI -0.09 to 0.15) QALYs: 0.05 (95% CI -0.06 to 0.17) Lifetime: Life-years: 0.04 (95% CI -0.29 to 0.50) QALYs: 0.06 (95% CI -0.21 to 0.43)
PCI vs. Med: 4.6 years (median): Cost per life-year gained: $299,518 for PCI Cost per QALY gained (ICER): $206,229 for PCI Lifetime: Cost per life-year gained: $262,116 for PCI Cost per QALY gained (ICER): $168,019 for PCI Similar results were found for cost of clinically meaningful improvement in SAQ domains, even after stratifying by baseline severity (see text for details) Similar results found with sensitivity analyses
Utility values used to calculated QALY were only available for a fraction of randomized patients (32.5% to 55.4%, varying by follow-up period)
Direct costs only even though societal perspective stated
Favarato 2003, Vieira 2012 (MASS-II) QHES 48/100
Brazil Perspective NR (direct costs used)
1 year & 5 years Discounting NR
PCI vs. Med: 1 year $8676 vs. $2285 5 years:
PCI vs. Med: 1 year $6390 5 years: $7588
PCI vs. Med: 1 year Event-free survival*: 0.83 vs. 0.93 years
PCI vs. Med: 1 year Event-free survival*: -0.10 years Event- and
PCI vs. Med: 1 year Cost per event-free survival*: $7895 (95% CI $7258 to $8532, p<0.001)
No discounting
No sensitivity analysis
Perspective NR
Lifetime cost effectiveness NR

WA - Health Technology Assessment December 11, 2015
Cardiac Stents – Re-Review: Final Evidence Report Page 125
Author, Date, QHES
Country Perspective Currency
Time Horizon Discounting
Costs Difference in Costs
Outcome (QALY, utility, clinical )
Difference in Outcome
Primary Findings (e.g. ICER, other) Range
Primary Limitations
US dollars (year NR)
$14,328 vs. $6740
Event- and angina free survival*: NR 5 years: Event-free survival*: 3.59 vs. 3.79 years Event- and angina-free survival*: 2.77 vs. 2.07 years
angina free survival*: NR 5 years: Event-free survival*: -0.20 years Event- and angina-free survival*: 0.70 years
higher with PCI Cost per event- and angina-free survival*: $8093 (95% CI $7021 to $9165, p<0.001) higher with PCI 5 years: Cost per event-free survival*: $10,896 higher with PCI Cost per event- and angina-free survival*: $9278 higher with PCI
Limited methodologic details
Hambrecht 2003 (special population: males) QHES 35/100
Germany Perspective NR (direct costs used) US dollars (year NR)
1 year Discounting NR
PCI vs. Med: 1 year $6086 ± 370 vs. $3708 ± 156
PCI vs. Med: 1 year $2378
NR
NR
PCI vs. Med: 1 year Cost of gaining 1 CCS class from baseline: $3527 higher in PCI group ($6956 vs. $3429)
No discounting
No sensitivity analysis
Perspective NR
Short time horizon (1 year only)
Outcome reported did not include major outcomes of interest such as death or MI
Outcome not clearly reported
Limited methodologic details
Hlatky 2009 (BARI 2D) (special
US Perspective NR (direct costs used)
4 years & Lifetime horizon 3% annual rate
PCI vs. Med: 4 years: $76,000 vs. $71,000
PCI vs. Med: 4 years: $5000 Lifetime:
PCI vs. Med: 4 years: Life-years gained: 3.58 vs. 3.65 QALY gained:
PCI vs. Med: 4 years: Life-years gained: -0.07 with PCI
PCI vs. Med: 4 years: Medical therapy alone dominated PCI in terms of both
Perspective NR
Limited methodologic details
Unclear % f/u for patients used in analysis

WA - Health Technology Assessment December 11, 2015
Cardiac Stents – Re-Review: Final Evidence Report Page 126
Author, Date, QHES
Country Perspective Currency
Time Horizon Discounting
Costs Difference in Costs
Outcome (QALY, utility, clinical )
Difference in Outcome
Primary Findings (e.g. ICER, other) Range
Primary Limitations
population: type 2 diabetes) QHES 65/100
2007 US dollars
Lifetime: $237,900 vs. $238,100
-$200 3.22 vs. 3.48 4 years: Life-years gained: 13.70 vs. 14.03 QALY gained: NR
QALY gained: -0.26 with PCI 4 years: Life-years gained: -0.33 with PCI QALY gained: -0.267 with PCI
cost/life-years gained and cost-QALY Lifetime: Medical therapy alone cost $600 ($700) more than PCI per life year (QALY) gained, Medical therapy alone more cost- effective
past 2 years
Limited methodologic details
NR: not reported; RCT: randomized controlled trial; SD: standard deviation.
* Event-free survival was not clearly defined but appeared to include freedom from death, MI, revascularization, and strok

WA - Health Technology Assessment December 11, 2015
Cardiac Stents – Re-Review: Final Evidence Report Page 127
4.2. Key Question 2: PCI with DES versus BMS in Patients with Stable or Unstable CAD
4.2.1. Study characteristics
The literature search yielded 3408 potentially relevant citations based on the search strategy outlined in Appendix A. Of these 3293 were excluded based on title and abstract and 115 were reviewed at full text. For Key Question 1 parts a, b, and c, a total of 21 citations – 7 RCTs (12 publications),30,32-
34,45,55,60,93,102,103,130,132 3 registries (4 publications),41,94,105,106 and 5 case series56,66,67,96,141 – were included after full-text review; 66 citations were excluded after full-text review (see Appendix B). For Key Question 1 part d (cost-effectiveness), one economic analysis33 also met the inclusion criteria and employed data from one of the trials included in Key Question 1 parts a, b, and c; 28 citations were excluded after full-text review (see Appendix B).
Randomized controlled trials
A total of seven randomized controlled trials (RCTs)30,32,34,60,103,130,132 and five associated follow-up publications33,45,55,93,102 comparing newer generation drug-eluting stents (DES) with bare metal stents (BMS) met the inclusion criteria for KQ 1a, b, and c. Study, patient, and intervention characteristics are found in Table 29. Briefly, four trials (BASKET-PROVE, EXAMINATION, X-MAN, XIMA)30,32,60,103 evaluated everolimus-eluting stents (Xience, Abbott Vascular), two (ENDEAVOR II, ZEUS)34,130 evaluated zotarolimus-eluting stents (Endeavor, Medtronic Vascular), and one trial (PRODIGY)132 evaluated both everolimus- and zotarolimus-eluting stents separately. The most common bare metal stents used across trials were the Driver (Medtronic Vascular) and the Multilink Vision (Abbott Vascular), both made of cobalt-chromium. All included trials were conducted outside of the United States, primarily in Europe as well as Asia Pacific, Israel, New Zealand, and Australia and all but one were multicenter (range, 3 to 72 sites); the X-MAN pilot study was conducted at a single-site in Indonesia. The majority of trials were funded by industry (Medtronic, Abbott Vascular) and/or government entities; one trial received a University research grant indicating that no external funding was received (PRODIGY) and one trial did not report its source of funding (X-MAN). Sample sizes ranged from 150 to 1606 and the majority of patients were male (range, 60%–85%). The average age of the study populations was similar, ranging from 55.0 to 71.8 years, except for the XIMA trial which was conducted solely in octogenarians (mean patient age 83.5 years).30 Other trials were conducted in specific populations as well and included patients with ST-segment elevation myocardial infarction (STEMI) in the EXAMINATION and X-MAN trials,32,103 patient with large vessels (≥ 3 mm) requiring stenting in the BASKET-PROVE trial,60 and uncertain candidates for DES due to a high bleeding or restenosis risk in the ZEUS trial.130 Only the ENDEAVOR II34 and PRODIGY132 trials included stable and unstable patients with no other special characteristics. Hypertension and hyperlipidemia were present in the majority of patients and the prevalence of diabetes ranged from 14.7% to 26.2%. A history of prior MI and prior revascularization was common (however, <20% of the total population) but proportions varied across studies. The majority of patients had one or two diseased vessels requiring stenting, primarily the left anterior decending (LAD) artery and right coronary artery (RCA), and the number of stents implanted ranged from one to two. All patients received dual-antiplatelet therapy, primarily clopidogrel and low dose aspirin, though some trials also reported the use of prasugrel or ticagrelor; in all but one trial (XIMA)30 the medication regimens were identical between the DES and BMS groups. Therapeutic agents for secondary prevention, such as statins, were prescribed according to current guidelines. Of note, the PRODIGY trial was specifically designed to evaluate the efficacy and safety of prolonging the duration of clopidogrel therapy up to 24 months in all-comer patient groups randomized to paclitaxel-eluting, everolimus-eluting, zotarolimus-eluting or bare metal stents. Angiography and revascularization were performed only if clinically indicated in the BASKET-PROVE,60 EXAMINATION103 and X-MAN32 trials while

WA - Health Technology Assessment December 11, 2015
Cardiac Stents – Re-Review: Final Evidence Report Page 128
patients in the ENDEAVOR II34 trial underwent angiography and subsequent revascularization if indicated as defined by protocol (i.e., angiographic follow-up at 8 months for the first 600 consecutive patients enrolled and for all patients implanted with 2 or more stents); it was unclear if angiography and revascularization were clinically- or protocol driven in the remaining three trials (PRODIGY, XIMA, ZEUS).30,130,132 All included trials were critically appraised. Appraisal of individual studies is found in Appendix XX. Overall, two RCTs (ENDEAVOR II, EXAMINATION)34,103 were considered to be at low risk of bias (class of evidence I) and five trials (BASKET-PROVE, PRODIGY, XIMA, X-MAN, ZEUS)30,32,60,130,132 were considered to be at moderately low risk of bias (class of evidence II). Intention-to-treat analysis was clearly applied in all trials. The most common methodological shortcoming across trials was unclear concealment of allocation. Data was analyzed in a blinded fashion in all but one trial – BASKET-PROVE60 – in which the final one third of events were adjudicated without blinding due to time constraints and an attendance issue with one of the members of the independent critical events committee. Co-interventions were applied equally across all studies based on the understanding from clinical experts that current use of agents such as clopidogrel in BMS recipients may vary depending on patient presentation, possibility of upcoming surgery and other factors. Follow-up periods ranged from 30 days to 5 years and all but one trial reported complete follow-up of 80% or greater (and <10% difference between groups); loss-to-follow-up was unclear in the XIMA trial (octogenarians).30 The latter trial was also the only RCT that did not control for possible confounding; compared with BMS, a significantly greater number of patients in the DES group had a history of prior MI and placement of longer stents.

WA - Health Technology Assessment December 11, 2015
Cardiac Stents – Re-Review: Final Evidence Report Page 129
Table 29. DES versus BMS: Patient demographics for randomized controlled trials
de Belder (2014) [XIMA]
Dharma (2014) [X-MAN]
Fajadet (2010) [ENDEAVOR II]
Kaiser (2010) [BASKET-PROVE]
Characteristics
Everolimus DES
(n = 399)
BMS
(n = 401)
Everolimus DES
(n = 75)
BMS
(n = 75)
Zotarolimus DES
(n = 598)
BMS
(n = 599)
Everolimus DES
(n = 774)
BMS
(n = 765)
Patient demographics Males, % (n) 61.1% (244) 59.1% (237) 89.3% (67) 81.3%(61) 77.2% (461) 75.3% (449) 75.8% (587) 76.6% (586) Age, years; mean (SD) 83.6 ± 3.2 83.4 ± 3.1 56 ± 9.6 54 ± 9.5 61.6 ± 10.5 61.9 ± 10.5 66 ± 11 67 ± 11 Stable angina, % (n) NR NR NR NR NR NR 35.0% (271) 37.3% (285) Unstable angina, % (n) NR NR NR NR NR NR 34.1% (264) 32.2% (246) Subgroup Octogenarians Octogenarians STEMI STEMI NR NR Large vessels
(≥3.0 mm) Large vessels
(≥3.0 mm) Number diseased vessels, % (n)
One 62.7% (250) 60.5% (243) 40.0% (30) 38.7% (29) 100% (598) 100% (599) 58.8% (455)* 57.3% (438)*
Two 27.2% (109) 31.5% (126) 60.0% (45)† 61.3% (46)† 0% (0) 0% (0) 41.2% (319) † 42.7% (327) †
Three + 10.2% (41) 8.0% (32) 0% (0) 0% (0) Comorbidities, % (n)
Prior MI 29.8% (119) 21.5% (86) NR NR 39.7% (236) 41.5% (247) 10.7% (82) 13.3% (103) Prior PCI 12.8% (51) 10.2% (41) 0% (0) 0% (0) 21.7% (129) 18.0% (107) 12.0% (93) 11.5% (88) Prior CABG 7.0% (28) 4.2% (17) 0% (0) 0% (0) 4.5% (28) 4.9% (29) 2.6% (20) 2.6% (20) Diabetes 25.6% (102) 24.2% (97) 29.3% (22) 22.7% (17) 18.2% (108) 22.2% (132) 15.4% (119) 14.1% (108) Hyperlipidemia 57.6% (230) 52.9% (212) 48% (36) 48.0% (36) 80.5% (476) 76.9% (455) 64.3% (498) 64.7% (495) Hypertension 75.1% (300) 77.6% (311) 49.3% (37) 49.3% (37) NR NR 60.6% (469) 63.4% (485) Smoking 5.0% (20) 4.0% (16) 35.3% (207) 35.2% (207) 34.5% (267) 34.1% (261)
Procedural characteristics % stenosis, mean (SD) NR NR NR NR 69.7% ± 10.8% 69.5% ± 11.0% NR NR Target lesion, LAD; % (n) 60.7% (242) 63.0% (253) 56% (42) 55% (41) 43.2% (255) 47.5% (281) 53.2% (412) 53.2% (400) Target lesion, left circumflex; % (n)
31.7% (126) 30.0% (120) 7% (5) 3% (2) 22.4% (132) 21.2% (125) 26.1% (202) 26.5% (203)
Target lesion, RCA; % (n) 38.1% (152) 35.3% (142) 37% (28) 43% (32) 34.4% (203) 31.3% (185) 40.1% (310) 42.5% (325) Target lesion, left main; % (n) 7.6% (30) 8.3% (33) NR NR NR NR 0.9% (7) ‡ 1.2% (9) ‡ No. of stents implanted; mean (SD)
2.0 (1–3) § 2.0 (1–3)§ 1.1 ± 0.3 1.0 ± 0.2 See foonote** See footnote** 1.4 ± 0.8 1.5 ± 0.8
Vessel diameter, mm; mean (SD)
3.1 ± 0.4 3.2 ± 0.4 2.7 ± 0.5 2.8 ± 0.5 NR NR
Lesion length, mm; mean 26.6 ± 14.3 24.0 ± 13.4 NR NR 14.1 ± 5.6 14.4 ± 5.7 NR NR

WA - Health Technology Assessment December 11, 2015
Cardiac Stents – Re-Review: Final Evidence Report Page 130
de Belder (2014) [XIMA]
Dharma (2014) [X-MAN]
Fajadet (2010) [ENDEAVOR II]
Kaiser (2010) [BASKET-PROVE]
Characteristics
Everolimus DES
(n = 399)
BMS
(n = 401)
Everolimus DES
(n = 75)
BMS
(n = 75)
Zotarolimus DES
(n = 598)
BMS
(n = 599)
Everolimus DES
(n = 774)
BMS
(n = 765)
(SD) Staged procedure, % (n) 8.3% (33) 7.3% (29) NR NR NR NR 5.3% (41) 4.3% (33) Glycoprotein IIb/IIIa inhibitors
1.5% (6) 1.7% (7) NR NR NR NR 22% (168) 23% (173)
Cross-over, % (n) NR NR NR NR NR NR NR NR Medical treatment/co-intervention
Clopidogrel (duration) mg NR (1 yr.) mg NR (1 mo.) 75 mg/day (1 yr)
75 mg/day (1 yr)
75 mg/day (12 weeks)
75 mg/day (12 weeks)
75 mg/day (12 months)
75 mg/day (12 months)
Aspirin (duration) mg NR (1 yr.) mg NR (1 mo.) 80-100 mg (indefinitely)
80-100 mg (indefinitely)
≥75 mg/day (indefinitely)
≥75 mg/day (indefinitely)
75 or 100 mg/day (long-term)
75 or 100 mg/day (long-
term) Statins/Lipid lowering NR NR NR NR NR NR mg NR (lifelong) mg NR
(lifelong) Hypertension treatment NR NR NR NR NR NR Other NR NR NR NR DAPT (details
NR) DAPT (details
NR) NR NR
Follow-up (% followed) 12 mos. (%NR) 12 mos. (%NR) 30 days (%NR) 30 days (%NR) 5 years (96.8%; 1159/1197)
5 years (96.8%; 1159/1197)
2 years (97.5%; 2255/2314)
2 years (97.5%;
2255/2314) Risk of bias (COE) Moderately Low (II) Moderately Low (II) Low (I) Moderately Low (II)

WA - Health Technology Assessment December 11, 2015
Cardiac Stents – Re-Review: Final Evidence Report Page 131
Table 29 continued. DES versus BMS: Patient demographics and study characteristics
Sabate (2012) [EXAMINATION]
Valgimigli (2015) [ZEUS]
Valgimigli (2014) [PRODIGY]
Characteristics
Everolimus DES
(n = 751)
BMS
(n = 747)
Zotarolimus DES
(n = 802)
BMS
(n = 804)
Everolimus DES
(n = 501)
Zotarolimus DES
(n = 500) BMS
(n = 502)
Patient demographics
Males (n) 84.4% (634) 81.7 (610) 70.0% (561) 71.1% (572) 76.4% (383) 78.2% (391) 73.5% (369) Age, years; mean (SD) 60.8 ± 12 61.6 ± 13 71.8 ± 11 71.8 ± 12 68 ± 11 68 ± 11 69 ± 11 Stable angina (n) NR NR 36.8% (295) 36.7% (295) 25.0% (125) 27.4% (137) 24.3% (122) Unstable angina (n) NR NR 17.3% (136) 16.3% (131) 19.8% (99) 18.4% (92) 18.5% (93) Subgroup (n) STEMI STEMI Uncertain DES
candidates Uncertain DES
candidates None None None
Number diseased vessels, % (n) One 85.9% (645) 87.8% (656) 41.4% (332) 38.9% (313) 28.7% (144) 28.7% (139) 33.9% (170) Two 13.3% (100)†† 11.8% (88)†† 33.2% (266) 35.4% (285) 71.3% (357)†† 72.2% (361)†† 66.1%
(332)†† Three 25.4% (204) 25.6% (206)
Comorbidities, % (n)
Prior MI 4.4% (33) 6.3% (47) 24.2% (194) 23.6% (190) 28.5% (143) 24.2% (121) 22.7% (114) Prior PCI 3.9% (29) 4.3% (32) 19.3% (155) 18.5% (149) NR NR NR Prior CABG 0.4% (3) 0.9% (7) 6.7% (54) 7.3% (99) 12.2% (61) 11.4% (57) 8.9% (45) Diabetes 18.2% (137) 16.2% (121) 26.8% (215) 25.5% (205) 24.0% (120) 23.6% (118) 23.5% (118) Hyperlipidemia 47.1% (354) 40.3% (301) 47.5% (381) 49.6% (399) 70.9% (355) 68.4% (342) 74.9% (376) Hypertension 46.2% (347) 50.6% (378) NR NR 59.1% (296) 52.6% (263) 50.6% (254) Smoking 72.4% (544)† 72.0% (538)† 20.8% (167) 21.0% (169)
Procedural characteristics
% stenosis, mean (SD) NR NR 68% ± 16% 67% ± 16% 78% ± 16% 77% ± 13% 78% ± 14% Target lesion, LAD; % (n) 42.2% (317) 39.0% (291) 52.5% (421) 51.1% (411) 57.3% (287) 59.0% (295) 57.8% (290) Target lesion, left circumflex; % (n) 14.0% (105) 15.0% (112) 32.8% (263) 34.6% (278) 37.1% (186) 29.8% (149) 29.3% (147) Target lesion, RCA; % (n) 42.3% (318) 44.7% (334) 41.8% (335) 39.4% (317) 35.4% (177) 35.8% (179) 37.8% (190) No. of stents implanted; mean (SD) 1 1 1.7 ± 1.1 1.7 ± 1.1 1.8 ± 1.1 1.9 ± 1.3 1.8 ± 1.2 Vessel diameter, mm; mean (SD) NR NR 2.9 ± 0.8 2.9 ± 0.9 NR NR NR
Lesion length, mm; mean (SD) NR NR 16.6 ± 10.7 16.3 ± 10.5 13.1 ± 8.4 13.2 ± 8.3 13.1 ± 8.5 Cross-over, % (n) 0% (0) 0% (0) 1.0% (8) 1.6% (5) NR NR NR
Medical treatment/co-intervention
Clopidogrel (duration) 75 mg/day (1 year) 75 mg/day (1 year)
300 or 600 mg/d (NR)
300 or 600 mg/d (NR)
75 mg/day (NR) 75 mg/day (NR) 75 mg/day (NR)

WA - Health Technology Assessment December 11, 2015
Cardiac Stents – Re-Review: Final Evidence Report Page 132
Sabate (2012) [EXAMINATION]
Valgimigli (2015) [ZEUS]
Valgimigli (2014) [PRODIGY]
Characteristics
Everolimus DES
(n = 751)
BMS
(n = 747)
Zotarolimus DES
(n = 802)
BMS
(n = 804)
Everolimus DES
(n = 501)
Zotarolimus DES
(n = 500) BMS
(n = 502)
Aspirin (duration) 100 mg/NR (indefinitely)
100 mg/NR (indefinitely)
80-160 mg/day (NR)
80-160 mg/day (NR)
75 mg/day (NR) 75 mg/day (NR) 75 mg/day (NR)
Statins/Lipid lowering NR NR NR NR NR Hypertension treatment NR NR NR NR NR Other NR NR DAPT (30 days);
prasugrel or ticagrelor (NR);
single antiplatelet
regimen (NR)‡
DAPT (30 days); prasugrel or
ticagrelor (NR); single antiplatelet
regimen (NR)‡
NR NR NR
Follow-up (% followed) 24 months (98%; 1474/1504)
24 months (98%;
1474/1504)
12 months (99%;
1604/1606)
12 months (99%; 1604/1606)
24 months
(99.3%; 1498/1508)
24 months
(99.3%; 1498/1508)
24 months
(99.3%; 1498/1508)
Risk of bias (CoE) Low (I) Moderately Low (II) Moderately Low (II)
* These figures are back-calculated based on the multivessel figures below.
† These values represent multivessel disease; number of vessels not delineated in text.
‡ Includes left main with bypass grafts
§ Values in parentheses represent the interquartile range (IQR)
** DES vs. BMS: none, 1.0% (6/597) vs. 0.8% (5/596); one, 87.8% (525/597) vs. 88.5% (530/596); two, 11.0% (66/597) vs. 10.2% (61/596).
†† These values represent multivessel disease; number of vessels not delineated in text.

WA - Health Technology Assessment December 11, 2015
Cardiac Stents – Re-Review: Final Evidence Report Page 133
Nonrandomized studies
Additionally, eight nonrandomized studies were found that were designed to evaluate the safety of newer generation DES: three registry studies (in four publications)41,94,105,106 comparing outcomes with BMS and five case series evaluating mechanical complications, primarily stent fracture.56,66,67,96,141 Since stent fracture and other mechanical complications are very rare events and were not reported in any of the included RCTs and nonrandomized comparative studies, these case series were included for completeness. Study, patient, and intervention characteristics for the registry studies are found in Table 30. Briefly, two of the nonrandomized comparative studies, published by Sarno et al., used data collected prospectively from the multicenter Swedish Coronary Angiography and Angioplasty Registry (SCARR); the 2012 paper reported outcomes in the entire population (N=49,198)105 while the 2014 paper included only those patients with STEMI (n=29,876),106 resulting in considerable overlap between these patient populations. Another publication retrospectively analyzed data from the single-center Korea Acute Myocardial Infarction Registry (KAMIR) and included only octogenarians (age ≥80 years) with STEMI (N=509).94 The fourth study included prospectively collected registry data from two dedicated sites in the United States.41 Excluding the study in octogenarians, patient demographics were similar across all populations; ages ranged from 61 to 67 years and the majority of patients were male (72.3% to 74.8%). Conversely, the mean age of patients from the KAMIR registry was 84.8 years and the majority were female (55%). Comorbidities such as prior MI, diabetes, hypertension, hyperlipidemia, and smoking were prevalent in all study populations; in all studies, less than 15% of patients had a history of prior revascularization (PCI or CABG). The target lesion was most commonly the left anterior descending artery, followed by the right coronary artery. The mean number of stents placed was similar across the four studies that reported this variable (range, 1.5 to 1.8 stents). All studies indicated that the majority of patients were taking both clopidogrel and aspirin. The recommended duration of clopidogrel treatment (75 mg once daily) was at least 12-month for DES patients and at least 1-month for BMS patients in the KAMIR registry and dual antiplatelet therapy was recommended for 1 year following primary PCI in another41; regimens were not reported for the populations from the SCAAR registry. The use of statins, lipid lowering drugs, hypertension treatment, or others medication (e.g., ticagelor, heparin, etc.) was poorly reported across studies. Two of the registries (SCAAR, Garg et al.) were considered to be moderately high risk of bias (CoE III) and one (KAMIR) was considered high risk of bias. The main differences between the KAMIR registry study and the other studies was that it was not designed specifically for the conditions evaluated, it included retrospective data only, and there was no mention of a process to validate the completeness and quality of the data collected. In all studies, independent or blind assessment of outcomes not clearly independent of personal judgement was unclear or not done. Follow-up periods ranged from 12 to 36 months and the proportion of patients followed to the final timepoint was unclear in all studies. Coinverventions were applied equally across studies given the understanding stated above. All studies controlled for baseline characteristics that were not evenly distributed between groups and accounted for time at risk. Details regarding the case series can be found in Appendix F.

WA - Health Technology Assessment December 11, 2015
Cardiac Stents – Re-Review: Final Evidence Report Page 134
Table 30. DES versus BMS: Patient demographics for nonrandomized comparative studies
Garg 2014
Piao 2014 [KAMIR]
Sarno 2012 [SCAAR]
Sarno 2014 [SCAAR]
Characteristics
DES (n = 752)
BMS (n = 1187)
DES (n = 323)
BMS (n = 186)
DES (n = 6425)
BMS (n = 42,773)
DES (n = 4811)
BMS (n = 25,065)
Patient demographics
Males, % (n) 73.9% (556) 71.5% (849) 43.3% (140) 47.8% (89) 74.0% (7808) 72.0% (46,534) 73.8% (3551) 75.0% (18,799) Age, years; mean (SD) median 61
(IQR, 62, 71) median 61
(IQR, 51, 74) 84.6 ± 3.8 85.2 ± 4.2 65.8 ± 10.5 67 ± 11.2 67.8 ± 11.3 66 ± 11.6
Stable angina, % (n) NR NR NR NR 31.3% (2013) 18.0% (7718) NR NR Unstable angina, % (n) NR NR NR NR 51.8% (3331) 44% (18,855) NR NR Subgroup STEMI STEMI Octogenarians
with STEMI Octogenarians
with STEMI None None STEMI STEMI
Number diseased vessels, % (n) One NR NR 35.3% (114) 52.7% (98) 39.6% (2546) 48.5%
(20,760) NR NR
Two NR NR 32.8% (106) 19.4% (36) 24.8% (1591) 28.7% (12,274)
NR NR
Three + NR NR 27.6% (89 24.2% (45) 15.8% (1017) 16.9% (7239) NR NR Comorbidities, % (n)
Prior MI 11.3% (85) 15.9% (189) 4.3% (14) 3.8% (7) 36.3% (2334) 22.7% (9698) 19.9% (1411) 28.1% (2085) Prior PCI NR NR 2.8% (9) 1.6% (3) NR NR NR NR
Prior CABG 4.9% (37) 5.7% (68) NR NR 13.8% (885) 8.2% (3522) 10.4% (741) 12.2% (902) Diabetes 18.4% (138) 15.8% (188) 24.5% (79) 18.7% (34) 25.3% (1623) 15.8% (6756) 26.7% (1892) 24.9% (1844) Hyperlipidemia NR NR 6.5% (21) 7.7% (14) 62% (3983) 45.6% (19,505) 67.7% (4802) 52.7% (3905) Hypertension 56.1% (422) 56.4% (669) 61.3% (198) 51.6% (94) 62.3% (4002) 51.4% (21,972) 65.6% (4650) 58.9% (4365) Smoking 35.7% (266) 46.2% (544) 13.5% (43) 27.1% (49) 17.1% (1101) †† 21.5% (9181)†† 19.3% (1367) 24.1% (1786)
Procedural characteristics
Target lesion, LAD; % (n) 37.9% (285) 33.4% (397) 53.6% (173) 42.5% (79), 41.5% (2669) 41.2% (17,641) 44.8% (5447) 41% (4394) Target lesion, left circumflex; % (n)
14.6% (110) 13.8% (164) 7.4% (24) 5.9% (11), 16.7% (1076) 18.7% (7996) 23% (2802) 21.2% (2265)
Target lesion, RCA; % (n) 44.9% (338) 49.5% (588) 37.2% (120) 50% (93), 22.2% (1427) 35.5% (15,188) 27% (3286) 30.7% (3290) No. of stents implanted; mean (SD)
NR NR 1.5 ± 0.8 1.4 ± 0.7 1.63 ± 0.93 1.45 ± 0.77 1.96 ± 1.10 1.78 ± 0.99
Glycoprotein IIb/IIIa inhibitors*
40.7% (306) 55.3% (657) 18.6% (59) 27.0% (43) 12.9% (1368) 28.1% (18,197) 24.3% (1170) 43.4% (10,878)

WA - Health Technology Assessment December 11, 2015
Cardiac Stents – Re-Review: Final Evidence Report Page 135
Garg 2014
Piao 2014 [KAMIR]
Sarno 2012 [SCAAR]
Sarno 2014 [SCAAR]
Characteristics
DES (n = 752)
BMS (n = 1187)
DES (n = 323)
BMS (n = 186)
DES (n = 6425)
BMS (n = 42,773)
DES (n = 4811)
BMS (n = 25,065)
Medical treatment/co-Intervention*
Clopidogrel (duration)* DAPT (% NR) DAPT (% NR) 98.1% (313)§ 100.0% (186)§ 96.1% (10,143) 96.3% (62,189) 23.2% (1115) 22.8% (5727) Aspirin (duration)* DAPT (% NR) DAPT (% NR) 97.5% (312) 100.0% (186) 98.5% (10,428) 98.0% (63,304) 10.7% (514) 12.9% (3233) Statins/Lipid lowering* NR† NR† 67.8% (219) 71.5% (133) NR NR NR NR Hypertension treatment* NR† NR† 48.4% (156)** 53.9% (100)** NR NR NR NR
Follow-up (% followed) 12 months (99.6%)‡
12 months (99.6%)‡
12 months (% NR)
12 months (% NR) 24 months; mean 359 ± 194
days (% NR)
24 months; mean 607 ± 190
days (% NR)
36 months (% NR) 36 months (% NR)
Risk of bias (COE) Moderately high (III) High (IV) Moderately high (III) Moderately high (III)
BMS: Bare-Metal Stent; CABG: Coronary Artery Bypass Grafting; DAPT: Dual Antiplatelet Therapy; DES: Drug-Eluting Stent; LAD: Left Anterior Descending artery; IQR: Interquartile Range; LMWH: Low Molecular Weight Heparin; NR: Not Reported; KAMIR: Korea Acute Myocardial Infarction Registry; RCA: Right Circumflex Artery; SCAAR: Swedish Coronary Angiography and Angioplasty Registry; SD: Standard Deviation; STEMI: ST-Elevated Myocardial Infarction
* Only proportion of patients given each medical treatment were reported; dose and frequency are unknown.
† For both arms, aspirin, unfractionated heparin, glycoprotein IIb/IIIa, or aspirin and bivalrudin without glycoprotein IIb/IIIa were administered at unknown dose and frequency periprocedurally.
‡ Follow-up is for overall population.
§ Post-procedurally, clopidogrel was administered for at least 12 months for DES group and at least 1 month for BMS group.
** This is an average based on percent patients reported to be on ACE inhibitors, ARBs, and beta-blockers.
†† Current values are for current smokers; study also gave values for former smokers (DES vs. BMS) 39.2% (2517) vs. 33.4% (14,279)

WA - Health Technology Assessment December 11, 2015
Cardiac Stents – Re-Review: Final Evidence Report Page 136
In addition to the primary studies that met the inclusion criteria, an individual patient data meta-analysis by Stefanini, et. al compared DES with BMS among women only.121 Seventeen of the included RCTs compared newer DES with each other, with older DES or with BMS. It was estimated that at least 85% of persons received FDA approved DES. Willingness to provide data was the only inclusion/exclusion criteria stated and authors report that all contacted investigators agreed to provide data. This analysis was rated as being at high risk of bias. Primary methodological concerns include unclear methods and criteria for identification of studies (no systematic literature search was described), and lack of information on the amount and handling of missing data. Across 17 RCTs, 6278 women receive a newer-generation DES and across 10 RCTs 1108 received BMS; only two trials (ENDEAVOR II and PRODIGY) were head to head comparisons of BMS with newer DES. Most individual patient data for BMS were from older (2006 or earlier) studies comparing BMS with older DES, thus there may be heterogeneity in populations and medical practices. There was differential length of follow-up between groups with mean follow up of 2.6 years (±1.4years) in those receiving DES compared with 3.3 years (±1.5years) in those receiving BMS. There were significant differences between groups with regard to patient risk factors and clinical history and in lesion and angiographic characteristics at baseline; statistical adjustment for these factors was done for some 3 year outcomes.
4.2.2. Efficacy and Effectiveness
All-cause mortality (primary outcome)
Summary Overall, all-cause mortality was similar between DES and BMS groups at all time frames (Figures 3 and 4; Table 31). Across four RCTs (N=5084)30,34,103,130 no differences in cumulative all-cause mortality were observed between DES and BMS at 12 months. There were also no differences across three trials33,60,102 (N = 4204) at >12 months. No differences in cumulative all-cause mortality were identified at 6 months in one trial (N = 800) or at 60 months in another trial (N = 1498). An individual patient data meta-analysis in women only (N =6278) also reported similar risk of all-cause mortality for newer DES and BMS recipients at 3 years based on unadjusted Kaplan Meier estimates; adjusted effect size estimates were not reported.121 Detailed analysis Of the four trials reporting cumulative all-cause mortality to 12 months, one at moderately low risk of bias was in octogenarians (XIMA, N = 800), one at low risk of bias in persons with STEMI (EXAMINATION, N = 1498), one at moderately low risk of bias in a mixed population (i.e. stable and unstable presentation) (ENDEAVOR II N = 1167) and one at moderately low risk of bias in patients whose candidacy for DES was uncertain due to bleeding risk (ZEUS, N=1606). Two trials employed everolimus stents30,103 and two employed zotarolimus stents34,130 and compared them to BMS. Across four trials, cumulative all-cause mortality was similar between the DES and BMS groups, occurring in 6.2% (157/2542) of those receiving newer-generation DES versus 5.9% (151/2541) of BMS recipients by 12 months, pooled risk RD = 0.49% (-0.49% to 1.5%) and pooled RR 1.04 (95% CI 0.84 to 1.28 up to 12 months (Figure 3). Despite potential clinical heterogeneity in patient populations previously described, no statistical heterogeneity was identified for pooled estimates and results of no difference between DES and BMS were consistent across trials. Three trials (N = 4204)33,60,102 reported all-cause mortality past 12 months, two at 24 months, and one at 48 months were pooled. At 24 months, across two RCTs employing everolimus DES, one RCT (CoE I) was in patients with STEMI (EXAMINATION N = 1498)102 and one RCT (CoE II) in patients requiring stent

WA - Health Technology Assessment December 11, 2015
Cardiac Stents – Re-Review: Final Evidence Report Page 137
diameter of ≥ 3 mm (BASEKT PROVE, N = 1539),60 there were no differences between DES and BMS (pooled RD -0.98% (-2.4% to 0.4 %) . Similarly, there was not difference between zotarolimus DES and BMS up to 48 months in in one trial (CoE I) in a mixed population ( i.e. stable and unstable presentation) (ENDEAVOR N = ). Across the three trials reporting all-cause mortality >12months, risk of all-cause mortality was similar: 4.1% (86/2108) in DES recipients versus 4.8% (101/2096) of BMS recipients, pooled RD -0.78% (95% CI -2.0% to 0.5%, pooled RR 0.85 (95% CI 0.64, 1.12) (Figure 4). Despite potential clinical heterogeneity across studies due to study population differences, no statistical heterogeneity was identified when studies were pooled. No differences between treatments were found at other time frames reported in single studies. One trial (XIMA) in octogenarians (N=800) reported no differences in cumulative frequency of all-cause mortality between DES and BMS groups at 6 months (4.8% vs. 4.0%). The ENDEAVOR II trial (N = 1167) reported the longest follow-up, to 60 months; No statistical differences in cumulative all-cause mortality were identified (6.2% for DES versus 7.6 % BMS, RD -1.3% 95% CI -4.2 to 1.6) at 60 months (Table 31). There may have been insufficient power in both these trials to detect a statistically meaningful difference between DES and BMS. Similarly, when periprocedural events (<30 days) were excluded, risk of all-cause mortality was comparable between DES and BMS groups from 1-6 months (3.3% versus 2.7%) and from 1-12 months (7.0% versus 6.0%) in the XIMA trial and in the EXAMINATION trial in patients with STEMI at 12 months (2.0% versus 1.6%) and 24 months (2.8% versus 3.1%), Table 31.
Figure 3. Comparison of newer-generation DES with BMS for all-cause mortality at 12 months*
BMS: bare metal stents; CI: confidence interval; DES: drug-eluting stents.
*Trials enrolling special populations: EXAMINATION, STEMI patients; XIMA, octogenarians; ZEUS, patients that whose candidacy for DES is uncertain based on bleeding risk.

WA - Health Technology Assessment December 11, 2015
Cardiac Stents – Re-Review: Final Evidence Report Page 138
Figure 4. Comparison of newer-generation DES with BMS for cumulative all-cause mortality in studies with follow-up >12 months to 48 months*
BMS: bare metal stents; CI: confidence interval; DES: drug-eluting stents.
*Trials enrolling special populations: BASKET-PROVE, patients with large vessels, requiring >3 mm diameter stents; EXAMINATION, STEMI patients.
An individual patient data meta-analysis in women only (N =6278)121 also reported similar risk of all-cause mortality for newer DES and BMS recipients (5.3% vs. 6.3%) at 3 years based on unadjusted Kaplan-Meier estimates; adjusted effect size estimates were not reported. This analysis was considered to be at high risk of bias as primarily because methods of study selection were not clear and there were significant differences between treatment groups with regard to patient risk factors and clinical history. Two post-hoc analyses of the EXAMINATION trial data in patients with STEMI were also included.45,55 Subgroup analyses were conducted to examine age ≥75 years and <75 years as well as proximal left anterior descending (LAD) artery disease intervention following DES and BMS on outcomes at 12 months. (Appendix Table X). No significant differences in all-cause mortality at 12 months between treatment groups for patients age ≥75 years (n=245) or for age <75 years (n=1253) in one study55 or for those with proximal (n=290) and non-proximal (n=1208) LAD disease in the other.45 Statistical tests for interaction for these factors were not significant (See KQ 2c on differential effectiveness). Overall, however, regardless of treatment group, risk of all-cause mortality was higher in patients ≥ 75years old (13.9%) compared with those <75 years old (1.4%) and for those with proximal LAD disease (5.5%) compared with those with non-proximal LAD disease. Cardiac death (primary outcome)

WA - Health Technology Assessment December 11, 2015
Cardiac Stents – Re-Review: Final Evidence Report Page 139
Summary No differences between DES and BMS were seen for cumulative risk of cardiac death at any time frame. Across four RCTs (N=5084 total, two at low risk of bias and two at moderately low risk of bias),30,34,103,130 no differences between DES and BMS with regard to cumulative cardiac mortality were observed at 12 months, across two trials (N = 2665, one at low risk of bias, one at moderately low of bias)60,102 at 24 months or at 60 months in one trial (N= 1498)34 (Figures 5 and 6, Table 31) Detailed analysis Of the four trials reporting cardiac death at 12 months, one RCT with moderately low risk of bias was in octogenarians (XIMA, N = 800),30 one with low risk of bias in persons with STEMI (EXAMINATION, N = 1167),103 one at moderately low risk of bias in a mixed population (i.e. stable and unstable presentation) (ENDEAVOR II N = 1167)34 and another at moderately low risk of bias in patients whose candidacy for DES was uncertain due to bleeding risk (ZEUS, N = 1606).130 Two trials employed everolimus stents30,103 and two employed zotarolimus stents34,130 and compared them to BMS. No differences in cardiac death between DES and BMS were observed at any time frame. By 12 months, across four trials (N = 5084), cumulative cardiac death was similar between treatments with 4.1% (104/2542) of those receiving newer generation DES versus 4.4% (111/2542) of BMS recipients experience cardiac death, pooled RD = 0.09% (-0.72% to 0.9%), pooled RR 0.94 (0.72, 1.22). Despite potential clinical heterogeneity across studies, no statistical heterogeneity was identified when studies were pooled, Figure 5. Two trials (N = 3037) comparing everolimus stents with BMS reported cardiac death up to 24 months; one RCT at low risk of bias was in patients with STEMI (EXAMINATION N = 1498)102 and one RCT at moderately low risk of bias in patients requiring stent diameter of ≥ 3 mm (BASEKT PROVE, N = 1539).60 Cardiac death risk for both stent types was similar (DES 2.7%, BMS 3.3%) up to 24 months across the two trials, (pooled estimates RD -1% (-2.0% to 0.0%), RR 0.8 (0.48, 1.34) (Figure 6). Cardiac death risk was also similar in one trial at 6 months (N=800; DES 2.3% vs. BMS 3.2%; RD -0.9%, 95% CI -3.3% to 1.3%)30 and in another trial reporting mean follow-up to 60 months (N=1498, RD -0.5%, 95% CI -2.6% to 1.6%), for DES (3.1%) and BMS (3.6%). When periprocedural events (<30 days) were excluded, there were no differences between stent types at 1 to 6 months (RD -0.7% , 95% CI -2.7% to 1.3%) or 1 to 12 months (RD -1.2% (-3.7% to 1.3%) in the XIMA trial in octogenarians.30 Similarly in a trial of patients with STEMI (EXAMINATION), there were no differences at from 1 to 12 months (RD 0.8%, 95% CI -0.4% to 2.0%)103 or from 1-24 months (RD 0.4%, 95% CI -1.0% to1.8%)102 (Table 31) Cardiac death during the peri-procedural time period (<30 days) is described under safety.

WA - Health Technology Assessment December 11, 2015
Cardiac Stents – Re-Review: Final Evidence Report Page 140
Figure 5. Comparison of newer-generation DES with BMS for cardiac death at 12 months*
BMS: bare metal stents; CI: confidence interval; DES: drug-eluting stents.
* Trials enrolling special populations: EXAMINATION, STEMI patients; XIMA, octogenarians; ZEUS, patients that whose candidacy for DES is uncertain based on bleeding risk.
Figure 6. Comparison of newer-generation DES with BMS for cardiac death at 24 months*
BMS: bare metal stents; CI: confidence interval; DES: drug-eluting stents.
* Trials enrolling special populations: BASKET-PROVE, patients with large vessels, requiring >3 mm diameter stents; EXAMINATION, STEMI patients.

WA - Health Technology Assessment December 11, 2015
Cardiac Stents – Re-Review: Final Evidence Report Page 141
Table 31. Summary of results for comparison of DES with BMS: All-cause and cardiac mortality data not included in the meta-analysis
All-cause mortality % (n/N)
Time Point RCT* DES BMS Risk Difference (95% CI)
Risk Ratio (95% CI)
p-value
All-cause mortality - Cumulative
6 months XIMA 4.8% (19/399)
4.0% (16/401)
0.8% (–2.1% to 3.6%) 1.2 (0.6 to 2.3) 0.59
60 months ENDEAVOR II 6.2% (36/577)
7.6% (44/582)
–1.3% (–4.2% to 1.6%) 0.8 (0.5 to 1.3) 0.38
All-cause mortality - Excluding events ≤30 days
6 months XIMA 3.3% (13/399)
2.7% (11/401)
0.5% (–1.9% to 2.9%) 1.2 (0.5 to 2.6) 0.67
12 months
XIMA 7.0% (28/399)
6.0% (24/401)
1.0% (–2.4% to 4.5%) 1.2 (0.7 to 2.0) 0.55
EXAMINATION 2.0% (15/751)
1.6% (12/747)
0.4% (–1.0% to 1.7%) 1.2 (0.6 to 2.6) 0.57
24 months EXAMINATION 2.8% (21/751)
3.1% (23/747)
–0.3% (–2.0% to 1.4%) 0.9 (0.5 to 1.6) 0.75
Cardiac mortality - Cumulative
6 months XIMA 2.3% (9/399) 3.2% (13/401)
–0.9% (–3.3% to 1.3%) 0.7 (0.3 to 1.6) 0.39
60 months ENDEAVOR II 3.1% (18/577)
3.6% (21/582)
–0.5% (–2.6% to 1.6%) 0.9 (0.5 to 1.6) 0.64
Cardiac mortality - Excluding events ≤30 days
6 months XIMA 1.8% (7/399) 2.5% (10/401)
–0.7% (–2.7% to 1.3%) 0.7 (0.3 to 1.8) 0.47
12 months
XIMA 2.8% (11/399)
4.0% (16/401)
–1.2% (–3.7% to 1.3%) 0.7 (0.3 to 1.5) 0.33
EXAMINATION 1.7% (13/751)
0.9% (7/747)
0.8% (–0.4% to 2.0%) 1.8 (0.7 to 4.6) 0.18
24 months EXAMINATION 2.3% (17/751)
1.9% (14/747)
0.4% (–1.0% to 1.8%) 1.2 (0.6 to 2.4) 0.60
BMS = bare metal stent; CI = confidence interval; DES = drug-eluting stent; RCT = randomized controlled trial.
*These trials are in special populations: XIMA, octogenarians; EXAMINATION, STEMI patients.
Two post-hoc subgroup analyses of the EXAMINATION trial in patients with STEMI and one subgroup analysis of the BASKET-PROVE trial in a general population were includes. No significant differences were found in the incidence of cardiac mortality at 12 months between treatment groups for patients age ≥75 years (n=245) and age <75 years (n=1253) in one study55 or for those with proximal (n=290) and non-proximal (n=1208) LAD disease in the other.45 Statistical tests for interaction for these factors were not significant (See KQ 2c on differential effectiveness). (Appendix Table X) However, compared with

WA - Health Technology Assessment December 11, 2015
Cardiac Stents – Re-Review: Final Evidence Report Page 142
age <75 years, older age (age ≥75 years) was associated with a significantly increased risk of death from cardiac causes: 12.7% versus 1.1% regardless of treatment group. Proximal LAD versus non-proximal LAD disease was not was not associated with increased risk of death. The third study evaluated DES and BMS in those patients with non-ST-segment elevation acute coronary syndrome only (n=510) from the BASKET-PROVE trial and found no difference between treatment groups in the risk of cardiovascular death through 24 months (1.1% vs. 2.0%, respectively; p=0.43).93 Myocardial infarction (primary outcome) Summary Overall, MI definitions and time frames for reporting varied across five trials limiting the ability to pool data. Across three trials (N = 3904)30,103,130 that provided data for “any” MI up to 12 months, cumulative risk of MI was less when DES were employed compared with BMS, however the observed association was within the limits of chance given no true difference in risk, Figure 7 There was inconsistency when the trials were considered individually, the trial in octogenarians (XIMA)30 and a trial in candidates of uncertain DES eligibility (ZEUS)130 reported statistically significant differences favoring DES while the trial in patients with STEMI (EXAMINATION) did not .103 With the exception of one trial in octogenarians (XIMA) that reported cumulative MI (any) risk is less common with DES compared with BMS at 6 months, across the other trials (EXAMINATION,102,103 ENDEAVOR II,33,34 BASKET-PROVE60), MI risk was similar between DES and BMS regardless of definition or time frame, population or exclusion of periprocedural (<30 days)events; there were no differences between DES and BMS for target vessel MI, Q-wave MI, non-Q-wave MI or nonfatal MI with risk differences between groups ranging from -1.2% to -0.01% (Table 32). An individual patient data meta-analysis in women only (N =6278)121 suggest that that MI was less common with newer DES (4.8% vs. 7.7%, p=0.03), based on unadjusted Kaplan Meier estimates, however, adjusted effect size estimates were not reported and there were substantial baseline differences between treatment groups. Detailed analysis Myocardial infarction was reported by five trials (XIMA, EXAMINATION, ENDEAVOR II, BASKET-PROVE, ZEUS),30,34,60,103,130 but definitions and time frames for reporting varied, limiting the ability to pool data. In general, trials did not distinguish between fatal and non-fatal MI or between Q-wave and non-Q wave MI. Myocardial infarction during the peri-procedural time period (<30 days) is described under safety. Three trials provided data for “any” MI up to 12 months and were pooled (EXAMINATION, XIMA, ZEUS).30,103,130 Of the three trials, one at moderately low risk of bias was in octogenarians (XIMA),30 one at moderately low risk of bias was in patients with STEMI (EXAMINATION)103 and the third was in patients who may be uncertain candidates for DES based on concerns for bleeding risk (ZEUS).130 Everolimus stents were used in two trials (EXAMINATION, XIMA) and zotarolimus in the third (ZEUS). Cumulative risk of MI was less when DES were employed (2.6%, 50/1952) compared with BMS (5.9%, 115/1952). Across the three trials (N = 3904) the pooled was RD -3.3% (95% CI -7.2% to 0.6%) however the observed association was within the limits of chance given no true difference in risk (Figure 7). There was evidence of heterogeneity (I2 =90%) possibly due to differences in the individual study populations. The pooled RR across the three trials was 0.44, 95% CI, 0.32 to 0.61. Considering the studies individually, the trial in octogenarians (XIMA) and the trial in candidates of uncertain DES eligibility (ZEUS) reported statistically significant differences favoring DES while the trial in patients with STEMI (EXAMINATION) did not.

WA - Health Technology Assessment December 11, 2015
Cardiac Stents – Re-Review: Final Evidence Report Page 143
One trial in octogenarians (XIMA) reported that cumulative MI (any) risk is less common with DES compared with BMS at 6 months (RD -4.2%, 95% CI -7.4% to 1.0%) and that the effect persisted following removal of periprocedural (<30day) events30 (Table 32). The confidence intervals for effect estimates are wide, suggesting lack of precision in the estimates. There was no control for baseline imbalances between DES and BMS recipients with regard to history of prior MI (more common in DES recipients) or placement of longer stents in DES recipients, potentially biasing results. Across other trials (EXAMINATION, ENDEAVOR II, BASKET-PROVE) MI risk was similar between DES and BMS regardless of definition or time frame, population, or exclusion of periprocedural (<30 days) events. (Table 32)
Target vessel MI risk was similar between DES and BMS recipients up to 12 months across 2 trials at low risk of bias (RDs: EXAMINATION -0.9 % (95% CI -2.2% to 0.3%) and ENDEAVOR II -1.2% (95% CI -3.2% to 0.9%)34,103 and remained similar following exclusion of periprocedural (≤30days) events in one trial (EXAMINATION), RD -0.4% (-1.2% to 0.4%).103 Similarly, no differences were observed at 24 months in the EXAMINATION trial102 for cumulative events (RD –0.7%, 95% CI –2.0% to 0.7%) or following exclusion of periprocedural events (RD–0.1%, 95% CI –1.1% to 0.8%) or in the ENDEAVOR II trial at 60 months.34
Q-wave MI was similar between DES and BMS groups at 12 months (RD –0.4%, 95%CI –1.2% to 0.4%)103 and 24 months (RD –0.1% 95% CI –1.1% to 0.8%)102 in one trial at low risk of bias (EXAMINATION).
Non-Q-wave MI was similar between DES and BMS groups at 12 months (RD –0.5%, 95% CI –1.4% to 0.3%)103 and 24 months (RD –0.9%, 95%CI–1.9% to 0.2%)102 in one trial at low risk of bias (EXAMINATION).
Nonfatal MI was reported in two trials; there were no differences between DES and BMS groups at 24 months in a trial at moderately low risk of bias in patients with larger vessels requiring >3 mm stents (BASKET-PROVE),60 RD –0.9% 95% CI –2.4% to 0.5%, or at 48 months in another trial (ENDEAVOR II)33 at low risk of bias, RD –1.2%, 95% CI –3.4% to 1.0%.
Two post-hoc subgroup analyses of the EXAMINATION trial in patients with STEMI were included.45,55 No significant differences were found in the incidence of any myocardial infarction at 12 months between treatment groups for patients age ≥75 years (n=245) and age <75 years (n=1253) in one study55 or for those with proximal (n=290) and non-proximal (n=1208) LAD disease in the other.45 Statistical tests for interaction for these factors were not significant (See KQ 2c on differential effectiveness) (Appendix G). No difference was seen in the risk of MI based comparing those <75 years old with those ≥75 years) or when comparing the presence or absence of proximal LAD disease. A third study, a subgroup analysis of the BASKET-PROVE trial, evaluated DES and BMS in those patients with non-ST-segment elevation acute coronary syndrome only (n=510) and found no difference between treatment groups in the risk of nonfatal MI through 24 months (1.1% vs. 3.7%, respectively; p=0.08).93 An individual patient data meta-analysis in women only (N =6278)121 suggest that that cumulative risk of MI was less common with newer DES (4.8% vs. 7.7%, p= 0.03), based on unadjusted Kaplan Meier estimates; adjusted effect size estimates were not reported for this outcome. This analysis was considered to be at high risk of bias as there were significant differences between treatment groups with regard to patient risk factors and clinical history, and methods of study selection and handling of missing data were not clear.

WA - Health Technology Assessment December 11, 2015
Cardiac Stents – Re-Review: Final Evidence Report Page 144
Figure 7. Comparison of newer-generation DES with BMS for any myocardial infarction, cumulative to 12 months*
BMS: bare metal stents; CI: confidence interval; DES: drug-eluting stents.
*Trials enrolling special populations: XIMA, octogenarians; EXAMINATION, STEMI patients; ZEUS, patients that whose candidacy for DES is uncertain based on bleeding risk.
Table 32. Summary of results for comparison of DES with BMS: Myocardial infarction data not included in the meta-analysis
Time Point RCT* DES BMS Risk Difference (95% CI)
Risk Ratio (95% CI)
p-value
Any MI - Cumulative
6 months XIMA 3.5% (14/399)
7.7% (31/401)
–4.2% (–7.4% to –1.0%) 0.5 (0.2 to 0.8) 0.01
24 months EXAMINATION 1.9% (14/751)
2.4% (18/747)
–0.6% (–2.0% to 0.9%) 0.8 (0.4 to 1.5) 0.47
Any MI - Excluding events ≤30 days
6 months XIMA 1.0% (4/399)
4.2% (17/401)
–3.2% (–5.4% to –1.0%) 0.2 (0.08 to 0.7) 0.004
12 months
XIMA 1.8% (7/399)
5.2% (21/401)
–3.5% (–6.0% to –1.0%) 0.3 (0.1 to 0.8) 0.007
EXAMINATION 0.7% (5/751)
0.8% (6/747)
–0.1% (–1.0% to 0.7%) 0.8 (0.3 to 2.7) 0.76
24 months EXAMINATION 1.2% (9/751)
1.2% (9/747)
–0.01% (–1.1% to 1.1%) 1.0 (0.4 to 2.5) 0.99

WA - Health Technology Assessment December 11, 2015
Cardiac Stents – Re-Review: Final Evidence Report Page 145
Time Point RCT* DES BMS Risk Difference (95% CI)
Risk Ratio (95% CI)
p-value
Target vessel MI - Cumulative
12 months
EXAMINATION 1.1% (8/751)
2.0% (15/747)
–0.9% (–2.2% to 0.3%) 0.5 (0.2 to 1.2) 0.14
ENDEAVOR II 2.7% (16/590)
3.9% (23/590)
–1.2% (–3.2% to 0.9%) 0.7 (0.4 to 1.3) 0.25
24 months EXAMINATION 1.5% (11/751)
2.1% (16/747)
–0.7% (–2.0% to 0.7%) 0.7 (0.3 to 1.5) 0.32
60 months ENDEAVOR II 3.8% (22/577)
4.8% (28/582)
–1.0% (–3.3% to 1.3%) 0.8 (0.5 to 1.4) 0.40
Target vessel MI - Excluding events ≤30 days
12 months EXAMINATION 0.4% (3/751)
0.8% (6/747)
–0.4% (–1.2% to 0.4%) 0.5 (0.1 to 2.0) 0.31
24 months EXAMINATION 0.8% (6/751)
0.9% (7/747)
–0.1% (–1.1% to 0.8%) 0.9 (0.3 to 2.5) 0.77
Q-wave MI – Cumulative
12 months ENDEAVOR II 0.3% (2/590)†
0.8% (5/590)†
–0.5% (–1.4% to 0.3%) 0.4 (0.8 to 2.1) 0.26
60 months ENDEAVOR II 0.3% (2/577)†
1.2% (7/582)†
–0.9% (–1.9% to 0.2%) 0.3 (0.1 to 1.4) 0.10
Non-Q-wave MI - Cumulative
12 months ENDEAVOR II 2.4% (14/590)†
3.1% (18/590)†
–0.7% (–2.5% to 1.2%) 0.8 (0.4 to 1.5) 0.47
60 months ENDEAVOR II 3.5% (20/577)†
3.6% (21/582)†
–0.1% (–2.3% to 2.0%) 1.0 (0.5 to 1.8) 0.90
Nonfatal MI – Cumulative
24 months BASKET-PROVE 1.7% (13/774)
2.6% (20/765)
–0.9% (–2.4% to 0.5%) 0.6 (0.3 to 1.3) 0.21
48 months ENDEAVOR II 3.3% (19/583)†
4.5% (26/584)†
–1.2% (–3.4% to 1.0%) 0.7 (0.4 to 1.3) 0.29
BMS = bare metal stent; CI = confidence interval; DES = drug-eluting stent; MI = myocardial infarction; RCT = randomized controlled trial.
*These trials are in special populations: XIMA, octogenarians; EXAMINATION, STEMI patients; BASKET-PROVE, large vessels, >3 mm).
†All target vessel MIs.
Composite of Death or MI
Composite outcomes were not considered primary outcomes for the reasons given in the Methods section and strength of evidence was not be evaluated for these. A summary of the composite of death or MI is provided here for completeness, as two trials at moderately low risk of bias (PRODIGY, BASKET-PROVE) did not report hard clinical outcomes (mortality, MI) separately. No differences between treatments for the composite of all-cause mortality or MI were seen at either 12 or 24 months in the PRODIGY trial (N=1498). The risk of cardiac death or MI was lower in the DES group at 6 months in the BASKET-PROVE trial (N = 1539) but this was not sustained to 24 months, Table 33. Data for the

WA - Health Technology Assessment December 11, 2015
Cardiac Stents – Re-Review: Final Evidence Report Page 146
individual outcomes of death and MI are reported for ZEUS and ENDEAVOR II are discussed above. In an individual patient data meta-analysis in women only (N =6278)121 analyses adjusted for difference in baseline factors, the composite of death or MI was less common (HR 0.70, 95% CI 0.51 to 0.97) at three years.
Table 33. Cumulative incidence of the composite outcome of death or MI from randomized controlled trials
Time Point RCT* DES BMS Risk Difference (95% CI)
Risk Ratio (95% CI)
p-value
All-cause death or MI
12 month
PRODIGY 14.3% (143/1000)
16.9% (84/498)
–2.6% (–6.5% to 1.4%) 0.8 (0.7 to 1.1) 0.19
ZEUS 13.1% (105/802)
17.4% (140/804)
–4.3% (–7.8% to –0.8%) 0.8 (0.6 to 0.9) 0.02
24 months PRODIGY 17.0% (170/1000)
20.1% (100/498)
–3.1% (–7.3% to 1.1%) 0.8 (0.7 to 1.1) 0.14
48 months ENDEAVOR II 7.9% (46/583)
9.1% (53/584)
–1.2% (–4.4% to 2.0%) 0.9 (0.6 to 1.3) 0.47
Cardiac death or MI
6 months BASKET-PROVE 1.3% (10/774)
2.7% (21/765)
–1.5% (–2.9% to –0.01%) 0.5 (0.2 to 1.0) 0.04
12 months ZEUS 9.7% (78/802)
14.6% (117/804)
–4.8% (–8.0% to –1.6%) 0.7 (0.5 to 0.9) 0.003
24 months BASKET-PROVE 3.2% (25/774)
4.8% (37/765)
–1.6% (–3.6% to 0.4%) 0.7 (0.4 to 1.1) 0.12
BMS = bare metal stent; CI = confidence interval; DES = drug-eluting stent; MI = myocardial infarction; RCT = randomized controlled trial.
*These trials are in special populations: ZEUS, patients whose candidacy for DES is uncertain based on bleeding risk; BASKET-PROVE = large vessels, >3 mm).
One trial, conducted in patients whose candidacy for DES was uncertain due to concerns regarding bleeding risk, performed subgroup analysis of the three major trial inclusion criteria on the composite outcome of death or MI following DES and BMS.130 Patients with a high bleeding risk (n=828), low thrombotic risk (n=1321), and low restenosis risk (n=941) all had a significantly lower risk of death or MI at 12 months when treated with DES compared with BMS, respectively: HR 0.71 (95% CI, 0.53 to 0.96), HR 0.66 (95% CI, 0.49 to 0.88), and HR 0.62 (95% CI, 0.41 to 0.92). A second study evaluated the risk of cardiac death or MI following DES versus BMS in those patients with non-ST-segment elevation acute coronary syndrome only (n=510) from the BASKET-PROVE trial,93 with no difference between treatment groups found through 24 months after adjusting for sex, diabetes, and number of stents placed (2.3% vs. 4.9%, respectively; p=0.25). Statistical tests for interaction were not significant. (See section for KQ2 on differential effectiveness). Patient-reported outcomes (primary outcome) None of the included studies provided data on patient-reported outcomes.

WA - Health Technology Assessment December 11, 2015
Cardiac Stents – Re-Review: Final Evidence Report Page 147
Revascularization (intermediate, secondary outcome) Summary Both target lesion revascularization (TLR) and target vessel revascularization (TVR) were significantly less common with DES versus BMS at 12 months across RCTs.30,34,103,130,132 At 24 months, while revascularization was also less common with DES, the observed associations in RCTs were within the limits of chance given no true difference in risk.60,102,132 In an individual patient data meta-analysis in women only (N =6278)121 analyses adjusted for difference in baseline factors, target-lesion revascularization was significantly less common at three years in newer-generation DES recipients compared with those receiving BMS. Both TLR and TVR were considered secondary, intermediate outcomes. The extent to which TLR or TVR may have been clinically driven was not clear in most trials or in the meta-analysis. Detailed analysis Target lesion revascularization (TLR) and target vessel revascularization (TVR) were considered secondary, intermediate outcomes. Only two trials explicitly stated that revascularization was clinically driven and a third stated that any follow-up angiography would be clinically driven.60,103 For the other trials, it is unclear to what extent additional angiography and/or revascularization was clinically driven and what impact this may have on frequency of revascularization. TLR was reported in three trials at 12 months, two at low risk of bias (EXAMINATION, ENDEAVOR II) and one at moderately low risk of bias (ZEUS). EXAMINATION was among patients with STEMI and ZEUS focused on those whose candidacy for DES was uncertain due to concerns regarding bleeding risk. Everolimus stents were used on one trial and zotarolimus were used in two. At 12 months, across three trials (n = 4284),34,103,130 significantly fewer DES recipients required revascularization 4.3% (93/2143) compared with BMS recipients 9.2% (198/2141); pooled RD -4.8% (95% CI -7.4% to -2.1%, I2 = 68%, RR 0.47 (95% CI 0.37 to 0 .60, I2 = 0%), N = 4284) (Figure 8). Differences in patient populations may partially explain the statistical heterogeneity; EXAMINATION enrolled patients with STEMI, ZEUS enrolled those of uncertain eligibility for DES and ENDEAVOR II enrolled a mixed population of patients presenting with stable and unstable CAD. Only two trials (EXAMINATION, PRODIGY) provided data for 24 months (N = 2996).102,132 The PRODIGY TRIAL had separate everolimus and zotarolimus arms which were combined for analysis. EXAMINATION was considered at low risk of bias, PRODIGY at moderately low risk of bias. TLR was less common in DES recipients 6.1% (106/1751) versus BMS recipients 10.2% (127/1245), however the risk difference was not statistically significant (pooled RD -5.5%, 95% CI -12.2% to 1.2%, I2 = 90%, pooled RR 0.5, 95% CI 0.39, 0.64) (Figure 9). Differences in patient populations may partially explain the observed heterogeneity; EXAMINATION enrolled patients with STEMI, while PRODIGY was comprised of those presenting with both stable and unstable CAD. For pooled analysis the everolimus and zotarolimus arms of the PRODIGY trial were combined. Effect sizes for each DES versus BMS from this trial were as follows: everolimus versus BMS, RD -11.9% (95% CI -15.7% to -8.0%); zotarolimus versus BMS RD -5.5%, (95% CI -9.8% to - 1.1%). Two post-hoc subgroup analyses of age and proximal LAD disease from the EXAMINATION trial in patients with STEMI were included.45,55 At 12 months, one study found that younger patients (age <75 years; n=1253) who received DES had a significantly lower risk of TLR than those who received BMS (2.0% vs. 5.4%) whereas the risk in older patients (age ≥75 years; n=245) was similar between treatment

WA - Health Technology Assessment December 11, 2015
Cardiac Stents – Re-Review: Final Evidence Report Page 148
groups (DES 2.7%, BMS 3.0%).55 In the second study, compared with BMS, DES was associated with a significantly lower risk of TLR in patients both with (n=290) and without (n=1208) proximal LAD disease: 1.3% versus 6.8%.45 Statistical tests for interaction for these factors were not significant (See KQ 2c on differential effectiveness) (Appendix G). Overall, ignoring treatment group, no difference was seen in the risk of TLR comparing younger vs. older patients or for the presence or absence of proximal LAD disease. In an individual patient data meta-analysis in women only (N =6278),121 analyses adjusted for difference in baseline factors, target-lesion revascularization was significantly less common (HR 0.44, 95% CI 0.313 to 0.64) in newer-generation DES recipients compared with those receiving BMS at three years. This analysis was considered to be at high risk of bias. Target vessel revascularization (TVR) was also less common with use of DES compared with BMS across five trials, two of which were at low risk of bias (EXAMINATION, ENDEAVOR II)34,103 and three considered to be at moderately low risk of bias (XIMA, PRODIGY, ZEUS).30,130,132 At 12 months across 5 RCTs (N = 6582), the pooled RD was -5.1% (95% CI -6.6% to -3.5%, I2 = 31%) and pooled RR 0.51 (95% CI 0.43, 0.61, I2 = 0%) (Figure 10). Everolimus DES were used in two trials (XIMA, EXAMINATION), zotarolimus DES were used in two trials (ENDEAVOR II, ZEUS) and both were used in one trial (PRODIGY). Despite clinical differences in study populations, effect estimates were fairly consistent across studies. At 24 months, across 3 trials (N = 4535), one at low risk of bias (EXAMINATION)102 and two of which were considered at moderately low risk of bias (BASKET-PROVE, PRODIGY).60,132 Everolimus stents were used in two trials (EXAMINATION, BASKET-PROVE) and the third trial used both everolimus and zotarolimus. Although TVR was less common among DES (5.3%, 133/2525) recipients compared with BMS recipients (7.0%, 141/2010), the observed associations was within the limits of chance given no true difference in risk, pooled RD -3.1%, 95% CI -7.8% to 1.5% I2 = 92%, pooled RR 0.65 (0.41, 1.0, I2 = 62%) (Figure 11). The source of heterogeneity is not clear.

WA - Health Technology Assessment December 11, 2015
Cardiac Stents – Re-Review: Final Evidence Report Page 149
Figure 8. Comparison of newer-generation DES with BMS for target lesion revascularization cumulative to 12 months*
BMS: bare metal stents; CI: confidence interval; DES: drug-eluting stents.
*Trials enrolling special populations: EXAMINATION, STEMI patients; ZEUS in uncertain DES candidates;
Figure 9. Comparison of newer-generation DES with BMS for target lesion revascularization cumulative to 24 months*
BMS: bare metal stents; CI: confidence interval; DES: drug-eluting stents.
*Trials enrolling special populations: EXAMINATION, STEMI patients.

WA - Health Technology Assessment December 11, 2015
Cardiac Stents – Re-Review: Final Evidence Report Page 150
Figure 10. Comparison of newer-generation DES with BMS for target vessel revascularization cumulative to 12 months
BMS: bare metal stents; CI: confidence interval; DES: drug-eluting stents.
*Trials enrolling special populations: XIMA, octogenarians; ZEUS in uncertain DES candidates; EXAMINATION, STEMI patients.
Figure 11. Comparison of newer-generation DES with BMS for target vessel revascularization cumulative to 24 months
BMS: bare metal stents; CI: confidence interval; DES: drug-eluting stents.
*Trials enrolling special populations: BASKET-PROVE, patients with large vessels, requiring >3 mm diameter stents; EXAMINATION, STEMI patients
4.2.3. Safety
Definite stent thrombosis
Summary The timing of ARC-defined definite stent thrombosis was variably reported across five RCTs.30,32,60,103,130 Overall, pooled estimates from RCTs for ARC-defined definite stent thrombosis at any time frame were within the limits of chance given no true difference in risk. There is likely insufficient power to detect differences between newer generation DES and BMS for this rare event in randomized controlled trials. Data from registry studies, which had larger samples sizes but were at moderately high to high risk of bias reported similar risks of definite stent thrombosis ≤ 30 days in patients with STEMI for DES and BMS. Effect sizes and significance tests were not consistently reported in the registry studies, however some report that definite stent thrombosis may be less common with the newer generation DES compared with BMS at 12 months in patients with STEMI and 24 months in a general population. An individual patient data meta-analysis in women only (N = 6278)121 also reported similar risk of definite
WA - Health Technology Assessment December 11, 2015
Cardiac Stents – Re-Review: Final Evidence Report Page 151
stent within the first year for newer DES and BMS recipients (0.5% vs. 0.6%); while authors report statistical significance, p=0.007, clinical significance is unclear. Few additional events occurred between years 1 and 3 but the estimated incidence was higher in those receiving BMS (Kaplan Meier cumulative incidence 0.07% for DES, 0.3% for BMS, p = 0.002); adjusted effect size estimates were not reported. This analysis was considered to be at high risk of bias as there were significant differences between treatment groups with regard to patient risk factors and clinical history, and methods of study selection and handling of missing data were not clear. Detailed analysis The timing of ARC-defined definite stent thrombosis was variably reported across five RCTs.30,32,60,103,130 Four registry studies also provided information on this outcome.41,94,105,106 Three trials (XMAN, EXAMINATION, XIMA), all of which employed everolimus DES, reported early definite stent thrombosis (≤30 days). One was at moderately low risk of bias was in octogenarians (XIMA, N = 800),30 one at low risk of bias in persons with STEMI (EXAMINATION, N = 1498),103 one pilot trial at moderately low risk of bias in a mixed population (i.e. stable and unstable presentation) (XMAN, N = 152).32 Across the three trials (N =2450), definite stent thrombosis was rare within the first month and it is likely that there is insufficient power to detect differences between DES and BMS for this outcome. Definite stent thrombosis occurred within 1 month in 0.4% (5/1226) of DES patients and 1.1% (13/1224) of BMS patients. Pooled estimates of effect were not statistically significant: RD 0% (95% CI -2.0% to 1.0%), I2 = 75% and RR 0.95 (95% CI 0.14 to 6.48, I2 = 0% (Figure 12). Estimates for individual trials were inconsistent, perhaps due to differences in populations. This may contribute to lack of significance for the pooled estimates. The risk of early definite stent thrombosis (≤30 days) was reported by two registry studies,41,106 both in patients with STEMI, and appears to be similar between DES and BMS groups (1.0 % vs. 1.7%, p=0.20, n=1939; 0.5% vs. 0.9%, p=NR, n=29,500 at risk); however, no adjusted effect estimates were reported (Table 34). Both studies were considered at moderately high risk of bias. Two trials (XIMA, EXAMINATION, N = 2298) reported definite stent thrombosis from 1 to 12 months post-intervention.30,103 This outcome was rare (0.2% in both groups) and it is likely that there is insufficient power to detect differences between DES and BMS in these trials. (Figure 12).

WA - Health Technology Assessment December 11, 2015
Cardiac Stents – Re-Review: Final Evidence Report Page 152
Figure 12. Comparison of newer-generation DES with BMS for definite stent thrombosis from RCTs: ≤ 30 days and from 1-12 months*
BMS: bare metal stents; CI: confidence interval; DES: drug-eluting stents.
*Trials enrolling special populations: EXAMINATION, STEMI patients; XIMA, octogenarians.
The cumulative incidence of definite stent thrombosis up to 12 months was reported in two trials, (N = 1306), one in a population of octogenarians (XIMA),30 the other was in persons whose candidacy for DES was uncertain due to bleeding risk concerns (ZEUS).130 Both were at moderately low risk of bias. Effect estimates for these trials were in opposite directions, but each individually was within the limits of chance given no true difference in risk as was the pooled estimate (RD 0%, 95% CI -2.0% to 2.0%, I2 = 88%; RR 0.95, 95% CI 0.1 to 8.79), Figure 13. Inconsistency in effect estimates may be due to clinical differences in these populations and/or differences in stents used. The cumulative risk of definite stent thrombosis up to 24 months was reported in two trials, (N = 3037), both of which employed everolimus stents; one at moderately low risk of bias was evaluated patients requiring >3mm diameter stents (BASKET-PROVE),60 the other was at low risk of bias and enrolled patients with STEMI (EXAMINATION).102 Effect estimates for each trial were within the limits of chance given no true difference in risk as was the pooled risk difference estimate, RD -1.0%, 95% CI -2.0% to 0% I2 = 39%, RR 0.36 (95% CI 0.16 to 0.81 I2 = 0%)

WA - Health Technology Assessment December 11, 2015
Cardiac Stents – Re-Review: Final Evidence Report Page 153
Figure 13. Comparison of newer-generation DES with BMS for definite stent thrombosis from RCTs: Cumulative to 12 months and to 24 months*
BMS: bare metal stents; CI: confidence interval; DES: drug-eluting stents.
*Trials enrolling special populations: XIMA, octogenarians; ZEUS, patients that whose candidacy for DES is uncertain based on bleeding risk; BASKET-PROVE, patients with large vessels, requiring >3 mm diameter stents; EXAMINATION, STEMI patients.
An individual patient data meta-analysis in women only (N = 6278)121 also reported similar risk of ARC-defined definite stent thrombosis for newer DES and BMS recipients (0.5% vs. 0.6%) within the first year; analysis adjusting for baseline differences was not reported. While authors report that the result reached statistical significance (p =0.007) it is not clear if it is clinically significant. Most definite stent thrombosis occurred within the first year with few additional events between years 1 and 3 but the estimated incidence was higher in those receiving BMS (Kaplan Meier cumulative incidence 0.07% for DES, 0.3% for BMS, p=0.002; adjusted effect size estimates were not reported. This analysis was considered to be at high risk of bias as there were significant differences between treatment groups with regard to patient risk factors and clinical history, and methods of study selection and handling of missing data were not clear. Four registry-based studies reported adjusted risk estimates of definite stent thrombosis for patients who received newer generation DES compared with BMS (Table 34). Two of the studies used data from the same registry (SCAAR) and were considered to be at moderately high risk of bias, one analyzing all included registry patients (stable and unstable presentation)105 and the other analyzing patients with STEMI only.106 One study based on the KAMIR registry94 was considered at high risk of bias and another based on individual hospital registries was considered at moderately high risk of bias.41

WA - Health Technology Assessment December 11, 2015
Cardiac Stents – Re-Review: Final Evidence Report Page 154
The cumulative risk of definite stent thrombosis up to 12 months was significantly lower in patients treated with DES versus BMS as reported by two studies, both in patients with STEMI: 0.9% vs. 3.8% (adjusted HR 0.19, 95%CI 0.04 to 0.93; p=0.04) (all octogenarians, n=509)94 and 0.9% vs. 1.5% (adjusted HR 0.65, 95% CI 0.43 to 0.99; p=0.04) (n=26,459 at risk; from SCAAR subanalysis).106 A third study using data from all patients included in the SCAAR registry also reported a lower risk of definite stent thrombosis up to 12 months (n=52,196 at risk) in DES (0.5%) versus BMS (1.2%) but did not provide an adjusted effect estimate or test for significance.105 The cumulative risk of definite stent thrombosis up to 24 months was reported by two studies and was significantly lower following DES compared with BMS according to data from the SCAAR registry (0.6% vs. 1.4% [n=33,545 at risk]; adjusted HR 0.38, 95% CI 0.28 to 0.52)105; the second study, another registry that included only patients with STEMI (n=1939),41 also reported a lower risk with DES but the difference did not reach statistical significance (1.4% vs. 3.8%; adjusted HR 0.52, 95% CI 0.27 to 1.0; p=0.05). A third study from the SCAAR registry among patients with STEMI only also reported rates of definite stent thrombosis at 24 months and 36 months; however adjusted effect estimates were not provided: DES 1.2% vs. BMS 1.8% (n=22,087 at risk) and DES 1.3% vs. 2.0% (n=17,117 at risk).106 However, the latter study did report the adjusted cumulative risk of definite stent thrombosis from 12 months through 36 months (defined as very late thrombosis) and found no significant difference between treatment groups (adjusted HR 1.52; 95% CI 0.78 to 2.98; p=0.21).
Table 34. Comparison of newer generation DES with BMS from nonrandomized comparative studies: Definite stent thrombosis
Time Point Author (Year) DES* BMS* Effect Estimate (95% CI)
p-value
Definite Stent Thrombosis
30 days
Garg 2014 (STEMI)
1% (7/752) 1.7% (19/1187) NR 0.20
Sarno 2014 (STEMI subgroup)
0.5% (n at risk = 4649)
0.9% (n at risk = 24,851)
NR NR
12 months
Piao 2014 (age ≥80 years with STEMI)
0.9% (3/323) 3.8% (7/186) Adjusted HR 0.19 (0.04 to 0.93)†
0.04
Sarno 2012 0.5% (n at risk = 4188)
1.2% (n at risk = 47,968)
NR NR
Sarno 2014 (STEMI subgroup)
0.9% (n at risk = 4497)
1.5% (n at risk = 21,962)
Adjusted HR 0.65 (0.43 to 0.99)‡
0.04
24 months
Garg 2014 (STEMI)
1.4% (10/752) 3.8% (39/1187) Adjusted HR 0.52 (0.27 to 1.00)§
0.049
Sarno 2012 0.6% (n at risk = 847)
1.4% (n at risk = 32,698)
Adjusted HR 0.38 (0.28 to 0.52)**
NR
Sarno 2014 (STEMI subgroup)
1.2% (n at risk = 2751)
1.8% (n at risk = 19,336)
NR NR
36 months Sarno 2014 (STEMI subgroup)
1.3% (n at risk = 1235)
2.0% (n at risk = 15882)
NR NR
12 months to 36 months (very late ST)
Sarno 2014 (STEMI subgroup)
NR NR Adjusted HR 1.52 (0.78 to 2.98)‡
0.21

WA - Health Technology Assessment December 11, 2015
Cardiac Stents – Re-Review: Final Evidence Report Page 155
BMS bare metal stents; DES = drug-eluting stents; HR = hazard ratio; NR = not reported; OR = odds ratio; ST = stent thrombosis; STEMI = ST-segment elevation myocardial infarction.
* Most studies reported Kaplan-Meier curves therefore the numerators could not be calculated from the percentages given; when applicable, the number at risk at each timepoint is provided for reference.
† Adjusted for sex, diabetes, current smoking, stent diameter, and stent length.
‡ Adjusted for age, sex, diabetes, hypertension, dyslipidemia, smoking status, use of acetylsalicylic acid, glycoprotein IIb/IIIa inhibitors, and/or P2Y12 receptor inhibitors at the index procedure, treated vessel, previous myocardial infarction, previous coronary artery bypass grafting, previous PCI, year of the index procedure, enrolling center, lesion type, bifurcation lesions, and 3-vessel/left main disease.
§ Propensity adjusted outcomes; scores based on backward selection for age, sex, diabetes, hypertension, prior CABG, prior MI, anterior MI, cardiogenic shock, current smoker, and TIMI 2-3 flow on angiography pre-PCI. Reported by the authors as BMS vs. DES, adjusted HR: 1.92 (1.00 to 3.69); for consistency we reported the inverse in order to represent the comparison of DES vs. BMS.
** Adjusted for age, sex diabetes, hypertension, dyslipidaemia, smoking status, clinical indication of the procedure, use of acetyl salicylic acid, GPIIb–IIIa and/or P2Y12 receptor inhibitors at the index procedure, treated vessel, previous myocardial infarction (MI), previous coronary artery bypass grafting (CABG), previous PCI, year of the index procedure, enrolling centre, lesion type, bifurcation lesions, restenotic lesions, chronic total occlusions (CTO), stent type, stent diameter, stent length, three-vessel/left main disease, the use of additional stents, and maximal inflation pressure.
One post-hoc subgroup analysis of proximal versus non-proximal LAD disease from the EXAMINATION trial in patients with STEMI for the outcome of definite stent thrombosis was included.45 Authors reported that patients with non-proximal LAD disease (n=1208) who received DES had a significantly lower risk of definite stent thrombosis through 12 months than those who received BMS (0.7% vs. 2.1%; p=0.03) whereas the risk in patients with proximal LAD (n=290) was not statistically different (DES 0%, BMS 0.8%; p=0.27). The statistical test for interaction for this factors was not significant (See KQ 2c on differential effectiveness). (Appendix Table X)
All-cause mortality (≤30 days)
Across two RCTs (XIMA, EXAMINATION) (N = 2298),30,103 risk of periprocedural (≤30 day) all-cause mortality was in similar in the DES (1.5%, 17/1150) and BMS groups (1.7%, 19/1148); pooled RD -0.15%(95% CI -1.2% to 0.86%), I2 = 0%, pooled RR 0.89 (95% CI 0.46 to 1.71), Figure 14. XIMA enrolled octogenarians and was at moderately low risk of bias and EXAMINATION was in patients with STEMI at was considered at low risk of bias.
Figure 14. Comparison of newer-generation DES with BMS from RCTs: All-cause mortality (≤30 days)*
BMS: bare metal stents; CI: confidence interval; DES: drug-eluting stents.
* Trials enrolling special populations: XIMA, octogenarians; EXAMINATION, STEMI patients.
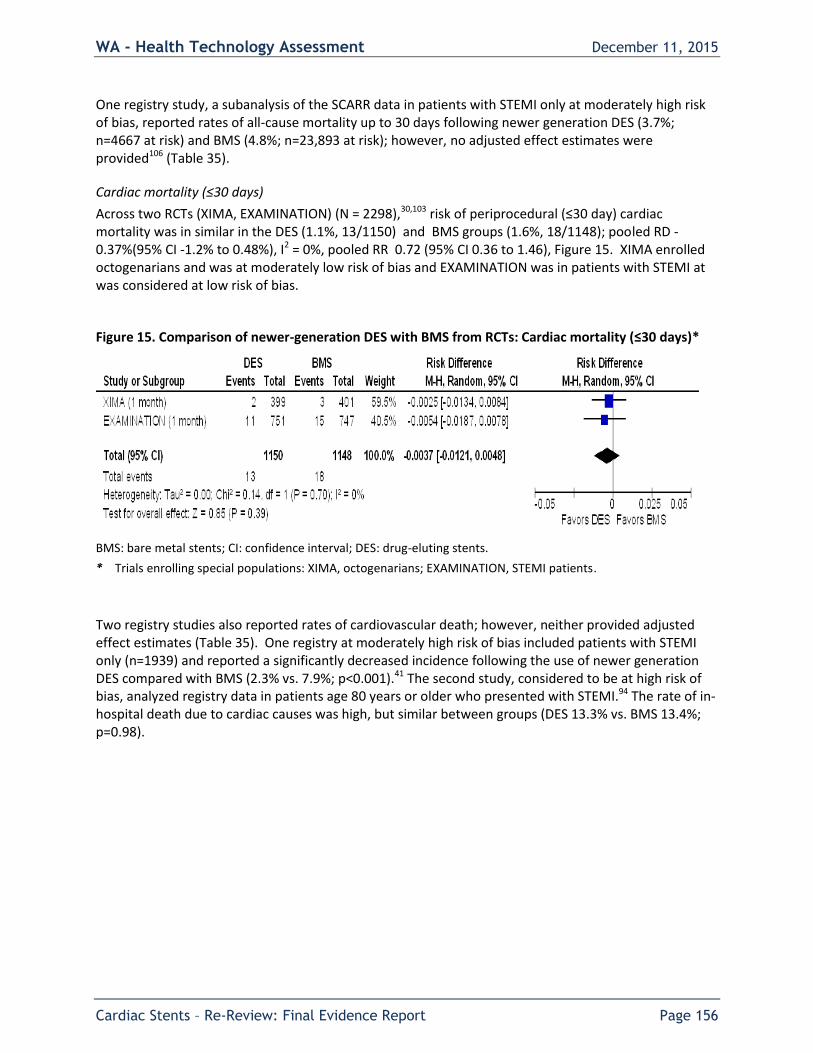
WA - Health Technology Assessment December 11, 2015
Cardiac Stents – Re-Review: Final Evidence Report Page 156
One registry study, a subanalysis of the SCARR data in patients with STEMI only at moderately high risk of bias, reported rates of all-cause mortality up to 30 days following newer generation DES (3.7%; n=4667 at risk) and BMS (4.8%; n=23,893 at risk); however, no adjusted effect estimates were provided106 (Table 35).
Cardiac mortality (≤30 days)
Across two RCTs (XIMA, EXAMINATION) (N = 2298),30,103 risk of periprocedural (≤30 day) cardiac mortality was in similar in the DES (1.1%, 13/1150) and BMS groups (1.6%, 18/1148); pooled RD -0.37%(95% CI -1.2% to 0.48%), I2 = 0%, pooled RR 0.72 (95% CI 0.36 to 1.46), Figure 15. XIMA enrolled octogenarians and was at moderately low risk of bias and EXAMINATION was in patients with STEMI at was considered at low risk of bias.
Figure 15. Comparison of newer-generation DES with BMS from RCTs: Cardiac mortality (≤30 days)*
BMS: bare metal stents; CI: confidence interval; DES: drug-eluting stents.
* Trials enrolling special populations: XIMA, octogenarians; EXAMINATION, STEMI patients.
Two registry studies also reported rates of cardiovascular death; however, neither provided adjusted effect estimates (Table 35). One registry at moderately high risk of bias included patients with STEMI only (n=1939) and reported a significantly decreased incidence following the use of newer generation DES compared with BMS (2.3% vs. 7.9%; p<0.001).41 The second study, considered to be at high risk of bias, analyzed registry data in patients age 80 years or older who presented with STEMI.94 The rate of in-hospital death due to cardiac causes was high, but similar between groups (DES 13.3% vs. BMS 13.4%; p=0.98).

WA - Health Technology Assessment December 11, 2015
Cardiac Stents – Re-Review: Final Evidence Report Page 157
Table 35. Comparison of newer generation DES with BMS from nonrandomized comparative studies: All-cause and cardiac mortality (≤30 days)
Time Point Author (Year) DES BMS Effect Estimate (95% CI)
p-value
All-cause Mortality
≤ 30 days Sarno 2014 (STEMI subgroup)
3.7% (n at risk = 4667)*
4.8% (n at risk = 23,893)*
NR NR
Cardiac Mortality
≤ 30 days Garg 2014 (STEMI)
2.3% (17/752)
7.9% (93/1187)
NR <0.001
In-hospital Piao 2014 (age ≥80 years with STEMI)
13.3% (43/323)
13.4% (25/186)
NR 0.98
BMS = bare metal stents; DES = drug-eluting stents; NR = not reported; STEMI = ST-segment elevation myocardial infarction.
* This study reported Kaplan-Meier curves therefore the numerators could not be calculated from the percentages given; therefore, the number at risk is provided for reference.
MI (≤30 days)
Across two RCTs (XIMA, EXAMINATION) (N = 2298),30,103 risk of periprocedural (≤30 day) MI (any type) was in similar in the DES (1.3%, 15/1150) and BMS groups (2.0 %, 23/1148); pooled RD -0.60% (95% CI -1.5% to 0.30%), I2 = 0%, pooled RR 0.66 (95% CI 0.19, 1.25), Figure 16. XIMA enrolled octogenarians and was at moderately low risk of bias and EXAMINATION was in patients with STEMI at was considered at low risk of bias.
Figure 16. Comparison of newer-generation DES with BMS from RCTs: Myocardial infarction (≤30 days)*
BMS: bare metal stents; CI: confidence interval; DES: drug-eluting stents.
* Trials enrolling special populations: XIMA, octogenarians; EXAMINATION, STEMI patients.
One registry study at moderately high risk of bias reported no difference between DES and BMS groups for re-infarction ≤30 day in patients with STEMI (1.4% versus 2.1%, p = 0.23); effect size was not reported.41

WA - Health Technology Assessment December 11, 2015
Cardiac Stents – Re-Review: Final Evidence Report Page 158
Stroke
Summary
Three RCTS, two at moderately low risk of bias (XIMA, ZEUS)30,130 and one at low risk of bias (ENDEAVOR II),33 reported stroke at various time frames. Stroke was uncommon across studies and time frames (0.8% to 1.7% for DES and 0% to 1.5% for BMS) and individually studies may not have had sufficient power to detect a difference between DES and BMS. There were no differences in stroke incidence (any stroke or ischemic stroke) between newer generation DES and BMS across studies and time frames with the exception of one trial in octogenarians (XIMA) which reported a risk of 1% in DES recipients compared with 0% in BMS recipient, p =-.04) after exclusion of periprocedural stroke. Similarly, no differences between DES and BMS were observed when ischemic stroke was evaluated separately.
Detailed analysis
Three RCTS, two at moderately low risk of bias (XIMA, ZEUS)30,130 and one at low risk of bias (ENDEAVOR II),33 reported stroke at various time frames. Stroke was uncommon across studies and time frames (0.8% to 1.7% for DES and 0% to 1.5% for BMS) and individually studies may not have had sufficient power to detect a difference between DES and BMS (Table 36). One RCT in octogenarians (XIMA) (moderately low risk of bias, N =800) reported cerebral vascular accident (CVA) defined as new neurological deficit lasting >24 h confirmed with appropriate imaging abnormality <30 days.30 During the periprocedural period (≤ 30 days) no patient in the DES group had a CVA, and three patients (0.8%) in the BMS group did (all ischemic CVA/stroke); study sample size was likely too low to detect a difference between groups. The same trial reported no difference in cumulative stroke risk between groups at six months but reported a risk of 1% in DES recipients compared with 0% in BMS recipients, p =0.04) after exclusion of periprocedural stroke; no differences were seen between DES and BMS at 12 months, regardless of exclusion of periprocedural events. Similarly, no differences between DES and BMS were observed at either 6 or 12 months when ischemic and hemorrhagic stroke were evaluated separately or when periprocedural events were excluded from their analysis. Confidence intervals were wide calling estimate stability into question (Table 36). Another trial at moderately low risk of bias in patients whose candidacy for DES was uncertain due to concerns regarding bleeding risk (N = 1606) reported no difference between DES and BMS with regard to cumulative incidence of ischemic stroke at 12 months (1.1% for DES, 1.5% for BMS).130 The third trial (ENDEAVOR II) at low risk of bias (N =1167) enrolled patients presenting with either stable or unstable CAD and reported similar cumulative risk of stroke (any type) up to 48 months; DES 1.7%, BMS 1.5% (RD -1.2% (95% CI -3.4% to 1.0%).33

WA - Health Technology Assessment December 11, 2015
Cardiac Stents – Re-Review: Final Evidence Report Page 159
Table 36. Comparison of newer generation DES with BMS from RCTs: Stroke/cerebrovascular accident
Stroke/CVA, % (n/N)
Time Point RCT* DES BMS Risk Difference (95% CI)
Risk Ratio (95% CI)
p-value
Any Stroke/CVA - Cumulative
≤ 30 days XIMA 0% (0/399) 0.8% (3/401)
–0.8% (NC)
NC 0.08
6 months XIMA 1.0% (4/399)
0.7% (3/401)
0.3% (–1.0% to 1.6%)
1.3 (0.3 to 5.9)
0.70
12 months XIMA 1.5% (6/399)
1.2% (5/401)
0.3% (–1.4% to 1.9%)
1.2 (0.4 to 3.9)
0.76
48 months ENDEAVOR II 1.7% (10/583)
1.5% (9/584)
–1.2% (–3.4% to 1.0%)
0.7 (0.4 to 1.3)
0.29
Any Stroke/CVA - Excluding events ≤30 days
6 months XIMA 1.0% (4/399)
0.0% (0/401)
1.0% (NC)
NC 0.04
12 months XIMA 1.5% (6/399)
0.5% (2/401)
1.0% (–0.4% to 2.4%)
3.0 (0.6 to 14.8)
0.15
Ischemic stroke/CVA - Cumulative
≤ 30 days XIMA 0% (0/399)
0.8% (3/401)
–0.8% (NC)
NC 0.08
6 months XIMA 0.8% (3/399)
0.7% (3/401)
0% (–1.2% to 1.2%)
1.0 (0.2 to 4.9)
1.0
12 months
XIMA 0.8% (3/399)
1.0% (4/401)
–0.3% (–1.5% to 1.0%)
0.8 (0.2 to 3.3)
0.71
ZEUS 1.1% (9/802)
1.5% (12/804)
–0.4% (–1.5% to 0.7%)
0.8 (0.3 to 1.8)
0.51
Ischemic stroke/CVA - Excluding events ≤30 days
6 months XIMA 0.8% (3/399)
0.0% (0/401)
0.8% (NC) NC 0.08
12 months XIMA 0.8% (3/399)
0.2% (1/401)
0.5% (–0.5% to 1.5%) 3.0 (0.3 to 28.9)
0.31
Hemorrhagic stroke/CVA - Cumulative
≤ 30 days XIMA 0% (0/399)
0% (0/401)
0% (NC)
NC N/A
6 months XIMA 0.3% (1/399)
0% (0/401)
0.3% (NC)
NC 0.32
12 months XIMA 0.8% (3/399)
0.2% (1/401)
0.5% (–0.5% to 1.5%)
3.0 (0.3 to 28.9)
0.31
Hemorrhagic stroke/CVA - Excluding events ≤30 days
6 months XIMA 0.3% (1/399)
0% (0/401)
0.3% (NC) NC 0.32
12 months XIMA 0.8% (3/399)
0.2% (1/401)
0.5% (–0.5% to 1.5%)
3.0 (0.3 to 28.9)
0.31

WA - Health Technology Assessment December 11, 2015
Cardiac Stents – Re-Review: Final Evidence Report Page 160
BMS = bare metal stent; CVA = cardiovascular accident; DES = drug-eluting stent; N/A = not applicable; NC = not calculable; RCT = randomized controlled trial.
* These trials are in special populations: XIMA, octogenarians; ZUES, patients that whose candidacy for DES is uncertain based on bleeding risk.
Major Bleeding (any time)
Summary
Four RCTS reported on major bleeding at any time (N = 4054) (XIMA, XMAN, EXAMINATION, ZEUS).30,32,103,130 Across studies and time frames, risk of major bleeding was similar in those receiving DES (0.9%) and those receiving BMS (1.4%), pooled RD -0.44 (95% CI -1.1% to 0.18%)
Detailed analysis
Four RCTS reported on major bleeding at any time (N = 4054). Two (XIMA, XMAN)30,32 at moderately low risk of bias reported events within the periprocedural time (≤ 30 days) and two (one at low risk of bias, the other at moderately low risk of bias) reported events up to 12 months.103,130 Overall, risk of major bleeding was similar between groups across time frames; 0.9% (18/2027) in DES recipients versus 1.4% (28/2027) in BMS recipients, pooled RD -0.44% (95% CI -1.1% to 0.18%), I2 = 0%; pooled RR 0.64, (95% CI 0.36, 1.16), Figure 17. One trial at moderately low risk of bias in patients whose candidacy for DES was uncertain due to concerns regarding bleeding risk (ZEUS, N =1606) reported no difference between DES (3.5%) and BMS (4.4%), with respect to bleeding requiring medical attention RR 0.8 (95% CI 0.5 to 1.3).130 It is unclear from the study methods how this bleeding differs from major or minor bleeding reported by authors.
Figure 17. Comparison of newer-generation DES with BMS from RCTs: Major bleeding (any time)*
BMS: bare metal stents; CI: confidence interval; DES: drug-eluting stents.

WA - Health Technology Assessment December 11, 2015
Cardiac Stents – Re-Review: Final Evidence Report Page 161
* Trials enrolling special populations: EXAMINATION, STEMI patients; ZEUS: patients that whose candidacy for DES is uncertain based on bleeding risk.
Two post-hoc subanalyses of age and proximal LAD disease the EXAMINATION trial data in person with STEMI evaluated bleeding (Appendix Table X). No significant differences were found in the incidence of major and minor bleeding at 12 months between treatment groups for patients age ≥75 years (n=245) versus age <75 years (n=1253) in one study55 or for those with proximal (n=290) versus non-proximal (n=1208) LAD disease in the other.45 Statistical tests for interaction were not statistically significant (See KQ 2c on differential effectiveness). Overall, the risk of bleeding did not differ between the elderly and the non-elderly or the patients with proximal LAD and non-proximal LAD disease. One registry study at high risk of bias analyzing registry data in patients age 80 years or older who presented with STEMI reported the a similar incidence of in-hospital major bleeding events following placement of a newer generation DES (1.2%) compared with a BMS (2.7%), p=0.30; however, however, an adjusted effect estimate was not provided.94 Minor bleeding was reported in four RCTs. No differences between newer generation DES and BMS were seen at ≤ 30 days in two RCTS30,32 or at 12 months in two other RCTs.103,130 (Appendix G has detailed data abstraction).
Revascularization (≤ 30 days)
Revascularization within the periprocedural period were significantly less common with newer-generation DES compared with BMS in one low risk of bias trial of in patients with STEMI103 however there was no difference between groups in another trial among octogenarians that was at moderately low risk of bias,30 Table 37.
Table 37. Comparison of newer generation DES with BMS from RCTs: Target lesion and target vessel revascularization (≤ 30 days)
Event RCT* DES BMS Risk Ratio (95% CI)
p-value
Target lesion revascularization (≤ 30 days)
EXAMINATION 0.5% (4/751) 2.0% (15/747)
0.3 (0.1 to 0.8)
0.01
Target vessel revascularization (≤ 30 days)
EXAMINATION 1.2% (9/751) 3.3% (25/747)
0.4 (0.2 to 0.8)
0.005
XIMA 0.5% (2/399) 0.5% (2/401) 1.0 (0.1 to 7.1)
1.0
BMS: bare metal stents; CI: confidence interval; DES: drug-eluting stents; RCT: randomized controlled trial.
* Trials enrolling special populations: EXAMINATION, STEMI patients; XIMA, octogenarians.
Stent fracture and related adverse outcomes
Stent fracture was reported in the previous (2009) report and is therefore included in this update. Table 38 summarizes structure-related events from five case series of newer-generation DES (everolimus,

WA - Health Technology Assessment December 11, 2015
Cardiac Stents – Re-Review: Final Evidence Report Page 162
zotarolimus) including one study that provided limited data for BMS in addition to DES (detailed results abstraction can be found in Appendix G). Risk of stent fracture in everolimus DES across three case series was 2.9% to 3.8% of patients.56,66,67 Longitudinal stent deformation in zotarolimus-eluting stents was reported by one case series and occurred in 1.4% of all patients and in 1.8% of patients where post dilation was attempted (according to the authors, stent separation can only occur with post-dilation)96; similar risk was seen in one case series of everolimus DES (1.5% of patients).56 In a third case series, the risk of stent deformation following implantation of various DES, as well as BMS, was reported: everolimus DES (0.2%), zotarolimus-eluting stent (<0.01%), and BMS (0%).141 Stent fracture and other mechanical factors were related to restenosis and stent thrombosis.
Table 38. Adverse events related to mechanical factors from included case-series
Author (Year) Follow-up Type of DES Frequency, % (n/N)
Patients Lesions
Stent Fracture (any)
Inaba 2014 Mean 14.7 months Everolimus (NR) 2.9% (4/136) 2.3% (4/177)
Kuramitsu 2012 Median 7.8 months Everolimus (Xience V) 3.8% (39/1035) 2.9% (39/1339)
Kuramitsu 2015 Median 6.3 months Everolimus (Promus Element) 2.6% (18/700) 2.0% (18/898)
Longitudinal Stent Deformation
Inaba 2014 Mean 14.7 months Everolimus (NR) 1.5% (2/136) 1.1% (2/177)
Pitney 2011 6 months Zotarolimus (Endeavor) 1.4% (14/1000) 1.8% (14/775)*
NR
Williams 2012† NR (data collected over a 4 year period)
Everolimus (Xience V, Promus); Zotarolimus (Endeavor, Resolute Integrity)‡
NR 0.2% (7/4585)
Stent Strut Fracture
Inaba 2014 Mean 14.7 months Everolimus (NR) 8.1% (11/136) 6.2% (11/177)
In-stent Restenosis
Kuramitsu 2012 Median 7.8 months Everolimus (Xience V) 8.9% (92/1035) 6.9% (92/1339)
Kuramitsu 2015 Median 6.3 months Everolimus (Promus Element) 13.7% (96/700) 10.7% (96/898)
In-segment Restenosis
Kuramitsu 2012 Median 7.8 months Everolimus (Xience V) 11.3% (117/1035)
8.7% (117/1339)
Kuramitsu 2015 Median 6.3 months Everolimus (Promus Element) 14.9% (104/700) 11.6% (104/898)
Definite Stent Thrombosis (Any)
Kuramitsu 2012 Median 7.8 months Everolimus (Xience V) 0.6% (6/1035) 0.4% (6/1339)
Kuramitsu 2015 Median 6.3 months Everolimus (Promus Element) 0.3% (2/700) 0.2% (2/898)
Definite Stent Thrombosis (Early: 0-30 Days)
Kuramitsu 2012 Median 7.8 months Everolimus (Xience V) 0.3% (3/1035) 0.2% (3/1339)
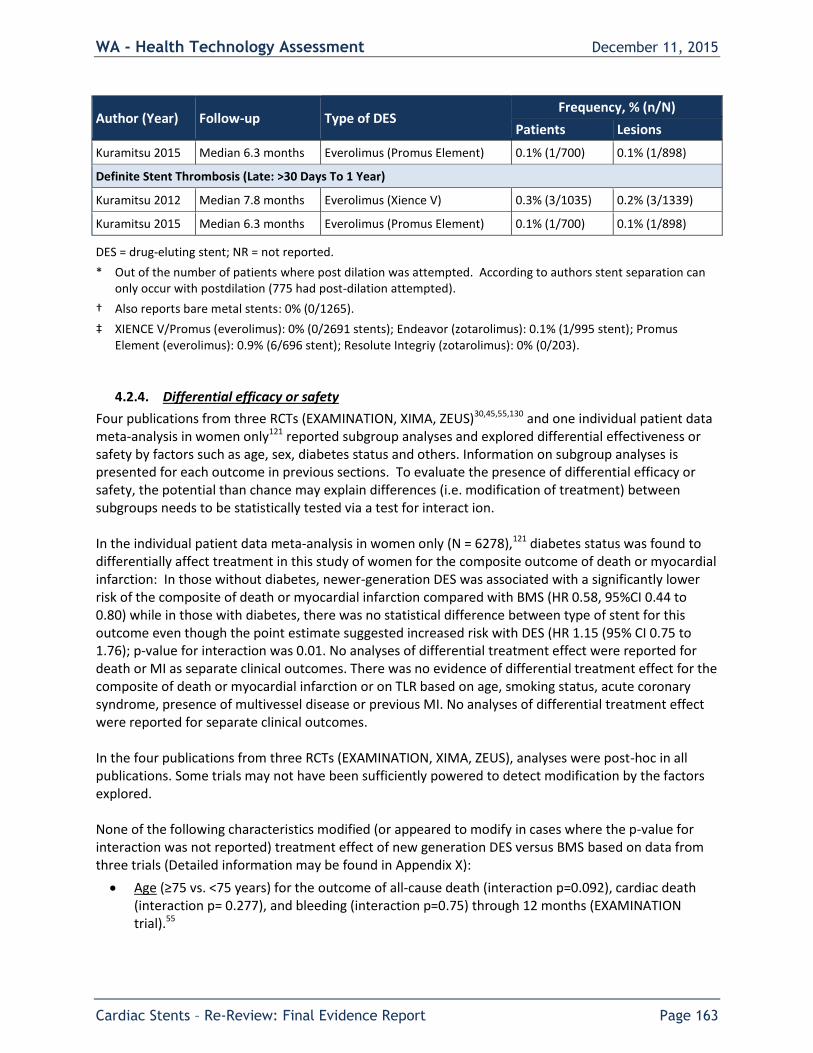
WA - Health Technology Assessment December 11, 2015
Cardiac Stents – Re-Review: Final Evidence Report Page 163
Author (Year) Follow-up Type of DES Frequency, % (n/N)
Patients Lesions
Kuramitsu 2015 Median 6.3 months Everolimus (Promus Element) 0.1% (1/700) 0.1% (1/898)
Definite Stent Thrombosis (Late: >30 Days To 1 Year)
Kuramitsu 2012 Median 7.8 months Everolimus (Xience V) 0.3% (3/1035) 0.2% (3/1339)
Kuramitsu 2015 Median 6.3 months Everolimus (Promus Element) 0.1% (1/700) 0.1% (1/898)
DES = drug-eluting stent; NR = not reported.
* Out of the number of patients where post dilation was attempted. According to authors stent separation can only occur with postdilation (775 had post-dilation attempted).
† Also reports bare metal stents: 0% (0/1265).
‡ XIENCE V/Promus (everolimus): 0% (0/2691 stents); Endeavor (zotarolimus): 0.1% (1/995 stent); Promus Element (everolimus): 0.9% (6/696 stent); Resolute Integriy (zotarolimus): 0% (0/203).
4.2.4. Differential efficacy or safety
Four publications from three RCTs (EXAMINATION, XIMA, ZEUS)30,45,55,130 and one individual patient data meta-analysis in women only121 reported subgroup analyses and explored differential effectiveness or safety by factors such as age, sex, diabetes status and others. Information on subgroup analyses is presented for each outcome in previous sections. To evaluate the presence of differential efficacy or safety, the potential than chance may explain differences (i.e. modification of treatment) between subgroups needs to be statistically tested via a test for interact ion. In the individual patient data meta-analysis in women only (N = 6278),121 diabetes status was found to differentially affect treatment in this study of women for the composite outcome of death or myocardial infarction: In those without diabetes, newer-generation DES was associated with a significantly lower risk of the composite of death or myocardial infarction compared with BMS (HR 0.58, 95%CI 0.44 to 0.80) while in those with diabetes, there was no statistical difference between type of stent for this outcome even though the point estimate suggested increased risk with DES (HR 1.15 (95% CI 0.75 to 1.76); p-value for interaction was 0.01. No analyses of differential treatment effect were reported for death or MI as separate clinical outcomes. There was no evidence of differential treatment effect for the composite of death or myocardial infarction or on TLR based on age, smoking status, acute coronary syndrome, presence of multivessel disease or previous MI. No analyses of differential treatment effect were reported for separate clinical outcomes. In the four publications from three RCTs (EXAMINATION, XIMA, ZEUS), analyses were post-hoc in all publications. Some trials may not have been sufficiently powered to detect modification by the factors explored. None of the following characteristics modified (or appeared to modify in cases where the p-value for interaction was not reported) treatment effect of new generation DES versus BMS based on data from three trials (Detailed information may be found in Appendix X):
Age (≥75 vs. <75 years) for the outcome of all-cause death (interaction p=0.092), cardiac death (interaction p= 0.277), and bleeding (interaction p=0.75) through 12 months (EXAMINATION trial).55

WA - Health Technology Assessment December 11, 2015
Cardiac Stents – Re-Review: Final Evidence Report Page 164
Age (80-85 vs. 85-90 vs. >90 years) for the composite outcome of death/MI/ TVR/CVA/major hemorrhage at 12 months (interaction p-value not reported) (XIMA trial)30
Sex (Females vs. Males) for the composite outcome of death/MI/ TVR/CVA/major hemorrhage at 12 months (interaction p-value not reported) (XIMA trial)30
Diabetes (Yes vs. No) for the composite outcome of death/MI/ TVR/CVA/major hemorrhage at 12 months (interaction p-value not reported) (XIMA trial)30
Kidney disease (creatinine >200 vs. <200) for the composite outcome of death/MI/ TVR/CVA/major hemorrhage at 12 months (interaction p-value not reported) (XIMA trial)30
Proximal LAD disease (Yes vs. No) for the composite outcome of cardiac death, target-vessel MI, and target lesion revascularization (interaction p=0.07) and clinically-driven TVR (interaction p= 0.05) (EXAMINATION trial)45
Left main disease (Yes vs. No) for the composite outcome of death/MI/ TVR/CVA/major hemorrhage at 12 months (interaction p-value not reported) (XIMA trial)30
Presentation (Stable vs. Unstable) for the composite outcome of death/MI/ TVR/CVA/major hemorrhage at 12 months (interaction p-value not reported) (XIMA trial)30
Number of diseased vessels (1 vs. 2 vs. >2) for the composite outcome of death/MI/ TVR/CVA/major hemorrhage at 12 months (interaction p-value not reported) (XIMA trial)30
Catheter approach (Radial vs. Femoral) for the composite outcome of death/MI/ TVR/CVA/major hemorrhage at 12 months (interaction p-value not reported) (XIMA trial)30
Rotational atherectomy (Yes vs. No) for the composite outcome of death/MI/ TVR/CVA/major hemorrhage at 12 months (interaction p-value not reported) (XIMA trial)30
High bleeding risk (Yes vs. No) for the outcome of death or MI through 12 months (interaction p=0.96) (ZEUS trial)130
High thrombotic risk (Yes vs. No) for the outcome of death or MI through 12 months (interaction p=0.13) (ZEUS trial)130
Low stenosis risk (Yes vs. No) for the outcome of death or MI through 12 months (interaction p=0.25) (ZEUS trial)130
4.2.5. Cost Effectiveness
One full economic study based on data from the ENDEAVOR II trial met the inclusion criteria.33 An additional report which pooled data from case series with the ENDEAVOR II trial is briefly summarized for completeness.
Summary
A moderate quality economic analysis was conducted from a U.S. healthcare provider perspective. Survival and quality-adjusted survival at 4 years were not statistically different between DES (zotarolimus) and BMS groups. Incremental cost-effectiveness ratios could not be calculated as there were no significant differences in key elements of these ratios. Briefly, compared with BMS, DES reduced target vessel revascularization through 4-years of follow-up with no difference in cumulative medical costs and was associated with nonsignificant differences in discounted survival and quality-adjusted survival.

WA - Health Technology Assessment December 11, 2015
Cardiac Stents – Re-Review: Final Evidence Report Page 165
Detailed Analysis
Eisenstein et al. 2009 conducted cost-utility and cost-effectiveness analyses using data from the ENDEAVOR II trial (Table 39).33 This trial was considered at moderately low risk of bias and is discussed in greater detail in sections 4.2.1. and 4.2.2. Briefly, 1197 patients with clinical evidence of ischemia or an abnormal functional study who were undergoing percutaneous coronary intervention with stenting in a single, de novo, native artery were randomly assigned to receive a zotarolimus-eluting stent (DES, n=598) or a bare metal stent (BMS, n=599). Patients were followed for a total of 5 years; however, the economic analysis only includes data up to 4-years of follow-up in 97.5% of the population. All economic and quality of life data were collected retrospectively. This study was considered to be of moderate quality based on QHES score of 81 (see Appendix E for details). The economic analysis was conducted from a healthcare provider perspective and included costs associated with inpatient hospital stays only (deaths not associated with a hospital stay were the only outpatient episodes). Medication costs were not included. Clinical events and MACE information were identified from trial data and cross-checked with serious adverse events hospitalization records to identify cardiac and noncardiac hospital stays not included in the MACE records. Diagnosis-related groups (DRG) were assigned to episodes of care (1 index procedure per patient and a variable number of follow-up episodes) using the logic of the Centers for Medicare and Medicaid Services (CMS) MS-DRG Grouper. These assignments were then audited by a trained medical records professional. Medical costs for all episodes of care were estimated using 2008 Medicare national average payment amounts (calculated using an average hospital Medicare base rate of $4,893) and physician services were estimated using published data. In order to extrapolate procedure costs for DES (Endeavor stent) and BMS, the average 2008 unit costs for each stent type ($2,100 and $900, respectively) were added to Medicare reimbursement amounts for balloon angioplasty procedures. Also, the type of repeat PCI procedure was not recorded in the trial data so a distribution of 13% balloon angioplasty, 19% BMS, and 68% DES was assumed based on publically available data. Cumulative four-year costs, as well as costs accrued during the first, second, third and fourth year after treatment, were used in the evaluation and calculated with and without a 3% annual discount rate. Quality of life estimates were assigned to clinical events using a secondary, published sources and included adjustments for index procedure year, all years with and without a revascularization, nonfatal MI, and length of each hospital stay. Four-year survival and quality-adjusted survival were reported. Analyses of the cumulative 4-year incremental total medical costs per QALY saved and incremental medical costs per TVR avoided were also planned, with variability of the estimates assessed via the bootstrap method. The initial cost of DES ($17,422) was higher compared with BMS ($16,641), though the difference was not statistically significant ($781, 95% CI –61 to 1,623; p=0.07). Cumulative 4-year medical costs, however, were similar between groups ($21,873 vs. $22,167, respectively; difference –$294, 95% CI –$1,772 to $1,185; p=0.70), even after discounting (difference –$198, 95% CI –$1,608 to $1,207; p=0.78). At all time-points measured during the follow-up period, subsequent medical costs were lower for DES compared with BMS: second year ($1,709 vs. $1,970; difference –$261, 95% CI –$785 to $263; p=0.33); third year ($1,405 vs. $1,737; difference –$332, 95% CI –$863 to $199; p=0.22); and fourth year ($1,337 vs. $1,819; difference –$481, 95% CI –$1,003 to $40; p=0.07). Survival and quality-adjusted survival at 4 years were not statistically different among groups, respectively: 1,406 days versus 1,405 days (difference of 1 day favoring DES; 95% CI –19 to 21; p=0.93) and 1,162 days versus 1,158 days (difference of 4 days favoring DES; 95% CI –14 to 21; p=0.68). Similar results were seen when discounting was applied: differences of 1 day (1,325 vs. 1,324 days; 95% CI –18 to 19; p=0.94) and 3 days (1,093 vs. 1.090 days; 95% CI –13 to 19; p=0.69), both favoring DES.

WA - Health Technology Assessment December 11, 2015
Cardiac Stents – Re-Review: Final Evidence Report Page 166
Incremental cost-effectiveness ratios could not be calculated as there were no significant differences in key elements of these ratios. Briefly, compared with BMS, DES reduced TVR through 4-years of follow-up with no difference in cumulative medical costs and was associated with nonsignificant differences in discounted survival and quality-adjusted survival. This economic analysis has several limitations. Due to the retrospective nature of the data collection, only costs associated an inpatient hospital stay were included. Costs such as outpatient visits and/or testing and medication costs are likely to impact total medical costs, as may indirect costs (e.g., lost work productivity, travel expenses, etc.), which were also not considered in this analysis. There was substantial variability (i.e., large confidence intervals) for cost and quality adjusted survival estimates. Sensitivity analysis was limited. Also, data were obtained from multiple hospitals across numerous countries that likely have substantial variation in medical practices and difference in payer/healthcare systems. The generalizability of results to other DES (e.g. everolimus) is not clear.

WA - Health Technology Assessment December 11, 2015
Cardiac Stents – Re-Review: Final Evidence Report Page 167
Table 39. Summary of results and limitations of included economic studies
Author, Date Funding
Country Perspective Currency
Time Horizon Discounting
Treatments Costs Difference in Costs
Outcome (QALY, Utility, Clinical )
Difference in Outcome
Primary Findings (e.g. ICER, Other) Range
Primary Limitations
Eisenstein, 2009 Funding - Medtronic
Europe, Asia Pacific, Israel, New Zealand, and Australia Healthcare system 2008 US dollars
4 years 3% annual rate
DES
(zotaroli
mus)
BMS
$21,483* $21,680*
$198* 1,093 days* 1,090 days*
3 days* ICER NR, no significant difference in quality adjusted survival Range: NR; graph of bootstrap analysis suggest substantial variability DES vs. BMS reduced TVR with no difference in cumulative medical cost (data NR)
Economic and QOL data collected retrospectively (derived from secondary sources)
Only costs associated with an inpatient hospital stay were included (outpatient and medication costs were not included)
Limited sensitivity analysis; boot strap analysis only presented graphically; no analysis on drivers of cost or impact of model assumptions
Multihospital dataset Substantial variability
(large standard deviations) for cost and quality adjusted survival estimates
Life-time estimates were not included
BMS: bare metal stent; DES: drug-eluting stent; NR: not reported; RCT: randomized controlled trial; SD: standard deviation.
* After discounting, cumulative 4-year costs and quality-adjusted survival days.

WA - Health Technology Assessment December 11, 2015
Cardiac Stents – Re-Review: Final Evidence Report Page 168
A second economic analysis conducted by Remak et al. pooled data from the Endeavor clinical trial program (Endeavor I, II, II CA, III, IV, and V trials) to compare the cost-effectiveness of DES with BMS.98 All but one included study—the Endeavor II trial which is detailed above—were single arm studies of the Endeavor zotarolimus-eluting stent. Because the findings and conclusion of this analysis are based primarily on indirect data and data from single arm studies (lower quality data), the findings are described briefly and the study not formally evaluated. This study is based on the UK health care system. Over a four year time horizon, the total cost of care with DES (£5,739 ± £191) was similar to that of BMS (£5,636 ± £128) with total QALYs gained of 3.11 ± 0.66 and 3.08 ± 0.57, respectively, resulting in an incremental cost-effectiveness ratio of £3,757/QALY gained. At a threshold of £20,000/QALY this was found to be 62% likely to be cost-effective and 81% likely at a threshold of £30,000/QALY. In a secondary analysis of the Endeavor II clinical data only (head-to-head analysis of DES vs. BMS) the incremental cost-effectiveness ratio was £5,716/QALY gained. Differences in payer and healthcare systems between the US and United Kingdom should be considered.

WA - Health Technology Assessment December 11, 2015
Cardiac Stents – Re-Review: Final Evidence Report Page 169
5. Summary by Key Question
The following summaries of evidence have been based on the highest quality of studies available. Additional information on lower quality studies is available in the report. A summary of the primary results for each key question are provided in the tables that follow the text summaries below with a focus on the primary outcomes described above. Details of these and other outcomes are available in the full report. RCTs and comparative nonrandomized controlled trials are the focus for this summary.
5.1. Key Question 1a: Primary Efficacy Outcomes for PCI with Stenting and Medical Therapy Compared with Medical Therapy Alone for Stable CAD
Population Outcome Number of Studies (N)
Risk of Bias
Indirectness Inconsistency Imprecision Reporting Bias
Graded Up for Additional Domains
Strength of Evidence
Absolute Risk Effect Size (95% CI) Conclusions
General population
Mortality (all-cause) through 12 months
1 RCT (MASS-II) (N=408)
Serious risk of bias (-1)1
No serious indirectness
Unknown Serious imprecision (-1)2
Undetected ⨁⨁◯◯ LOW
PCI 4.4%, Med 1.5% RD 2.9% (-0.4% to 6.2%) RR 3.0 (0.8 to 10.8) Mortality up to 12 months was slightly higher in the PCI group compared with the Med group, however, this difference was not statistically meaningful.
Special population: Males
Mortality (all-cause) through 24 months
1 RCT (Hambrecht) (N=101)
Serious risk of bias (-1)1
No serious indirectness
Unknown Serious imprecision (-1)3
Undetected ⨁⨁◯◯
LOW
PCI 4%, Exercise 2% RD 2% (-5% to 9%) RR 2.0 (0.2 to 21.8) A difference was not detected due to low power.
General population
Mortality (all-cause) through median of 55.2 months
1 RCT (COURAGE) (N=2287)
Serious risk of bias (-1)1
No serious indirectness
Unknown No serious imprecision
Undetected ⨁⨁⨁◯ MODERATE
PCI 7.4%, Med 8.4% RD -1.0% (-3.2% to 1.3%) RR 0.89 (0.67 to 1.17) Mortality was similar between PCI and Med groups through a median of 55 months

WA - Health Technology Assessment December 11, 2015
Cardiac Stents – Re-Review: Final Evidence Report Page 170
Population Outcome Number of Studies (N)
Risk of Bias
Indirectness Inconsistency Imprecision Reporting Bias
Graded Up for Additional Domains
Strength of Evidence
Absolute Risk Effect Size (95% CI) Conclusions
General population
Mortality (all-cause) through 60 months
1 RCT (MASS-II) (N=408)
Serious risk of bias (-1)1
No serious indirectness
Unknown Serious imprecision (-1)3
Undetected ⨁⨁◯◯ LOW
PCI 11.7%, Med 12.3% RD -0.6% (-6.9% to 5.7%) Adjusted RR 0.92 (0.46 to 1.86) Mortality up to 60 months was similar between PCI and Med groups
Special population: Type 2 Diabetes
Mortality (all-cause) through mean of 63.6 months
1 RCT (BARI 2D) (N=1605)
Serious risk of bias (-1)1
No serious indirectness
Unknown No serious imprecision
Undetected ⨁⨁⨁◯ MODERATE
PCI 12.8%, Med 11.9% RD 0.9% (-2.3% to 4.1%) RR 1.1 (0.8 to 1.4) Mortality was similar between PCI and Med groups through a mean of 63.6 months
General population
Mortality (all-cause) through 120 months
1 RCT (MASS-II) (N=408)
Serious risk of bias (-1)1
No serious indirectness
Unknown Serious imprecision (-1)3
Undetected ⨁⨁◯◯ LOW
PCI 25.1%, Med 31.0% RD -7.1% (-15.7% to 1.5%) RR 0.8 (0.6 to 1.1) Mortality through 120 months was slightly lower in the PCI group compared with the Med group, however, this difference was not statistically meaningful.
General population
Cardiac death through 12 months
1 RCT (MASS-II) (N=408)
Serious risk of bias (-1)1
No serious indirectness
Unknown Serious imprecision (-1)2
Undetected ⨁⨁◯◯ LOW
PCI 4.4%, Med 1.5% RD 2.9% (-0.4% to 6.2%) RR 3.0 (0.8 to 10.8) Cardiac death through 12 months was similar between PCI and Med groups
Special population: Males
Cardiac death through 24 months
1 RCT (Hambrecht) (N=101)
Serious risk of bias (-1)1
No serious indirectness
Unknown Serious imprecision (-1)2
Undetected ⨁⨁◯◯ LOW
PCI 0%, Exercise 0% There were no cardiac deaths in either group through 24 months.
General population
Cardiac death through
1 RCT (COURAGE)
Serious risk of bias (-1)1
No serious indirectness
Unknown No serious imprecision
Undetected ⨁⨁⨁◯ MODERATE
PCI 2.0%, Med 2.2% RD -0.2% (-1.4% to 1.0%)

WA - Health Technology Assessment December 11, 2015
Cardiac Stents – Re-Review: Final Evidence Report Page 171
Population Outcome Number of Studies (N)
Risk of Bias
Indirectness Inconsistency Imprecision Reporting Bias
Graded Up for Additional Domains
Strength of Evidence
Absolute Risk Effect Size (95% CI) Conclusions
median of 55.2 months
(N=2287) unadjusted HR 0.87 (0.65 to 1.16) Cardiac death through a median of 55.2 months was similar between PCI and Med groups
General population
Cardiac death through 60 months
1 RCT (MASS-II) (N=408)
Serious risk of bias (-1)1
No serious indirectness
Unknown Serious imprecision (-1)3
Undetected ⨁⨁◯◯ LOW
PCI 11.6%, Med 12.3% RD -0.6% (-6.9% to 5.7%) RR 1.0 (0.6 to 1.6) Cardiac death through 60 months was similar between PCI and Med groups
Special population: Type 2 Diabetes
Cardiac death through mean of 63.6 months (special population: type 2 diabetes)
1 RCT (BARI 2D) (N=1605)
Serious risk of bias (-1)1
No serious indirectness
Unknown No serious imprecision
Undetected ⨁⨁⨁◯
MODERATE
PCI 5.5%, Med 4.1% RD 1.4% (-0.7% to 3.5%) RR 1.3 (0.9 to 2.1) Cardiac death through a mean of 63.6 months was similar between PCI and Med groups
General population
Cardiac death through 120 months
1 RCT (MASS-II) (N=408)
Serious risk of bias (-1)1
No serious indirectness
Unknown Serious imprecision (-1)3
Undetected ⨁⨁◯◯ LOW
PCI 14.3%, Med 20.7% RD -6.5% (-13.9% to 0.8%) RR 0.7 (0.4 to 1.1) Cardiac death occurred in fewer PCI patients through 120 months, however this difference was not statistically meaningful.
General population
Nonfatal MI through 12 months
1 RCT (MASS-II) (N=408)
Serious risk of bias (-1)1
No serious indirectness
Unknown Serious imprecision (-1)2
Undetected ⨁⨁◯◯ LOW
PCI 8.3%, Med 5.0% RD 2.9% (-1.9% to 7.6%) RR 1.6 (0.7 to 2.4) Nonfatal MI through 12 months was similar between PCI and Med groups

WA - Health Technology Assessment December 11, 2015
Cardiac Stents – Re-Review: Final Evidence Report Page 172
Population Outcome Number of Studies (N)
Risk of Bias
Indirectness Inconsistency Imprecision Reporting Bias
Graded Up for Additional Domains
Strength of Evidence
Absolute Risk Effect Size (95% CI) Conclusions
Special population: Males
Nonfatal MI through 12 months
1 RCT (Hambrecht) (N=101)
Serious risk of bias (-1)1
No serious indirectness
Unknown Serious imprecision (-1)2
Undetected ⨁⨁◯◯ LOW
PCI 2%, Exercise 0% RD 2% A difference was not detected due to low power.
Special population: Males
Nonfatal MI through 24 months
1 RCT (Hambrecht) (N=101)
Serious risk of bias (-1)1
No serious indirectness
Unknown Serious imprecision (-1)2
Undetected ⨁⨁◯◯ LOW
PCI 2%, Exercise 2% RD 0% (-6% to 6%) RR 1.0 (0.1 to 15.9) A difference was not detected due to low power.
General population
Nonfatal MI (post-peri-procedural through median of 55.2 months
1 RCT (COURAGE) (N=2287)
Serious risk of bias (-1)1
No serious indirectness
Unknown No serious imprecision
Undetected ⨁⨁⨁◯ MODERATE
PCI 9.4%, Med 10.5% RD -1.1% (-3.5% to 1.4%) RR 0.9 (0.9 to 1.2) A difference was not detected.
Special population: Type 2 Diabetes
MI (post-peri-procedural, fatal & nonfatal) through mean of 55.2 months
1 RCT (BARI 2D) (N=1605)
Serious risk of bias (-1)1
No serious indirectness
Unknown No serious imprecision
Undetected ⨁⨁⨁◯ MODERATE
PCI 8.5%, Med 9.6% RD -1.0% (-3.8% to 1.8%) RR 0.9 (0.7 to 1.2) Non-periprocedural MI was similar between PCI and Med groups through a mean of 55.2 months
General population
Nonfatal MI through 60 months
1 RCT (MASS-II) (N=408)
Serious risk of bias (-1)1
No serious indirectness
Unknown Serious imprecision (-1)3
Undetected ⨁⨁◯◯ LOW
PCI 11.2%, Med 15.3% RD -4.1% (-10.6% to 2.5%) RR 0.7 (0.44 to 1.2) Nonfatal MI through 60 months was similar between PCI and Med groups

WA - Health Technology Assessment December 11, 2015
Cardiac Stents – Re-Review: Final Evidence Report Page 173
Population Outcome Number of Studies (N)
Risk of Bias
Indirectness Inconsistency Imprecision Reporting Bias
Graded Up for Additional Domains
Strength of Evidence
Absolute Risk Effect Size (95% CI) Conclusions
General population
Nonfatal MI through 120 months
1 RCT (MASS-II) (N=408)
Serious risk of bias (-1)1
No serious indirectness
Unknown Serious imprecision (-1)3
Undetected ⨁⨁◯◯ LOW
PCI 13.2%, Med 20.7% RD -7.5% (-17.8% to -0.3%) RR 0.64 (0.41 to 0.991) Nonfatal MI through 120 months was less common in the PCI versus Med group
General population
Revascular-ization (any) through 12 months
1 RCT (MASS-II) (N=408)
Serious risk of bias (-1)1
No serious indirectness
Unknown Serious imprecision (-1)3
Undetected ⨁⨁◯◯ LOW
PCI 12.2%, Med 7.9% RD 4.3% (-1.5% to 10.1%) RR 1.55 (0.85 to 2.81) Revascularization up to 12 months was statistically similar between PCI and Med groups.
Special population: Males
Revascular-ization (any) through 12 months
1 RCT (Hambrecht) (N=101)
Serious risk of bias (-1)1
No serious indirectness
Unknown Serious imprecision (-1)3
Undetected ⨁⨁◯◯ LOW
PCI 20%, Exercise 6% RD 14% (1% to 27%) RR 3.4 (1.0 to 11.6) Revascularization was performed in more PCI versus Exercise groups through 12 months.
General population
Revascular-ization (any) through median of 55.2 months
1 RCT (COURAGE) (N=2287)
Serious risk of bias (-1)1
No serious indirectness
Unknown No serious imprecision
Undetected ⨁⨁⨁◯ MODERATE
PCI 19.8%, Med 30.6% RD -10.7% (-14.3% to -7.2%) RR 0.65 (0.56 to 0.75) Revascularization was performed in fewer patients in the PCI group than in the Med group through a median of 55 months
Special population: Type 2 Diabetes
Revascular-ization (any) through 60 months
1 RCT (BARI 2D) (N=1605)
Serious risk of bias (-1)1
No serious indirectness
Unknown No serious imprecision
Undetected ⨁⨁⨁◯ MODERATE
PCI 26.8%, Med 39.1% RD -12.3% (-16.9% to -7.8%) RR 0.68 (0.59 to 0.79) Revascularization was performed in fewer patients in the PCI group than in the Med group through 60 months

WA - Health Technology Assessment December 11, 2015
Cardiac Stents – Re-Review: Final Evidence Report Page 174
Population Outcome Number of Studies (N)
Risk of Bias
Indirectness Inconsistency Imprecision Reporting Bias
Graded Up for Additional Domains
Strength of Evidence
Absolute Risk Effect Size (95% CI) Conclusions
General population
Revascular-ization (any) through 60 months
1 RCT (MASS-II) (N=408)
Serious risk of bias (-1)1
No serious indirectness
Unknown Serious imprecision (-1)3
Undetected ⨁⨁◯◯ LOW
PCI 32.2%, Med 24.1% RD 8.1% (-0.6% to 16.8%) RR 1.33 (0.97 to 1.83) Revascularization through 60 months was more common in the PCI group, however this difference was not statistically significant.
General population
Revascular-ization (any) through 120 months
1 RCT (MASS-II) (N=408)
Serious risk of bias (-1)1
No serious indirectness
Unknown Serious imprecision (-1)3
Undetected ⨁⨁◯◯ LOW
PCI 41.5%, Med 39.4% RD 2.1% (-7.5% to 11.6%) RR 1.05 (0.83 to 1.33) Revascularization through 120 months was similar between PCI and Med groups
General population
Clinically-significant improve-ment* in SAQ domains at 6 months
1 RCT (COURAGE) (N=1698-1738)
Serious risk of bias (-1)1
No serious indirectness
Unknown Serious imprecision (-1)4
Undetected ⨁⨁◯◯ LOW
At 6 months, more patients in the PCI versus Med group had clinically significant improvement in the SAQ domains for angina frequency (50% vs. 44%, RR 1.14, 95% CI 1.03 to 1.26), physical limitation (51% vs. 42%, RR 1.21, 95% CI 1.10 to 1.35), and in quality of life (64% vs. 56%, RR 1.14, 95% CI 1.06 to 1.24), while there were no differences between groups in treatment satisfaction (30% vs. 31%) or angina stability (56% vs. 52%).

WA - Health Technology Assessment December 11, 2015
Cardiac Stents – Re-Review: Final Evidence Report Page 175
Population Outcome Number of Studies (N)
Risk of Bias
Indirectness Inconsistency Imprecision Reporting Bias
Graded Up for Additional Domains
Strength of Evidence
Absolute Risk Effect Size (95% CI) Conclusions
General population
Clinically-significant improve-ment* in SAQ domains at 12 months
1 RCT (COURAGE) (N=1653-1692)
Serious risk of bias (-1)1
No serious indirectness
Unknown Serious imprecision (-1)4
Undetected ⨁⨁◯◯ LOW
At 12 months, more patients in the PCI versus Med group had clinically significant improvement in the SAQ domains for angina frequency (52% vs. 46%, RR 1.13, 95% CI 1.03 to 1.25) and treatment satisfaction (39% vs. 33%, RR 1.18, 95% CI 1.04 to 1.34), while there were no differences between groups in the domains physical limitation, quality of life, or angina stability.
General population
Clinically-significant improve-ment* in SAQ domains at 36 months
1 RCT (COURAGE) (N=1156-1179)
Serious risk of bias (-2)1,6
No serious indirectness
Unknown Serious imprecision (-1)4
Undetected ⨁◯◯◯ INSUFFICIENT
At 36 months, more patients in the PCI versus Med group had clinically significant improvement in the SAQ angina frequency domain (57% versus 50%, RR 1.14, 95% CI 1.02 to 1.27) but not in any other SAQ domain. Firm conclusions cannot be made due to low follow-up (51%).
General population
Clinically-significant improve-ment† in RAND-36 domains at 6 and 12 months
1 RCT (COURAGE) (N=1653-1738)
Serious risk of bias (-1)1
No serious indirectness
Unknown Serious imprecision (-1)4
Undetected ⨁⨁◯◯ LOW
More patients in the PCI versus Med group had improvement in the physical functioning domain (50% versus 43%, RR 1.16, 95% CI 1.05 to 1.28) and role limitation-physical domain (48% versus 43%, RR 1.11, 95% CI 1.00 to 1.23) at 6 months; otherwise there were no significant differences between

WA - Health Technology Assessment December 11, 2015
Cardiac Stents – Re-Review: Final Evidence Report Page 176
Population Outcome Number of Studies (N)
Risk of Bias
Indirectness Inconsistency Imprecision Reporting Bias
Graded Up for Additional Domains
Strength of Evidence
Absolute Risk Effect Size (95% CI) Conclusions
groups in any other domain at 6 or 12 months.
General population
Clinically-significant improve-ment† in RAND-36 domains at 36 months
1 RCT (COURAGE) (N=1156-1179)
Serious risk of bias (-1)1,6
No serious indirectness
Unknown Serious imprecision (-1)4
Undetected ⨁◯◯◯ INSUFFICIENT
At 36 months, there was no difference between groups in the percentage of patients with clinically meaningful improvement in any of the RAND-36 domains. Firm conclusions cannot be made due to low follow-up (51%).
General population
SF-36 scores at 12 months
1 RCT (MASS-II) (N=408)
Serious risk of bias (-1)1
No serious indirectness
Unknown Serious imprecision (-1)4
Undetected ⨁⨁◯◯ LOW
The PCI group had significantly better mean scores in the SF-36 physical functioning and vitality subdomains compared with the medical therapy group at 12 months (p<0.001). There were no other significant differences in mean scores between the groups at 12 months for any of the other subdomains (general health, role functioning-physical, role functioning-emotional, mental health, pain, social functioning). Data was only provided in graph form thus additional data are not available.
Special population: Type 2 Diabetes
Duke Activity Status Index through 48 months
1 RCT (BARI 2D) (N=1602)
Serious risk of bias (-1)1
No serious indirectness
Unknown Serious imprecision (-1)5
Undetected ⨁⨁◯◯ LOW
PCI and Med groups had similar percent improvement from baseline over 48 months in the Duke Activity Status Index (OR 1.07, p=0.40).

WA - Health Technology Assessment December 11, 2015
Cardiac Stents – Re-Review: Final Evidence Report Page 177
Population Outcome Number of Studies (N)
Risk of Bias
Indirectness Inconsistency Imprecision Reporting Bias
Graded Up for Additional Domains
Strength of Evidence
Absolute Risk Effect Size (95% CI) Conclusions
Special population: Type 2 Diabetes
Energy, health distress, and self-rated health (modified RAND domains) through 48 months
1 RCT (BARI 2D) (N=1602)
Serious risk of bias (-1)1
No serious indirectness
Unknown Serious imprecision (-1)5
Undetected ⨁⨁◯◯ LOW
PCI and Med groups had similar percent improvement from baseline over 48 months in the modified RAND domains for energy (OR 1.12, p=0.17), health distress (OR 0.97, p=0.69), and self-rated health (OR 0.92, p=0.36).
General population
Freedom from angina (not defined) at 12 and 36 months
1 RCT (COURAGE) (N=1644-2041)
Serious risk of bias (-1)1
No serious indirectness
Unknown Serious imprecision (-1)4
Undetected ⨁⨁◯◯ LOW
Significantly more PCI than Med patients were angina-free at 12 months (66.0% vs. 58.9%, RR 1.11, 95% CI 1.04 to 1.19, p=0.001) and 36 months (73.4% versus 67.7%. RR 1.08, 95% CI 1.01 to 1.15, p=0.01).
General population
Freedom from angina (not defined) at 12, 60, and 120 months
1 RCT (MASS-II) (N=408)
Serious risk of bias (-1)1
No serious indirectness
Unknown Serious imprecision (-1)4
Undetected ⨁⨁◯◯ LOW
At all follow-ups, more PCI versus Med patients were angina-free (not further defined), including 12 months (52.2% versus 36.5%, RR 1.43, 95% CI 1.1 to 1.8, p=0.001), 60 months (77.3% versus 54.8%, RR 1.28, 95% CI 1.06 to 1.55, p=0.0102), and 120 months (58.5% versus 43.3%, RR 1.35, 95% CI 1.11 to 1.64, p=0.0022).

WA - Health Technology Assessment December 11, 2015
Cardiac Stents – Re-Review: Final Evidence Report Page 178
Population Outcome Number of Studies (N)
Risk of Bias
Indirectness Inconsistency Imprecision Reporting Bias
Graded Up for Additional Domains
Strength of Evidence
Absolute Risk Effect Size (95% CI) Conclusions
Special population: Type 2 Diabetes
Patient-reported worsening angina (overall angina that was worse in severity and/or frequency or a change from no angina to any angina or to unstable angina) through 12 months
1 RCT (BARI 2D) (N=1502)
Serious risk of bias (-1)1
No serious indirectness
Unknown Serious imprecision (-1)4
Undetected ⨁⨁◯◯ LOW
Worsening angina occurred in fewer PCI versus Med patients through 12 months (17.7% versus 24.5%; RD -6.8%, 95% CI -10.9% to -2.7%; RR 0.7, 95% CI 0.6 to 0.9; p=0.0012).
Special population: Type 2 Diabetes
Patient-reported worsening angina (overall angina that was worse in severity and/or frequency or a change from no angina to any angina or to unstable angina) between 24-60 months
1 RCT (BARI 2D) (N=1502)
Serious risk of bias (-1)1
No serious indirectness
Unknown Serious imprecision (-1)5
Undetected ⨁⨁◯◯ LOW
Worsening angina occurred similarly between groups during the second year follow-up (~14% in both groups), but favored the PCI group again as measured during the third year of follow-up (~11% vs. 15%, p=0.019). Results were similar between groups during the fourth (~10% vs. ~11%) and fifth (~9% in both groups) years of follow-up.

WA - Health Technology Assessment December 11, 2015
Cardiac Stents – Re-Review: Final Evidence Report Page 179
Population Outcome Number of Studies (N)
Risk of Bias
Indirectness Inconsistency Imprecision Reporting Bias
Graded Up for Additional Domains
Strength of Evidence
Absolute Risk Effect Size (95% CI) Conclusions
Special population: Type 2 Diabetes
Freedom from patient-reported angina (in subset of patients with classic angina at baseline)
1 RCT (BARI 2D) (N=961)
Serious risk of bias (-1)1
No serious indirectness
Unknown Serious imprecision (-1)5
Undetected ⨁⨁◯◯ LOW
In the subset of patients with classic angina at baseline, signficantly more PCI than Med group patients did not report new angina during the first year follow-up (~40% versus ~24%, p<0.001). There were no significant differences between groups in the second, third, fourth, or fifth years of follow-up.
Special population: Type 2 Diabetes
New classic angina (in subset of patients without classic angina at baseline)
1 RCT (BARI 2D) (N=641)
Serious risk of bias (-1)1
No serious indirectness
Unknown Serious imprecision (-1)5
Undetected ⨁⨁◯◯ LOW
In the subset of patients without classic angina at baseline, cumulative new angina rates were not statistically significant between groups through 60 months follow-up.
* Clinical significance defined as a difference of 8 points or more on the physical-limitation scale, 25 or more on the angina-stability scale, 20 or more on the angina-frequency scale, 12 or more on the treatment-satisfaction scale, and 16 or more on the quality-of-life scale.
† Clinical significance defined as a difference 10 points or more in a given domain.
1. Serious risk of bias: the study violated one or more of the criteria for good quality RCT related to the outcome reported (see Appendix for details)
2. Serious imprecision: insufficient sample size
3. Serious imprecision: insufficient sample size; wide (or unknown) confidence interval
4. Serious imprecision: wide confidence interval
5. Serious imprecision: unknown confidence interval
6. Serious risk of bias: very low follow-up (51%)

WA - Health Technology Assessment December 11, 2015
Cardiac Stents – Re-Review: Final Evidence Report Page 180
5.1. Key Question 1b: Safety Outcomes for PCI with Stenting and Medical Therapy Compared with Medical Therapy Alone for Stable CAD
Population Outcome Number of Studies (N)
Risk of Bias
Indirectness Inconsistency Imprecision Reporting Bias
Graded Up for Additional Domains
Strength of Evidence
Absolute Risk Effect Size (95% CI) Conclusions
General
population
In-hospital
adverse
events
1 RCT (MASS-II)
(N=205)
Serious risk of bias (-1)1
No serious indirectness
Unknown Serious imprecision (-1)2
Undetected ⨁⨁◯◯ LOW
PCI 1% to 2.4%, Med NA
During the index PCI
procedure, in-hospital
events were relatively
rare and included death
(2.4%), Q-wave MI
(1.0%), emergency CABG
(1.0%), emergency PCI
(1.0%), and stroke
(1.0%).
General
population
Periprocedural
MI
1 RCT
(COURAGE)
(N=2287)
Serious risk of bias (-1)1
No serious
indirectness
Unknown No serious
imprecision
Undetected ⨁⨁⨁◯
MODERATE
PCI 3.0%, Med 0.8%
RD 2.3% (1.1% to 3.4%)
RR 3.85 (1.86 to 7.98)
Periprocedural MI
occurred in significantly
more patients
randomized to PCI
versus Med
Special
population:
Type 2
Diabetes
Periprocedural
MI
1 RCT (BARI
2D) (N=1602)
Serious risk
of bias (-1)1 No serious indirectness
Unknown No serious
imprecision
Undetected undetected ⨁⨁⨁◯
MODERATE
PCI 3.4%, Med 1.4%
RD 2.0% (0.5% to 3.5%)
RR 2.48 (1.24 to 4.96)
Periprocedural MI was
significantly more
common in the PCI
group
Special
population:
Type 2
Diabetes
30-day
mortality
1 RCT (BARI
2D) (N=798)
Serious risk of bias (-1)1
No serious indirectness
Unknown Serious imprecision (-1)2
Undetected ⨁⨁◯◯ LOW
PCI 0.5%, Med NR
30-day mortality
occurred in 0.5% of PCI
patients; no data were
reported for the control

WA - Health Technology Assessment December 11, 2015
Cardiac Stents – Re-Review: Final Evidence Report Page 181
Population Outcome Number of Studies (N)
Risk of Bias
Indirectness Inconsistency Imprecision Reporting Bias
Graded Up for Additional Domains
Strength of Evidence
Absolute Risk Effect Size (95% CI) Conclusions
group.
Special
population:
Type 2
Diabetes
Periprocedural
stroke
1 RCT (BARI
2D) (N=1605)
Serious risk of bias (-1)1
No serious indirectness
Unknown Serious imprecision (-1)2
Undetected ⨁⨁◯◯ LOW
PCI 0.4%, Med 0.2%
RD 0.1% (-0.4% to 0.7%)
RR 1.52 (0.25 to 9.04)
Periprocedural stroke
was similar between PCI
and Med groups
Special
population:
Males
Stroke
through 12
months
1 RCT
(Hambrecht)
(N=101)
Serious risk of bias (-1)1
No serious indirectness
Unknown Serious imprecision (-1)3
Undetected ⨁⨁◯◯ LOW
PCI 6%, Exercise 4%
RD 2% (–6% to 10%)
RR 1.5 (0.3 to 8.8)
A difference was not
detected due to low
power.
General
population
Stroke
through
median of
55.2 months
1 RCT
(COURAGE)
(N=2287)
Serious risk of bias (-1)1
No serious indirectness
Unknown No serious imprecision
Undetected ⨁⨁⨁◯
MODERATE
PCI 1.9%, Med 1.2%
RD 0.7% (–0.3% to 1.7%)
RR 1.56 (0.80 to 3.03)
Stroke through a median
of 55.2 months occurred
similarly between
groups.
Special
population:
Type 2
Diabetes
Stroke
through mean
of 55.2
months
1 RCT (BARI
2D) (N=1605)
Serious risk of bias (-1)1
No serious indirectness
Unknown No serious imprecision
Undetected ⨁⨁⨁◯
MODERATE
PCI 2.6%, Med 2.6%
RD 0.03% (-1.5% to
1.6%)
RR 1.0 (0.6 to 1.8)
Stroke through a mean
of 55.2 months occurred
similarly between
groups.
General
population
Stroke
through 120
months
1 RCT (MASS-II)
(N=408)
Serious risk of bias (-1)1
No serious indirectness
Unknown Serious imprecision (-1)3
Undetected ⨁⨁◯◯ LOW
PCI 5.4%, Med 6.9%
RD –1.5% (–6.2% to
3.1%)
RR 0.8 (0.4 to 1.7)

WA - Health Technology Assessment December 11, 2015
Cardiac Stents – Re-Review: Final Evidence Report Page 182
Population Outcome Number of Studies (N)
Risk of Bias
Indirectness Inconsistency Imprecision Reporting Bias
Graded Up for Additional Domains
Strength of Evidence
Absolute Risk Effect Size (95% CI) Conclusions
Stroke through 120
months occurred
similarly between
groups; similar results
were found when
assessed through 12 and
60 months.
1. Serious risk of bias: the study violated one or more of the criteria for good quality RCT related to the outcome reported (see Appendix for details)
2. Serious imprecision: insufficient sample size
3. Serious imprecision: insufficient sample size; wide (or unknown) confidence interval

WA - Health Technology Assessment December 11, 2015
Cardiac Stents – Re-Review: Final Evidence Report Page 183
5.2. Key Question 1c: Differential Efficacy and Safety for PCI with Stenting and Medical Therapy Compared with Medical Therapy Alone for Stable CAD
Population
Baseline
Characteristic,
Outcome
Number of
Studies
(N)
Risk of
Bias Indirectness Inconsistency Imprecision
Reporting
Bias
Graded
Up for
Additional
Domains
Strength of
Evidence
Absolute Risk
Effect Size
(95% CI)
Conclusions
General
population
Healthcare system
(US-VA vs. US-nonVA
vs. Canada)
Outcome:
Revascularization
(any) through
median of 55.2
(range, 30 to 84)
months
1 RCT
(COURAGE)
(N=2158)
Serious risk of bias (-2)1,2
No serious
indirectness
Unknown Serious
imprecision
Undetected ⨁◯◯◯ INSUFFICIENT
US-VA: PCI 28.1%, Med 32.6%
US-nonVA: PCI 23.4%, Med
34.8%
Canada: PCI 12.9%, Med
32.5%
US-VA: RD -4.5% (-10.5% to
1.6%)
US-nonVA: RD -11.5% (-20.8%
to -2.2%)
Canada: RD -19.6% (-24.9% to
-14.3%)
US-VA: RR 0.86 (0.71 to 1.05)
US-nonVA: 0.67 (0.48 to 0.93)
Canada: RR 0.40 (0.30 to 0.52)
Healthcare system modified
the treatment effect of
revascularization through a
median of 55.2 months
(interaction p<0.001) such
that revascularization rates
were different in different
healthcare systems
1. Serious risk of bias: the study violated one or more of the criteria for good quality RCT related to the outcome reported (see Appendix for details)
2. Serious risk of bias for HTE: additional risk of bias related to evaluation of subgroups (hypothesis not clearly stated; subgroup not one of a smaller number tested in the COURAGE trial)
3. Serious imprecision: wide confidence intervals
4.
In a post-hoc analysis of data from the COURAGE trial, baseline scores of the SAQ angina frequency, physical limitation, and quality of life domains (divided into
tertiles) and time (through 36 months) modified treatment effect with respect to the percentage of patients with clinically significant improvement in the same

WA - Health Technology Assessment December 11, 2015
Cardiac Stents – Re-Review: Final Evidence Report Page 184
domain (interaction p<0.001 for all) and with respect to mean scores in the same domain (interaction p<0.008 for all) such that patients with lower baseline
scores had greater improvement.
In the COURAGE trial, the SAQ angina stability domain was modified in terms of treatment group, patient sex, and time (through 36 months) (interaction p=
0.0041. Similarly, the SAQ angina frequency and quality of life domains were modified in terms of treatment group, prior CABG, and time (through 36 months)
(interaction p=0.0113 & p=0.0270, respectively). However, no additional data were reported and it is unclear how the results varied according to the
characteristics evaluated (sex, history of CABG) and time, which were both used as interaction variables.
There was no evidence that the effect of PCI+MT versus MT alone on any of the primary efficacy outcomes or safety outcomes was modified by any baseline
characteristic evaluated, including: age, baseline angiographic risk, baseline SAQ domain scores, baseline ischemia, number of lesions, total occlusion, proximal
LAD, prior revascularization, LVEF, diabetes, chronic kidney disease, or healthcare system. There was evidence that age modified the composite outcome of
death/MI and that healthcare system modified treatment effect in terms of the need for revascularization, however, neither of these were considered to be
primary outcomes of interest.

WA - Health Technology Assessment December 11, 2015
Cardiac Stents – Re-Review: Final Evidence Report Page 185
5.3. Key Question 1d: Economic Outcomes for PCI with Stenting and Medical Therapy Compared with Medical Therapy Alone for Stable CAD
Population Interventions Studies Time Horizon
Countries QHES Range
Overall Quality of Evidence
Conclusions
General population
PCI+Med vs. Med COURAGE (Weintraub 2008, Zhang 2011) Median 4.6 years & Lifetime horizon
US and Canada
90/100 Moderate The authors concluded that an initial treatment of PCI + optimal medical therapy for stable CAD was not more cost effective than an initial treatment strategy of optimal medical therapy alone, with a cost per QALY gained (ICER) of $206,229 with PCI and the cost per life-year gained with PCI was $299,518 for the in-trial period of 4.6 years; the cost per life-year gained with PCI was $299,518 over the same time horizon. Over the lifetime horizon, the ICER was $168,019 with PCI and the cost per life-year gained was $262,116. The QALY took into account both survival (including that following non-fatal events) and angina-related quality of life using SAQ scores; direct costs were used. Additional analyses of the cost of clinically meaningful improvement in different SAQ domains yielded similar conclusions, even after stratifying by baseline angina severity. Sensitivity analyses supported the conclusion that PCI was not cost-effective as an initial treatment.
General population
PCI+Med vs. Med MASS-II (Favarato 2003, Vieira 2012) 1 year & 5 years
Brazil 48/100 Insufficient The authors concluded that an initial treatment of PCI + optimal medical therapy for stable multivessel CAD was not more cost effective than an initial treatment strategy of optimal medical therapy alone for the time horizons of 1 and 5 years. At 5 years, the cost per year of event-free survival (which appeared to include freedom from death, MI, stroke, and revascularization) was $10,896 higher in the PCI group ($19,967 versus $9,071, p<0.001); the cost of event-free and angina-free survival through 5 years was $9278 higher in the PCI group ($25,831 versus $16,553, p<0.001). No sensitivity analyses were done. Direct costs were used.
Special population: Males
PCI+Med vs. Exercise + Med
Hambrecht 2003 1 year
Germany 35/100 Insufficient The average cost to improve one CCS class between baseline and 12 months was significantly higher in the PCI group compared with the control group ($6956 versus $3249; p<0.001). No sensitivity analyses were done. Direct costs were used.
Special population: Type 2 Diabetes
PCI+Med vs. Med BARI 2D (Hlatky 2009) 4 years Lifetime horizon
US 79/100 Moderate The authors concluded that an initial treatment of PCI + medical therapy for stable CAD was not more cost effective than an initial treatment strategy of medical therapy alone. Direct costs were used, and the main outcome was survival. Over a 4-year time horizon, PCI was dominated by medical therapy (i.e., medical therapy was more effective and cost less) when cost per life-years gained was calculated. Similarly, medical therapy dominated in terms of the 4-year cost per QALY, which was

WA - Health Technology Assessment December 11, 2015
Cardiac Stents – Re-Review: Final Evidence Report Page 186
Population Interventions Studies Time Horizon
Countries QHES Range
Overall Quality of Evidence
Conclusions
based on trial data for DASI, CCS class, health rating, and self-reported health status (no further details reported). In the lifetime projected cost-effectiveness analysis, the PCI group had slightly lower costs than the control group ($237,900 versus $238,100) but fewer life-years of survival (13.70 versus 14.03), so that medical therapy alone resulted in an additional cost of $600 per life-year gained over this time horizon. Similar results were found for the lifetime horizon when evaluated in terms of cost per QALY gained; the cost per life year gained was $700 for medical therapy alone. Similar results were found in additional sensitivity analyses.

WA - Health Technology Assessment December 11, 2015
Cardiac Stents – Re-Review: Final Evidence Report Page 187
5.4. Key Question 2a: Primary Efficacy Outcomes for Newer Generation DES compared with BMS for Stable or Unstable CAD
Outcome Number of Studies (N)
Risk of Bias Indirectness Inconsistency Imprecision Reporting Bias
Graded Up for Additional Domains
Strength of Evidence
Absolute Risk Effect Size (95% CI) Conclusions
Mortality (all cause) cumulative to 12 months
4 RCTs (EXAMINATION, XIMA, ENDEAVOR II, ZEUS) (N = 5084)
No serious risk of bias
No serious indirectness
No serious inconsistency
No serious imprecision
undetected ⨁⨁⨁⨁ HIGH
DES 6.2%, BMS 5.9% RD 0.46% (-0.44% to 1.4%) RR 1.04 (0.84 to 1.28); Mortality up to 12 months was similar between DES and BMS groups
Mortality (all cause) cumulative with follow-up > 12 months to 48 months
3 RCTs (BASKET PROVE, EXAMINATION ENDEAVOR II) (N= 4204)
No serious risk of bias
No serious indirectness
No serious inconsistency
No serious imprecision
undetected ⨁⨁⨁⨁ HIGH
DES 4.1%, BMS 4.8% RD-0.98% (-2.4% to 0.4%) RR 0.85 (0.64 to 1.12); Mortality was similar between DES and BMS groups from 12 to 48 months
Mortality (all cause) cumulative at 36 months (women)
1 Individual patient data meta-analysis from RCT data (N = 6278)
Serious risk of bias (-2)
1
No serious indirectness
No serious inconsistency
Serious imprecision (-1)
2
undetected ⨁⨁◯◯ LOW
DES 5.3%, BMS 6.3% Mortality was similar for DES and BMS based on unadjusted Kaplan Meier estimates; adjusted effect size estimates were not reported.
Mortality (all cause) cumulative to 60 months
1 RCT (ENDEAVOR II) (N =1167)
No serious risk of bias
No serious indirectness
Unknown Serious imprecision (-1)
3
undetected ⨁⨁⨁◯ MODERATE
DES 6.2%, BMS 7.6 % RD -1.3% (-4.2% to 1.6%) RR 0.8 (0.5 to 1.3) No differences in cumulative all-cause mortality
Cardiac death at 12 months (cumulative)
4 RCTs (EXAMINATION, XIMA, ENDEAVOR, ZEUS) (N = 5084)
No serious risk of bias
No serious indirectness
No serious inconsistency
No serious imprecision
undetected ⨁⨁⨁⨁ HIGH
DES 4.1%, BMS 4.4% RD 0.09% (-0.44% to 1.4%) RR 1.04 (0.84, 1.28); At 12 months cumulative risk of cardiac death was similar for DES and BMS.
Cardiac death 2 RCTs (BASKET- Serious risk No serious No serious No serious undetected ⨁⨁⨁◯ DES 2.7%, BMS 3.3%

WA - Health Technology Assessment December 11, 2015
Cardiac Stents – Re-Review: Final Evidence Report Page 188
Outcome Number of Studies (N)
Risk of Bias Indirectness Inconsistency Imprecision Reporting Bias
Graded Up for Additional Domains
Strength of Evidence
Absolute Risk Effect Size (95% CI) Conclusions
(cumulative) at 24 months
PROVE, EXAMINATION) (N = 3037)
of bias (-1)1 indirectness inconsistency imprecision MODERATE RD -1.0% (-2.0% to 0%)
RR 0.8 (0.48 to 1.34); Cardiac death risk was similar for DES and BMS recipients.
Cardiac death at 24 months (excluding periprocedural events, i.e. ≤30 days)
1 RCT (EXAMINATION) (N =1498)
No serious risk of bias
No serious indirectness
Unknown Serious imprecision (-1)
4
undetected ⨁⨁⨁◯ MODERATE
DES 2.3 %, BMS 1.9% RD 0.4% (-0.4% to 1.8%) RR 1.2 (0.6 to 2.4); Risk of cardiac death was similar between DES and BMS at 24 months following exclusion of periprocedural events.
Cardiac death (cumulative) at 60 months
1 RCT (ENDEAVOR II) (N =1167)
No serious risk of bias
No serious indirectness
Unknown
Serious imprecision (-1)
4
undetected ⨁⨁⨁◯ MODERATE
DES 3.1%, BMS 3.6% RD -0.9% (-3.3% to 1.3%) RR 0.9 (0.5 to 1.6); Risk of cardiac death was similar for DES and BMS groups at 60 months
Myocardial infarction (any, 6 months) Octogenarians
1 RCT (XIMA) (N = 800)
Very serious risk of bias (-2)
1
No serious indirectness
Unknown Serious imprecision (-1)
3
undetected ⨁◯◯◯ INSUFFICIENT
Cumulative to 6 months DES 3.5%, BMS 7.7 % RD -4.2% (-7.4% to -1.0%) RR 0.5 (0.4 to 1.5); 1-6 months (excluding events ≤30 days) DES 1.0%, BMS 4.2% RD -3.2% (-5.4% to -1.0%) RR 0.2 (0.8 to 0.7); Cumulative risk of MI was less with use of DES compared with BMS in octogenarians at 6 months; Similarly risk of MI was less with DES after exclusion of

WA - Health Technology Assessment December 11, 2015
Cardiac Stents – Re-Review: Final Evidence Report Page 189
Outcome Number of Studies (N)
Risk of Bias Indirectness Inconsistency Imprecision Reporting Bias
Graded Up for Additional Domains
Strength of Evidence
Absolute Risk Effect Size (95% CI) Conclusions
periprocedural (<30 day) MI.
Myocardial infarction (any, cumulative) to 12 months.
3 RCTs (ZEUS, XIMA, EXAMINATION) (N = 3904)
Serious risk of bias (-2)
1
No serious indirectness
No serious inconsistency
Serious imprecision (-1)
3
undetected ⨁⨁◯◯ LOW
DES 2.6%, BMS 5.9 % RD -3.3 % (-7.2% to 0.6%) RR 0.44 (0.32 to 0.61); MI was less common when DES were employed compared with BMS, however the observed association was within the limits of chance given no true difference in risk. Some heterogeneity is noted which may be due to the individual study populations.
Myocardial infarction (any, 24 months)
1 RCT (EXAMINATION) (N =1498)
No serious risk of bias
No serious indirectness
Unknown No serious imprecision
undetected ⨁⨁⨁⨁ HIGH
Cumulative to 24 months DES 1.9%, BMS 2.4% RD -0.6% (-2.0% to 0.9%) RR 0.8 (0.4 to .15); Excluding events ≤ 30 days DES 1.2%%, BMS 1.2% RD -0.1% (-1.1% to 1.1% ) RR 1.0 (0.4 to 2.5); At 24 months, there was no difference in risk of any MI between DES and BMS groups, when cumulative events were considered or when periprocedural events were excluded.
Myocardial infarction, cumulative at 36 months (women)
1 Individual patient data meta-analysis of RCT data (N = 6278)
Very serious risk of bias (-2)
1
No serious indirectness
Unknown Serious imprecision (-1)
2
undetected ⨁⨁◯◯
LOW
DES 4.8% vs. BMS 7.7% Risk of MI was lower in women receiving DES compared with those

WA - Health Technology Assessment December 11, 2015
Cardiac Stents – Re-Review: Final Evidence Report Page 190
Outcome Number of Studies (N)
Risk of Bias Indirectness Inconsistency Imprecision Reporting Bias
Graded Up for Additional Domains
Strength of Evidence
Absolute Risk Effect Size (95% CI) Conclusions
receiving BMS (p-value, 0.03) based on unadjusted Kaplan Meier estimates; adjusted effect size estimates were not reported
Myocardial infarction - Target Vessel (12 months)
2 RCTs (EXAMINATION, ENDEAVOR II) (N = 2665)
No serious risk of bias
No serious indirectness
No serious inconsistency
No serious imprecision
undetected ⨁⨁⨁⨁ HIGH
Cumulative (2 trials) EXAMINATION DES 1.1%, BMS 2.0% RD -0.9 % (-2.2% to 0.3%) ENDEAVOR II DES 2.7%, BMS 3.9% RD -1.2% (-3.2% to 0.9%) Excluding events ≤30 days (1 trial) EXAMINATION DES 0.4%, BMS 0.8% RD -0.4% (-1.2% to 0.4%) Risk of target vessel MI was similar between DES and BMS recipients up to 12 months across 2 trials and remained similar following exclusion of periprocedural events (≤ 30days) in one trial.
Myocardial infarction - Target Vessel (>12 months)
2 RCTs (EXAMINATION, ENDEAVOR II) (N = 2665)
No serious risk of bias
No serious indirectness
No serious inconsistency
No serious imprecision
undetected ⨁⨁⨁⨁ HIGH
Cumulative (2 trials) EXAMINATION 24 months DES 1.5%, BMS 2.1% RD -0.7 % (-2.0% to 0.7%) ENDEAVOR II (60 months) DES 3.8%, BMS 4.8% RD -1.0% (-3.3% to 1.3%) Excluding events ≤30 days

WA - Health Technology Assessment December 11, 2015
Cardiac Stents – Re-Review: Final Evidence Report Page 191
Outcome Number of Studies (N)
Risk of Bias Indirectness Inconsistency Imprecision Reporting Bias
Graded Up for Additional Domains
Strength of Evidence
Absolute Risk Effect Size (95% CI) Conclusions
(1 trial) EXAMINATION 24 months DES 0.8%, BMS 0.9% RD -0.q% (-1.1% to 0.8%) Risk of target vessel MI was similar between DES and BMS recipients up to 24 months in one trial and remained similar following exclusion of periprocedural events (≤ 30days) in that same trial. Similarly, there were no differences at 60 months in the other trial.
Myocardial infarction - Q-wave MI (target vessel, cumulative)
1 RCT (ENDEAVOR II) N = 1167
No serious risk of bias
No serious indirectness
Unknown No serious imprecision
undetected ⨁⨁⨁⨁ HIGH
12 Months DES 0.3%, BMS 0.8% RD -0.5 % (-1.4% to 0.3%) RR 0.4 (0.8 to 2.1); 60 months DES 0.3%, BMS 1.2% RD -0.9% (-1.9% to 0.2%) RR 0.3 (0.1 to 1.4) There were no differences between DES and BMS in Q-wave MI at either 12 or 60 months
Myocardial infarction - non-Q-wave MI (in target vessel, cumulative)
1 RCT (ENDEAVOR II) N = 1167
No serious risk of bias
No serious indirectness
Unknown No serious imprecision
undetected ⨁⨁⨁⨁ HIGH
12 Months DES 2.4%, BMS 3.1% RD -0.7 % (-2.5% to 1.2%) RR 0.8 (0.4 to 1.5); 60 months DES 3.5%, BMS 3.6% RD -0.1% (-2.3% to 2.0%)

WA - Health Technology Assessment December 11, 2015
Cardiac Stents – Re-Review: Final Evidence Report Page 192
Outcome Number of Studies (N)
Risk of Bias Indirectness Inconsistency Imprecision Reporting Bias
Graded Up for Additional Domains
Strength of Evidence
Absolute Risk Effect Size (95% CI) Conclusions
RR 1.0 (0.5 to 1.8) There were no differences between DES and BMS in non-Q-wave MI at either 12 or 60 months
Nonfatal MI (cumulative) 24months
1 RCT (BASKET-PROVE N = 1539)
Very serious risk of bias (-2)
1
No serious indirectness
No serious inconsistency
No serious imprecision
undetected ⨁⨁◯◯ LOW
DES 1.7%, BMS 2.6% RD -0.9% (-2.4% to 0.5%) RR 0.6 (0.3 to 1.3); Nonfatal MI risk was similar between DES and BMS groups at 24 months in one trial
Nonfatal MI (cumulative) 48 months
1 RCT (ENDEAVOR II) N = 1167
No serious risk of bias
No serious indirectness
No serious inconsistency
No serious imprecision
undetected ⨁⨁⨁⨁ HIGH
DES 3.3%, BMS 4.5% RD -1.2 % (-3.4% to 1.0%) RR 0.7 (0.4 to 1.3); Nonfatal MI risk was similar between DES and BMS groups at 48 months in one trial
Target lesion revascularization to 12 months
3 RCTs (EXAMINATION, ENDEAVOR II, ZEUS) (N= 4284)
No serious risk of bias
Serious indirectness (-1)
5
No serious inconsistency
No serious imprecision
undetected ⨁⨁⨁◯ MODERATE
DES 4.3%, BMS 9.2% RD -4.8% (-7.4% to - 2.1%) I2 = 68% RR 0.47 (0.37 to 0 .60); At 12 months, significantly fewer DES recipients required revascularization compared with BMS recipients.
Target lesion revascularization to 24 months
2 RCTs (EXAMINATION, PRODIGY (N = 2996)
No serious risk of bias
Serious indirectness (-1)
5
Serious Inconsistency (-1)
Serious imprecision (-1)
3
undetected ⨁⨁◯◯ LOW
DES 6.1 %, BMS 10.2% RD -5.5% (-12.2% to 1.2%) RR 0.5 (0.39 to 0.64); Although TLR was less common with DES use compared with BMS, the risk difference was not

WA - Health Technology Assessment December 11, 2015
Cardiac Stents – Re-Review: Final Evidence Report Page 193
Outcome Number of Studies (N)
Risk of Bias Indirectness Inconsistency Imprecision Reporting Bias
Graded Up for Additional Domains
Strength of Evidence
Absolute Risk Effect Size (95% CI) Conclusions
statistically significant at 24 months. Differences in patient populations may partially explain heterogeneity.
Target lesion revascularization to 36 months (Women)
1 Individual patient data meta-analysis (N = 6278)
Serious risk of bias (-1)
1
Serious indirectness
No serious inconsistency
No serious imprecision
undetected ⨁⨁◯◯ LOW
HR 0.44, 95% CI 0.31 to 0.64 Target-lesion revascularization was significantly less common in women receiving newer-generation DES compared with those receiving BMS at three years based on analyses adjusted for difference in baseline factors.
Target vessel revasucularization to 12 months
5 RCTs (EXAMINATION, ENDEAVOR II, XIMA, PRODIGY ZEUS) (N = 6582)
Serious risk of bias (-1)
1
Serious indirectness (-1)
5
No serious inconsistency
No serious imprecision
undetected ⨁⨁◯◯ LOW
DES 5.7%, BMS 10.6 % RD -5.1% (-6.6% to -3.5%) RR 0.51 (CI 0.43 to 0.61); TVR was significantly less common in DES recipients comapred with BMS recipients.
Target vessel revasucularization to 24 months
3 RCTs (BASKET-PROVE, EXAMINATION, PRODIGY (N = 4535)
Serious risk of bias (-1)
1
Serious indirectness (-1)
5
Serious Inconsistency
Serious imprecision (-1)
3
undetected ⨁◯◯◯ INSUFFICIENT
DES 5.3%, BMS 7.0% RD -3.1%, -7.8% to 1.5% RR 0.65 (0.41 to 1.0); Based on pooled risk difference, the observed association was within the limits of chance given no true difference in risk.
1. Serious risk of bias: the study violated one or more of the criteria for good quality RCT related to the outcome reported (see Appendix for details)
2. Serious imprecision: Effect estimates are not provided

WA - Health Technology Assessment December 11, 2015
Cardiac Stents – Re-Review: Final Evidence Report Page 194
3. Serious imprecision: wide confidence interval
4. Serious imprecision: single study
5. Serious indirectness: TLR/TVR are considered indirect/intermediate outcome
5.5. Key Question 2b: Safety Outcomes for Newer Generation DES compared with BMS for Stable or Unstable CAD
Outcome Number of Studies (N)
Study Limitations
Indirectness Inconsistency Imprecision Reporting Bias
Graded Up for Additional Domains
Strength of Evidence
Conclusions, Effect Size
Definite stent thrombosis ≤30 days
3 RCTs (XMAN, EXAMINATION, XIMA) (N = 2405)
Serious risk of bias (-1)
1
No serious indirectness
Serious Inconsistency (-1)
6
Serious imprecision (-1)7
undetected ⨁⨁◯◯ LOW
DES 0.4%, BMS 1.1% RD 0% (-2.0% to 1.0%) RR 0.95 (0.14 to 6.48); A difference between DES and BMS was not detected likely due to lack of power. Estimates for individual trials were somewhat inconsistent, perhaps due to differences in populations.
Definite stent thrombosis ≤30 days STEMI
2 Registry studies (Garg, N = 1939); Sarno 2014, patients at risk 29,500)
Serious risk of bias (-2)
1
No serious indirectness
No serious inconsistency
No serious imprecision
undetected ⨁◯◯◯ INSUFFICIENT
DES (0.5% to 1.0%); BMS (0.9% to 1.7%) Risk of definite stent thrombosis appears to be similar between DES and BMS across two studies, however, neither provided effect sizes and one reported p=0.20.
Definite stent thrombosis 1-12 months
2 RCTs (XIMA, EXAMINATION) N = 2298
No serious risk of bias
No serious indirectness
No serious inconsistency
Serious imprecision (-1)
7
⨁⨁◯◯ LOW
DES 0.2 %, BMS 0.2% RD 0% This outcome was rare. There may be insufficient power to detect differences between DES and BMS in these trials.

WA - Health Technology Assessment December 11, 2015
Cardiac Stents – Re-Review: Final Evidence Report Page 195
Outcome Number of Studies (N)
Study Limitations
Indirectness Inconsistency Imprecision Reporting Bias
Graded Up for Additional Domains
Strength of Evidence
Conclusions, Effect Size
Definite stent thrombosis cumulative to 12 months
2 RCTS (XIMA, ZEUS) N = 1306
Serious risk of bias (-1)
1
No serious indirectness
Serious Inconsistency (-1)
Serious imprecision (-1)
3
undetected ⨁◯◯◯ INSUFFICIENT
DES 0.8%, BMS 1.5% RD 0% (-2.0% to 2.0 %) RR 0.95 (0.1 to 8.79); Effect estimates for the trials were in opposite directions, but each individually was within the limits of chance given no true difference in risk as was the pooled RD. Inconsistency in effect estimates may be due to clinical differences in these populations. Sample size may be insufficient to detect differences for this rare outcome.
Definite stent thrombosis (women only) *Cumulative to 12 months *12 to 36 months
1 Individual patient data meta-analysis of RCT data (N = 6278)
Very serious risk of bias (-1)
1
No serious indirectness
Unknown Serious imprecision (-1)
2
undetected ⨁⨁◯◯ LOW
Cumulative to 12 months DES 0.5 %, BMS 0.6% 12 months to 36 months DES 0.07%, BMS 0.3%; Risks between DES and BMS are based on unadjusted Kaplan-Meier estimates; adjusted effect size estimates were not provided and there were substantial baseline differences between groups. Although risks appear similar for DES and BMS, author report p-values of 0.007 and 0.002 for the 12 month and 12-36 month estimates

WA - Health Technology Assessment December 11, 2015
Cardiac Stents – Re-Review: Final Evidence Report Page 196
Outcome Number of Studies (N)
Study Limitations
Indirectness Inconsistency Imprecision Reporting Bias
Graded Up for Additional Domains
Strength of Evidence
Conclusions, Effect Size
respectively. It is not clear if the risk differences are clinically important.
Definite stent thrombosis cumulative to 24 months
2 RCTs (BASKET-PROVE, EXAMINATION), (n= 3037)
Serious risk of bias (-1)
1
No serious indirectness
No serious inconsistency
Serious imprecision (-1)
7
undetected ⨁⨁◯◯ LOW
DES 0.5%, BMS 1.5% RD -1.0%, (-2.0% to 0%) RR 0.36 (0.16 to 0.81) Effect estimates for each trial were within the limits of chance given no true difference in risk as was the pooled risk difference estimate; sample size may be inadequate to demonstrate statistical difference.
All-cause mortality ≤30 days
2 RCTs (XIMA, EXAMINATION) N = 2298
No serious risk of bias
No serious indirectness
No serious inconsistency
Serious imprecision (-1)
7
undetected ⨁⨁⨁◯ MODERATE
DES 1.5%, BMS 1.7% RD -0.15% (-1.2% to 0.86%) RR 0.89(0.46 to 1.7); Periprocedural (≤ 30 day) all-cause mortality was in similar in the DES and BMS groups.
Cardiac mortality ≤30 days
2 RCTs (XIMA, EXAMINATION) N = 2298
No serious risk of bias
No serious indirectness
No serious inconsistency
Serious imprecision (-1)
7
undetected ⨁⨁⨁◯ MODERATE
DES 1.1 %, BMS 1.6% RD -0.37% (-1.2% to 0.48%) RR 0.72 (0.36 to 1.46); Periprocedural (≤ 30 day) cardiac mortality was in similar in the DES and BMS groups.
Myocardial infarction ≤30 days
2 RCTs (XIMA, EXAMINATION) N = 2298
No serious risk of bias
No serious indirectness
No serious inconsistency
Serious imprecision (-1)
7
⨁⨁⨁◯
MODERATE
DES 1.3%, BMS 2.0% RD -0.60% (-1.5% to 0.30%) RR 0.66 (95% CI 0.19, 1.25); Periprocedural (≤ 30 day) MI was in similar in the DES and BMS groups

WA - Health Technology Assessment December 11, 2015
Cardiac Stents – Re-Review: Final Evidence Report Page 197
Outcome Number of Studies (N)
Study Limitations
Indirectness Inconsistency Imprecision Reporting Bias
Graded Up for Additional Domains
Strength of Evidence
Conclusions, Effect Size
Re-infarction ≤30 days (nonrandomized studies)
1 Registry study (Garg, N = 1939)
Serious risk of bias (-1)
1
No serious indirectness
Unknown No serious imprecision
undetected ⨁◯◯◯ INSUFFICIENT
One registry study reported no difference between DES and BMS groups for re-infarction ≤30 day in patients with STEMI (1.4% versus 2.1%, p = 0.23)
41;
effect size was not reported.
Stroke (Any) Cumulative ≤30 days; (Octogenarians)
1 RCT (XIMA) (N=800)
Serious risk of bias (-1)
1
No serious indirectness
Unknown Serious imprecision (-1)
7
undetected ⨁⨁◯◯ LOW
DES 0%, BMS 0.8% RD 0.8%, p=0.08 RR (NC) Periprocedural stroke was rare, occurring in only 3 patients (BMS) ; it is likely that differences between groups was not detected due to low power.
Stroke (Any) 6 months and 12 months (Octogenarians)
1 RCT (XIMA) (N=800)
Serious risk of bias (-1)
1
No serious indirectness
Unknown Serious imprecision (-1)
7
undetected ⨁⨁◯◯ LOW
Cumulative 6 month DES 1.0 %, BMS 0.7%; RD 0.3% (-1.0% to 1.6%) 6 month excluding events ≤30 days DES 1.0 %, BMS 0%; RD 1.0%; p =0.04; Cumulative 12 months: DES 1.5%, BMS 1.2%; RD 0.3% (-1.4% to 1.9%) 12 months excluding events ≤30 days DES 1.5%, BMS 0.5%; RD 0.5% (-0.4% to 2.4%) Cumulative stroke risk was similar between groups at six months; after exclusion of periprocedural stroke,

WA - Health Technology Assessment December 11, 2015
Cardiac Stents – Re-Review: Final Evidence Report Page 198
Outcome Number of Studies (N)
Study Limitations
Indirectness Inconsistency Imprecision Reporting Bias
Graded Up for Additional Domains
Strength of Evidence
Conclusions, Effect Size
although statistically significant, it is not clear whether the 1% RD is clinically significant. No differences were seen between DES and BMS at 12 months, regardless of exclusion of periprocedural events. Stroke was rare across time frames and sample size was likely too small to detect stable differences between stent types.
Stroke (Any) Cumulative to 48 Months
1 RCT (ENDEAVOR II), (N=1167)
No serious risk of bias
No serious indirectness
Unknown Serious imprecision (-1)
7
undetected ⨁⨁⨁◯ MODERATE
DES 1.7 %, BMS 1.5% RD -1.2% (-3.4% to 1.0%) RR 0.7 (0.4 to 1.3); Risk of stroke at 48 months was similar between DES and BMS groups. There may have been insufficient power to detect differences between groups.
Ischemic Stroke 1 RCT at 6 months (XIMA, N = 800); 2 RCTs at 12 months (XIMA, ZEUS, N =
Serious risk of bias (-1)
1
No serious indirectness
No serious inconsistency
Serious imprecision (-1)
7
undetected ⨁⨁◯◯
LOW
Ischemic Stroke 6 months (Cumulative): DES 0.8%, BMS 0.7%; RD 0% (-1.2% to 1.2%) RD following exclusion of events ≤30 days: DES 0.8%, BMS 0% Ischemic stroke 12 months (Cumulative, 2 trials) DES range 0.8% to1.1%, BMS range 0%to 1.5%; RDs were similar for both

WA - Health Technology Assessment December 11, 2015
Cardiac Stents – Re-Review: Final Evidence Report Page 199
Outcome Number of Studies (N)
Study Limitations
Indirectness Inconsistency Imprecision Reporting Bias
Graded Up for Additional Domains
Strength of Evidence
Conclusions, Effect Size
trials -0.3% (-1.5% to 1.0%) and -0.4% (-1.5% to 0.7%) There were no differences between DES and BMS were observed at either 6 or 12 months when ischemic stroke was evaluated separately or when periprocedural events were excluded from the analysis if ischemic stroke in the trial among octogenarians; Failure to detect differences between treatment may be due to lack of power
Major bleeding (any time)
4 RCTs (XIMA, XMAN, EXAMINATION, ZEUS) (N=4054)
Serious risk of bias (-1)
1
No serious indirectness
No serious inconsistency
No serious imprecision
undetected ⨁⨁⨁◯ MODERATE
DES 0.9%, BMS 1.4% RD -0.44% (-1.1% to 0.18%) RR 0.64 (0.36, 1.16); The risk of major bleeding was similar between groups across studies and time frames
Stent Fracture and mechanical complications
5 case series (N range 136 to 1035)
Very serious risk of bias
Serious indirectness
Unknown No serious imprecision
undetected ⨁◯◯◯
INSUFFICIENT
Comparative data for were not available; Complete or partial stent fracture across three studies ranged from 2.6% to 3.8% of patients (2.0% to 2.9% of lesions) over 6 to 15 months of follow-up; all patients received an everolimus-eluting stent. The incidence of stent strut fracture was 8.1% (6.2% of lesions) over

WA - Health Technology Assessment December 11, 2015
Cardiac Stents – Re-Review: Final Evidence Report Page 200
Outcome Number of Studies (N)
Study Limitations
Indirectness Inconsistency Imprecision Reporting Bias
Graded Up for Additional Domains
Strength of Evidence
Conclusions, Effect Size
a mean 15-month period in one case series (N=136).Longitudinal stent deformation (mix of everolimus- and zotarolimus-eluting stents) and ranged from 1.4% to 1.5% patients over 6 to 15 month follow-up in two studies (N = 136 and 1000) and from 0.2% to 1.1% of lesions over 15 to 48 month follow-up two studies (N = 177 and 4585). All studies associated mechanical complications such as stent fracture and longitudinal stent deformation to an increased risk of stent thrombosis
1. Serious risk of bias: the study violated one or more of the criteria for good quality RCT related to the outcome reported (see Appendix for details)
2. Serious imprecision: Effect estimates are not provided
3. Serious imprecision: wide confidence interval
4. Serious imprecision: single study
5. Serious indirectness: TLR/TVR are considered indirect/intermediate outcome
6. Serious inconsistency: Effect sizes are in different directions
7. Serious imprecision: sample size inadequate

WA - Health Technology Assessment December 11, 2015
Cardiac Stents – Re-Review: Final Evidence Report Page 201
5.6. Key Question 2c: Differential Efficacy and Safety for Newer Generation DES compared with BMS for Stable or Unstable CAD
Only one study in patients with STEMI (N = 1498) reported post-hoc analysis on the effect of age (≥75 vs. <75 years) finding no evidence of modification for primary outcomes of all-cause death (interaction p=0.092), cardiac death (interaction p= 0.277), and bleeding (interaction p=0.75) through 12 months (LOW evidence).55 Post-hoc analyses from three RCTs evaluated modification of treatment effect by various demographic and clinical factors on composite outcomes as did one meta-analysis of individual patient data. As composites were not considered as primary outcome for this report, they are not summarized here but are described in the report.
5.7. Key Question 2d: Cost-effectiveness Outcoms for Newer Generation DES compared with BMS for Stable or Unstable CAD
Population Interventions Studies Time Horizon
Countries QHES Range Overall Quality of Evidence
Conclusions
General DES (zotarolimus) BMS
ENDEAVOR II (Einstein)2009 4 year horizon
United States
87/100 Moderate Survival and quality-adjusted survival at 4 years were not statistically different among groups. Incremental cost-effectiveness ratios could not be calculated as there were no significant differences in key elements of these ratios. Briefly, compared with BMS, DES reduced TVR through 4-years of follow-up with no difference in cumulative medical costs and was associated with nonsignificant differences in discounted survival and quality-adjusted survival. . There was substantial variability (i.e., large confidence intervals) for cost and quality adjusted survival estimates.

WA - Health Technology Assessment December 11, 2015
Cardiac Stents – Re-Review: Final Evidence Report Page 202
References 1. Levels of evidence and grades of recommendation. (Accessed July 23, 2015, at
http://www.cebm.net/wp-content/uploads/2014/06/CEBM-Levels-of-Evidence-2.1.pdf.)
2. Alexander KP, Newby LK, Armstrong PW, et al. Acute coronary care in the elderly, part II: ST-segment-elevation myocardial infarction: a scientific statement for healthcare professionals from the American Heart Association Council on Clinical Cardiology: in collaboration with the Society of Geriatric Cardiology. Circulation 2007;115:2570-89.
3. Alexander KP, Newby LK, Cannon CP, et al. Acute coronary care in the elderly, part I: Non-ST-segment-elevation acute coronary syndromes: a scientific statement for healthcare professionals from the American Heart Association Council on Clinical Cardiology: in collaboration with the Society of Geriatric Cardiology. Circulation 2007;115:2549-69.
4. Amsterdam EA, Wenger NK, Brindis RG, et al. 2014 AHA/ACC Guideline for the Management of Patients with Non-ST-Elevation Acute Coronary Syndromes: a report of the American College of Cardiology/American Heart Association Task Force on Practice Guidelines. J Am Coll Cardiol 2014;64:e139-228.
5. Anderson C, Laubscher S, Burns R. Validation of the Short Form 36 (SF-36) health survey questionnaire among stroke patients. Stroke; a journal of cerebral circulation 1996;27:1812-6.
6. Anderson JL, Adams CD, Antman EM, et al. ACC/AHA 2007 guidelines for the management of patients with unstable angina/non-ST-Elevation myocardial infarction: a report of the American College of Cardiology/American Heart Association Task Force on Practice Guidelines (Writing Committee to Revise the 2002 Guidelines for the Management of Patients With Unstable Angina/Non-ST-Elevation Myocardial Infarction) developed in collaboration with the American College of Emergency Physicians, the Society for Cardiovascular Angiography and Interventions, and the Society of Thoracic Surgeons endorsed by the American Association of Cardiovascular and Pulmonary Rehabilitation and the Society for Academic Emergency Medicine. J Am Coll Cardiol 2007;50:e1-e157.
7. Antman EM, Anbe DT, Armstrong PW, et al. ACC/AHA guidelines for the management of patients with ST-elevation myocardial infarction--executive summary. A report of the American College of Cardiology/American Heart Association Task Force on Practice Guidelines (Writing Committee to revise the 1999 guidelines for the management of patients with acute myocardial infarction). J Am Coll Cardiol 2004;44:671-719.
8. Antman EM, Hand M, Armstrong PW, et al. 2007 Focused Update of the ACC/AHA 2004 Guidelines for the Management of Patients With ST-Elevation Myocardial Infarction: a report of the American College of Cardiology/American Heart Association Task Force on Practice Guidelines: developed in collaboration With the Canadian Cardiovascular Society endorsed by the American Academy of Family Physicians: 2007 Writing Group to Review New Evidence and Update the ACC/AHA 2004 Guidelines for the Management of Patients With ST-Elevation Myocardial Infarction, Writing on Behalf of the 2004 Writing Committee. Circulation 2008;117:296-329.
9. Atkins D, Best D, Briss PA, et al. Grading quality of evidence and strength of recommendations. Bmj 2004;328:1490.

WA - Health Technology Assessment December 11, 2015
Cardiac Stents – Re-Review: Final Evidence Report Page 203
10. Bangalore S, Kumar S, Fusaro M, et al. Outcomes with various drug eluting or bare metal stents in patients with diabetes mellitus: mixed treatment comparison analysis of 22,844 patient years of follow-up from randomised trials. Bmj 2012;345:e5170.
11. Bangalore S, Pursnani S, Kumar S, Bagos PG. Percutaneous coronary intervention versus optimal medical therapy for prevention of spontaneous myocardial infarction in subjects with stable ischemic heart disease. Circulation 2013;127:769-81.
12. BARI 2D Study Group, Frye RL, August P, et al. A randomized trial of therapies for type 2 diabetes and coronary artery disease. N Engl J Med 2009;360:2503-15.
13. Berkman ND LK, Ansari M, al. e. Grading the Strength of a Body of Evidence When Assessing Health Care Interventions for the Effective Health Care Program of the Agency for Healthcare Research and Quality: An Update. 2013.
14. Boden WE, O'Rourke R A, Teo KK, et al. Design and rationale of the Clinical Outcomes Utilizing Revascularization and Aggressive DruG Evaluation (COURAGE) trial Veterans Affairs Cooperative Studies Program no. 424. Am Heart J 2006;151:1173-9.
15. Boden WE, O'Rourke RA, Teo KK, et al. Optimal medical therapy with or without PCI for stable coronary disease. N Engl J Med 2007;356:1503-16.
16. Boden WE, O'Rourke RA, Teo KK, et al. Impact of optimal medical therapy with or without percutaneous coronary intervention on long-term cardiovascular end points in patients with stable coronary artery disease (from the COURAGE Trial). The American journal of cardiology 2009;104:1-4.
17. Bradley SM, Bohn CM, Malenka DJ, et al. Temporal Trends in Percutaneous Coronary Intervention Appropriateness: Insights from the Clinical Outcomes Assessment Program. Circulation 2015:CIRCULATIONAHA. 114.015156.
18. Bradley SM, Rao SV, Curtis JP, et al. Change in hospital-level use of transradial percutaneous coronary intervention and periprocedural outcomes: insights from the national cardiovascular data registry. Circulation Cardiovascular quality and outcomes 2014;7:550-9.
19. Braunwald E, Antman EM, Beasley JW, et al. ACC/AHA guidelines for the management of patients with unstable angina and non-ST-segment elevation myocardial infarction: executive summary and recommendations. A report of the American College of Cardiology/American Heart Association task force on practice guidelines (committee on the management of patients with unstable angina). Circulation 2000;102:1193-209.
20. Braunwald E, Antman EM, Beasley JW, et al. ACC/AHA guideline update for the management of patients with unstable angina and non-ST-segment elevation myocardial infarction--2002: summary article: a report of the American College of Cardiology/American Heart Association Task Force on Practice Guidelines (Committee on the Management of Patients With Unstable Angina). Circulation 2002;106:1893-900.
21. Brooks MM, Chaitman BR, Nesto RW, et al. Clinical and angiographic risk stratification and differential impact on treatment outcomes in the Bypass Angioplasty Revascularization Investigation 2 Diabetes (BARI 2D) trial. Circulation 2012;126:2115-24.
22. Brooks MM, Chung SC, Helmy T, et al. Health status after treatment for coronary artery disease and type 2 diabetes mellitus in the Bypass Angioplasty Revascularization Investigation 2 Diabetes trial. Circulation 2010;122:1690-9.

WA - Health Technology Assessment December 11, 2015
Cardiac Stents – Re-Review: Final Evidence Report Page 204
23. Bypass Angioplasty Revascularization Investigation 2 Diabetes Study G. Baseline characteristics of patients with diabetes and coronary artery disease enrolled in the Bypass Angioplasty Revascularization Investigation 2 Diabetes (BARI 2D) trial. Am Heart J 2008;156:528-36, 36 e1-5.
24. Center for Health Statistics: Washington State Department of Health. Mortality Table C2: Leading Causes of Death for Residents, 2014. In: Mortality C Leading Causes of Death Overview and Selected Causes of Death Tables 1980 - 2014, ed. Washington: Washington State Department of Health; 2015.
25. Chaitman BR, Hardison RM, Adler D, et al. The Bypass Angioplasty Revascularization Investigation 2 Diabetes randomized trial of different treatment strategies in type 2 diabetes mellitus with stable ischemic heart disease: impact of treatment strategy on cardiac mortality and myocardial infarction. Circulation 2009;120:2529-40.
26. Chaitman BR, Hartigan PM, Booth DC, et al. Do major cardiovascular outcomes in patients with stable ischemic heart disease in the clinical outcomes utilizing revascularization and aggressive drug evaluation trial differ by healthcare system? Circulation Cardiovascular quality and outcomes 2010;3:476-83.
27. Chung SC, Hlatky MA, Faxon D, et al. The effect of age on clinical outcomes and health status BARI 2D (Bypass Angioplasty Revascularization Investigation in Type 2 Diabetes). J Am Coll Cardiol 2011;58:810-9.
28. Dagenais GR, Lu J, Faxon DP, et al. Effects of optimal medical treatment with or without coronary revascularization on angina and subsequent revascularizations in patients with type 2 diabetes mellitus and stable ischemic heart disease. Circulation 2011;123:1492-500.
29. Dallmeijer AJ, de Groot V, Roorda LD, et al. Cross-diagnostic validity of the SF-36 physical functioning scale in patients with stroke, multiple sclerosis and amyotrophic lateral sclerosis: a study using Rasch analysis. Journal of rehabilitation medicine 2007;39:163-9.
30. de Belder A, de la Torre Hernandez JM, Lopez-Palop R, et al. A prospective randomized trial of everolimus-eluting stents versus bare-metal stents in octogenarians: the XIMA Trial (Xience or Vision Stents for the Management of Angina in the Elderly). J Am Coll Cardiol 2014;63:1371-5.
31. Desai NR, Bradley SM, Parzynski CS, et al. Appropriate Use Criteria for Coronary Revascularization and Trends in Utilization, Patient Selection, and Appropriateness of Percutaneous Coronary Intervention. Jama 2015;314:2045-53.
32. Dharma S, Wardeh AJ, Soerianata S, Firdaus I, Jukema JW. A Randomized Comparison between Everolimus-Eluting Stent and Cobalt Chromium Stent in Patients with Acute ST-Elevation Myocardial Infarction Undergoing Primary Percutaneous Coronary Intervention Using Routine Intravenous Eptifibatide: The X-MAN (Xience vs. Multi-Link Stent in Acute Myocardial Infarction) Trial, A Pilot Study. Int J Angiol 2014;23:93-100.
33. Eisenstein EL, Wijns W, Fajadet J, et al. Long-Term Clinical and Economic Analysis of the Endeavor Drug-Eluting Stent Versus the Driver Bare-Metal Stent. 4-Year Results From the ENDEAVOR II Trial (Randomized Controlled Trial to Evaluate the Safety and Efficacy of the Medtronic AVE ABT-578 Eluting Driver Coronary Stent in De Novo Native Coronary Artery Lesions). JACC: Cardiovascular Interventions 2009;2:1178-87.
34. Fajadet J, Wijns W, Laarman GJ, et al. Long-term follow-up of the randomised controlled trial to evaluate the safety and efficacy of the zotarolimus-eluting driver coronary stent in de novo native

WA - Health Technology Assessment December 11, 2015
Cardiac Stents – Re-Review: Final Evidence Report Page 205
coronary artery lesions: five year outcomes in the ENDEAVOR II study. EuroIntervention 2010;6:562-7.
35. Favarato D, Hueb W, Gersh BJ, et al. Relative cost comparison of treatments for coronary artery disease: the First Year Follow-Up of MASS II Study. Circulation 2003;108 Suppl 1:II21-3.
36. Favarato ME, Hueb W, Boden WE, et al. Quality of life in patients with symptomatic multivessel coronary artery disease: a comparative post hoc analyses of medical, angioplasty or surgical strategies-MASS II trial. Int J Cardiol 2007;116:364-70.
37. Feldman DN, Gade CL, Slotwiner AJ, et al. Comparison of outcomes of percutaneous coronary interventions in patients of three age groups (<60, 60 to 80, and >80 years) (from the New York State Angioplasty Registry). The American journal of cardiology 2006;98:1334-9.
38. Fihn SD, Blankenship JC, Alexander KP, et al. 2014 ACC/AHA/AATS/PCNA/SCAI/STS focused update of the guideline for the diagnosis and management of patients with stable ischemic heart disease: a report of the American College of Cardiology/American Heart Association Task Force on Practice Guidelines, and the American Association for Thoracic Surgery, Preventive Cardiovascular Nurses Association, Society for Cardiovascular Angiography and Interventions, and Society of Thoracic Surgeons. J Am Coll Cardiol 2014;64:1929-49.
39. Fihn SD GJ, Abrams J, Berra K, Blankenship JC, Dallas AP, Douglas PS, Foody JM, Gerber TC, Hinderliter AL, King SB III, Kligfield PD, Krumholz HM, Kwong RYK, Lim MJ, Linderbaum JA, Mack MJ, Munger MA, Prager RL, Sabik JF, Shaw LJ, Sikkema JD, Smith CR Jr, Smith SC Jr, Spertus JA, Williams SV. 2012 ACCF/AHA/ACP/AATS/PCNA/SCAI/STS guideline for the diagnosis and management of patients with stable ischemic heart disease: a report of the American College of Cardiology Foundation/American Heart Association Task Force on Practice Guidelines, and the American College of Physicians, American Association for Thoracic Surgery, Preventive Cardiovascular Nurses Association, Society for Cardiovascular Angiography and Interventions, and Society of Thoracic Surgeons. J Am Coll Cardiol 2012;60:2564-603.
40. Fraker TD, Jr., Fihn SD, Gibbons RJ, et al. 2007 chronic angina focused update of the ACC/AHA 2002 guidelines for the management of patients with chronic stable angina: a report of the American College of Cardiology/American Heart Association Task Force on Practice Guidelines Writing Group to develop the focused update of the 2002 guidelines for the management of patients with chronic stable angina. J Am Coll Cardiol 2007;50:2264-74.
41. Garg A, Brodie BR, Stuckey TD, et al. New generation drug-eluting stents for ST-elevation myocardial infarction: a new paradigm for safety. Catheter Cardiovasc Interv 2014;84:955-62.
42. Gibbons RJ, Abrams J, Chatterjee K, et al. ACC/AHA 2002 guideline update for the management of patients with chronic stable angina: a report of the American College of Cardiology/American Heart Association Task Force on Practice Guidelines (Committee to Update the 1999 Guidelines for the Management of Patients with Chronic Stable Angina). Available at www.acc.org/clinical/guidelines/stable/stable.pdf. 2002.
43. Gibbons RJ, Abrams J, Chatterjee K, et al. ACC/AHA 2002 guideline update for the management of patients with chronic stable angina--summary article: a report of the American College of Cardiology/American Heart Association Task Force on practice guidelines (Committee on the Management of Patients With Chronic Stable Angina). J Am Coll Cardiol 2003;41:159-68.
44. Gibbons RJ, Chatterjee K, Daley J, et al. ACC/AHA/ACP-ASIM guidelines for the management of patients with chronic stable angina: executive summary and recommendations. A Report of the

WA - Health Technology Assessment December 11, 2015
Cardiac Stents – Re-Review: Final Evidence Report Page 206
American College of Cardiology/American Heart Association Task Force on Practice Guidelines (Committee on Management of Patients with Chronic Stable Angina). Circulation 1999;99:2829-48.
45. Gomez-Lara J, Brugaletta S, Gomez-Hospital JA, et al. Everolimus-eluting stent versus bare metal stent in proximal left anterior descending ST-elevation myocardial infarction: insights from the EXAMINATION trial. Am Heart J 2013;166:119-26.
46. Guolo A. Higher-order likelihood inference in meta-analysis and meta-regression. Statistics in medicine 2012;31:313-27.
47. Hambrecht R, Walther C, Mobius-Winkler S, et al. Percutaneous coronary angioplasty compared with exercise training in patients with stable coronary artery disease: a randomized trial. Circulation 2004;109:1371-8.
48. Hardy RJ, Thompson SG. A likelihood approach to meta-analysis with random effects. Statistics in medicine 1996;15:619-29.
49. Hlatky MA, Boineau RE, Higginbotham MB, et al. A brief self-administered questionnaire to determine functional capacity (the Duke Activity Status Index). The American journal of cardiology 1989;64:651-4.
50. Hlatky MA, Boothroyd DB, Melsop KA, et al. Economic outcomes of treatment strategies for type 2 diabetes mellitus and coronary artery disease in the Bypass Angioplasty Revascularization Investigation 2 Diabetes trial. Circulation 2009;120:2550-8.
51. Hlatky MA, Rogers WJ, Johnstone I, et al. Medical care costs and quality of life after randomization to coronary angioplasty or coronary bypass surgery. Bypass Angioplasty Revascularization Investigation (BARI) Investigators. N Engl J Med 1997;336:92-9.
52. Hueb W, Lopes N, Gersh BJ, et al. Ten-year follow-up survival of the Medicine, Angioplasty, or Surgery Study (MASS II): a randomized controlled clinical trial of 3 therapeutic strategies for multivessel coronary artery disease. Circulation 2010;122:949-57.
53. Hueb W, Lopes NH, Gersh BJ, et al. Five-year follow-up of the Medicine, Angioplasty, or Surgery Study (MASS II): a randomized controlled clinical trial of 3 therapeutic strategies for multivessel coronary artery disease. Circulation 2007;115:1082-9.
54. Hueb W, Soares PR, Gersh BJ, et al. The medicine, angioplasty, or surgery study (MASS-II): a randomized, controlled clinical trial of three therapeutic strategies for multivessel coronary artery disease: one-year results. J Am Coll Cardiol 2004;43:1743-51.
55. Ielasi A, Brugaletta S, Silvestro A, et al. Everolimus-eluting stent versus bare-metal stent in elderly ((greater-than or equal to) 75 years) versus non-elderly (< 75 years) patients with ST-elevation myocardial infarction undergoing primary percutaneous coronary intervention: Insights from the examination trial. International Journal of Cardiology 2015;179:73-8.
56. Inaba S, Mintz GS, Yun KH, et al. Mechanical complications of everolimus-eluting stents associated with adverse events: an intravascular ultrasound study. EuroIntervention 2014;9:1301-8.
57. Jansen JP, Fleurence R, Devine B, et al. Interpreting indirect treatment comparisons and network meta-analysis for health-care decision making: report of the ISPOR Task Force on Indirect Treatment Comparisons Good Research Practices: part 1. Value in health : the journal of the International Society for Pharmacoeconomics and Outcomes Research 2011;14:417-28.

WA - Health Technology Assessment December 11, 2015
Cardiac Stents – Re-Review: Final Evidence Report Page 207
58. January CT, Wann LS, Alpert JS, et al. 2014 AHA/ACC/HRS guideline for the management of patients with atrial fibrillation: a report of the American College of Cardiology/American Heart Association Task Force on Practice Guidelines and the Heart Rhythm Society. J Am Coll Cardiol 2014;64:e1-76.
59. Jneid H, Anderson JL, Wright RS, et al. 2012 ACCF/AHA focused update of the guideline for the management of patients with unstable angina/non-ST-elevation myocardial infarction (updating the 2007 guideline and replacing the 2011 focused update): a report of the American College of Cardiology Foundation/American Heart Association Task Force on Practice Guidelines. J Am Coll Cardiol 2012;60:645-81.
60. Kaiser C, Galatius S, Erne P, et al. Drug-eluting versus bare-metal stents in large coronary arteries. N Engl J Med 2010;363:2310-9.
61. Kereiakes DJ, Choo JK, Young JJ, Broderick TM. Thrombosis and drug-eluting stents: a critical appraisal. Rev Cardiovasc Med 2004;5:9-15.
62. Kimble LP, Dunbar SB, Weintraub WS, et al. The Seattle angina questionnaire: reliability and validity in women with chronic stable angina. Heart disease 2002;4:206-11.
63. King SB, 3rd, Smith SC, Jr., Hirshfeld JW, Jr., et al. 2007 focused update of the ACC/AHA/SCAI 2005 guideline update for percutaneous coronary intervention: a report of the American College of Cardiology/American Heart Association Task Force on Practice guidelines. J Am Coll Cardiol 2008;51:172-209.
64. Kontopantelis E, Springate DA, Reeves D. A re-analysis of the Cochrane Library data: the dangers of unobserved heterogeneity in meta-analyses. PloS one 2013;8:e69930.
65. Kramer MC, Rittersma SZ, de Winter RJ, et al. Relationship of thrombus healing to underlying plaque morphology in sudden coronary death. J Am Coll Cardiol 2010;55:122-32.
66. Kuramitsu S, Hiromasa T, Enomoto S, et al. Incidence and Clinical Impact of Stent Fracture After PROMUS Element Platinum Chromium Everolimus-Eluting Stent Implantation. JACC Cardiovasc Interv 2015;8:1180-8.
67. Kuramitsu S, Iwabuchi M, Haraguchi T, et al. Incidence and clinical impact of stent fracture after everolimus-eluting stent implantation. Circ Cardiovasc Interv 2012;5:663-71.
68. Kushner FG, Hand M, Smith SC, Jr., et al. 2009 focused updates: ACC/AHA guidelines for the management of patients with ST-elevation myocardial infarction (updating the 2004 guideline and 2007 focused update) and ACC/AHA/SCAI guidelines on percutaneous coronary intervention (updating the 2005 guideline and 2007 focused update) a report of the American College of Cardiology Foundation/American Heart Association Task Force on Practice Guidelines. J Am Coll Cardiol 2009;54:2205-41.
69. Levine GN, Bates ER, Blankenship JC, et al. 2011 ACCF/AHA/SCAI Guideline for Percutaneous Coronary Intervention. A report of the American College of Cardiology Foundation/American Heart Association Task Force on Practice Guidelines and the Society for Cardiovascular Angiography and Interventions. J Am Coll Cardiol 2011;58:e44-122.
70. Levine GN, O'Gara PT, Bates ER, et al. 2015 ACC/AHA/SCAI Focused Update on Primary Percutaneous Coronary Intervention for Patients With ST-Elevation Myocardial Infarction: An Update of the 2011 ACCF/AHA/SCAI Guideline for Percutaneous Coronary Intervention and the 2013 ACCF/AHA Guideline for the Management of ST-Elevation Myocardial Infarction: A Report of

WA - Health Technology Assessment December 11, 2015
Cardiac Stents – Re-Review: Final Evidence Report Page 208
the American College of Cardiology/American Heart Association Task Force on Clinical Practice Guidelines and the Society for Cardiovascular Angiography and Interventions. J Am Coll Cardiol 2015.
71. Lima EG, Hueb W, Garcia RM, et al. Impact of diabetes on 10-year outcomes of patients with multivessel coronary artery disease in the Medicine, Angioplasty, or Surgery Study II (MASS II) trial. Am Heart J 2013;166:250-7.
72. Lin GA, Dudley RA. Fighting the “oculostenotic reflex”. JAMA internal medicine 2014;174:1621-2.
73. Lin GA, Dudley RA, Redberg RF. Cardiologists' use of percutaneous coronary interventions for stable coronary artery disease. Archives of internal medicine 2007;167:1604-9.
74. Lloyd-Jones D, Adams RJ, Brown TM, et al. Heart disease and stroke statistics--2010 update: a report from the American Heart Association. Circulation 2010;121:e46-e215.
75. Lopes NH, Paulitsch FS, Pereira AC, et al. Impact of metabolic syndrome on the outcome of patients with stable coronary artery disease: 2-year follow-up of the MASS II study. Coron Artery Dis 2008;19:383-8.
76. Lorig KR, Sobel DS, Stewart AL, et al. Evidence suggesting that a chronic disease self-management program can improve health status while reducing hospitalization: a randomized trial. Medical care 1999;37:5-14.
77. Lotfi A, Jeremias A, Fearon WF, et al. Expert consensus statement on the use of fractional flow reserve, intravascular ultrasound, and optical coherence tomography: a consensus statement of the Society of Cardiovascular Angiography and Interventions. Catheter Cardiovasc Interv 2014;83:509-18.
78. Mancini GB, Bates ER, Maron DJ, et al. Quantitative results of baseline angiography and percutaneous coronary intervention in the COURAGE trial. Circulation Cardiovascular quality and outcomes 2009;2:320-7.
79. Mancini GB, Hartigan PM, Bates ER, et al. Angiographic disease progression and residual risk of cardiovascular events while on optimal medical therapy: observations from the COURAGE Trial. Circ Cardiovasc Interv 2011;4:545-52.
80. Maron DJ, Boden WE, O'Rourke RA, et al. Intensive multifactorial intervention for stable coronary artery disease: optimal medical therapy in the COURAGE (Clinical Outcomes Utilizing Revascularization and Aggressive Drug Evaluation) trial. J Am Coll Cardiol 2010;55:1348-58.
81. Maron DJ, Boden WE, Spertus JA, et al. Impact of metabolic syndrome and diabetes on prognosis and outcomes with early percutaneous coronary intervention in the COURAGE (Clinical Outcomes Utilizing Revascularization and Aggressive Drug Evaluation) trial. J Am Coll Cardiol 2011;58:131-7.
82. National Center for Health Statistics. Mortality Multiple Cause Micro-Data Files, 2011. Public use data file and documentation. NHLBI tabulations.: National Center for Health Statistics; 2011.
83. Navarese EP, Andreotti F, Schulze V, et al. Optimal duration of dual antiplatelet therapy after percutaneous coronary intervention with drug eluting stents: meta-analysis of randomised controlled trials. Bmj 2015;350:h1618.
84. Newsome LT KM, Royster RL. Coronary artery stents: Part I. Evolution of percutaneous coronary intervention. Anesth Analg 2008;107:552-69.

WA - Health Technology Assessment December 11, 2015
Cardiac Stents – Re-Review: Final Evidence Report Page 209
85. Neyt M VBH, Devriese S, Mahieu J, De Ridder A, De Graeve D. . Drug Eluting Stents in Belgium: Health Technology Assessment (HTA). Bruxelles: Belgian Health Care Knowledge Centre (KCE) KCE reports 2007;66C (D/2007/10.273/49).
86. Nishimura RA, Otto CM, Bonow RO, et al. 2014 AHA/ACC guideline for the management of patients with valvular heart disease: a report of the American College of Cardiology/American Heart Association Task Force on Practice Guidelines. The Journal of thoracic and cardiovascular surgery 2014;148:e1-e132.
87. Nortvedt MW, Riise T, Myhr KM, Nyland HI. Performance of the SF-36, SF-12, and RAND-36 summary scales in a multiple sclerosis population. Medical care 2000;38:1022-8.
88. O'Gara PT, Kushner FG, Ascheim DD, et al. 2013 ACCF/AHA guideline for the management of ST-elevation myocardial infarction: executive summary: a report of the American College of Cardiology Foundation/American Heart Association Task Force on Practice Guidelines: developed in collaboration with the American College of Emergency Physicians and Society for Cardiovascular Angiography and Interventions. Catheter Cardiovasc Interv 2013;82:E1-27.
89. Ofman JJ, Sullivan SD, Neumann PJ, et al. Examining the value and quality of health economic analyses: implications of utilizing the QHES. Journal of managed care pharmacy : JMCP 2003;9:53-61.
90. Oxman AD, Guyatt GH. A consumer's guide to subgroup analyses. Annals of internal medicine 1992;116:78-84.
91. Palmerini T, Biondi-Zoccai G, Della Riva D, et al. Clinical outcomes with drug-eluting and bare-metal stents in patients with ST-segment elevation myocardial infarction: evidence from a comprehensive network meta-analysis. J Am Coll Cardiol 2013;62:496-504.
92. Patel MR, Dehmer GJ, Hirshfeld JW, et al. ACCF/SCAI/STS/AATS/AHA/ASNC/HFSA/SCCT 2012 appropriate use criteria for coronary revascularization focused update: a report of the American College of Cardiology Foundation Appropriate Use Criteria Task Force, Society for Cardiovascular Angiography and Interventions, Society of Thoracic Surgeons, American Association for Thoracic Surgery, American Heart Association, American Society of Nuclear Cardiology, and the Society of Cardiovascular Computed Tomography. The Journal of thoracic and cardiovascular surgery 2012;143:780-803.
93. Pedersen SH, Pfisterer M, Kaiser C, et al. Drug-eluting stents and bare metal stents in patients with NSTE-ACS: 2-year outcome from the randomised BASKET-PROVE trial. EuroIntervention 2014;10:58-64.
94. Piao ZH, Jeong MH, Li Y, et al. Comparison of second-generation drug-eluting versus bare-metal stents in octogenarian patients with ST-segment elevation myocardial infarction. Int J Cardiol 2014;177:1081-4.
95. Pignone M, Alberts MJ, Colwell JA, et al. Aspirin for primary prevention of cardiovascular events in people with diabetes: a position statement of the American Diabetes Association, a scientific statement of the American Heart Association, and an expert consensus document of the American College of Cardiology Foundation. Diabetes Care 2010;33:1395-402.
96. Pitney M, Pitney K, Jepson N, et al. Major stent deformation/pseudofracture of 7 Crown Endeavor/Micro Driver stent platform: incidence and causative factors. EuroIntervention 2011;7:256-62.

WA - Health Technology Assessment December 11, 2015
Cardiac Stents – Re-Review: Final Evidence Report Page 210
97. Puhan MA, Schunemann HJ, Murad MH, et al. A GRADE Working Group approach for rating the quality of treatment effect estimates from network meta-analysis. Bmj 2014;349:g5630.
98. Remak E, Manson S, Hutton J, Brasseur P, Olivier E, Gershlick A. Cost-effectiveness of the Endeavor stent in de novo native coronary artery lesions updated with contemporary data. EuroIntervention 2010;5:826-32.
99. Rezende PC, Hueb W, Garzillo CL, et al. Ten-year outcomes of patients randomized to surgery, angioplasty, or medical treatment for stable multivessel coronary disease: effect of age in the Medicine, Angioplasty, or Surgery Study II trial. The Journal of thoracic and cardiovascular surgery 2013;146:1105-12.
100. Rodriguez AE, Mieres J, Fernandez-Pereira C, et al. Coronary stent thrombosis in the current drug-eluting stent era: insights from the ERACI III trial. J Am Coll Cardiol 2006;47:205-7.
101. Rothberg MB, Sivalingam SK, Kleppel R, Schweiger M, Hu B, Sepucha KR. Informed Decision Making for Percutaneous Coronary Intervention for Stable Coronary Disease. JAMA internal medicine 2015.
102. Sabate M, Brugaletta S, Cequier A, et al. The EXAMINATION trial (Everolimus-Eluting Stents Versus Bare-Metal Stents in ST-Segment Elevation Myocardial Infarction): 2-year results from a multicenter randomized controlled trial. JACC Cardiovasc Interv 2014;7:64-71.
103. Sabate M, Cequier A, Iniguez A, et al. Everolimus-eluting stent versus bare-metal stent in ST-segment elevation myocardial infarction (EXAMINATION): 1 year results of a randomised controlled trial. Lancet 2012;380:1482-90.
104. Samsa G, Edelman D, Rothman ML, Williams GR, Lipscomb J, Matchar D. Determining clinically important differences in health status measures: a general approach with illustration to the Health Utilities Index Mark II. PharmacoEconomics 1999;15:141-55.
105. Sarno G, Lagerqvist B, Frobert O, et al. Lower risk of stent thrombosis and restenosis with unrestricted use of 'new-generation' drug-eluting stents: a report from the nationwide Swedish Coronary Angiography and Angioplasty Registry (SCAAR). Eur Heart J 2012;33:606-13.
106. Sarno G, Lagerqvist B, Nilsson J, et al. Stent thrombosis in new-generation drug-eluting stents in patients with STEMI undergoing primary PCI: a report from SCAAR. J Am Coll Cardiol 2014;64:16-24.
107. Sedlis SP, Hartigan PM, Teo KK, et al. Effect of PCI on Long-Term Survival in Patients with Stable Ischemic Heart Disease. N Engl J Med 2015;373:1937-46.
108. Sedlis SP, Jurkovitz CT, Hartigan PM, et al. Optimal medical therapy with or without percutaneous coronary intervention for patients with stable coronary artery disease and chronic kidney disease. The American journal of cardiology 2009;104:1647-53.
109. Sedlis SP, Jurkovitz CT, Hartigan PM, et al. Health status and quality of life in patients with stable coronary artery disease and chronic kidney disease treated with optimal medical therapy or percutaneous coronary intervention (post hoc findings from the COURAGE trial). The American journal of cardiology 2013;112:1703-8.
110. Serruys PW, Morice MC, Kappetein AP, et al. Percutaneous coronary intervention versus coronary-artery bypass grafting for severe coronary artery disease. N Engl J Med 2009;360:961-72.
111. Serruys PW, Unger F, Sousa JE, et al. Comparison of coronary-artery bypass surgery and stenting for the treatment of multivessel disease. N Engl J Med 2001;344:1117-24.

WA - Health Technology Assessment December 11, 2015
Cardiac Stents – Re-Review: Final Evidence Report Page 211
112. Shah B, Srinivas VS, Lu J, et al. Change in enrollment patterns, patient selection, and clinical outcomes with the availability of drug-eluting stents in the Bypass Angioplasty Revascularization Investigation 2 Diabetes trial. Am Heart J 2013;166:519-26.
113. Shaw LJ, Berman DS, Maron DJ, et al. Optimal medical therapy with or without percutaneous coronary intervention to reduce ischemic burden: results from the Clinical Outcomes Utilizing Revascularization and Aggressive Drug Evaluation (COURAGE) trial nuclear substudy. Circulation 2008;117:1283-91.
114. Shaw LJ, Weintraub WS, Maron DJ, et al. Baseline stress myocardial perfusion imaging results and outcomes in patients with stable ischemic heart disease randomized to optimal medical therapy with or without percutaneous coronary intervention. Am Heart J 2012;164:243-50.
115. Skelly A, Derleth, AM, Ecker, ED, Hashimoto, RE, Olson, CM, Dettori, JR. Cardiac stents: Comparison of drug eluting stents (DES) with bare metal stents (BMS). Health Technology Assessment. Olympia WA: Washington State Health Care Authority; Health Technology Assessment Program; 2009.
116. Smith SC, Jr., Dove JT, Jacobs AK, et al. ACC/AHA guidelines for percutaneous coronary intervention (revision of the 1993 PTCA guidelines)-executive summary: a report of the American College of Cardiology/American Heart Association task force on practice guidelines (Committee to revise the 1993 guidelines for percutaneous transluminal coronary angioplasty) endorsed by the Society for Cardiac Angiography and Interventions. Circulation 2001;103:3019-41.
117. Smith SC, Jr., Feldman TE, Hirshfeld JW, Jr., et al. ACC/AHA/SCAI 2005 guideline update for percutaneous coronary intervention: a report of the American College of Cardiology/American Heart Association Task Force on Practice Guidelines (ACC/AHA/SCAI Writing Committee to Update 2001 Guidelines for Percutaneous Coronary Intervention). Circulation 2006;113:e166-286.
118. Soares PR, Hueb WA, Lemos PA, et al. Coronary revascularization (surgical or percutaneous) decreases mortality after the first year in diabetic subjects but not in nondiabetic subjects with multivessel disease: an analysis from the Medicine, Angioplasty, or Surgery Study (MASS II). Circulation 2006;114:I420-4.
119. Spertus JA, McDonell M, Woodman CL, Fihn SD. Association between depression and worse disease-specific functional status in outpatients with coronary artery disease. Am Heart J 2000;140:105-10.
120. Spertus JA, Winder JA, Dewhurst TA, et al. Development and evaluation of the Seattle Angina Questionnaire: a new functional status measure for coronary artery disease. J Am Coll Cardiol 1995;25:333-41.
121. Stefanini GG, Baber U, Windecker S, et al. Safety and efficacy of drug-eluting stents in women: a patient-level pooled analysis of randomised trials. Lancet 2013;382:1879-88.
122. Stergiopoulos K, Boden WE, Hartigan P, et al. Percutaneous coronary intervention outcomes in patients with stable obstructive coronary artery disease and myocardial ischemia: a collaborative meta-analysis of contemporary randomized clinical trials. JAMA internal medicine 2014;174:232-40.
123. Stone GW, Hochman JS, Williams DO, et al. Medical Therapy With Versus Without Revascularization in Stable Patients With Moderate and Severe Ischemia: The Case for Community Equipoise. J Am Coll Cardiol 2015.

WA - Health Technology Assessment December 11, 2015
Cardiac Stents – Re-Review: Final Evidence Report Page 212
124. Teo KK, Sedlis SP, Boden WE, et al. Optimal medical therapy with or without percutaneous coronary intervention in older patients with stable coronary disease: a pre-specified subset analysis of the COURAGE (Clinical Outcomes Utilizing Revascularization and Aggressive druG Evaluation) trial. J Am Coll Cardiol 2009;54:1303-8.
125. Thom T HN, Rosamond W, et al. Heart disease and stroke statistics--2006 update: a report from the American Heart Association Statistics Committee and Stroke Statistics Subcommittee. Circulation 2006;113:e85-151.
126. Topol EJ, Serruys PW. Frontiers in interventional cardiology. Circulation 1998;98:1802-20.
127. Tsimikas S. Drug-eluting stents and late adverse clinical outcomes lessons learned, lessons awaited. J Am Coll Cardiol 2006;47:2112-5.
128. CYPHER™ Sirolimus-eluting Coronary Stent - P020026. U.S. Food and Drug Administration, 2013. (Accessed September 21, 2015, at http://www.fda.gov/MedicalDevices/ProductsandMedicalProcedures/DeviceApprovalsandClearances/Recently-ApprovedDevices/ucm082499.htm.)
129. Clinicaltrials.gov. 2015. (Accessed Sept. 14, 2015, at clinicaltrials.gov.)
130. Valgimigli M, Patialiakas A, Thury A, et al. Zotarolimus-eluting versus bare-metal stents in uncertain drug-eluting stent candidates. J Am Coll Cardiol 2015;65:805-15.
131. Valgimigli M, Sabate M, Kaiser C, et al. Effects of cobalt-chromium everolimus eluting stents or bare metal stent on fatal and non-fatal cardiovascular events: patient level meta-analysis. Bmj 2014;349:g6427.
132. Valgimigli M, Tebaldi M, Borghesi M, et al. Two-year outcomes after first- or second-generation drug-eluting or bare-metal stent implantation in all-comer patients undergoing percutaneous coronary intervention: a pre-specified analysis from the PRODIGY study (PROlonging Dual Antiplatelet Treatment After Grading stent-induced Intimal hyperplasia studY). JACC Cardiovasc Interv 2014;7:20-8.
133. VanderZee KI, Sanderman R, Heyink JW, de Haes H. Psychometric qualities of the RAND 36-Item Health Survey 1.0: a multidimensional measure of general health status. International journal of behavioral medicine 1996;3:104-22.
134. Vieira RD, Hueb W, Hlatky M, et al. Cost-effectiveness analysis for surgical, angioplasty, or medical therapeutics for coronary artery disease: 5-year follow-up of medicine, angioplasty, or surgery study (MASS) II trial. Circulation 2012;126:S145-50.
135. Walther C, Mobius-Winkler S, Linke A, et al. Regular exercise training compared with percutaneous intervention leads to a reduction of inflammatory markers and cardiovascular events in patients with coronary artery disease. Eur J Cardiovasc Prev Rehabil 2008;15:107-12.
136. Weintraub WS, Barnett P, Chen S, et al. Economics methods in the Clinical Outcomes Utilizing percutaneous coronary Revascularization and Aggressive Guideline-driven drug Evaluation (COURAGE) trial. Am Heart J 2006;151:1180-5.
137. Weintraub WS, Boden WE, Zhang Z, et al. Cost-effectiveness of percutaneous coronary intervention in optimally treated stable coronary patients. Circulation Cardiovascular quality and outcomes 2008;1:12-20.
138. Weintraub WS, Spertus JA, Kolm P, et al. Effect of PCI on quality of life in patients with stable coronary disease. N Engl J Med 2008;359:677-87.

WA - Health Technology Assessment December 11, 2015
Cardiac Stents – Re-Review: Final Evidence Report Page 213
139. Wenaweser P, Rey C, Eberli FR, et al. Stent thrombosis following bare-metal stent implantation: success of emergency percutaneous coronary intervention and predictors of adverse outcome. Eur Heart J 2005;26:1180-7.
140. West S, King V, Carey TS, et al. Systems to rate the strength of scientific evidence. Evidence report/technology assessment 2002:1-11.
141. Williams PD, Mamas MA, Morgan KP, et al. Longitudinal stent deformation: a retrospective analysis of frequency and mechanisms. EuroIntervention 2012;8:267-74.
142. Wilson RW, Hutson LM, Vanstry D. Comparison of 2 quality-of-life questionnaires in women treated for breast cancer: the RAND 36-Item Health Survey and the Functional Living Index-Cancer. Physical therapy 2005;85:851-60.
143. Windecker S, Stortecky S, Stefanini GG, et al. Revascularisation versus medical treatment in patients with stable coronary artery disease: network meta-analysis. Bmj 2014;348:g3859.
144. Wright RS, Anderson JL, Adams CD, et al. 2011 ACCF/AHA focused update of the Guidelines for the Management of Patients with Unstable Angina/Non-ST-Elevation Myocardial Infarction (updating the 2007 guideline): a report of the American College of Cardiology Foundation/American Heart Association Task Force on Practice Guidelines developed in collaboration with the American College of Emergency Physicians, Society for Cardiovascular Angiography and Interventions, and Society of Thoracic Surgeons. J Am Coll Cardiol 2011;57:1920-59.
145. Zhang Z, Kolm P, Boden WE, et al. The cost-effectiveness of percutaneous coronary intervention as a function of angina severity in patients with stable angina. Circulation Cardiovascular quality and outcomes 2011;4:172-82.