final goldman sachs gold day 300513 - newcrest … sachs australia gold day 30 may 2013, sydney...
TRANSCRIPT

Goldman SachsAustralia Gold Day30 May 2013, Sydney
Spencer ColeManager Investor Relations

2
Disclaimer
Forward Looking Statements
These materials include forward looking statements. Often, but not always, forward looking statements can generally be identified by the use of forward looking words such as “may”, “will”, “expect”, “intend”, “plan”, “estimate”, “anticipate”, “continue”, and “guidance”, or other similar words and may include, without limitation, statements regarding plans, strategies and objectives of management, anticipated production or construction commencement dates and expected costs or production outputs.
Forward looking statements inherently involve known and unknown risks, uncertainties and other factors that may cause the company’s actual results, performance and achievements to differ materially from any future results, performance or achievements. Relevant factors may include, but are not limited to, changes in commodity prices, foreign exchange fluctuations and general economic conditions, increased costs and demand for production inputs, the speculative nature of exploration and project development, including the risks of obtaining necessary licenses and permits and diminishing quantities or grades of reserves, political and social risks, changes to the regulatory framework within which the company operates or may in the future operate, environmental conditions including extreme weather conditions, recruitment and retention of personnel, industrial relations issues and litigation.
Forward looking statements are based on the company and its management’s good faith assumptions relating to the financial, market, regulatory and other relevant environments that will exist and affect the company’s business and operations in the future. The company does not give any assurance that the assumptions on which forward looking statements are based will prove to be correct, or that the company’s business or operations will not be affected in any material manner by these or other factors not foreseen or foreseeable by the company or management or beyond the company’s control.
Although the company attempts and has attempted to identify factors that would cause actual actions, events or results to differ materially from those disclosed in forward looking statements, there may be other factors that could cause actual results, performance, achievements or events not to be as anticipated, estimated or intended, and many events are beyond the reasonable control of the company. Accordingly, readers are cautioned not to place undue reliance on forward looking statements. Forward looking statements in these materials speak only at the date of issue. Subject to any continuing obligations under applicable law or any relevant stock exchange listing rules, in providing this information the company does not undertake any obligation to publicly update or revise any of the forward looking statements or to advise of any change in events, conditions or circumstances on which any such statement is based.
Ore Reserves and Mineral Resources Reporting Requirements
As an Australian company with securities listed on the Australian Securities Exchange (“ASX”), Newcrest is subject to Australian disclosure requirements and standards, including the requirements of the Corporations Act and the ASX. Investors should note that it is a requirement of the ASX listing rules that the reporting of ore reserves and mineral resources in Australia comply with the 2004 Edition of the Australasian Code for Reporting of Exploration Results, Mineral Resources and Ore Reserves (the “JORC Code”) and that Newcrest’s ore reserve and mineral resource estimates comply with the JORC Code. As a company listed on the Toronto Stock Exchange (“TSX”), Newcrest is subject to certain Canadian disclosure requirements and standards, including the requirements of National Instrument 43-101 - Standards of Disclosure for Mineral Projects of the Canadian Securities Administrators (“NI 43-101”). In accordance with NI 43-101, Newcrest reports its ore reserves and mineral resources estimates in compliance with the JORC Code, along with a reconciliation to the material differences between the JORC Code and the applicable definitions adopted by the Canadian Institute of Mining, Metallurgy and Petroleum (CIM Definition Standards). In relation to the December 2012 Resources and Reserves Statement, the reconciliation is set out in Newcrest’s Canadian News Release dated 8 February 2013, and is available at www.sedar.com and at Newcrest’s website www.newcrest.com.au. Except as otherwise noted in that document, there are no material differences between the definitions of Measured, Indicated and Inferred Mineral Resources, and Proven and Probable Reserves, under the CIM Definition Standards and the equivalent or corresponding definitions in the JORC Code.
Competent Person’s Statement
The information in this presentation that relates to Exploration Results and other scientific and technical information is based on information compiled by C. Moorhead, EGM Minerals for Newcrest who is a Fellow of The Australasian Institute of Mining and Metallurgy, and a full-time employee of Newcrest. Mr Moorhead has sufficient experience which is relevant to the styles of mineralisation and types of deposits under consideration and to the activity which he is undertaking to qualify as a Competent Person as defined in the JORC Code and is a Qualified Person within the meaning of NI 43-101. Mr Moorhead consents to and has approved the inclusion in this presentation of the matters based on this information in the form and context in which it appears including sampling, analytical and test data underlying the results. For details of exploration reports refer to the Newcrest website at www.newcrest.com.au.
Non-IFRS Financial Information
This presentation uses Non-IFRS financial information including Underlying Profit, EBITDA and EBIT. Underlying Profit is presented to assist in the assessment of the relative performance of the Group. EBITDA and EBIT are used to measure segment performance and have been extracted from the Segment Information disclosed in the ASX Appendix 4D. Non-IFRS information has not been subject to review by Newcrest’s external auditor.

3
Newcrest Mining
Telfer
Gosowong
Lihir Is
Cadia Valley
Wafi-GolpuTandai
Manus Is
Gold Equivalent Resource
Bonikro
Namosi JV
Hidden Valley
• 4th largest global gold producer1
• Primarily Australia and Asia Pacific
• 6 production assets in 4 countries
• FY13 Gold production 2.00 – 2.15Moz2
• FY13 Copper production 75 – 85kt2
• Reserve life >30 years
• Gearing 17%3
+50Moz20-50Moz0-20Moz
1 By market capitalisation2 March 2013 production guidance.3 Per December 2012 half year financial results. Gearing = Net Debt / (Net Debt + Equity)
• Gold
• Long life, low cost, moderate growth
• Australia, SE Asia focus
• Unhedged, low gearing, dividend growth
• Focus on early stage resources
• People & technical capability focus
• Management incentives =ROCE, reserve growth, and cost position
Newcrest in a snapshot
Newcrest strategy

4
Why Newcrest
• Find– Company built on exploration success– Low cost resource capture– Long Reserve life (>30 years)
• Develop– Successful delivery of major projects– Near term growth from capital already
invested
• Operate– High quality, low cost assets drive growth– Focus on consistent, predictable delivery– Strong balance sheet– Positioning for higher free cash flow

5
Near term growth from past investment
• 30 year + mine life, second quartile cash cost• Production capability of ~1 million ounces p.a.• Old plant refurbishment key to improving
reliability (> 50% complete)
• Highly automated, large tonnage bulk underground mine – expected mining cost $6/t
• Production growth to ~750,000 ounces gold p.a. over next 5 years
• Lowest cost quartile, 30 year mine life
Cadia – commercial production from Jan 2013
Lihir – plant expansion completed Feb 2013
• High grade, low cost, 20+ year mine life• Resource 29moz Au1, 9mt Cu1
• Production objective 600koz Au1 and 300kt Cu1
• Technical prefeasibility done, initial capex $4.8B1
Wafi Golpu – the next major growth engine
1 Figures shown on 100% basis – Newcrest share is 50%

6
0
200
400
600
800
1,000
1,200
1,400
1,600
1,800
2,000
0% 25% 50% 75% 100%
USD$/oz
Percentile
Industry Reported Total Cash Cost($/oz post by product credit)
GosowongCadia Valley
Lihir
Telfer
Bonikro
Hidden Valley
1st Quartile
2nd Quartile
3rd Quartile
4th Quartile
Source: Thompson-Reuters GFMS; CY2012 (Q1 to Q3)
Production growth at low end of the cost curveGold industry cash costs (post by product credits)
Major growth projects in 1st and 2nd quartile
Future Wafi-Golpu cost position
All-in sustaining cash cost around $1,250 in FY13, expected to be lower in future years

7
Declining capital expenditure profile
• Cadia East panel cave 1 established and Lihir plant expansion complete
• FY14 capital remains focused on Cadia and Lihir
• Studies paused on some longer dated projects
• Wafi-Golpu capex estimate review, minimal expenditure in FY14
Capital expenditure trend
0
500
1,000
1,500
2,000
2,500
3,000
FY12 FY13 FY14 FY15 FY16 FY17
A$mWafi Golpu
Major Projects
Minor Projects
Development
Sustaining
Higher free cashflow anticipated from increased production and declining capital expenditure
8
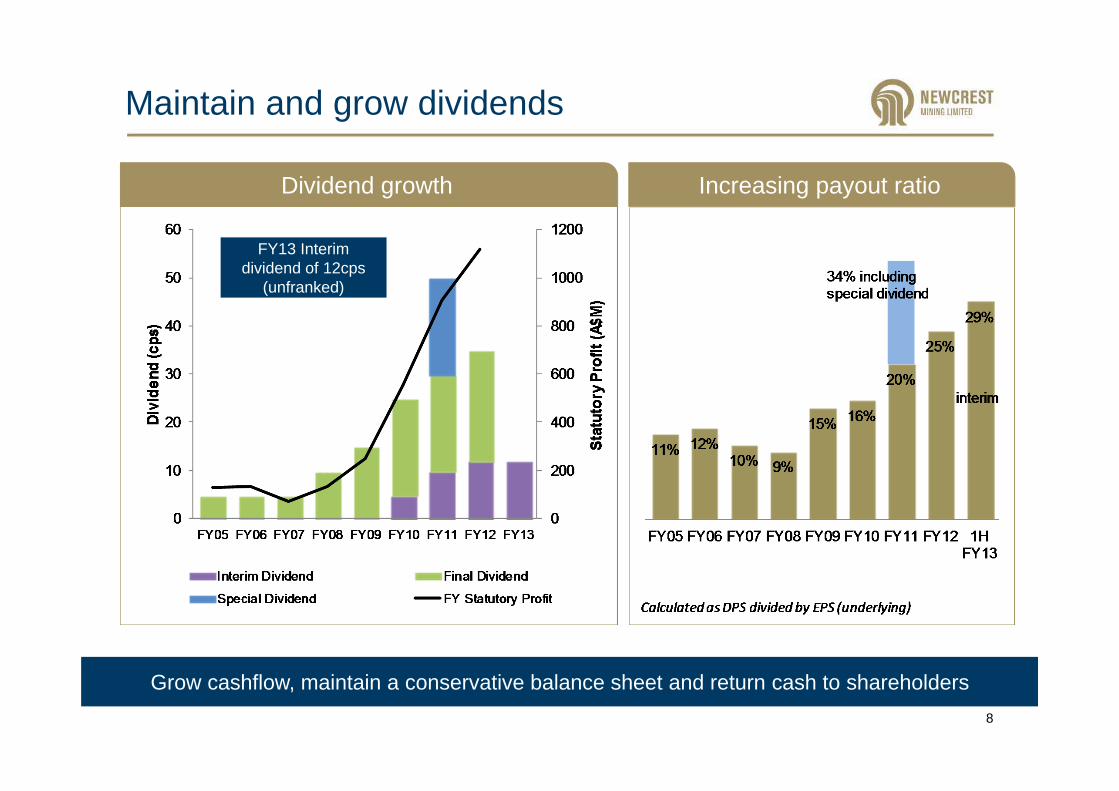
Maintain and grow dividends
Dividend growth
FY13 Interim dividend of 12cps
(unfranked)
Increasing payout ratio
Grow cashflow, maintain a conservative balance sheet and return cash to shareholders

9
Strong balance sheet
• Conservative balance sheet to absorb gold price volatility
• Long dated debt repayment profile
• Credit ratings BBB & Baa2, stable outlook
• Gearing 17%1
Maintain conservative balance sheet
1 Per December 2012 half year financial results. Gearing = Net Debt / (Net Debt + Equity)
Long dated debt repayment profile1
10
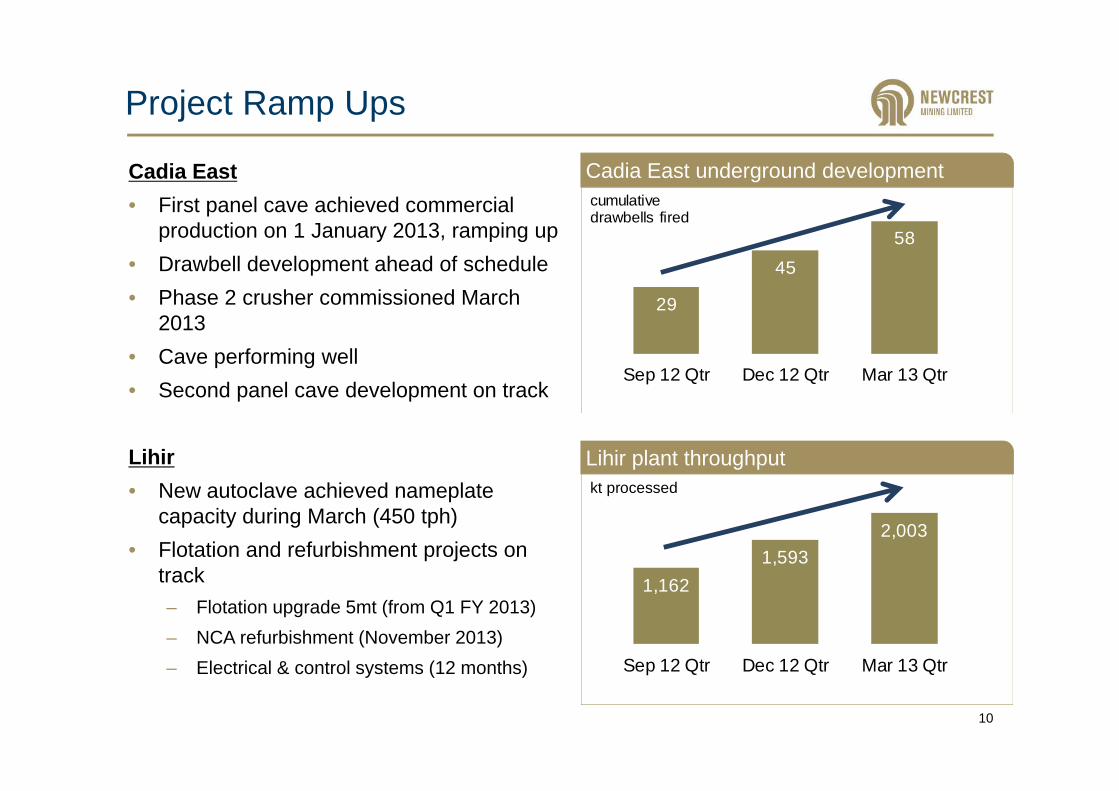
Project Ramp Ups
Cadia East• First panel cave achieved commercial
production on 1 January 2013, ramping up• Drawbell development ahead of schedule• Phase 2 crusher commissioned March
2013• Cave performing well• Second panel cave development on track
Lihir• New autoclave achieved nameplate
capacity during March (450 tph) • Flotation and refurbishment projects on
track– Flotation upgrade 5mt (from Q1 FY 2013)– NCA refurbishment (November 2013)– Electrical & control systems (12 months)
29
4558
Sep 12 Qtr Dec 12 Qtr Mar 13 Qtr
cumulative drawbells fired
Cadia East underground development
Lihir plant throughput
1,1621,593
2,003
Sep 12 Qtr Dec 12 Qtr Mar 13 Qtr
kt processed

11
Telfer
• High cost mine, produce only cash profitable ounces
• Producing to plan of ~ 500koz
• No new capital in current price and cost environment
Gosowong
• High margin mine, focus on extending reserve life
• Re-established access to higher grade ore
• Expected 2013 production around 300 - 325koz
Hidden Valley
• Actions to improve production and cost structure
• Primary crusher installation May 2013
• Targeting 20-30% cost reduction over next 12 months
Bonikro
• 3rd quartile cash cost, steady production
• Possible expansion delayed for 2 years
• Stripping investments continue, providing margins hold
Focus on operating cashflow at other assets
12
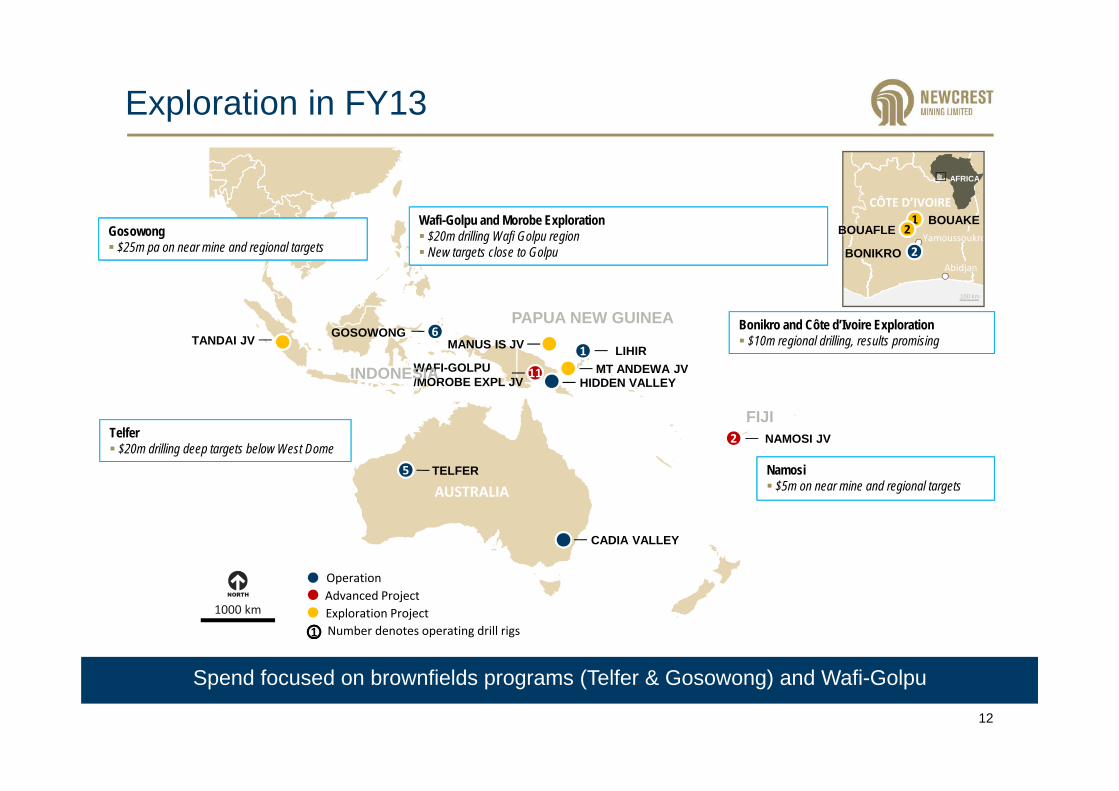
Exploration in FY13
WAFI-GOLPU/MOROBE EXPL JV
PAPUA NEW GUINEA
INDONESIA
AUSTRALIA
FIJI
55
22
6611
100 km
AFRICA
Yamoussoukro
AbidjanBONIKRO
11 BOUAKEBOUAFLE
CÔTE D’IVOIRE
22
22
1000 km
1111
CADIA VALLEY
NAMOSI JV
HIDDEN VALLEY
TANDAI JV
MT ANDEWA JV
MANUS IS JVGOSOWONG
TELFER
LIHIR
OperationAdvanced ProjectExploration Project
Bonikro and Côte d’Ivoire Exploration $10m regional drilling, results promising
Telfer $20m drilling deep targets below West Dome
Wafi-Golpu and Morobe Exploration $20m drilling Wafi Golpu region New targets close to Golpu
Namosi $5m on near mine and regional targets
Gosowong $25m pa on near mine and regional targets
11 Number denotes operating drill rigs
Spend focused on brownfields programs (Telfer & Gosowong) and Wafi-Golpu

13
Price & cost pressure= delay capital, attack costs
• Costs have followed higher commodity prices (labour, energy, commodity inputs)• Industry trend - declining grades and labour productivity• Exchange rates drive regional differences• Await firmer direction for larger capital decisions
Relative cost impacted by exchange rates
Source: Thomson Reuters GFMS, Bloomberg
Stop high cost ounces, lower business activity, productivity remains key
-250
0
250
500
750
1,000
1,250
1,500
1,750
2,000
0 10 20 30 40 50 60 70 80 90 100
Cash
Cos
t US$
/oz
(net
of b
y-pr
oduc
t cre
dit)
Cumulative Production (Percent)
H1 2012
2006
Industry cash costs
Source: Thomson Reuters GFMS Gold Mine Economics Service
Average Cash Cost• 2006 US$317/oz• 2012 US$738/ozAustralia• 2012 US$857/oz

14
Gold price and money supply
• Western economies have loosened monetary policy
• Fundamentals still support a strong gold price– Currency devaluation– Negative real interest rates– Inflation, political and economic
uncertainty
• Physical gold buyers strong
Fundamentals remain for a strong medium term gold price
Global money supply and gold price

15
Insulating against gold price volatility
• Long dated debt maturity profile• Low gearing to absorb gold price volatility• Credit ratings BBB & Baa2, stable outlook
• Production growth from low cost operations• Simplified off-site activity and reduced headcount• Re-negotiating costs and activity with key suppliers• Heavy emphasis on productivity & technology
• Postponed or slowed some long dated studies• Reviewed exploration program• Retain sight of “cheap resource capture”
• Focus on delivering return on past investments• Stopping all capital investment in higher cost
ounces• Reviewing open pit material movements
Strong Balance Sheet
Free Cashflow
Focus
Protect Margins
Prioritise Growth Options

16
Summary
• Deliver Lihir and Cadia ramp up• Reduce business activities and costs• Focus capital expenditure on low cost ounces• Reduce Wafi‐Golpu start up capital • Maximize free cash flow• Increase dividends, subject to profitability• Maintain strong balance sheet