final international iso/fdis draft standard 18755 · iso (the international organization for...
TRANSCRIPT

Please see the administrative notes on page iii
RECIPIENTS OF THIS DRAFT ARE INVITED TOSUBMIT, WITH THEIR COMMENTS, NOTIFICATION OF ANY RELEVANT PATENT RIGHTS OF WHICHTHEY ARE AWARE AND TO PROVIDE SUPPORT-ING DOCUMENTATION.
IN ADDITION TO THEIR EVALUATION AS BEING ACCEPTABLE FOR INDUSTRIAL, TECHNO-LOGICAL, COMMERCIAL AND USER PURPOSES,DRAFT INTERNATIONAL STANDARDS MAY ONOCCASION HAVE TO BE CONSIDERED IN THELIGHT OF THEIR POTENTIAL TO BECOME STAN-DARDS TO WHICH REFERENCE MAY BE MADE IN NATIONAL REGULATIONS.
Reference numberISO/FDIS 18755:2004(E)
© ISO 2004
FINAL DRAFT
ISO/TC 206
Secretariat: JISC
Voting begins on: 2004-12-14
Voting terminates on: 2005-02-14
INTERNATIONAL STANDARD
ISO/FDIS18755
Fine ceramics [advanced ceramics, advanced technical ceramics] — Determination of thermal diffusivity of monolithic ceramics by laser flash method
Céramiques techniques — Détermination de la diffusivité thermique des céramiques monolithiques par la méthode flash laser
ISO/FDIS 18755:2004(E)
PDF disclaimer This PDF file may contain embedded typefaces. In accordance with Adobe's licensing policy, this file may be printed or viewed but shall not be edited unless the typefaces which are embedded are licensed to and installed on the computer performing the editing. In downloading this file, parties accept therein the responsibility of not infringing Adobe's licensing policy. The ISO Central Secretariat accepts no liability in this area.
Adobe is a trademark of Adobe Systems Incorporated.
Details of the software products used to create this PDF file can be found in the General Info relative to the file; the PDF-creation parameters were optimized for printing. Every care has been taken to ensure that the file is suitable for use by ISO member bodies. In the unlikely event that a problem relating to it is found, please inform the Central Secretariat at the address given below.
Copyright notice
This ISO document is a Draft International Standard and is copyright-protected by ISO. Except as permitted under the applicable laws of the user's country, neither this ISO draft nor any extract from it may be reproduced, stored in a retrieval system or transmitted in any form or by any means, electronic, photocopying, recording or otherwise, without prior written permission being secured.
Requests for permission to reproduce should be addressed to either ISO at the address below or ISO's member body in the country of the requester.
ISO copyright office Case postale 56 • CH-1211 Geneva 20 Tel. + 41 22 749 01 11 Fax + 41 22 749 09 47 E-mail [email protected] Web www.iso.org
Reproduction may be subject to royalty payments or a licensing agreement.
Violators may be prosecuted.
ii © ISO 2004 – All rights reserved
ISO/FDIS 18755:2004(E)
© ISO 2004 – All rights reserved iii
In accordance with the provisions of Council Resolution 15/1993, this document is circulated in the English language only.

ISO/FDIS 18755:2004(E)
iv © ISO 2004 – All rights reserved
Contents Page
Foreword .............................................................................................................................................................v 1 Scope......................................................................................................................................................1 2 Normative references............................................................................................................................1 3 Terms and definitions ...........................................................................................................................1 4 Apparatus...............................................................................................................................................3 4.1 Specimen holder....................................................................................................................................4 4.2 Pulse laser..............................................................................................................................................4 4.3 Thermometer for measuring steady-state temperature of the specimen........................................5 4.4 Detector for measuring transient temperature rise of rear face of the specimen ..........................5 4.5 Environment for measurements ..........................................................................................................5 4.6 Temperature control unit ......................................................................................................................5 4.7 Data acquisition unit .............................................................................................................................5 5 Specimen................................................................................................................................................5 5.1 Shape and dimension of specimens ...................................................................................................5 5.2 Coating on the specimen......................................................................................................................6 5.3 Reference specimen .............................................................................................................................6 6 Measurement procedure.......................................................................................................................6 6.1 Measurement of specimen thickness .................................................................................................6 6.2 Surface treatment ..................................................................................................................................6 6.3 Determination of flash time of the laser pulse and the chronological profile of the laser
pulse .......................................................................................................................................................6 6.4 Temperature and atmosphere control ................................................................................................6 6.5 Stability of specimen temperature.......................................................................................................6 6.6 Energy of pulse heating........................................................................................................................7 6.7 Measurement temperature ...................................................................................................................7 6.8 Record ....................................................................................................................................................7 7 Data analysis..........................................................................................................................................7 7.1 Calculation based on the half-rise-time method ................................................................................7 7.2 Criteria for applicability of the half-rise-time method........................................................................7 8 Measurement report ............................................................................................................................10 Annex A (informative) Principle of laser flash thermal diffusivity measurements ....................................12 Annex B (informative) Correction for non-ideal initial and boundary conditions......................................13 Annex C (informative) Data analysis algorithms to calculate thermal diffusivity from
observed temperature history curve under non-ideal initial and boundary conditions..............19 Annex D (informative) Other error factors......................................................................................................22 Annex E (informative) Reference data and reference materials of thermal diffusivity..............................28 Bibliography......................................................................................................................................................29
ISO/FDIS 18755:2004(E)
© ISO 2004 – All rights reserved v
Foreword
ISO (the International Organization for Standardization) is a worldwide federation of national standards bodies (ISO member bodies). The work of preparing International Standards is normally carried out through ISO technical committees. Each member body interested in a subject for which a technical committee has been established has the right to be represented on that committee. International organizations, governmental and non-governmental, in liaison with ISO, also take part in the work. ISO collaborates closely with the International Electrotechnical Commission (IEC) on all matters of electrotechnical standardization.
International Standards are drafted in accordance with the rules given in the ISO/IEC Directives, Part 2.
The main task of technical committees is to prepare International Standards. Draft International Standards adopted by the technical committees are circulated to the member bodies for voting. Publication as an International Standard requires approval by at least 75 % of the member bodies casting a vote.
Attention is drawn to the possibility that some of the elements of this document may be the subject of patent rights. ISO shall not be held responsible for identifying any or all such patent rights.
ISO 18755 was prepared by Technical Committee ISO/TC 206, Fine ceramics.

FINAL DRAFT INTERNATIONAL STANDARD ISO/FDIS 18755:2004(E)
© ISO 2004 – All rights reserved 1
Fine ceramics [advanced ceramics, advanced technical ceramics] — Determination of thermal diffusivity of monolithic ceramics by laser flash method
1 Scope
This International Standard specifies the test method for the determination of thermal diffusivity from room temperature to 1700 K by the laser flash method for homogeneous monolithic ceramics with porosity less than 10 %.
2 Normative references
The following referenced documents are indispensable for the application of this document. For dated references, only the edition cited applies. For undated references, the latest edition of the referenced document (including any amendments) applies.
ISO 3611, Micrometer callipers for external measurement
3 Terms and definitions
For the purposes of this document, the following terms and definitions apply.
3.1 thermal diffusivity thermal conductivity divided by the product of specific heat capacity and density
3.2 thermal conductivity density of heat flow rate divided by temperature gradient under steady state condition
3.3 specific heat capacity heat capacity per unit mass
3.4 pulse width ττττp full width of half maximum (FWHM) which is the time duration when the laser pulse intensity is larger than the half of its maximum value on time basis
3.5 centroid of laser pulse chronological centroid of laser light energy
3.6 spatial energy distribution of pulse heating energy density of the laser beam incident at each point on the front face of the specimen
ISO/FDIS 18755:2004(E)
2 © ISO 2004 – All rights reserved
3.7 transient temperature curve transient temperature change of the rear face of the specimen after the light pulse heating
3.8 transient radiance curve transient change of the spectral radiance from the rear face of the specimen after the light pulse heating
NOTE It should be noted that the observed transient curve is proportional to the change of the spectral radiance rather than the change of temperature when a radiation thermometer or a radiation detector is used to observe the transient temperature rise of the specimen after the light pulse heating.
3.9 maximum temperature rise ∆∆∆∆Tmax difference between the steady temperature before the pulse heating and the maximum temperature of the rear face of the specimen after the pulse heating
NOTE See Figure 1.
3.10 half rise-time tl/2 time until ∆Tmax/2 is attained from the pulse heating
3.11 characteristic time of heat loss ττττc time of heat loss determined when the cooling region is fitted with an exponential function, ∆T0 exp( - t/τC)
NOTE See Figure 1.

ISO/FDIS 18755:2004(E)
© ISO 2004 – All rights reserved 3
Key X: time Y: temperature rise
1 exponential function ( )0 exp / cT t τ ∆ − 2 initial noise
Figure 1 —Transient temperature curve of the rear face of the specimen after a light pulse heating onto the front face of the specimen
3.12 extrapolated temperature rise ∆∆∆∆T0 temperature rise determined when the cooling region is fitted with an exponential function, ∆T0 exp( - t/τC)
3.13 initial noise superimposed on transient temperature curve initial spike and/or hump superimposed on the initial part of the transient temperature curve, due to transmitted and/or scattered light from the heating laser pulse and/or electrically induced noise associated with the laser pulse discharge
3.14 homogeneity of specimen degree of homogeneity of local thermal diffusivity over the specimen
4 Apparatus
The apparatus shall be designed for obtaining the thermal diffusivity from the transient temperature curve of the rear face of a specimen after the laser pulse is irradiated onto the front face of the specimen, and shall consist of the following principal components as shown in Figure 2.

ISO/FDIS 18755:2004(E)
4 © ISO 2004 – All rights reserved
4.1 Specimen holder
The specimen holder shall hold the specimen stable, with minimum thermal contact, and shall be designed to suppress stray lights from the laser beam being transmitted to the transient detector.
A diaphragm with aperture diameter slightly larger than the specimen diameter should be placed close to the front face of the specimen, and another diaphragm with aperture diameter smaller than the specimen diameter and larger than the target size of radiative detection should be placed close to the rear face of the specimen.
Key 1 pulsed laser 2 data analysis 3 detector
4 specimen holder 5 power supply 6 heater
a Trigger signal. b Transient temperature response.
Figure 2 — Block diagram of laser flash apparatus for measuring thermal diffusivity
4.2 Pulse laser
The pulse laser shall be capable of emitting the light pulse with pulse duration preferably shorter than 1,0 ms in full width at half maximum (FWHM). The specimen should be irradiated uniformly by the light pulse.
When a pulse laser is used for the light pulse, the direct beam profile is often irregular because of multi-mode oscillation. In this case, the beam should be converted to a uniform beam using beam-homogenizing optics.

ISO/FDIS 18755:2004(E)
© ISO 2004 – All rights reserved 5
4.3 Thermometer for measuring steady-state temperature of the specimen
The steady-state temperature of the specimen before pulse heating should be measured by a thermocouple, or an equally or more reliable thermometer.
The thermocouple shall be positioned such that it does not interrupt the light pulse heating onto the front face of the specimen, or the radiation from the rear face of the specimen. If the specimen does not react with the thermocouple, a thin thermocouple should be contacted with the specimen to measure the specimen temperature with minimal uncertainty. If the thermocouple junction cannot be allowed to contact the specimen because of chemical reaction with the specimen, or because it interrupts the setting of the specimen, or because of the system design, the tip should be placed as close as practical to the specimen in the same plane.
4.4 Detector for measuring transient temperature rise of rear face of the specimen
The transient temperature rise curve on the rear face of the specimen shall be observed with a non-contact radiation thermometer or a radiation detector. The frequency response of the detector and its associated electronics should be faster than 10 kHz. The target diameter of the radiation detector should be smaller than 50 % of the diameter for disk specimens, or 50 % of the shortest side-length for square and rectangular specimens.
4.5 Environment for measurements
Measurements may be performed under open air, under an inert gas atmosphere, or under vacuum at room temperature. For higher temperature measurements, an appropriate inert atmosphere or vacuum shall be used, when necessary, to protect furnace parts and specimen holders from oxidation and to protect the specimen and its coating from structure/phase changes and compatibility problems.
4.6 Temperature control unit
For higher temperature measurements, the specimen should be kept at a stable temperature by electric heaters before pulse heating. Drift and fluctuation of the temperature should be less than 0,01 K/s.
4.7 Data acquisition unit
The transient detector signal should be amplified and converted to the digital signal using a digital oscilloscope or an AD converter which is input to a personal computer for computation of the thermal diffusivity. The frequency response of the amplifier and the AD conversion should be faster than 10 kHz. The resolution of the AD conversion should be larger than 10 bits, more than 1000 data points should be sampled with the sampling time faster than 1 % of the half rise-time “t1/2”.
5 Specimen
5.1 Shape and dimension of specimens
The specimen shall be a flat plate of circular, square or rectangular shape. The specimen diameter or side shall be between 5 mm and 15 mm.
The specimen thickness shall be chosen to be as follows:
a) thicker than 0,5 mm and thinner than 5 mm;
b) sufficiently thick that the t1/2 value is larger than 5 times the pulse width.
The uniformity of the specimen thickness shall be smaller than 1,0 %.

ISO/FDIS 18755:2004(E)
6 © ISO 2004 – All rights reserved
5.2 Coating on the specimen
If the specimen does not have a high absorption coefficient for the heating laser beam or a high emissivity for radiative temperature detection, the surfaces of the specimen shall be coated with a thin, opaque, preferably black layer. The coating shall be dense enough to prevent penetration of the laser beam or thermal radiation at the observed wavelength, and should be resistive against laser pulse heating at high temperatures. Coating thickness should be a minimum commensurate with excluding directly transmitted laser pulse.
NOTE Suitable coatings for many ceramic materials include evaporated, sputtered carbon or sprayed colloidal graphite. If the test specimen reacts with carbon at high temperatures, a metal coating, such as platinum, gold or nickel may alternatively be used. The surface of the test specimen may, with advantage, be roughened to improve adhesion of the coating. The coating thickness dependence must be evaluated for the observed thermal diffusivity, if the contribution of coatings is not negligible.
5.3 Reference specimen
Reference specimens can be used to evaluate uncertainty of thermal diffusivity measurements by a laser flash apparatus. The uncertainty is obtained as the difference between the measured value and the reference value of thermal diffusivity of the reference specimen.
NOTE There are no certified reference materials for thermal diffusivity measurements authorized by national or international organizations yet, although several materials are used as such (see Annex E).
Care should be taken in the use of these references to ensure that the half rise-time and the thermal diffusivity value are similar to those of the test materials.
6 Measurement procedure
The specimen shall be measured under the following procedures.
6.1 Measurement of specimen thickness
Measure the thickness of the specimen to an accuracy of 0,5 % or better, using a micrometer in accordance with ISO 3611.
6.2 Surface treatment
Carry out the surface treatment in accordance with 5.2.
6.3 Determination of flash time of the laser pulse and the chronological profile of the laser pulse
The chronological trace of the laser pulse versus the same trigger signal to initiate laser flash thermal diffusivity measurements shall be observed. If the FWHM of the laser pulse duration is larger than 1 % of the half rise-time, correction for the finite pulse time shall be made following one of the procedures stated in Annex B.
6.4 Temperature and atmosphere control
Insert the test specimen in the apparatus and position the thermocouples. The atmosphere should be such that the specimen is not subjected to any chemical change under the measured temperature range.
6.5 Stability of specimen temperature
The specimen temperature shall be controlled with drift smaller than 0,01 K/s.

ISO/FDIS 18755:2004(E)
© ISO 2004 – All rights reserved 7
6.6 Energy of pulse heating
Irradiate the specimen with the laser pulse at an intensity of as low energy as possible, commensurate with an acceptable noise level.
NOTE Refer to Annex D about nonlinearity of spectral radiance on temperature.
6.7 Measurement temperature
Record the measurement temperature as 0 maxT T+ ∆ , where 0T is the initial steady-state temperature and maxT∆ is the maximum temperature rise of the specimen recorded by the thermocouple in contact with the
specimen or the calibrated radiation thermometer.
NOTE A thermocouple below 0,15 mm in diameter, which is directly contacted to the rear or side surface of a specimen mechanically or with a paste, is preferable to estimate maxT∆ .
6.8 Record
The transient temperature curve should be recorded for a duration at least until 10 times the half-rise-time, in order to make reliable evaluation of measurements, including heat-loss correction and evaluation of nonuniform heating effect.
7 Data analysis
7.1 Calculation based on the half-rise-time method
The standard algorithm to calculate thermal diffusivity from the laser flash method is the half-rise-time method, in which the analytical equation is fitted to the transient temperature curve at t, the height of a half of maximum temperature rise of the transient temperature or radiance response curve above the base line “ max / 2T∆ ” over the half-rise-time.
If the measurement is valid when made under the above-mentioned ideal initial and boundary conditions, the thermal diffusivity, α, is represented by the following equation based on the half-rise-time method:
2
1/ 2
0,1388 dt
α = (1)�
where t1/2 is the time delay when the temperature of the rear face reaches one-half of the maximum temperature rise, ∆Tmax, after the front face was heated by the laser pulse.
7.2 Criteria for applicability of the half-rise-time method
In order that the rise-time can be validly applied, the following initial and boundary conditions must be satisfied:
The duration of the laser pulse is short, compared with the characteristic time of heat diffusion (FWHM < 1 % of t1/2).
The front face of the specimen is uniformly heated by the light pulse.
The specimen is adiabatic during the period of measurement after the light pulse heating.
The specimen is uniform (in geometry) and is homogeneous.
The specimen is opaque (nontransparent and nontranslucent) to the light pulse and to thermal radiation.

ISO/FDIS 18755:2004(E)
8 © ISO 2004 – All rights reserved
If these conditions are satisfied, the heat flow becomes one-dimensional and the temperature of the rear face of the specimen changes according to an analytical equation (See Annex A).
The thermal diffusivity value shall be determined by fitting this equation to the observed transient temperature curve. Theoretically, if the measurement is made under the above-mentioned ideal conditions, the calculated thermal diffusivity value should be independent of the position along the transient curves. Therefore, any point on the transient temperature curve can be analyzed to yield the thermal diffusivity, α. This will be given by Equation (2) as follows;
2x
x
K dt
α = (2)
where
d is the specimen thickness, in metres;
tx is the time for the specimen rear face to reach a fraction of the maximum temperature rise, in seconds (see Table 1);
x is the percentage of the maximum rise in temperature;
Kx is a constant relating α to d and tx, in the case of ideal measurements.
Calculate the thermal diffusivity at fractional temperature rises other than t1/2. If the values at t0,3, t0,5 and t0,7 calculated using the relevant values of Kx in Table 1 are all within ± 2 % then it can be assumed that the half-rise-time method is applicable without any correction. If the spread of thermal diffusivity values so calculated is greater than ± 2 %, the possibility of non-ideal initial and/or boundary conditions, imperfect design and/or operation of the laser flash apparatus, or problems associated with the specimen, must be considered.
Table 1 — Values of constant KX for a range of transient times
x % Kx tx
10
20
30
40
50
60
70
80
90
0,0662
0,0843
0,1012
0,1190
0,1388
0,1622
0,1919
0,2332
0,3036
t0,1
t0,2
t0,3
t0,4
t1/2
t0,6
t0,7
t0,8
t0,9

ISO/FDIS 18755:2004(E)
© ISO 2004 – All rights reserved 9
Key X: time Y: temperature rise
Figure 3 — Averaged deviation of the transient temperature curve (solid curve) from the Parker’s equation having the observed half rise-time (broken curve)
The applicability of the half-rise-time method can alternatively be checked through the averaged deviation of the transient temperature curve from the Parker’s equation corresponding to the experimentally determined half rise-time as shown in Figure 3. The averaged deviation is calculated over the region from the half rise-point to the maximum point normalized by the maximum temperature rise “∆Tmax”. If the averaged deviation is within ± 1 % then it can be assumed that no corrections apply.
If the averaged deviation is greater than ± 1 %, the possibility of non-ideal initial and/or boundary conditions, imperfect design and/or operation of the laser flash apparatus, or problems associated with the specimen, shall be considered, as follows.
a) Imperfect design and/or operation of the laser flash apparatus:
1) superposition of stray light or electrical noise on the transient temperature response curve;
2) excessive drift of steady-state temperature;
3) insufficient response time of radiation detector and/or amplifier;
4) non-negligible heat exchange with the specimen holder;
5) effect of non-linearity of spectral radiance.
b) Problems associated with the specimen:
1) thermal resistance of coating;
2) poor flatness of the specimen;
3) large void or inhomogeneous distribution of pores.
ISO/FDIS 18755:2004(E)
10 © ISO 2004 – All rights reserved
c) Non-ideal initial and boundary conditions:
1) nonuniform heating effects;
2) finite pulse time effect;
3) radiation heat loss.
First, check Items a), b) and item c) 1) and improve them to make the measurements closer to the ideal conditions.
NOTE During practical measurement by the laser flash method it is difficult always to satisfy the ideal initial and boundary conditions. Annex C and the Bibliography give examples of analyses for non-ideal conditions which may be applied as appropriate. Annex D gives information on other sources of error. If the position is still not acceptable, then corrections for items c) 1) and c) 2) are necessary via appropriate algorithms.
Examples of such analyses are given in Annex C. Details of all the procedures employed shall be given in the measurement report.
8 Measurement report
The following information should be recorded in the measurement report:
a) General information
1) The name and address of the testing establishment.
2) The date of measurements.
3) A unique identification of the report.
4) A reference to this International Standard.
5) The name of the laser flash apparatus used.
b) Light pulse
1) The type of the pulse light source.
2) Duration of the light pulse in full width at half maximum (optional).
3) Energy of one light pulse (optional).
4) Statement of spatial profile of the laser beam.
c) Specimen
1) A description of the material; (material type, manufacturing code, batch number, date of receipt).
2) Method of cutting, grinding and/or polishing specimens from supplied material.
3) Shape of the specimen (disk, square plate or rectangular plate).
4) Diameter or side length of the specimen.
5) Thickness of the specimen.
ISO/FDIS 18755:2004(E)
© ISO 2004 – All rights reserved 11
d) Coating
1) Use of coating (Yes or No).
2) Coated material.
3) Coating procedure.
4) Thickness of coating (optional).
e) Thermometry
1) Thermometer used for steady-state temperature measurements.
2) Thermometer or radiation detector used for measuring transient temperature or radiance rise of the specimen rear face after light pulse heating.
f) Data acquisition (optional)
1) Response time of the transient temperature measurements.
g) Data analysis
1) The type of the analytical solution on which the data analysis is founded.
2) The data analysis algorithm (half-rise-time method, least-square-fit method, non-linear least-square method, equiareal method or logarithmic method).
h) Corrections
1) Calculated values of heat-loss corrections, if any, giving full details if the methods are not given in Annex B or C.
2) Calculated values of nonuniform heating corrections, if any, giving full details if the methods are not given in Annex B or C.
3) Calculated values of finite pulse time correction, if any, giving full details if the methods are not given in Annex B.
4) Calculated values of nonlinearity of spectral radiance correction, if any, giving full details if the methods are not given in Annex B or C.
5) Calculated values of coating thermal resistance corrections, if any, giving full details.
i) Measured results
1) The measurement temperature(s), in kelvins or degrees Celsius.
2) The half rise-time, in seconds.
3) The calculated thermal diffusivity value(s) in m2/s.
j) Other important information
1) Discussion of errors and correction procedures.
2) Comments about the measurement and measurement results.
ISO/FDIS 18755:2004(E)
12 © ISO 2004 – All rights reserved
Annex A (informative)
Principle of laser flash thermal diffusivity measurements
A.1 Ideal condition
The analytical solution for laser flash thermal diffusivity measurements has been given by Parker et al. [1] under the following conditions.
a) The duration of the laser pulse is negligibly short compared to the characteristic time of heat diffusion.
b) The front face of the specimen is uniformly heated by a light pulse.
c) The specimen is adiabatic during the measurement after the light pulse heating.
d) The specimen is uniform (in geometry) and is homogeneous.
e) The specimen is opaque (nontransparent and nontranslucent) to the light pulse and to thermal radiation.
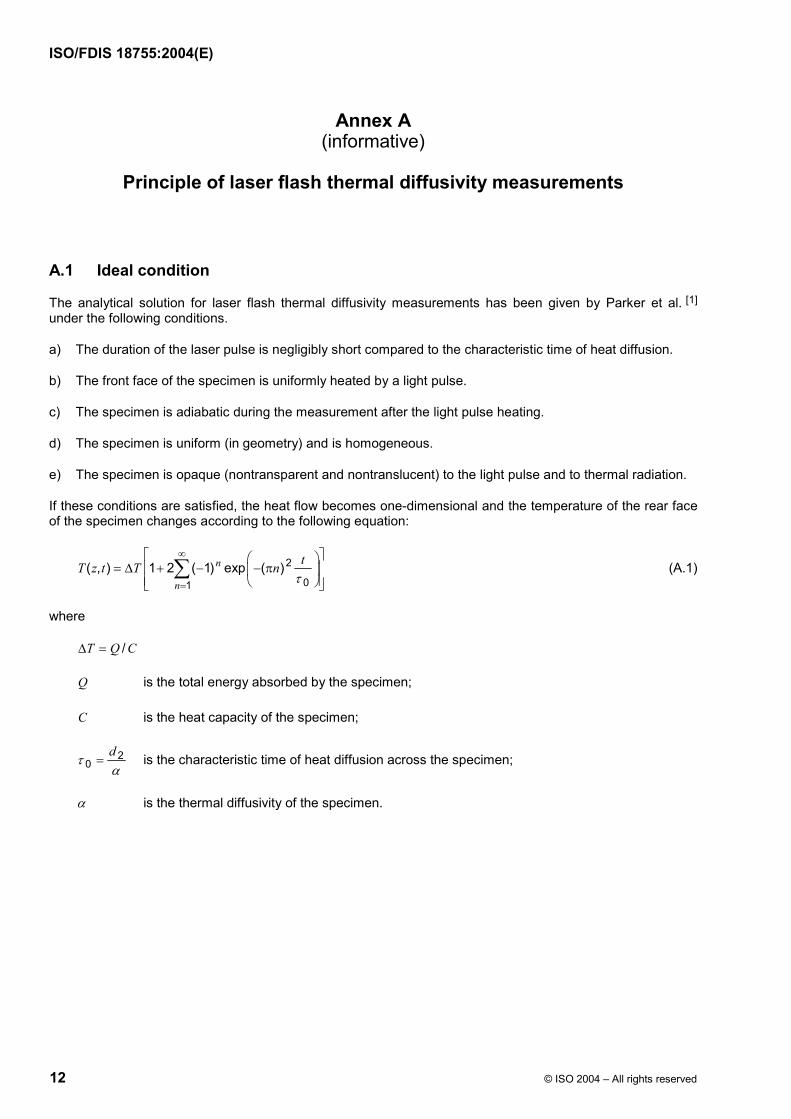
If these conditions are satisfied, the heat flow becomes one-dimensional and the temperature of the rear face of the specimen changes according to the following equation:
2
01( , ) 1 2 ( 1) exp ( )n
n
tT z t T nτ
∞
=
= ∆ + − − π
∑ (A.1)
where
/T Q C∆ =
Q is the total energy absorbed by the specimen;
C is the heat capacity of the specimen;
20
dτ
α= is the characteristic time of heat diffusion across the specimen;
α is the thermal diffusivity of the specimen.

ISO/FDIS 18755:2004(E)
© ISO 2004 – All rights reserved 13
Annex B (informative)
Correction for non-ideal initial and boundary conditions
B.1 General
The calculation of thermal diffusivity using Equation (1) is modified if the pulse transit time is less than 100 times the duration of the heat pulse, or if heat is lost from the specimen. Examples of modifications applying to the calculation method are given in B.2 to B.3.
The mathematical derivation given in Annex A assumes that no heat is lost from the specimen during the time taken for the heat pulse to pass through it. [2-5] For good conductors at temperatures close to ambient, this is a reasonable approximation, but for poor conductors and for most samples at high temperatures, corrections for heat losses will almost certainly be applicable.
Provided that use of a suitable holder design has minimized heat lost from the specimen by conduction, and that the duration of the transient is short enough for heat lost by convection to be neglected (there are no convective losses if the measurement is performed in a vacuum), the main source of heat loss is by radiation from the specimen surfaces. The best way to analyze heat loss is to compare the entire experimental curve with one or more of the many theoretical models available. Examples of analytical methods are given in Annex C.
B.2 Effect of finite pulse time
Several analytical calculations have been reported in order to correct the effect of the finite duration time of the heating laser pulse [6-8]. If the pulse width is much shorter than the half rise-time of the transient temperature curve, the laser pulse heating can be approximated by Dirac’s delta function located at the chronological centroid of laser light energy [9].
When t1/2 is less than 100 times the heat pulse duration, the finite pulse time effect should be corrected. Two widely used correction methods are the centroid method and the triangular pulse method described as follows.
B.2.1 Centroid method [9]
If t1/2 is larger than 3 times the Pulse width (τp), the finite pulse time effect can be corrected by shifting the time origin of the data analysis to the chronological centroid of the laser pulse (tg). Thus, t1/2 should be replaced by 1 2 gt t− .
B.2.2 Determination of chronological centroid of laser pulse
The chronological centroid of the laser pulse (tg) should be determined by one of the following procedures.
B.2.2.1 Real time method
Measure the waveform of the laser pulse by a detector of frequency response faster than 10 µs, and calculate the centroid directly from the observed waveform.
B.2.2.2 Integration method
Prepare a metallic sheet thin enough that the heat diffusion time across it is shorter than 3 µs. Then, the chronological trace of the temperature rise of the metallic film is proportional to the integrated energy of the

ISO/FDIS 18755:2004(E)
14 © ISO 2004 – All rights reserved
laser beam from the starting point of the laser pulse. The waveform of the laser pulse is derived as the derivative of the chronological trace of the temperature rise.
B.2.3 Triangular pulse approximation [6]
The shape of the heat pulse from a neodymium-glass laser and a flash-lamp can be approximated by a triangular pulse of duration τ with a maximum occurring at β, where β is a fraction between zero and one.
This is most easily achieved by using a fast-response photodiode (as used in several laser calorimeters) or by measuring the change in resistance of a thin (approximately 25 µm) tantalum foil strip when subjected to the heat pulse. The parameters τ and β usually change with the heat pulse power, and so should be determined at the power to be used.
Once τ and β are known, the thermal diffusivity α is given by the equation:
21
2 1/ 2
C daC t τ
=−
(B.1)
where
the constants C1 and C2 are given in Table B.1 for values of β;
d is the specimen thickness.
The finite pulse time correction given in Equation (B.1) should not be used for t1/2 less than 10τ.
Table B.1 — Finite pulse time correction constants
β C1 C2
0,15 0,34844 2,5106
0,28 0,31550 2,2730
0,29 0,31110 2,2454
0,30 0,30648 2,2375
B.3 Effect of radiative heat losses
The thermal diffusivity shall be calculated from Equation (B.2), introducing correction factors if radiative heat losses cannot be neglected.
21/ 20,1388 /rhlk d tα = (B.2)
where
α is the thermal diffusivity (m2/s);
d is the thickness of the specimen at room temperature (m);
rhlk is the correction factor relating to heat loss from the specimen.
The following boundary condition is introduced instead of the adiabatic boundary condition, in order to formulate an analytical solution under the radiative heat losses. The other assumptions are the same as the ideal conditions.
ISO/FDIS 18755:2004(E)
© ISO 2004 – All rights reserved 15
Heat losses from the specimen can be expressed by the Newtonian cooling law and the Biot number can be defined.
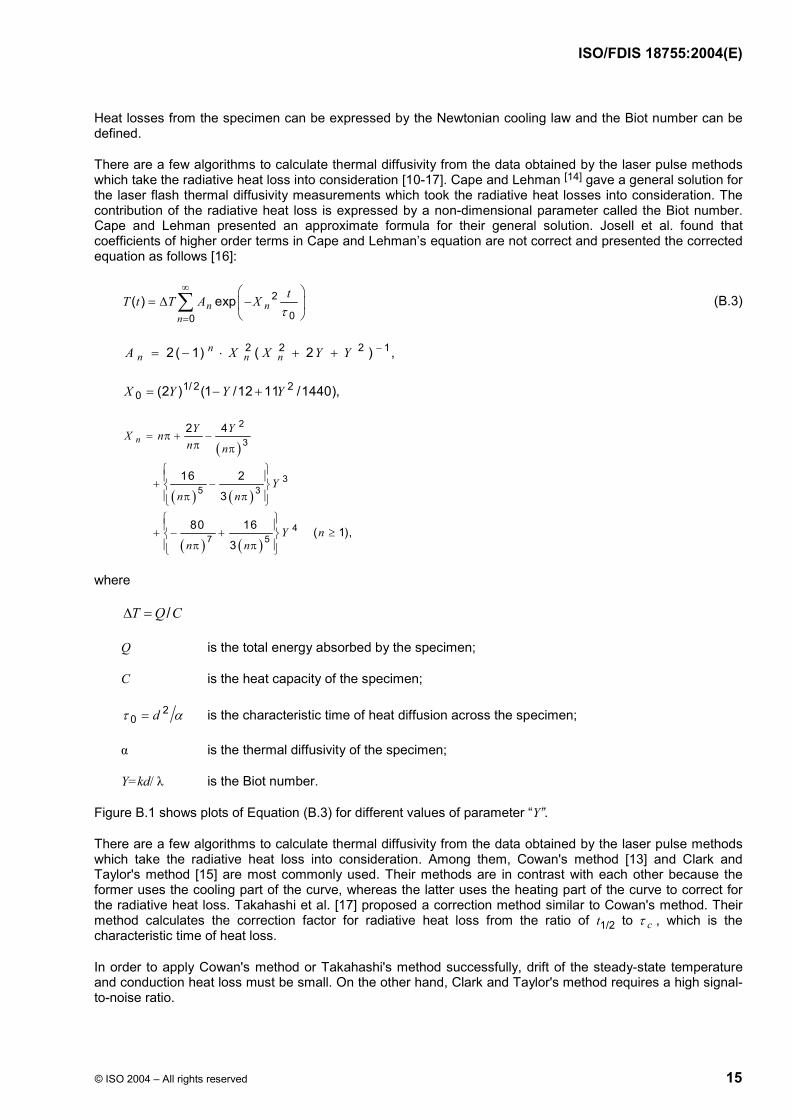
There are a few algorithms to calculate thermal diffusivity from the data obtained by the laser pulse methods which take the radiative heat loss into consideration [10-17]. Cape and Lehman [14] gave a general solution for the laser flash thermal diffusivity measurements which took the radiative heat losses into consideration. The contribution of the radiative heat loss is expressed by a non-dimensional parameter called the Biot number. Cape and Lehman presented an approximate formula for their general solution. Josell et al. found that coefficients of higher order terms in Cape and Lehman’s equation are not correct and presented the corrected equation as follows [16]:
2
00( ) expn n
n
tT t T A Xτ
∞
=
= ∆ −
∑ (B.3)
2 2 2 12 ( 1) ( 2 ) ,nn n nA X X Y Y −= − ⋅ + +
1/ 2 20 (2 ) (1 /12 11 /1440),X Y Y Y= − +
( )
( ) ( )
( ) ( )
2
3
35 3
47 5
2 4
16 2
3
80 16 ( 1),3
nY YX n
n n
Yn n
Y nn n
= π + −π π
+ − π π
+ − + ≥ π π
where
/T Q C∆ =
Q is the total energy absorbed by the specimen;
C is the heat capacity of the specimen;
20 dτ α= is the characteristic time of heat diffusion across the specimen;
α is the thermal diffusivity of the specimen;
Y=kd/ λ is the Biot number.
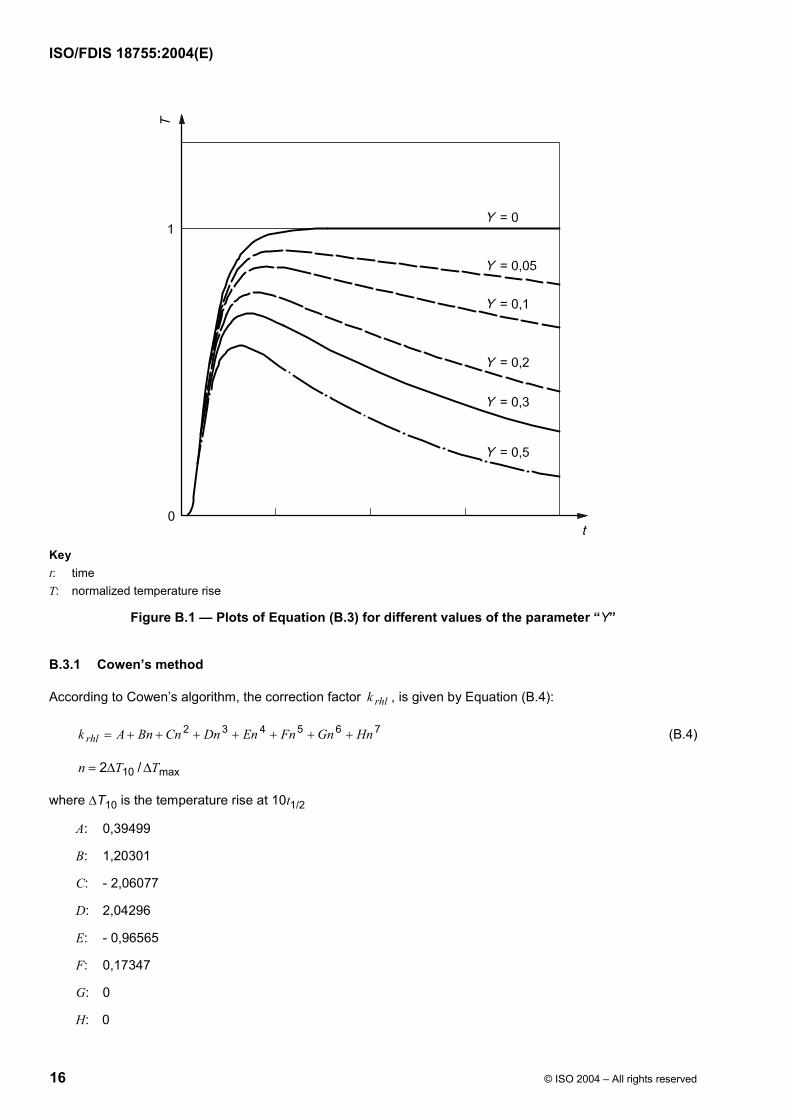
Figure B.1 shows plots of Equation (B.3) for different values of parameter “Y”.
There are a few algorithms to calculate thermal diffusivity from the data obtained by the laser pulse methods which take the radiative heat loss into consideration. Among them, Cowan's method [13] and Clark and Taylor's method [15] are most commonly used. Their methods are in contrast with each other because the former uses the cooling part of the curve, whereas the latter uses the heating part of the curve to correct for the radiative heat loss. Takahashi et al. [17] proposed a correction method similar to Cowan's method. Their method calculates the correction factor for radiative heat loss from the ratio of t1/2 to cτ , which is the characteristic time of heat loss.
In order to apply Cowan's method or Takahashi's method successfully, drift of the steady-state temperature and conduction heat loss must be small. On the other hand, Clark and Taylor's method requires a high signal-to-noise ratio.
ISO/FDIS 18755:2004(E)
16 © ISO 2004 – All rights reserved
Key t: time T: normalized temperature rise
Figure B.1 — Plots of Equation (B.3) for different values of the parameter “Y”
B.3.1 Cowen’s method
According to Cowen’s algorithm, the correction factor rhlk , is given by Equation (B.4):
2 3 4 5 6 7rhlk A Bn Cn Dn En Fn Gn Hn= + + + + + + + (B.4)
10 max2 /n T T= ∆ ∆
where ∆T10 is the temperature rise at 10t1/2
A: 0,39499
B: 1,20301
C: - 2,06077
D: 2,04296
E: - 0,96565
F: 0,17347
G: 0
H: 0

ISO/FDIS 18755:2004(E)
© ISO 2004 – All rights reserved 17
when ∆T5: temperature rise at 5t1/2
A: - 0,74729
B: 8,92744
C: - 28,65631
D: 49,63425
E: - 49,03007
F: 27,78776
G: - 8,41414
H: 1,05579
B.3.2 Azumi and Takahashi’s method [17]
According to this algorithm, the correction factor rhlk , is given by Equation (B.5):
( )1 1 1/ 21 1 1rhlk B A c t= − + ⋅ ⋅ − (B.5)
where the following values should be substituted for A1 and B1:
When L u 0,4
A1 = 96 / (1 + L)
B1 = 0,084
When 0,4 < L u 1,0
A1 = 89 [1 + 1,24 (1 - L) - 2,70 (1 - L)2]
B1 =0,08 [1 - 1,13 (1 - L) + 2,01 (1 - L)2]
When L > 1,0
A1 = 89
B1 = 0,080
where
L = d / r
r is the radius of the specimen, or radius of the circle having the same area as the specimen if the specimen is not a true circle.
ISO/FDIS 18755:2004(E)
18 © ISO 2004 – All rights reserved
B.3.3 Clark and Taylor’s method [15]
Heat-loss corrections based on the Clark and Taylor rise curve data also use ratio techniques. For the 0,75 0,25/t t ratio, which is the time to reach 75 % of maxT∆ divided by the time to reach 25 % of maxT∆ , the
ideal value is 2,272. Determine this ratio from the experimental data. Then calculate the correction factor rhlk from the following equation:
20,75 0,25 0,75 0,250,3461467 0,361578( / ) 0,06520543( / )rhlk t t t t= − + − (B.6)
Corrections based on many other ratios can also be used.
B.4 Correction for thermal expansion
A thermal diffusivity calculated by the procedure in the main text is the apparent thermal diffusivity “ ( )0 Tα ” based on the specimen thickness at room temperature.
The correct thermal diffusivity based on the specimen thickness at the measurement temperature “ ( )Tα ” is derived by the following equation.
( ) ( )2
00
TdT Td
α α
= ⋅
(B.7)
where
0d is the specimen thickness at room temperature;
dT is the specimen thickness at the measurement temperature “T ”.
ISO/FDIS 18755:2004(E)
© ISO 2004 – All rights reserved 19
Annex C (informative)
Data analysis algorithms to calculate thermal diffusivity from
observed temperature history curve under non-ideal initial and boundary conditions
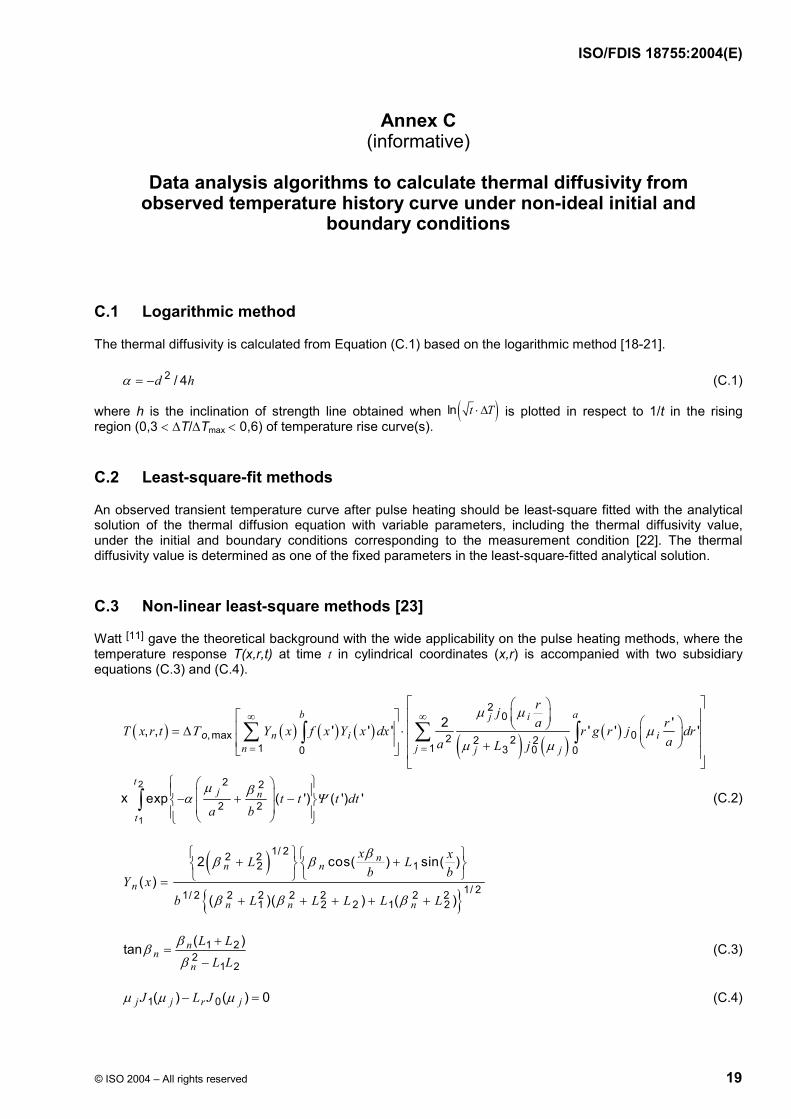
C.1 Logarithmic method
The thermal diffusivity is calculated from Equation (C.1) based on the logarithmic method [18-21].
2 / 4d hα = − (C.1)
where h is the inclination of strength line obtained when ( )ln t T⋅∆ is plotted in respect to 1/t in the rising region (0,3 < ∆T/∆Tmax < 0,6) of temperature rise curve(s).
C.2 Least-square-fit methods
An observed transient temperature curve after pulse heating should be least-square fitted with the analytical solution of the thermal diffusion equation with variable parameters, including the thermal diffusivity value, under the initial and boundary conditions corresponding to the measurement condition [22]. The thermal diffusivity value is determined as one of the fixed parameters in the least-square-fitted analytical solution.
C.3 Non-linear least-square methods [23]
Watt [11] gave the theoretical background with the wide applicability on the pulse heating methods, where the temperature response T(x,r,t) at time t in cylindrical coordinates (x,r) is accompanied with two subsidiary equations (C.3) and (C.4).
( ) ( ) ( ) ( ) ( ) ( )( )
20
, max 02 22 21 1 3 00 0
2 ', , ' ' ' ' ' 'b aj i
n i in j j j
rjraT x r t Y x f x Y x dx r g r j draa L j
µ µΤ µ
µ µ
∞ ∞
= =
= ∆ ⋅ +
∑ ∑∫ ∫ο
x 2
1
2 2
2 2exp ( ') ( ') 't
j n
t
t t t dta b
µ βα Ψ
− + − ∫ (C.2)
( ){ }
1/ 22 22 1
1/ 21/ 2 2 2 2 2 2 21 2 2 1 2
2 cos( ) sin( )( )
( )( ) ( )
nn n
n
n n n
x xL Lb b
Y xb L L L L L
ββ β
β β β
+ + =
+ + + + +
1 22
1 2
( )tan nn
n
L LL L
ββ
β
+=
− (C.3)
1 0( ) ( ) 0j j r jJ L Jµ µ µ− = (C.4)
ISO/FDIS 18755:2004(E)
20 © ISO 2004 – All rights reserved
where
the distribution of a heat pulse is expressed by ( ) ( ) ( )f x g r tΨ 1 2(0 , 0 , )x b x a t t t≤ ≤ ≤ ≤ ≤ ≤ ;
L1, L2, and Lr are Biot numbers of specimen (front, rear and side) surfaces;
a and b are the diameter and thickness of a specimen, respectively;
µn and βj are roots of Equations (C.3) and (C.4), respectively;
∆T0, max is the maximum temperature rise of a specimen at L = 0 (adiabatic condition).
These relations show that thermal diffusivity, non-approximated Biot numbers, pulse width and non-uniformity of pulse can be, in principle, calculated under the assumption of axial symmetry from one transient temperature curve observed in the specified area on a specimen.
The actual data analysis procedures may be carried out on the basis of the Marquart (non-linear regression) method, as shown with the nonlinear operational form of Equation (C.2), the algorithm of data analysis, and some measurement results in [23].
In order to avoid ambiguous estimations, the centroid of pulse tg is at first determined using a sufficiently thin metal foil, then nonuniformity of a pulse is estimated using suitable functions with one of specimens at room temperature, where heat losses are negligibly small. As the centroid position tg and nonuniformity of laser pulses are usually assumed to be constant during experiments, thermal diffusivity, Biot numbers and ∆T0,max (or the corresponding value in a transient radiance curve) can be precisely determined simultaneously under the predetermined parameters including the observed temperature area (diameters). The procedures are also applicable to measure thermal diffusivity of thin films, such as those not covered by this regulation, because the laser heating and observed temperature area may be flexibly controlled and specified on a specimen so as to satisfy Equation (C.2), if the conditions are axial symmetry.
C.4 Equiareal method
The thermal diffusivity value should be determined when the integrated areas from t1 to t2 are equal under the observed transient temperature curve and under the analytical solution of the thermal diffusion equation under the initial and boundary conditions corresponding to the measurement condition [5, 24].
The amplitude of the analytical solution is normalized to the observed transient temperature curve at the maximum temperature if measurements are made under the ideal condition with no heat losses under uniform heating.
Under the general boundary condition with heat losses, the amplitude of the analytical solution is normalized by the asymptotic exponential function of the corresponding analytical solution.
As described in B.3, the equiareal method takes the effect of radiative heat losses from the beginning, since the observed temperature response curve is fitted by Josell’s equation [Equation (B.2)] which is the solution under the heat-loss boundary condition [14, 16].
The equiareal method calculates thermal diffusivity from the transient temperature curve obtained by the laser flash measurement. In contrast to the half-rise-time method, the entire set of the experimental data is fitted by the theoretical curve based on Cape and Lehman’s analysis [14] corrected by Josell et al. [16], which considers the radiative-heat-loss effect exactly. Both thermal diffusivity and Biot number are simultaneously determined by this equiareal method as shown in Figure C.1.

ISO/FDIS 18755:2004(E)
© ISO 2004 – All rights reserved 21
If 0t τ> , the terms of order higher than 2nd can be neglected compared with the 1st term in Equation (B.2). Thus, the specimen temperature converges to the steady-state temperature before the light pulse heating expressed by the following single exponential equation:
20 0
0( ) exp tT t T A X
τ
= ∆ ⋅ −
(C.5)
Consequently, the temperature rise decreases exponentially with the characteristic cooling time of 2
0 0c Xτ τ= . The data analysis procedure to determine thermal diffusivity values by the equiareal method is shown in Figure 2. First, τc is determined by a least-squares fit over the cooling region “ 0t τ> ” of the observed temperature response curve. Then, if either the thermal diffusivity or Biot number is determined, the other is simultaneously fixed. Thus, the thermal diffusivity is determined when the normalized area under Equation (B.2), as a function of t with the parameter 0τ for the fixed region (t1 < t < t2), is equal to the area under the observed temperature response curve for the same time region [5].
One advantage of the equiareal method is that the quality of experimental data can be checked by observing the discrepancy between the experimental data and the theoretical curve. Data of poor quality, such as those affected by nonuniform heating, by drift of steady-state temperature, or by a temperature detection system of slow response time, can be screened out immediately. Thus, only the experimental data of good quality are chosen and the thermal diffusivity values with smaller uncertainty are obtained.
Key X: time (ms) Y: normalised temperature rise
1 exponential function 2 equal area method 3 least-square fit
Figure C.1 — Principle of the equiareal method to calculate thermal diffusivity from a transient temperature curve observed by the laser flash method
ISO/FDIS 18755:2004(E)
22 © ISO 2004 – All rights reserved
Annex D (informative)
Other error factors
D.1 Effect of nonuniform heating
There have been several investigations to analyze heat diffusion and temperature response after nonuniform pulse heating [25-27]. McKay and Schriempf [25] gave a general analytical solution of temperature distribution within the specimen after the front face was heated by a laser beam of arbitrary energy distribution.
D.1.1 Observation of spatial energy distribution of pulse laser beam
It is desirable that the spatial energy distribution of pulse laser is quantitatively measured with a beam profile measurement instrument such as a CCD camera [28]. If those instruments are not available, the beam profile can be checked with a sheet of laser-beam foot print paper.
When the temperature profile is axially symmetric, axial energy distribution of the laser beam can be measured using a laser power meter while changing the aperture size of the field stop before the power meter. The diameter of the aperture size should be typically from 2 mm to the specimen diameter (10 mm standard) by steps of 2 mm.
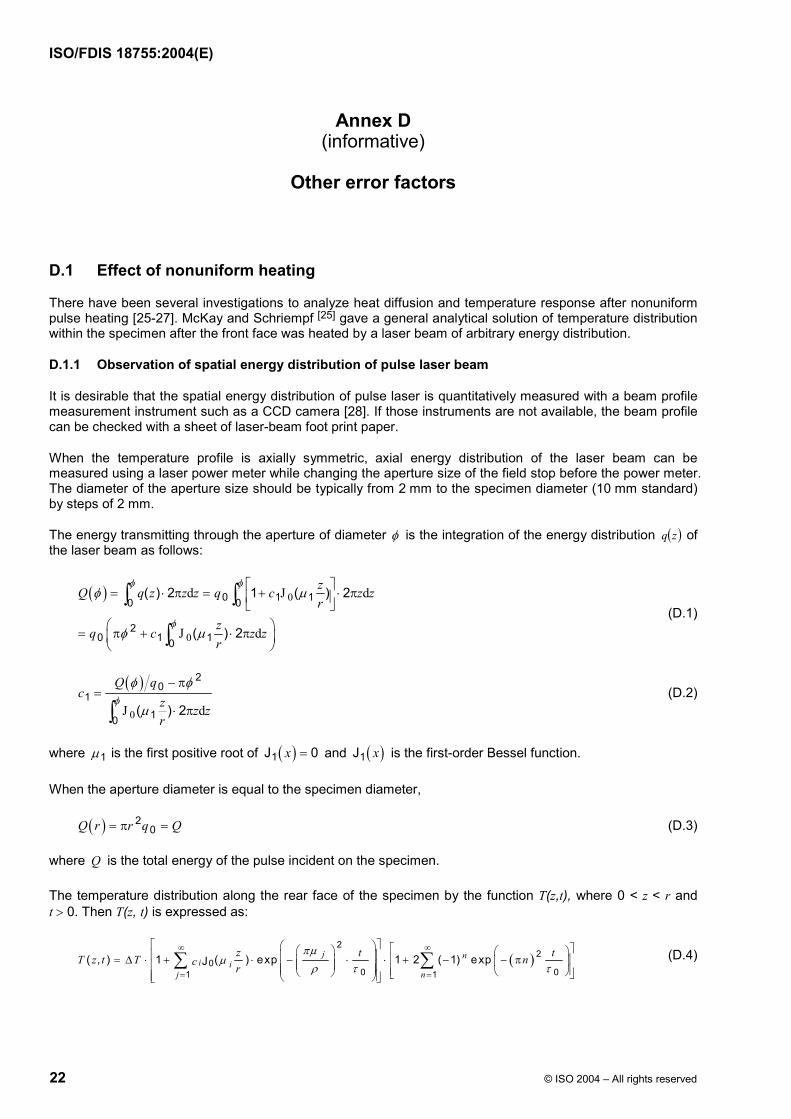
The energy transmitting through the aperture of diameter φ is the integration of the energy distribution ( )zq of the laser beam as follows:
( ) 0
0
d J d
J d
0 1 10 0
20 1 10
( ) 2 1 ( ) 2
( ) 2
zQ q z z z q c z zr
zq c z zr
φ φ
φ
φ µ
φ µ
= ⋅ π = + ⋅ π = π + ⋅ π
∫ ∫
∫ (D.1)
( )
0J d
20
110
( ) 2
Q qc
z z zr
φ
φ φ
µ
− π=
⋅ π∫ (D.2)
where 1µ is the first positive root of ( )1J 0x = and ( )1J x is the first-order Bessel function.
When the aperture diameter is equal to the specimen diameter,
( ) 20Q r r q Q= π = (D.3)
where Q is the total energy of the pulse incident on the specimen.
The temperature distribution along the rear face of the specimen by the function T(z,t), where 0 < z < r and t > 0. Then T(z, t) is expressed as:
( )2
20
0 01 1( , ) 1 ( ) exp 1 2 ( 1) expJ
j ni i
j n
z t tT z t T nc rπµ
µρ τ τ
∞ ∞
= =
= ∆ ⋅ + ⋅ − ⋅ ⋅ + − − π ∑ ∑ (D.4)

ISO/FDIS 18755:2004(E)
© ISO 2004 – All rights reserved 23
where
/T Q C∆ = ;
Q is the total energy absorbed by the specimen;
C is the heat capacity of the specimen;
(2 )pρ π= ;
(2 )p d r= is the thickness to diameter ratio of the specimen;
20 dτ α= is the characteristic time of heat diffusion across the specimen;
α is the thermal diffusivity of the specimen.
The nonuniform heating effect is expressed by the first parenthesis and the second parenthesis corresponds to the normal solution under the uniform heating.
D.1.2 Evaluation of nonuniform heating effect
The temperature response of any combination of p and c1 can be calculated from Equation (D.4), and the apparent thermal diffusivity values, α, can be calculated by the half-rise-time method. Figure D.1 shows the calculated apparent thermal diffusivity values, when temperature is measured at the center of the specimen as a function of thickness to diameter ratio p with a parameter c1.
When the coefficient c1 is positive, the beam has a hot center and when the coefficient c1 is negative, the beam has a cold center. All curves have a maximum (c1 > 0) or minimum (c1 < 0) between p = 0,15 and p = 0,3, where the nonuniform heating effect is largest under irradiation of the laser beam of the same profile.

ISO/FDIS 18755:2004(E)
24 © ISO 2004 – All rights reserved
Key X: ratio of thickness to diameter ( in log scale), p Y: apparent thermal diffusivity (normalised)
Figure D.1 — Calculated apparent thermal diffusivity when temperature is measured at the centre of the specimen as a function of “p” with a parameter “c1”
ISO/FDIS 18755:2004(E)
© ISO 2004 – All rights reserved 25
D.2 Measurements of apparent thermal diffusivity values dependent on light pulse energy
The apparent thermal diffusivity derived from the observed transient radiance curve changes dependent on the light pulse energy, because of nonlinearity of Planck’s equation and temperature dependence of the thermal diffusivity of the specimen [30-34]. Generally, the apparent thermal diffusivity changes as a function of temperature most sensitively at the lowest measurement temperature. Thus, it is recommended that laser flash measurements should be made under different levels of the laser beam energy.
D.3 Measurements of apparent thermal diffusivity values dependent on specimen thickness
In order to characterize the equipment, such as the non-uniformity of pulses, measure the temperature rise curves of several standard specimens different in thickness at room temperature, in accordance with 5.3 [5, 35].
D.4 Uncertainty associated with radiative heat losses
If the radiative-heat-loss correction is not made, the apparent thermal diffusivity value calculated from the observed temperature response curve is larger than the correct value by the ratio 1 rhlk according to Cowan's method, Takahashi’s method, and Clark and Taylor's method.
If the thermal diffusivity is calculated based on least-square-fit methods, non-linear least-square methods or the equiareal method, the correction factor rhlk for the apparent thermal diffusivity value calculated from the observed temperature response curve is given by the data analysis program, simultaneously with the corrected thermal diffusivity value.
D.5 Steady temperature of the specimen
D.5.1 Uncertainty of thermometers
Thermocouples are commonly used in laser flash systems operating over the temperature range of this International Standard (from room temperature to 1700 K). Platinum/platinum-rhodium thermocouples are most commonly used and the uncertainty associated with these types of thermocouples is ± 1,5 K or ± 0,25 % according to the requirements by ISO, unless they are degraded or contaminated. After a series of measurements up to high temperatures, the thermocouple should be recalibrated in order to check if its thermoelectrical response is unchanged after exposure to a high temperature environment.
D.5.2 Temperature difference between the specimen and the sensing part of the thermometer
If the thermal contact between the specimen and the junction of the thermocouple is not enough, there is a temperature difference between them. In this case, it is necessary to investigate the deviation of the specimen temperature from the thermocouple junction temperature systematically.
One of the recommended procedures is to prepare another thermocouple and to paste its junction to the specimen with good thermal contact. Record the indication of both the regularly used thermocouple and the temporarily pasted thermocouple, from room temperature to the highest temperature of the measurements. Then, the reproducibility of the deviation can be checked and the conversion table from the regularly used thermocouple temperature to the specimen temperature can be obtained.
D.5.3 Effective temperature of the specimen after light pulse heating
Since thermal diffusivities of materials change dependent on temperature, there is a fundamental problem concerning how to assign the effective temperature to the transient measurement with variation of temperature distribution over the specimen after the laser pulse heating. According to numerical simulations,

ISO/FDIS 18755:2004(E)
26 © ISO 2004 – All rights reserved
the measured thermal diffusivity value should be assigned to the effective temperature calculated as T0 + ∆Tmax, where T0 is the steady temperature of the specimen immediately before the pulse heating [36].
In order to know the value of ∆T max, the temperature response at the rear face of the specimen must be measured with a radiation thermometer calibrated with the temperature scale. If a radiation detector is used for relative measurements of the temperature response, ∆T max shall be estimated from the indication of other thermometers, such as a thermocouple contact with the specimen.
D.5.4 Uncertainty of effective temperature of the specimen
Since it is difficult to evaluate the absolute value of ∆T max the major factors contributing to uncertainty of effective temperature of the specimen are uncertainty of the steady-state temperature of the specimen, T0, and uncertainty of the maximum temperature rise, ∆T max.
D.5.5 Extrapolation of apparent thermal diffusivity value dependent on the laser pulse energy
As described in the previous subclause, the apparent thermal diffusivity derived from the observed transient radiance curve changes dependent on the light pulse energy, because of the nonlinearity of Planck’s equation and temperature dependence of thermal diffusivity of the specimen. In principle, when the light pulse energy is infinitesimal, the apparent thermal diffusivity should be equal to the intrinsic thermal diffusivity at the steady-state temperature before the pulse heating. The thermal diffusivity corresponding to the infinitesimal laser pulse energy can be extrapolated from the series of apparent thermal diffusivity values measured when changing the laser pulse energy [5, 35].
D.6 Transient temperature of the specimen
D.6.1 Nonlinearity of Planck’s equation
The spectra radiance, at wavelength Λ from a blackbody of temperature T, is expressed by Planck’s equation as follows:
15 1
2 1( , )exp 1
cL TcT
ΛΛ
Λ
= − −
(D.5)
where
c1 = 5,9548 × 10⁻¹⁷ Wm2 is the first radiation constant;
c2 = 0,014388 mK is the second radiation constant.
It should be noted that this equation is highly nonlinear, and linear approximation is not satisfactory even over the narrow range as small as 10 K. For example, the spectral radiance change from 25 oC to 30 oC is 18 %, larger than that from 20 oC to 25 oC [33].
D.6.2 Calibration of radiation thermometer
In order to observe the transient “temperature” change of the specimen rear face after the impulse heating instead of transient “spectral radiance”, the radiation thermometer should be calibrated using black body cavities in the temperature range from 0 oC to 200 oC, where nonlinear dependence of the output temperature must be corrected for accurate thermal diffusivity measurements [33-34].
D.6.3 Uncertainty associated with individual measurements
Even if a radiation thermometer is calibrated to the temperature standard with small uncertainty, a number of conditions must be satisfied as follows, dependent on a particular environment in order to measure the absolute value of temperature response after the pulse heating.
ISO/FDIS 18755:2004(E)
© ISO 2004 – All rights reserved 27
The radiation thermometer must observe only radiation from the central part of the specimen rear face free from stray lights.
Emissivity of the observed face of the specimen must be high and the value of emissivity must be known.
D.7 Time response of transient temperature measurements
D.7.1 Observation
D.7.1.1 Impulse response
Overall time responsivity of transient temperature measurements, considering the response of the radiation thermometer and the electronics can be evaluated by the temperature response curve at the rear face of a metal foil thinner than 100 µm after its front face is heated by a light pulse shorter than 10 µs. The observed temperature response curve can be considered as the impulse response function “ ( )R t ” of the total unit for transient temperature measurements.
D.7.1.2 Sinusoidal response
Overall time responsivity of transient temperature as a function of frequency can be measured using an infrared light emitting diode (IR-LED) operated in current modulation mode in the frequency region from 1 Hz up to 100 kHz [37]. The amplitude and the phase of the signal from a radiation thermometer should be constant at least over the frequency from 1 Hz to 10 kHz [37].
D.8 Coating
D.8.1 Uncertainty associated with coating
It is not easy to evaluate uncertainty associated with coating, because it is very difficult to measure a reliable value of effective thickness and thermophysical properties of the coating layer.
The uncertainty can be reduced If a coating layer is thin enough for the heat diffusion time across it to be negligible compared with that across the specimen although the coating layer is dense, and durable enough to prevent transmission of light pulses.
ISO/FDIS 18755:2004(E)
28 © ISO 2004 – All rights reserved
Annex E (informative)
Reference data and reference materials of thermal diffusivity
E.1 Reference data
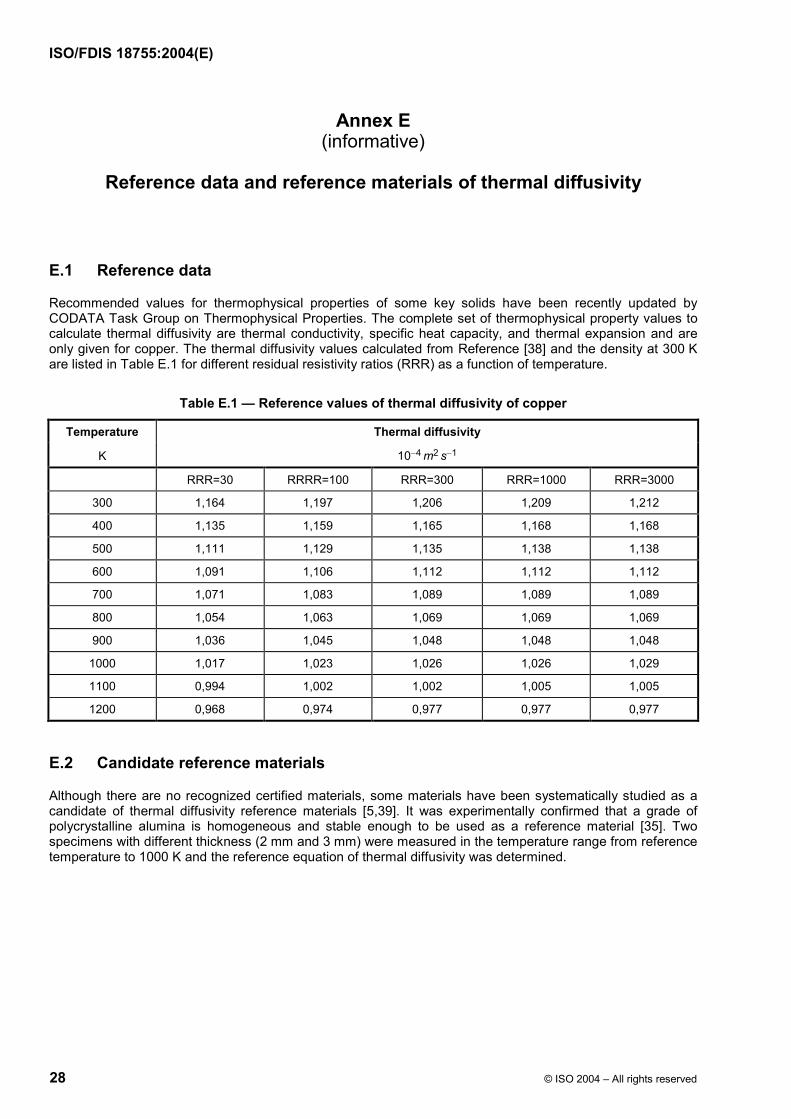
Recommended values for thermophysical properties of some key solids have been recently updated by CODATA Task Group on Thermophysical Properties. The complete set of thermophysical property values to calculate thermal diffusivity are thermal conductivity, specific heat capacity, and thermal expansion and are only given for copper. The thermal diffusivity values calculated from Reference [38] and the density at 300 K are listed in Table E.1 for different residual resistivity ratios (RRR) as a function of temperature.
Table E.1 — Reference values of thermal diffusivity of copper
Temperature Thermal diffusivity
K 10−4 m2 s−1
RRR=30 RRRR=100 RRR=300 RRR=1000 RRR=3000
300 1,164 1,197 1,206 1,209 1,212
400 1,135 1,159 1,165 1,168 1,168
500 1,111 1,129 1,135 1,138 1,138
600 1,091 1,106 1,112 1,112 1,112
700 1,071 1,083 1,089 1,089 1,089
800 1,054 1,063 1,069 1,069 1,069
900 1,036 1,045 1,048 1,048 1,048
1000 1,017 1,023 1,026 1,026 1,029
1100 0,994 1,002 1,002 1,005 1,005
1200 0,968 0,974 0,977 0,977 0,977
E.2 Candidate reference materials
Although there are no recognized certified materials, some materials have been systematically studied as a candidate of thermal diffusivity reference materials [5,39]. It was experimentally confirmed that a grade of polycrystalline alumina is homogeneous and stable enough to be used as a reference material [35]. Two specimens with different thickness (2 mm and 3 mm) were measured in the temperature range from reference temperature to 1000 K and the reference equation of thermal diffusivity was determined.

ISO/FDIS 18755:2004(E)
© ISO 2004 – All rights reserved 29
Bibliography
[1] PARKER, W.J., JENKINS, R.J., BUTLER, C.P., ABOTT, G.L., Flash Method of Determining Thermal Diffusivity, Heat Capacity, and Thermal Conductivity, J. Appl. Phys., 32 (1961) pp.1679-1684
[2] RIGHINI, F., CEZAIRLIYAN, A., High Temperatures-High Pressures, 5 (1973) p 481
[3] Ed. by TAYLOR, R.E. & K.D., Maglic: Compendium of Thermophysical Property Measurement Methods vol. 1, Survey of Measurement Techniques (Plenum, 1984)
[4] Ed. by TAYLOR, R.E. & K.D., Maglic: Compendium of Thermophysical Property Measurement Methods vol. 2, Recommended Measurement Techniques and Practices, (Plenum, 1992)
[5] BABA, T., ONO, A., Improvement of the laser flash method to reduce uncertainty in thermal diffusivity measurements, Meas. Sci. Technol. 12 (2001) pp. 2046–2057
[6] LARSON, K.B., KOYAMA, K., Correction for Finite-Pulse-Tme Effects in Very Thin Samples using the Flash Method of Measuring Thermal Diffusivity, J. Appl. Phys., 38 (1967) pp. 465-474
[7] TAYLOR, R.E., CLARK, III L.M., Finite Pulse Time Effects in Flash Diffusivity Method, High Temp. - High Press., 6 (1974) pp. 65-72
[8] XUE, J., LIU, X., LIAN, Y., TAYLOR, R., The Effects of a Finite Pulse Time in the Flash Thermal Diffusivity Method, Int. J. Thermophysics, 14 (1993) pp. 123-133
[9] AZUMI, T., TAKAHASHI, Y., Novel Finite Pulse-width Correction in Flash Thermal Diffusivity Measurement, Rev. Sci. Instrum., 52 (1981) pp. 1411-1413
[10] TAYLOR, R., Construction of Apparatus for Heat Pulse Thermal Diffusivity Measurements from 300-3000 K, J. Phys. E: Sci. Instrum., 13 (1980) pp. 1193-1199
[11] WATT, D.A., Theory of Thermal Diffusivity by Pulse Technique, Brit. J. Appl. Phys., 17 (1966) pp. 231-240
[12] HECKMAN, R.C., Finite Pulse-time and Heat-loss Effects in Pulse Thermal Diffusivity Measurements, J. Appl. Phys., 44 (1973) pp. 1455-1460
[13] COWAN, R.D., Pulse Method of Measuring Thermal Diffusivity at High Temperatures, J. Appl. Phys., 34 (1963) pp. 926-927
[14] CAPE, J.A., LEHMAN, G.W., Temperature and Finite Pulse-Time Effects in the Flash Method for Measuring Thermal Diffusivity, J. Appl. Phys., 34 (1963) pp. 1909-1913
[15] CLARK, III L.M., TAYLOR, R.E, Radiation Loss in the Flash Method for Thermal Diffusivity, J. Appl. Phys., 46 (1975) pp. 714-719
[16] JOSELL, D., WARREN, J., CEZAIRLIYAN, A., Correcting an Error in Cape and Lehman's Analysis for Determining Thermal Diffusivity from Thermal Pulse Experiments, J. Appl. Phys. 78 (1995) p 6867
[17] JIS, R., 1611: 1997, Test methods of thermal diffusivity, specific heat capacity, and thermal conductivity for fine ceramics by laser flash method
[18] TADA, Y., HARADA, H., TANIGAKI, M., EGUCHI, W., Rev. Sci. Instrum., 49 (1978) p 1305
[19] JAMES, H.M., Some Extensions of the Flash Method of Measuring Thermal Diffusivity, J. Appl. Phys., 51 (1980) pp. 4666-4672
ISO/FDIS 18755:2004(E)
30 © ISO 2004 – All rights reserved
[20] TAKAHASHI, Y., YAMAMOTO, K., OHSATO, T., Advantage of Logarithmic Method - A New Method for Determining Thermal Diffusivity - in the Laser-flash Technique, Calorimetry and Thermal Analysis, 15 (1988) pp. 103-109
[21] GEMBAROVIC, J., TAYLOR, R.E., Use of Laplace Transform for Data Reduction in the Flash Method of Measuring Thermal Diffusivity, Int. J. Thermophysics, 14 (1993) pp. 297-311
[22] BEEDHAM, K., DALRYMPLE, I.P., The Measurement of Thermal Diffusivity by the Flash Method. An Investigation into Errors Arising from the Boundary Conditions, Rev. int. Hautes Temper. et Refract., 7 (1970) pp. 278-283
[23] MITSUHASHI, T., Extended Flash Method on Thermal Diffusivity Measurement of Solids, JAERI-M-92-207 (1992), pp. 302-307
[24] CEZAIRLIYAN, A., BABA, T., TAYLOR, R., High-Temperature Laser-Pulse Thermal Diffusivity Apparatus, Int. J. Thermophysics, 15 (1994) pp. 317-341
[25] SCHRIEMPF, J.T., A Laser Flash Technique for Determining Thermal Diffusivity of Liquid Metals at Elevated Temperatures, Rev. Sci. Instrum., 43 (1972) pp. 781-786
[26] BEEDHAM, K., DALRYMPLE, I.P., The Measurement of Thermal Diffusivity by the Flash Method. An Investigation into Errors Arising from the Boundary Conditions, Rev. int. Hautes Temper. et Refract., 7 (1970) pp. 278-283
[27] MCKAY, J.A., SCHRIEMPF, J.T., Corrections for Nonuniform Surface Heating Errors in Flash-method Thermal-diffusivity Measurements, J. Appl. Phys., 47 (1976) pp. 1668-1671
[28] BABA, T., KOBAYASHI, M., ONO, A., HONG, J.H., Experimental investigation of the nonuniform heating effect in laser flash thermal diffusivity measurements, Thermochimica Acta, 218 (1993) pp. 329-339.
[29] BABA, T., HONG, J.H., ONO, A., Application of Optical Fibers to The Improvement of Laser Beam Profile for Laser Flash Thermal Diffusivity Measurements, Proc. 2nd Asian Thermophys. Prop. Conf., 2 (1989) pp. 127-133
[30] HASSELMAN, D.P.H., MEKEL, G., CERAM, J. Am. Soc., 72 (1989) pp. 967
[31] HASSELMAN, D.P.H., DONALDSON, K.Y., Effects of Detector Nonlinearity and Specimen Size on the Apparent Thermal Diffusivity of NIST 8425 Graphite, Int. J. Thermophysics, 11 (1990) pp. 573-585
[32] HOEFLER, J.J., TAYLOR, R.E., Effects of Infrared Detector Nonlinearity on Thermal Diffusivity Measurements Using the Flash Method, Int. J. Thermophysics, 11 (1990) pp. 1099-1110
[33] BABA, T., KOBAYASHI, M., ONO, A., Nonlinearity effect of radiation thermometry in laser flash thermal diffusivity measurements, Jpn. J. Thermophys. Prop., 7 (1993) pp. 156-158
[34] KOBAYASHI, M., BABA, T., ONO, A., Infrared radiation thermometer for laser flash thermal diffusivity measurements, Jpn. J. Thermophys. Prop., 8 (1994) pp. 143-148
[35] OGAWA, M., MUKAI, K., FUKUI, T., BABA, T., The development of a thermal diffusivity reference material using alumina, Meas. Sci. Technol. 12 (2001) pp. 2058–2063
[36] OHTA, H., BABA, T., SHIBATA, H., WASEDA, Y., Evaluation of the Effective Sample Temperature in Thermal Diffusivity Measurements Using the Laser Flash Method, International Journal of Thermophysics, 23, (2002) pp. 1659-1668
[37] ISHII, J., BABA, T., Time-response Measurement of the Infrared Radiation Thermometer, Jpn. J. Thermophys. Prop., 13 (1999) pp. 70-72

ISO/FDIS 18755:2004(E)
© ISO 2004 – All rights reserved 31
[38] WHITE, G.K., MINGES, M.L., Thermophysical Property of Some Key Solids: An Update, Int. J. Thermophysics, 18 (1997) pp. 1269-1327
[39] BABA, T., CEZAIRLIYAN, A., Thermal Diffusivity of POCO AXM-5Q1 Graphite in the Range 1500 to 2500 K, Int. J. Thermophysics, 15 (1994) pp. 343-364

ISO/FDIS 18755:2004(E)
ICS 81.060.30 Price based on 31 pages
© ISO 2004 – All rights reserved