final mla annual report 2018-19 lr
TRANSCRIPT

ANNUAL REPORT 2018–19
Fostering prosperity
to the Australian red meat and
livestock industry
years’ service20

OVERVIEW
MLA at a glance 2
2018–19 highlights 4
Chair’s report 6
Managing Director’s report 8
2018–19 summary statistics 10
ABOUT MLA
What we do 53
How we work 54
How we’re funded 56
How we’re governed 57
Who we are 63
MLA organisational chart 67
Our subsidiary companies 68
Human resources 69
FINANCIAL REPORT
Financial summary 71
Directors’ report 74
Financial statements 77
REPORT TO STAKEHOLDERS
Strategic Plan 2016–2020: pillar overview 12
Pillar 1 Consumer and community support 14
Pillar 2 Market growth and diversification 22
Pillar 3 Supply chain efficiency and integrity 28
Pillar 4 Productivity and profitabliity 34
Pillar 5 Leadership and collaborative culture 42
Pillar 6 Stakeholder engagement 48
SUPPORTING INFORMATION
Appendix A. Status of MLA’s 2018–19 key performance indicators 100
Appendix B. CoMarketing Program participants 2018–19 114
Appendix C. Rural R&D for Profit projects 115
Acronyms, glossary and index 117
Contents
Auditors: EY
Bankers: Commonwealth Bank
MLA acknowledges the matching funds provided by the Australian Government to support the research and development detailed in this report.
Numbers in graphs and tables within the report may be affected by rounding.
© Meat & Livestock Australia 2019 ABN 39 081 678 364
This work is copyright. Apart from any use permitted under the Copyright Act 1968, all rights are expressly reserved. Requests for further authorisation should be directed to the Corporate Publications and Communications Manager, PO Box 1961, North Sydney NSW 2059 or [email protected]
Published September 2019
This report is printed on Precision Offset Laser, an environmentally responsible paper manufactured under the environmental management system ISO 14001 using Elemental Chlorine Free pulp sourced from sustainable forests.

Report to stakeholders
About
MLA
Financial report
Supporting inform
ation
Meat & Livestock Australia is here to improve the profitability, sustainability and global competitiveness of Australia’s red meat and livestock industry.
Every R&D project, every marketing activity, is carried out with the single purpose of fostering prosperity for beef, lamb and goat producers across the country.Jason Strong, MLA Managing Director ‘Managing Director’s report’, page 8
1
Overview

2
Our stakeholders
MLA works in partnership with industry and government to deliver products and services to the cattle, sheep and goat industries, and other entities along the supply chain.
Through the Science and Research Priorities and the Rural Research, Development and Extension Priorities, the Australian Government sets high-level priority research and development objectives covering community, industry and environmental concerns.
Peak industry councils are bodies prescribed by the Australian Government and provide policy direction, scrutinise budgets and monitor MLA’s performance on behalf of the red meat and livestock industry. These are the Australian Lot Feeders’ Association, Cattle Council of Australia, Goat Industry Council of Australia and Sheep Producers Australia.
MLA also works closely with the Australian Meat Processor Corporation, Australian Meat Industry Council, LiveCorp and Australian Livestock Exporters’ Council to develop programs that address key industry issues and opportunities through the supply chain, manage projects and communicate outcomes. See pages 54–55 for more on how MLA engages with its stakeholders and collaborators.
Processors and livestock exporters also co-invest levies into MLA programs through their service companies: Australian Meat Processor Corporation and Australian Livestock Export Corporation (LiveCorp). Individual exporters and importers can also co-invest with MLA on marketing activities.
MLA generates additional income via eligible commercial funding contributions which are matched by the Australian Government. This funding is invested in research and development partnerships that benefit the Australian red meat industry through MLA Donor Company.
Integrity Systems Company also receives additional income via the sale of national vendor declaration books and the Livestock Production Assurance program accreditation fee.
Our members
Membership of MLA is voluntary and free to all levy-paying grassfed cattle, grainfed cattle, sheep, lamb and goat producers. MLA had 49,692 members at 30 June 2019 (page 55).
Our history
MLA was established in 1998 as a public company limited by guarantee, following the merging of two industry statutory organisations – the Australian Meat & Livestock Corporation and the Meat Research Corporation. MLA is the declared industry marketing body and the industry research body under sections 60(1) and 60(2) of the Australian Meat and Live‑stock Industry Act 1997.
Our funding
MLA is primarily funded by transaction levies paid on livestock sales by red meat producers. The Australian Government also contributes a dollar for each levy dollar MLA invests in research and development. Other funding streams come from specific unmatched grants from the Australian Government and cooperative funding contributions from other Research and Development Corporations, individual processors, wholesalers, foodservice operators and retailers.
To foster the long-term prosperity of the Australian red meat and livestock industry.
To be the recognised leader in delivering world-class research, development and marketing outcomes that benefit the Australian red meat and livestock industry.
To collaborate with stakeholders to invest in research, development and marketing initiatives that contribute to producer profitability, sustainability and global competitiveness.
MLA at a glance
OUR FOUNDATIONS
Additional investment areas, while not considered strategic pillars, are: corporate services, levy management and AUS-MEAT.
Consumer and community
support
Market growth and
diversification
Supply chain efficiency and
integrity
Productivity and
profitability
Leadership and collaborative
culture
Stakeholder engagement
OUR STRATEGIC PILLARS
• customer centricity
• accountability through transparency
• outcomes that make a difference.
OUR VALUESOUR MISSIONOUR VISIONOUR PURPOSE

3
Overview
Report to stakeholders
About
MLA
Financial report
Supporting inform
ation
Our subsidiary companies
MLA owns two subsidiary companies.
MLA Donor Company works in partnership with investors in areas that bring value to the red meat supply chain through innovation and new technologies (page 68).
Integrity Systems Company administers the National Livestock Identification System database which records livestock movements. It is also responsible for the Livestock Production Assurance program and National Vendor Declarations (page 68).
Our decision making processes
MLA doesn’t make investment decisions in isolation. This is carried out in collaboration with producers, the government, peak industry councils and other industry organisations (see ‘Our stakeholders’ and pages 54–55 for other consultation mechanisms). The regional consultation framework (page 36), which commenced in the second half of 2015, enables producers to have direct input into MLA’s research and development priorities.
Our employeesAt 30 June 2019 MLA had 271 employees across eight countries. MLA’s workforce profile reflects a balanced gender profile and age distribution across the organisation (page 69). More than 52% of employees are from a rural background.
Washington DC
BrusselsLondon*
Dubai
TokyoSeoul
Ho Chi Minh*
SingaporeMalaysia*
Jakarta
BrisbaneSydney
Armidale
Beijing
Taiwan*
* MLA has a presence through local agents in these locations but does not have registered offices
Community engagement events
MSA
Regional consultationProducer Demonstration Sites
Adoption events and workshops
These locations are in addition to 83 events sponsored by MLA
Our engagement in 2018–19
Adoption events and workshops Community engagement events Regional consultation activities Producer Demonstration Sites MSA workshops
Our locations MLA employees are based strategically to leverage the best possible access to all stakeholders and to drive demand for red meat in our key markets.
These locations are in addition to 83 events sponsored by MLA.

4
20 years’
service to industry celebrated by MLA at
flagship event Red Meat 2018 (page 51)
Highlights from major projects MLA has led, managed or contributed to include:
2018–19 highlights
Psyllid-resistantleucaena variety and Di-Bak Parkinsonia
released (pages 36–37)
Australian beef
became an official partner of Australia’s 2020 Olympic
and Paralympic teams (page 21)
57%reduction in
greenhouse gas emissions by the Australian red meat
industry between 2005 and 2016 (page 19)
25%increase in retail lamb
sales following the MLA summer lamb campaign
(page 26)
100,000Australian lamb meals served in new airline
partnership (page 27)
$198min additional farm gate returns through Meat Standards Australia
(page 31)
21.6%of total supply chain
movements from eNVDs, following a range of
improvements to the system (page 33)
Fivelamb processors and
one beef abattoir adopted DEXA technology
(page 39)

5
NOVEMBER 2018MLA held its flagship event, Red Meat 2018, in Canberra (page 51), where it announced Australian beef as the official partner of the 2020 Australian Olympic Team (page 21).
OCTOBER 2018Tedera, a new variety of forage legume that can significantly reduce the need to supplementary feed sheep through summer and autumn, was officially launched in WA (mla.com.au/tedera).
SEPTEMBER 2018The State of the Industry Report 2018, compiled by MLA on behalf of the red meat industry, was launched at Parliament House and outlines key consumption, production, export and economic data (page 45).
AUGUST 2018MLA launched Good Meat, an online platform providing consumers with an open, trusted source of information about the production of red meat in Australia (page 16).
DECEMBER 2018LEAP V, an automated bone-in forequarter processing module, was installed at two plants to further improve carcase value, increase efficiencies and deliver operator safety (mla.com.au/leapv).
JULY 2018Following the official launch of Australia-European Union Free Trade Agreement negotiations, MLA hosted a barbecue in Brussels, Belgium, to promote Australian red meat to EU decision-makers (page 25).
MAY 2019Di-Bak Parkinsonia, a new tool to fight the noxious woody weed Parkinsonia, was launched and is now available to producers (page 37).
APRIL 2019MLA welcomed its new Managing Director, Jason Strong. Turn to page 8 to read his opening message.
MARCH 2019Three more lamb processing facilities were lined up to install DEXA technology, paving the way for more timely, accurate and objective carcase information (page 39).
FEBRUARY 2019Brian the Butcher returns to launch the ‘Australian Beef. The Greatest’ autumn campaign, boosting mean number of beef serves a week by 9% (page 26).
JANUARY 2019MLA’s summer lamb campaign launched, resulting in a 25% increase in domestic retail lamb sales (page 26).
JUNE 2019Redlands, the first psyllid-resistant variety of leucaena, was released into the commercial market, opening up large areas for leucaena-based grazing in northern Australia (page 36).
TIMELINE OF ACHIEVEMENTS Overview

6
I’m pleased to present MLA’s Annual Report 2018–19: Celebrating 20 years’
service to the Australian red meat and livestock industry.
It’s been a really tough year for many key production regions throughout Australia, particularly for those affected by drought and the tragic Queensland floods in February. However, despite the many challenges – as well as the increased prevalence of anti-red meat protests making news headlines – our red meat producers remain as resilient as ever.
2018–19 saw the delivery of several important on-farm research and development (R&D) outcomes for producers, including the commercial releases of a psyllid-resistant variety of leucaena (page 36) and a new tool to fight the woody weed parkinsonia (page 37).
More than $6 million worth of R&D investments were influenced via direct red meat producer input through the Regional Consultation annual call, which I encourage you to read more about on page 36.
In markets, beef and lamb continue to be staples on our nation’s dinner tables (page 26), with Australia remaining our
competition in Japan and Korea, while South American suppliers have also increasingly switched their focus to the Chinese market. Notwithstanding, China will remain a significant market for Australian beef.
Sheepmeat market
KEY TRENDS
• national flock size decreased
• record sheep and lamb prices
• sheepmeat exports continue to benefit from strong global demand
Substantial culling of breeding ewes and generally poor lambing rates underpinned a fall in the national flock in 2018–19 as drought conditions persisted for many sheepmeat-producing regions.
Despite the challenges faced, sheep and lamb prices benefited from strong global demand, with domestic saleyard prices reaching records levels during the year. Tightening New Zealand supplies, a low Australian dollar and demand from key export markets – namely the US and China – have supported increased lamb and mutton exports.
Goat market
KEY TRENDS
• sharp fall in goat supply
• goat prices reached record levels
• the US remains the key market for goatmeat
Goat supplies continued to contract in 2018–19 as the persistent poor seasonal conditions saw slaughter levels ease across all states during the year. With a
highest-value market. Support for red meat has been steady, backed up by the quality product we produce.
Our red meat is hugely popular around the world and we remain a small but very important contributor to global export markets. Market access is key – for example, negotiations in the EU have provided the first opportunity in more than 40 years to potentially secure additional access for Australian beef, sheepmeat and goatmeat (page 24).
Cattle and beef market
KEY TRENDS
• accelerated herd contraction
• store market under pressure as finished cattle prices find support
• robust international demand in key markets
Widespread dry conditions persisted this year, limiting feed availability and generating severe stock water shortages. The challenging conditions saw many producers destock or significantly reduce their breeding herds. The national herd contracted significantly throughout 2019, reflecting the impacts of ongoing drought and the devastating floods in north-west Queensland.
Prices for finished cattle have improved this year, supported by robust demand from Australia’s key international markets and the low Australian dollar. Young cattle prices were reasonably subdued due to limited restocker interest as conditions deteriorated.
On the back of growing US exports, Australian beef experienced increased
Board business, industry trends and outlook
Beef and veal EYCI
2000
2100
2200
2300
2400
2500
2600
2700
250
260
270
280
290
300
310
kg/head
’00
0 to
nnes
cw
t
A¢/
kg c
wt
200
8
Jan
Feb
Mar
Apr
May Jun
Jul
Aug Se
p
Oct
Nov
Dec
2010
2014
2012
2016
2018
2020
f
2022
f
2010
200
8
2012
2014
2016
2018
f
2020
f
2022
f
Sources: ABS, MLA forecasts Sources: ABS, MLA
ProductionCarcase weight
201820195-year average
201820195-year average
350
400
450
500
550
600
Trade lambs
Ac/
kg c
wt
Jan
Feb
Mar
Apr
May Jun
Jul
Aug Se
p
Oct
Nov
Dec
Sources: ABS, MLA
500
600
700
800
900
1000
Beef exports
’00
0 to
nnes
sw
t
Source: DAWR
Beef exports
800
900
1000
1100
1200
1300
1400
Beef and veal EYCI
2000
2100
2200
2300
2400
2500
2600
2700
250
260
270
280
290
300
310
kg/head
’000
tonn
es c
wt
A¢/
kg c
wt
2008 Ja
n
Feb
Mar
Apr
May Jun
Jul
Aug Se
p
Oct
Nov
Dec
2010
2014
2012
2016
2018
2020
f
2022
f
2010
2008
2012
2014
2016
2018
f
2020
f
2022
f
Sources: ABS, MLA forecasts Sources: ABS, MLA
ProductionCarcase weight
201820195-year average
201820195-year average
350
400
450
500
550
600
Trade lambs
Ac/
kg c
wt
Jan
Feb
Mar
Apr
May Jun
Jul
Aug Se
p
Oct
Nov
Dec
Sources: ABS, MLA
500
600
700
800
900
1000
Beef exports
’000
tonn
es s
wt
Source: DAWR
Beef exports
800
900
1000
1100
1200
1300
1400
Beef and veal EYCI
2000
2100
2200
2300
2400
2500
2600
2700
250
260
270
280
290
300
310
kg/head
’00
0 to
nnes
cw
t
A¢/
kg c
wt
200
8
Jan
Feb
Mar
Apr
May Jun
Jul
Aug Se
p
Oct
Nov
Dec
2010
2014
2012
2016
2018
2020
f
2022
f
2010
200
8
2012
2014
2016
2018
f
2020
f
2022
f
Sources: ABS, MLA forecasts Sources: ABS, MLA
ProductionCarcase weight
201820195-year average
201820195-year average
350
400
450
500
550
600
Trade lambsA
c/kg
cw
t
Jan
Feb
Mar
Apr
May Jun
Jul
Aug Se
p
Oct
Nov
Dec
Sources: ABS, MLA
500
600
700
800
900
1000
Beef exports
’00
0 to
nnes
sw
t
Source: DAWR
Beef exports
800
900
1000
1100
1200
1300
1400
Chair’s report
BEEF AND VEAL PRODUCTION AUSTRALIAN BEEF EXPORTSEASTERN YOUNG CATTLE INDICATOR
Dr Michele Allan, Chair

7
Overview
Report to stakeholders
About
MLA
Financial report
Supporting inform
ation
Lamb Trade lambs
300
350
400
450
500
550
20.0
20.5
21.0
21.5
22.0
22.5
23.0
23.5
kg/head
’000
tonn
es c
wt
A¢/
kg c
wt
200
8
Jan
Feb
Mar
Apr
May Jun
Jul
Aug Se
p
Oct
Nov
Dec
2010
2012
2014
2016
2018
2020
2022
f
2010
200
8
2012
2014
2016
2018
f
2020
f
2022
f
Sources: ABS, MLA forecasts Sources: ABS, MLA
ProductionCarcase weight
500
600
700
800
900
1000
Goat
A¢/
kg c
wt
Jan
Feb
Mar
Apr
May Jun
Jul
Aug Se
p
Oct
Nov
Dec
Sources: ABS, MLA
400
500
600
700
800
900
1000
Lamb exports
’00
0 to
nnes
sw
t
Source: DAWR
Lamb exports
100
150
200
250
300
201820195-year average
201820195-year average
GOAT OVER-THE-HOOKS INDICATOR
Lamb Trade lambs
300
350
400
450
500
550
20.0
20.5
21.0
21.5
22.0
22.5
23.0
23.5
kg/head’0
00 to
nnes
cw
t
A¢/
kg c
wt
200
8
Jan
Feb
Mar
Apr
May Jun
Jul
Aug Se
p
Oct
Nov
Dec
2010
2012
2014
2016
2018
2020
2022
f
2010
200
8
2012
2014
2016
2018
f
2020
f
2022
f
Sources: ABS, MLA forecasts Sources: ABS, MLA
ProductionCarcase weight
500
600
700
800
900
1000
Goat
A¢/
kg c
wt
Jan
Feb
Mar
Apr
May Jun
Jul
Aug Se
p
Oct
Nov
Dec
Sources: ABS, MLA
400
500
600
700
800
900
1000
Lamb exports
’00
0 to
nnes
sw
t
Source: DAWR
Lamb exports
100
150
200
250
300
201820195-year average
201820195-year average
AUSTRALIAN LAMB EXPORTS
Lamb Trade lambs
300
350
400
450
500
550
20.0
20.5
21.0
21.5
22.0
22.5
23.0
23.5
kg/head
’000
tonn
es c
wt
A¢/
kg c
wt
200
8
Jan
Feb
Mar
Apr
May Jun
Jul
Aug Se
p
Oct
Nov
Dec
2010
2012
2014
2016
2018
2020
2022
f
2010
200
8
2012
2014
2016
2018
f
2020
f
2022
f
Sources: ABS, MLA forecasts Sources: ABS, MLA
ProductionCarcase weight
500
600
700
800
900
1000
Goat
A¢/
kg c
wt
Jan
Feb
Mar
Apr
May Jun
Jul
Aug Se
p
Oct
Nov
Dec
Sources: ABS, MLA
400
500
600
700
800
900
1000
Lamb exports
’00
0 to
nnes
sw
t
Source: DAWR
Lamb exports
100
150
200
250
300
201820195-year average
201820195-year average
AUSTRALIAN LAMB PRODUCTIONLamb Trade lambs
300
350
400
450
500
550
20.0
20.5
21.0
21.5
22.0
22.5
23.0
23.5
kg/head
’000
tonn
es c
wt
A¢/
kg c
wt
200
8
Jan
Feb
Mar
Apr
May Jun
Jul
Aug Se
p
Oct
Nov
Dec
2010
2012
2014
2016
2018
2020
2022
f
2010
200
8
2012
2014
2016
2018
f
2020
f
2022
f
Sources: ABS, MLA forecasts Sources: ABS, MLA
ProductionCarcase weight
500
600
700
800
900
1000
Goat
A¢/
kg c
wt
Jan
Feb
Mar
Apr
May Jun
Jul
Aug Se
p
Oct
Nov
Dec
Sources: ABS, MLA
400
500
600
700
800
900
1000
Lamb exports
’00
0 to
nnes
sw
t
Source: DAWR
Lamb exports
100
150
200
250
300
201820195-year average
201820195-year average
NATIONAL TRADE LAMB INDICATOR
decline in production, exports followed a similar trend, declining across all major goatmeat markets, particularly the US.
As a result of the decline in production, the over-the-hooks goat price surged to record levels, with international markets competing extensively for the limited supply of Australian goatmeat.
Board business
With 2020 being the final year in the Strategic Plan 2016–2020, the Board’s key focus throughout 2018–19 has been ensuring MLA is delivering tangible outcomes in line with the Plan. This also applies to MLA’s two subsidiaries – MLA Donor Company (MDC) and Integrity Systems Company (ISC).
This year, MDC continued to invest in initiatives which help to add value along the entire red meat supply chain and accelerate innovation. The new Farmers2Founders program (page 45), which allows Australian producers to co-invest in new technologies and concepts to increase the competitiveness of our red meat on a global scale, will be a key focus for MDC in 2019–20.
ISC has also continued to contribute to the Australian red meat and livestock industry’s position as a global leader, ensuring producers can ‘stand by what they sell’. In 2018–19, the MLA Board approved the Integrity System 2025 and beyond strategy, which aims to ensure our integrity system remains recognised and trusted globally as underpinning a quality product, produced to rigorous standards, and embedded in livestock management. You can read more about the strategy on page 32.
At MLA’s 2018 Annual General Meeting, members voted on the election of two first-time directors to the skills-based Board – nutrition and health expert Manny Noakes, and customer engagement, marketing and strategy expert Jo Pye. Both Manny and Jo have provided extremely valuable input into the Board meetings throughout the year, and I commend the MLA Selection Committee on their robust processes.
One of the most important topics taking place around the Board table in 2018–19 was the election of our Managing Director following Richard Norton’s departure in December. A Managing Director must have extensive knowledge and experience within the red meat industry, and bring a variety of new skills to the role – which is why, on behalf of the Board, I was thrilled to welcome Jason Strong as our new MD in early 2019. Levy payers can have every confidence that Jason has the experience and knowledge to lead MLA and help enhance our industry’s position
both at home and overseas. Please take the time to read his opening message over the page.
Looking ahead
While extreme climatic events and growing competition have certainly been challenges for the Australian red meat sector throughout 2018–19, they’re nothing our red meat producers have not seen before. The MLA Board will continue to ensure investment in key R&D and marketing initiatives is directed at helping producers deliver the best red meat in the world.
2020 will be a big year – MLA’s partnership with the Australian Olympics Committee and Paralympic Association will see Australian beef take its rightful place on the world stage (page 21) in the lead-up to – and duration of – the Tokyo 2020 Olympic Games.
Demonstrating red meat’s nutrition, versatility, sustainability and superior taste to international consumers will be an ongoing priority for MLA and the Board in the years ahead, as we develop new ways to share our story.
In closing, I’d like to thank the MLA Board, management team and employees for their commitment to fostering the prosperity of the Australian red meat and livestock industry in 2018–19.
Dr Michele AllanChair

8
As MLA’s Managing Director, it’s my pleasure to present this report and
discuss our organisation’s focus and outlook.
Although I’ve worked in the red meat and livestock industry for many years and have previous experience with MLA – firstly through Meat Standards Australia (MSA) and then as a regional manager in Europe – I’ve spent my first six months in the role learning as much as I can about the company, its subsidiaries and the important role they all play.
MLA is here to improve the profitability, sustainability and global competitiveness of Australia’s red meat and livestock industry. Every R&D project, every marketing initiative, is carried out with the single purpose of fostering prosperity for beef, lamb and goat producers across the country. My job is to support each of our stakeholders so we can achieve this together.
One way I do this is through meeting with producers and processors at key events – you can see from the stakeholder engagement map on page 3 that MLA’s involved in a wide range of events
Australia-wide. A highlight for me has been attending many of these and engaging with levy payers, hearing their thoughts on industry matters and any feedback on MLA.
It’s this consultation that guides the future direction of our organisation and it’s one of the most important aspects of my job. If you have anything you’d like to discuss with me or one of the MLA program managers, please get in touch via [email protected].
In each of the conversations I’ve had with our stakeholders, there are three questions that tend to come up regularly:
1. What progress has MLA made on ‘major industry announcements’?
2. What are the key areas MLA’s working on at the moment?
3. What’s the plan going forward?
I’d like to take this opportunity to address each of these questions below.
Progress on major initiatives
MLA’s annual Red Meat event has previously been a platform for making ‘major announcements’. Here’s a summary of where our big-ticket items over the past few years are up to.
DEXA
MLA announced its target to roll-out DEXA beef and sheep units in all AUS-MEAT-registered plants across Australia at the 2016 Annual General Meeting (AGM).
DEXA technology provides timely, accurate and objective information on the lean meat, bone and fat composition of each carcase.
An industry taskforce to ascertain how the initiative could be rolled out is still working to secure agreement on a suitable funding model for whole-of-industry adoption; however, MLA’s working with processors in the meantime to adopt the technology using a combination of private investment and MLA Donor Company funding. In March 2019, three lamb processors signed MLA DEXA contracts to install systems in their facilities (page 39).
I’ve always said there’s greater value to be realised for all participants in the supply chain if we work smarter and more cohesively. The uptake of objective measurement technologies like DEXA is a good example of how that can be achieved.
Carbon neutral by 2030 (CN30)
CN30 was announced at Red Meat 2017 and is about taking action to get in front of claims against the industry regarding climate change and carbon production (page 19).
Over the next year, a range of producer case studies will be published through MLA’s communications channels including Feedback magazine and Friday Feedback e-newsletter. These will give examples of the best pathways to become carbon neutral by 2030.
It’s an ambitious and important target that requires productivity improvements, vegetation balance and new emission reduction methodologies. MLA will continue to invest in key research projects, such as genetic improvement and feed additives, to help make the CN30 target a reality.
Olympic and Paralympic partnership
At Red Meat 2018, MLA announced that Australian beef will be an official partner of the 2020 Australian Olympic and Paralympic teams under new sponsorship deals (page 21).
Marketing activity will extend from television and social media right through to point-of-purchase material. While most of the activity relating to our sponsorship will be in Australia, MLA will also undertake cross-promotional opportunities in Japan
MLA’s focus and outlookManaging Director’s report
Jason Strong, MLA Managing Director
Producer Greg Brown and I at one of the MLA BeefUp Forums held across northern Australia in 2018–19.

9
Overview
Report to stakeholders
About
MLA
Financial report
Supporting inform
ation
to further cement Australian Beef’s leading position in our largest beef export market.
An association with the biggest sporting event in the world will allow us to promote the health credentials of red meat. Beyond this, an immediate win is having beef on the menu at all Australian Olympic and Paralympic team events leading up to and during the Games.
Key areas of work
The breadth of MLA’s work extends far beyond our major announcements. Below is a summary of some key areas we’re focusing on.
Sustainability
Linked to CN30, MLA’s sustainability program is ever-growing and remains a key priority as consumers demand ‘environmental credentials’ when purchasing meat.
While each of our programs relate to sustainability in one way or another, one of the major initiatives supported by MLA, the Australian Beef Sustainability Framework, is particularly noteworthy.
The Framework’s Annual Update found the red meat industry has more than halved our carbon emissions since 2005. To read more on the report findings, turn to page 18.
Community
We know ‘the consumer is always right’, which is why MLA’s community program is focused on informing metropolitan consumers of red meat’s story.
Through platforms such as Good Meat (page 16), school education (page 18) and Paddock to Plate virtual reality experiences (page 17), we’ve been working hard to engage with the community and ensure ‘curious consumers’ not only know where their beef and lamb comes from, but also understand how nutritious, delicious and versatile Aussie red meat is.
We’ve also recently announced a partnership with the National Farmers’ Federation called ‘Telling our story’ – more information on this to come in 2019–20.
Producer adoption of R&D
MLA celebrated its 20-year anniversary in 2018 and I want to make sure we’re getting as much value out of the research, development and marketing activity that’s taken place over the last two decades as we can.
This year, we’ve started taking a more focused approach to R&D – particularly in regards to extension and adoption – and we’ve got the ball rolling for improved accessibility to our research findings. I’ll be providing an update on this in 2019–20, so please keep an eye on MLA’s communication platforms to stay up-to-date.
To support this more focused approach, we’ve made some refinements to the leadership team at MLA which is reflected in the footnote on page 67.
2019–20 and beyond
As mentioned in Dr Allan’s report (pages 6–7), 2020 marks the final year of MLA’s Strategic Plan 2016–2020, which means a review of our strategic direction as an organisation, as well as an industry, is underway. There’s a new Meat Industry Strategic Plan (MISP) that runs to 2030 and we’re developing the new MLA strategic plan to align with the MISP.
While MLA takes the lead from the broader industry on these plans, one thing I can guarantee is that we’ll continue to operate according to our values – with customer centricity, accountability through transparency and a focus on outcomes that make a difference.
Telling the good story of red meat (particularly its sustainability/environmental/welfare credentials) and enhancing adoption of R&D will be key priorities in the years to come, and I look forward to working with you to build a stronger and more prosperous industry.
Jason StrongManaging Director
Talking leucaena with Queensland beef producers Tom Saunders (left) and Brett Blennerhassett after the official launch of the psyllid‑resistant variety, Redlands, in May 2019.

at 30 June 2019
Revenue
$205.7m $197.8m $200.5m
$269.9m$272.5m
Expenditure
$179.5m $172.4m$193.0m
$274.4m$262.2m
Retained earnings
$75.4m
$100.7m$108.2m
$118.5m $114.0m
Research contracts
$110.9m $96.4m
$246.0m
458
302322 $450.3m$460.0m
604466
Members
49200
50400
49,845 49,89249,726
50,128
49,692
KPIs
67%
75%
68%
64%
68%
Employees
237 234243
265271
ValueNumber
2014–15 2015–16 2016–17 2017–18 2018–19
2014–15 2015–16 2016–17 2017–18 2018–19
2014–15 2015–16 2016–17 2017–18 2018–19
2014–15 2015–16 2016–17 2017–18 2018–19
2014–15 2015–16 2016–17 2017–18 2018–19
2014–15 2015–16 2016–17 2017–18 2018–19
2014–15 2015–16 2016–17 2017–18 2018–19
2018–19 summary statistics
1% to $269.9 million
REVENUE
5% to $274.4 million
EXPENDITURE
4% to $114.0 million
RETAINED EARNINGS
466 research contracts worth $450.3 million
NUMBER OF RESEARCH CONTRACTS
2% to 271 employees
NUMBER OF MLA EMPLOYEES
1% to 49,692 members
NUMBER OF MLA MEMBERS
4 percentage points to 68% achieved
KEY PERFORMANCE INDICATORS
See page 71 for the full financial summary.
10

Overview
Report to stakeholders
About
MLA
Financial report
Supporting inform
ation
11
Supporting inform
ationFinancial
reportA
bout M
LAO
verviewReport to
stakeholders
11
This ‘Report to stakeholders’ reports against the pillars and priorities outlined in MLA’s Strategic Plan 2016–2020 and provides transparency around the organisation’s
actual activities and outcomes.
MLA objectives and planned activities in 2018–19 were directed by its Annual Investment Plan 2018–19. All these activities enable MLA to deliver on its Strategic Plan. MLA regards the Annual Investment Plan 2018–19 as the fourth year of the MLA Strategic Plan 2016–2020.
The MLA Strategic Plan 2016–2020 is aligned to the Meat Industry Strategic Plan 2020 and the Australian Government’s Science and Research Priorities and its Rural Research, Development and Extension Priorities. The MLA Strategic Plan was released in April 2016, following the publication of the Meat Industry Strategic Plan 2020 in September 2015.
Report to stakeholders

12
Stra
tegi
c Pl
an 2
016–
2020
Pilla
rs
1. Consumer and community support
2. Market growth and diversification
3. Supply chain efficiency and integrity
Out
com
es b
y 20
20 The community continues to support and trust the Australian red meat and livestock industry, with industry practices in step with community expectations.
Improved access to markets, with marketing programs and value-creating innovation driving increased consumer and customer preference and premiums for Australian red meat.
Increased returns through the value chain, with participants and customers confident in product quality, pricing and integrity systems.
Prio
ritie
s • Continuous improvement of the welfare of animals in our care
• Stewardship of environmental resources• Role of red meat in a healthy diet
• Efficiency and value in trade and market access
• Marketing and promoting Australian red meat and livestock
• Optimising product quality and cost efficiency
• Guaranteeing product quality and systems integrity
Ann
ual I
nves
tmen
t Pla
n 20
18–1
9
Prog
ram
s
• Animal health • Animal welfare• Nutrition• Livestock export market activities • Livestock export (research and
development)• Sustainability (off-farm) • Sustainability (on-farm)• Beef productivity • Feedbase production and infrastructure• Industry leadership and capacity building • Communication (community)
• Market knowledge (domestic)• Marketing and promotion (domestic)• Market access• Market knowledge (international) • Marketing and promotion
(international) • Livestock export market activities • Livestock export (research and
development)• Market access science• High Value Food Frontiers
• Eating quality• Market access science• Integrity systems• Objective measurement• High Value Food Frontiers• Digital value chain information
Mile
ston
e sc
orec
ard
90KPIs
Achieved… 58
Partly achieved… 7
Not achieved or noton track… 22
Not available… 3
Achieved… 25
Partly achieved… 1
Not achieved or noton track… 7
On track to be achievedby 2020… 5
Not available… 2
Achieved… 27
Partly achieved… 1
Not achieved or noton track… 12
On track to be achievedby 2020… 2
Achieved… 58
Partly achieved… 6
Not achieved or noton track… 22
On track to be achievedby 2020… 1
Not available… 3
Achieved… 40
Partly achieved… 2
Not achieved or noton track… 7
On track to be achievedby 2020… 2
Not available… 1
Achieved… 20
Partly achieved… 2
Not achieved or noton track… 5
On track to be achievedby 2020… 3
Not available… 1
40KPIs
42KPIs
31KPIs
52KPIs
90KPIs
90KPIs
Achieved… 58
Partly achieved… 7
Not achieved or noton track… 22
Not available… 3
Achieved… 25
Partly achieved… 1
Not achieved or noton track… 7
On track to be achievedby 2020… 5
Not available… 2
Achieved… 27
Partly achieved… 1
Not achieved or noton track… 12
On track to be achievedby 2020… 2
Achieved… 58
Partly achieved… 6
Not achieved or noton track… 22
On track to be achievedby 2020… 1
Not available… 3
Achieved… 40
Partly achieved… 2
Not achieved or noton track… 7
On track to be achievedby 2020… 2
Not available… 1
Achieved… 20
Partly achieved… 2
Not achieved or noton track… 5
On track to be achievedby 2020… 3
Not available… 1
40KPIs
42KPIs
31KPIs
52KPIs
90KPIs
MLA is an outcomes-based company and is committed to providing transparency to our stakeholders. For a full report on our key performance indicators, see Appendix A on page 100.
Please note some KPIs from MLA’s Annual Investment Plan 2018–19 could apply across several strategic plan pillars. In these cases, KPIs have been counted more than once.
Strategic Plan 2016–2020: pillar overview

Overview
Report to stakeholders
About
MLA
Financial report
Supporting inform
ation
13
4. Productivity and profitability
5. Leadership and collaborative culture
6. Stakeholder engagement
Pillars
Strategic Plan 2016–2020
Productivity gains through the value chain from the adoption of tools and technologies.
Industry participants are confident in industry leadership capability.
Industry participants are confident that the levy investment is delivering value.
Outcom
e by 2020
• Production efficiencies in farms and feedlots
• Processing productivity• Live export productivity
• Building leadership capability• Protecting and promoting our industry
• Engagement with producers and stakeholders
Priorities
• Livestock export market activities• Livestock export (research and
development)• Producer adoption• Productivity (off-farm) • Beef productivity • Feedbase production and
infrastructure • Goat productivity • Livestock genetics • Sheep productivity • Innovation capability building
• Innovation capability building• Industry leadership and capacity
building• Communication (stakeholder)• Corporate services
• Market knowledge (domestic)• Industry leadership and capacity
building• Communication (stakeholder)
Programs
Annual Investm
ent Plan 2018–19
90KPIs
Achieved… 58
Partly achieved… 7
Not achieved or noton track… 22
Not available… 3
Achieved… 25
Partly achieved… 1
Not achieved or noton track… 7
On track to be achievedby 2020… 5
Not available… 2
Achieved… 27
Partly achieved… 1
Not achieved or noton track… 12
On track to be achievedby 2020… 2
Achieved… 58
Partly achieved… 6
Not achieved or noton track… 22
On track to be achievedby 2020… 1
Not available… 3
Achieved… 40
Partly achieved… 2
Not achieved or noton track… 7
On track to be achievedby 2020… 2
Not available… 1
Achieved… 20
Partly achieved… 2
Not achieved or noton track… 5
On track to be achievedby 2020… 3
Not available… 1
40KPIs
42KPIs
31KPIs
52KPIs
90KPIs
90KPIs
Achieved… 58
Partly achieved… 7
Not achieved or noton track… 22
Not available… 3
Achieved… 25
Partly achieved… 1
Not achieved or noton track… 7
On track to be achievedby 2020… 5
Not available… 2
Achieved… 27
Partly achieved… 1
Not achieved or noton track… 12
On track to be achievedby 2020… 2
Achieved… 58
Partly achieved… 6
Not achieved or noton track… 22
On track to be achievedby 2020… 1
Not available… 3
Achieved… 40
Partly achieved… 2
Not achieved or noton track… 7
On track to be achievedby 2020… 2
Not available… 1
Achieved… 20
Partly achieved… 2
Not achieved or noton track… 5
On track to be achievedby 2020… 3
Not available… 1
40KPIs
42KPIs
31KPIs
52KPIs
90KPIs M
ilestone scorecard
Overall summary of MLA’s 2018–19 key performance indicators*
Status Symbol 2018–19 KPIs in MLA’s Strategic Plan 2016–2020
KPIs from MLA’s Annual Investment Plan 2018–19 Total result Percentage
Achieved 9 154 163 68.2
Partly achieved 11 11 4.6
Not achieved or not on track 3 45 48 20.1
Not available 1 6 7 2.9
On track to being achieved by 2020 10 10 4.2
Total 23 216 239 100.0
* For a detailed overview of MLA’s KPIs for 2018–19, see page 100.

14
Consumer and community support
50,000 visitsto the new Good
Meat website, which provides open,
transparent information to consumers about Australian red meat production (page 16)
>14,700 people
experienced MLA’s virtual reality Australian Lamb Paddock to Plate
Story (page 17)
This pillar invests in research into the superior nutritional properties of red meat. It also includes research and development to enhance the industry’s animal welfare, disease control and
environmental practices. This includes the communication of these actions and commitments by the industry to the community.
57.6% reduction in greenhouse gas emissions by the
Australian red meat industry between 2005
and 2016 (page 19)
Australian Beef Sustainability Framework
released its second Annual Update (the beef industry’s sustainability
scorecard) (page 18)
HIG
HLIG
HT
S
PILLAR
1
See Appendix A for a full list of KPIs. Please note some KPIs may be relevant across several pillars.
90KPIs
58 achieved
7 partly achieved
22 not achieved or not on track
3 not available
KEY PERFORMANCE INDICATORS
$28.
3m
$38.
0m
$33.
2m
$22.
4m
2014
–15
2015
–16
2016
–17
2017
–18
2018
–19
$40.
0m
$62.
9m
$67.
0m
$50.
4m
$67.
2m
2014
–15
2015
–16
2016
–17
2017
–18
2018
–19
$71.
8m
$16.
5m
$26.
4m
$12.
9m
$7.8
m
2014
–15
2015
–16
2016
–17
2017
–18
2018
–19
$29.
1m
$16.
5m
$26.
4m
$12.
9m
$7.8
m
2014
–15
2015
–16
2016
–17
2017
–18
2018
–19
$29.
1m
$62.
9m
$67.
0m
$50.
4m
$67.
2m
2014
–15
2015
–16
2016
–17
2017
–18
2018
–19
$71.
8m
$29.
1m
$35.
8m
$20.
0m $2
6.8m
2014
–15
2015
–16
2016
–17
2017
–18
2018
–19
$41.
5m
$6.0
m
$8.3
m$9.6
m
$4.5
m
2014
–15
2015
–16
2016
–17
2017
–18
2018
–19
$12.
4m
$6.0
m
$8.3
m$9.6
m
$4.5
m
2014
–15
2015
–16
2016
–17
2017
–18
2018
–19
$12.
4m
$29.
1m
$35.
8m
$20.
0m $2
6.8m
2014
–15
2015
–16
2016
–17
2017
–18
2018
–19
$41.
5m
$37.
6m
$73.
5m
$40.
2m
$31.1
m
2014
–15
2015
–16
2016
–17
2017
–18
2018
–19
$65.
5m
$37.
6m
$73.
5m
$40.
2m
$31.1
m
2014
–15
2015
–16
2016
–17
2017
–18
2018
–19
$65.
5m
$28.
3m
$38.
0m
$33.
2m
$22.
4m
2014
–15
2015
–16
2016
–17
2017
–18
2018
–19
$40.
0mINVESTMENT OVER TIME
Total
$40.0mTotal
$71.8m
Total
$41.5mTotal
$29.1m
Total
$65.5m
Continuous improvement of the welfare of animals in our care $20.4m
Stewardship of environmental resources $17.7m
Role of red meat in a healthy diet $1.9m
E�ciency and value in trade and market access $8.0m
Marketing and promoting Australian red meat and livestock $63.8m
Optimising product quality and cost e�ciency $28.7m
Guaranteeing product quality and systems integrity $12.7m
Building leadership capability $27.0m
Protecting and promoting our industry $2.1m
Production e�ciencies in farms and feedlots $53.0m
Processing productivity $11.2m
Live export productivity $1.3m
Total
$12.4m
Engagement with producers and stakeholders' priority $12.4m
2018–19 INVESTMENT BY PRIORITY
Total*
$40.0mTotal*
$71.8m
Total*
$41.5mTotal*
$29.1m
Total*
$65.5mTotal*
$12.4m
Producer levies $8.0m
Government funding $14.4m
Processor contributions $0.9m
LiveCorp contributions $1.1m
Other sources $15.6m
Producer levies $61.4m
Government funding $3.6m
Processor contributions $3.9m
LiveCorp contributions $0.2m
Other sources $2.7m
* Total includes $19.8m invested via MLA Donor Company
* Total includes $2.9m invested via MLA Donor Company
Producer levies $8.5m
Government funding $15.0m
Processor contributions $2.8m
LiveCorp contributions $0.1m
Other sources $15.1m
Producer levies $5.6m
Government funding $12.8m
Processor contributions $3.1m
Other sources $7.6m
* Total includes $18.4m invested via MLA Donor Company
* Total includes $18.3m invested via MLA Donor Company
Producer levies $13.3m
Government funding $31.6m
Processor contributions $2.0m Processor contributions $0.2m
LiveCorp contributions $0.3m
Other sources $18.2m
Producer levies $9.5m
Government funding $2.1m
Other sources $0.6m
* Total includes $34.7m invested via MLA Donor Company
* Total includes $0.1m invested via MLA Donor Company
2018–19 INVESTMENT BY FUNDING SOURCE
MEAT INDUSTRY STRATEGIC PLAN (MISP)
2020 PRIORITIES
• Continuous improvement of the welfare of animals in our care
• Stewardship of environmental resources
• Role of red meat in a healthy diet
AUSTRALIAN GOVERNMENT PRIORITIES
Science and Research Rural Research, Development and Extension
• Food• Soil and water• Environmental change • Transport• Resources• Health
• Adoption of research and development
• Soil, water and managing natural resources
• Advanced technology• Biosecurity
ALIGNMENT TO INDUSTRY AND GOVERNMENT PRIORITIES

15
Overview
About
MLA
Financial report
Supporting inform
ation
$6/head net benefitof using woodchip
bedding in feedlots, as well as several animal
welfare and production benefits (page 17)
‘So What’s for Dinner?’
campaign launched, allowing GPs and
dietitians to educate patients and clients on red meat’s nutritional properties (page 20)
Australian beef
became an official partner of Australia’s 2020 Olympic and Paralympic teams
(page 21)
11,631 students
were told red meat’s story through MLA’s
Primary School Virtual Excursion program
(page 18)
Report to stakeholders

16
While there are various animal welfare training programs and courses already available to sheep handlers, they don’t target underlying attitudes that need to be altered to achieve sustained changes in stockperson behaviour. MLA continues to support ongoing work in this area.
Streamlining parasite management
Obtaining faecal worm egg counts to monitor gastrointestinal parasites in livestock can be a time-consuming exercise, both in terms of the manual counting of eggs, and also the time it takes to send a faecal sample to a laboratory and receive results.
An MLA-supported project investigated using ‘image recognition’ smartphone software to replace the manual process of identifying and counting parasite eggs in a sample, potentially allowing the process to be completed on-farm without involving a laboratory.
Researchers have provided proof of the concept and further development of the software will be assessed in 2019–20.
Pest animal control support
MLA is supporting ongoing work aimed at improving coordination of pest animal control in northern Australia, particularly for beef enterprises, through support of regional coordinators.
The project – ‘Adoption of best practice vertebrate pest control in northern Queensland’ – is focused on the control of wild dogs for grassfed beef enterprises.
It’s been designed to build community and producer capacity and maximise the effectiveness of pest control. The project aligns with the National Wild Dog Action Plan and the Centre for Invasive Species Solutions (CISS) activities, with the data collected providing valuable intelligence for future planning of wild dog control.
The community has high expectations about the way livestock are treated and how animal welfare standards are applied. It is important the red meat industry continues to improve the welfare of
livestock by enhancing husbandry practices through adoption of new research.
This priority also seeks to improve welfare by ensuring the continued freedom of herds and flocks from exotic diseases and minimising the impact of endemic diseases.
Equally, it’s important to clearly communicate these improvements to the Australian and global community to earn their trust and maintain their support for the industry.
OVERVIEW
Good Meat website launched
MLA launched a new online platform – goodmeat.com.au – to provide consumers with an open and honest source of information about the production of beef, lamb and goatmeat in Australia.
The site demonstrates how Australian red meat is produced sustainably with animal welfare front of mind, and how it’s also an important part of a healthy, balanced diet.
Through Good Meat, producers can highlight their commitment to best practice and continuous improvement in a transparent, factual format – frequently asked questions (FAQs), direct from consumers.
Good Meat is also home to a range of educational resources including study guides, classroom posters, lesson and activity sheets, virtual farm visits, digital lessons and online board games.
The website is a direct response to the increasing interest consumers have in how food is produced. It aligns with MLA’s role in promoting the value of environmental stewardship and animal welfare to the community, and aims to build trust in the Australian red meat industry in line with the Meat Industry Strategic Plan 2020 and MLA’s Strategic Plan 2016–2020.
Good Meat received about 50,000 visits in the first seven months following launch.
Reducing livestock handling stress
Stress in sheep has implications for both animal welfare and meat eating quality.
A project supported by MLA investigated attitude/behaviour training for stock handlers in the sheep transport and processing sectors.
It found ‘attitudes’ influence the way animals are handled, and that behavioural training can help to safeguard sheep welfare and meat quality.
Continuous improvement of the welfare of animals in our care
Total*
$20.4mTotal*
$17.7m
Total*
$63.8mTotal*
$28.7m
Producer levies $5.1m
Government funding $8.4m
LiveCorp contributions $1.1m
Other sources $5.8m
Producer levies $1.9m
Government funding $5.3m
Processor contributions $0.8m
Other sources $9.8m
* Total includes $10.8m invested via MLA Donor Company
* Total includes $2.7m invested via MLA Donor Company
* Total includes $8.8m invested via MLA Donor Company * Total includes $18.3m invested
via MLA Donor Company
* Total includes $16.2m invested via MLA Donor Company
* Total includes $25.8m invested via MLA Donor Company
* Total includes $2.2m invested via MLA Donor Company
* Total includes $9.0m investedvia MLA Donor Company * Total includes $0.2m invested
via MLA Donor Company
Producer levies $58.1m
Government funding $2.3m
Processor contributions $0.9m
Other sources $2.4m
Producer levies $6.0m
Government funding $12.8m
Processor contributions $1.3m
Other sources $8.6m
Government funding $5.6m
Processor contributions $2.0m
Processor contributions $2.0m
Other sources $3.6m
Producer levies $0.5m
Government funding $0.4m
LiveCorp contributions $0.3m
Total
$1.9m
Total*
$12.7m
Total*
$27.0m
Producer levies $1.1m
Role of red meat E�ciency in tradeStewardship of environWelfare of animals
Government funding $0.7m
Processor contributions $0.1m
Producer levies $2.4m
Government funding $2.2m
Processor contributions $1.5m
LiveCorp contributions $0.1m
Other sources $6.6m
Producer levies $3.9m
Government funding $12.4m
Processor contributions $3.1m
Other sources $7.6m
Producer levies $1.7m
Government funding $0.4m
Total*
$8.0m
Total*
$53.0m
Total
$2.1m
Producer levies $3.4m
Government funding $1.2m
Processor contributions $2.9m
LiveCorp contributions $0.2m
Other sources $0.3m
* Total includes $0.2m invested via MLA Donor Company
Producer levies $12.8m
Government funding $25.6m
Other sources $14.6m
Quality and systems integrity Production e�cienciesOptimising product qualityMarketing and promos
Total
$12.4m
Producer levies $9.5m
Government funding $2.1m
Other sources $0.6m
* Total includes $0.1m invested via MLA Donor Company
Engagement
Building leadership Protecting industryLive exportProcessing productivity
Total
$1.3mTotal*
$11.2m
2018–19 INVESTMENT BY FUNDING SOURCE
PILLAR
1PILLAR
1

About
MLA
Financial report
Supporting inform
ation
MLA launched the Australian Lamb Paddock to Plate Story at Red Meat 2018 in Canberra in November (page 51), telling the story of lamb production
from farm to consumer.
It builds on the success of MLA’s Australian Beef Paddock to Plate Story and uses the same immersive 360⁰ virtual reality (VR) technology. The experience takes consumers into the world of Australian sheep farming, transportation, processing and end markets, enabling them to experience the industry through a VR headset.
Following its launch, the Lamb Paddock to Plate Story undertook a three-month roadshow where it visited 34 community events and 29 schools in city centres. More than 14,700 people were digitally immersed in the Australian lamb production chain in 2018–19. Some of the key events visited included AgriFutures evokeAG in Melbourne, Royal Canberra Show, Newcastle Show, Sydney Royal Easter Show and Tocal Field Days. The technology was also taken to four international trade shows, including the Supermarket Trade Show, Japan; Gulfood, UAE; FHA, Singapore; and SIAL, China.
Since the launch of MLA’s Paddock to Plate Story campaign, more than 50,000 people have experienced Australia’s beef and lamb production systems through this fully immersive resource. In a post-experience survey, 70% of respondents said they felt more positive about Australian lamb production practices.
17
Overview
The Australian Lamb Paddock to Plate StoryMLA also supports a range of other projects with CISS and is investing approximately $2.3 million from 2018–22 to support cost-effective pest animal management through new and improved tools, and a better understanding of proven management strategies.
Woodchip bedding benefits
A project funded by grainfed levies found providing feedlot cattle with woodchip bedding during wet and muddy conditions results in a range of animal welfare and production benefits that offset the cost of woodchips.
Undertaken by the University of New England Ruminant Research Group in 2018, the project examined the welfare outcomes and performance for 100-day grainfed cattle when woodchip bedding was applied at depths of 15 and 30cm, compared to that of cattle in pens with no bedding.
The research found a provision of woodchip bedding at a depth of 15cm resulted in an increased average daily gain and hot standard carcase weight, as well as animal welfare benefits.
Physiological measurements found the adrenal glands in the woodchip bedded cattle were smaller.
The adrenal gland is linked to production of stress hormones, suggesting woodchip bedding reduces chronic stress in cattle who are in cold, wet conditions.
The greatest impact of the woodchip bedding was improved feed efficiency. The cattle on woodchips increased their carcase weight gain but didn’t increase their intake, and had lower maintenance energy requirements. This resulted in an improvement in the grid price and increased carcase value.
Under the small pen research conditions and a 109-day feeding period, there was a $74 increase in carcase value. This translated into a $6/head net benefit of woodchip bedding.
Report to stakeholders
>50,000 viewers
for Beef and Lamb Stories combined
34 community
events visited
>14,700 viewersof the Lamb Paddock to Plate Story since
launch
29 schools visited

18
School resources
MLA has developed a range of Australian curriculum-aligned materials for kindergarten to year 10 teachers to support them in teaching students about:
• sustainable farming practices
• red meat nutrition
• Australian beef, lamb and goatmeat production.
Resources also cover the important role modern science and technologies play in agriculture to tackle the challenge of feeding a growing population.
The resources are housed on MLA’s Good Meat website’s education page (goodmeat.com.au/education), which generated almost 4,000 views from August 2018 to June 2019.
Beef producer Tim Eyes from Wyong Creek, NSW, with teacher Emily, during a Virtual Excursion session.
One of the most valuable resources available is the Primary School Virtual Excursion program, which is free, interactive and curriculum-linked.
It enables students to engage with Australian red meat producers live on video stream, see and hear what they do on-farm while taking part in educational activities, quizzes and even interact with other schools.
In 2018–19, 11,631 students from 276 primary schools from all Australian states and territories participated in MLA’s Virtual Excursion program.
Livestock production relies on natural resources. Future increases in production will depend on efficiently and effectively managing soil health, weeds, invasive animals, water, methane emissions,
biodiversity and climate variability. These aims provide the focus for MLA’s research and development work to assist the industry in improving productivity and sustainability.
Maintaining the industry’s environmental impact in line with community expectations is also a primary goal. This is achieved by the red meat and livestock industry engaging with consumers to demonstrate it is an ethical and responsible custodian of livestock, land and natural resources.
OVERVIEW
Australian Beef Sustainability Framework update
The Australian Beef Sustainability Framework released its second Annual Update in June, highlighting significant progress in how the red meat and livestock industry is further improving how it cares for natural resources, animals and people.
MLA is the Secretariat for the Red Meat Advisory Council (RMAC)-led Framework, which acts as a sustainability scorecard for the Australian beef industry from paddock-to-plate.
The 2019 Annual Update demonstrates how cattle producers are sustainably managing almost half of the Australian landscape, as well as the significant contribution they’ve made to rural communities and reducing national carbon emissions.
The report also shows how improvements in productivity have driven efficiencies and profitability for the beef sector. For example, carcase weights and growth rates in young cattle have increased 10% and 19% respectively over the past five years, allowing producers to generate more beef per animal.
Over the past year, the Framework’s Sustainability Steering Group has worked with the first multi-disciplinary Expert Working Group and other key stakeholders to develop practical and evidence-based measures for the ‘balance of tree and grass cover’ priority. These are the first national indicators and measures of changes in landscape for the beef industry.
Stewardship of environmental resources
56% reduction in beef
industry’s carbon accounts
Annual Update highlights include:
• 56% reduction in beef’s carbon accounts, demonstrating the industry target to be carbon neutral by 2030 is on-track (see ‘CN30’ on next page)
• forest and woodlands on beef-producing land are increasing and removal of primary forests has declined more than 90% since 1990
• use of pain relief increased to 15% of the herd, up from 4% the previous year, with the industry focused on driving rapid uptake
• 86% poll gene prevalence, removing the need for producers to dehorn cattle.
PILLAR
1
Total*
$20.4mTotal*
$17.7m
Total*
$63.8mTotal*
$28.7m
Producer levies $5.1m
Government funding $8.4m
LiveCorp contributions $1.1m
Other sources $5.8m
Producer levies $1.9m
Government funding $5.3m
Processor contributions $0.8m
Other sources $9.8m
* Total includes $10.8m invested via MLA Donor Company
* Total includes $2.7m invested via MLA Donor Company
* Total includes $8.8m invested via MLA Donor Company * Total includes $18.3m invested
via MLA Donor Company
* Total includes $16.2m invested via MLA Donor Company
* Total includes $25.8m invested via MLA Donor Company
* Total includes $2.2m invested via MLA Donor Company
* Total includes $9.0m investedvia MLA Donor Company * Total includes $0.2m invested
via MLA Donor Company
Producer levies $58.1m
Government funding $2.3m
Processor contributions $0.9m
Other sources $2.4m
Producer levies $6.0m
Government funding $12.8m
Processor contributions $1.3m
Other sources $8.6m
Government funding $5.6m
Processor contributions $2.0m
Processor contributions $2.0m
Other sources $3.6m
Producer levies $0.5m
Government funding $0.4m
LiveCorp contributions $0.3m
Total
$1.9m
Total*
$12.7m
Total*
$27.0m
Producer levies $1.1m
Role of red meat E�ciency in tradeStewardship of environWelfare of animals
Government funding $0.7m
Processor contributions $0.1m
Producer levies $2.4m
Government funding $2.2m
Processor contributions $1.5m
LiveCorp contributions $0.1m
Other sources $6.6m
Producer levies $3.9m
Government funding $12.4m
Processor contributions $3.1m
Other sources $7.6m
Producer levies $1.7m
Government funding $0.4m
Total*
$8.0m
Total*
$53.0m
Total
$2.1m
Producer levies $3.4m
Government funding $1.2m
Processor contributions $2.9m
LiveCorp contributions $0.2m
Other sources $0.3m
* Total includes $0.2m invested via MLA Donor Company
Producer levies $12.8m
Government funding $25.6m
Other sources $14.6m
Quality and systems integrity Production e�cienciesOptimising product qualityMarketing and promos
Total
$12.4m
Producer levies $9.5m
Government funding $2.1m
Other sources $0.6m
* Total includes $0.1m invested via MLA Donor Company
Engagement
Building leadership Protecting industryLive exportProcessing productivity
Total
$1.3mTotal*
$11.2m
2018–19 INVESTMENT BY FUNDING SOURCE

Overview
Report to stakeholders
About
MLA
Financial report
Supporting inform
ation
19
The Australian red meat industry continues to make progress in its ambitious target to be carbon neutral by 2030 (CN30).
According to data released by CSIRO in June, the industry has achieved a 57.6% reduction in greenhouse gas (GHG) emissions across the beef, sheepmeat and goatmeat production sectors since the baseline year of 2005. In fact, emissions reduced from 129.3 million tonnes of CO2 equivalent (Mt CO2-e) in 2005 to 54.8 Mt CO2-e in 2016.
The reduction represents a halving of the red meat industry’s proportion of national GHG emissions, from 21.4% to 10.4% between 2005 and 2016. The red meat and manufacturing industries are the only two industries to have reduced emissions over this period, with carbon account reductions from red meat by far the largest. The significant decline in the industry’s carbon accounts reflects the impact of enhanced productivity, as well as land management practices like reforestation, afforestation and reduced deforestation.
Under the CN30 initiative announced in November 2017, MLA is leading a collaborative research, development and adoption (RD&A) program to develop and commercialise technologies and practices that promote the role of carbon farming in building a more sustainable, profitable industry. CN30 is not only an emissions-based target – the aim is to unlock a $300 million/year opportunity by optimising the carbon cycle to improve drought resilience and farm gate profitability, and reduce GHG.
There are many pathways available today which can boost productivity. Several of these pathways are already well-known – such as improved pastures, adding legumes to the system, improved animal genetics and land management – while others require more R&D.
MLA is focused on working with partners, including the Federal Government, to leverage resources and address RD&A gaps, such as commercialisation for promising technologies and practices, as well as continued investment into suppressing methane.
As the program evolves, MLA continues to work with industry partners to trial and implement new practices for the dual benefit of increasing productivity and reducing greenhouse gases.
Pictured above: Dunkeld Pastoral Company’s Group General Manager, Glenn White, outlined pathways his team has taken to become carbon neutral in a video released by MLA in May (YouTube: meatandlivestock).
Carbon neutral by 2030 (CN30)Pastures’ resilience put through their PACEs
Pastures are being planted in modified ‘atmosphere chambers’ to simulate climate conditions predicted for the future.
Based at the University of Western Sydney’s Hawkesbury Campus, the Pastures and Climate Extremes (PACE) project is supported by funding from MLA Donor Company.
A range of pasture grasses and legumes have been planted in six large polytunnels, where the climate is controlled with infra-red heat lamps used to increase air temperature and rainfall.
This enables researchers to assess the plants’ response to (and recovery from) drought and heat stress scenarios, and to determine which pastures are resilient to higher temperatures.
The two main climate treatments – warming (+3°C) and (winter/spring) drought – were initiated in 2018.
Datasets from the November 2018 harvest show that:
• fescue productivity in late spring was particularly reduced under drought, with an 80% decrease compared to control plots
• biserrula was the most strongly affected legume, with a 50% reduction in productivity in drought plots, compared to a decrease of only 33% for lucerne
• the tropical C4 grasses maintained higher yields under drought than their temperate counterparts, although yield reductions of up to about 50% were still observed at the end of spring.
Recovery after drought is one of the most important aspects of a species’ resilience, so will be carefully monitored as the PACE project continues.
Red meat is one of only two industries
in Australia to reduce emissions between 2005 and 2016
57.6% reduction in emissions
across the red meat industry since 2005

20
These promotions referred health professionals to the MLA Healthy Meals website for further information about red meat and healthy eating, generating an average of 2,500 page views/month.
Evaluation of the campaign material suggests it’s well-received by GPs, with 62% of GPs agreeing that ‘So What’s for Dinner?’ is a relevant resource for their patients. In fact, two-thirds of GPs surveyed used the resource to advise their patients on healthy eating.
The material has also been well-received by consumers because it provides them with a new way of thinking about how to eat healthily, provides guidance on how to choose best cuts and informs them how much meat to use in their meal preparation.
MLA’s response to EAT-Lancet report
A report released by the EAT-Lancet Commission outlined what a diet that’s good for the planet may look like.
The EAT-Lancet Commission, a global team of 37 experts, published the Healthy diets from sustainable food systems report in January.
To address the need to sustain a growing population, the Commission recommended changes to diet, production and food waste – all of which could have implications for the Australian red meat industry.
The report, which aimed to describe a ‘universal healthy reference diet’, endorsed an increase in vegetables, fruits, wholegrains, legumes and nuts, and suggested limiting red meat to a maximum of 28g/day in an effort to reduce consumption by half.
It’s estimated that universal adoption of this guideline by 2050 would reduce global meat production by 70%.
In response to the report, MLA met with the authors of Healthy diets from
Red meat faces strong competition from protein sources like pork and chicken. Securing red meat’s place in a healthy, balanced diet and giving consumers a compelling reason to purchase requires
consistent messages to be delivered about the nutritional benefits of red meat.
Defending the role of red meat in a healthy diet also requires informing domestic and global nutrition policy and key opinion leaders with evidence on the amount and frequency of red meat consumption to achieve healthy living.
OVERVIEW
‘So What’s for Dinner?’ campaign
MLA launched the ‘So What’s for Dinner?’ campaign in September 2018 in response to insights generated from research about consumers’ nutrition needs.
‘So What’s for Dinner?’ is a meal-planning tool that provides guidance on how to eat recommended amounts of red meat in line with the Australian Dietary Guidelines.
It comprises a set of resources designed for general practitioners (GPs) and dietitians to use with their patients and clients to help them eat a healthy diet.
Red meat’s credential as a good protein source of iron and zinc is widely recognised, but some consumers are confused about how much is good for their health.
Australian Dietary Guidelines recommend 130g of lean and cooked red meat every second day and limiting consumption to 455g/week as part of a healthy, balanced diet.
MLA research found Australians think about red meat consumption within the context of dinner because it’s a popular protein choice and typically a home-prepared meal. As a result, they’re looking for ideas and practical tips that fit easily into their meal planning.
GPs and dietitians are trusted sources of information and, according to an MLA survey, 7/10 GPs report providing nutrition education material to their patients.
MLA’s ‘So What’s for Dinner?’ campaign materials were distributed to GPs and dietitians through a range of platforms, including professional and medical media publications, and sampling and brochure services.
The campaign reached 25% of GPs in Australia and information was sent to all members of the Dietitians Association of Australia.
Approximately 350,000 nutrition education brochures were distributed to healthcare professionals in 2018–19.
Role of red meat in a healthy diet
⅔ of Australian GP survey
respondents used ‘So What’s for Dinner?’ materials to educate patients
on healthy eating
PILLAR
1
Total*
$20.4mTotal*
$17.7m
Total*
$63.8mTotal*
$28.7m
Producer levies $5.1m
Government funding $8.4m
LiveCorp contributions $1.1m
Other sources $5.8m
Producer levies $1.9m
Government funding $5.3m
Processor contributions $0.8m
Other sources $9.8m
* Total includes $10.8m invested via MLA Donor Company
* Total includes $2.7m invested via MLA Donor Company
* Total includes $8.8m invested via MLA Donor Company * Total includes $18.3m invested
via MLA Donor Company
* Total includes $16.2m invested via MLA Donor Company
* Total includes $25.8m invested via MLA Donor Company
* Total includes $2.2m invested via MLA Donor Company
* Total includes $9.0m investedvia MLA Donor Company * Total includes $0.2m invested
via MLA Donor Company
Producer levies $58.1m
Government funding $2.3m
Processor contributions $0.9m
Other sources $2.4m
Producer levies $6.0m
Government funding $12.8m
Processor contributions $1.3m
Other sources $8.6m
Government funding $5.6m
Processor contributions $2.0m
Processor contributions $2.0m
Other sources $3.6m
Producer levies $0.5m
Government funding $0.4m
LiveCorp contributions $0.3m
Total
$1.9m
Total*
$12.7m
Total*
$27.0m
Producer levies $1.1m
Role of red meat E�ciency in tradeStewardship of environWelfare of animals
Government funding $0.7m
Processor contributions $0.1m
Producer levies $2.4m
Government funding $2.2m
Processor contributions $1.5m
LiveCorp contributions $0.1m
Other sources $6.6m
Producer levies $3.9m
Government funding $12.4m
Processor contributions $3.1m
Other sources $7.6m
Producer levies $1.7m
Government funding $0.4m
Total*
$8.0m
Total*
$53.0m
Total
$2.1m
Producer levies $3.4m
Government funding $1.2m
Processor contributions $2.9m
LiveCorp contributions $0.2m
Other sources $0.3m
* Total includes $0.2m invested via MLA Donor Company
Producer levies $12.8m
Government funding $25.6m
Other sources $14.6m
Quality and systems integrity Production e�cienciesOptimising product qualityMarketing and promos
Total
$12.4m
Producer levies $9.5m
Government funding $2.1m
Other sources $0.6m
* Total includes $0.1m invested via MLA Donor Company
Engagement
Building leadership Protecting industryLive exportProcessing productivity
Total
$1.3mTotal*
$11.2m
2018–19 INVESTMENT BY FUNDING SOURCE

Overview
Report to stakeholders
About
MLA
Financial report
Supporting inform
ation
21
Australian beef is now an official partner of Australia’s 2020 Olympic and Paralympic teams under new sponsorship deals delivered by MLA in
2018–19.
The partnerships, which will run throughout the 2020 Olympic Games and Paralympic Games in Tokyo, Japan, provide far-reaching platforms over an extended period to promote Australian beef’s nutritional benefits and its ability to fuel Australian athletes.
The partnerships will build on all MLA’s marketing and communications initiatives in the domestic market and will also include cross-promotional opportunities in Japan – two of the Australian beef industry’s largest customers.
Marketing activities will extend from television and social media right through to point-of-purchase material.
Sports dietitians, nutritionists and national sporting federations – with a reach that extends not only to elite athletes but to community participation sports – will be the focus of MLA’s nutrition communications and education program throughout the partnerships.
Australian beef will feature on the menu at all official Australian Olympic and Paralympic events in both Australia and Japan.
Australian beef sponsorship of Olympic and Paralympic teams
sustainable food systems to determine what the EAT-Lancet Commission would mean in an Australian context. MLA also attended the Commission’s Australian launch, participating in its Food Systems Dialogue along with retailers, public health professionals and academics.
A subsequent teleconference was held with the EAT chief executive officer and one of the authors, Mario Herrero from the CSIRO, to explore how the EAT-Lancet approach could be localised with Australian consumption data and production systems.
MLA does not support the report’s findings. MLA promotes eating in line with the Australian Dietary Guidelines, which recommends 130g of lean and cooked red meat every second day because it’s an important protein source of iron and zinc.
However, initial discussions indicate that when applied locally, EAT-Lancet recommendations would not mean a reduction in production, given Australia’s export profile and limited arable land.
MLA views the report as an opportunity for the Australian red meat industry to promote its nutrition and sustainability credentials. This is already being done in a number of ways, including:
• MLA’s Healthy Meals website, which promotes the ‘So What’s for Dinner?’ program (see previous page), offers nutrition education materials that meet consumer demands for variety, enjoyment and ease of preparation, and ‘how to’ ideas, including protein and vegetable portion size guides and flexible recipes.
• The Australian Good Meat platform (page 16) ensures the community has access to credible information about red meat production to help them make informed choices.
• Through the Australian Beef Sustainability Framework (page 18), the beef industry is working proactively to ensure it continues to meet community expectations. One example is the industry’s target to be carbon neutral by 2030 (page 19), while at the same time preserving and enhancing the natural environment that the industry operates in.

22
Market growth and diversification
Partnership agreement
with Indonesia signed(page 24)
650 Europeans introduced to True Aussie
beef and lambat MLA’s annual Brussels
BBQ (page 25)
Improving market access is the primary way for the Australian red meat industry to grow demand and diversify markets.
This pillar strives to reduce economic and technical barriers to trade, defend existing gains in trade and proactively identify and develop new business opportunities. It also recognises the integrity systems that underpin marketing efforts to differentiate Australian red meat from other red meat competitors and proteins.
Trans-Pacific agreement
entered into force
bringing new benefits to Australian red meat
(page 25)
>300 beef, lamb and goat
brandssupported by
CoMarketing program (page 26)
HIG
HLIG
HT
S
See Appendix A for a full list of KPIs. Please note some KPIs may be relevant across several pillars.
40KPIs
25 achieved 1 partly achieved 7 not achieved or not on track 2 not available 5 on track to be achieved by 2020
KEY PERFORMANCE INDICATORS
MEAT INDUSTRY STRATEGIC PLAN (MISP)
2020 PRIORITIES
• Efficiency and value in trade and market access
• Marketing and promoting Australian red meat and livestock
AUSTRALIAN GOVERNMENT PRIORITIES
Science and Research Rural Research, Development and Extension
• Food • Advanced technology
• Adoption of research and development
ALIGNMENT TO INDUSTRY AND GOVERNMENT PRIORITIES
PILLAR
2
Total*
$40.0mTotal*
$71.8m
Total*
$41.5mTotal*
$29.1m
Total*
$65.5mTotal*
$12.4m
Producer levies $8.0m
Government funding $14.4m
Processor contributions $0.9m
LiveCorp contributions $1.1m
Other sources $15.6m
Producer levies $61.4m
Government funding $3.6m
Processor contributions $3.9m
LiveCorp contributions $0.2m
Other sources $2.7m
* Total includes $19.8m invested via MLA Donor Company
* Total includes $2.9m invested via MLA Donor Company
Producer levies $8.5m
Government funding $15.0m
Processor contributions $2.8m
LiveCorp contributions $0.1m
Other sources $15.1m
Producer levies $5.6m
Government funding $12.8m
Processor contributions $3.1m
Other sources $7.6m
* Total includes $18.4m invested via MLA Donor Company
* Total includes $18.3m invested via MLA Donor Company
Producer levies $13.3m
Government funding $31.6m
Processor contributions $2.0m Processor contributions $0.2m
LiveCorp contributions $0.3m
Other sources $18.2m
Producer levies $9.5m
Government funding $2.1m
Other sources $0.6m
* Total includes $34.7m invested via MLA Donor Company
* Total includes $0.1m invested via MLA Donor Company
2018–19 INVESTMENT BY FUNDING SOURCE
Total
$40.0mTotal
$71.8m
Total
$41.5mTotal
$29.1m
Total
$65.5m
Continuous improvement of the welfare of animals in our care $20.4m
Stewardship of environmental resources $17.7m
Role of red meat in a healthy diet $1.9m
E�ciency and value in trade and market access $8.0m
Marketing and promoting Australian red meat and livestock $63.8m
Optimising product quality and cost e�ciency $28.7m
Guaranteeing product quality and systems integrity $12.7m
Building leadership capability $27.0m
Protecting and promoting our industry $2.1m
Production e�ciencies in farms and feedlots $53.0m
Processing productivity $11.2m
Live export productivity $1.3m
Total
$12.4m
Engagement with producers and stakeholders' priority $12.4m
2018–19 INVESTMENT BY PRIORITY
$28.
3m
$38.
0m
$33.
2m
$22.
4m
2014
–15
2015
–16
2016
–17
2017
–18
2018
–19
$40.
0m
$62.
9m
$67.
0m
$50.
4m
$67.
2m
2014
–15
2015
–16
2016
–17
2017
–18
2018
–19
$71.
8m
$16.
5m
$26.
4m
$12.
9m
$7.8
m
2014
–15
2015
–16
2016
–17
2017
–18
2018
–19
$29.
1m
$16.
5m
$26.
4m
$12.
9m
$7.8
m
2014
–15
2015
–16
2016
–17
2017
–18
2018
–19
$29.
1m
$62.
9m
$67.
0m
$50.
4m
$67.
2m
2014
–15
2015
–16
2016
–17
2017
–18
2018
–19
$71.
8m
$29.
1m
$35.
8m
$20.
0m $2
6.8m
2014
–15
2015
–16
2016
–17
2017
–18
2018
–19
$41.
5m
$6.0
m
$8.3
m$9.6
m
$4.5
m
2014
–15
2015
–16
2016
–17
2017
–18
2018
–19
$12.
4m
$6.0
m
$8.3
m$9.6
m
$4.5
m
2014
–15
2015
–16
2016
–17
2017
–18
2018
–19
$12.
4m
$29.
1m
$35.
8m
$20.
0m $2
6.8m
2014
–15
2015
–16
2016
–17
2017
–18
2018
–19
$41.
5m
$37.
6m
$73.
5m
$40.
2m
$31.1
m
2014
–15
2015
–16
2016
–17
2017
–18
2018
–19
$65.
5m
$37.
6m
$73.
5m
$40.
2m
$31.1
m
2014
–15
2015
–16
2016
–17
2017
–18
2018
–19
$65.
5m
$28.
3m
$38.
0m
$33.
2m
$22.
4m
2014
–15
2015
–16
2016
–17
2017
–18
2018
–19
$40.
0m
INVESTMENT OVER TIME

Overview
About
MLA
Financial report
Supporting inform
ation
23
60 million Japanese
consumers reached in MLA’s
‘Let’s Barbie!’ campaign (page 27)
Almost 100,000 Australian
lamb meals served
in new airline partnership (page 27)
9% increase in number of beef serves per week
for domestic consumers (page 26)
25% increasein retail
lamb sales following the summer
lamb campaign (page 26)
Report to stakeholders

24
Currently, Australia only has access to a 7,150 tonne country-specific High Quality Beef quota and shared access to a 45,000 tonne global grainfed beef quota (although more restrictive amendments to the latter quota are imminent). For sheepmeat and goatmeat there are similar quantitative restrictions, with Australia’s current access to the EU comprising a 19,186 tonne (combined) country-specific quota.
Transforming Australia’s access to the EU falls under the remit of the A-EU FTA Red Meat Industry Taskforce, of which MLA is a member. The Taskforce is collaborating with the Australian Government to seek to position the sector for substantial improvements to the EU’s existing import regime.
A great deal of work remains and the A-EU FTA will remain a key focus of the market access program over the next 12 months and beyond.
Navigating Brexit
Brexit has both short and long-term implications for Australian beef and sheepmeat given the United Kingdom (UK) is Australia’s largest red meat market within the EU.
A key short-term issue with the UK’s departure from the EU could include a split of the existing country-specific tariff rate quotas between the EU and UK. This would see Australia’s existing 7,150 tonne High Quality Beef quota split 65% and 35% between the UK and the remaining EU respectively, and the 19,186 tonne sheepmeat quota split 80% and 20%.
This would erode Australia’s existing access by reducing exporters’ ability to target the most attractive consumer market in either region. Currently, Australian beef and sheepmeat are able to shift between the UK and the EU seamlessly under the single quota arrangements.
The Australian industry has voiced strong opposition to this proposal and MLA
Australian red meat faces tariffs, quotas and technical barriers to trade across the globe, which impose billions of dollars in additional costs across the value chain. These barriers also prevent or
restrict trade, which limits the diversity of markets and, consequently, reduces the number of potential customers for Australian red meat.
In response, MLA collaborates with industry stakeholders including the Australian Government, Australian Meat Processor Corporation (AMPC) and Australian Livestock Export Corporation (LiveCorp) to drive growth in exports. MLA does this by prioritising and taking action to reduce economic and technical barriers to trade in global markets.
OVERVIEW
Indonesian trade deal
The Indonesia-Australia Comprehensive Economic Partnership Agreement (IA-CEPA) was signed in March 2019, providing a framework for mutual trade benefits into the future. Negotiations between Indonesia and Australia lasted eight years.
Once implemented, the agreement will bring tariff elimination and more trade certainty for products not previously liberalised under the existing ASEAN-Australia-New Zealand free trade agreement.
The IA-CEPA will deliver a range of benefits to the Australian red meat industry:
• a quota (0% in-quota tariff) for 575,000 head of live male cattle, which will grow by 4%/year over five years to 700,000 head
• import permits automatically issued annually (without seasonal restrictions)
• liberalised access for female live cattle exported to Indonesia, with 0% tariff on entry into force of the agreement
• tariff elimination for beef and sheepmeat exports over five years
• elimination of the 5% tariff on frozen offal on entry into force of the agreement.
Market access opportunity in the EU
The Australia-EU free trade agreement (A-EU FTA) negotiations in 2018–19 provided the first opportunity in more than 40 years to potentially secure additional preferential access for Australian beef, sheepmeat and goatmeat.
While negotiations remain challenging given the EU’s sensitivity around agricultural imports, Australia is well-placed to help meet the EU’s supply deficit of high quality red meat products.
Efficiency and value in trade and market access
PILLAR
2
Indonesia-Australia trade deal secured
in March 2019
Total*
$20.4mTotal*
$17.7m
Total*
$63.8mTotal*
$28.7m
Producer levies $5.1m
Government funding $8.4m
LiveCorp contributions $1.1m
Other sources $5.8m
Producer levies $1.9m
Government funding $5.3m
Processor contributions $0.8m
Other sources $9.8m
* Total includes $10.8m invested via MLA Donor Company
* Total includes $2.7m invested via MLA Donor Company
* Total includes $8.8m invested via MLA Donor Company * Total includes $18.3m invested
via MLA Donor Company
* Total includes $16.2m invested via MLA Donor Company
* Total includes $25.8m invested via MLA Donor Company
* Total includes $2.2m invested via MLA Donor Company
* Total includes $9.0m investedvia MLA Donor Company * Total includes $0.2m invested
via MLA Donor Company
Producer levies $58.1m
Government funding $2.3m
Processor contributions $0.9m
Other sources $2.4m
Producer levies $6.0m
Government funding $12.8m
Processor contributions $1.3m
Other sources $8.6m
Government funding $5.6m
Processor contributions $2.0m
Processor contributions $2.0m
Other sources $3.6m
Producer levies $0.5m
Government funding $0.4m
LiveCorp contributions $0.3m
Total
$1.9m
Total*
$12.7m
Total*
$27.0m
Producer levies $1.1m
Role of red meat E�ciency in tradeStewardship of environWelfare of animals
Government funding $0.7m
Processor contributions $0.1m
Producer levies $2.4m
Government funding $2.2m
Processor contributions $1.5m
LiveCorp contributions $0.1m
Other sources $6.6m
Producer levies $3.9m
Government funding $12.4m
Processor contributions $3.1m
Other sources $7.6m
Producer levies $1.7m
Government funding $0.4m
Total*
$8.0m
Total*
$53.0m
Total
$2.1m
Producer levies $3.4m
Government funding $1.2m
Processor contributions $2.9m
LiveCorp contributions $0.2m
Other sources $0.3m
* Total includes $0.2m invested via MLA Donor Company
Producer levies $12.8m
Government funding $25.6m
Other sources $14.6m
Quality and systems integrity Production e�cienciesOptimising product qualityMarketing and promos
Total
$12.4m
Producer levies $9.5m
Government funding $2.1m
Other sources $0.6m
* Total includes $0.1m invested via MLA Donor Company
Engagement
Building leadership Protecting industryLive exportProcessing productivity
Total
$1.3mTotal*
$11.2m
2018–19 INVESTMENT BY FUNDING SOURCE

Overview
Report to stakeholders
About
MLA
Financial report
Supporting inform
ation
25
MLA hosted an Australian ‘backyard barbecue’ in Brussels, Belgium in July 2018 to celebrate the long-awaited launch of Australia-EU free trade
agreement negotiations.
Almost 650 Europeans gathered to mark the occasion and enjoy premium quality True Aussie beef and lamb, which was inspired by Mediterranean and Spanish tapas flavours, brasserie-style cooking and the traditional English roast. This was MLA Europe’s fourth annual barbecue, providing a key opportunity to engage influential policymakers and emphasise the need for strong trade relations.
The event attracted members of the European Parliament and their advisors, key trade and agriculture contacts, European Commission trade officials, associates of the Australian embassy, European agricultural industry bodies and EU meat importers.
Annual barbecue in Brussels
will continue to work closely with the Australian Government and like-minded trading partners in the World Trade Organization in defence of Australia’s (albeit limited) access.
CPTPP tariff cuts
Significant progress made on the Comprehensive and Progressive Agreement for Trans-Pacific Partnership (CPTPP, formerly known as TPP-11).
Although the CPTPP was signed in March 2018, it couldn’t enter into force until six of the 11 members completed their domestic ratification processes. On behalf of industry, MLA worked with the Australian Government and international alliances to advocate that all members expedite these procedures.
The CPTPP entered into force on 30 December 2018, resulting in two tariff
cuts in quick succession – the first on 30 December and the second on 1 January (1 April for Japan).
As a consequence, the Australian red meat industry will benefit from improved competitiveness in CPTPP member countries. Two of the main opportunities are:
• Further reduction of tariffs for Australian beef entering Japan
The CPTPP tariff on both frozen and chilled beef has fallen to 9% over 15 years – as opposed to the end point of 19.5% for frozen beef and 23.5% for chilled beef secured under the Japan-Australia Economic Partnership Agreement. This offers Australian beef a substantial tariff advantage compared to US beef, which will continue to face a 38.5% tariff (following President Trump’s withdrawal of the US from the TPP-11).
• Free trade arrangements with Canada and Mexico
In Canada, the current 35,000 tonne beef quota (0% in-quota tariff) will remain; however, the above-quota tariff of 26.5% will be phased out within five years. Additionally, the 2.5% tariff on Australian sheepmeat will be eliminated on entry into force.
For Australia’s exports to Mexico, the current 20–25% tariffs on beef will be eliminated within 10 years; the 10% sheepmeat and goatmeat tariffs will be eliminated within eight years; and the majority of offal tariffs will be eliminated on entry into force.
Positioning the industry for improved access to China
An August 2018 survey of MLA’s industry and government stakeholders revealed some frustration around the slow alleviation of non-tariff barriers, but positive sentiment towards MLA’s involvement in trade access.
This frustration was predominantly driven by the slow progress in improving trade access in China. The development of the China Trade Strategy by the Australian Meat Industry Council over the past 12 months has had strong MLA support and input, and implementation remains an ongoing focus.
Other trade initiatives
MLA’s market access activities in 2018–19 also included:
• engagement with the Federal Government, aimed at:
– defending Australia’s access under the EU’s grainfed beef quota
– providing input in pursuit of outcomes from the Regional Comprehensive Economic Partnership, Peru-Australia Free Trade Agreement and Pacific Alliance Free Trade Agreement negotiations
– providing numerous briefings and maintaining close rapport in Canberra, as well as in key export markets with Australia’s team of agriculture counsellors
• liaising closely with peak industry councils, the Australian Meat Processor Corporation (as joint funder of the market access program), commercial entities and Australian and international alliances to continuously improve the trade portfolio.

26
insights that many shoppers aren’t sure where beef comes from. It ranked as one of MLA’s top three most engaging beef commercials, with strong brand distinction and message take-out well above advertising industry benchmarks.
CoMarketing
MLA continued to support the development and marketing of Australian red meat brands through the CoMarketing initiative.
CoMarketing assists producers, processors and licensed meat exporters with beef, veal, lamb and goat brands to develop superior marketing strategies, create customer loyalty and build sustainable brand growth. This investment delivers added value back down the supply chain to producers.
Beef:
• MLA worked with 64 beef brand owners promoting 262 beef brands, covering 764 individual activities across 27 countries/regions, with a total MLA contribution of $2.77 million.
• 83% of beef CoMarketing participants rated their overall satisfaction with their outcomes as 7/10 or higher.
Lamb:
• MLA collaborated with 23 lamb brand owners promoting 51 brands, covering 121 individual activities across 17 regions/countries, with a total MLA contribution of $555,716.
• 81% of lamb CoMarketing participants rated their overall satisfaction with their outcomes as 7/10 or higher.
With Australian red meat facing increasing competition from other red meat suppliers and protein products in global markets, the industry must aggressively promote its superior points of
difference to global customers and consumers – safety, quality and traceability. MLA also segments markets based on the size of the opportunity and the risks.
MLA’s focus in the domestic market is to ensure beef and lamb remain popular meal choices by focusing on Australian red meat’s value proposition and business development.
OVERVIEW
Lamb bridges ‘the ditch’
MLA’s 2019 summer lamb campaign, ‘New Australia-Land’, called for Trans-Tasman unity by using lamb to mend the light-hearted rivalry between Australia and New Zealand.
The highly-anticipated annual campaign – which resulted in an 11% increase in overall lamb sales and a 25% increase in retailer lamb sales – built on the new brand platform ‘Share the Lamb’ and continued lamb’s long-term strategy to bring people together.
It generated strong national and international interest, with a social media coverage and reach of 144.8 million. There were 31.1 million TV impressions and the campaign reach across all media platforms was 297 million. It was also Snapchat’s campaign of the month in February.
Telling beef’s great story
Brian the Butcher returned in 2019 for the second chapter of MLA’s popular ‘Australian Beef. The Greatest’ campaign, which reinforces the provenance and high quality of Australian beef.
The eight-week campaign was rolled out across metro and regional TV, radio, print, digital and social media in February and March. Following the campaign, Australian consumers’ mean number of serves of beef per week increased by 9% to 1.70.
In the new ad, Brian takes a customer through the story of how cattle are raised in Australia, responding to MLA consumer
Marketing and promoting Australian red meat and livestock
PILLAR
2
MLA’s summer lamb campaign
resulted in:
11% increase in overall lamb sales
25% increase in retailer lamb sales
MLA’s winter beef campaign
resulted in:
Australian consumers’ mean number of serves of beef per week:
pre-campaign: 1.56post-campaign: 1.70
How have brand owners benefited from CoMarketing?The program has contributed to brand owners developing new business and building brand awareness including:
• “The brand now has a strong identity thanks to this program, which is starting to be recognised in different areas of the globe.”
• “Very effective so far, as it’s our first foray into branded products. We’ve received a lot of positive feedback from customers.”
• “We’re excited about the opportunities that have been opened up to us in the market this year and appreciate the support of the MLA CoMarketing program.”
Total*
$20.4mTotal*
$17.7m
Total*
$63.8mTotal*
$28.7m
Producer levies $5.1m
Government funding $8.4m
LiveCorp contributions $1.1m
Other sources $5.8m
Producer levies $1.9m
Government funding $5.3m
Processor contributions $0.8m
Other sources $9.8m
* Total includes $10.8m invested via MLA Donor Company
* Total includes $2.7m invested via MLA Donor Company
* Total includes $8.8m invested via MLA Donor Company * Total includes $18.3m invested
via MLA Donor Company
* Total includes $16.2m invested via MLA Donor Company
* Total includes $25.8m invested via MLA Donor Company
* Total includes $2.2m invested via MLA Donor Company
* Total includes $9.0m investedvia MLA Donor Company * Total includes $0.2m invested
via MLA Donor Company
Producer levies $58.1m
Government funding $2.3m
Processor contributions $0.9m
Other sources $2.4m
Producer levies $6.0m
Government funding $12.8m
Processor contributions $1.3m
Other sources $8.6m
Government funding $5.6m
Processor contributions $2.0m
Processor contributions $2.0m
Other sources $3.6m
Producer levies $0.5m
Government funding $0.4m
LiveCorp contributions $0.3m
Total
$1.9m
Total*
$12.7m
Total*
$27.0m
Producer levies $1.1m
Role of red meat E�ciency in tradeStewardship of environWelfare of animals
Government funding $0.7m
Processor contributions $0.1m
Producer levies $2.4m
Government funding $2.2m
Processor contributions $1.5m
LiveCorp contributions $0.1m
Other sources $6.6m
Producer levies $3.9m
Government funding $12.4m
Processor contributions $3.1m
Other sources $7.6m
Producer levies $1.7m
Government funding $0.4m
Total*
$8.0m
Total*
$53.0m
Total
$2.1m
Producer levies $3.4m
Government funding $1.2m
Processor contributions $2.9m
LiveCorp contributions $0.2m
Other sources $0.3m
* Total includes $0.2m invested via MLA Donor Company
Producer levies $12.8m
Government funding $25.6m
Other sources $14.6m
Quality and systems integrity Production e�cienciesOptimising product qualityMarketing and promos
Total
$12.4m
Producer levies $9.5m
Government funding $2.1m
Other sources $0.6m
* Total includes $0.1m invested via MLA Donor Company
Engagement
Building leadership Protecting industryLive exportProcessing productivity
Total
$1.3mTotal*
$11.2m
2018–19 INVESTMENT BY FUNDING SOURCE

27
About
MLA
Financial report
Supporting inform
ationO
verview
Goatmeat:
• MLA contributed approximately $16,000 to seven goatmeat activities in three countries.
Key activities supported over the year included:
• Strategy and brand development: engaging consultants and agencies to develop brand marketing strategies.
• Business development: participation at trade shows; seminars for chefs educating on range of product specifications and cuts to meet their customer and consumer requirements; sponsoring trade delegations to inspect paddock-to-plate supply chains.
• Brand building: social media campaigns to raise awareness of brands; advertising in magazines and billboards; in-store sampling to raise awareness and sales of branded Australian beef and lamb; sponsorship of customer and consumer-facing events to build brand awareness.
True Aussie campaigns in international markets
MLA’s True Aussie brand continues to promote Australian beef, lamb and goatmeat in 35 export markets. It’s designed to create awareness of Australian red meat attributes, build preference, and enable Australia to differentiate itself from competitors.
International marketing highlights in 2018–19 include:
Japan
A key activity was the annual ‘Let’s Barbie!’ campaign in Japan, which played a vital role in ‘taking up the slack’ in demand for barbecue beef cuts during Australia’s winter.
The campaign reached more than 60 million people and sales of True Aussie beef increased 5% year-on-year.
China
Global tradeshows provide a strong platform for the Australian red meat industry to promote its credentials. One of the more prominent opportunities is SIAL China, the world’s third largest (and Asia’s largest) food and drink trade show. More than 117,000 visitors attended the event in May.
A True Aussie-branded industry stand hosted 26 Australian red meat exporter participants and showcased red meat export brands, product demonstrations, butchery, kitchen and chiller displays.
According to a post-event survey, all participants at MLA’s True Aussie stand stated they built preference for their products among target consumers at the trade show.
Innovative recipes for foodservice
MLA teamed up with Australia’s largest foodservice provider, Compass Group, to develop and launch 11 new beef and lamb recipes for Compass clients.
Compass serves up 65 million meals a year for a range of industries, purchasing up to three million kilos of beef and sheepmeat annually.
MLA’s Corporate Chef Sam Burke began working with Compass in July 2018 to help create new red meat dishes for the group.
Sam and MSA retail training facilitator Kelly Payne also hosted a training session with the Compass food team on cut-for-cook utilisation of secondary, non-loin cuts.
Another successful foodservice campaign was with Rashays, who operate more than 28 casual dining restaurants and two food court locations.
MLA worked with Rashays to develop recipes using Australian beef for their Meat Lovers Campaign, which ran in March and April 2019, during which time Rashays sold more than 23,000 beef meals – or a 5.2% increase on the previous month’s sales.
The slow-cooked BBQ Texan brisket burger was the most popular, selling 13,909 meals, followed by the slow-cooked sticky BBQ ribs (5,324) and Wagyu scotch fillet (3,858).
Report to stakeholders
As part of ongoing work with the foodservice sector, MLA collaborated with airline catering company, Gate Gourmet, to expand the presence
of Australian red meat on in-flight menus. Gate Gourmet is part of the global Gate Group, which services end-to-end airline catering from 200 facilities in 60 countries for a range of different airlines.
MLA’s Sam Burke, Julie Ballard and Kelly Payne ran workshops for Gate Gourmet staff to showcase how secondary cuts like lamb shoulder, beef brisket and rump cap could provide tasty, affordable airline dishes. Following the workshops, Gate Gourmet incorporated Australian red meat on a number of menus, including a range of new lamb dishes for a domestic airline.
A Moroccan lamb dish using diced Australian lamb shank will now be offered in economy class on selected flights across Australia, with 98,829 portions of the dish expected to be served by the airline annually, using 15 tonnes of Australian lamb. This will be in addition to the 150 tonnes of Australian beef and lamb already used each year by Gate Gourmet.
The collaboration between MLA and Gate Gourmet also saw the introduction of seven dishes featuring Australian beef and lamb on an international airline’s new menu on flights from Sydney and Los Angeles earlier this year.
From paddock to plane
MLA’s chefs Sam Burke and Julie Ballard (centre), pictured with the Gate Gourmet team led by Executive Chef Asia Pacific Jeremy Steele (second from left).

28
Supply chain efficiency and integrity
Lamb definition updated
giving producers greater certainty when sending
lambs to market (page 30)
Changes to MSA set to deliver benefits
along entire value chain (page 30)
$198 million in additional
farm gate returns
through MSA program (page 31)
96% of lambs following
MSA pathways met program requirements
(page 31)
HIG
HLIG
HT
S
MEAT INDUSTRY STRATEGIC PLAN (MISP)
2020 PRIORITIES
• Optimising product quality and cost efficiency
• Guaranteeing product quality and systems integrity
AUSTRALIAN GOVERNMENT PRIORITIES
Science and Research Rural Research, Development and Extension
• Food• Transport
• Advanced technology
• Adoption of research and development
• Biosecurity
ALIGNMENT TO INDUSTRY AND GOVERNMENT PRIORITIES
PILLAR
3
See Appendix A for a full list of KPIs. Please note some KPIs may be relevant across several pillars.
42KPIs
27 achieved 1 partly achieved 12 not achieved or not on track 2 on track to be achieved by 2020
KEY PERFORMANCE INDICATORS
Satisfied customers and industry partners working in collaboration are signs of a well-functioning value chain. The red meat and livestock industry strives to achieve this through Meat Standards Australia,
which guarantees consumers a minimum eating quality in their red meat purchases, and also through integrity systems that underpin clean, safe, natural and traceability claims. The red meat and livestock industry has an opportunity to enhance this win-win for customers and value chain partners through objective measurement technologies, information exchange and value-based pricing, where consumers pay the true value of the products they purchase and industry is able to increase the value of each carcase.
Total*
$40.0mTotal*
$71.8m
Total*
$41.5mTotal*
$29.1m
Total*
$65.5mTotal*
$12.4m
Producer levies $8.0m
Government funding $14.4m
Processor contributions $0.9m
LiveCorp contributions $1.1m
Other sources $15.6m
Producer levies $61.4m
Government funding $3.6m
Processor contributions $3.9m
LiveCorp contributions $0.2m
Other sources $2.7m
* Total includes $19.8m invested via MLA Donor Company
* Total includes $2.9m invested via MLA Donor Company
Producer levies $8.5m
Government funding $15.0m
Processor contributions $2.8m
LiveCorp contributions $0.1m
Other sources $15.1m
Producer levies $5.6m
Government funding $12.8m
Processor contributions $3.1m
Other sources $7.6m
* Total includes $18.4m invested via MLA Donor Company
* Total includes $18.3m invested via MLA Donor Company
Producer levies $13.3m
Government funding $31.6m
Processor contributions $2.0m Processor contributions $0.2m
LiveCorp contributions $0.3m
Other sources $18.2m
Producer levies $9.5m
Government funding $2.1m
Other sources $0.6m
* Total includes $34.7m invested via MLA Donor Company
* Total includes $0.1m invested via MLA Donor Company
2018–19 INVESTMENT BY FUNDING SOURCE
Total
$40.0mTotal
$71.8m
Total
$41.5mTotal
$29.1m
Total
$65.5m
Continuous improvement of the welfare of animals in our care $20.4m
Stewardship of environmental resources $17.7m
Role of red meat in a healthy diet $1.9m
E�ciency and value in trade and market access $8.0m
Marketing and promoting Australian red meat and livestock $63.8m
Optimising product quality and cost e�ciency $28.7m
Guaranteeing product quality and systems integrity $12.7m
Building leadership capability $27.0m
Protecting and promoting our industry $2.1m
Production e�ciencies in farms and feedlots $53.0m
Processing productivity $11.2m
Live export productivity $1.3m
Total
$12.4m
Engagement with producers and stakeholders' priority $12.4m
2018–19 INVESTMENT BY PRIORITY
$28.
3m
$38.
0m
$33.
2m
$22.
4m
2014
–15
2015
–16
2016
–17
2017
–18
2018
–19
$40.
0m
$62.
9m
$67.
0m
$50.
4m
$67.
2m
2014
–15
2015
–16
2016
–17
2017
–18
2018
–19
$71.
8m
$16.
5m
$26.
4m
$12.
9m
$7.8
m
2014
–15
2015
–16
2016
–17
2017
–18
2018
–19
$29.
1m
$16.
5m
$26.
4m
$12.
9m
$7.8
m
2014
–15
2015
–16
2016
–17
2017
–18
2018
–19
$29.
1m
$62.
9m
$67.
0m
$50.
4m
$67.
2m
2014
–15
2015
–16
2016
–17
2017
–18
2018
–19
$71.
8m
$29.
1m
$35.
8m
$20.
0m $2
6.8m
2014
–15
2015
–16
2016
–17
2017
–18
2018
–19
$41.
5m
$6.0
m
$8.3
m$9.6
m
$4.5
m
2014
–15
2015
–16
2016
–17
2017
–18
2018
–19
$12.
4m
$6.0
m
$8.3
m$9.6
m
$4.5
m
2014
–15
2015
–16
2016
–17
2017
–18
2018
–19
$12.
4m
$29.
1m
$35.
8m
$20.
0m $2
6.8m
2014
–15
2015
–16
2016
–17
2017
–18
2018
–19
$41.
5m
$37.
6m
$73.
5m
$40.
2m
$31.1
m
2014
–15
2015
–16
2016
–17
2017
–18
2018
–19
$65.
5m
$37.
6m
$73.
5m
$40.
2m
$31.1
m
2014
–15
2015
–16
2016
–17
2017
–18
2018
–19
$65.
5m
$28.
3m
$38.
0m
$33.
2m
$22.
4m
2014
–15
2015
–16
2016
–17
2017
–18
2018
–19
$40.
0m
INVESTMENT OVER TIME

Overview
About
MLA
Financial report
Supporting inform
ation
1,635 producers now have access to
valuable carcase feedback through
Livestock Data Link (page 33)
eNVDs comprised
21.6% of total supply chain
movements, following a range of improvements to the system (page 33)
94,285 producers completed
accreditation under the enhanced
LPA program (page 33)
The Integrity System 2025 and beyond
strategy was endorsed by industry (page 32)
Report to stakeholders
29

30
While lambs under the new definition can be slightly older than they previously were, the length of time a lamb is considered a lamb could be extended by less than a month.
Lamb was previously defined as ‘a female, castrate or entire male that has zero permanent incisor teeth’, meaning the moment a permanent incisor erupted, the lamb was downgraded to hogget.
The new definition is also consistent with New Zealand’s definition, Australia’s biggest lamb competitor in export markets, and serves to even the playing field between the two countries.
Importantly, research has shown that lamb under the new definition produced no discernible difference in eating quality compared with lambs with only milk teeth.
Meat Standards Australia update
Changes to MSA
Meat Standards Australia (MSA) rolled out several changes to its beef model, the MSA Vendor Declaration Form and myMSA from June 2019, to deliver more benefits throughout the value chain, particularly to consumers.
The beef model updates incorporate findings from seven years of research, reviewed by the independent scientists on the MSA R&D Pathways Committee.
Key changes include:
• Hump height is now used as a direct predictor of eating quality rather than an estimate of tropical breed content.
• The number of ‘cut by cook’ combinations have increased from 169 to 275 to give new secondary cut options to the foodservice industry and provide increasingly popular consumer cooking methods such as sous vide and kombi-oven roasting.
• The MSA Vendor Declaration Form has been revised to simplify how producers record tropical breed content. It also
Since its inception in 1998, the industry’s uptake of Meat Standards Australia (MSA) has helped lift the eating quality of red meat in the domestic market. The opportunity now exists to broaden the reach
of MSA to export markets by providing marketers with a tool to sell Australian beef and lamb with eating quality claims.
This priority also works with individual supply chains to reduce the eating quality variation within a production run and segregate and extract higher premiums for product with higher eating quality. There is also opportunity to improve the value of the carcase through value-based pricing, underpinned by accurate and transparent objective measurements.
OVERVIEW
Resources to support lamb definition change
Following the amendment of various pieces of federal and state legislation and regulations in 2018–19, Australia’s new definition of lamb came into effect on 1 July 2019, giving producers greater certainty and a definitive signal to make moves to market their lambs.
MLA, Sheep Producers Australia and the Australian Meat Industry Council developed a new series of resources to provide guidance to the industry on what the change means in practice and how to apply the new definition. The resources are available at sheepproducers.com.au/lamb-definition.
The new definition of lamb is ‘an ovine animal that is under 12 months of age or does not have any permanent incisor teeth in wear’. This means a lamb is able to cut one or both of its permanent central incisor teeth, as long as they are not in wear. A permanent incisor is considered ‘in wear’ if it touches the upper pad when the sheep’s mouth is closed or is above the height of the lamb’s milk teeth either side of the permanent incisors.
Optimising product quality and cost efficiency
PILLAR
3
Total*
$20.4mTotal*
$17.7m
Total*
$63.8mTotal*
$28.7m
Producer levies $5.1m
Government funding $8.4m
LiveCorp contributions $1.1m
Other sources $5.8m
Producer levies $1.9m
Government funding $5.3m
Processor contributions $0.8m
Other sources $9.8m
* Total includes $10.8m invested via MLA Donor Company
* Total includes $2.7m invested via MLA Donor Company
* Total includes $8.8m invested via MLA Donor Company * Total includes $18.3m invested
via MLA Donor Company
* Total includes $16.2m invested via MLA Donor Company
* Total includes $25.8m invested via MLA Donor Company
* Total includes $2.2m invested via MLA Donor Company
* Total includes $9.0m investedvia MLA Donor Company * Total includes $0.2m invested
via MLA Donor Company
Producer levies $58.1m
Government funding $2.3m
Processor contributions $0.9m
Other sources $2.4m
Producer levies $6.0m
Government funding $12.8m
Processor contributions $1.3m
Other sources $8.6m
Government funding $5.6m
Processor contributions $2.0m
Processor contributions $2.0m
Other sources $3.6m
Producer levies $0.5m
Government funding $0.4m
LiveCorp contributions $0.3m
Total
$1.9m
Total*
$12.7m
Total*
$27.0m
Producer levies $1.1m
Role of red meat E�ciency in tradeStewardship of environWelfare of animals
Government funding $0.7m
Processor contributions $0.1m
Producer levies $2.4m
Government funding $2.2m
Processor contributions $1.5m
LiveCorp contributions $0.1m
Other sources $6.6m
Producer levies $3.9m
Government funding $12.4m
Processor contributions $3.1m
Other sources $7.6m
Producer levies $1.7m
Government funding $0.4m
Total*
$8.0m
Total*
$53.0m
Total
$2.1m
Producer levies $3.4m
Government funding $1.2m
Processor contributions $2.9m
LiveCorp contributions $0.2m
Other sources $0.3m
* Total includes $0.2m invested via MLA Donor Company
Producer levies $12.8m
Government funding $25.6m
Other sources $14.6m
Quality and systems integrity Production e�cienciesOptimising product qualityMarketing and promos
Total
$12.4m
Producer levies $9.5m
Government funding $2.1m
Other sources $0.6m
* Total includes $0.1m invested via MLA Donor Company
Engagement
Building leadership Protecting industryLive exportProcessing productivity
Total
$1.3mTotal*
$11.2m
2018–19 INVESTMENT BY FUNDING SOURCE

Overview
Report to stakeholders
About
MLA
Financial report
Supporting inform
ation
31
Meat Standards Australia delivered an additional $198 million in farm gate returns in 2018–19, a record high for the program since it was first
launched in 1998. This represents a 30% increase on the $152 million in additional farm gate returns delivered in 2017–18.
MSA delivers record farm gate returnsprovides an option for owners who use agistment or custom feeding to receive direct carcase feedback through the myMSA feedback portal.
• New myMSA features enable producers to access an Opportunity Index on cattle that did not meet minimum MSA grading requirements, giving producers an indication of the potential value of those carcases if they addressed the reasons for non-compliance. The myMSA online portal has also been refreshed to be more user-friendly.
The changes received unanimous support from the MSA Pathways R&D Committee, MSA Beef Taskforce and the Australian Meat Industry Language and Standards Committee.
Beef
Cattle processed through the MSA program in 2018–19 comprised 43% of the total national adult cattle slaughter, the same rate as the previous year. However, an additional 350,000 cattle were processed through the MSA program in 2018–19, the highest number of cattle graded in a year since MSA’s inception.
In the face of challenging conditions throughout Australia, MSA compliance rates decreased slightly to 93.8%, down on the previous year’s record high of 94.3%.
The MSA Index is a score between 30 and 80, assigned to beef carcases to represent the eating quality potential of a whole carcase. It’s a tool that producers and lot feeders can use to benchmark the impact of genetic and management interventions on eating quality, across time periods. In 2018–19, the national average MSA Index decreased to 57.48, down slightly from 57.78 in 2017–18.
Sheepmeat
The number of sheep following MSA pathways in 2018–19 represented 19% of the national lamb slaughter, with 73% of these going on into MSA-trademarked brands.
MSA compliance rates reached a new high, with 96% of all lambs graded meeting MSA requirements, up from 95% in 2017–18.
Brands
Growth in MSA beef and sheep brands continues, with an additional 23 brands in 2018–19, lifting the total number of MSA-licensed brands to 195.
In export markets, the US Department of Agriculture again approved MSA as a Process Verified Program, with more
brand owners taking up the opportunity to use the program’s shield on their MSA products in the US.
myMSA
Producers continue to engage with the online digital platform, myMSA, with 4,300 producers using myMSA more than 16,000 times in 2018–19. Additionally, more than 3,100 beef and/or sheepmeat producers attended one of the 47 MSA producer information sessions or workshops held throughout the year.
23 additional MSA-licensed
brands
$198 million in additional farm
gate returns from MSA

32
• National Vendor Declarations replaced by automated verification systems
• automated verification of market suitability
• data-driven decision making and data sharing
• implicit compliance.
Initiatives will be delivered over three time horizons – one to two years, two to five years, and over five years.
ISC will be accountable for the overall delivery of the IS2025 Plan and will work collaboratively with industry and government.
Digital value chain information
Digital value chain information helps to foster the prosperity of the Australian red meat and livestock industry by enabling increased productivity and value along the supply chain.
This occurs by capturing, integrating and interpreting the vast and increasing range of data that is being generated through existing and new technologies. Providing producers and industry supply chains with decision support tools and services that optimise and predict the quality of their product, enables market access and supports biosecurity.
In 2018–19, a total of 19,335 Livestock Production Assurance (LPA) and National Livestock Identification System (NLIS) accounts were linked to myMLA, comprising 9,384 NLIS accounts and 9,951 LPA accounts.
Data sharing and security principles were established and endorsed, along with a data platform strategy implementation plan.
The digital value chain program was further enhanced through the Growing Digital project, a collaboration between 11 Research and Development Corporations to ensure program alignment with and value from whole-of-industry digital strategy, capability and benchmarking.
Australian red meat is marketed as clean, safe and natural, underpinned by its disease-free status and advanced food safety and integrity systems. As our competitors build their own capabilities to
deliver a similar product claim, it is essential for Australia to enhance our systems and technologies to keep ahead of our competitors and maintain our point of difference.
Raising the bar of our integrity systems also helps Australia continue to access markets which demand higher levels of product assurance. With the development of the Integrity System 2025 and beyond strategy, investments will be made into sourcing the best technology and data systems available, which will strengthen the systems even further, while also reducing the complexity and demands of the system on the supply chain.
OVERVIEW
Integrity System 2025 Strategic Plan
Integrity Systems Company (ISC) released the Integrity System 2025 and beyond strategy (IS2025 Plan) in 2018–19 to prepare industry for the future and guide valuable investment into the integrity system and its programs.
The IS2025 Plan was developed through extensive consultation with industry and government and informed by a comprehensive analysis of the current system and global trends.
The Plan aims to ensure Australia’s integrity system remains recognised and trusted globally as underpinning a quality product, produced to rigorous standards and embedded in Australian livestock management.
The integrity system of the future must be simple to use, valued by industry and trusted by consumers.
The IS2025 Plan outlines key priorities that will achieve this, including:
• automated identification of livestock and locations
• real-time monitoring and tracking of livestock
Guaranteeing product quality and systems integrity
PILLAR
3
Digital value chain and supply chain extension officers
To enhance digital capability within individual companies or supply chains and support producers, eight digital value chain and supply chain extension officers have been co-funded through the MLA Donor Company (MDC).
The role of digital value chain officers is to enhance digital capability, specifically through the provision of advanced analytics of data sets to generate new insights for the business.
The role of supply chain extension officers is to support producers in utilising existing and new data and feedback as it becomes available through objective measurement technology and other sources. This will improve decision making and management practices, so on-farm productivity and profitability is enhanced.
Demand for the co-funded positions has exceeded expectations, with a waitlist in place to fulfil positions as funding becomes available. A workshop for the new digital value chain and supply chain extension officers was held in March.
Total*
$20.4mTotal*
$17.7m
Total*
$63.8mTotal*
$28.7m
Producer levies $5.1m
Government funding $8.4m
LiveCorp contributions $1.1m
Other sources $5.8m
Producer levies $1.9m
Government funding $5.3m
Processor contributions $0.8m
Other sources $9.8m
* Total includes $10.8m invested via MLA Donor Company
* Total includes $2.7m invested via MLA Donor Company
* Total includes $8.8m invested via MLA Donor Company * Total includes $18.3m invested
via MLA Donor Company
* Total includes $16.2m invested via MLA Donor Company
* Total includes $25.8m invested via MLA Donor Company
* Total includes $2.2m invested via MLA Donor Company
* Total includes $9.0m investedvia MLA Donor Company * Total includes $0.2m invested
via MLA Donor Company
Producer levies $58.1m
Government funding $2.3m
Processor contributions $0.9m
Other sources $2.4m
Producer levies $6.0m
Government funding $12.8m
Processor contributions $1.3m
Other sources $8.6m
Government funding $5.6m
Processor contributions $2.0m
Processor contributions $2.0m
Other sources $3.6m
Producer levies $0.5m
Government funding $0.4m
LiveCorp contributions $0.3m
Total
$1.9m
Total*
$12.7m
Total*
$27.0m
Producer levies $1.1m
Role of red meat E�ciency in tradeStewardship of environWelfare of animals
Government funding $0.7m
Processor contributions $0.1m
Producer levies $2.4m
Government funding $2.2m
Processor contributions $1.5m
LiveCorp contributions $0.1m
Other sources $6.6m
Producer levies $3.9m
Government funding $12.4m
Processor contributions $3.1m
Other sources $7.6m
Producer levies $1.7m
Government funding $0.4m
Total*
$8.0m
Total*
$53.0m
Total
$2.1m
Producer levies $3.4m
Government funding $1.2m
Processor contributions $2.9m
LiveCorp contributions $0.2m
Other sources $0.3m
* Total includes $0.2m invested via MLA Donor Company
Producer levies $12.8m
Government funding $25.6m
Other sources $14.6m
Quality and systems integrity Production e�cienciesOptimising product qualityMarketing and promos
Total
$12.4m
Producer levies $9.5m
Government funding $2.1m
Other sources $0.6m
* Total includes $0.1m invested via MLA Donor Company
Engagement
Building leadership Protecting industryLive exportProcessing productivity
Total
$1.3mTotal*
$11.2m
2018–19 INVESTMENT BY FUNDING SOURCE

Overview
Report to stakeholders
About
MLA
Financial report
Supporting inform
ation
33
The electronic National Vendor Declaration (eNVD) system aims to streamline data transfer along the value chain, reducing costs and improving information
accuracy. Following steady uptake of the system after it launched in August 2017, eNVDs now capture 21.6% of total livestock movements through the supply chain and adoption continues to increase.
The system underwent a range of improvements in 2018–19, including an enhanced property identification code search function. A phased approach is underway for further enhancements to the eNVD system, including incorporating user testing and feedback, to improve user functionality across web and mobile applications. Improvements planned for 2019–20 will look to develop offline creation of all forms and leveraging modern technologies for all supply chain participants to integrate with.
Producers switching to eNVDs
LPA update
The Livestock Production Assurance (LPA) program is the Australian livestock industry’s on-farm assurance program covering food safety, animal welfare and biosecurity. It provides evidence of livestock history and on-farm practices when transferring livestock through the value chain.
More than 94,000 producers have now completed the accreditation process under the Integrity Systems Company’s (ISC) enhanced program since it was launched on 1 October 2017.
Of these producers, 17,070 were new accreditations; 16,730 were voluntary renewals; and 57,460 were requested renewals.
Total
200,284
New South Wales 71,797
Victoria 52,444
Queensland 42,657
South Australia 13,262
Western Australia 12,566
Tasmania 7,216
Northern Territory 342
2018–19 LPA-ACCREDITED PRODUCERS
While LPA is a voluntary program, it is recognised both domestically and internationally, and demanded by supply chains around the globe.
As part of the program, ISC oversees close to 2,000 random audits and 1,000 targeted audits of LPA-accredited producers each year.
NLIS update
Australia’s reputation for producing safe, high quality livestock products for both domestic and export markets is underpinned by the National Livestock Identification System (NLIS).
NLIS movement recording compliance was 96.04% in 2018–19. This was above the published key performance indicator of 95.75%.
NLIS data showed cattle movements increased by 9% to 23.4 million.
NLIS sheep (mob) movements decreased by 8% to 38.3 million and goat (mob)
movements decreased by 22% to 2.5 million.
Individual NLIS sheep movements increased 175% to 11 million and individual goat movements increased 40% to 7,751. This substantial increase was a result of the implementation of mandatory electronic identification and individual movement recording for sheep and goats in Victoria.
Livestock Data Link
A range of enhancements to the online carcase feedback resource, Livestock Data Link (LDL), were rolled out in 2018–19.
As at 30 June 2019, LDL was used by 1,635 producers, an increase of 378 year-on-year. To showcase how LDL benefits producers, three new on-farm case study videos were released and have been viewed more than 1,070 times.
LDL has expanded its accessibility beyond producers and processors, with several service-kill operators and brand owners now able to access data via LDL.
The Beef Breeder report has been improved to include Meat Standards Australia (MSA) information for graded carcases. Producers who have bred but not directly consigned cattle to a processor will be able to access feedback on any MSA-graded carcases. If the carcases weren’t graded, the original breeder will still see basic carcase feedback.
Through its link with LDL, the National Sheep Health Monitoring Project has been able to supply 2018–19 animal health feedback for over 8 million sheep.

34
Productivity and profitability
>$6 million worth of R&D investments influenced via direct
producer consultation (page 36)
Psyllid-resistant leucaena
variety released (page 36)
Increasing productivity and profitability across the red meat and livestock industry will assist all supply chain participants to raise their competitiveness, improve long-term sustainability and help offset the
long running cost–price squeeze.
Encouraging the red meat supply chain to increase its productivity requires a new approach to research adoption. Providing producers, lot feeders, live exporters and processors with compelling commercial benefits to implement research and development is another priority. Also critical is the supply of timely, accurate and relevant tools, technologies and information.
Feedlot bunk
scannercommercialised
(page 36)
A new tool to fight
parkinsonia became commercially
available (page 37)
HIG
HLIG
HT
S
See Appendix A for a full list of KPIs. Please note some KPIs may be relevant across several pillars.
90KPIs
58 achieved 6 partly achieved 22 not achieved or not on track 3 not available 1 on track to be achieved by 2020
KEY PERFORMANCE INDICATORS
MEAT INDUSTRY STRATEGIC PLAN (MISP)
2020 PRIORITIES
• Production efficiencies in farms and feedlots
• Processing productivity
• Live export productivity
AUSTRALIAN GOVERNMENT PRIORITIES
Science and Research Rural Research, Development and Extension
• Soil and water• Food• Transport• Environmental change• Advanced
manufacturing• Energy
• Advanced technology
• Adoption of research and development
• Soil, water and managing natural resources
ALIGNMENT TO INDUSTRY AND GOVERNMENT PRIORITIES
PILLAR
4
Total*
$40.0mTotal*
$71.8m
Total*
$41.5mTotal*
$29.1m
Total*
$65.5mTotal*
$12.4m
Producer levies $8.0m
Government funding $14.4m
Processor contributions $0.9m
LiveCorp contributions $1.1m
Other sources $15.6m
Producer levies $61.4m
Government funding $3.6m
Processor contributions $3.9m
LiveCorp contributions $0.2m
Other sources $2.7m
* Total includes $19.8m invested via MLA Donor Company
* Total includes $2.9m invested via MLA Donor Company
Producer levies $8.5m
Government funding $15.0m
Processor contributions $2.8m
LiveCorp contributions $0.1m
Other sources $15.1m
Producer levies $5.6m
Government funding $12.8m
Processor contributions $3.1m
Other sources $7.6m
* Total includes $18.4m invested via MLA Donor Company
* Total includes $18.3m invested via MLA Donor Company
Producer levies $13.3m
Government funding $31.6m
Processor contributions $2.0m Processor contributions $0.2m
LiveCorp contributions $0.3m
Other sources $18.2m
Producer levies $9.5m
Government funding $2.1m
Other sources $0.6m
* Total includes $34.7m invested via MLA Donor Company
* Total includes $0.1m invested via MLA Donor Company
2018–19 INVESTMENT BY FUNDING SOURCE
Total
$40.0mTotal
$71.8m
Total
$41.5mTotal
$29.1m
Total
$65.5m
Continuous improvement of the welfare of animals in our care $20.4m
Stewardship of environmental resources $17.7m
Role of red meat in a healthy diet $1.9m
E�ciency and value in trade and market access $8.0m
Marketing and promoting Australian red meat and livestock $63.8m
Optimising product quality and cost e�ciency $28.7m
Guaranteeing product quality and systems integrity $12.7m
Building leadership capability $27.0m
Protecting and promoting our industry $2.1m
Production e�ciencies in farms and feedlots $53.0m
Processing productivity $11.2m
Live export productivity $1.3m
Total
$12.4m
Engagement with producers and stakeholders' priority $12.4m
2018–19 INVESTMENT BY PRIORITY
$28.
3m
$38.
0m
$33.
2m
$22.
4m
2014
–15
2015
–16
2016
–17
2017
–18
2018
–19
$40.
0m
$62.
9m
$67.
0m
$50.
4m
$67.
2m
2014
–15
2015
–16
2016
–17
2017
–18
2018
–19
$71.
8m
$16.
5m
$26.
4m
$12.
9m
$7.8
m
2014
–15
2015
–16
2016
–17
2017
–18
2018
–19
$29.
1m
$16.
5m
$26.
4m
$12.
9m
$7.8
m
2014
–15
2015
–16
2016
–17
2017
–18
2018
–19
$29.
1m
$62.
9m
$67.
0m
$50.
4m
$67.
2m
2014
–15
2015
–16
2016
–17
2017
–18
2018
–19
$71.
8m
$29.
1m
$35.
8m
$20.
0m $2
6.8m
2014
–15
2015
–16
2016
–17
2017
–18
2018
–19
$41.
5m
$6.0
m
$8.3
m$9.6
m
$4.5
m
2014
–15
2015
–16
2016
–17
2017
–18
2018
–19
$12.
4m
$6.0
m
$8.3
m$9.6
m
$4.5
m
2014
–15
2015
–16
2016
–17
2017
–18
2018
–19
$12.
4m
$29.
1m
$35.
8m
$20.
0m $2
6.8m
2014
–15
2015
–16
2016
–17
2017
–18
2018
–19
$41.
5m
$37.
6m
$73.
5m
$40.
2m
$31.1
m
2014
–15
2015
–16
2016
–17
2017
–18
2018
–19
$65.
5m
$37.
6m
$73.
5m
$40.
2m
$31.1
m
2014
–15
2015
–16
2016
–17
2017
–18
2018
–19
$65.
5m
$28.
3m
$38.
0m
$33.
2m
$22.
4m
2014
–15
2015
–16
2016
–17
2017
–18
2018
–19
$40.
0m
INVESTMENT OVER TIME

Overview
Report to stakeholders
About
MLA
Financial report
Supporting inform
ation
35
Overview
About
MLA
Financial report
Supporting inform
ation
$30/head benefit
estimated following development
of world’s first automated beef boning room
(page 39)
Five lamb processors
and one beef abattoir
adopted DEXA technology (page 39)
Launch of new
genetics hubto provide tips
and tools for using breeding values
(page 37)
>50 projects established
to improve breeding selection accuracy
for producers (page 37)
Report to stakeholders

36
Priority areas were determined by producers via the Southern Australia Livestock Research Council (SALRC), North Australia Beef Research Council (NABRC), and Western Australian Livestock Research Council (WALRC).
The new projects addressed:• optimising reproduction efficiency in
sheep production systems• improved methodologies for objective
measures that can predict carcase characteristics; and crush-side or remote data collection technologies for animal health, welfare and productivity
• implementation of novel grazing systems• biological controls for weeds• quantifying regional impacts of
competitive grazing pressure• short-term reviews to address:
– calf loss in southern Australia – on-farm actions to impact legume nodulation and rhizobia
– tree-grass balance• development of a Calf Loss Consortium
for northern Australia.
The Regional Consultation process is moving to a ‘programs approach’ to ensure projects are addressing larger industry issues, enabling a bigger impact in producers’ priority areas.
The Calf Loss Consortium has been conceived as a program approach to address the significant calf survival issues in northern Australia. Expressions of interest have been received from six organisations, representing 38 researchers, to participate. The first meeting of this consortium was held in August 2019 to discuss the program of work required and funding sources.
An MLA report, Research and development stocktake, was compiled in February 2019 to inform the regional councils on current research to help identify research gaps and ensure duplication is avoided. This report is set to be published in 2019–20.
Redlands leucaena launch
MLA investment has paved the way for leucaena-based grazing systems in the north’s high-rainfall zones, with the launch of the psyllid-resistant variety, Redlands.
For producers and lot feeders to remain competitive and sustainable in the long term, MLA’s research, development and adoption programs need to deliver outcomes that improve their bottom line. This
priority is focused on providing producers and lot feeders with options to improve the efficiency of their operations through programs including genetics and genomics, feedbase, reproduction, animal nutrition, compliance to market specifications and feed efficiency. MLA will support the uptake of new practices through outcomes focused on producer education, training and coaching.
OVERVIEW
Feedlot technology
MLA and the Australian Lot Feeders’ Association are investing grainfed levies to deliver technologies, developed by automation and robotics solution company Manabotix, to add value to feedlots by improving bunk management, feed delivery and labour efficiency.
An Australian patent was granted in April 2019 for a feed bunk scanner – ‘BunkBot’ – which objectively determines the quantity of feed remaining in cattle feed bunks. The technology was commercially launched at BeefEx in Brisbane in October 2018 and is now available to industry.
Evaluations of the BunkBot technology in three feedlots were completed this year. It proved to be more precise and accurate than human callers, with feedlot managers reporting it offers potential productivity and profitability benefits by ensuring feed allocation is as accurate as possible to optimise cattle performance and prevent feed wastage.
In another project between MLA and Bindaree Beef Group, a prototype feed truck auto-delivery system was developed to ensure more consistent and efficient delivery of feed into bunks.
Manabotix designed the technology for retrofitting on existing feed trucks in feedlots to address productivity, staff training and safety issues. Initial testing to date has indicated feed time efficiency savings of up to 20%, as drivers can accomplish single-pass feeding.
The system is in the second phase of testing on a Roto-Mix feed truck at Bindaree Beef Group’s Myola Feedlot at North Star, NSW.
Regional Consultation for RD&A
Livestock productivity, feedbase and management of pests and weeds were among the priorities for livestock producers who influenced the investment of more than $6 million of levy funds for new projects in MLA’s Regional Consultation annual call.
Production efficiencies in farms and feedlots
PILLAR
4
BunkBot
Total*
$20.4mTotal*
$17.7m
Total*
$63.8mTotal*
$28.7m
Producer levies $5.1m
Government funding $8.4m
LiveCorp contributions $1.1m
Other sources $5.8m
Producer levies $1.9m
Government funding $5.3m
Processor contributions $0.8m
Other sources $9.8m
* Total includes $10.8m invested via MLA Donor Company
* Total includes $2.7m invested via MLA Donor Company
* Total includes $8.8m invested via MLA Donor Company * Total includes $18.3m invested
via MLA Donor Company
* Total includes $16.2m invested via MLA Donor Company
* Total includes $25.8m invested via MLA Donor Company
* Total includes $2.2m invested via MLA Donor Company
* Total includes $9.0m investedvia MLA Donor Company * Total includes $0.2m invested
via MLA Donor Company
Producer levies $58.1m
Government funding $2.3m
Processor contributions $0.9m
Other sources $2.4m
Producer levies $6.0m
Government funding $12.8m
Processor contributions $1.3m
Other sources $8.6m
Government funding $5.6m
Processor contributions $2.0m
Processor contributions $2.0m
Other sources $3.6m
Producer levies $0.5m
Government funding $0.4m
LiveCorp contributions $0.3m
Total
$1.9m
Total*
$12.7m
Total*
$27.0m
Producer levies $1.1m
Role of red meat E�ciency in tradeStewardship of environWelfare of animals
Government funding $0.7m
Processor contributions $0.1m
Producer levies $2.4m
Government funding $2.2m
Processor contributions $1.5m
LiveCorp contributions $0.1m
Other sources $6.6m
Producer levies $3.9m
Government funding $12.4m
Processor contributions $3.1m
Other sources $7.6m
Producer levies $1.7m
Government funding $0.4m
Total*
$8.0m
Total*
$53.0m
Total
$2.1m
Producer levies $3.4m
Government funding $1.2m
Processor contributions $2.9m
LiveCorp contributions $0.2m
Other sources $0.3m
* Total includes $0.2m invested via MLA Donor Company
Producer levies $12.8m
Government funding $25.6m
Other sources $14.6m
Quality and systems integrity Production e�cienciesOptimising product qualityMarketing and promos
Total
$12.4m
Producer levies $9.5m
Government funding $2.1m
Other sources $0.6m
* Total includes $0.1m invested via MLA Donor Company
Engagement
Building leadership Protecting industryLive exportProcessing productivity
Total
$1.3mTotal*
$11.2m
2018–19 INVESTMENT BY FUNDING SOURCE

37
Overview
About
MLA
Financial report
Supporting inform
ation
Nearly 15 years in the making, Redlands was bred by researchers at the University of Queensland and developed with MLA funding. It was described as a game changer by MLA Managing Director Jason Strong, who performed the official launch in May at ‘Pinnarendi Station’, Mount Surprise, Queensland, the site of a large-scale grazing trial comparing Redlands to the Wondergraze variety.
Cattle grazing Redlands to date have demonstrated an average gain of 0.69kg/day – no different to those grazing Wondergraze, but double what would be expected from animals grazing native pasture only, in the same environment. In the trial, Redlands proved both palatable and psyllid-free, lifting potential for better rangeland management by reducing stocking rate pressure on native pastures and reducing methane emission intensities.
Of the $7 million invested in leucaena research and development across 26 projects to date, using both MLA Donor Company funds and levies, almost 12% has been dedicated to the development and assessment of psyllid-resistant leucaena.
Redlands seed is now available from two exclusive growers and suppliers – Peter Larsen of Leucseeds, Banana, Queensland and Bruce Mayne, Calliope, Queensland.
Dirt turned on dung beetle project
MLA is working with 10 partner organisations to rear existing and introduce new strains of dung beetles across southern Australia.
The five-year project, funded by MLA Donor Company, is in its second year and aims to fill seasonal and geographic gaps in the distribution of beetles. At completion, the ecosystem benefits for primary producers will be quantified and shared with landholders.
Project outcomes in 2018–19 include:
• Monitoring has begun to better understand current beetle populations, identify specific regional needs and incorporate these into beetle distribution/establishment activities.
• CSIRO entomologists in France assessed North African and European dung beetles for their suitability for exporting to Australia.
• The first of the new beetle egg importations (of the Moroccan strain of Onthophagus vacca) have successfully been reared out of quarantine.
• Importation applications have been submitted for Euonthophagus crocatus and Gymnopleurus sturmi strains.
• A facility has been built at Wagga Wagga, NSW, where beetles will be
In 2016, the red meat industry’s National Livestock Genetics Consortium (NLGC) set a target of doubling the rate of genetic gain in the commercial livestock
sector by 2022. Through its Genetics strategy, MLA is working towards achieving this objective via R&D investment, as well as the Genetics Adoption Plan and the management of Sheep Genetics. The NLGC Taskforce has established more than 50 projects to improve selection accuracy for red meat producers by responding to R&D priorities. These priorities include boosting adoption of genetic tools, linking genetics to consumer outcomes and innovation in genetics R&D.
Genetics Adoption PlanA key outcome from the MLA’s Genetics Adoption Plan in 2018–19 was the launch of MLA’s livestock genetics marketing campaign and genetics hub – genetics.mla.com.au – which gives producers a clear look at how better breeding values can help accelerate their herd or flock’s productivity. The ongoing campaign includes advertisements, producer case studies, how-to videos and written collateral for rural press and MLA’s Feedback magazine. Eight workshops were delivered for key industry stakeholders who provide advice to producers on genetics (such as technical specialists, consultants, government departments and livestock agencies). These workshops generated keen interest to continue high levels of engagement and genetics education.
Sheep GeneticsSheep Genetics aims to improve the quality, scope and utilisation of flock and breed genetic information for the Australian sheep industry. In March 2019, Sheep Genetics ran a major event – Leading Breeder – which was attended by more than 180 stud owners/managers. The event promoted the extension and adoption of Australian Sheep Breeding Values (ASBVs) and genomic technologies, and coincided with the 30th anniversary celebrations for genetic evaluation in the Australian sheep industry. Participants evaluated the event as 8/10 for content and value to their breeding business.
Genetics program
Andrew Carruthers is one of the producer advocates introduced in MLA’s Livestock Genetics campaign. Read or watch his story at genetics.mla.com.au/prime-lambs
reared before heading out to ‘farmer nurseries’ to help engage farmers with the project and protect the beetles to ensure successful distribution.
Direct hit on parkinsonia
A safer, cheaper and more environmentally-friendly new tool to fight the noxious woody weed parkinsonia was launched in May 2019 with support from MLA.
Di-Bak Parkinsonia – a biological herbicide
containing naturally-occurring fungal pathogens – has allowed industry to take a major step forward in boosting feedbase management for graziers. The product introduces pathogens that induce dieback disease, which stresses and can kill the weed. After years of collaborative research and trials by the University of Queensland, BioHerbicides Australia, cattle producers, government departments and natural resource management groups, it’s now commercially available through BioHerbicides Australia.
Report to stakeholders

38
The research is co-funded through MLA Donor Company with matching contributions from commercial operators and the Australian Government.
Innovative ideas
Ink jet printing technologies could be used in beef processing plants to guide more precise cutting.
It’s just one of the concepts put forward by automation companies to the Beef Boning Automation Industry Advisory Group, convened by MLA to bring processors and global technology providers together to develop innovative solutions.
Two automation companies – Frontmatec and Scott Technology – have now been contracted to develop beef boning concepts for industry to review.
Frontmatec has undertaken preliminary designs for automated beef chine bone removal and to evaluate the potential of applying food-grade ink to beef carcases (directed by X-ray or CT sensing) to mark cut lines as a guide for automated or manual cutting to maximise carcase value.
Scott Technology has committed an investment to drive beef automation developments and has developed detailed concept designs for chine bone removal, a key step in fabricating saleable meat primals.
With Australian red meat facing intense price competition from other proteins and exporting nations, every cent counts during processing.
To help processors increase their efficiency and minimise production costs, this priority is focused on maximising value, addressing labour availability and workplace health and safety issues. Automation technologies and objective measurement will be the primary avenues to achieve this.
OVERVIEW
New X-ray technologies: what’s on the horizon?
MLA is investing in new X-ray technology to advance the objective measurement of eating quality.
Contracts have been signed this year for a range of projects, including:
• development of innovative 3D X-ray CT technology, adapted from airline baggage scanning, which features leading edge multi-energy X-ray (MEXA). This technology will measure intramuscular fat on pre-chilled carcases to predict lean meat yield and eating quality, and will also enable automated chine bone removal.
• evaluation of the potential of highly innovative cone beam X-ray technology, adapted from equine medicine, to measure beef eating quality attributes on feedlot livestock as well as carcase, and generate beef automation cut lines to integrate with cutting technology.
• development of sensing systems for beef carcases, which are thicker than lamb carcases and therefore require more powerful imaging equipment and specific computer algorithms.
Processing productivity
This graphically‑modified image shows how scanning technology could be used in future to objectively measure live animals.
PILLAR
4
Total*
$20.4mTotal*
$17.7m
Total*
$63.8mTotal*
$28.7m
Producer levies $5.1m
Government funding $8.4m
LiveCorp contributions $1.1m
Other sources $5.8m
Producer levies $1.9m
Government funding $5.3m
Processor contributions $0.8m
Other sources $9.8m
* Total includes $10.8m invested via MLA Donor Company
* Total includes $2.7m invested via MLA Donor Company
* Total includes $8.8m invested via MLA Donor Company * Total includes $18.3m invested
via MLA Donor Company
* Total includes $16.2m invested via MLA Donor Company
* Total includes $25.8m invested via MLA Donor Company
* Total includes $2.2m invested via MLA Donor Company
* Total includes $9.0m investedvia MLA Donor Company * Total includes $0.2m invested
via MLA Donor Company
Producer levies $58.1m
Government funding $2.3m
Processor contributions $0.9m
Other sources $2.4m
Producer levies $6.0m
Government funding $12.8m
Processor contributions $1.3m
Other sources $8.6m
Government funding $5.6m
Processor contributions $2.0m
Processor contributions $2.0m
Other sources $3.6m
Producer levies $0.5m
Government funding $0.4m
LiveCorp contributions $0.3m
Total
$1.9m
Total*
$12.7m
Total*
$27.0m
Producer levies $1.1m
Role of red meat E�ciency in tradeStewardship of environWelfare of animals
Government funding $0.7m
Processor contributions $0.1m
Producer levies $2.4m
Government funding $2.2m
Processor contributions $1.5m
LiveCorp contributions $0.1m
Other sources $6.6m
Producer levies $3.9m
Government funding $12.4m
Processor contributions $3.1m
Other sources $7.6m
Producer levies $1.7m
Government funding $0.4m
Total*
$8.0m
Total*
$53.0m
Total
$2.1m
Producer levies $3.4m
Government funding $1.2m
Processor contributions $2.9m
LiveCorp contributions $0.2m
Other sources $0.3m
* Total includes $0.2m invested via MLA Donor Company
Producer levies $12.8m
Government funding $25.6m
Other sources $14.6m
Quality and systems integrity Production e�cienciesOptimising product qualityMarketing and promos
Total
$12.4m
Producer levies $9.5m
Government funding $2.1m
Other sources $0.6m
* Total includes $0.1m invested via MLA Donor Company
Engagement
Building leadership Protecting industryLive exportProcessing productivity
Total
$1.3mTotal*
$11.2m
2018–19 INVESTMENT BY FUNDING SOURCE

39
Overview
About
MLA
Financial report
Supporting inform
ation
DEXA roll-out continues
The roll-out of DEXA (dual-energy X-ray absorptiometry) technology continues, with processing plants coming on board to adopt the innovations.
DEXA technology provides timely, accurate and objective information on the lean meat, bone and fat composition of carcases, paving the way for scientific measurement of saleable meat yield and a shift to a value-based marketing system.
MLA supported the introduction of new DEXA systems at five lamb processing facilities (Bordertown, Brooklyn, Gundagai, Frewstal, Wammco) and one beef abattoir (Teys Lakes Creek) in 2018–19.
Additional DEXA modules for lamb loin and tenderloin have also been developed and installed in a major lamb processing plant for evaluation.
MLA facilitated trials of two spectral imaging devices from Frontmatec and E+V for objective assessment of traits contributing to eating quality. Both are progressing towards AUS-MEAT accreditation.
MLA continues to support the adoption of tools, such as the lamb cuts calculator and the boning room optimisation tool, to enable industry to implement value-based pricing models.
The lamb cuts calculator has now been implemented by five supply chains, while a beef cuts calculator has been developed and calibrated with manual bone-out data, but soon to be calibrated for DEXA lean meat yield input. A boning room optimisation tool for lamb has been developed and is being trialled by industry.
A revolutionary, global and scalable design for beef boning automation is set to become a reality through a $32.4 million investment over five years.
Announced in June 2019, funding from MLA Donor Company will enable MLA, in collaboration with beef processor Teys-Cargill Australia and solution providers including Scott Technology, to establish the world’s first beef boning automation research and development (R&D) room.
Building on current lamb boning automation technology known as ‘LEAP™’, the beef boning automation R&D room will be enabled by 3D X-ray computed tomography and DEXA (dual-energy X-ray absorptiometry) objective carcase measurement technology, and referred to as ‘Leap4Beef’.
Beyond movements in livestock prices, the single biggest impact on processing efficiency is the accurate segmentation and deboning of carcases into the highest primal value possible. This is where the most significant improvements in processing industry efficiency can be made, with beef boning automation estimated to deliver at least a $30/head benefit, with an estimated 40% of this benefit to return to producers.
The developments will also provide a platform for other value-adding outcomes, such as increasing producer feedback on primal performance through DEXA X-ray and CT installations.
The program won’t use any producer or processor levies, with Teys-Cargill Australia co-funding the beef boning automation R&D room at its facility in Rockhampton, Queensland, with matching R&D contributions to come from the Federal Government.
MLA undertook industry consultation with more than 20 processors on beef boning automation and will continue to work with other Australian processors through holding regular technical updates.
Leap4Beef builds on other work underway by MLA in the automation space to lead the industry towards adopting more efficient and globally competitive processing technologies.
LEAP forward for beef
Report to stakeholders
$12/head predicted to return
to producers’ pockets
from beef boning automation

40
Minimum viable product trials
MLA ran several programs to demonstrate how a collaborative approach could benefit both Australia and Vietnam. The main one was the assisted and controlled delivery of value-added red meat products in three Vietnamese supply chains, including consumer trials of these products.
These MLA-led trials showed importers and abattoir owners they had the capability to produce higher quality products that were competitive with imported beef products.
Before the trials, abattoirs only had aspirations to improve product hygiene without increasing any eating quality attributes. The trial provided new evidence (based on consumer taste tests and surveys) that a premium price could be attracted for value-added products, such as chilled and aged beef.
While the trials have not yet resulted in abattoir owners and importers making permanent changes to their operations, they demonstrated the value of improving beef quality and paved the way for MLA’s continued business development activities in Vietnam.
Business development
In January 2019, MLA supported the appointment of three supply chain business development managers to work within Vietnamese commercial supply chains for 12 months.
These consultants have worked in different sectors of the Australian beef industry including processing, butchery and retail, to facilitate knowledge transfer into the Vietnamese supply chain.
The managers are assisting companies to deal with commercial obstacles to market development throughout the supply chain, such as by addressing technical issues with staff capability and infrastructure needed to produce a consistent product.
The managers are also assisting supply chains to transition a percentage of the live export trade out of the reliance on unregulated traditional models, by testing
One of the significant challenges for the Australian livestock export industry is to remain internationally competitive while working within existing regulatory frameworks.
This priority addresses this by identifying cost savings, particularly in regulatory compliance and transport. This area also aims to improve animal health and welfare and productivity through the supply chain.
OVERVIEW
Developing sustainable supply chains in Vietnam
By understanding the nature of local supply chains, responding to consumer trends and evolving to meet new market opportunities, MLA works with foreign governments and companies throughout the supply chain to maintain the Australian industry’s longevity in key live export markets.
Vietnam is one market where MLA has implemented activities to achieve clear outcomes for the Australian live export supply chain.
Vietnam has evolved from a fragmented market to become Australia’s second largest live cattle market in just five years. However, the traditional Vietnamese supply chain still doesn’t fully capitalise on the potential to value-add beef during processing, which limits abattoir and supply chain profitability.
Vietnamese consumers are also evolving and if the Australian livestock export industry isn’t positioned to capture their demand for quality (rated more highly than food safety), there is the threat that Australian beef could be replaced by cheaper or less regulated products from competing nations.
MLA’s strategy in Vietnam is unique, as it aims to ‘disrupt’ these traditional supply chain models by addressing consumers’ economic, technical and social barriers to change.
In 2018–19, MLA continued to focus on an interlinked program of activities in Vietnam – predominantly in feedlots and abattoirs – which:
• capitalise on the emergence of young, connected Vietnamese consumers who are willing to pay more for a higher quality Australian product
• maintain Australia’s competitiveness in the face of increasing global competitors by supporting partners to transition to modern slaughter practices, regulation and distribution.
Live export productivity
PILLAR
4
Vietnam has become Australia’s
second largest live cattle market
in just five years
Total*
$20.4mTotal*
$17.7m
Total*
$63.8mTotal*
$28.7m
Producer levies $5.1m
Government funding $8.4m
LiveCorp contributions $1.1m
Other sources $5.8m
Producer levies $1.9m
Government funding $5.3m
Processor contributions $0.8m
Other sources $9.8m
* Total includes $10.8m invested via MLA Donor Company
* Total includes $2.7m invested via MLA Donor Company
* Total includes $8.8m invested via MLA Donor Company * Total includes $18.3m invested
via MLA Donor Company
* Total includes $16.2m invested via MLA Donor Company
* Total includes $25.8m invested via MLA Donor Company
* Total includes $2.2m invested via MLA Donor Company
* Total includes $9.0m investedvia MLA Donor Company * Total includes $0.2m invested
via MLA Donor Company
Producer levies $58.1m
Government funding $2.3m
Processor contributions $0.9m
Other sources $2.4m
Producer levies $6.0m
Government funding $12.8m
Processor contributions $1.3m
Other sources $8.6m
Government funding $5.6m
Processor contributions $2.0m
Processor contributions $2.0m
Other sources $3.6m
Producer levies $0.5m
Government funding $0.4m
LiveCorp contributions $0.3m
Total
$1.9m
Total*
$12.7m
Total*
$27.0m
Producer levies $1.1m
Role of red meat E�ciency in tradeStewardship of environWelfare of animals
Government funding $0.7m
Processor contributions $0.1m
Producer levies $2.4m
Government funding $2.2m
Processor contributions $1.5m
LiveCorp contributions $0.1m
Other sources $6.6m
Producer levies $3.9m
Government funding $12.4m
Processor contributions $3.1m
Other sources $7.6m
Producer levies $1.7m
Government funding $0.4m
Total*
$8.0m
Total*
$53.0m
Total
$2.1m
Producer levies $3.4m
Government funding $1.2m
Processor contributions $2.9m
LiveCorp contributions $0.2m
Other sources $0.3m
* Total includes $0.2m invested via MLA Donor Company
Producer levies $12.8m
Government funding $25.6m
Other sources $14.6m
Quality and systems integrity Production e�cienciesOptimising product qualityMarketing and promos
Total
$12.4m
Producer levies $9.5m
Government funding $2.1m
Other sources $0.6m
* Total includes $0.1m invested via MLA Donor Company
Engagement
Building leadership Protecting industryLive exportProcessing productivity
Total
$1.3mTotal*
$11.2m
2018–19 INVESTMENT BY FUNDING SOURCE

Overview
Report to stakeholders
About
MLA
Financial report
Supporting inform
ation
41
products with customers and consumers to capture the greatest value from the carcase.
While the initial phase of this program focused on understanding consumers and producing specific products, the supply chain business development managers program is now having impact on productivity in feedlots, such as through improved nutrition which has improved beef quality.
Quality control
Another part of MLA’s integrated work in Vietnam is to support the development of quality assurance and control systems, especially for beef hygiene which impacts the consistency of product quality.
MLA previously led a program to teach core slaughter skills to Vietnamese workers. Managing Abattoirs, Training and Exchange of Skills (MATES) was run under the Australian Department of Foreign Affairs and Trade’s Aus4Skills program in 2018 and was supported by MLA and LiveCorp’s joint Livestock Export Program (LEP). The program was modified to develop hygiene systems in select supply chains in Vietnam, with ‘MATES Plus’ launched in January to support Vietnamese supply chains to develop and implement hygiene quality assurance and quality control systems for chilled beef.
MLA market insights reveal that Vietnamese consumers are becoming more conscious of the food they consume (in light of recent food incidents such as pork or buffalo meat being passed off as beef), which is driving demand for good quality beef products with proven safety credentials. This program responds to the challenge of reassuring Vietnamese consumers about the integrity and safety of Australian beef processed in Vietnam.
MATES Plus is not directly funded by MLA, however MLA provided technical advice to design MATES Plus and is leveraging off the program as part of its wider Livestock Export Program strategy in Vietnam. MATES Plus has been rolled out in three Vietnamese abattoirs this year.
MLA supports Vietnam to implement
best practice quality assurance and control
systems.

42
Leadership and collaborative culture
>45 producer advocates engaged in MLA
workshops (page 44)
35% of applicants for Nuffield
Scholarshipsfrom the red meat industry (page 44)
Securing the potential of the Australian red meat and livestock industry and delivering on the ambitions of the Meat Industry Strategic Plan 2020 requires strong industry leadership, a capable
workforce and the ability to attract the best and brightest minds to the industry.
For MLA, the delivery of its own Strategic Plan will rely on the strength of our team and the expertise of our people. Our progress will be continually monitored, objectively measured, and transparently communicated to all stakeholders.
10 interns graduated
from MLA’s Livestock Consulting Internship program
(page 44)
469 red meat producers engaged
by Livestock Consulting Interns over two years
(page 44)
HIG
HLIG
HT
S
See Appendix A for a full list of KPIs. Please note some KPIs may be relevant across several pillars.
52KPIs
40 achieved 2 partly achieved 7 not achieved or not on track 1 not available 2 on track to be achieved by 2020
KEY PERFORMANCE INDICATORS
MEAT INDUSTRY STRATEGIC PLAN (MISP)
2020 PRIORITIES
• Building leadership capability
• Protecting and promoting our industry
AUSTRALIAN GOVERNMENT PRIORITIES
Science and Research Rural Research, Development and Extension
• Food
• Environmental change
• Adoption of research and development
• Biosecurity
ALIGNMENT TO INDUSTRY AND GOVERNMENT PRIORITIES
PILLAR
5
Total*
$40.0mTotal*
$71.8m
Total*
$41.5mTotal*
$29.1m
Total*
$65.5mTotal*
$12.4m
Producer levies $8.0m
Government funding $14.4m
Processor contributions $0.9m
LiveCorp contributions $1.1m
Other sources $15.6m
Producer levies $61.4m
Government funding $3.6m
Processor contributions $3.9m
LiveCorp contributions $0.2m
Other sources $2.7m
* Total includes $19.8m invested via MLA Donor Company
* Total includes $2.9m invested via MLA Donor Company
Producer levies $8.5m
Government funding $15.0m
Processor contributions $2.8m
LiveCorp contributions $0.1m
Other sources $15.1m
Producer levies $5.6m
Government funding $12.8m
Processor contributions $3.1m
Other sources $7.6m
* Total includes $18.4m invested via MLA Donor Company
* Total includes $18.3m invested via MLA Donor Company
Producer levies $13.3m
Government funding $31.6m
Processor contributions $2.0m Processor contributions $0.2m
LiveCorp contributions $0.3m
Other sources $18.2m
Producer levies $9.5m
Government funding $2.1m
Other sources $0.6m
* Total includes $34.7m invested via MLA Donor Company
* Total includes $0.1m invested via MLA Donor Company
2018–19 INVESTMENT BY FUNDING SOURCE
Total
$40.0mTotal
$71.8m
Total
$41.5mTotal
$29.1m
Total
$65.5m
Continuous improvement of the welfare of animals in our care $20.4m
Stewardship of environmental resources $17.7m
Role of red meat in a healthy diet $1.9m
E�ciency and value in trade and market access $8.0m
Marketing and promoting Australian red meat and livestock $63.8m
Optimising product quality and cost e�ciency $28.7m
Guaranteeing product quality and systems integrity $12.7m
Building leadership capability $27.0m
Protecting and promoting our industry $2.1m
Production e�ciencies in farms and feedlots $53.0m
Processing productivity $11.2m
Live export productivity $1.3m
Total
$12.4m
Engagement with producers and stakeholders' priority $12.4m
2018–19 INVESTMENT BY PRIORITY
$28.
3m
$38.
0m
$33.
2m
$22.
4m
2014
–15
2015
–16
2016
–17
2017
–18
2018
–19
$40.
0m
$62.
9m
$67.
0m
$50.
4m
$67.
2m
2014
–15
2015
–16
2016
–17
2017
–18
2018
–19
$71.
8m
$16.
5m
$26.
4m
$12.
9m
$7.8
m
2014
–15
2015
–16
2016
–17
2017
–18
2018
–19
$29.
1m
$16.
5m
$26.
4m
$12.
9m
$7.8
m
2014
–15
2015
–16
2016
–17
2017
–18
2018
–19
$29.
1m
$62.
9m
$67.
0m
$50.
4m
$67.
2m
2014
–15
2015
–16
2016
–17
2017
–18
2018
–19
$71.
8m
$29.
1m
$35.
8m
$20.
0m $2
6.8m
2014
–15
2015
–16
2016
–17
2017
–18
2018
–19
$41.
5m
$6.0
m
$8.3
m$9.6
m
$4.5
m
2014
–15
2015
–16
2016
–17
2017
–18
2018
–19
$12.
4m
$6.0
m
$8.3
m$9.6
m
$4.5
m
2014
–15
2015
–16
2016
–17
2017
–18
2018
–19
$12.
4m
$29.
1m
$35.
8m
$20.
0m $2
6.8m
2014
–15
2015
–16
2016
–17
2017
–18
2018
–19
$41.
5m
$37.
6m
$73.
5m
$40.
2m
$31.1
m
2014
–15
2015
–16
2016
–17
2017
–18
2018
–19
$65.
5m
$37.
6m
$73.
5m
$40.
2m
$31.1
m
2014
–15
2015
–16
2016
–17
2017
–18
2018
–19
$65.
5m
$28.
3m
$38.
0m
$33.
2m
$22.
4m
2014
–15
2015
–16
2016
–17
2017
–18
2018
–19
$40.
0m
INVESTMENT OVER TIME

Overview
About
MLA
Financial report
Supporting inform
ation
Suite of drought and flood resources compiled
to assist producers facing extreme climatic events
(page 47)
MLA successfully challenged
ABC’s Catalyst program regarding its representation
of the Australian beef industry (page 46)
Five students from five different
institutions comprised 2019
Australian ICMJ team (page 45)
Intercollegiate Meat Judging Competition (ICMJ) celebrated 30
years, with 150 Australian students participating in the 2019 event (page 45)
43
Report to stakeholders

44
Outside her work as a livestock manager, Clare is also a part-time secondary agriculture teacher and has recognised the need for industry to have a stronger interface with schools to demonstrate a clear career path in the agricultural sector.
Clare will utilise her Nuffield Scholarship to investigate how the sector can attract and retain the appropriate talent through better alignment with schools and ag-education programs.
Nuffield Scholarship study topics are chosen with the aim of investigating new and innovative aspects of red meat production, and scholars endure a vigorous selection process for their appropriateness for development and leadership potential.
35% of the applications for Nuffield Scholarships in 2019 were from the red meat industry.
Clare Peltzer, MLA’s 2019 Nuffield Scholar
Future livestock consultants
The second class of interns to complete MLA’s Livestock Consulting Internship program officially graduated from the program in June 2019, with 10 interns completing two-year internships with participating livestock consulting businesses throughout Australia.
The Livestock Consulting Internship program is a partnership between
The red meat and livestock industry depends on leaders who are capable, skilled and experienced to deliver on its strategic plans.
In this priority, MLA works with the peak industry councils and other value chain participants to build the industry’s capability and invest in current and emerging industry leaders through a range of professional development, graduate training, mentoring and scholarship opportunities.
Building capability extends to communicating with all industry stakeholders about the value of collaborative investment in marketing, research and development and ways for producers and other value chain participants to develop more productive and profitable businesses.
OVERVIEW
Producer advocate program
According to MLA’s consumer insights, red meat producers are considered a trusted, genuine voice in discussions around livestock production. To upskill producers to speak to their communities and ‘curious consumers’ around red meat production and its sustainability, MLA developed the producer advocate program.
The program includes a range of activities and initiatives to equip producers with the skills, knowledge and confidence to be effective communicators and leaders.
Advocate workshops are designed to enable producers to promote and defend the industry’s credentials through:
• training and development, giving producers the information and tools they need to engage with consumers at community events, schools or through the media
• a communication network for information sharing and peer support.
More than 45 producer advocates were engaged in workshops run by MLA during 2018–19, and more than 30 stakeholders also attended the information sessions.
One of the workshops was held as part of MLA’s Red Meat 2018 (page 51) event in Canberra in November.
Investing in rural leaders
MLA continues to invest in building leadership capacity in the red meat industry, supporting programs such as the Nuffield Australia Farming Scholarships.
Nuffield Australia Farming Scholarships support participants to study farming practices around the world to develop their practical knowledge and management skills. Scholars study a topic of interest and share learnings with peers to build industry capability.
MLA’s 2019 Scholar is Clare Peltzer from Evandale, Tasmania.
Building leadership capability
PILLAR
5
>45 producer advocates
engaged in MLA workshops
Total*
$20.4mTotal*
$17.7m
Total*
$63.8mTotal*
$28.7m
Producer levies $5.1m
Government funding $8.4m
LiveCorp contributions $1.1m
Other sources $5.8m
Producer levies $1.9m
Government funding $5.3m
Processor contributions $0.8m
Other sources $9.8m
* Total includes $10.8m invested via MLA Donor Company
* Total includes $2.7m invested via MLA Donor Company
* Total includes $8.8m invested via MLA Donor Company * Total includes $18.3m invested
via MLA Donor Company
* Total includes $16.2m invested via MLA Donor Company
* Total includes $25.8m invested via MLA Donor Company
* Total includes $2.2m invested via MLA Donor Company
* Total includes $9.0m investedvia MLA Donor Company * Total includes $0.2m invested
via MLA Donor Company
Producer levies $58.1m
Government funding $2.3m
Processor contributions $0.9m
Other sources $2.4m
Producer levies $6.0m
Government funding $12.8m
Processor contributions $1.3m
Other sources $8.6m
Government funding $5.6m
Processor contributions $2.0m
Processor contributions $2.0m
Other sources $3.6m
Producer levies $0.5m
Government funding $0.4m
LiveCorp contributions $0.3m
Total
$1.9m
Total*
$12.7m
Total*
$27.0m
Producer levies $1.1m
Role of red meat E�ciency in tradeStewardship of environWelfare of animals
Government funding $0.7m
Processor contributions $0.1m
Producer levies $2.4m
Government funding $2.2m
Processor contributions $1.5m
LiveCorp contributions $0.1m
Other sources $6.6m
Producer levies $3.9m
Government funding $12.4m
Processor contributions $3.1m
Other sources $7.6m
Producer levies $1.7m
Government funding $0.4m
Total*
$8.0m
Total*
$53.0m
Total
$2.1m
Producer levies $3.4m
Government funding $1.2m
Processor contributions $2.9m
LiveCorp contributions $0.2m
Other sources $0.3m
* Total includes $0.2m invested via MLA Donor Company
Producer levies $12.8m
Government funding $25.6m
Other sources $14.6m
Quality and systems integrity Production e�cienciesOptimising product qualityMarketing and promos
Total
$12.4m
Producer levies $9.5m
Government funding $2.1m
Other sources $0.6m
* Total includes $0.1m invested via MLA Donor Company
Engagement
Building leadership Protecting industryLive exportProcessing productivity
Total
$1.3mTotal*
$11.2m
2018–19 INVESTMENT BY FUNDING SOURCE

Overview
Report to stakeholders
About
MLA
Financial report
Supporting inform
ation
45
MLA Donor Company and participating consulting firms, and managed by Meridian Agriculture. It’s designed to ensure the continued development of livestock consultants for the private sector, with a focus on supporting producer decision making, delivering industry extension programs and providing skilled one-on-one advice.
The program was established to address the decline in extension services offered by public agencies by supporting private consulting businesses meet the substantial financial costs and time required to upskill graduates and, as a result, boost the number of new entrants to the field.
The 2019 graduates included Georgia Reid, AgPro Management, WA; Jackson Adams, University of Adelaide; Bec Clapperton, RCS, Queensland; Michael Wellington,
The Intercollegiate Meat Judging (ICMJ) Competition celebrated its 30th anniversary in 2019. In a demonstration of its ongoing success, the Australian
ICMJ team once again proved its skills at a global level.
At the National Western ICMJ contest in January 2019 at Greeley, Colorado, the Australian team won the lamb grading competition for the fourth consecutive year and claimed third place Overall High Team.
The competition was part of the annual month-long tour of the US meat industry, sponsored via MLA’s industry capability building program and the Australian Meat Processor Corporation.
The tour marked the first time the five students represented five different institutions, with the team comprising Nikita Ellison, University of Queensland; Lauren Smith, Murdoch University; Jessie Phillips, Charles Sturt University; Jess Davis, Sydney University; and Felicity Brumpton, University of New England (pictured).
The 2019 Australian ICMJ workshop and competition at Charles Sturt University, Wagga Wagga, NSW, in July was the biggest gathering in the event’s history, with 150 students from 12 Australian institutions and four international teams attending.
ICMJ turns 30
Bush AgriBusiness, Queensland; Hilary Beech, Holmes Sackett, NSW; Georgia McCarthy, Macquarie Franklin, Tasmania; Will Clark-Dickson, Moses & Son, NSW; Tara Graetz, Rural Directions, SA; James Macfarlane, Southern Dirt, WA; and Jess Brogden, Southern Farming Systems, Victoria.
As part of the program, interns are required to undertake professional hours and major industry research projects, giving them a real-world understanding of the implementation of research and development.
Overall, 469 red meat producers were engaged by the interns over the past two years.
Industry project topics included addressing barriers to producers benchmarking their businesses, comparing the difference
between long and short-acting worm control in sheep flocks, and the impact of body condition score and genetics in northern beef herds.
MLA has committed to support round three of the program.
Farmers2Founders
Following the success of MLA Donor Company’s Producer Innovation Fast-Track pilot program in involving producers in driving innovation, the program has been expanded beyond the red meat industry and transitioned to a new model in 2018–19.
Producer Innovation Fast-Track was initially developed to identify producer ‘trailblazers’ and provide the support and knowledge required to build their capabilities.
This year, the program model evolved to Farmers2Founders (F2F), administered and delivered externally with support from MLA and four other Australian Rural Research and Development Corporations (RDCs) – AgriFutures Australia, Australian Wool Innovation, Grains Research and Development Corporation, and Wine Australia.
The F2F program continues the work of Producer Innovation Fast-Track in providing all the necessary tools, resources, training, coaching and support to deliver solutions to genuine industry problems.
Across two streams, F2F supports innovators to accelerate the creation and scaling of ag-tech, food and food-tech business ventures, engage with new value chains, and solve industry problems.
State of the Industry report
Drawing on its Australian red meat and livestock industry insights, MLA compiled and published the State of the Industry 2018: the Australian red meat and livestock industry in 2018.
The report was launched in September 2018 by the Red Meat Advisory Council at its Red Meat Nation event, Parliament House, Canberra.
It was the second year the report has been produced, but the first time MLA compiled and published it on behalf of the industry.
State of the Industry is an informative reference document on Australia’s red meat and livestock industry, including consumption, production and export data and analysis.
The 2018 report highlighted the industry’s strong economic credentials and value to Australian consumers.

46
• food and nutrition
• animal welfare in the red meat supply chain
• red meat production and environmental impact.
The review also recommended the importance of developing agreed industry positions for key areas and enhanced coordination of communication and advocacy activities. The work programs of the industry corporate affairs function are presently directed by the Red Meat Advisory Council (RMAC), with an Industry Corporate Affairs Steering Group to be established in the second half of 2019.
MLA already maintains a Crisis Response Plan, and regularly conducts simulation activities to ensure the organisation is prepared to support the industry’s issues responses and crisis management.
MLA challenges ABC’s Catalyst program
MLA pursued a complaint with the fair journalism watchdog, the Australian Communications and Media Authority (ACMA), on behalf of red meat producers, following the airing of a story on ABC’s Catalyst program titled ‘Feeding Australia: Foods of Tomorrow’, in August 2018.
The program was focused on more sustainable ways to produce food, including fish, green leafy vegetables, tomatoes, avocados and protein, with a focus on beef.
MLA made an initial complaint to the ABC that the commentary and reported facts presented by Catalyst were misleading and inaccurate regarding the Australian beef industry’s water use and impact on the environment.
One of the central complaints from MLA about the program was that it was not a fair representation of Australia’s beef production system.
The ABC dismissed the complaint after an internal review, and so MLA pursued the complaint with the ACMA.
Within this priority, MLA is supporting the creation of frameworks and collecting evidence to measure the progress of the red meat and livestock industry’s development. MLA is also
supporting the development and implementation of a framework for efficiently reporting on its sustainability credentials.
The red meat and livestock industry’s ability to respond quickly to a sudden or unexpected threat or risk can minimise the impact of a crisis. This priority addresses this need by reviewing and updating the industry’s detailed Crisis Response Plan to prepare individual sectors to avoid or mitigate the impact of any crisis and to be ready and able to manage industry issues in a coordinated manner.
OVERVIEW
Issues and crisis management
MLA has been working with peak industry councils and other red meat and livestock Rural Research and Development Corporations to establish an industry corporate affairs function.
The move to establish a function focused on whole-of-supply-chain issues responds to a review MLA conducted in late 2018 to better understand sociopolitical risks and the management of these within MLA and the red meat industry more broadly. The review assessed issues management and crisis management plans, capability, capacity, processes and governance.
An opportunity was identified for industry to strengthen its approach to issues management through systematic monitoring of peer-reviewed literature, public policy discourse and developments, Australian parliamentary discourse, and the activities of environment and animal welfare non-governmental organisations and advocacy activists, covering three key areas:
Protecting and promoting our industry
PILLAR
5
1. ActivationNotification of the
incident is received and the Crisis Response Team is activated.
2. AssessmentInitial assessment
of the incident.
3. PlanningDetermine the actions and outcomes, allocate
responsibilities and liaise with peak
industry councils.
4. ResponseImplement the
action plan.
5. RecoveryReview level of
resources and move into recovery mode.
MLA’S CRISIS MANAGEMENT PROCESS
Total*
$20.4mTotal*
$17.7m
Total*
$63.8mTotal*
$28.7m
Producer levies $5.1m
Government funding $8.4m
LiveCorp contributions $1.1m
Other sources $5.8m
Producer levies $1.9m
Government funding $5.3m
Processor contributions $0.8m
Other sources $9.8m
* Total includes $10.8m invested via MLA Donor Company
* Total includes $2.7m invested via MLA Donor Company
* Total includes $8.8m invested via MLA Donor Company * Total includes $18.3m invested
via MLA Donor Company
* Total includes $16.2m invested via MLA Donor Company
* Total includes $25.8m invested via MLA Donor Company
* Total includes $2.2m invested via MLA Donor Company
* Total includes $9.0m investedvia MLA Donor Company * Total includes $0.2m invested
via MLA Donor Company
Producer levies $58.1m
Government funding $2.3m
Processor contributions $0.9m
Other sources $2.4m
Producer levies $6.0m
Government funding $12.8m
Processor contributions $1.3m
Other sources $8.6m
Government funding $5.6m
Processor contributions $2.0m
Processor contributions $2.0m
Other sources $3.6m
Producer levies $0.5m
Government funding $0.4m
LiveCorp contributions $0.3m
Total
$1.9m
Total*
$12.7m
Total*
$27.0m
Producer levies $1.1m
Role of red meat E�ciency in tradeStewardship of environWelfare of animals
Government funding $0.7m
Processor contributions $0.1m
Producer levies $2.4m
Government funding $2.2m
Processor contributions $1.5m
LiveCorp contributions $0.1m
Other sources $6.6m
Producer levies $3.9m
Government funding $12.4m
Processor contributions $3.1m
Other sources $7.6m
Producer levies $1.7m
Government funding $0.4m
Total*
$8.0m
Total*
$53.0m
Total
$2.1m
Producer levies $3.4m
Government funding $1.2m
Processor contributions $2.9m
LiveCorp contributions $0.2m
Other sources $0.3m
* Total includes $0.2m invested via MLA Donor Company
Producer levies $12.8m
Government funding $25.6m
Other sources $14.6m
Quality and systems integrity Production e�cienciesOptimising product qualityMarketing and promos
Total
$12.4m
Producer levies $9.5m
Government funding $2.1m
Other sources $0.6m
* Total includes $0.1m invested via MLA Donor Company
Engagement
Building leadership Protecting industryLive exportProcessing productivity
Total
$1.3mTotal*
$11.2m
2018–19 INVESTMENT BY FUNDING SOURCE

Overview
Report to stakeholders
About
MLA
Financial report
Supporting inform
ation
47
In May 2019, the ACMA investigation found the Catalyst program had breached the impartiality provisions of its own Code of Practice, and “failed to present the production of beef with due impartiality, as it did for other foods”.
The ACMA also found Catalyst “used dramatic visual displays, emotive language and moral arguments in the segments that referred to beef. In aggregate, these caused the program to demonstrate a lack of fair treatment and open-mindedness”.
MLA welcomed the outcome of the ACMA’s investigation and is proactively working with media outlets to provide accurate and up-to-date information about red meat production in Australia.
Following unprecedented flooding in north-west Queensland in February, MLA established a page on its website listing a comprehensive range of resources
for flood-affected red meat producers to access. The page has a wide range of information and advice including links to emergency and financial assistance, farm and livestock management resources, and contacts for personal support.
MLA maintains regular contact with industry organisations including AgForce and provides ongoing assistance to the North Queensland Livestock Industry Recovery Agency, an initiative of the Department of Prime Minister and Cabinet.
MLA is investing in managing climate-related events through a major initiative known as ‘Forewarned is forearmed: managing the impacts of extreme climate events’. This Rural R&D4Profit project provides improved forecasting for climate extremes such as heatwaves, frost, floods and drought, beyond the seven-day weather forecast out to seasonal timescales (6–12 months), providing options and tools for producers to proactively plan and manage for extreme events.
R&D investment continues across a range of projects identifying on-farm technologies for the monitoring of livestock and infrastructure, with applications to not only locate and count stock, but also identify safe areas, predict flood patterns and track missing livestock.
Support for flood-affected producers
Photo courtesy of Rural Aid Australia
Counteracting animal activists
Following the launch of an online interactive map earlier this year by animal rights organisation, Aussie Farms, as well as ongoing occurrences and threats of animal activist intrusions, MLA, in partnership with the red meat industry and the National Farmers’ Federation (NFF), continues to provide information and support to red meat producers.
The Aussie Farms map claims to contain the exact locations of thousands of farms and abattoirs and includes photos, videos and documents. The locations mapped are not limited to red meat and cover all types of agricultural industries, as well as the pet industry.
Trespassing on farms or entry without prior permission presents a substantial biosecurity risk that could be detrimental to the health and wellbeing of livestock. It also presents a safety risk for farming families and their employees.
MLA has shared advice from NFF across all its communications platforms about what producers should do if they encounter a trespasser on their property.
MLA has also used its consumer insights to offer the red meat industry updates on consumer and community trends related to red meat production to help address activism.
MLA research shows 93% of consumers perceive producers to be responsible custodians of the land, and there’s been a strong show of community support for producers affected by vegan extremists’ illegal and invasive actions.
Drought management resources
With drought continuing to impact many livestock production regions of Australia in 2018–19, MLA has collated and regularly updates a range of guides and information to assist red meat producers manage through and plan to recover from drought.
The resources cover all facets of drought management including pastures; feeding, management and transportation of livestock; mental health support services; and financial assistance available from federal and state and territory government departments.
Risk management
MLA’s Risk Management Plan outlines the process of identifying, assessing and managing risks, which is in line with AS/NZS ISO 31000:2018 Risk Management Standard. MLA reviews its Risk Management Plan and updates its risk profile annually.
In 2019, the Risk Management Plan was reviewed by the MLA Board, during which time the Board revised its risk appetite and endorsed a number of changes to the plan. These changes included the incorporation of the Three Lines of Defence Model to further enhance the understanding of risk management across the business by clarifying roles and responsibilities related to governance, risk and control. Other amendments were made to the descriptions of risk subcategories and the interconnectivity of risks were identified to foster a more coordinated and effective use of resources. Mitigation strategies are also monitored regularly by both the Audit and Risk Committee and the Board.

48
Stakeholder engagement
42,000 users
registeredfor myMLA (page 50)
805,000 user-generated
reportscreated in Prices &
Markets tool (page 50)
The successful delivery of MLA’s Strategic Plan 2016–2020 requires an enhanced level of collaboration between MLA and its many stakeholders. This pillar focuses on extending the breadth
and depth of stakeholder engagement and communications across MLA.
Genuine two-way consultation and collaboration provides mutual benefit in the delivery of MLA’s marketing, research and development services to industry. This pillar also includes the delivery of MLA’s corporate reporting responsibilities within a culture of continuous improvement.
Importance of being an
MLA member rated 7.6/10 in annual survey
(page 50)
83 events across
Australiasponsored by MLA
(page 51)
HIG
HLIG
HT
S
See Appendix A for a full list of KPIs. Please note some KPIs may be relevant across several pillars.
31KPIs
20 achieved 2 partly achieved 5 not achieved or not on track 1 not available 3 on track to be achieved by 2020
KEY PERFORMANCE INDICATORS
AUSTRALIAN GOVERNMENT PRIORITIES
Science and Research Rural Research, Development and Extension
• Food • Adoption of research and development
ALIGNMENT TO INDUSTRY AND GOVERNMENT PRIORITIES
PILLAR
6
Total*
$40.0mTotal*
$71.8m
Total*
$41.5mTotal*
$29.1m
Total*
$65.5mTotal*
$12.4m
Producer levies $8.0m
Government funding $14.4m
Processor contributions $0.9m
LiveCorp contributions $1.1m
Other sources $15.6m
Producer levies $61.4m
Government funding $3.6m
Processor contributions $3.9m
LiveCorp contributions $0.2m
Other sources $2.7m
* Total includes $19.8m invested via MLA Donor Company
* Total includes $2.9m invested via MLA Donor Company
Producer levies $8.5m
Government funding $15.0m
Processor contributions $2.8m
LiveCorp contributions $0.1m
Other sources $15.1m
Producer levies $5.6m
Government funding $12.8m
Processor contributions $3.1m
Other sources $7.6m
* Total includes $18.4m invested via MLA Donor Company
* Total includes $18.3m invested via MLA Donor Company
Producer levies $13.3m
Government funding $31.6m
Processor contributions $2.0m Processor contributions $0.2m
LiveCorp contributions $0.3m
Other sources $18.2m
Producer levies $9.5m
Government funding $2.1m
Other sources $0.6m
* Total includes $34.7m invested via MLA Donor Company
* Total includes $0.1m invested via MLA Donor Company
2018–19 INVESTMENT BY FUNDING SOURCE
$28.
3m
$38.
0m
$33.
2m
$22.
4m
2014
–15
2015
–16
2016
–17
2017
–18
2018
–19
$40.
0m
$62.
9m
$67.
0m
$50.
4m
$67.
2m
2014
–15
2015
–16
2016
–17
2017
–18
2018
–19
$71.
8m
$16.
5m
$26.
4m
$12.
9m
$7.8
m
2014
–15
2015
–16
2016
–17
2017
–18
2018
–19
$29.
1m
$16.
5m
$26.
4m
$12.
9m
$7.8
m
2014
–15
2015
–16
2016
–17
2017
–18
2018
–19
$29.
1m
$62.
9m
$67.
0m
$50.
4m
$67.
2m
2014
–15
2015
–16
2016
–17
2017
–18
2018
–19
$71.
8m
$29.
1m
$35.
8m
$20.
0m $2
6.8m
2014
–15
2015
–16
2016
–17
2017
–18
2018
–19
$41.
5m
$6.0
m
$8.3
m$9.6
m
$4.5
m
2014
–15
2015
–16
2016
–17
2017
–18
2018
–19
$12.
4m
$6.0
m
$8.3
m$9.6
m
$4.5
m
2014
–15
2015
–16
2016
–17
2017
–18
2018
–19
$12.
4m
$29.
1m
$35.
8m
$20.
0m $2
6.8m
2014
–15
2015
–16
2016
–17
2017
–18
2018
–19
$41.
5m
$37.
6m
$73.
5m
$40.
2m
$31.1
m
2014
–15
2015
–16
2016
–17
2017
–18
2018
–19
$65.
5m
$37.
6m
$73.
5m
$40.
2m
$31.1
m
2014
–15
2015
–16
2016
–17
2017
–18
2018
–19
$65.
5m
$28.
3m
$38.
0m
$33.
2m
$22.
4m
2014
–15
2015
–16
2016
–17
2017
–18
2018
–19
$40.
0m
INVESTMENT OVER TIME
Total
$40.0mTotal
$71.8m
Total
$41.5mTotal
$29.1m
Total
$65.5m
Continuous improvement of the welfare of animals in our care $20.4m
Stewardship of environmental resources $17.7m
Role of red meat in a healthy diet $1.9m
E�ciency and value in trade and market access $8.0m
Marketing and promoting Australian red meat and livestock $63.8m
Optimising product quality and cost e�ciency $28.7m
Guaranteeing product quality and systems integrity $12.7m
Building leadership capability $27.0m
Protecting and promoting our industry $2.1m
Production e�ciencies in farms and feedlots $53.0m
Processing productivity $11.2m
Live export productivity $1.3m
Total
$12.4m
Engagement with producers and stakeholders' priority $12.4m
2018–19 INVESTMENT BY PRIORITY

Overview
About
MLA
Financial report
Supporting inform
ation
MLA’s 20 years’ service
to industry celebrated
at Red Meat 2018 dinner (page 51)
97% of participants
very/extremely satisfied
with MLA’s ‘Global Markets Forum – Sheepmeat’
at LambEx 2018 (page 51)
>800 stakeholders
registeredfor Red Meat 2018
(page 51)
47 MLA speakers at events nationally
(page 51)
49
Report to stakeholders

50
and beef projections, self-service analytical tools and much more.
The main update to myMLA in 2018–19 was the dashboard’s weather feature, in tandem with a redesign of weather.mla.com.au.
The weather tools account for about a third of MLA’s total web traffic, and these enhancements improve user experience by:
• giving producers the ability to track multiple weather locations on their dashboard
• giving myMLA users access to additional features such as historical weather data
• connecting myMLA with weather.mla.com.au to create an improved user experience to ensure the delivery of synchronised information across both online platforms.
Other website enhancements launched this year on mla.com.au include a redesigned homepage, updated News & Events, and a refreshed About MLA section, delivering greater clarity for levy payers on the organisation’s role and governance.
Member satisfaction
MLA runs an annual member survey to measure member satisfaction with activities including communications, events and programs across MLA’s research, marketing, market information and consumer insights portfolio.
This year’s survey was completed in May 2019 and revealed overall member satisfaction with MLA remained stable:
• overall satisfaction with MLA communications remained at 6.9 out of 10
• satisfaction with printed communications lifted to 7.5 (+0.2) and digital communications 7.2 (-0.1)
• satisfaction with MLA’s marketing activities increased to 7.2 (+0.3)
• satisfaction with MLA’s research and development work lifted to 6.9 (+0.2) and MLA’s market reporting lifted to 7.5 (+0.1)
• importance of being an MLA member was up to 7.6 (+0.2).
MLA engages with a wide range of producers and stakeholders, ensuring all levy payers are given the opportunity to provide feedback on its research, development and marketing activities.
This priority centres on stakeholder engagement and communication initiatives to build awareness of MLA’s programs and demonstrate the value of these investments.
OVERVIEW
myMLA and MLA website
Red meat producers continue to utilise the convenience of MLA’s personalised online dashboard, myMLA, with more than 42,000 users now registered for the service. Around 12,000 new users came onboard in 2018–19.
myMLA is a component of the MLA website offering personalised, relevant content delivered straight to an online dashboard unique to each user, based on predetermined preferences such as location and species type.
It provides a single sign-on portal using one username and password for key red meat industry systems: National Livestock Identification System, Livestock Production Assurance, National Vendor Declarations, Meat Standards Australia and Livestock Data Link.
As the Australian industry embraces data-driven decision making, MLA has positioned myMLA to become the portal to access national, state and regional price and market information. There were more than 184,000 page views in 2018–19.
myMLA helps producers with their livestock selling/buying decisions by driving them straight to the information and analysis that best suits their unique profile.
The interactive market information widgets have proven to be the most popular content on the dashboard, with many users visiting the reports more than three times a week.
The interactive Prices & Markets tool, which launched at the same time as myMLA, allows users to dive deeper into the data and view information specific to their requirements by selecting pre-set terms such as ‘skin prices’ for ‘sheep’.
There were 805,000 custom user-generated reports created this financial year, which users can save to the myMLA dashboard for repeat viewing.
In future, myMLA users will be able to access improved saleyard markets reports, over-the-hook quote summaries, production and slaughter numbers, sheep
Engagement with producers and stakeholders
PILLAR
6
42,000 users registered for
myMLA
Total*
$20.4mTotal*
$17.7m
Total*
$63.8mTotal*
$28.7m
Producer levies $5.1m
Government funding $8.4m
LiveCorp contributions $1.1m
Other sources $5.8m
Producer levies $1.9m
Government funding $5.3m
Processor contributions $0.8m
Other sources $9.8m
* Total includes $10.8m invested via MLA Donor Company
* Total includes $2.7m invested via MLA Donor Company
* Total includes $8.8m invested via MLA Donor Company * Total includes $18.3m invested
via MLA Donor Company
* Total includes $16.2m invested via MLA Donor Company
* Total includes $25.8m invested via MLA Donor Company
* Total includes $2.2m invested via MLA Donor Company
* Total includes $9.0m investedvia MLA Donor Company * Total includes $0.2m invested
via MLA Donor Company
Producer levies $58.1m
Government funding $2.3m
Processor contributions $0.9m
Other sources $2.4m
Producer levies $6.0m
Government funding $12.8m
Processor contributions $1.3m
Other sources $8.6m
Government funding $5.6m
Processor contributions $2.0m
Processor contributions $2.0m
Other sources $3.6m
Producer levies $0.5m
Government funding $0.4m
LiveCorp contributions $0.3m
Total
$1.9m
Total*
$12.7m
Total*
$27.0m
Producer levies $1.1m
Role of red meat E�ciency in tradeStewardship of environWelfare of animals
Government funding $0.7m
Processor contributions $0.1m
Producer levies $2.4m
Government funding $2.2m
Processor contributions $1.5m
LiveCorp contributions $0.1m
Other sources $6.6m
Producer levies $3.9m
Government funding $12.4m
Processor contributions $3.1m
Other sources $7.6m
Producer levies $1.7m
Government funding $0.4m
Total*
$8.0m
Total*
$53.0m
Total
$2.1m
Producer levies $3.4m
Government funding $1.2m
Processor contributions $2.9m
LiveCorp contributions $0.2m
Other sources $0.3m
* Total includes $0.2m invested via MLA Donor Company
Producer levies $12.8m
Government funding $25.6m
Other sources $14.6m
Quality and systems integrity Production e�cienciesOptimising product qualityMarketing and promos
Total
$12.4m
Producer levies $9.5m
Government funding $2.1m
Other sources $0.6m
* Total includes $0.1m invested via MLA Donor Company
Engagement
Building leadership Protecting industryLive exportProcessing productivity
Total
$1.3mTotal*
$11.2m
2018–19 INVESTMENT BY FUNDING SOURCE

Overview
Report to stakeholders
About
MLA
Financial report
Supporting inform
ation
51
Smorgasbord of events
MLA ran a range of events and workshops in 2018–19, designed to deliver the practical outcomes of R&D activities and inform producers about key marketing activities.
Sponsorship and speakers
MLA sponsored 63 events in 2018–19 as part of a biannual call for sponsorships of up to $10,000, and also contributed to 20 major sponsorships.
Events included the Red Meat Updates Tasmania, BEEFEX 2018, Australian Sheep & Wool Show, East Gippsland Beef Conference, Growing SA, Northern Territory Cattlemen’s Association Annual Industry Conference, Young Beef Producers’ Forum, Bendigo All Breeds Goat Expo, and the WAFarmers Annual Conference.
MLA also filled 47 speaker requests across Australia.
Lambition
MLA sponsored the Lambition Gala Dinner in Bendigo in July 2018, which was attended by 240 people.
Hosted by Fairfax Agricultural Media, Lambition is an industry event which celebrates the outstanding meat and fibre produced by Australia’s sheep industry.
The celebration coincided with the Australian Sheep & Wool Show and included a live cooking demonstration by MLA’s Corporate Chef Sam Burke, with guests dining on an impressive four-course, breed-specific menu.
MLA’s Corporate Chef Sam Burke designed the three‑course menu at LambEx 2018’s GrandsLAMB Dinner.
LambEx 2018
MLA was a major partner of LambEx 2018, a biennial event celebrating all that is great about Australia’s sheep and lamb industries.
The event, from 5–7 August 2018 at the Perth Convention and Exhibition Centre, was attended by 1,020 people from all sectors of the lamb value chain.
MLA’s Chief Marketing and Communications Officer, Lisa Sharp, spoke at LambEx and gave an insight into the new generation of meat-eaters and how Australian lamb producers can meet their demands.
Sam Burke, MLA’s Corporate Chef, designed the menu for the LambEx Australian Wool Innovation GrandsLAMB Dinner.
MLA’s flagship event Red Meat 2018 was held in Canberra from 20–23 November, with more than 800 red meat producers and stakeholders
registering – nearly double the numbers at the inaugural forum in 2017.
The action-packed event featured the latest research, innovation and marketing insights, a red meat showcase, digital forum, producer tours and MLA’s Annual General Meeting (AGM). Networking opportunities included a Business Breakfast and a dinner marking MLA’s 20 years’ service to the Australian red meat and livestock industry.
The Red Meat event concept was launched in 2017 to bring a new, engaging format to MLA’s AGM. The 2019 event will be held in Tamworth, NSW, from 18–20 November.
Red Meat 2018
Former MLA Chair David Crombie (pictured with current Chair Dr Michele Allan) was a guest speaker at the Red Meat 2018 Welcome Function, a celebration of MLA’s 20 years’ service to the Australian red meat and livestock industry.
MLA organised the ‘Global Markets Forum – Sheepmeat’ as part of LambEx 2018, which was attended by 90 people. A survey revealed 97% of attendees rating their overall satisfaction with the Global Markets Forum as very satisfied/extremely satisfied.

52
About MLA

Overview
Report to stakeholders
About
MLA
Financial report
Supporting inform
ation
53
MLA invests in research and marketing activities for the benefit of the Australian red meat and livestock industry.
Research, development and adoption
MLA invested $170.3 million in a range of research, development and adoption programs during 2018–19. This included $94.2 million invested through MLA Donor Company (MDC). This investment includes matching funds from the Australian Government and grants.
These programs are linked to the Australian Government’s Science and Research Priorities and Rural Research, Development and Extension Priorities. This alignment is shown in the graphs on the right.
In 2018–19, MLA completed or terminated 376 research contracts, worth $90.4 million. These included 180 MDC contracts, contributing a total value of $47.3 million. MLA commenced 249 new research and development contracts totalling $92.2 million in 2018–19. This included 55 contracts through the MDC that were worth $52.8 million, with milestones across multiple years. This has resulted in 466 current contracts as at 30 June 2019, worth $450.3 million.
Marketing, market access and insights
During 2018–19 MLA invested $104.1 million in marketing, market access and insights to grow demand for Australian red meat and livestock domestically and abroad. The majority of this investment was ineligible to be matched with funds from the Australian Government.
What we do
Alignment with Government's Science and Research Priorities
Alignment with Government's Rural Research, Development and Extension Priorities
Percentages may not add up due to rounding.
Food 78.6%
Environmental change 5.7%
Soil and water 8.7%
Energy 0.4%
Advanced manufacturing 6.6%
Adoption of research and development 46.5%Soil, water and managing natural resources 7.1%Biosecurity 11.3%Advanced technology 35.1%
ALIGNMENT WITH GOVERNMENT SCIENCE AND RESEARCH PRIORITIES
2015 2016 2017 2018 2019
0
100
200
300
400
500
0
$100m
$200m
$300m
$400m
$500m
VALUE OF RESEARCH CONTRACTS AT 30 JUNE
Alignment with Government's Science and Research Priorities
Alignment with Government's Rural Research, Development and Extension Priorities
Percentages may not add up due to rounding.
Food 78.6%
Environmental change 5.7%
Soil and water 8.7%
Energy 0.4%
Advanced manufacturing 6.6%
Adoption of research and development 46.5%Soil, water and managing natural resources 7.1%Biosecurity 11.3%Advanced technology 35.1%
ALIGNMENT WITH GOVERNMENT RURAL RESEARCH, DEVELOPMENT AND EXTENSION PRIORITES

54
Strategic alignment
MLA’s Annual Investment Plan 2018–19 has guided the company’s investment over the past year, outlining the company’s programs, budgets and key performance measures.
The strategic direction of this Plan was informed by the Australian Government’s Science and Research Priorities and Rural Research, Development and Extension Priorities, the Meat Industry Strategic Plan 2020 and the MLA Strategic Plan 2016–2020.
MLA’s Strategic Plan 2016–2020 is aligned closely with the Meat Industry Strategic Plan 2020, giving focus and direction to
MLA’s work to build demand, productivity and trust for the Australian red meat and livestock industry. The figure below provides an overview of MLA’s strategic and operational planning process.
Stakeholders
MLA operates in partnership with the Australian Government and value chain partners to deliver research, development and marketing to benefit red meat and livestock producers, value chain partners and the Australian community.
The Australian Government sets high priority research and development objectives covering community, industry and environmental concerns.
Peak industry councils provide policy direction, review budgets and monitor MLA’s performance on behalf of the red meat industry. These are the Australian Lot Feeders’ Association, the Cattle Council of Australia, the Goat Industry Council of Australia and Sheep Producers Australia.
MLA also works closely with the Red Meat Advisory Council, the Australian Meat Processor Corporation, the Australian Meat Industry Council, LiveCorp and the Australian Livestock Exporters’ Council to develop programs that address key industry issues and opportunities through the supply chain, manage projects and communicate outcomes.
Commence executing Annual Investment Plan and associated
annual implementation plans
Load implementation plan key performance indicators into
individual performance plans of MLA staff
Based on the Annual Investment Plan, develop implementation
plans and key performance indicators for coming year
Finalise Annual Investment Plan and submit to MLA Board then
Australian Government
Seek peak industry council endorsement of Annual Investment
Plan for the coming financial year
Review external environment and assumptions including the Meat Industry Strategic Plan 2020 themes and the imperatives for the sheep, beef and goat industry strategic plans
Finalise MLA Annual Report (includes reporting on the achievement of the previous year’s key performance indicators)
Consult with peak industry councils and other stakeholders about MLA’s proposed marketing, research and development programs for the coming financial year
Refine marketing, research and development programs and proposed budget allocations (based on Board and peak industry council feedback and
recommendations)
Draft Annual Investment Plan for the coming financial year
Jul
Jan
AugJun
Feb
SepMay
OctApr
NovMar
Dec
MLA’S STRATEGIC AND OPERATIONAL PLANNING PROCESS
How we work

Overview
Report to stakeholders
About
MLA
Financial report
Supporting inform
ation
55
Industry consultation arrangements
Livestock producers influence the investment of their levies through a number of industry consultation mechanisms.
The Red Meat Advisory Council (RMAC) is the peak body that represents the collective interests of the Australian red meat industry. RMAC is responsible for the development of the Meat Industry Strategic Plan which provides the overarching strategic framework that enables the direction, measurement and reporting of overall industry progress to government and industry stakeholders. Levy payers are consulted by RMAC during the development of the five-year Meat Industry Strategic Plan.
Examples of areas where consultation occurs include:
On planning and whole-of-red-meat-industry priority areas:
• Meat Industry Strategic Plan
• Beef Industry Strategic Plan
• Sheepmeat Industry Strategic Plan
• Goat Industry Strategic Plan
• MLA Strategic Plan
• MLA Annual Investment Plan
• Beef Industry Sustainability Framework.
Each year, MLA also consults with the peak industry councils regarding research, development and marketing investments.
Examples of where consultation occurs include:
On research and development:
• Research, development and adoption investment priorities
• Red Meat Co-investment Committee
• Regional Consultation model (see page 36) and the Southern Australia Meat Research Council, the Western Australian Livestock Research Council and the North Australia Beef Research Council
• Sheep and beef forecasting committees
• Sheep Genetics Advisory Committee
• MSA Taskforce and R&D Pathways Committee
• Resource Flock Steering Committee
• Genetics Steering Committee
• Integrity Systems Taskforce
Research and Development Corporations by co-investing in projects and consortiums with mutual benefits.
In 2018–19, MLA was successful in having one project approved in the fourth round of the Department of Agriculture Rural R&D for Profit program. MLA is the lead for nine projects and is a partner organisation in a further seven projects. Refer to Appendix C for an overview of all Rural R&D for Profit projects involving MLA.
During 2018–19 MLA also partnered with seven consortiums:
• National Livestock Genetics Consortium
• Managing Climate Variability Program – phase V
• Reef Alliance
• National Sheep Health Monitoring Project
• Australian Livestock Spatial Innovation Program
• Animal Welfare Strategic Partnership
• Livestock Productivity Partnership.
MLA continued its collaboration with the Sheep CRC and the Centre for Invasive Species Solutions in 2018–19. Co-investment in projects through MLA Donor Company also accelerated in 2018–19. Collaborators included both local and global research organisations, value chain partners and commercial participants.
Membership
Membership of MLA is voluntary and free to all levy-paying grassfed cattle, grainfed cattle, sheep, lamb and goat producers. MLA had 49,692 members at 30 June 2019, a decrease of 436 members from the previous year. The table below shows the composition of MLA’s members.
On marketing:
• Region-specific global marketing and market access strategies for beef, sheepmeat and goatmeat (Australia, Japan, Korea, North America, Middle East, Europe/Russia, Indonesia, China and South Asia)
• MSA Taskforce.
The global marketing and market access consultation process underpins the overarching market strategy specific to each region. This process involves peak industry councils and industry representatives consulting with MLA to help set strategic priorities for growing demand and improving market access for the Australian red meat industry across global markets.
The consultation process involves a number of steps for industry to guide MLA’s global market investment strategy. This encompasses reviewing the output/outcomes from the previous year’s activities and investments, evaluating MLA’s performance, setting strategic priorities, advising budget allocations for the upcoming financial year and, importantly, confirming key performance indicators.
MLA strives to ensure all members have the opportunity to participate in the Annual General Meeting by rotating its location around the nation. The 2018 AGM was held in Canberra, ACT and was preceded by Alice Springs, NT (2017), Hahndorf, SA (2016), Brisbane, Queensland (2015), Sydney, NSW (2014), Wodonga, Victoria (2013), Fremantle, WA (2012), Longreach, Queensland (2011), Launceston, Tasmania (2010), and Darwin, NT (2009).
Collaboration
MLA has a long history of collaborating with the Australian Government, research organisations, value chain partners, Cooperative Research Centres and other
COMPOSITION OF MLA’S MEMBERS
Members 2014–15 2015–16 2016–17 2017–18 2018–19
Grassfed cattle 42,295 42,275 42,087 42,266 41,910
Grainfed cattle 5,430 5,430 5,453 5,478 5,456
Sheep/prime lambs 18,523 18,583 18,634 18,963 18,820
Sheep only 9,568 9,483 9,415 9,363 9,135
Goats 2,414 2,415 2,403 2,426 2,402
Total members* 49,845 49,892 49,726 50,128 49,692
* Includes members of mixed enterprises.

56
Transaction levies
MLA is primarily funded by transaction levies paid on livestock sales by producers. Levies received by MLA are accounted for in two streams – one to support marketing activities and the other to support research and development.
Transaction levies are charged by the Australian Government on the sale of each head of cattle, sheep and goat sold under the Primary Industries (Excise) Levies Act 1999.
Transaction levies are collected, administered and disbursed by the Department of Agriculture on a cost-recovery basis and invested back into the industry to assist in research and development, marketing and market access services. Total levies charged in 2018–19 were $5/head of grassfed and grainfed cattle transacted, $1.50/head for lambs*, 20¢/head for sheep+ and 37.7¢/head of goats transacted (see figures below).
MLA is not the only recipient of livestock transaction levies – it is one of three organisations alongside Animal Health Australia and the National Residue Survey.
Government-matched contributions
The Australian Government also contributes a dollar for each levy dollar MLA invests in eligible research and development.
Government-matched voluntary contributions
MLA generates additional income via voluntary contributions which are matched by the Australian Government. This funding is invested in research and development partnerships that benefit the Australian red meat industry through MLA Donor Company.
+ Per head, where defined sale price is greater than or equal to $10. Where defined sale price is less than or equal to $10, levy is 2% of the sale price. Where there is no defined sale price, levy is set at 20 cents per head.
* Per head, where defined sale price is greater than $75. Where defined sale price is less than or equal to $75, levy is 2% of the sale price. Where there is no defined sale price, levy is set at 80 cents per head.
How we’re funded
Unmatched grants
MLA also receives unmatched grants from the Australian Government and cooperative contributions from other Research and Development Corporations, individual processors, wholesalers, foodservice operators and retailers. This includes grants as part of the Rural R&D for Profit program (see Appendix C).
CoMarketing funding
Exporters and importers can also co invest with MLA (via transaction levies) on marketing activities through the CoMarketing Program (see page 26).
Other levies
Processors and livestock exporters also co-invest levies into MLA programs through their service companies: Australian Meat Processor Corporation and LiveCorp. See pages 72–73 for a summary of MLA’s income and expenditure by funding source in 2018–19.
Goat levy allocation
Lamb levy allocation
Grassfed cattle levy allocation
Grainfed cattle levy allocation
Sheep levy allocation
Total levy
$5 per head,
per transaction
Total levy
$5 per head,
per transaction
Total levy
$1.50* per head,
per transaction
Total levy
20 cents+ per head,
per transaction
Total levy
37.7 cents per head,
per transaction
MLA (R&D) 16.7 centsMLA (Marketing) 10.5 centsAnimal Health Australia 4.5 centsNational Residue Survey 6.0 cents
MLA (R&D) 7.7 cents+MLA (Marketing) 8.7 cents+Animal Health Australia 1.8 cents+National Residue Survey 1.8 cents+
MLA (R&D) $0.92MLA (Marketing) $3.66Animal Health Australia $0.13National Residue Survey $0.29
MLA (R&D) 37 cents*MLA (Marketing) 90 cents*Animal Health Australia 15 cents*National Residue Survey 8 cents*
MLA (R&D) $1.50MLA (Marketing) $3.08Animal Health Australia $0.13National Residue Survey $0.29
GRAINFED CATTLE LEVY ALLOCATIONGoat levy allocation
Lamb levy allocation
Grassfed cattle levy allocation
Grainfed cattle levy allocation
Sheep levy allocation
Total levy
$5 per head,
per transaction
Total levy
$5 per head,
per transaction
Total levy
$1.50* per head,
per transaction
Total levy
20 cents+ per head,
per transaction
Total levy
37.7 cents per head,
per transaction
MLA (R&D) 16.7 centsMLA (Marketing) 10.5 centsAnimal Health Australia 4.5 centsNational Residue Survey 6.0 cents
MLA (R&D) 7.7 cents+MLA (Marketing) 8.7 cents+Animal Health Australia 1.8 cents+National Residue Survey 1.8 cents+
MLA (R&D) $0.92MLA (Marketing) $3.66Animal Health Australia $0.13National Residue Survey $0.29
MLA (R&D) 37 cents*MLA (Marketing) 90 cents*Animal Health Australia 15 cents*National Residue Survey 8 cents*
MLA (R&D) $1.50MLA (Marketing) $3.08Animal Health Australia $0.13National Residue Survey $0.29
SHEEP LEVY ALLOCATION
Goat levy allocation
Lamb levy allocation
Grassfed cattle levy allocation
Grainfed cattle levy allocation
Sheep levy allocation
Total levy
$5 per head,
per transaction
Total levy
$5 per head,
per transaction
Total levy
$1.50* per head,
per transaction
Total levy
20 cents+ per head,
per transaction
Total levy
37.7 cents per head,
per transaction
MLA (R&D) 16.7 centsMLA (Marketing) 10.5 centsAnimal Health Australia 4.5 centsNational Residue Survey 6.0 cents
MLA (R&D) 7.7 cents+MLA (Marketing) 8.7 cents+Animal Health Australia 1.8 cents+National Residue Survey 1.8 cents+
MLA (R&D) $0.92MLA (Marketing) $3.66Animal Health Australia $0.13National Residue Survey $0.29
MLA (R&D) 37 cents*MLA (Marketing) 90 cents*Animal Health Australia 15 cents*National Residue Survey 8 cents*
MLA (R&D) $1.50MLA (Marketing) $3.08Animal Health Australia $0.13National Residue Survey $0.29
LAMB LEVY ALLOCATION
Goat levy allocation
Lamb levy allocation
Grassfed cattle levy allocation
Grainfed cattle levy allocation
Sheep levy allocation
Total levy
$5 per head,
per transaction
Total levy
$5 per head,
per transaction
Total levy
$1.50* per head,
per transaction
Total levy
20 cents+ per head,
per transaction
Total levy
37.7 cents per head,
per transaction
MLA (R&D) 16.7 centsMLA (Marketing) 10.5 centsAnimal Health Australia 4.5 centsNational Residue Survey 6.0 cents
MLA (R&D) 7.7 cents+MLA (Marketing) 8.7 cents+Animal Health Australia 1.8 cents+National Residue Survey 1.8 cents+
MLA (R&D) $0.92MLA (Marketing) $3.66Animal Health Australia $0.13National Residue Survey $0.29
MLA (R&D) 37 cents*MLA (Marketing) 90 cents*Animal Health Australia 15 cents*National Residue Survey 8 cents*
MLA (R&D) $1.50MLA (Marketing) $3.08Animal Health Australia $0.13National Residue Survey $0.29
GRASSFED CATTLE LEVY ALLOCATION Goat levy allocation
Lamb levy allocation
Grassfed cattle levy allocation
Grainfed cattle levy allocation
Sheep levy allocation
Total levy
$5 per head,
per transaction
Total levy
$5 per head,
per transaction
Total levy
$1.50* per head,
per transaction
Total levy
20 cents+ per head,
per transaction
Total levy
37.7 cents per head,
per transaction
MLA (R&D) 16.7 centsMLA (Marketing) 10.5 centsAnimal Health Australia 4.5 centsNational Residue Survey 6.0 cents
MLA (R&D) 7.7 cents+MLA (Marketing) 8.7 cents+Animal Health Australia 1.8 cents+National Residue Survey 1.8 cents+
MLA (R&D) $0.92MLA (Marketing) $3.66Animal Health Australia $0.13National Residue Survey $0.29
MLA (R&D) 37 cents*MLA (Marketing) 90 cents*Animal Health Australia 15 cents*National Residue Survey 8 cents*
MLA (R&D) $1.50MLA (Marketing) $3.08Animal Health Australia $0.13National Residue Survey $0.29
GOAT LEVY ALLOCATION

Overview
Report to stakeholders
About
MLA
Financial report
Supporting inform
ation
57
Corporate governance
MLA’s corporate governance framework is set by the Board having regard to the best interests of our members, the values of our organisation, MLA’s obligations set out under our Funding Agreement with the Commonwealth of Australia dated 13 October 2016, and in accordance with the ASX Corporate Governance Council’s Corporate Governance Principles and Recommendations (3rd edition).
This long-established framework operates to ensure we remain accountable to our stakeholders and that stakeholder interests are protected. MLA’s governance arrangements are reviewed regularly to reflect industry developments, stakeholder expectations and regulatory and legislative changes. This statement, and documents and policies relevant to our corporate governance framework, are also available on our website.
The Board
The MLA Board’s nine directors combine a broad range of skills, experience and expertise to work with industry to set strategic priorities for the company and to approve and monitor progress against MLA’s Strategic Plan 2016–2020. It evaluates performance and budgets, oversees risk management and compliance, and ensures the company abides by its obligations under the Red Meat Industry Memorandum of Understanding, the Funding Agreement, and under corporations law. Many directors are also producers and members of the company.
Please see pages 63–65 for the Board member biographies.
Board selection
The Managing Director is the only executive director and is appointed by the Board. Otherwise, directors are nominated through the Selection Committee and appointed by members at MLA AGMs for a three-year term. After such term, a director may reapply for a position on the Board in the same way as other candidates. Further information about the Selection Committee is on page 58.
Dr Michele Allan, the Chair of the Board, was elected in 2011 and is an independent director. She will retire at the 2019 MLA Annual General Meeting at which time Mr Alan Beckett will assume the role of Chair. He was elected in 2014 and is an independent director.
MLA’S GOVERNANCE FRAMEWORK
Australian Meat & Live-stock Industry Act 1997
Red Meat Industry Memorandum of Understanding
Funding Agreement Australian Government and Meat & Livestock Australia
MLA Constitution MLA Board
Corporations Act 2001
Board committees
Two Board committees met during the year:
• Audit and Risk Committee
• Remuneration Committee.
These Committees are comprised solely of non-executive directors, with management attending committee meetings by invitation only.
The Chair of each Committee provides a verbal update of each committee meeting to the Board and minutes of Committee meetings are provided in the Board papers. The role of each Committee is set out in the Committee charters, which are regularly reviewed. The members of each Committee, together with each member’s attendance at meetings, are set out in the ‘Directors’ report’ on page 74.
Audit and Risk Committee
The Audit and Risk Committee assists the Board to fulfil its oversight responsibilities relating to MLA’s risk management framework, the company’s financial reporting, internal control structure and the internal and external audit functions. In keeping with community expectations, the Chair of the committee is not the Chair of the Board.
The Audit and Risk Committee is required to meet at least four times a year and holds closed sessions with the auditors at least once each year. The Audit and Risk Committee is responsible for making recommendations to the Board for the approval of the annual audit plan and annual financial statements.
As at 30 June 2019, the Audit and Risk Committee consisted of Alan Beckett (Chair), Erin Gorter, Russell Lethbridge and Andrew Michael. Details of each members’ attendance at meetings is set out in the ‘Directors’ report’ on page 74.
Internal auditor
The Audit and Risk Committee reviews the adequacy and effectiveness of internal controls, including the company’s policies and procedures, to assess, monitor and manage business risk and legal and ethical compliance programs. This review includes monitoring the implementation of MLA’s Risk Management Plan, Fraud Control Plan and Intellectual Property Management Plan. It also reviews the company’s foreign exchange and treasury management and oversees the company’s risk management program.
To assist its function the Audit and Risk Committee, with management and a dedicated Risk & Assurance Manager, worked with newly appointed internal auditor KPMG. During 2018–19, KPMG conducted reviews of social media governance, risk management maturity, workforce planning, payroll and privacy.
Internal audit activities are designed to assist management with independent and objective assurance on the effectiveness of our governance, risk management and internal control processes.
External auditor
MLA’s external auditor is Ernst & Young (EY). The Audit and Risk Committee holds discussions with the external auditors and management before the annual financial statements are submitted to the Board.
The Committee oversees MLA’s relationship with EY, including:
• making recommendations to the Board about the appointment of MLA’s auditors based on their qualifications, independence, engagement, fees and performance
• reviewing and assessing the performance, independence and objectivity of EY
• reviewing EY’s proposed annual audit scope and audit approach, including materiality levels.
How we’re governed

58
Remuneration Committee
The Remuneration Committee consisted of Erin Gorter (Chair), Michele Allan, Jo Pye and Manny Noakes as at 30 June 2019.
The responsibilities of the Remuneration Committee include the review and oversight of:
• remuneration matters, including: – establishing and monitoring KPIs,
a remuneration framework for, and the performance of, the Managing Director
– remuneration and incentive framework for senior executives and all staff
– recruitment, remuneration and retention strategies
• succession plans for senior executives and key staff
• strategic human resources policies and practices to ensure they are appropriate and consistent with MLA’s objectives and values.
Details of each members’ attendance at meetings is set out in the ‘Directors’ report’ on page 74.
Selection Committee
Each year the Selection Committee is tasked to assess Board candidates against a range of criteria, including experience and skills, personal qualities and their available time commitment, and report to MLA members on the suitability of candidates for election.
Following a rigorous interview and selection process of candidates by the Selection Committee and in accordance with good governance practice, appropriate checks of each candidate are undertaken before each nominee is put forward to members as a candidate for election as a director.
The composition of the Selection Committee, together with each member’s attendance at meetings, is set out in the ‘Directors’ report’ on page 74.
Board meetings
The Board had six scheduled meetings during 2018–19. The agendas for each of the MLA Group of companies are formulated in preparation for each meeting. They incorporate items from an annual work plan to ensure regular review of key aspects of the business of the MLA Group including performance, compliance and governance.
Meeting agendas include regular reviews of MLA’s financial position and management reports, detailed reviews of the company’s strategic imperatives and marketing and R&D programs.
The Board continually strives to ensure its meetings are conducted efficiently to enable sufficient discussion and contribution from all directors. The Board regularly considers and discusses key strategic issues at both a group company and industry level. Management attends and presents information relevant to their portfolios and to respond to information requested in Board meetings.
Independence
The Board considers each director’s independence on an annual basis. Directors are considered to be independent if they are not a member of management and are free of any business or other relationship that materially interferes with – or could reasonably be perceived to materially interfere with – the independent exercise of their judgement.
In assessing a director’s independence, materiality is considered on a case-by-case basis by reference to each director’s circumstances. A policy on the independence of directors, which requires that the Board assess independence annually, or more regularly if a director’s circumstances change, is currently implemented and in force. The Board has determined that all the non-executive directors are independent.
Conflicts of interest
In accordance with the requirements of the Corporations Act, the Funding Agreement and MLA’s conflict of interest policy and procedures, directors must declare any conflict of interest they may have, and must follow the procedures set out in MLA’s policy.
In certain circumstances, directors will abstain from participating in any discussion or voting on matters in which they have a material personal interest. At the time of their appointment and as notified from time to time, each director provides to the Board information about their business and other interests. The Board records such notifications in its minutes and maintains a register in accordance with the ASX Corporate Governance Council’s Corporate Governance Principles and Recommendations (3rd edition) and in compliance with the requirements of MLA’s Funding Agreement.
Reporting framework
On 13 October 2016, MLA and the Commonwealth of Australia (through its Department of Agriculture and Water Resources) agreed to a Funding Agreement for the period 2016–2020. The Funding Agreement sets out the requirements for the company’s expenditure of levy funds and matching funds, and provides a
framework under which the company must report to the Department.
On a six-monthly basis MLA’s Chair, Managing Director and key management personnel meet with government representatives to discuss MLA’s performance of its functions and compliance with the terms of the Funding Agreement.
Financial management
The Audit and Risk Committee has received a written declaration from the Managing Director and Chief Financial Officer that the financial reports represent a true and fair view, in all material respects, of the company’s financial condition and operating results, and are in accordance with relevant accounting standards.
Risk management
MLA’s Risk Management Plan outlines the process of identifying, assessing and managing risks, which is in line with AS/NZS ISO 31000:2018 Risk Management Standard. MLA reviews its Risk Management Plan and updates its risk profile annually.
In 2019, the Risk Management Plan was reviewed by the MLA Board, during which time the Board revised its risk appetite and endorsed a number of changes to the plan. These changes included the incorporation of the Three Lines of Defence Model to further enhance the understanding of risk management across the business by clarifying roles and responsibilities related to governance, risk and control. Other amendments were made to the descriptions of risk subcategories and the interconnectivity of risks were identified to foster a more coordinated and effective use of resources. Mitigation strategies are also monitored regularly by both the Audit and Risk Committee and the Board.
A full summary of the drivers affecting MLA’s operating environment can be found in MLA’s Annual Investment Plan 2019–20 which outlines the risk outlook for the year ahead: mla.com.au/aip.
Code of business conduct and ethics
The Board has endorsed the Code of Business Conduct and Ethics (the code), which embodies the company’s values of customer centricity, accountability through transparency and outcomes that make a difference. The Code otherwise sets out principles which must be met to ensure the company and its business associates meet its commitments to all stakeholders.
A copy of the code is on MLA’s website and is provided to all new employees on commencement. It is a feature of the

Overview
Report to stakeholders
About
MLA
Financial report
Supporting inform
ation
59
formal induction training which is provided to new employees. It is reviewed regularly to maintain its relevance and to reflect changes in the regulatory environment, with the most recent changes reviewed and approved by the Board in July 2019.
MLA’s Code of Business Conduct and Ethics was revised to reflect the adoption by MLA of the requirements under the Modern Slavery Act and to reflect MLA’s Whistleblower Policy. Ongoing work to review MLA’s current supply chain and its potential modern slavery risks using a risk-based assessment is underway. By 31 December 2020, MLA is required to submit an annual modern slavery statement to the Commonwealth outlining:
• the potential modern slavery risks in MLA’s operations and supply chains
• the actions MLA has taken to assess and address those risks
• MLA’s due diligence and remediation processes.
As part of an annual program of training and capability building within MLA, staff received training in privacy and the Data Breach Notification Scheme, Competition and Consumer Act compliance, risk management assessments and intellectual property management. Staff also received performance training sessions on competencies and capabilities. Additionally, an external training platform operates and is available to all staff on-demand for a wide range of courses.
COMPARISON OF MLA’S CORPORATE GOVERNANCE PRINCIPLES TO ASX CORPORATE GOVERNANCE PRINCIPLES AND RECOMMENDATIONS (3RD EDITION)
Principle/recommendation Description/reference of disclosure/compliance
Principle 1. Lay solid foundations for management and oversight
Recommendation 1.1
A listed entity should disclose:
(a) the respective roles and responsibilities of its board and management; and
(b) those matters expressly reserved to the board and those delegated to management.
This is outlined in the Board Charter and a detailed Delegations of Authority policy.
Recommendation 1.2
A listed entity should:
(a) undertake appropriate checks before appointing a person, or putting forward to security holders a candidate for election, as a director; and
(b) provide security holders with all material information in its possession relevant to a decision on whether or not to elect or re-elect a director.
As part of the Selection Committee process in relation to annual director selection, appropriate background checks are undertaken each year.
Candidates are shortlisted by reference to the selection criteria that act as terms of reference for the committee to ensure there is an appropriate mix of skills in the candidates nominated for election.
Candidates’ biographical details, included on the MLA Notice of Meeting, are prepared from the material submitted through the Selection Committee process.
Recommendation 1.3
A listed entity should have a written agreement with each director and senior executive setting out the terms of their appointment.
MLA has written engagement letters for directors and executive employment contracts with all members of the Leadership Team.
Recommendation 1.4
The company secretary of a listed entity should be accountable directly to the board, through the chair, on all matters to do with the proper functioning of the board.
The Company Secretary is accountable to the Board through the Chair on all matters related to the proper functioning of the MLA Board.
Diversity
In March 2018, the Board revised its company-wide diversity policy to reflect the changing landscape in which MLA operates, including recent examples of poor treatment of females in the industry and the increased expectations of stakeholders with respect to diversity and gender equality.
MLA recognises the importance of a workforce that represents a range of experience and backgrounds as well as age, ethnicity, sexual orientation, religious beliefs and physical abilities. The diversity policy recognises that a diverse workforce enables MLA to provide a better service and improve long-term performance, as well as creating a source of competitive advantage and benefit to industry and its people.
As at 30 June 2019, 56% of MLA’s staff were women. On the Leadership Team, three of the eight (38%) executives are female. On the MLA Board, four of the eight non-executive directors are female (50%), with one being the Chair of the Board.
The composition of MLA Group’s workforce has also been recognised by the Workplace Gender Equality Agency as being compliant with the Workplace Gender Equality Act 2012.
Remuneration and performance arrangements
The total limit for directors’ remuneration (excluding the Managing Director) is $750,000. This limit was determined by
members at the 2008 Annual General Meeting. As part of the Remuneration Committee’s oversight of MLA’s remuneration and incentive framework, in 2016–17 the committee commissioned a broad review of remuneration within MLA. This included director and employee remuneration being benchmarked by Aon Hewitt against like organisations. Consultation with Aon Hewitt has been undertaken in 2018–19 to confirm market movements and reliance on the benchmarking data.
In accordance with this, the Board determined in July 2018 that a 2.5% increase in directors’ fees would take effect from 1 January 2019. The increase reflects the time and effort required of the non-executive directors sitting across the MLA Group of companies and in recognition of the additional workload on the committee Chairs. The total per annum cost for non-executive directors is $610,845.57.
The remuneration arrangements for each member of the Leadership Team, including the Managing Director, comprise both fixed and performance-based remuneration. The remuneration packages for the MLA Leadership Team are reviewed each year and include several gateways before eligibility to the performance-based component. This ensures the remuneration structure aligns management effort with organisational objectives and attracts, retains and motivates quality management personnel.

60
Principle/recommendation Description/reference of disclosure/compliance
Recommendation 1.5
A listed entity should:(a) have a diversity policy which includes requirements for the board or
a relevant committee of the board to set measurable objectives for achieving gender diversity and to assess annually both the objectives and the entity’s progress in achieving them;
(b) disclose that policy or a summary of it; and(c) disclose as at the end of each reporting period the measurable
objectives for achieving gender diversity set by the board or a relevant committee of the board in accordance with the entity’s diversity policy and its progress towards achieving them, and either: (1) the respective proportions of men and women on the board, in
senior executive positions and across the whole organisation (including how the entity has defined “senior executive” for these purposes); or
(2) if the entity is a “relevant employer” under the Workplace Gender Equality Act, the entity’s most recent “Gender Equality Indicators”, as defined in and published under that Act.
The Diversity Policy is available on MLA’s website: mla.com.au The Board recognises and fosters a culture that encourages divergent views and robust discussion. In assessing candidates, the Selection Committee considers diversity of education, the nature of the businesses and business functions in which candidates have gained experience and the roles held, as well as the more obvious aspects of diversity such as gender, age, ethnicity and cultural background. In 2018 the Board also set a target of 30% of females on the Board by 2019, which was actually realised in 2018.MLA also enunciates its commitment to diversity in other policies such as EEO and Anti-discrimination policy and Misconduct and Discipline policy which are regularly reported to, monitored by and adjusted with approval by the Board. The proportion of women as at the date of this report: • Board members: 25%• Leadership Team: 38%• Whole organisation: 56%
Recommendation 1.6
A listed entity should:(a) have and disclose a process for periodically evaluating the
performance of the board, its committees and individual directors; and(b) disclose, in relation to each reporting period, whether a performance
evaluation was undertaken in the reporting period in accordance with that process.
The Board evaluates its performance through an annual performance review, which is facilitated by an external specialist. As part of the Board’s review process in 2018–19 it completed the Australian Institute of Company Directors Governance Analysis Tool survey and reviewed this as part of the annual review.
Recommendation 1.7
A listed entity should:(a) have and disclose a process for periodically evaluating the
performance of its senior executives; and(b) disclose, in relation to each reporting period, whether a performance
evaluation was undertaken in the reporting period in accordance with that process.
The Remuneration Committee and Board conduct an annual assessment of the performance of the Managing Director and the Leadership Team against agreed KPIs. In accordance with the annual work plan, the performance evaluation process for the Managing Director and the Leadership Team was completed.
Principle 2. Structure the board to add value
Recommendation 2.1
The board of a listed entity should:(a) have a nomination committee which:
(1) has at least three members, a majority of whom are independent directors; and
(2) is chaired by an independent director, and disclose:(3) the charter of the committee;(4) the members of the committee; and(5) as at the end of each reporting period, the number of times
the committee met throughout the period and the individual attendances of the members at those meetings; or
(b) if it does not have a nomination committee, disclose that fact and the processes it employs to address board succession issues and to ensure that the board has the appropriate balance of skills, knowledge, experience, independence and diversity to enable it to discharge its duties and responsibilities effectively.
MLA’s Constitution and operation of the Selection Committee reflects this requirement.Refer also to the section about Selection Committee in the ‘Corporate Governance Statement’.
Recommendation 2.2
A listed entity should have and disclose a board skills matrix setting out the mix of skills and diversity that the board currently has or is looking to achieve in its membership.
Biographical details of directors are published on the MLA website: mla.com.au/about-mla/mla-at-a-glance/board-of-directors
Recommendation 2.3
A listed entity should disclose:(a) the names of the directors considered by the board to be independent
directors;(b) if a director has an interest, position, association or relationship of
the type described in Box 2.3 but the board is of the opinion that it does not compromise the independence of the director, the nature of the interest, position, association or relationship in question and an explanation of why the board is of that opinion; and
(c) the length of service of each director.
The MLA Board currently considers the independence of its directors on an annual basis.Refer also to the Director Independence section in the ‘Corporate Governance Statement’.Length of service of each director is included in the Director biographies.
Recommendation 2.4
A majority of the board of a listed entity should be independent directors. All of the directors are independent with the exception of the Managing Director.
Recommendation 2.5
The chair of the board of a listed entity should be an independent director and, in particular, should not be the same person as the CEO of the entity.
The role of the Chair and the Managing Director are not performed by the same person.

Overview
Report to stakeholders
About
MLA
Financial report
Supporting inform
ation
61
Principle/recommendation Description/reference of disclosure/compliance
Recommendation 2.6
A listed entity should have a program for inducting new directors and provide appropriate professional development opportunities for directors to develop and maintain the skills and knowledge needed to perform their role as directors effectively.
MLA has a program for inducting new directors and provides appropriate professional development. Four directors completed the AICD Company Directors Course during the past year.
Principle 3. Act ethically and responsibly
Recommendation 3.1
A listed entity should:
(a) have a code of conduct for its directors, senior executives and employees; and
(b) disclose that code or a summary of it.
MLA has a Code of Conduct which covers the governance and sets the expectation for the Board and all MLA personnel. The Code of Conduct, which was last revised and endorsed by the Board in July 2018, is on MLA’s website.
Principle 4. Safeguard integrity in corporate reporting
Recommendation 4.1
The board of a listed entity should:
(a) have an audit committee which:(1) has at least three members, all of whom are non-executive
directors and a majority of whom are independent directors; and(2) is chaired by an independent director, who is not the chair of the
board, and disclose:(3) the charter of the committee;(4) the relevant qualifications and experience of the members of the
committee; and(5) in relation to each reporting period, the number of times
the committee met throughout the period and the individual attendances of the members at those meetings; or
(b) if it does not have an audit committee, disclose that fact and the processes it employs that independently verify and safeguard the integrity of its corporate reporting, including the processes for the appointment and removal of the external auditor and the rotation of the audit engagement partner.
The Board has established an Audit and Risk Committee which is structured so that it:• consists of only non-executive, independent directors;• is chaired by an independent chair who is not Chair of the Board; and• consists of at least three members of the Board.
The charter of the committee is on MLA’s website.
Biographical details of directors are published to the MLA website: mla.com.au/about-mla/mla-at-a-glance/board-of-directors
Refer also to the Audit and Risk Committee section in the ‘Corporate Governance Statement’.
Recommendation 4.2
The board of a listed entity should, before it approves the entity’s financial statements for a financial period, receive from its CEO and CFO a declaration that, in their opinion, the financial records of the entity have been properly maintained and that the financial statements comply with the appropriate accounting standards and give a true and fair view of the financial position and performance of the entity and that the opinion has been formed on the basis of a sound system of risk management and internal control which is operating effectively.
The wording of the declaration reflects the wording in the recommendation.
Recommendation 4.3
A listed entity that has an AGM should ensure that its external auditor attends its AGM and is available to answer questions from security holders relevant to the audit.
MLA’s external auditor attends each AGM and is available to answer questions from members relevant to the audit.
Principle 5. Make timely and balanced disclosure
Recommendation 5.1
A listed entity should:
(a) have a written policy for complying with its continuous disclosure obligations under the Listing Rules; and
(b) disclose that policy or a summary of it.
As MLA is an unlisted public company it is not an ASX disclosing entity but does report annually to members and to the Commonwealth Government on its operations and financial results.
Principle 6. Respect the rights of security holders
Recommendation 6.1
A listed entity should provide information about itself and its governance to investors via its website.
MLA provides information about itself and its governance framework on its website.
Recommendation 6.2
A listed entity should design and implement an investor relations program to facilitate effective two-way communication with investors.
MLA has a Communications, Promotions and Engagement team and program to promote effective two-way communication with members, levy payers, representative councils and the Commonwealth Government.
Recommendation 6.3
A listed entity should disclose the policies and processes it has in place to facilitate and encourage participation at meetings of security holders.
Information about how MLA facilitates and encourages participation by members at meetings is on MLA’s website. It has also significantly expanded the program of events that occur in the week of the AGM and promotes this through: redmeat.mla.com.au.

62
Principle/recommendation Description/reference of disclosure/compliance
Recommendation 6.4
A listed entity should give security holders the option to receive communications from, and send communications to, the entity and its security registry electronically.
In addition to amending its constitution in 2009 to ensure information can be provided electronically, in 2016 MLA ran an opt-in campaign for members to elect to receive electronic communications. This is a standing option for current and new members.
Principle 7. Recognise and manage risk
Recommendation 7.1
The board of a listed entity should:(a) have a committee or committees to oversee risk, each of which:
(1) has at least three members, a majority of whom are independent directors; and
(2) is chaired by an independent director, and disclose: (3) the charter of the committee; (4) the members of the committee; and (5) as at the end of each reporting period, the number of times
the committee met throughout the period and the individual attendances of the members at those meetings; or
(b) if it does not have a risk committee or committees that satisfy (a) above, disclose that fact and the processes it employs for overseeing the entity’s risk management framework.
The Board has established an Audit and Risk Committee which is structured so that it:• consists of only non-executive, independent directors;• is chaired by an independent chair who is not Chair of the Board; and• consists of at least three members of the Board.The charter of the committee is on MLA’s website.Refer also to the section about the Audit and Risk Committee in the ‘Corporate Governance Statement’.
Recommendation 7.2
The board or a committee of the board should:(a) review the entity’s risk management framework at least annually to
satisfy itself that it continues to be sound; and(b) disclose, in relation to each reporting period, whether such a review
has taken place.
Refer to the section about the Audit and Risk Committee section in the ‘Corporate Governance Statement’.
Recommendation 7.3
A listed entity should disclose:(a) if it has an internal audit function, how the function is structured and
what role it performs; or(b) if it does not have an internal audit function, that fact and the
processes it employs for evaluating and continually improving the effectiveness of its risk management and internal control processes.
Refer to the section about the Internal Audit program in the ‘Corporate Governance Statement’.In addition to the internal audits undertaken by KPMG, MLA’s own Risk and Assurance Manager works in parallel with KPMG and undertakes a number of reviews of overseas offices to ensure compliance with MLA policy and controls.
Recommendation 7.4
A listed entity should disclose whether it has any material exposure to economic, environmental and social sustainability risks and, if it does, how it manages or intends to manage those risks.
Refer to the section about MLA’s Risk Management on pages 47, 57 and 58 of this Annual Report. The Risk register is a living document and is broadly engaged with across the business.In addition to this, KPMG undertook a detailed review of MLA’s risk management framework to make an assessment of its level of maturity and to inform ongoing improvement in the way MLA manages and reports on its risk profile.
Principle 8. Remunerate fairly and responsibly
Recommendation 8.1
The board of a listed entity should:(a) have a remuneration committee which:
(1) has at least three members, a majority of whom are independent directors; and
(2) is chaired by an independent director, and disclose: (3) the charter of the committee; (4) the members of the committee; and (5) as at the end of each reporting period, the number of times
the committee met throughout the period and the individual attendances of the members at those meetings; or
(b) if it does not have a remuneration committee, disclose that fact and the processes it employs for setting the level and composition of remuneration for directors and senior executives and ensuring that such remuneration is appropriate and not excessive.
The Board has established a Remuneration Committee which is structured so that it:• consists of three non-executive, independent directors; and• is chaired by an independent chair.The charter of the committee is on MLA’s website.Refer also to the Remuneration Committee and Remuneration and performance arrangements sections in the ‘Corporate Governance Statement’.
Recommendation 8.2
A listed entity should separately disclose its policies and practices regarding the remuneration of non-executive directors and the remuneration of executive directors and other senior executives.
Refer to the Remuneration and performance arrangements section in the ‘Corporate Governance Statement’.
Recommendation 8.3
A listed entity which has an equity-based remuneration scheme should:(a) have a policy on whether participants are permitted to enter into
transactions (whether through the use of derivatives or otherwise) which limit the economic risk of participating in the scheme; and
(b) disclose that policy or a summary of it.
Not applicable as MLA does not have an equity-based remuneration scheme.

Overview
Report to stakeholders
About
MLA
Financial report
Supporting inform
ation
63
Who we are
Dr Michele Allan ChairBAppSc, MMgt, MCommLaw, DBA, FAICD
Director since November 2011
Dr Allan has an academic background in biomedical science, management and law. Dr Allan currently holds board positions with Food Innovation Australia Limited, Apple and Pear Australia, GrainGrowers, Nuffield Australia, CSIRO, Food Agility CRC, Dairy Food Safety Victoria, MJCP Holdings Pty Ltd and Wine Australia. She is Chancellor of Charles Sturt University and Chair of the Defence CRC for Trusted Autonomous Systems.
Previous roles: Chair of the Grains & Legumes Nutrition Council; executive director of Patties Foods; non-executive director of Patties Foods, Dairy Research and Development Corporation, Forest and Wood Products Australia, Ruralco Holdings, Tasmania Fruit and Vegetable Taskforce, Tasmanian Irrigation, Callaghan Innovation, William Angliss Catering & Hospitality TAFE College, Cooperative Research Centre Hearing, Grape and Wine Research and Development Corporation, Innovation and Science Australia, and member of the CRC Advisory Committee.
Chair
Director
Member
Jason Strong Managing DirectorMAICD
Appointed 25 March 2019
Mr Strong has more than 30 years’ red meat and livestock experience, knowledge and connections from the farm through to the end consumer in both domestic and international markets. He is a well-recognised and respected senior executive with extensive skills in commercial and industry business management and administration, supply chain development, meat science and grading, genetics and marketing, as well as on-farm experience.
Previous roles: CEO of Smithfield Cattle Company, Managing Director of AACo, MLA’s regional manager in Europe and Russia, Pfizer (now Zoetis), and manager at MSA Grading Services.
Managing Director
Chair
Director
Alan Beckett BEc, FICA, GAICD
Director since November 2014
Mr Beckett runs an Angus breeding and backgrounding operation in Yea, Victoria. He brings 40 years’ experience with a major professional services firm, practising in the area of audit and corporate services to large companies with an emphasis on listed public companies, along with practical experience in doing business in Oceania, South-East Asia, China, Japan and India. Mr Beckett is a non-executive director of Defence Health Limited, Westbourne Capital Pty Ltd and Westbourne Credit Management Limited.
Previous roles: Chairman of ASX-listed Basper Limited (formerly Berklee Limited), Deputy Chairman of the Department of Defence Audit & Risk Committee, and independent member of the Audit & Risk Committee of the Reserve Bank of Australia’s wholly-owned subsidiary, Note Printing Australia Limited.
Director
Chair
Member
MLA BOARD
Robert Fitzpatrick BEc, LLB, MBA, GAICD
Director since November 2015
Mr Fitzpatrick is an industry and technology expert with more than 30 years’ experience in senior executive roles across the spectrum of large corporates, government agencies, and small and medium enterprises and start-ups. He has a detailed understanding of industry representative bodies, research and higher education, retail, fast-moving consumer goods, telecommunications, and information and communications technology sectors. Mr Fitzpatrick has a passion for improving the integrity and efficiency of Australia’s agricultural sector, applying new analytics to improve on-farm productivity, de-bottleneck supply chains and reduce the cost of moving product from farm gate to global markets. Mr Fitzpatrick is director of Australia’s Academic and Research Network, and as at 30 June 2019 was CEO of Gelion UK and Gelion Technologies, a leading provider of battery storage for the renewable energy sector.
Previous roles: Board and senior executive roles at McKinsey & Company, Optus, ShopFast, Monitoring Division Inc and wishlist.com.au, councillor of Charles Sturt University, senior executive of Data61 (formerly NICTA) and CEO of Australian Information Industry Association.
Director
Chair
Erin Gorter BA (Education), GAICD
Director since November 2015
Ms Gorter is a rural industry consultant with many years of experience as a WA livestock producer. Ms Gorter comes from a farming background and was a landholder and involved in running a mixed farming operation in Kojonup, WA, producing prime lamb, wool and grains, conducting sheep trading and a small amount of agroforestry for nearly 30 years. Ms Gorter runs her own business in providing business and industry management advice in rural areas. She was awarded the WA RIRDC Rural Women’s Award runner-up in 2010 and is a director of agVivo. Ms Gorter is also a director of Primary Industries Education Foundation Australia and Grower Group Alliance Inc.
Previous roles: Producer representative on the Board of the WA Meat Industry Authority and managed all aspects of two WA-based grower production groups.
Director
Chair
Member

64
Russell LethbridgeDip Rural Bus Mgt, Cert AH & FarmEng (Hons), MAICD
Director since December 2017
Mr Lethbridge, with his family, runs Werrington Cattle Company, a commercial beef cattle breeding, growing and fattening enterprise. Mr Lethbridge has a deep understanding of cattle production systems, managing breeder and feeder cattle under extreme environmental conditions and pasture nutrition levels, utilising genetic selection and strategic herd management to achieve production and business success. Mr Lethbridge is Chair of the Hann Highway Action Group, a member of the Rural Fire Board and a member of the Oak Race Club Committee and has been so since 1988.
Previous roles: Chair of the Hann Highway Action Group, a member of the Rural Fire Board and a member of the Oak Race Club Committe. Elected representative of AgForce for seven years, beginning as Regional Vice President for the north region, then as Regional President and Board member and member of AgForce Finance Audit and Risk and Agribusiness Finance Drought and Climate Policy committees. Member of the steering committee for the Northern Gulf Resource Management Group to develop and promote a business improvement package for north Australian cattlemen.
Director
Member
Andrew Michael
Director since December 2017
Mr Michael is a fourth-generation farmer, working his 1,500ha family farm at Snowtown, SA. Over the last 45 years he’s built and operated a large-scale sheepmeat and wool business including both terminal and maternal sheep. He has extensive experience in the use of breeding technologies in both the sheep and cattle industries and, for over 35 years, has incorporated all the latest leading-edge animal breeding technologies available. Mr Michael is a great supporter and user of all sheep industry resources, including Sheep CRC, Sheep Genetics, Resource Flock and many more. For many years he’s had a close association with commercial producers all round Australia, New Zealand and South America, holding presentation and educational field days and helping their marketing and genetic selection programs.
Previous roles: President of the Royal Adelaide Show Pastoral Committee, Board member of the Lumeah Trust, member with SA Sheep Disease Management Committee focusing on OJD and Spider Syndrome, and an Australian White Suffolk Association foundation member. Mr Michael is also Honorary Life Member and Distinguished Service Award member of the Australian White Suffolk Association.
Director
Member
Manny NoakesBSc, Dip Nut & Diet, PhD, GAICD
Director since November 2018
Professor Manny Noakes is a well-credentialed research scientist in food and nutrition and currently managers her own nutrition consultancy business. With over 35 years’ experience she has extensive knowledge in many fields of nutrition and health including the food regulatory system and functional food substantiation, and an in-depth knowledge of the role of red meat in human nutrition. She was instrumental in the development of the CSIRO Total Wellbeing Diet which positions red meat as part of a healthy diet for weight control. Professor Noakes is currently an Adjunct Research Professor with the University of South Australia and a member of the Nutrition Society of Australia. She is also a member of the National Committee for Nutrition for the Australian Academy of Sciences, as well as being on its Expert Working Group Special Project: ‘Nourishing Australia: A decadal plan for nutrition science’.
Previous roles: Senior Principal Research Scientist and Director for the Nutrition and Health Program at CSIRO, executive member of the Federal Government Food and Health Dialogue, the National Heart Foundation Food and Nutrition Advisory Committee and the Lion Nutrition Advisory Panel, and numerous other advisory roles for industry and government.
Director
Member
Clare Stanwix BA (Hons) LLB, LLM, GAICD, FGIA, FCIS
Appointed June 2014
Ms Stanwix’s role as Company Secretary is to convey the Board’s role, priorities and needs to the business and facilitate good governance within MLA. She is accountable directly to the Board, through the Chair, on all matters to do with the proper functioning of the Board. In addition to holding the office of Company Secretary, Ms Stanwix is a member of MLA’s Leadership Team and holds the position of General Counsel. She leads the legal, risk and governance team at MLA and over the past year has been responsible for the evolution of MLA’s crisis management and risk frameworks. She has significant experience in intellectual property, technology, corporate and commercial law, advertising, workplace health and safety, and dispute resolution.
Previous roles: Prior to joining MLA in 2009 as General Counsel Ms Stanwix was a senior associate with DLA Piper and external legal counsel to MLA.
Company Secretary
Director
Jo PyeBSc Food & Nutrition, MBA , Diploma in Leadership Coaching
Director since November 2018
Ms Pye has 20 years’ experience in large-scale customer engagement, marketing and strategy within the fast-moving consumer goods industry (with a focus on food and beverage) across numerous roles covering food science, product and strategic marketing management, consumer insights and strategic planning. She has held senior positions across local, regional (APAC) and global (USA, UK, APAC) markets including a three-year assignment in Shanghai, China where she was responsible for strategic planning and implementation to drive regional business growth. Ms Pye has excelled in both global corporate and lean start-up environments and in designing and delivering high quality strategic market advisory and implementation projects. She is currently undertaking a Diploma in Leadership Coaching and is a member of the Australian Institute of Food Science & Technology.
Previous roles: Director of Food Service for The NPD Group, Global Head of Insights & Customer Experience at Watch Me Think, Global Director of Insights & Client Service, Mintel International, Marketing Director, Australia & NZ, DuPont (formerly Danisco).
Director
Member

Overview
Report to stakeholders
About
MLA
Financial report
Supporting inform
ation
65
RETIRING DIRECTORS
KEY: MLA SUBSIDIARY COMPANIES AND COMMITTEES
Meat & Livestock Australia
MLA Donor Company Limited
Integrity Systems Company Limited
Red Meat Traceability Systems Pty Ltd
AUS-MEAT Limited
Remuneration Committee
Selection Committee
Audit and Risk Committee
Steven Chaur GradDip Marketing, MBA, GAICD, FIML
Director since November 2015
Mr Chaur is a highly experienced food industry leader, executive and consumer brand marketer, having managed some of Australia’s favourite brands and has more than 25 years’ experience in fast-moving consumer goods within the food industry across Asia, China, Middle East, NZ, US and Europe. Mr Chaur has gained strong experience in multi-sales channel customer relationship management, market access, consumer marketing and brand development strategy, corporate strategy and governance, crisis management/product recall, capital projects and company financial management. Mr Chaur has broad experience across primary industries where the farm-to-consumer value chain and innovation excellence is critical.
Previous roles: Managing Director roles with ASX-listed Patties Foods Limited and Saint-Gobain SA and Managing Director and CEO of Nutrano Produce Group Ltd, a large-scale integrated farming and export company. Senior executive roles with Pacific Brands Food Group, George Weston Foods and Findus SA. Mr Chaur was also a previous Marketing Director at National Foods Limited (milk) and Simplot Australia.
Director
Past Chair
Member
Richard NortonFormer Managing Director (2014–2018) MBA, GAICD
Appointed 2 June 2014
Mr Norton is the fifth generation of a beef and sheep farming family from Monaro, NSW. He began his working life as a rouseabout and jackaroo then for more than 20 years served livestock producers as a stock agent and auctioneer across NSW.
Previous roles: Mr Norton held executive positions in retail, manufacturing, logistics and warehousing with Woolworths, Coca-Cola Amatil, Wesfarmers and Toll Holdings and was a non-executive director of Agrium Asia Pacific, the Australian Wheat Board, RD1 New Zealand, Landmark Harcourts and Australian Wool Handlers. He was head of Live Export and International Trade and then Managing Director of Landmark Operations Australia. He was Chairman of Integrated Traceability Solutions (Global) and AuctionsPlus.
Past Managing Director
Director
Member

66
Lisa Sharp BEc
Chief Marketing and Communications Officer
Ms Sharp joined MLA in April 2015 and leads MLA’s Communications, Marketing and Industry Insights team. She has an extensive background in consumer insights and brand marketing, product innovation, global strategy development, communications, change management and general management. Ms Sharp has held marketing leadership and executive team positions in a number of Australian and multinational organisations including SPC Ardmona, Coca-Cola Amatil, PZ Cussons and Novartis Consumer Health. She has also held finance, business analyst and brand management roles during her career.
Number of employees: 73
Jason StrongMAICD
Managing Director
See page 63 for Mr Strong’s biography.
Clare Stanwix BA (Hons) LLB, LLM, GAICD, FGIA, FCIS
General Counsel and Company Secretary
See page 64 for Ms Stanwix’s profile.
Number of employees: 5
MLA LEADERSHIP TEAM
Dr Jane Weatherley PhD (Farming systems), GAICD
Chief Executive Officer, Integrity Systems Company
Dr Weatherley took on the role of Chief Executive Officer of Integrity Systems Company (ISC) in 2016. Before this role, she was General Manager – Livestock Productivity, managing Meat Standards Australia, livestock genetics and sheep productivity RD&E. Prior to MLA, Dr Weatherley held positions spanning red meat extension, farming systems research and development, and evaluation. She maintains an active role in her family beef operation on Bruny Island, Tasmania.
Number of employees: 34
Andrew Ferguson BA, CA
Chief Financial Officer
Mr Ferguson joined MLA as Chief Financial Officer in December 2016. He is a Chartered Accountant with more than 20 years of commercial and financial experience in both the UK and Australia. His previous positions include senior finance roles with Ruralco Holdings, NRMA and Jetset Travelworld. Prior to this, Mr Ferguson worked as a senior manager with EY.
Number of employees: 42
Michael Finucan BAgSc
General Manager, International Markets
Mr Finucan has extensive experience working in international markets after being involved in the export of a range of agricultural commodities before joining MLA in 2007. He has held a number of roles at MLA, including Manager Livestock Exports and International Business Manager in Korea. He is responsible for the delivery of MLA’s international markets strategy and oversees MLA’s international operations from Singapore.
Number of employees: 48
Sean Starling GAICD, LLB, B.Eng (Chem), Vincent Fairfax Fellow
General Manager, Research, Development & Innovation and MDC
Mr Starling joined MLA in 2016 following his role as General Manager – Australia of Scott Automation & Robotics and was previously at MLA from 2002–2009 as Manager – Innovation and Capability Building. He has been engaged in food value chains for most of his career, having worked in positions from factory engineer to general manager in manufacturing, research and development, and engineering organisations.
Number of employees: 24
Michael Crowley B.RurSc, Grad Cert Bus Admin
General Manager, Producer Consultation and Adoption
Mr Crowley joined MLA in 2009 as the manager of Meat Standards Australia (MSA). In 2012 he moved to Brussels as MLA’s International Business Manager for EU and Russia. He returned in 2015 to manage MSA, then joined MLA’s Leadership Team in 2016. He is responsible for MLA’s investments in MSA, livestock genetics, beef and sheep R&D, Producer Innovation Fast-Track, adoption and the regional consultation framework. Prior to joining MLA, Mr Crowley held commercial positons within red meat processing, production, procurement, marketing and sales. His family operate a beef cattle property in northern NSW.
Number of employees: 37

Overview
Report to stakeholders
About
MLA
Financial report
Supporting inform
ation
67
MLA ORGANISATIONAL CHARTat 30 June 2019
MLA BoardChair: Dr Michele Allan
Andrew FergusonChief Financial Officer
Corporate Services
Dr Jane WeatherleyCEO, Integrity Systems Company
Lisa Sharp*Chief Marketing and Communications Officer
Communications, Marketing and Industry Insights
Producer Consultation and Adoption
Michael FinucanGeneral Manager – International Markets
International Markets
Research, Development and Innovation
Legal, Governance and Risk
Michael CrowleyGeneral Manager – Producer Consultation and Adoption
Integrity Systems Company (ISC)
Sean Starling**General Manager – Research, Development & Innovation and MLA Donor Company
Clare StanwixGeneral Counsel and Company Secretary
MLA Donor Company (MDC)
Business units
MLA Leadership Team
Subsidiary companies
Managing DirectorJason Strong
* At the time of publication, a new position was created within the MLA Leadership Team to reinforce the organisation’s commitment to continued effective and professional communications to all stakeholders across the red meat supply chain.
Peta Slack-Smith commenced in the key senior role of General Manager, Strategic Communications and Corporate Affairs in August 2019.
This new appointment resulted in a restructure of the Communications, Marketing and Industry Insights business unit. More information on this restructure will be included in MLA’s Annual Report 2019–20.
** Sean Starling left MLA on 30 September 2019.

68
OUR SUBSIDIARY COMPANIES
MLA Donor Company
MDC accelerates innovation across the value chain so the Australian red meat and livestock industry can remain competitive on the world stage. It does this by attracting commercial investment from individual enterprises and others that share a mutual interest to co-invest in innovation that will benefit the industry (see figure below).
MDC supports MLA’s strategic purpose of fostering the long-term prosperity of the Australian red meat and livestock industry via:
• extending MLA’s strategic priorities into future-focused, transformational impact areas
• facilitating capability and adoption of innovation by industry
• acting as a catalyst to accelerate the development of innovations with new types of provider partnerships
• partnerships that facilitate ‘big picture’ change in the industry
• engaging leading global providers and entrepreneurs that bring new ideas and new value to the industry
• attracting new investment partners to co-develop key priority areas.
MDC’s strategic investment portfolio is directly aligned to extending the achievement of the Meat Industry Strategic Plan 2020 and MLA’s Strategic Plan 2016–2020.
Further detail about MDC is available at mla.com.au/mdc
Integrity Systems Company
Integrity Systems Company (formerly NLIS Ltd) is a wholly owned subsidiary of MLA. Its expanded remit began in September 2016, being responsible for delivering the red meat and livestock industry’s traceability and quality assurance systems: the Livestock Production Assurance (LPA) program, National Vendor Declarations (NVDs) and the National Livestock Identification System (NLIS) (see figure below).
Integrity Systems Company (ISC) was launched following a recommendation
by industry and government in 2015 – through their SAFEMEAT partnership – that one company be given responsibility for delivering a fully integrated integrity system. The streamlined structure helps to ensure resources are more effectively directed to further develop and improve these key systems which underpin market access, customer expectations and the safety of Australian red meat and livestock. ISC’s strategic investment portfolio is directly aligned to extending the achievement of the Meat Industry Strategic Plan 2020 and MLA’s Strategic Plan 2016–2020.
THE ROLE OF MDC
Market accessCustomer expectationsSafe red meat
Food safety
Animal welfare Biosecurity Traceability
National LivestockIdentification System
Livestock Production Assurance
National Vendor Declaration
THE ROLE AND SCOPE OF INTEGRITY SYSTEMS COMPANY

Overview
Report to stakeholders
About
MLA
Financial report
Supporting inform
ation
69
HUMAN RESOURCES
At 30 June 2019 MLA had 271 employees, both domestically and internationally. The workforce has increased marginally up from 265 employees compared to the prior year.
Voluntary turnover for the reporting year was 11.3% compared to 10.6% in 2017–18. Total turnover in 2018–19 was 20% which includes voluntary and involuntary turnover and end of fixed-term contracts.
Performance and remuneration process
MLA’s performance management framework aligns MLA’s strategic priorities and organisational values to individual performance and outcomes to encourage, recognise and reward employee performance.
Employee remuneration is reviewed on an annual basis, taking into consideration changes to the Consumer Price Index, external salary survey information and employee development and performance.
During 2018–19 MLA continued to have new roles benchmarked through global human resources consulting firm Aon Hewitt to ensure remuneration remains competitive to attract and retain talent.
The total employee benefit expense in 2018–19 was $34,638,909 (see page 84).
Training and professional development
It is important that MLA employees have the necessary knowledge and skills to manage change and complexity to deliver MLA’s Strategic Plan 2016–2020, while enabling growth and innovation to build capability for the future.
In 2018–19 MLA continued to support employees through training and professional development through its 70/20/10 model approach to learning and development:
• 70% of learning and development is on the job (including workplace tasks and stretch assignments)
• 20% is through others (including managers, peers and coaching arrangements)
• 10% is through formal learning initiatives (such as risk management, performance management and anti bullying and harassment training, and training courses identified between individual employees and their managers).
MLA EMPLOYEE PROFILE AT 30 JUNE
2015 2016 2017 2018 2019
Male 112 114 112 125 118
Female 125 120 131 140 153
Full-time 208 207 208 232 231
Part-time 29* 27* 35* 33* 40*
Australian-based 197 196 205 222 227
Overseas-based# 40 38 38 43 44
Total staff 237 234 243 265 271
* Excludes employees on parental leave. * Part‑time total includes five casual employees based in Australia.# Overseas‑based includes both locally engaged employees and expatriates/international
assignees.
MLA also provides financial and study assistance to employees undertaking a professionally recognised qualification related to their work, such as an undergraduate or postgraduate course at university, TAFE or other recognised education institutions.
In 2018–19, assistance was provided to 14 employees studying undergraduate and postgraduate courses ranging from rural science to agriculture and communication to business management, as well as professional certifications.
Employee engagement
As a service provider to industry, MLA’s employees are vital to delivering outcomes that support MLA’s strategic priorities for the red meat industry. MLA commissions an employee engagement survey, conducted by Aon Hewitt, to measure engagement across the company and strives for continuous improvement to work toward being recognised amongst the best employers in Australia.
Diversity and gender equality
MLA is committed to diversity, equal employment opportunity and inclusive workplace practices. The diversity policy can be viewed at mla.com.au.
At 30 June 2019, MLA’s employee profile reflects a balanced age distribution and gender profile (see figure). MLA continues to offer employees flexible work arrangements that support work/life balance, including family or caring responsibilities. Provisions include flexible hours of work, telecommuting, part-time work, paid parental leave and personal/carer’s leave.
MLA also offers employees access to an employee assistance program, and has training and formal policies to educate and protect employees against discrimination, harassment and bullying.
MLA employees – age and gender composition
0
5
10
15
20
25
30
35
40
0
5
10
15
20
25
30
35
40
Female
20–24 25–29 30–34 35–39 40–44 45–49 50–54 55–59 60–64 65–69 70–74
Male
MLA EMPLOYEES – AGE AND GENDER COMPOSITION
70
Financial summary ..............................................................71
Directors’ report .................................................................74
Auditor’s independence declaration ............................76
Income statement .............................................................. 77
Statement of comprehensive income .......................... 77
Statement of financial position .......................................78
Statement of changes in equity .....................................79
Statement of cash flows ...................................................79
Notes to the financial statements................................. 80
Directors’ declaration ........................................................96
Independent auditor’s report..........................................97
Financial report
70

Overview
Report to stakeholders
About
MLA
Financial report
Supporting inform
ation
71
REVENUE AND EXPENDITURE SUMMARY
2014–15 $m
2015–16 $m
2016–17 $m
2017–18 $m
2018–19 $m
% change 2018–19 compared with
2017–18
Grassfed cattle levies 66.9 61.4 53.8 55.3 58.9 6.5
Grainfed cattle levies 10.5 11.9 10.9 11.3 11.4 0.9
Lamb/mutton levies 36.4 37.2 35.8 39.1 37.3 -4.6
Goat levies 0.9 0.8 0.7 0.7 0.5 -28.6
Producer levies 114.7 111.4 101.2 106.4 108.1 1.6
Government contributions 46.5 44.0 52.1 80.4 80.9 0.6
Other 44.5 42.4 47.2 85.7 80.8 -5.7
Total revenue 205.7 197.8 200.5 272.5 269.9 -1.0
Marketing, market access and insights 86.6 84.4 88.9 90.4 104.1 15.2
Research and development 92.9 88.0 104.2 171.8 170.3 -0.9
Total expenditure* 179.5 172.4 193.0 262.2 274.4 4.7
* Total includes $94.2 million invested via MLA Donor Company
Revenue
MLA’s total income for 2018–19 of $269.9 million was 1% lower than the previous year. The decrease was primarily attributable to lower partner contributions and access fee receipts associated with MLA Donor Company projects. An overall increase in levy investment resulted in MLA Donor Company being allocated a smaller residual share of MLA’s Government matching cap on research and development investment.
Levy income increased $1.7 million (1.6%) to $108.1 million in 2018–19 due to an increase in cattle levies. Unfavourable weather conditions in key production regions resulted in elevated slaughter rates and also forced record numbers of cattle into feedlots, resulting in an uplift in levy income. Strong international demand also underpinned the result. The increase was partially offset by a reduction in sheepmeat levies, which were adversely affected by drought-induced supply constraints.
Expenditure
MLA’s total expenditure increased 4.7% in 2018–19 to $274.4 million. The increase mainly reflects the application of MLA’s Levy Reserve Policy, which required the release of increased levies from reserves for investment. The level of investment reflects the fact levy reserves are currently above the target levels outlined in the policy.
MLA’s investment during the period comprised $170.3 million in research and development and $104.1 million in marketing, market access and insights activities. The Group continued to utilise greater than 99% of the Government matching funds available in 2018–19.
Retained earnings
MLA returned a deficit of $4.5 million, taking the retained surplus at 30 June 2019 to $114.0 million. The reduction in retained earnings predominantly reflects the application of MLA’s Levy Reserve Policy, which required an increase in levy investment. Lower access fees received via MLA Donor Company also contributed to the result.
Cash flow
MLA’s cash balance decreased primarily due to lower contributions received from MLA Donor Company partners. MLA Donor Company’s expenditure was lower compared to the previous year which resulted in decreased external income contributions.
Total
$114.0m
Grassfed cattle levies $48.3m
Grainfed cattle levies $14.7m
Lamb levies $42.4m
Mutton levies $2.4m
Goat levies $0.8m
MLA Donor Company $4.9mIntegrity Systems Company $0.5m
50
100
150
200
250
300
2018–192017–182016–172015–162014–15
Revenue, expenditure and retained earnings
Revenue Expenditure Retained earnings
RETAINED EARNINGS BY FUNDING SOURCE 2018–19
Total
$114.0m
Grassfed cattle levies $48.3m
Grainfed cattle levies $14.7m
Lamb levies $42.4m
Mutton levies $2.4m
Goat levies $0.8m
MLA Donor Company $4.9mIntegrity Systems Company $0.5m
50
100
150
200
250
300
2018–192017–182016–172015–162014–15
Revenue, expenditure and retained earnings
Revenue Expenditure Retained earnings
REVENUE, EXPENDITURE AND RETAINED EARNINGS
Financial summary

72
Pillars and priorities Goat Mutton Lamb Total sheep Grassfed cattle Grainfed cattle Total cattle Total levy funds Processor LiveCorp External Govt. MLA*
R&D $000
M $000
R&D $000
M $000
R&D $000
M $000
R&D $000
M $000
R&D $000
M $000
R&D $000
M $000
R&D $000
M $000
R&D $000
M $000
R&D $000
M $000
R&D $000
M $000
R&D $000
M $000
R&D $000
Total $000
Pillar 1: Consumer and community support
Continuous improvement of the welfare of animals in our care
8 25 240 61 936 248 1,175 310 1,038 1,362 919 262 1,957 1,624 3,140 1,959 17 497 606 992 4,760 8,414 20,386
Stewardship of environmental resources 5 27 23 212 105 239 129 456 343 405 281 862 623 1,105 752 523 232 6,196 3,642 5,271 17,721
Role of red meat in a healthy diet 259 202 259 202 241 140 122 125 362 265 621 467 91 45 712 1,937
Pillar 2: Market growth and diversification
Efficiency and value in trade and market access 44 28 162 212 975 240 1,137 251 1,428 413 240 294 1,669 534 2,849 516 2,422 59 155 188 105 1,214 8,042
Marketing and promoting Australian red meat and livestock
12 189 153 359 275 17,677 429 18,036 172 34,209 5,068 172 39,277 613 57,502 466 452 1,126 1,262 2,341 63,763
Pillar 3: Supply chain efficiency and integrity
Optimising product quality and cost efficiency 20 121 149 1,311 551 1,432 700 1,889 1,187 375 405 2,265 1,593 3,717 2,292 1,342 846 7,737 12,796 28,730
Guaranteeing product quality and systems integrity
8 23 38 107 148 294 186 401 291 849 99 593 390 1,442 583 1,866 443 1,061 18 47 5,449 2,158 12,737
Pillar 4: Productivity and profitability
Production efficiencies in farms and feedlots 571 407 4,878 5,285 5,243 16 1,670 11 6,913 27 12,769 27 16 1,832 12,799 25,584 53,027
Processing productivity 1,996 3,618 5,613 11,227
Live export productivity 26 11 93 28 118 39 99 258 99 258 217 297 217 115 434 1,281
Pillar 5: Leadership and collaborative culture
Building leadership capability 12 24 60 24 750 666 810 691 876 1,089 17 357 893 1,446 1,715 2,161 3,140 1 7,558 12,412 26,986
Protecting and promoting our industry 8 2 10 25 204 523 214 548 125 751 22 67 147 817 369 1,367 14 369 2,118
Pillar 6: Stakeholder engagement
Engagement with producers and stakeholders 20 8 36 148 964 2,313 1,001 2,461 731 4,381 149 743 880 5,124 1,901 7,593 166 23 547 30 2,097 12,357
AUS-MEAT 2 9 170 179 315 54 369 550 550
Total expenditure pre corporate services 663 317 1,147 1,080 10,241 23,752 11,388 24,832 11,412 46,327 3,821 8,207 15,233 54,534 27,283 79,683 8,717 4,235 792 923 17,190 42,623 79,415 260,860
Corporate services 35 19 57 67 607 1,282 664 1,349 510 2,352 213 411 723 2,763 1,421 4,131 5,930 1,421 12,903
Levy collection costs 3 1 4 4 43 84 47 88 36 155 15 27 51 182 100 271 148 100 619
Total expenditure 700 337 1,207 1,151 10,891 25,118 12,098 26,269 11,957 48,834 4,049 8,645 16,006 57,479 28,804 84,085 8,717 4,235 792 923 23,268 42,623 80,936 274,383
Income available:
Levies 331 208 1,211 1,368 10,073 24,635 11,283 26,003 11,840 47,036 3,741 7,683 15,581 54,719 27,195 80,930 108,125
Government 80,936 80,936
Processors 8,717 4,235 12,952
Live export 792 923 1,714
R&D partnerships 42,373 42,373
External 23,796 23,796
Total actual income 2018–19 331 208 1,211 1,368 10,073 24,635 11,283 26,003 11,840 47,036 3,741 7,683 15,581 54,719 27,195 80,930 8,717 4,235 792 923 23,796 42,373 80,936 269,897
Surplus/(deficit) -369 -129 3 217 -818 -483 -815 -266 -117 -1,798 -308 -962 -425 -2,760 -1,609 -3,155 528 250 -4,486
Income and expenditure by funding source 2018–19

Overview
Report to stakeholders
About
MLA
Financial report
Supporting inform
ation
73
Pillars and priorities Goat Mutton Lamb Total sheep Grassfed cattle Grainfed cattle Total cattle Total levy funds Processor LiveCorp External Govt. MLA*
R&D $000
M $000
R&D $000
M $000
R&D $000
M $000
R&D $000
M $000
R&D $000
M $000
R&D $000
M $000
R&D $000
M $000
R&D $000
M $000
R&D $000
M $000
R&D $000
M $000
R&D $000
M $000
R&D $000
Total $000
Pillar 1: Consumer and community support
Continuous improvement of the welfare of animals in our care
8 25 240 61 936 248 1,175 310 1,038 1,362 919 262 1,957 1,624 3,140 1,959 17 497 606 992 4,760 8,414 20,386
Stewardship of environmental resources 5 27 23 212 105 239 129 456 343 405 281 862 623 1,105 752 523 232 6,196 3,642 5,271 17,721
Role of red meat in a healthy diet 259 202 259 202 241 140 122 125 362 265 621 467 91 45 712 1,937
Pillar 2: Market growth and diversification
Efficiency and value in trade and market access 44 28 162 212 975 240 1,137 251 1,428 413 240 294 1,669 534 2,849 516 2,422 59 155 188 105 1,214 8,042
Marketing and promoting Australian red meat and livestock
12 189 153 359 275 17,677 429 18,036 172 34,209 5,068 172 39,277 613 57,502 466 452 1,126 1,262 2,341 63,763
Pillar 3: Supply chain efficiency and integrity
Optimising product quality and cost efficiency 20 121 149 1,311 551 1,432 700 1,889 1,187 375 405 2,265 1,593 3,717 2,292 1,342 846 7,737 12,796 28,730
Guaranteeing product quality and systems integrity
8 23 38 107 148 294 186 401 291 849 99 593 390 1,442 583 1,866 443 1,061 18 47 5,449 2,158 12,737
Pillar 4: Productivity and profitability
Production efficiencies in farms and feedlots 571 407 4,878 5,285 5,243 16 1,670 11 6,913 27 12,769 27 16 1,832 12,799 25,584 53,027
Processing productivity 1,996 3,618 5,613 11,227
Live export productivity 26 11 93 28 118 39 99 258 99 258 217 297 217 115 434 1,281
Pillar 5: Leadership and collaborative culture
Building leadership capability 12 24 60 24 750 666 810 691 876 1,089 17 357 893 1,446 1,715 2,161 3,140 1 7,558 12,412 26,986
Protecting and promoting our industry 8 2 10 25 204 523 214 548 125 751 22 67 147 817 369 1,367 14 369 2,118
Pillar 6: Stakeholder engagement
Engagement with producers and stakeholders 20 8 36 148 964 2,313 1,001 2,461 731 4,381 149 743 880 5,124 1,901 7,593 166 23 547 30 2,097 12,357
AUS-MEAT 2 9 170 179 315 54 369 550 550
Total expenditure pre corporate services 663 317 1,147 1,080 10,241 23,752 11,388 24,832 11,412 46,327 3,821 8,207 15,233 54,534 27,283 79,683 8,717 4,235 792 923 17,190 42,623 79,415 260,860
Corporate services 35 19 57 67 607 1,282 664 1,349 510 2,352 213 411 723 2,763 1,421 4,131 5,930 1,421 12,903
Levy collection costs 3 1 4 4 43 84 47 88 36 155 15 27 51 182 100 271 148 100 619
Total expenditure 700 337 1,207 1,151 10,891 25,118 12,098 26,269 11,957 48,834 4,049 8,645 16,006 57,479 28,804 84,085 8,717 4,235 792 923 23,268 42,623 80,936 274,383
Income available:
Levies 331 208 1,211 1,368 10,073 24,635 11,283 26,003 11,840 47,036 3,741 7,683 15,581 54,719 27,195 80,930 108,125
Government 80,936 80,936
Processors 8,717 4,235 12,952
Live export 792 923 1,714
R&D partnerships 42,373 42,373
External 23,796 23,796
Total actual income 2018–19 331 208 1,211 1,368 10,073 24,635 11,283 26,003 11,840 47,036 3,741 7,683 15,581 54,719 27,195 80,930 8,717 4,235 792 923 23,796 42,373 80,936 269,897
Surplus/(deficit) -369 -129 3 217 -818 -483 -815 -266 -117 -1,798 -308 -962 -425 -2,760 -1,609 -3,155 528 250 -4,486
*MDC expenditure of $94.2 million is included ($48.5 million unmatched)

74
The Board of Directors of Meat & Livestock Australia Limited (‘MLA’ or ‘the Company’) has pleasure in submitting its report for the financial year ended 30 June 2019.
Directors
The names and details of the company’s directors in office during the financial year and until the date of this report are as follows: Dr Michele Allan, Mr Jason Strong, Mr Alan Beckett, Mr Robert Fitzpatrick, Ms Erin Gorter, Mr Russell Lethbridge, Mr Andrew Michael, Professor Manny Noakes and Ms Jo Pye. All directors were in office for the entire year unless otherwise stated.
Retiring directors
The following directors retired during 2018–19: Mr Richard Norton and Mr Steven Chaur.
Company secretary
The company secretary during the year was Ms Clare Stanwix.
Subsidiaries
MLA Donor Company Limited
At 30 June 2019, the members of the board were Dr Michele Allan, Mr Jason Strong, Mr Alan Beckett, Ms Erin Gorter, Mr Robert Fitzpatrick, Mr Russell Lethbridge, Mr Andrew Michael, Professor Manny Noakes and Ms Jo Pye.
Integrity Systems Company Limited
At 30 June 2019, the members of the board were Dr Michele Allan, Mr Jason Strong, Mr Alan Beckett, Ms Erin Gorter, Mr Robert Fitzpatrick, Mr Russell Lethbridge, Mr Andrew Michael, Professor Manny Noakes and Ms Jo Pye.
Directors’ meetings
During the period 1 July 2018 to 30 June 2019, the MLA Board held six meetings of directors. The attendances of the directors at meetings of the Board and of its committees were:
Board of directors Committees of the Board of directors
Scheduled meetings Audit & Risk Remuneration
Michele Allan (Chair) 5 [6] 4 [4]
Jason Strong (Managing Director)
1 [1] 1 [1] 1 [1]
Alan Beckett 6 [6] 5 [5]
Erin Gorter 5 [6] 5 [5] 3 [4]
Robert Fitzpatrick 6 [6]
Russell Lethbridge 6 [6] 2 [2]
Andrew Michael 6 [6] 2 [2]
Manny Noakes 3 [3] 1 [1]
Jo Pye 3 [3] 1 [1]
Richard Norton 3 [3] 2 [3] 3 [3]
Steven Chaur 3 [3] 1 [3] 1 [2]
The number of meetings for which the director was eligible to attend is shown in brackets.
Selection Committee
During the year, the Selection Committee held four meetings. The current members of the Selection Committee and their attendance at meetings are listed below. The number of meetings for which the selection committee member was eligible to attend is shown in brackets.
MLA DirectorsMichele Allan (Chair) 4 [4]Alan Beckett 3 [4]
Peak council representativesAllan Piggott 2 [2]Howard Smith 3 [4]Tony Hegarty 2 [2]Tony Fitzgerald 2 [2]Therese Herbert 2 [2]Bryce Camm 0 [2]Jamie Heinrich 0 [2]
MLA member-elected representativesMick Hewitt 4 [4]Jane Kellock 4 [4]Peter Quinn 2 [2]
Principal activities
The major activities of Meat & Livestock Australia Ltd and its subsidiaries (the Group) during the financial year comprised:
• providing research and development support to the Australian red meat and livestock industry.
• providing marketing and promotion services to the Australian red meat and livestock industry both domestically and overseas.
There have been no significant changes in the nature of these activities during the year.
Directors’ report

Overview
Report to stakeholders
About
MLA
Financial report
Supporting inform
ation
75
Indemnification and insurance of directors and officers
Under its constitution, the Company may indemnify each director and each executive officer against any claim or any expenses or costs which may arise as a result of work performed in their respective capacities.
The Company paid an insurance premium in respect of a contract insuring all the directors, secretaries and executive officers of the group entities against all liabilities and expenses arising as a result of work performed in their respective capacities, to the extent permitted by law. The terms of that policy prohibit disclosure of the premium paid or the monetary limit of this indemnity.
Indemnification of auditors
To the extent permitted by law, the Company has agreed to indemnify its auditors, Ernst & Young Australia, as part of the terms of its audit engagement against claims by third parties arising from the audit (for an unspecified amount). No payment has been made to indemnify Ernst & Young during or since the financial year.
Rounding of accounts
The amounts contained in the financial report have been rounded to the nearest thousand dollars (where rounding is applicable) where noted ($000) under the option available to the Company under ASIC Corporation (Rounding in Financial/directors’ Reports) Instrument 2016/191. The company is an entity to which this legislative instrument applied.
Review and results of operations
Operating result for the period
The result of the Group for the financial year was a net deficit from continuing operations of $4,486,000 (2018: net surplus of $10,275,000). The deficit predominantly reflects the application of the MLA’s Levy Reserve Policy which required an increase in levy investment. Lower access fees received via MLA Donor Company also contributed to the result.
Group overview
The Group earned total revenue of $269,897,000 (2018: $272,454,000) which is comprised of the following:
• transaction levies $108,125,000 (2018: $106,412,000)
• research and development matching grants $80,936,000 (2018: $80,380,000)
• research and development contributions (unmatched) $8,915,000 (2018: $11,876,000)
• other income and revenues $71,921,000 (2018: $73,786,000).
Total income received/receivable was less than total expenditure, which resulted in a net deficit from continuing operations of $4,486,000 for the year.
Significant changes in the state of affairs
There were no significant changes in the state of affairs of the Group.
Significant events after the balance date
No significant events after balance date.
Environmental regulation and performance
The Group does not have a material exposure to any environmental regulations.
Registered office and principal place of business
Level 1, 40 Mount StreetNorth Sydney New South Wales 2060(02) 9463 9333
Auditor independence
The auditor’s independence declaration which forms part of the ‘Directors’ report’ for the financial year ended 30 June 2019 has been received and can be found following this report.
This report has been made in accordance with a resolution of directors.
Dr Michele AllanChair
Jason StrongManaging Director
24 September 2019
76
Auditor’s Independence Declaration to the Directors of Meat & Livestock Australia Limited
As lead auditor for the audit of Meat & Livestock Australia Limited for the financial year ended 30 June 2019, I declare to the best of my knowledge and belief, there have been:
a) no contraventions of the auditor independence requirements of the Corporations Act 2001 in relation to the audit; and
b) no contraventions of any applicable code of professional conduct in relation to the audit.
This declaration is in respect of Meat & Livestock Australia Limited and the entities it controlled during the financial year.
Ernst & Young
Rob LewisPartner
Sydney24 September 2019
to the Directors of Meat & Livestock Australia Limited
Auditor’s independence declaration

Overview
Report to stakeholders
About
MLA
Financial report
Supporting inform
ation
77
Year ended 30 June 2019 Note
Consolidated
2019$000
2018$000
CONTINUING OPERATIONS
REVENUES FROM CONTINUING OPERATIONS 3 269,897 272,454
EXPENDITURE FROM CONTINUING OPERATIONS
Consumer and community support 40,043 38,104
Market growth and diversification 71,805 67,054
Supply chain efficiency and integrity 41,467 35,723
Productivity and profitability 65,534 73,614
Leadership and collaborative culture 29,104 26,323
Stakeholder engagement 12,357 8,290
AUS-MEAT 550 550
Corporate cost 13,523 12,521
Total expenditure 274,383 262,179
NET (DEFICIT)/SURPLUS FROM CONTINUING OPERATIONS (4,486) 10,275
TOTAL CHANGE IN MEMBERS’ FUNDS (4,486) 10,275
The accompanying notes form an integral part of this ‘Income statement’.
Year ended 30 June 2019
Consolidated
2019$000
2018$000
NET (DEFICIT)/SURPLUS FROM CONTINUING OPERATIONS (4,486) 10,275
OTHER COMPREHENSIVE INCOME
Items that may be subsequently reclassified to the ‘Income statement’
Cash flow hedges:
Gain/(loss) taken to equity 157 408
Transferred to ‘Statement of comprehensive income’ (408) 420
Other comprehensive income/(expense) for the year (251) 828
TOTAL COMPREHENSIVE (DEFICIT)/INCOME FOR THE YEAR (4,737) 11,103
The accompanying notes form an integral part of this ‘Statement of comprehensive income’.
Income statement
Statement of comprehensive income

78
As at 30 June 2019 Note
Consolidated
2019$000
2018 $000
CURRENT ASSETS
Cash and short-term deposits 24 158,236 161,714
Trade and other receivables 7 41,314 41,943
Prepayments and deposits 8 1,916 1,884
TOTAL CURRENT ASSETS 201,466 205,541
NON-CURRENT ASSETS
Property, plant and equipment 12 3,170 3,194
Intangible assets 13 2,965 2,224
Other financial assets 14 1,079 1,640
TOTAL NON-CURRENT ASSETS 7,214 7,058
TOTAL ASSETS 208,680 212,599
CURRENT LIABILITIES
Trade and other payables 15 61,617 53,679
Provisions 16 2,068 2,054
Other liabilities 17 18,315 24,791
TOTAL CURRENT LIABILITIES 82,000 80,524
NON-CURRENT LIABILITIES
Other payables 18 1,882 2,320
Provisions 19 1,589 1,809
TOTAL NON-CURRENT LIABILITIES 3,471 4,129
TOTAL LIABILITIES 85,471 84,653
NET ASSETS 123,209 127,946
EQUITY – MEMBERS’ FUNDS
Contributed equity 27 9,031 9,031
Retained surplus 114,021 118,507
Cash flow hedge reserve 20 157 408
TOTAL EQUITY – MEMBERS’ FUNDS 123,209 127,946
The accompanying notes form an integral part of this ‘Statement of financial position’.
Statement of financial position

Overview
Report to stakeholders
About
MLA
Financial report
Supporting inform
ation
79
Year ended 30 June 2019 Contributed
equity$000
Consolidated
Retained earnings
$000
Cash flow hedge reserve
$000
Total
$000
At 1 July 2017 9,031 108,232 (420) 116,843
Surplus for the year – 10,275 10,275
Other comprehensive income – – 828 828
Total comprehensive income – 10,275 828 11,103
At 30 June 2018 9,031 118,507 408 127,946
Deficit for the year – (4,486) (4,486)
Other comprehensive (loss) – – (251) (251)
Total comprehensive (loss) – (4,486) (251) (4,737)
At 30 June 2019 9,031 114,021 157 123,209
The accompanying notes form an integral part of this ‘Statement of changes in equity’.
Year ended 30 June 2019 Note
Consolidated
2019$000
2018$000
CASH FLOWS FROM OPERATING ACTIVITIES
Levies collected 113,051 115,607
Research and development matching grants 79,125 78,070
Receipts from processors and live exporters 13,690 16,010
Other receipts 73,829 73,865
Payments to suppliers and employees (284,569) (273,920)
NET CASH FLOWS FROM OPERATING ACTIVITIES 24(b) (4,874) 9,632
CASH FLOWS FROM INVESTING ACTIVITIES
Proceeds from disposal of property, plant and equipment 140 77
Purchase of property, plant and equipment (1,214) (652)
Purchase of software 13 (1,785) (831)
Interest received 4,255 3,649
NET CASH FLOWS FROM INVESTING ACTIVITIES 1,396 2,243
NET (DECREASE)/INCREASE IN CASH HELD (3,478) 11,875
Add opening cash brought forward 161,714 149,839
CLOSING CASH CARRIED FORWARD 24(a) 158,236 161,714
The accompanying notes form an integral part of this ‘Statement of cash flows’.
Statement of changes in equity
Statement of cash flows

80
1. CORPORATE INFORMATION
The financial report of Meat & Livestock Australia Limited and its subsidiaries (‘the Group’) for the year ended 30 June 2019 was authorised for issue in accordance with a resolution of the directors on 24 September 2019.
MLA has prepared a consolidated financial report incorporating the Company and the entities that it controlled during the financial year.
MLA is a company limited by guarantee incorporated in Australia.
The nature of the operations and principal activities of the Group are described in the ‘Directors’ report’.
2. SUMMARY OF SIGNIFICANT ACCOUNTING POLICIES
(a) Basis of preparation
The financial report is a general-purpose financial report, which has been prepared in accordance with the requirements of the Corporations Act 2001, Australian Accounting Standards and other authoritative pronouncements of the Australian Accounting Standards Board. The financial report has also been prepared on a historical cost basis except for derivative financial instruments which have been measured at fair value.
The financial report is presented in Australian dollars and all values are rounded to the nearest thousands ($000).
(b) Statement of compliance
The principal accounting policies adopted in the preparation of the financial statements are set out below. These policies have been consistently applied to all the years presented, unless otherwise stated.
New, revised or amending Accounting Standards and Interpretations adopted
The Group has adopted all of the new, revised or amending Accounting Standards and Interpretations issued by the Australian Accounting Standards Board (‘AASB’) that are mandatory for the current reporting period.
Australian Accounting Standards and Interpretations that have recently been issued or amended but are not yet mandatory, have not been early adopted by the Group for the annual reporting period ended 30 June 2019. The Group’s assessment of the impact of these new or amended Accounting Standards and Interpretations, most relevant to the Group, are set out below.
• AASB 16 Leases
This standard is applicable to MLA from the year ending 30 June 2020 and requires lessees to account for all leases under a single on-balance sheet model
in a similar way to finance leases under AASB 117 Leases. The standard includes two recognition exemptions for lessees - leases of ‘low-value’ assets (e.g. personal computers) and short-term leases (i.e. leases with a lease term of 12 months or less). At the commencement date of a lease, a lessee will recognise a liability to make lease payments (i.e. the lease liability) and an asset representing the right to use the underlying asset during the lease term (i.e. the right-of-use asset). Lessees will be required to separately recognise the interest expense on the lease liability and the depreciation expense on the right-of-use asset.
• AASB 1058 and AASB 2016-8 Income of Not-for-Profit Entities
This standard will apply to MLA from the year ending 30 June 2020 and will defer income recognition in some circumstances for not-for-profit entities, particularly where there is a performance obligation or any other liability. In addition, certain components in an arrangement, such as donations, may be separated from other types of income and recognised immediately. The Standard also expands the circumstances in which not-for-profit entities are required to recognise income for goods and services received for consideration that is significantly less than the fair value of the asset principally to enable the entity to further its objectives (discounted goods and services), including for example, peppercorn leases.
(c) Principles of consolidation
The consolidated financial statements comprise the financial statements of MLA and its subsidiaries (the Group) as at 30 June 2019 (as outlined in Note 10). Controls are achieved where the Group has power over the investee, exposure, or rights to variable returns from its involvement with the investee and the ability to use its power to affect its returns. The results of subsidiaries acquired or disposed during the year are included in the ‘Consolidated income statement’ and ‘Statement of comprehensive income’ from the effective date of acquisition or up to the effective date of disposal, as appropriate.
The financial statements of the subsidiaries are prepared for the same reporting period as the Group, using consistent accounting policies. All intercompany balances and transactions have been eliminated in full.
(d) Cash and short-term deposits
Cash on hand and in banks and short-term deposits are stated at nominal value.
For the purposes of the consolidated statement of cash flows’ cash and cash equivalents includes cash on hand and in banks, and money market investments readily convertible to cash within two working days, net of outstanding bank overdrafts.
(e) Trade and other receivables
Trade receivables are recognised and carried at original invoice amount less a provision for any uncollectible debts. An estimate for doubtful debts is made when there is objective evidence that the Group will not be able to collect the debt. Bad debts are written-off as incurred.
(f) Taxes
Income tax
The Group is exempt from income tax under section 50–40 of the Income Tax Assessment Act 1997.
Goods and Services Tax (GST)
Revenue, expenses and assets are recognised net of the amount of GST except:
• Where GST incurred on a purchase of goods and services is not recoverable from the taxation authority, in which case the GST is recognised as part of the cost of acquisition of the asset or as part of the expense item as applicable.
• Receivables and payables (except accrued income and expenditure) are stated with the amount of GST included.
The net amount of GST recoverable from, or payable to, the taxation authority is included as part of receivables or payables in the ‘Statement of financial position’.
Cash flows are included in the ‘Statement of cash flows’ on a gross basis and the GST component of cash flows arising from investing activities, which is recoverable from or payable to the taxation authority are classified as operating cash flows.
Commitments and contingencies are disclosed net of the amount of GST recoverable from, or payable to, the taxation authority.
(g) Revenue recognition
Revenue is recognised to the extent that it is probable that the economic benefits will flow to the Group and the revenue can be reliably measured. Revenue, trade debtors and accrued revenue are recognised for the major business activities as follows:
• Transaction levies – revenue is recognised in the period to which it relates based on confirmations received from the Levies and Revenue Service who collect and distribute levies to the Company.
• Research and development Commonwealth-matching payments – revenue is recognised for the matching funding from the Australian government to the extent that the entity obtains control of the funding, it is probable that the economic benefits comprising the funding will flow to the entity and the funding can be measured reliably. These conditions are considered to be met when approved eligible research and development expenditure has been incurred. Accrued
Notes to the financial statements

Overview
Report to stakeholders
About
MLA
Financial report
Supporting inform
ation
81
matching payments represent unclaimed funding for the amount incurred on research and development.
• Research and development contributions (unmatched) – the company receives funding from various external parties (including the Department of Agriculture and the Australian Government) to conduct collaborative research and development programs. Revenue is recognised when the company obtains control of the contribution or the right to receive the contribution based on conditions around expenditure incurred.
• Research and development, processor and live exporter contributions are recognised as revenue when the company obtains control of the contribution or the right to receive the contribution when it is probable that the economic benefits comprising the funding will flow to the entity and the funding can be measured reliably. These conditions are considered to be met based on conditions around expenditure incurred.
• Interest income is taken up as income on an accrual basis.
• Government grants are recognised when the Group obtains control of the grant or the right to receive the grant, which is considered to occur when all attaching conditions have been met. The grant received or receivable will be recognised as income when it is probable that the economic benefits of the grant will flow to the entity and the amount of the grant can be measured reliably.
(h) Derivative financial instruments and hedging
The Group uses derivative financial instruments such as forward currency contracts and options contracts to hedge against the risks associated with foreign currency fluctuations. These contracts are initially recognised at fair value on the date they are entered into and are subsequently remeasured to fair value. Derivatives are carried as assets when their fair value is positive and as liabilities when their fair value is negative.
Any gains or losses arising from changes in the fair value of derivatives, except for those that qualify as cash flow hedges, are taken directly to net surplus or deficit for the year.
The fair value of forward currency contracts is calculated by reference to current forward exchange rates for contracts with similar maturity profiles.
For the purposes of hedge accounting, hedges are classified as cash flow hedges when they hedge exposure to variability in cash flows that is attributable either to a particular risk associated with a recognised asset or liability or to a forecast transaction.
A hedge of the foreign currency risk of a firm commitment is accounted for as a cash flow hedge.
At the inception of a hedge relationship, the Group formally designates and documents the hedge relationship to which the Group wishes to apply hedge accounting and the risk management objective and strategy for undertaking the hedge. The documentation includes identification of the hedging instrument, the hedged item, the nature of the risk being hedged and how the Group will assess whether the hedging relationship meets the hedge effectiveness requirements (including the analysis of sources of hedge ineffectiveness and how the hedge ratio is determined).
A hedging relationship qualifies for hedge accounting if it meets all of the following effectiveness requirements:
• There is ‘an economic relationship’ between the hedged item and the hedging instrument.
• The effect of credit risk does not ‘dominate the value changes’ that result from that economic relationship.
• The hedge ratio of the hedging relationship is the same as that resulting from the quantity of the hedged item that the Group actually hedges and the quantity of the hedging instrument that the Group actually uses to hedge that quantity of hedged item.
Hedges that meet the strict criteria for hedge accounting are accounted for as follows:
Cash flow hedges
Cash flow hedges are hedges of the Group’s exposure to variability in cash flows that is attributable to a particular risk associated with a recognised asset or liability or a highly probable forecast transaction and that could affect the surplus or deficit. The effective portion of the gain or loss on the hedging instrument is recognised directly in equity while the ineffective portion is recognised in the ‘Statement of comprehensive income’.
Amounts taken to equity are transferred to the ‘Statement of comprehensive income’ when the hedged transaction affects the surplus or deficit, such as when hedged income or expenses are recognised or when a forecast sale or purchase occurs. When the hedged item is the cost of a non-financial asset or liability, the amounts taken to equity are transferred to the initial carrying amount of the non-financial asset or liability.
If the forecast transaction is no longer expected to occur, amounts previously recognised in equity are transferred to the ‘Statement of comprehensive income’. If the hedging instrument expires or is sold, terminated or exercised without replacement or rollover, or if its designation as a hedge is revoked, amounts previously recognised in equity remain in equity until the forecast
transaction occurs. If the related transaction is not expected to occur, the amount is taken to the ‘Statement of comprehensive income’.
Financial assets and financial liabilities are offset and the net amount is reported in the consolidated statement of financial position if there is a currently enforceable legal right to offset the recognised amounts and there is an intention to settle on a net basis, to realise the assets and settle the liabilities simultaneously.
(i) Foreign currency translation
Both the functional and presentation currency of the Company and its subsidiaries is Australian dollars ($). For each entity, the Group determines its own functional currency and items included in the financial statements of each entity are measured using that functional currency.
Transactions in foreign currencies are initially recorded in the functional currency by applying the budget exchange rate and subsequently revaluing it to the average exchange rate of the month. Monetary assets and liabilities denominated in foreign currencies are retranslated at the rate of exchange ruling at the balance sheet date.
All exchange differences in the consolidated financial report are taken to the ‘Income statement’. Non-monetary items that are measured in terms of historical cost in a foreign currency are translated using the exchange rates at the dates of the initial transactions. Non-monetary items measured at fair value in a foreign currency are translated using the exchange rates at the date when the fair value is determined. The gain or loss arising on translation of non-monetary items measured at fair value is treated in line with the recognition of the gain or loss on the change in fair value of the item.
(j) Impairment of assets
The Group assesses at each reporting date whether there is an indication that an asset may be impaired. If any such indication exists, or when annual impairment testing for an asset is required, the Group makes an estimate of the asset’s recoverable amount. When the carrying amount of an asset exceeds its recoverable amount, the asset is considered impaired and is written down to its recoverable amount.
(k) Intangible assets
Intangible assets acquired are initially measured at cost. Following initial recognition, intangible assets are carried at cost less any accumulated amortisation and any accumulated impairment losses.
The useful lives of intangible assets are assessed to be either finite or indefinite. Intangible assets with finite lives are amortised over the useful economic life and

82
assessed for impairment whenever there is an indication that the intangible asset may be impaired. The amortisation period and the amortisation method for an intangible asset with a finite useful life are reviewed at least at each financial year-end. Changes in the expected useful life or the expected pattern of consumption of future economic benefits embodied in the asset are accounted for by changing the amortisation period or method, as appropriate, which is a change in accounting estimate. The amortisation expense on intangible assets with finite lives is recognised in the Income statement in the expense category consistent with the function of the intangible asset.
Intangibles are amortised as follows:
Computer software 1–5 years
(l) Leases
Leases are classified at their inception as either operating or finance leases based on the economic substance of the agreement so as to reflect the risks and benefits incidental to ownership. The minimum lease payments of operating leases, where the lessor effectively retains substantially all of the risks and benefits of ownership of the leased item, are recognised as an expense on a straight-line basis.
The cost of improvements to or on leasehold property is capitalised, disclosed as leasehold improvements, and amortised over the unexpired period of the lease or the estimated useful lives of the improvements, whichever is the shorter, if there is no certainty the Group will obtain ownership by the end of the lease.
(m) Property, plant and equipment
Cost
All classes of property, plant and equipment are measured at cost, net of accumulated depreciation and accumulated impairment losses if any.
Depreciation
Depreciation is provided on a straight-line basis on all property, plant and equipment.
Life
Leasehold improvements Remaining term of lease
Plant and equipment 2–5 years
Furniture and fittings 3–5 years
The assets’ residual values, useful lives and amortisation methods are reviewed and adjusted, if appropriate at each financial year end.
Derecognition and disposal
An item of property, plant and equipment is derecognised upon disposal or when no further future economic benefits are expected from its use or disposal.
reporting date using the projected unit credit method. Consideration is given to expected future wage and salary levels, experience of employee departures and periods of service. Expected future payments are discounted using market yields at the reporting date on corporate bonds with terms to maturity and currency that match, as closely as possible, the estimated future cash outflows.
(s) Fit-out contribution and rent-free period
The Company negotiated the lease of new premises in North Sydney in April 2013 which included incentives that involved a combination of a fit-out contribution and rent-free period. The benefit of these incentives are being amortised on a straight-line basis over the ten years and five months lease term.
(t) Investment in associate
The Group’s investment in its associate is accounted for using the equity method of accounting in the consolidated financial statements. The associate is an entity over which the Group has significant influence and that are neither subsidiaries nor joint ventures.
Under the equity method, investment in the associate is carried in the consolidated statement of financial position at cost plus post-acquisition changes in the Group’s share of net assets of the associates. After application of the equity method, the Group determines whether it is necessary to recognise any impairment loss with respect to the Group’s net investment in associates.
Pursuant to the constitution of the associate (AUS-MEAT), the Group has no entitlement to a share of the associate’s net results. The Group is also not entitled to the net assets of the associate except in the event of a winding up of the associate.
The reporting dates of the associate and the Group are identical and the associate’s accounting policies conform to those used by the Group for like transactions and events in similar circumstances.
Interests in associated entities are included in non-current assets at the recoverable amount. Detailed equity accounting information concerning the Group’s material interests in its associate is provided in Note 10.
(u) Leasehold make good provision
The Company has entered into a number of office premises lease agreements which include make good clauses. A make good clause requires the Company to restore the premises to its original condition at the conclusion of the lease. The provision has been calculated as the present value of the expected cost, which has been based on management’s best estimate.
Any gain or loss arising on derecognition of the asset (calculated as the difference between the net disposal proceeds and the carrying amount of the asset) is included in the income statement in the year the asset is derecognised.
(n) Trade and other payables
Liabilities for trade and other payables are carried at amortised cost, which is the fair value of consideration to be paid in the future for goods and services received prior to the end of the financial year and which are unpaid. These amounts are unsecured and will be paid when due.
(o) Financial liabilities
Financial liabilities are classified, at initial recognition, as financial liabilities at fair value through profit or loss, loans and borrowings, payables, or as derivatives designated as hedging instruments in an effective hedge, as appropriate.
(p) Provisions
Provisions are recognised when the Group has a present obligation (legal or constructive) as a result of a past event, it is probable that an outflow of resources embodying economic benefits will be required to settle the obligation and a reliable estimate can be made of the amount of the obligation. The expense relating to a provision is presented in the statement of profit or loss net of any reimbursement.
(q) Unearned income
Unearned income consists of funds which have been received or invoiced but income recognition has been deferred to future years because the project milestones have not been met or the expenditure to which they relate has not been incurred.
(r) Employee benefits
Provision is made for employee benefits accumulated as a result of employees rendering services up to the reporting date. These benefits include wages and salaries, annual leave, long service leave and other employee benefits.
Short-term employee benefits
Liabilities for wages and salaries, including non-monetary benefits, annual leave and long service leave expected to be settled wholly within 12 months of the reporting date are measured at the amounts expected to be paid when the liabilities are settled.
Other long-term employee benefits
The liability for annual leave and long service leave not expected to be settled within 12 months of the reporting date are measured as the present value of expected future payments to be made in respect of services provided by employees up to the

Overview
Report to stakeholders
About
MLA
Financial report
Supporting inform
ation
83
(v) Current versus non-current classification
The Group presents assets and liabilities in the statement of financial position based on current/non-current classification. An asset is current when it is:
• expected to be realised or intended to be sold or consumed in the normal operating cycle
• held primarily for the purpose of trading
• expected to be realised within twelve months after the reporting period.
A liability is current when:
• it is expected to be settled in the normal operating cycle
• it is held primarily for the purpose of trading
• it is due to be settled within twelve months after the reporting period
Or
• there is no unconditional right to defer the settlement of the liability for at least 12 months after the reporting period.
The Group classifies all other liabilities as non-current.
Notes
Consolidated
2019$000
2018 $000
3. REVENUE FROM CONTINUING OPERATIONS
Revenues from operating activities
Transaction levies 4 108,125 106,412
R&D Commonwealth-matching payments 80,936 80,380
R&D contributions (unmatched) 8,915 11,876
Other income 5 68,152 69,634
Total revenues from operating activities 266,128 268,302
Revenues from non-operating activities
Bank interest 3,769 4,152
Total revenues from non-operating activities 3,769 4,152
Total revenues from continuing operations 269,897 272,454
4. TRANSACTION LEVIES
Transaction levies:
– grainfed cattle 11,424 11,328
– grassfed cattle 58,876 55,277
– lambs 34,708 36,594
– sheep 2,579 2,505
– goats 538 708
Total transaction levies 108,125 106,412
5. OTHER INCOME
Processor contributions 10,871 13,761
Live exporter contributions 1,714 1,314
Co-operative funding 2,994 734
R&D partnership income 39,986 41,179
Sale of products or services 7,874 5,421
Other 4,713 7,225
Total other income 68,152 69,634
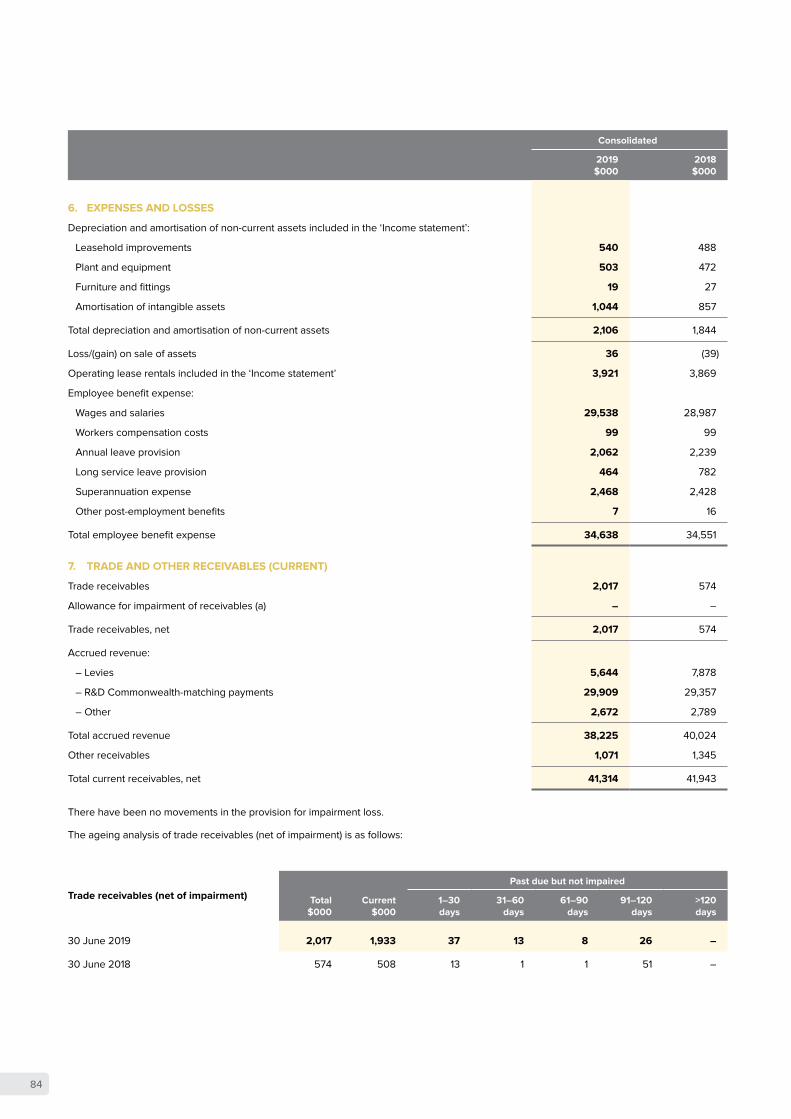
84
Consolidated
2019$000
2018 $000
6. EXPENSES AND LOSSES
Depreciation and amortisation of non-current assets included in the ‘Income statement’:
Leasehold improvements 540 488
Plant and equipment 503 472
Furniture and fittings 19 27
Amortisation of intangible assets 1,044 857
Total depreciation and amortisation of non-current assets 2,106 1,844
Loss/(gain) on sale of assets 36 (39)
Operating lease rentals included in the ‘Income statement’ 3,921 3,869
Employee benefit expense:
Wages and salaries 29,538 28,987
Workers compensation costs 99 99
Annual leave provision 2,062 2,239
Long service leave provision 464 782
Superannuation expense 2,468 2,428
Other post-employment benefits 7 16
Total employee benefit expense 34,638 34,551
7. TRADE AND OTHER RECEIVABLES (CURRENT)
Trade receivables 2,017 574
Allowance for impairment of receivables (a) – –
Trade receivables, net 2,017 574
Accrued revenue:
– Levies 5,644 7,878
– R&D Commonwealth-matching payments 29,909 29,357
– Other 2,672 2,789
Total accrued revenue 38,225 40,024
Other receivables 1,071 1,345
Total current receivables, net 41,314 41,943
There have been no movements in the provision for impairment loss.
The ageing analysis of trade receivables (net of impairment) is as follows:
Trade receivables (net of impairment) Total
$000Current
$000
Past due but not impaired
1–30 days
31–60 days
61–90 days
91–120 days
>120 days
30 June 2019 2,017 1,933 37 13 8 26 –
30 June 2018 574 508 13 1 1 51 –

Overview
Report to stakeholders
About
MLA
Financial report
Supporting inform
ation
85
7. TRADE AND OTHER RECEIVABLES (CURRENT) (continued)
(a) Allowance for impairment of receivables
A provision for impairment loss is recognised when there is objective evidence that a trade receivable is individually impaired (refer Note 2(e)). Financial difficulties of the debtor or defaulting in payments are considered objective evidence of impairment.
Receivables past due but not impaired are: $84,000 (2018: $66,000). Each business unit has been in contact with the relevant debtor and is satisfied that payment will be received in full. Other balances within trade and other receivables do not contain impaired assets and are not past due. It is expected these balances will be received when due.
(b) Interest rate risk
Trade debtors, R&D matching grants, levies and other accrued revenue are non-interest bearing and generally on 14–30-day terms.
(c) Security
The Group does not hold any collateral or security on trade receivables.
(d) Credit risk
The carrying value at the reporting date approximate the fair value for each class of receivable. Details regarding credit risk exposure are disclosed in Note 28 (iii).
Consolidated
2019$000
2018 $000
8. PREPAYMENTS AND DEPOSITS
Prepayments 1,177 1,136
Deposits 600 586
Inventory 139 162
Total prepayments and deposits 1,916 1,884
9. INVESTMENT IN ASSOCIATE
Unlisted:
AUS-MEAT Limited – –
AUS-MEAT Limited became an associated entity in 1998–99 and is jointly owned (50% each) by MLA and Australian Meat Processor Corporation Limited.
AUS-MEAT Limited is an independent company limited by guarantee with operations split into two principal areas, the Standards division and the Services division. It is incorporated in Australia.
MLA has a continuing commitment to support AUS-MEAT Limited. The contribution for the financial year ended 30 June 2019 was $550,000 (2018: $550,000).
Summary results of the associate entity
AUS-MEAT Limited
2019$000
2018 $000
Revenue 18,390 16,861
Accumulated surplus at beginning of the year 5,331 4,632
Net surplus for the year 229 699
Accumulated surplus at end of the year 5,560 5,331
Financial summary of associated entity
Total current assets 11,014 10,746
Total non-current assets 3,736 3,361
Total current liabilities 4,032 3,734
Total non-current liabilities 308 192
Net assets 10,410 10,181
The investment in AUS-MEAT Limited has been taken up at nil value (2018: $nil). There is no entitlement to a share of the net results or net assets except in the event of a winding up of the entity.

86
10. INVESTMENTS IN SUBSIDIARIES
The consolidated financial statements include the financial statements of MLA and the subsidiaries listed in the following table..
Name
Equity interest %
Investment $000
2019 2018 2019 2018
a) MLA Donor Company Limited 100 100 – –
b) Integrity Systems Company Limited 100 100 – –
– –
a) MLA Donor Company Limited was incorporated in Australia on 6 August 1998 and is limited by guarantee. If the company is wound up, its Constitution states that MLA is required to contribute a maximum of $5 towards meeting any outstanding obligations of the company.
b) Integrity Systems Company Limited (formerly known as National Livestock Identification System) was incorporated in Australia on 24 December 2008 and is limited by guarantee. If the company is wound up, its Constitution states that MLA is required to contribute a maximum of $5 towards meeting any outstanding obligations of the company.
11. PARENT ENTITY INFORMATION
Information relating to Meat & Livestock Australia Ltd2019$000
2018 $000
Current assets 192,107 195,108
Total assets 198,158 202,100
Current liabilities 76,152 74,207
Total liabilities 79,439 78,094
Contributed equity 9,031 9,031
Reserves 157 408
Total equity – Members’ funds 109,530 114,567
(Deficit)/surplus for the year (4,764) 8,098
Other comprehensive gain/(loss) for the year 157 408
As at balance date, the parent entity has not entered into any material contractual commitments for the acquisition of property, plant or equipment other than as noted in the financial statements.

Overview
Report to stakeholders
About
MLA
Financial report
Supporting inform
ation
87
Consolidated
2019$000
2018 $000
12. PROPERTY, PLANT AND EQUIPMENT
Plant and equipment
At cost 6,512 6,285
Accumulated depreciation (5,548) (5,570)
Total plant and equipment 964 715
Furniture and fittings
At cost 259 323
Accumulated depreciation (198) (233)
Total furniture and fittings 61 90
Leasehold improvements
At cost 5,978 5,716
Accumulated depreciation (3,833) (3,327)
Total leasehold improvements 2,145 2,389
Total property, plant and equipment
At cost 12,749 12,324
Accumulated depreciation (9,579) (9,130)
Total written down value 3,170 3,194
Reconciliations of the carrying amounts of property, plant and equipment at the beginning and end of the current financial year:
Plant and equipment
Carrying amount at beginning 715 826
Additions 767 405
Disposals (15) (26)
Depreciation expense (503) (490)
964 715
Furniture and fittings
Carrying amount at beginning 90 74
Additions 14 46
Disposals (24) (3)
Depreciation expense (19) (27)
61 90
Leasehold improvements
Carrying amount at beginning 2,389 2,673
Additions 433 201
Disposals (137) (9)
Depreciation expense (540) (476)
2,145 2,389

88
Consolidated
2019$000
2018 $000
13. INTANGIBLE ASSETS
Software
At cost 11,331 9,547
Accumulated amortisation (8,366) (7,323)
Total software 2,965 2,224
Reconciliation
Carrying amount at beginning 2,224 2,294
Additions 1,785 831
Amortisation expense (1,044) (901)
2,965 2,224
14. OTHER FINANCIAL ASSETS
Other financial assets consist of restricted cash which relates to cash held as rental bonds in bank account which is pledged as collateral to landlords for risks retained by the group.
Total other financial assets 1,079 1,640
1,079 1,640
15. TRADE AND OTHER PAYABLES (CURRENT)
Trade payables (a) 13,585 28,135
Accrued R&D and other creditors (a) 45,070 22,802
Rent-free period (refer Note 2q) 565 535
Derivative financial instruments (b) (157) (408)
Employee entitlements:
– annual leave 2,088 2,215
– other 466 400
Total current trade and other payables 61,617 53,679
(a) Trade payables, accrued R&D and other creditors are non-interest bearing and are normally settled on 30-day terms. In the case of accrued R&D, any payments are further subject to milestones being satisfactorily completed.
(b) Pursuant to Note 2(h), the Group remeasured to fair value its outstanding forward currency and option contracts as at year end.
16. PROVISIONS (CURRENT)
Long service leave 2,000 1,948
Leasehold make good 68 106
Total current other liabilities 2,068 2,054
Long service leave $000
Leasehold make good
$000Total
$000
Carrying amount at the beginning of the financial year 1,948 106 2,054
Additional provisions (134) (106) (240)
Utilised (107) – (107)
Amounts transferred from/(to) non-current during the year 293 68 361
Carrying amount at the end of the financial year 2,000 68 2,068

Overview
Report to stakeholders
About
MLA
Financial report
Supporting inform
ation
89
Consolidated
2019$000
2018 $000
17. OTHER LIABILITIES (CURRENT)
Unearned income 17,458 24,168
Other 857 623
Total current other liabilities 18,315 24,791
18. OTHER PAYABLES (NON-CURRENT)
Fit-out contribution and rent-free period (refer note 2q) 1,882 2,320
Total non-current other payables 1,882 2,320
19. PROVISIONS (NON-CURRENT)
Long service leave 1,132 1,289
Leasehold make good 457 520
Total non-current provisions 1,589 1,809
Consolidated
Movements in provisions:
Long service leave $000
Leasehold make good
$000Total
$000
Carrying amount at the beginning of the financial year 1,289 520 1,809
Additional provisions 136 5 141
Utilised – – –
Amounts transferred (from)/to current during the year (293) (68) (361)
Carrying amount at the end of the financial year 1,132 457 1,589
Consolidated
20. CASH FLOW HEDGE RESERVE2019$000
2018 $000
At the beginning of the financial year 408 (420)
Net surplus on cash flow hedges 157 408
Transfer of cash flow hedge reserve to ‘Statement of comprehensive income’ (408) 420
Total cash flow hedge reserve (a) 157 408
(a) The full amount of hedged cash flows as at 30 June 2019 are expected to affect the ‘Statement of comprehensive income’ within one year.
As at 30 June 2019, the Company did not have any portion of cash flow hedges deemed ineffective.
21. EMPLOYEE ENTITLEMENTS
The aggregate employee benefit liability is comprised of:
Provisions – current (refer Note 16) 2,000 1,948
Provisions – non-current (refer Note 19) 1,132 1,289
Payables – current (refer Note 15) 2,554 2,615
5,686 5,852

90
Consolidated
2019$
2018 $
22. REMUNERATION OF AUDITORS
Amounts received or due and receivable by Ernst & Young for:
• auditing or reviewing of the financial report of the entity and any other entity in the consolidated entity 195,082 189,520
• other services in relation to the entity and any other entity in the consolidated entity:
– tax compliance – 9,900
– other non-audit services 45,320 53,859
240,402 253,279
23. DIRECTOR AND EXECUTIVE DISCLOSURES
(a) Details of key management personnel (KMP)
(i) DirectorsMichele Allan ChairJason Strong (Managing Director – appointed 25 March 2019)Alan BeckettRobert FitzpatrickErin GorterAndrew MichaelRussell LethbridgeManny Noakes (appointed 21 November 2018)Jo Pye (appointed 21 November 2018)Richard Norton (Managing Director – resigned 7 December 2018)Steven Chaur (resigned 21 November 2018)
(ii) ExecutivesMichael Finucan General Manager – International Markets Michael Crowley General Manager – Producer Consultation and Adoption Clare Stanwix General Counsel and Company SecretaryJane Weatherley Chief Executive Officer – Integrity Systems CompanyLisa Sharp Chief Marketing and Communications Officer Andrew Ferguson Chief Financial Officer Sean Starling General Manager – MDC, Research, Development and Innovation

Overview
Report to stakeholders
About
MLA
Financial report
Supporting inform
ation
91
Notes
Consolidated
2019$
2018 $
23. DIRECTOR AND EXECUTIVE DISCLOSURES (continued)
(iii) Compensation of key management personnel by categories
Directors (a)
Short-term benefits 1,181,834 1,466,252
Post-employment benefits 70,542 81,084
Other long-term benefits 915 24,466
(a) 1,253,291 1,571,802
Executives (b)
Short-term benefits 2,644,578 3,010,078
Post-employment benefits 143,756 153,671
Other long-term benefits 52,446 95,873
(b) 2,840,780 3,259,622
(a) Compensation includes all benefits paid, payable or provided by the entity, or on behalf of the entity, in exchange for services rendered to the entity. Compensation includes wages, salaries, superannuation and other employees’ provisions.
(b) Executive compensation refers to all compensation earned by the General Managers of the Company with the exception of the Managing Director whose compensation has been included under Directors’ compensation.
(b) Related party transactions
Directors of the Group and directors of its related parties, or their director-related entities, conduct transactions with entities within the Group that occur within a normal employee, customer or supplier relationship on terms and conditions no more favourable than those which it is reasonable to expect the entity would have adopted if dealing with the director or director-related entity at arm’s length in similar circumstances. These transactions include the following and have been quantified below where the transactions are considered likely to be of interest to users of these financial statements:
• Dr Michele Allan is Chancellor of Charles Sturt University which invoiced the Company $1,277,087 (2018: $6,296,393) for various R&D projects including ‘Creating a dairy beef supply chain’ and ‘Quantifying the cost of disease in feedlots’. The company has invoiced Charles Sturt University $864,470 (2018: $777,841) for Rural R&D for Profit programs relating to Foot and Mouth Disease (FMD) and dung beetles ecosystem engineers, as well as reducing induction stress in the Australian feedlot system. Dr Allan is a Director of CSIRO which invoiced the company $6,976,300 (2018: $8,315,468) for various R&D projects including Rural R&D for Profit programs such as ‘FMD ready’ and ‘Phosphorous efficiency’, and also ‘Welfare benchmarking and management for the beef cattle and sheep meat industries’. The company invoiced CSIRO $1,439,215 (2018: $842,053) mainly for Livestock Productivity Partnership (LPP), ‘Improving profit from pasture’ and ‘Welfare benchmarking and management for the beef cattle and sheep meat industries’. Dr Allan is a Director of Nuffield Australia which invoiced the company $58,300 (2018: $57,200) for scholarships. Dr Allan is a Director of Wine Australia, which the company has invoiced $193,377 (2018: 66,000) for contribution to Rural R&D for Profit project ‘Forewarned is forearmed’ and Meat and Wine Collaboration programs in China.
• Mr Robert Fitzpatrick is Founder Fellow of Cicada Innovations which invoiced the company $1,022,791 (2018: $377,146) and the company invoiced $383,432 (2018: $348,237) for projects related to Grow Lab new venture accelerator program and Facilitation of the Australian Red Meat Industry Carbon Neutral 2030 Innovation Challenge.
• Ms Erin Gorter is a Director of Primary Industries Education Foundation Australia which invoiced the Company $86,625 (2018: $82,500) for membership funding to Primary Industries Education Foundation. Ms Gorter is a member of Evergreen Farming which invoiced the company $33,000 (2018: $27,500) for the Western Australia Pasture Updates project. Ms Gorter is a member of Southern DIRT producer group which invoiced the company $40,516 (2018: $109,819) and the company invoiced Southern DIRT $9,810 (2018: $20,989) for Synergy and profit using farm by-products in mixed farming systems. Ms Gorter is a Director of AgVivo Pty Ltd which has not invoiced the company in 2019 (2018: $59,773) and the company has not invoiced AgVivo in 2019 (2018: $34,985). Ms Erin Gorter is a Partner of the Gorter Family Trust trading as Erin Gorter Enterprises (TJR & EG Gorter) has not invoiced the company in 2019 (2018: $21,522).
• Mr Russell Lethbridge is a member of AgForce QLD which invoiced the Company $333,285 (2018: $220,365) and the company invoiced AgForce Queensland $157,080 (2018: $262,680) for various projects including ‘Adoption of Best Practice Vertebrate Pest Control in Northern Queensland’ and ‘Development of an accreditation scheme for lay sprayers using the Dropped Ovary Technique’.
• Ms Jo Pye is a Member of the Australian Institute Food Science & Technology which invoiced the Company $1,692 (2018: $93,269) and the company invoiced $44,994 (2018: $120,865) mainly for North Sydney office rent.

92
Consolidated
2019$000
2018 $000
24. NOTES TO THE STATEMENT OF CASH FLOWS
(a) Reconciliation of cash
Cash on hand 100,236 54,714
Short-term money market deposits 58,000 107,000
Closing cash balance 158,236 161,714
(b) Reconciliation of net cash from operating activities to net surplus
Net (deficit)/surplus (4,486) 10,275
Adjustments for:
Net loss/(gain) on disposal of property, plant and equipment 36 (39)
Depreciation expense 1,062 993
Amortisation expense 1,044 901
Interest received (4,255) (3,649)
Change in assets and liabilities:
Decrease/(increase) in assets:
Decrease/(increase) in trade and other receivables 629 (7,094)
(Increase) in prepayments and deposits (32) (96)
Decrease in other financial assets 561 765
Increase/(decrease) in liabilities:
Increase in trade and other payables 7,500 17,321
(Decrease) in other liabilities (6,476) (10,979)
(Decrease)/increase in provisions (457) 1,234
Net cash from operating activities (4,874) 9,632
25. EXPENDITURE COMMITMENTS
Expenditure (primarily research and development) contracted for is payable as follows:
– Not later than one year 139,521 172,292
– Later than one year but not later than five years 135,033 151,589
– Later than five years – –
Aggregate R&D expenditure contracted for at balance date 274,554 323,881
Operating lease expenditure contracted for is payable as follows:
– Not later than one year 4,786 4,669
– Later than one year but not later than five years 9,344 9,347
– Later than five years 564 863
Aggregate lease expenditure contracted for at balance date (a) 14,694 14,879
(a) The operating lease commitments include leases for properties, motor vehicles and maintenance with terms ranging from one to five years.
26. MEMBERS’ FUNDS
The Company is incorporated in Australia and is a company limited by guarantee. If the Company is wound up, its Constitution states that each member is required to contribute a maximum of $5 each towards meeting any outstanding obligations of the Company. At 30 June 2019, the number of members was 49,692 (2018: 50,128).

Overview
Report to stakeholders
About
MLA
Financial report
Supporting inform
ation
93
Consolidated
2019$000
2018 $000
27. CONTRIBUTED EQUITY
Capital contribution 9,031 9,031
This amount represents contributions from the Commonwealth Government as initial working capital and property, plant and equipment at written down value transferred from the Australian Meat and Live-stock Corporation and the Meat Research Corporation at nil consideration.
28. FINANCIAL RISK MANAGEMENT OBJECTIVES AND POLICIES
MLA’s principal financial instruments include derivatives, cash and cash equivalents. The Group has various other financial assets and liabilities such as trade receivables and trade payables which arise directly from its operations.
MLA enters into derivative transactions, including forward currency contracts and currency option contracts. The currency option contracts are limited to vanilla options and collar options. The purpose is to manage the currency risks arising from the Group’s overseas operations. The main risks arising from the Group’s financial instruments are interest rate risk, foreign currency risk, credit risk and liquidity risk.
The Board reviews and agrees policies for managing each of these risks and they are summarised below.
Oversight responsibility for identification and control of financial risks rests with the Audit and Risk Committee under the authority of the Board.
Details of the significant accounting policies and methods adopted, including the criteria for recognition, the basis of measurement and the basis on which income and expenses are recognised, in respect of each class of financial instrument are disclosed in Note 2 to the financial statements.
Risk exposures and responses
(i) Interest rate risk
The Group’s exposure to the risk of changes in market interest rates relates primarily to the Group’s cash and short-term deposit holding with a floating interest rate. Cash at bank earns interest at floating rates based on daily bank deposit rates. On call deposits are made for varying periods of between one day and twelve months, depending on the immediate cash requirements of the Group, and earn interest at the respective short-term deposit rates.
Cash deposits and short-term cash assets are held at floating exchange rates of interest that range between 0% and 2.91% at 30 June 2019. Some of these assets are held in foreign currency accounts.
Sensitivity analysis:
At 30 June 2019, if interest rates moved, as illustrated in the table below, with all other variables held constant, the effect on the Group’s net surplus would have been as follows:
Judgements of reasonable possible movements:
Consolidated surplus
2019$000
2018 $000
+1.00% (2018: +1.00%) 1,477 1,578
-0.50% (2018: -0.50%) (739) (789)
There is no direct impact on other comprehensive income.
(ii) Foreign currency risk
The Group has a policy of hedging the offshore component of its annual expenditure. In doing so, it works within Board-approved risk management bands that establish the upper and lower limits of hedge cover for each period out on a rolling 12-month basis. The objective is to ensure that the annual budget allocation for offshore expenditure for the next financial year is fully hedged by 30 June.
The Group is primarily exposed to the risk of adverse movements in the Australian dollar relative to certain foreign currencies and uses derivative financial instruments to manage these specifically identified foreign currency exposures.
Forward exchange contracts and options are purchased to hedge a majority of the Australian dollar value of United States Dollar, Japanese yen, Chinese renminbi and Korean won payments arising from the activities of overseas branches.
These contracts hedge highly probable forecasted future cash outflows and they are timed to mature when the payments are scheduled to be made.
Foreign exchange contracts commit the Group to purchase specific amounts of foreign currency at an agreed rate of exchange maturing at specific times up to 12 months from balance date.

94
28. FINANCIAL RISK MANAGEMENT OBJECTIVES AND POLICIES (continued)
Option contracts give the Group the right to purchase specific amounts of foreign currency at an agreed rate of exchange maturing at specific times up to 12 months from balance date.
At 30 June 2019, the Group held forward exchange contracts designated as hedges of forecasted future cash outflows to its overseas offices. The cash flows are expected to occur within 12 months from 30 June 2019.
Sensitivity analysis:
There is minimal sensitivity to foreign currency risk exposures on the Group’s net surplus/deficit for the year and on equity as overseas spending is subject to a fixed budget which is determined in Australian dollars. As there is no material impact on the net surplus/deficit or equity in local currency, a sensitivity analysis has not been prepared.
(iii) Credit risk
Credit risk arises from the financial assets of the Group, which comprise cash and cash equivalents, trade and other receivables and derivative instruments. The Group’s exposure to credit risk arises from the potential default of the counter party, with a maximum exposure equal to the carrying amount of these instruments. Exposure at balance date is addressed in each applicable note.
The Group’s objectives in relation to credit risk are to ensure minimum impairment of its financial assets and minimise the possibility of loss.
The Group’s financial assets are largely due from government related bodies, recognised creditworthy third parties and highly credit-rated financial institutions that have minimal risk of default. No collateral is held as security.
All receivable balances are monitored on an ongoing basis with the result that the Group’s experience of bad debts has not been significant.
There are no significant concentrations of credit risk and financial instruments are spread amongst a number of financial institutions to minimise the risk of default of counterparties.
The Group’s maximum exposure to credit risk at reporting date in relation to each class of recognised financial assets is the carrying amount of these assets.
(iv) Liquidity risk
Liquidity risk arises from the financial liabilities of the Group and the Group’s subsequent ability to meet its obligations to repay its financial liabilities as and when they fall due.
Pursuant to its reserving policy, the Group maintains minimum levels of reserves by specie. The Group’s objective is to invest the surplus funds represented by these reserves in financial instruments with maturities that match its forecast payment obligations. The surplus funds are invested primarily in term deposits with differing maturity terms that can be easily liquidated in the event of an unforeseen interruption of cash flow.
The Group manages its liquidity risk by monitoring the cash inflows and outflows expected on a weekly basis.
Non-derivative financial liabilities
The table below summarises the maturity profile of the Group’s financial liabilities as at the reporting date based on contractual undiscounted repayment obligations. The Group ensures that sufficient liquid assets are available to meet all the short-term cash payments.
Consolidated
Less than 6 months$000
6 to 12 months$000
Financial liabilities
Trade and other payables 58,656 –
(v) Fair value
The carrying values of all financial assets and liabilities approximate their fair value at the balance date. The net fair value of a financial asset is the amount at which the asset could be exchanged in a current transaction between knowledgeable and willing parties after allowing for transaction costs.
The Group uses various methods in estimating the fair value of a financial instrument. The methods comprise:
Level 1 – the fair value is calculated using quoted prices in active markets
Level 2 – the fair value is estimated using inputs other than quoted prices included in Level 1 that are observable for the asset or liability, either directly or indirectly
Level 3 – the fair value is estimated using inputs for the asset or liability that are not based on observable market data.

Overview
Report to stakeholders
About
MLA
Financial report
Supporting inform
ation
95
28. FINANCIAL RISK MANAGEMENT OBJECTIVES AND POLICIES (continued)
The fair value of the financial instruments as well as the methods used to estimate the fair value are summarised in the table below.
Year ended 30 June 2019 Consolidated
Market observable inputs (level 2)
$000Total
$000
Financial assets
Derivative instruments (53) (53)
Forward currency contracts (53) (53)
Financial instruments that use valuation techniques with only observable market inputs include forward currency contracts. The fair value of forward currency contracts is calculated by reference to current forward exchange rates for contracts with similar maturity profiles.
MLA presents derivative assets and derivative liabilities on a gross basis. Certain derivative assets and liabilities are subject to enforceable master netting arrangements with individual counterparties if they were subject to default. As at 30 June 2019, if these netting arrangements were to be applied to the derivative portfolio, derivative assets are reduced by $53,222 (30 June 2018: $124,180) and derivative liabilities are reduced by $53,222 (30 June 2018: $124,180).
29. LEGAL CLAIM CONTINGENCY
On 27 June 2016, MLA lodged an appeal in the Federal Court of Australia against Cargill Inc. and Branhaven, LLC. in relation to the prior dismissal of MLA’s opposition to the grant of Australian patent 2010102253 ‘Cattle Selection Methods Patent’. The initial hearing of the appeal concluded on 7 June 2017 and judgement was delivered on 9 February 2018. MLA was partly successful in relation to the appeal which gave rise to a further hearing for the parties to argue what amendments to the patent should be made. This hearing occurred 1–3 August 2018 and on 23 January 2019, the judgment supported the Patent amendments. MLA was awarded 10% of the substantive costs incurred.
On 15 February 2019 MLA sought leave to appeal the decision. MLA now awaits the Court’s consideration of the Leave to Appeal and the matters listed for Appeal, due for consideration on 29 August 2019.
By affidavit dated 31 July 2018, MLA (and Dairy Australia) was advised that Cargill assigned its interest in the patent to newly formed company called SelecTraits. Cargill has now removed itself from the matter.
A final order as to costs has not been made in this matter. It is possible that MLA will be required, in accordance with the court’s scale, to meet a portion of the legal costs in the appeal. Accordingly, no provision for such a liability has been made in these financial statements.
30. FINANCING ARRANGEMENTS
MLA has access to two funding facilities which are available under special circumstances in response to industry crises from the Red Meat Advisory Council Limited (RMAC).
• A $500,000 (2018: $500,000) emergency fund can be accessed by MLA for scoping purposes following consultation with the affected species sector/sectors.
• In addition, a $5 million (2018: $5 million) contingency fund for the management of industry crisis may be accessible. Use of this facility requires a two-thirds majority decision of RMAC directors with terms and conditions as agreed by RMAC and the Commonwealth Government.
• No amount has been withdrawn from these funding facilities.

96
In accordance with a resolution of the directors of Meat & Livestock Australia Limited, we state that:
In the opinion of the directors:
(a) the financial statements and notes of Meat & Livestock Australia Limited for the financial year ended 30 June 2019 in accordance with the Corporations Act 2001, including:
(i) giving a true and fair view of the consolidated entity’s financial position as at 30 June 2019 and of its performance for the year ended on that date; and
(ii) complying with Australian Accounting Standards (including Australian Accounting Interpretations) and Corporations Regulations 2001; and
(b) there are reasonable grounds to believe that the Company will be able to pay its debts as and when they become due and payable.
This declaration has been made after receiving the declarations required to be made to the directors by the managing director and chief financial officer in accordance with section 295A of the Corporations Act 2001 for the financial year ended 30 June 2019.
On behalf of the Board
Michele Allan Chair
Jason StrongManaging Director
24 September 2019
Directors’ declaration

Overview
Report to stakeholders
About
MLA
Financial report
Supporting inform
ation
97
Independent auditor’s report
to the members of Meat & Livestock Australia Limited
Independent Auditor’s Report to the Members of Meat & Livestock Australia Limited
Opinion
We have audited the financial report of Meat & Livestock Australia Limited (the Company) and its subsidiaries (collectively the Group), which comprises the consolidated statement of financial position as at 30 June 2019, the consolidated statement of comprehensive income, consolidated statement of changes in equity and consolidated statement of cash flows for the year then ended, notes to the financial statements, including a summary of significant accounting policies, and the directors’ declaration.
In our opinion, the accompanying financial report of the Group is in accordance with the Corporations Act 2001, including:
a) giving a true and fair view of the consolidated financial position of the Group as at 30 June 2019 and of its consolidated financial performance for the year ended on that date; and
b) complying with Australian Accounting Standards and the Corporations Regulations 2001.
Basis for opinion
We conducted our audit in accordance with Australian Auditing Standards. Our responsibilities under those standards are further described in the Auditor’s Responsibilities for the Audit of the Financial Report section of our report. We are independent of the Group in accordance with the auditor independence requirements of the Corporations Act 2001 and the ethical requirements of the Accounting Professional and Ethical Standards Board’s APES 110 Code of Ethics for Professional Accountants (the Code) that are relevant to our audit of the financial report in Australia. We have also fulfilled our other ethical responsibilities in accordance with the Code.
We believe that the audit evidence we have obtained is sufficient and appropriate to provide a basis for our opinion.
Information Other than the Financial Report and Auditor’s Report Thereon
The directors are responsible for the other information. The other information is the directors’ report accompanying the financial report.
Our opinion on the financial report does not cover the other information and accordingly we do not express any form of assurance conclusion thereon.
In connection with our audit of the financial report, our responsibility is to read the other information and, in doing so, consider whether the other information is materially inconsistent with the financial report or our knowledge obtained in the audit or otherwise appears to be materially misstated.
If, based on the work we have performed, we conclude that there is a material misstatement of this other information, we are required to report that fact. We have nothing to report in this regard.
Responsibilities of the Directors for the Financial Report
The directors of the Company are responsible for the preparation of the financial report that gives a true and fair view in accordance with Australian Accounting Standards and the Corporations Act 2001 and for such internal control as the directors determine is necessary to enable the preparation of the financial report that gives a true and fair view and is free from material misstatement, whether due to fraud or error.
In preparing the financial report, the directors are responsible for assessing the Group’s ability to continue as a going concern, disclosing, as applicable, matters relating to going concern and using the going concern basis of accounting unless the directors either intend to liquidate the Group or to cease operations, or have no realistic alternative but to do so.

98
Auditor’s Responsibilities for the Audit of the Financial Report
Our objectives are to obtain reasonable assurance about whether the financial report as a whole is free from material misstatement, whether due to fraud or error, and to issue an auditor’s report that includes our opinion. Reasonable assurance is a high level of assurance, but is not a guarantee that an audit conducted in accordance with the Australian Auditing Standards will always detect a material misstatement when it exists. Misstatements can arise from fraud or error and are considered material if, individually or in the aggregate, they could reasonably be expected to influence the economic decisions of users taken on the basis of this financial report.
As part of an audit in accordance with the Australian Auditing Standards, we exercise professional judgment and maintain professional scepticism throughout the audit. We also:
• Identify and assess the risks of material misstatement of the financial report, whether due to fraud or error, design and perform audit procedures responsive to those risks, and obtain audit evidence that is sufficient and appropriate to provide a basis for our opinion. The risk of not detecting a material misstatement resulting from fraud is higher than for one resulting from error, as fraud may involve collusion, forgery, intentional omissions, misrepresentations, or the override of internal control.
• Obtain an understanding of internal control relevant to the audit in order to design audit procedures that are appropriate in the circumstances, but not for the purpose of expressing an opinion on the effectiveness of the Group’s internal control.
• Evaluate the appropriateness of accounting policies used and the reasonableness of accounting estimates and related disclosures made by the directors.
• Conclude on the appropriateness of the directors’ use of the going concern basis of accounting and, based on the audit evidence obtained, whether a material uncertainty exists related to events or conditions that may cast significant doubt on the Group’s ability to continue as a going concern. If we conclude that a material uncertainty exists, we are required to draw attention in our auditor’s report to the related disclosures in the financial report or, if such disclosures are inadequate, to modify our opinion. Our conclusions are based on the audit evidence obtained up to the date of our auditor’s report. However, future events or conditions may cause the Group to cease to continue as a going concern.
• Evaluate the overall presentation, structure and content of the financial report, including the disclosures, and whether the financial report represents the underlying transactions and events in a manner that achieves fair presentation.
• Obtain sufficient appropriate audit evidence regarding the financial information of the entities or business activities within the Group to express an opinion on the financial report. We are responsible for the direction, supervision and performance of the Group audit. We remain solely responsible for our audit opinion.
We communicate with the directors regarding, among other matters, the planned scope and timing of the audit and significant audit findings, including any significant deficiencies in internal control that we identify during our audit.
Ernst & Young
Rob LewisPartner
Sydney24 September 2019

99
Supporting information

100
APPENDIX A:
STATUS OF MLA’S 2018–19 KEY PERFORMANCE INDICATORS as at 30 June 2019
2018–19 KPI Status Commentary
PROGRAM: Animal health and welfareSUB-PROGRAM: Animal health
PILLAR 1: CONSUMER AND COMMUNITY SUPPORT
Strategic plan KPI: Four new products including vaccines, diagnostic tests and tools to reduce the cost and welfare impact of endemic and emergency disease in Australia
Diagnostic tests include faecal worm egg count and a footrot diagnostic test. A cattle parasite Theileria vaccine, as well as a single-shot cattle tick vaccine, are some of the products under development.
Increased reporting of disease status from abattoir inspection back to producers
Increased reporting on animal disease has occurred in one beef supply chain, as well as via the enhanced abattoir surveillance project. A further eight animal disease feedback pilots are underway.
Foot and mouth disease animal vaccine test laboratory results available and tested for next generation sequencing. Farm-to-farm dispersal tool (beta version) released for end user consultation
Animal vaccine test lab results are available and were tested for next generation sequencing. The beta version of the dispersion tool is due for release in December 2019.
One project underway to include cattle in ParaBoss end-user consultation
One project is underway and proceeding on schedule, with content written on ticks, worms, flies and lice.
Improved diagnostic test for sheep footrot and serogroup determination made available to footrot vaccine program via diagnostic service providers
The diagnostic test has been made available to service providers.
New tick vaccine research underway: protective effect of novel antigens and innovative delivery methods for sustained release
A sustained-release formulation of the Bm86 antigen elicited an antibody response for up to 12 months. The ideal combination of immunogenic antigens from the Beef CRC research is being tested.
Surveillance program for antimicrobial resistance of bovine respiratory disease and food-borne pathogens implemented
Two surveillance programs are in place with the University of Adelaide to examine antimicrobial resistance of bovine respiratory disease and food-borne pathogens isolated from feedlot cattle. Both projects are currently in sample collection phase.
Internal parasite resistance and drench strategies for feedlot cattle evaluated and results made available to industry
Project was delayed due to an inability to source suitable feedlot cattle. A trial is now underway, with results available in 2019–20.
SUB-PROGRAM: Animal welfare
PILLAR 1: CONSUMER AND COMMUNITY SUPPORT
Strategic plan KPI: Restrict % consumers limiting red meat consumption due to animal welfare concerns to 8%
A 2018–19 survey indicated ‘animal welfare’ as the reason for 1.9% of the overall community population reducing their red meat consumption.
Less than 7% of the community limiting red meat consumption due to animal welfare concerns
A 2018–19 survey indicated ‘animal welfare’ as the reason for 1.9% of the overall community population reducing their red meat consumption.
Welfare strategic partnership launched and at least 20 blue-sky programs soundly established
Welfare strategic partnership launched, but only developed eight projects. Additional 18 projects developed under the MLA animal welfare program.
Finalise NumNuts product and prepare for commercial release The Numnuts system was commercially released to producers at the MerinoLink event in Armidale in June 2019. A large-scale field validation study is in the planning stage.
Wild dog control program established and three wild dog management groups identify benefits of coordinated dog management
A program of work was established under the Centre for Invasive Species Solutions, co-funded by MLA. Three regional wild dog coordinators for northern Australia management groups have been co-funded with AgForce.
Project implemented to evaluate alternative truck crate design and its effect on feedlot animal health and carcase characteristics
This project did not proceed as researcher was unable to find industry participants.
Status Symbol 2018–19 KPIs in MLA’s Strategic Plan 2016–2020
KPIs from MLA’s Annual Investment Plan 2018–19 Total result Percentage
Achieved 9 154 163 68.2
Partly achieved 11 11 4.6
Not achieved or not on track 3 45 48 20.1
Not available 1 6 7 2.9
On track to being achieved by 2020 10 10 4.2
Total 23 216 239 100.0

101
Overview
Report to stakeholders
About
MLA
Financial report
Supporting inform
ation
2018–19 KPI Status Commentary
PROGRAM: Domestic marketSUB-PROGRAM: Market knowledge (domestic)
PILLAR 2: MARKET GROWTH AND DIVERSIFICATIONPILLAR 6: STAKEHOLDER ENGAGEMENT
Strategic Plan KPI:Improve proportion of users who find MLA market information ‘extremely or highly valuable’ to 61%
The proportion of users rating market information highly or extremely valuable was 76%, an increase of 11% from 2017–18.
High levels of satisfaction (above 85%) by industry stakeholders with MLA’s market information services
The market information subscriber survey found 82% of respondents were satisfied with MLA's market information services, an increase of 11% from 2017–18.
Move to ISO 9001:2015 standard The move to ISO 9001:2015 was completed with accreditation being successful.
High levels of satisfaction (above 85%) by industry stakeholders with MLA’s market insights services
According to survey results post-market consultation, all respondents were satisfied with market insights, with a satisfaction rating of 89%.
SUB-PROGRAM: Nutrition
PILLAR 1: CONSUMER AND COMMUNITY SUPPORT
Strategic Plan KPI: Restrict % of main grocery buyers limiting beef consumption for health reasons to 15%
The number of main grocery buyers limiting beef consumption for health reasons is 22%.
Strategic Plan KPI: Restrict % of main grocery buyers limiting lamb consumption for health reasons to 19%
The number of main grocery buyers limiting lamb consumption for health reasons is 17%.
Red meat consumption amounts consistent with the Australian Dietary Guidelines are recommended by 75–80% of GPs and dietitians
72% of GPs and dietitians recommend red meat in amounts consistent with the Australian Dietary Guidelines based on a June 2019 survey.
Balanced media coverage of red meat and health issues (above 75% positive and neutral coverage)
82% of red meat and health issues media coverage was positive and/or neutral.
Uptake of information and resources from the ‘MLAhealthymeals’ website increases by 10%
On average, there was a 10% increase in uptake from MLA Healthy Meals website each month in comparison to 2017–18.
SUB-PROGRAM: Marketing and promotion (domestic)
PILLAR 2: MARKET GROWTH AND DIVERSIFICATION
Strategic Plan KPI: Increase % of domestic main grocery buyers willing to pay a premium for Australian beef to 21%
24% of domestic main grocery buyers are willing to pay a premium for Australian beef.
Strategic Plan KPI: Increase % of domestic main grocery buyers willing to pay a premium for Australian lamb to 23%
23% of domestic main grocery buyers are willing to pay a premium for Australian lamb.
Year-on-year increase in main grocery buyer endorsement of the statement “Willing to pay more for beef/lamb” to 20% (beef) and 22.5% (lamb) from 19% in 2015–16 (beef) and 21% in 2015–16 (lamb)
Main grocery buyers willing to pay more for beef/lamb: • Beef – 24%• Lamb – 23%
Maintain mean number of serves per week: 1.5–1.7 for beef and 0.7–0.9 for lamb
Mean number of serves per week:• Beef – 1.7• Lamb – 0.7
Restrict the percentage of main grocery buyers limiting red meat for health reasons to 15% (beef) and 19% (lamb)
Main grocery buyers limiting red meat for health reasons was restricted to 22% for beef and 16% for lamb.
70% of participants satisfied with CoMarketing Program 82% of CoMarketing participants are satisfied that their marketing program was effective.
73% of CoMarketing participants believe their marketing activities raised awareness among target customers
82% of CoMarketing participants are satisfied that their marketing activities raised awareness among target consumers.

102
2018–19 KPI Status Commentary
PROGRAM: International marketsSUB-PROGRAM: Market access
PILLAR 2: MARKET GROWTH AND DIVERSIFICATION
Strategic Plan KPI: Achieve $15m in new market opportunities by 2019–20
Access improvements have been realised in Japan, Canada and Mexico via the Comprehensive and Progressive Trans-Pacific Partnership agreement. Other free trade agreements are underway.
Strategic Plan KPI: Deliver $150m in new export market opportunities
Non-tariff barriers (NTB) have been alleviated in Indonesia and the Middle East. The China trade relationship strategy (led by AMIC) is currently in progress, with a focus on access for chilled product and tripe. MLA is a participant on AMPC’s Non-Tariff Measures Advisory committee, guiding additional priority NTB alleviation projects.
Persuasive and well-researched submissions, correspondence and advocacy strategies prepared/implemented by MLA are endorsed by peak industry councils, acknowledged and acted on by government, and support delivery of favourable trade outcomes
Five key submissions and associated correspondence prepared by MLA – and subsequently endorsed by industry/peak councils – were acknowledged and acted on by the Department of Foreign Affairs and Trade/Department of Agriculture.
High level of satisfaction (above 85%) by industry and government stakeholders with MLA’s contribution to implementing agreed industry strategies aimed at reducing impact of non-tariff (technical) barriers
The next survey is due in 2020. However, the 2018 survey outcomes are currently guiding MLA's contribution to non-tariff barrier alleviation and targeted in-market activities.
SUB-PROGRAM: Market knowledge (international)
PILLAR 2: MARKET GROWTH AND DIVERSIFICATION
High levels of satisfaction (above 85%) by industry stakeholders with MLA’s international market information
According to survey results post-market consultation, all respondents were satisfied with market insights, with a satisfaction rating of 89%.
SUB-PROGRAM: Marketing and promotion (international)
PILLAR 2: MARKET GROWTH AND DIVERSIFICATION
Strategic Plan KPI:Increase percentage of global consumers who prefer Australian beef to 22.8%
Increased consumer preference for beef rated at 24.6%.
Strategic Plan KPI: Increase percentage of global consumers who prefer Australian lamb to 21.2%
Increased consumer preference for lamb rated at 27.2%.
Build or maintain customer awareness and preference of Australia’s positive attributes (safety, quality) within target range per market
Awareness of Australian imported beef and lamb was measured at 99%, with preference for Australian imported beef and lamb at 82.1%.
Increase consumer preference for Australian red meat in key international markets to be above 22.8% for beef and 21.2% for lamb
Increased consumer preference for beef rated at 24.6% and 27.2% for lamb.
Minimum 70% of participants satisfied with CoMarketing program 82% of CoMarketing participants are satisfied that their marketing program was effective.
SUB-PROGRAM: Livestock export market activities
PILLAR 1: CONSUMER AND COMMUNITY SUPPORTPILLAR 2: MARKET GROWTH AND DIVERSIFICATIONPILLAR 4: PRODUCTIVITY AND PROFITABILITY
Strategic Plan KPI: Live Export Global Index complete and cost of delivery reduced by 1% by 2019–20
The global index project was terminated but data collection is ongoing for an alternative approach.
Minimum 70% of government and industry stakeholders satisfied with MLA’s livestock export market access, productivity and adoption initiatives
A live export-related survey indicated 63% of government and industry stakeholders were satisfied with MLA’s livestock export market access, productivity and adoption initiatives.
Minimum 70% of participants satisfied with co-funding program The survey results report is due in September 2019.

103
Overview
Report to stakeholders
About
MLA
Financial report
Supporting inform
ation
2018–19 KPI Status Commentary
SUB-PROGRAM: Livestock export research and development
PILLAR 1: CONSUMER AND COMMUNITY SUPPORTPILLAR 2: MARKET GROWTH AND DIVERSIFICATIONPILLAR 4: PRODUCTIVITY AND PROFITABILITY
Support supplied to allow industry to implement Livestock Global Assurance Program (LGAP) and ongoing refinement of the control and traceability framework to support LGAP where required
Implementation of LGAP and the associated control and framework was delayed by industry.
Ongoing data collection from industry to identify inefficiencies and address them through the live export supply chain, which will contribute data to develop a global index to monitor improvements in efficiency through the live export supply chain
The global index project was terminated but data collection is ongoing for an alternative approach.
Annual survey of industry and government stakeholders indicates a high level of satisfaction (above 70%) with the conduct of the livestock export program
A July 2018 independent survey showed satisfaction with MLA’s 12-month market access and live export program contribution rated at 63%.
Research projects implemented to improve and manage heat stress and mortality during summer in hot/dry or hot/humid Middle East environments
Further heat research is on hold, pending recommendations from the Heat Stress Risk Assessment technical panel.
Reporting framework adopted and refined to support the animal welfare indicators pilot project and broader ongoing research data collection
A framework is in place and data is being collected.
Research implemented to support and refine stocking densities and best practice bedding management on board livestock vessels
Three research projects are underway with the University of New England.
Research, development and extension projects that support ongoing improvements to existing regulation are commissioned (i.e. ASEL Review)
University of New England has been engaged to address the March 2019 recommendations from the ASEL review.
PROGRAM: Eating qualitySUB-PROGRAM: Eating quality
PILLAR 3: SUPPLY CHAIN EFFICIENCY AND INTEGRITY
Strategic Plan KPI: Improve the MSA beef eating quality index to 59.11
With an increase in volume and variation of cattle being MSA graded, the national average MSA Index has been maintained but not improved.
Improve compliance to MSA requirements to 94.7% for beef and 95% for sheepmeat
MSA compliance reached 93.8% for beef and 96% for sheepmeat.
Successfully pass audit requirements to maintain USDA Process verified approval and ISO certification to 9001:2015 Standard
MSA successfully maintained USDA Process verified approval and ISO 9001:2015 accreditation.
Engagement with 3,000 producers in MSA information sessions or workshops, including delivery of 30 value chain-focused producer engagement activities
Over 3,100 producers were involved in 47 MSA workshops or information sessions, with 32 of these associated with a value chain.
Improvement of average national beef herd eating quality (MSA Index) to 58.00 and increase in bottom 1% of herd by 0.4 points
In 2018–19, the national average MSA Index decreased to 57.48, down slightly from 57.78 in 2017–18.
Increase producer use of myMSA for feedback by 30% in number of visits and 10% in number of producers
4,300 producers used myMSA 16,140 times, with usage similar to 2017–18.
Adoption of MSA grading for beef increased from 43% to 46% of adult cattle slaughter
43% of national adult cattle slaughtered were MSA graded (same as 2017–18), however this represented a record high of 3.5 million cattle.
30% of national lamb slaughter following MSA pathways with 21% of national lamb slaughter being MSA trademarked
19% of national lamb slaughter followed MSA pathways. 76% of these went on to be included in MSA trademarked brands.
MSA Beef model V1.8 released for commercial implementation The MSA model upgrade was approved by the MSA Taskforce and development is in progress. It is expected to be released in August 2019.
Global eating quality research database established with Australian participation
The International Eating Quality Foundation has been established with Australian participation. Specifications for a global research database have been developed in preparation for build.

104
2018–19 KPI Status Commentary
PROGRAM: Environmental sustainabilitySUB-PROGRAM: Sustainability (off-farm)
PILLAR 1: CONSUMER AND COMMUNITY SUPPORT
Form one global partnership to increase environmental performance through supply chain optimisation enabled by enhanced information systems
A partnership with Hitachi is developing a management dashboard for red meat businesses to measure environmental performance along their supply chain.
Engage two supply chains in a strategy towards a carbon neutral red meat supply
Four supply chains co-funded by MLA are participating in carbon neutral-related projects. MLA is assisting three other supply chains in establishing carbon accounts and evaluating emissions reduction and carbon storage options.
Provide the tools and resources for industry to achieve a 15% reduction in water and energy use intensity relative to 2015 levels
MLA is co-funding a project with NH Foods' Oakey abattoir investigating waste use reduction, recycling and reuse options. In addition, an MLA co-funding project with energy consulting business, All Energy, resulted in the launch of an energy management tool for industry.
Provide the tools and resources for industry to achieve a 15% reduction in waste or increase in efficiency relative to 2015 levels
‘Wastes to Profits' Rural R&D for Profit project has identified numerous waste-related technology opportunities. In addition, MLA co-funded projects with processors testing novel phosphorous-removal technology for processing wastewater, as well as investigating nitrogen-removal technologies.
SUB-PROGRAM: Sustainability (on-farm)
PILLAR 1: CONSUMER AND COMMUNITY SUPPORT
Strategic Plan KPI: Restrict % consumers limiting red meat consumption due to environmental concerns to 8%
A 2018–19 survey indicated sustainability as the reason for 2.6% of the overall community population reducing their red meat consumption.
At least two new products on drought forecasting and decision support tools available for producers and advisors
The Northern Australia Climate Project has delivered a start and end of wet season/monsoon forecast product, as well as the Madden-Julian Oscillation (MJO) forecast product.
At least three seasonal Bureau of Meteorology products available for trialling
The ‘Forewarned is forearmed’ Rural R&D for Profit project has delivered two seasonal products for trialling. The third product was delayed until 2019–20.
Initiate a study with input from producer groups to evaluate profitable grazing systems for pastures in hotter and more variable climates
Three feedbase-related projects are underway, including a partnership with Western Sydney University to evaluate pastures in hotter and more variable climates.
‘Carbon Neutral by 2030’ implementation plan completed, based on CSIRO study
An implementation plan for the Carbon Neutral by 2030 (CN30) Initiative has been completed.
Investigation underway on sequestration of carbon under managed savannah burning in northern Australia, so as to assess a potential new Emissions Reduction Fund method
Investigation is underway via an MLA co-funded project with Indigenous Land Corporation.
Update the 2012 30-year study on the impact of beef on the environment to be 35 years (to 2017)
The completed and summarised study is available on MLA’s website.
Support and contract continuation of the ‘Wambiana’ grazing study, including impacts on environment and profitability of grazing operations in the Burdekin catchment (subject to Red Meat Panel endorsement and budget availability).
A new program is underway on the ‘Wambiana’ site, with three demonstration sites supported by the Department of Environment and Energy.
Commercialisation arrangements agreed with CSIRO for the production and supply of Asparagopsis to the Australian feedlot industry
An agreement has been executed between CSIRO, James Cook University and MLA for the commercialisation of the Asparagopsis algae for reducing rumen methane emissions.
Results from long-term benchmarking of greenhouse gas emissions in northern and southern Australian feedlots reported to industry and incorporated into the National Greenhouse Gas Inventory
Long-term greenhouse gas emissions from two feedlots, in northern and southern Australia respectively, have been completed and the results reported to industry. Incorporation of these into the National Greenhouse Gas Inventory will be delayed until 2020.
Contribute to: restrict the percentage of consumers limiting red meat consumption due to environmental concerns to 10%
A 2018–19 survey indicated sustainability as the reason for 2.6% of the overall community population reducing their red meat consumption.

105
Overview
Report to stakeholders
About
MLA
Financial report
Supporting inform
ation
2018–19 KPI Status Commentary
PROGRAM: Integrity systemsSUB-PROGRAM: Market access science
PILLAR 2: MARKET GROWTH AND DIVERSIFICATIONPILLAR 3: SUPPLY CHAIN EFFICIENCY AND INTEGRITY
Adoption of the shelf life model in domestic supply chain Adoption of the shelf life model has been used to demonstrate opportunities to redesign some domestic retail supply chains for chilled, vacuum-packed beef and lamb products.
Antimicrobial resistance in sheep is known Research shows that antimicrobial-resistant bacteria in sheep/lamb faeces at the time of slaughter is extremely low.
Changes to post-mortem inspection practices are implemented in domestic meat processing to manage risk and reduce costs
The first set of changes to post-mortem inspection practices have been implemented, with further changes being progressed that are anticipated to provide a substantial return to the red meat sector.
Qualitative assessment of the risk of toxoplasmosis in sheep for humans
A project is underway, but only 10% of the sample collection has been completed.
Approaches to protecting the integrity (identity) of product in supply chains are piloted
An MLA co-funded project to develop Australian authenticity markers has commenced, together with pilot trials with two export supply chains.
SUB-PROGRAM: Integrity systems
PILLAR 3: SUPPLY CHAIN EFFICIENCY AND INTEGRITY
Strategic Plan KPI: Increase producer awareness and compliance of integrity systems to 86%
The 2018–19 annual integrity survey revealed that integrity program awareness levels are 98% for NLIS, 96% for NVDs and 87% for LPA in 2018–19. NLIS compliance was ahead of the target at 96.04%.
NLIS movement recording compliance increase to 95.75% NLIS movement recording compliance was 96.04% for 2018–19.
25% of livestock consignments to be accompanied by an eNVD during 2018–19
eNVD usage grew steadily throughout the year to 21.6% (an increase of 9.8% on 2017–18).
Integrity Systems communication and adoption strategy workplan activities for 2018–19 implemented
Integrity System Communication and Adoption Strategy activities were implemented in line with the 2018–19 workplan.
Implementation of Integrity Systems 2025 Strategy commenced The Integrity Systems 2025 and beyond strategy was endorsed by SAFEMEAT and an implementation plan to support investment in the Strategy from 2019–20 onwards was developed in consultation with industry.
Implementation of improved LPA compliance monitoring system and non-conformance management system
A framework and implementation pathway for an improved compliance monitoring system was developed in consultation with industry.
LPA awareness levels increase to 86% LPA awareness levels were 87% in 2018–19.
SAFEMEAT governance and reporting structures are supported and remain effective
A review of the SAFEMEAT Terms of Reference was conducted in 2018–19 with key recommendations endorsed by SAFEMEAT. SAFEMEAT governance and reporting structures worked effectively throughout the year.
PROGRAM: Objective measurementSUB-PROGRAM: Objective measurement
PILLAR 3: SUPPLY CHAIN EFFICIENCY AND INTEGRITY
Strategic Plan KPI: Improve beef compliance through optimising efficiency across the value chain to 95%
The Advanced Livestock Measurement Technologies (ALMTech) program has developed beef carcase value optimisation tools as well as related objective measurement technologies for lean meat yield and eating quality.
Rural Research and Development for Profit ALMTech program successfully delivered and reporting accepted by the Department of Agriculture
The Advanced Livestock Measurement Technologies (ALMTech) research program is on track with year 3 reporting accepted by the Department of Agriculture.
DEXA output of carcase lean meat yield delivered in producer feedback from four lamb abattoirs and one beef abattoir
Two high-volume smallstock abattoirs have DEXA installed and an additional three have DEXA installations underway. One beef abattoir has installed DEXA. All of the above are anticipated to be providing producer feedback in 2020.
CT system installed for beef DEXA calibration and research and development data collection
Development of a CT system was delayed due to funding only becoming available later in the financial year. The build has commenced for completion in early 2020.

106
2018–19 KPI Status Commentary
Two spectral imaging devices trialled for objective assessment of traits contributing to eating quality
Four spectral imaging devices are under development and validation to measure eating quality traits with an aim of achieving AUS-MEAT accreditation.
Create tools to enable industry to implement value-based pricing models
Both lamb and beef carcase value calculators have been developed and are being adopted by industry. The lamb carcase cut-to-market end-point optimisation model is being evaluated by industry.
Beef carcase value calculator prototype commenced and trialled by one beef supply chain to develop an improved understanding of variation in carcase value and providing opportunities to improve value chain profit
The Advanced Livestock Measurement Technologies (ALMTech) program has developed a beef carcase value calculator which is being evaluated by industry.
DEXA adoption plan developed by Objective Measurement, Adoption and Commercialisation Committee (OMAC)
Wide-scale facilitated adoption of DEXA via an Objective Measurement Adoption and Commercialisation (OMAC) committee plan hasn’t progressed, owing to not achieving an agreed funding model. OMAC has supported the DEXA roll-out via individual processors being supported by MLA Donor Company funding.
PROGRAM: Producer adoptionSUB-PROGRAM: Producer adoption
PILLAR 4: PRODUCTIVITY AND PROFITABILITY
Strategic Plan KPI:Engage ≥2,000 producers in decision support programs who will improve business performance by ≥5% by 2020
1,134 beef and lamb producers engaged in MLA ‘involve and partner’ programs. Furthermore, more than 3,500 attendees participated in MLA awareness activities. More than 50% of participants have indicated they intend to change practices, with this rising to over 80% in some programs such as Profitable Integration of Cropping and Livestock.
Strategic Plan KPI:By 2020, improvement in total factor productivity of: 1.75% (southern beef); 0.5% (northern beef); 0.5% (sheepmeat); 1.5% (feedlot); 0.5% (goat)
MLA’s new evaluation framework is now based on measured productivity and cost impacts at an enterprise level rather than measuring total factor productivity
Engage at least 3,000 producers in program initiatives Over 3,500 attendees participated in MLA awareness activities including BeefUp, Pasture Updates and It’s Ewe Time forums.
On average, participant satisfaction and value scores are greater than 7/10 for ‘awareness’ activities
Attendees of the MLA awareness activities rated the events on average as over 8/10.
50% of participants indicate an intent to change practice More than 50% of participants in MLA adoption programs have indicated they intend to change practices, with this rising to over 80% in some programs such as Profitable Integration of Cropping and Livestock.
MLA member satisfaction survey rates awareness of extension and adoption programs above 4.5/10
An overall metric is not available, but awareness of individual programs ranges from 7.2/10 for Profitable Grazing Systems, 4.4 for It’s Ewe Time, to EDGE at 3.9.
Engage at least 2,500 commercial sheep and cattle producers in ‘influence and motivate’ activities
1,540 participants engaged in MLA 'influence and motivate' programs.
On average, participant satisfaction and value scores are greater than 7/10 for ‘influence’ activities
Participants in MLA 'influence and motivate' programs rated their experience as greater than 8/10.
On average, participating producers achieve a 50% knowledge and skills improvement score
More than 78% of the survey respondents who participated in MLA's 'influence and motivate' programs improved their skills and knowledge.
750 producers participate in Profitable Grazing Systems (PGS) ‘feeder’ activities
104 producers participated in PGS ‘feeder’ activities.
412 producers involved in PGS groups (cumulative total 732) 365 producers participated across 20 PGS training packages in 2018–19.
75% of producers involved in PGS groups increase their skills and knowledge above a skills audit score of 75% (competent)
62% of PGS participants scored skills and knowledge above 75% at the end of a training package.
800 businesses engaged in ‘involve and partner’ activities 1,134 producers engaged in MLA 'involve and partner' programs such as Profitable Grazing Systems and Producer Demonstration Sites.
Demonstration sites finishing in 2018–19 achieve a 75% adoption rate
Of the Producer Demonstration Sites projects that were completed in 2018–19, over 75% of the core producers adopted the new practice.
On average, participant satisfaction scores are greater than 8/10 and value score greater than 8/10
Of the Producer Demonstration Sites projects that were completed in 2018–19, participant satisfaction scores were greater than 8.75/10, and 8.8/10 for ‘producer value’.

107
Overview
Report to stakeholders
About
MLA
Financial report
Supporting inform
ation
2018–19 KPI Status Commentary
Grassfed beef and sheepmeat producers and research, development and adoption partners have a satisfaction rate with MLA’s Regional Consultation Framework of 4/5, measured via an annual satisfaction survey distributed by the regional councils
The annual satisfaction survey returned a result of 3.7/5.
5% increase in high quality, fundable proposals endorsed by the Red Meat Panel
The increase in endorsed, fundable proposals was 5.7%.
Feedlot productivity baseline data established to align with Meat Industry Strategic Plan (MISP) reporting requirements
Meat Industry Strategic Plan-aligned baseline data has been established for feedlot productivity measures, and ongoing data collection is in place.
Animal health monitoring baseline data established to align with MISP reporting requirements
Meat Industry Strategic Plan-aligned baseline data has been established for feedlot animal health measures, and ongoing data collection is in place.
Development of initial suite of training packages identified in the Feedlot Industry Training and Leadership Development Strategy initiated
A project manager has been appointed by the Australian Lot Feeders' Association, and a project initiated to develop an initial suite of training packages for the feedlot sector.
PROGRAM: Product and packaging innovationSUB-PROGRAM: High Value Food Frontiers
PILLAR 2: MARKET GROWTH AND DIVERSIFICATIONPILLAR 3: SUPPLY CHAIN EFFICIENCY AND INTEGRITY
Defined portfolio of growth opportunities (minimum 10) that will enable achievement of 3–5 value multiplier during 2020–25 on input raw commodity meat
Five partners contracted and 12 key opportunity spaces under development.
Develop ‘2Morrow’s Food Knowledge Portal’ comprising foresights and insights to inform MLA decision making
Portal development underway and continuing to be updated.
At least five new red meat-based value-added products, processes or services (for new usages and occasions) developed and tested
Six partners contracted in projects to explore high-value growth opportunities aligned to key themes identified, with products developed and tested ready for launch during 2019.
At least two process improvement initiatives completed that positively impact on product quality and yield performance in value-added red meat products
Four key process protocols have been developed and tested, then applied to value-added red meat products.
Three new red meat value-adding technology or packaging solutions identified and undergoing research and development
Several packaging projects are underway, including reduced plastic for retail-ready trays and soaker pads, as well as use of interactive Internet of Things (IoT) smart pack designs.
PROGRAM: Value chain information and efficiencySUB-PROGRAM: Digital value chain information
PILLAR 3: SUPPLY CHAIN EFFICIENCY AND INTEGRITY
Data sharing and security principles established and executed Data sharing principles have been developed and made available to industry. The ‘Growing Digital’ collaborative project has also delivered a data governance framework and toolkit for producers.
Data platform strategy implementation plan executed The data platform strategy plan has been executed, with a number of projects completed and others underway or planned in 2019–20.
More than 15,000 Integrity Systems Company (NLIS and LPA) linked accounts
A total of 19,335 NLIS and LPA accounts have been linked to myMLA, enabling the provision of a unified user experience to myMLA users.
Eight co-funded supply chain officer positions implemented Eight positions were co-funded and a waitlist is in place to fill further positions as funding becomes available.
Increased uptake and adoption of Integrity Systems Company digital opportunities facilitated through implementation of the Communication and Adoption Strategy
The ISC Communications and Adoption Strategy was developed and implemented.
15% of industry throughput is available through Livestock Data Link
Livestock Data Link throughput is increasing month-on-month, accounting for 9% of industry throughput.

108
2018–19 KPI Status Commentary
PROGRAM: Productivity (off-farm)SUB-PROGRAM: Productivity (off-farm)
PILLAR 4: PRODUCTIVITY AND PROFITABILITY
Strategic Plan KPI: Leverage co-investment through the MLA Donor Company (MDC) in the processing automation R&D portfolio by $10m/year
The total planned expenditure from MLA Donor Company (MDC) projects either approved, underway or completed since June 2015 has exceeded the $50 million target.
Productivity benefit of technologies adopted in 2018–19 and previous years deliver impact of $40 million/year
The annual productivity benefit of installed technologies was $57.5 million in 2018–19, primarily from lamb boning room automation and the BladeStop safety device.
80% of the expected outcomes from productivity and logistics investments are achieved, including:
• contract with two beef boning automation providers to develop concepts for industry review
• evaluation of innovation X-ray systems as automation enablers
• sensing systems and beef automation module design progress
• additional lamb processing modules trialled
• identify plant partners for beef automation program
• investigate adoption barriers, and finance/risk mitigation innovation.
85% of outcomes from the 2018–19 detailed investment plan were achieved:
• two global automation providers delivered concepts for review by the industry beef automation steering group
• three alternative X-ray technologies are currently being trialled
• the first two sensing and beef automation modules have been designed, with the first prototype module under development
• lamb tenderloin removal, lamb short ribs, and fat cap removal modules trialled
• plant partners identified, with strategic plant partner Teys having contracted a beef automation development room
• report received from external consultant.
PROGRAM: Productivity (on-farm)SUB-PROGRAM: Beef productivity
PILLAR 1: CONSUMER AND COMMUNITY SUPPORTPILLAR 4: PRODUCTIVITY AND PROFITABILITY
Rumen manipulation practices that contribute to an improved rangeland productivity of 0.5% by 2020
Three rumen manipulation projects underway (management of plant toxins, use of biochar and managing leucaena).
Leverage production systems such as use of Redlands leucaena for northern bioregions that increases turn-off by 0.5%/year
Redlands leucaena was launched in May 2019. Ongoing work across two sites to determine productivity levels/turn-off is underway.
Contribute to improved breeder herd fertility and reductions in calf loss, resulting in 0.5% increase in weaning rates by 2020
Four Tips & Tools documents were revised and released in March 2019, targeting breeder herd management and improved reproduction efficiency. However, initiation of calf loss consortium was delayed until August 2019. A project underway to survey calf mortality for southern systems in 2020.
Technologies and practices for live animal measurements available for online sales
Live animal objective measurement technologies are still under development. MLA is also initiating one additional project to progress ‘BeefSpecs’ measurement applications for Bos taurus cattle.
Project implemented to conduct feedlot cattle composition of gain research to predict days on feed to a set carcase endpoint (including lean meat yield), and potential integration with DEXA or CT composition analysis
The project was implemented in 2018–19 and is currently underway.
Decision made by MLA and Australian Lot Feeders' Association (ALFA) on the future of the research feedlot concept and, if positive, development initiated
The decision by MLA and the Australian Lot Feeders' Association on future investment in a research feedlot facility has been delayed. A selection committee has been developed to facilitate the tender process, which will now be undertaken in 2019–20.
Commercialisation arrangements agreed with CSIRO for the production and supply of Asparagopsis to the Australian feedlot industry
An agreement has been executed between CSIRO, James Cook University and MLA for the commercialisation of the Asparagopsis algae for reducing rumen methane emissions.
Project initiated to examine mechanisms for increasing the reactive surface area of black coal, as a mechanism for capturing nitrogen losses from manure
Proposal was assessed but not developed further due to other funding priorities.

109
Overview
Report to stakeholders
About
MLA
Financial report
Supporting inform
ation
2018–19 KPI Status Commentary
SUB-PROGRAM: Feedbase production and utilisation
PILLAR 1: CONSUMER AND COMMUNITY SUPPORTPILLAR 4: PRODUCTIVITY AND PROFITABILITY
Strategic Plan KPI:Reduce cost of feral animals and weeds by $30 million
A 2015–20 impact assessment indicated that productivity increases and cost savings from products such as the HOG-GONE® baiting system for pigs, parthenium biological control and the strengthened RHDV strains for rabbit calicivirus will exceed this target.
Obtain preliminary results for phosphorus-efficient pasture studies; ensure glasshouse studies are underway on plant traits and phosphorus efficiency
Characteristics of pasture plant roots that assist nutrient foraging were identified.
Feedbase investment delivery initiatives underway for developed phosphorus nutrition with establishment of 20 ‘soil clubs’ in NSW and Victoria
Ten ‘soil clubs’ were established in 2018–19, with an additional 10 planned by January 2020.
Commence five projects across NSW and southern Queensland which focus on increasing feedbase options
Five projects commenced, including grass and legume evaluation, brassica utilisation, improved legume adaptation, phosphorus management of tropical species and dual-purpose perennial cereals.
Hand-held biomass sensor and mobile device app available Biomass app and algorithms available, but there has been no commercial interest in a hand-held biomass sensor.
Terrestrial unmanned aerial vehicle (UAV) and long-range unmanned ground vehicle (UGV) evaluated for multiple applications such as fence line inspection, counting livestock, locating pest animals and taking soil samples
Multiple projects are underway for the use of long-range unmanned ground vehicles and aerial vehicles in a variety of applications, but evaluation not yet complete and not all applications trialled.
Farm Map Australia commercially available with more than 1,000 subscribers accessing farm mapping tools
Farm Map not funded further by MLA, as other competing mapping services are available.
Confirm UAV’s ability to map pasture, weeds and animals at three locations in northern Australia
Successful trials of unmanned aerial vehicle locating animals, but weeds and pasture assessment is still being trialled.
Genomic tools for annual legumes used by one seed company in breeding decisions
Markers for traits in legumes, medics and phalaris identified by genomics provider, with a sub-contract to a seed company.
Tedera species commercially available in WA Tedera was successfully launched in WA in October 2018 and all available seed has been sold.
Pasture variety and forage value index website accessed by more than 1,000 producers
There have been over 4,000 visits to the site by 2,547 unique users.
Leucaena seed sold to enable 8,000ha to be sown Approximately 2,000ha has been sown and all available seed sold. Delayed availability of parent seed material for bulk up, coupled with drought, has compromised commercial seed production.
Biocontrol web portal reports more than 100 new entries by users of the Biocontrol app
490 new user entries on the biocontrol app/hub added and 100+ Android versions of the app installed.
APVMA submission for prickly acacia completed by June 2019 Submission completed and APVMA review underway.
Red witchweed monitoring reports success in containment in Queensland
Targeted land has been intensively treated to deplete the witchweed soil seed bank, supporting success towards eradication.
K5 calicivirus reduces rabbit populations at more than 250 detailed monitoring sites by 30%
RHD-K5 virus was released at 323 ‘community sites’, and 38 state-run sites. 218 of the community release sites showed an average reduction in rabbit numbers of 34%.
Report on the R&D outputs which are passed along and included in the ‘producer adoption’ sub-program
Information products are being progressed from past R&D output, including the development of Pasture Paramedic, phosphorus efficiency soil clubs and feedbase plan R&D outputs being presented at 'Awareness' events.
SUB-PROGRAM: Goat productivity
PILLAR 4: PRODUCTIVITY AND PROFITABILITY
National supply estimates, scenario modelling and key messages generated, leading to informed advice back to industry regarding herd expansion needs
Forecasting committee meeting as planned and generating forecasts. Extremely useful data is coming through from the project, which is being communicated to the wider industry.
Kid loss issue quantified, leading to the provision of informed advice back to industry regarding management
Some management advice being provided to industry from project results so far. Kid loss will be quantified in 2019–20, based on completion of on-farm scanning.
At least 400 goat producers engaged in awareness activities; at least 240 engaged in ‘influence and motivate’ activities with on average a 75% knowledge and skills improvement score; at least 35 goat producers enrolled in category B and C activities like Profitable Grazing Systems and EDGE, with on average 75% making at least one practice change
Approximately 400 producers have engaged in awareness activities. However, only 100 producers were engaged in ‘influence and motivate’ activities. Overall, 68% of attending producers stated they intended to make changes to their businesses.
MLA’s benchmarking project has engaged 26 producers with a mix of Category B and C activities. While there is no goat-focused Profitable Grazing Systems activity as yet, three Supported Learning Programs are in development.

110
2018–19 KPI Status Commentary
SUB-PROGRAM: Livestock genetics
PILLAR 4: PRODUCTIVITY AND PROFITABILITY
Minimum 2% increase in annual rate of gain for each of the default Sheep Genetics indexes for Terminal, Maternal and Merino analyses
Default indexes increased by 2, 6 and 3 index points for the Merino, Terminal and Maternal analyses respectively.
Three major Sheep Genetics analyses indicate that terminal animal numbers maintained at current levels, maternal numbers increased by 1% and Merino numbers increased by 3%
Animal Terminal, Maternals and Merino number targets exceeded with increases of 6%, 8% and 8% respectively.
Sheep Genetics customer satisfaction level of 4/5 as described by annual client survey
Customer satisfaction was rated at 4.2 for MERINOSELECT and 4.1 for LAMBPLAN.
Automated breed percentage tool available A genomic test-based percentage tool is feasible and commercialisation terms have been developed for breed society use, though the tool is not yet available.
Diagnostics for single-step developed and implemented Diagnostics developed for beef and sheep, with availability via AGBU.
Pipeline for flock benchmarking developed and implemented Flock profile reports are available via AGBU.
Pipeline to automate construction of Genomic Relationship matrix implemented for all BREEDPLAN analyses
Genomic relationship matrices developed and operational, and will be handed over to ABRI in 2019–20.
raceMule solver implemented in BREEDPLAN raceMule solver being used in BREEDPLAN and Sheep Genetics evaluations.
New BREEDPLAN reproduction model developed and new Sheep Genetics reproduction model implemented
A new reproduction analysis was implemented in the maternal LAMBPLAN analysis in April 2019. A new BREEDPLAN model is under development.
Sheep Genetics database redevelopment project initiated The database development project tender has closed and applications are being reviewed. Interface project is underway.
Development of genetics ‘National Data Platform’ initiated The ‘Phenobank’ project is in progress as a pilot for redevelopment.
Management of genomics information management transitioned from Sheep CRC to MLA
Wind-up agreement signed by all participants. Service agreements with genotyping companies developed.
Genetics campaign launched The genetics campaign was launched in June 2019.
Establishment of at least one genetics demonstration site Genetics Producer Demonstration Site applications were received and will commence in 2019–20.
Genetics network development initiated ‘Beef champions’ network started with meeting in Armidale.
At least one project to simplify EBVs/ASBVs initiated Simplified web interface projects are underway for DeSireBull and Sheep Genetics.
At least three new BIN herds and one new sheep resource flock established
Three new BIN herds and one new sheep resource flock established.
SUB-PROGRAM: Sheep productivity
PILLAR 4: PRODUCTIVITY AND PROFITABILITY
Develop new knowledge to enable producers to increase marking rates by 5% and reduce ewe mortality rates by 1% by 2020
Various ewe and lamb mortality projects were funded, including causes of maternal/composite ewe mortality, reducing foetal losses in young ewes and commencement of a cross-industry review of sheep reproduction investments.
PROGRAM: Capability buildingSUB-PROGRAM: Innovation capability building
PILLAR 4: PRODUCTIVITY AND PROFITABILITYPILLAR 5: LEADERSHIP AND COLLABORATIVE CULTURE
Implement a program for a Digital Value Chain Officer with three additional partners (total of six)
Eight positions were co-funded and a waitlist is in place to fill further positions as funding becomes available.
80% of Producer Innovation Fast-Track participants express satisfaction with the program
Evaluation of the program indicated that 93% of participants fast-tracked innovation development and 94% achieved a change in innovation thinking.
Delivery of three capability programs (new ventures, new food products/value chain, on-farm) to Producer Innovation Fast-Track program participants
Three capability programs delivered and ongoing technical assistance available to participating producers.
Livestock Consulting Internship program completed, with employers and interns expressing 80% satisfaction with the program
Ten interns graduated from the Future Livestock Consulting program and participating employers expressed 95% satisfaction with the program.

111
Overview
Report to stakeholders
About
MLA
Financial report
Supporting inform
ation
2018–19 KPI Status Commentary
Delivery of an industry development education program for 20 Intercollegiate Meat Judging finalists
20 students completed the Intercollegiate Meat Judging industry development program.
Co-innovation program partners achieve 80% of documented innovation objectives and five new partners are engaged
The co-innovation program partners achieved >80% of innovation objectives. Ten companies were contracted, with a further six engaged in developing strategic plans to underpin potential co-innovation activities.
Appoint at least five new PhD students MLA awarded eight PhD scholarships in 2018–19.
At least 10 early career scientists employed in MLA-funded research and development
More than 10 early career scientists were engaged in research programs across MLA business units.
A minimum of 20 high quality I+E CONNECT new ventures are supported
An active portfolio of more than 20 new ventures are being supported through I+E Connect.
Strategic partnerships in place with all global-aligned ag-tech, food-tech and food innovation programs supporting red meat entrepreneurs
Strategic participation with all relevant partners established.
The I+E CONNECT program attracts at least $5 million venture capital to enable $10.5 million new venture project investment, with at least two Australian red meat businesses supported to develop corporate venturing capability and models
The I+E Connect program attracted $14 million in new venture capital. Corporate venture activity was achieved with two Australian red meat businesses.
SUB-PROGRAM: Industry leadership and capacity building
PILLAR 1: CONSUMER AND COMMUNITY SUPPORTPILLAR 5: LEADERSHIP AND COLLABORATIVE CULTUREPILLAR 6: STAKEHOLDER ENGAGEMENT
Grant a minimum of two scholarships a year to ensure ongoing investment in industry leadership capability
MLA continues to support young researchers through the PhD top-up scholarship program. Eight scholarships were awarded in 2018–19.
Engage a minimum of six past MLA-sponsored scholars in advocacy work for the industry
Thirty-two past MLA-sponsored scholars were engaged in events such as Regional Flavours, Taste of Sydney, Taste of Tasmania, Gourmet Escapes and Melbourne Food and Wine Festival.
40 industry people identified and trained as industry advocates 52 industry people were identified and trained as industry advocates.
Advocates used to support MLA’s ‘Paddock to Plate 360 Beef and Lamb Experiences’ at community events
Six advocates were engaged in MLA’s ‘Paddock to Plate 360 Beef and Lamb Experiences’.
At least seven industry representatives provided media and/or communications training
Nine industry representatives were provided with media or communications training in 2018–19.
40% of current and within six months of appointment, all future Cattle Council of Australia (CCA) directors will have completed the AICD Company Directors Course and assessment
80% of current directors completed the AICD Company Directors Course. New directors will complete the course in 2019–20.
CCA governance reviewed and recommendations implemented CCA governance has been reviewed and recommendations are being implemented.
15 producers will have completed ‘governance in action’ training This project did not proceed.
15 Sheep Producers Australia (SPA) board and/or committee members will have completed media and communications training
This project did not proceed.
Two Australian Lot Feeders' Association (ALFA) representatives provided governance training
One representative was trained in 2018–19, with a second to be selected for training in 2019–20.
Two Goat Industry Council of Australia (GICA) representatives provided governance training
GICA representatives were provided facilitation support through a review of their constitution.
Publication of second annual State of the Industry report The second annual report was completed by MLA and launched by RMAC in September 2018.
PROGRAM: CommunicationSUB-PROGRAM: Communication (community)
PILLAR 1: CONSUMER AND COMMUNITY SUPPORT
Promotion of the Good Meat online community engagement platform within MLA’s Domestic Market Strategy
Good Meat was promoted at a number of leading food and wine events in 2018–19.
Year-on-year increase in producer engagement via digital and social media
Results for ‘producer’ engagement specifically are not available, however overall engagement for the Good Meat digital and social channels has increased 95% from the previous year.
Community sentiment tracked, including percentage limiting red meat consumption due to animal welfare or environmental management concerns (KPI: 8%)
A 2018–19 survey indicated animal welfare and sustainability as the reason for 1.9% and 2.6% (respectively) of the overall community population reducing their red meat consumption.

112
2018–19 KPI Status Commentary
Participate in a minimum of four events to engage and inform key consumer segments "Passionate Foodies" and "Constrained Aspirers" – about the provenance of Australian red meat to enhance community confidence in the industry and promote red meat consumption as part of a healthy balanced diet
More than four events were attended in 2018–19, with major events including Regional Flavours, Gourmet Escapes, Taste of Sydney and Taste of Tasmania.
At least 6,000 consumers engaged and informed about the production of red meat and livestock in Australia
More than 6,500 consumers engaged through MLA's Regional Flavours activation, Gourmet Escapes and Taste festivals. More than 40,000 participants experienced the MLA Paddock to Plate virtual reality story.
Utilise at least 20 producer advocates in community events 32 advocates engaged in events such as MLA's Regional Flavours activation and the Paddock to Plate virtual reality tour of south-east Australia.
MLA’s ‘Paddock to Plate 360 Beef and Lamb Experiences’ presented at four Royal Agricultural Show events with 80% of viewers responding that they have:
• a better understanding of the industry
• improved perceptions of Australian beef/sheepmeat production
The Paddock to Plate Beef Experience was taken to more than four RAS events, with 85% of participants reporting a better understanding of the red meat value chain.
At least two teacher-focused events feature MLA educational resources
Four teacher-focused events were attended.
A minimum of 70 schools engaging with MLA education materials More than 9,000 students in 150 schools have participated in MLA’s Virtual Classroom program.
A minimum 1,000 education resource downloads Measure unavailable from current web platform.
SUB-PROGRAM: Communication (stakeholder)
PILLAR 5: LEADERSHIP AND COLLABORATIVE CULTUREPILLAR 6: STAKEHOLDER ENGAGEMENT
Strategic Plan KPI: Improve stakeholder endorsement of MLA programs to 2.9/5
Importance of being an MLA member averaged at 3.7/5 during the past three years.
Strategic Plan KPI: Improved industry crisis and issues management capability – one simulation with PICs
MLA has assisted the red meat and livestock industry to develop a new industry corporate affairs function. Support has been provided to the PICs in relation to media training and responding to key issues such as drought, flooding and vegan activism.
Strategic Plan KPI: Increase member satisfaction with MLA to 3.8/5
Overall satisfaction with MLA averaged 3.4/5 during the past three years.
Strategic Plan KPI: Improve stakeholder endorsement of the value of MLA products and services – methodology, benchmarks and targets set
MLA's products and services saw increased value, with consumer insights in international markets receiving the largest increase to date.
Delivery of the annual report for the Beef Industry Sustainability Framework
The second Annual Update report for the Australian Beef Sustainability Framework was launched on 5 June 2019.
An agreed approach for reporting on sheepmeat industry sustainability
Sheep Producers Australia, Wool Producers Australia and MLA have agreed on the development of a joint sheepmeat and wool sustainability framework and associated Sustainability Steering Group.
High levels of member satisfaction (above 70%) with MLA printed communications
Satisfaction with MLA printed communications increased from 72% to 75%, based on MLA’s annual member survey.
Delivery of three high-impact communication campaigns The three high-impact campaigns launched in 2018–19 were ‘Genetics – accelerating productivity’, changes to the lamb definition model and upgrades to Meat Standards Australia.
High levels of member awareness (above 70%) of MLA’s role Awareness of MLA's role has increased 10% in 2018–19, lifting to 75%, based on MLA’s annual member survey.
Increase in media volume against the 2017–18 benchmark MLA's media volume decreased by 4% against the 2017–18 benchmark. However, media favourability increased as more coverage was achieved in key media outlets that reach red meat producers. More than 90% of MLA-related media carried a key favourable message.
Completed registrations to myMLA (MLA members and non-members) to exceed 35,000
myMLA registrations exceeded 40,000 as at June 2019.
High levels of MLA member user satisfaction (above 70%) with MLA digital communications
Satisfaction with MLA digital communications was 72%, based on MLA’s annual member survey.
E-newsletter subscription database growth of 5% MLA has seen a 14% increase in subscribers to its e-newsletter services and has introduced new e-news platforms to provide more relevant information to red meat producers, such as MSA's Making the Grade newsletter.

113
Overview
Report to stakeholders
About
MLA
Financial report
Supporting inform
ation
2018–19 KPI Status Commentary
Year-on-year increase in producer engagement through social media
MLA has seen followers increase by 20% across social media channels including Facebook, Twitter and LinkedIn.
Interactive electronic version of Annual Report published on MLA website
MLA launched a new online version of its Annual Report in 2018–19.
High levels of satisfaction (above 70%) recorded by attendees at MLA events
MLA is unable to track satisfaction across all events, however for MLA's key event, Red Meat 2018, a 90% satisfaction score was achieved.
PROGRAM: Corporate servicesSUB-PROGRAM: Corporate services
PILLAR 5: LEADERSHIP AND COLLABORATIVE CULTURECORPORATE SERVICES
Detailed 2017–20 sub-program business plans completed and approved by MLA Board, resulting in increased delegation levels for project approval
Business plans were approved by the MLA Board in May 2019, resulting in increased delegation levels.
Compliance management and oversight to ensure MLA Group operating in accordance with requirements of:
• Commonwealth Funding Agreement
• Corporate Governance framework – finance, legal and risk systems and processes
• maintenance of member registry
Funding Agreement Compliance report for 2018–19 completed by management, noting compliance on all matters.
Implement smart contract system to streamline MLA contracting process
New systems under development, for completion in 2019–20. Electronic signatures implemented in 2018–19.
Crisis Portal maintained and reflects the latest Risk Management Plan
The Crisis Portal is regularly maintained and the Risk Management Plan is updated to reflect learnings.
Risk Management Plan is maintained in accordance with the Board’s risk appetite and reflects industry context
The Risk Management Plan is maintained and regularly updated.
Clean audit report received 2017–18 accounts were audited by MLA's auditors in accordance with the annual plan and a clean audit received.
Internal audit program delivered to the satisfaction of the MLA Audit and Risk Committee
Internal audits were successfully delivered in accordance with the MLA Audit and Risk Committee work program.
Implement quarterly rolling forecasts from October 2017 Quarterly rolling forecasts for income and reserve management were fully implemented.
Ensure reporting to internal and external stakeholders is timely, accurate and insightful
Accurate quarterly reporting to peak industry councils and MLA Board was distributed on time.
Implement sub-program level evaluation system to track return on MLA investments against MLA Strategic Plan 2016–2020
Detailed evaluation framework implemented, tracking the return on MLA's 32 sub-programs via 18 economic models.
Commercialisation is focused on high-impact project outputs (products) and is integrated with program strategy and project approval activities
Twenty-four commercialisation agreements completed for high-impact products. High-impact products integrated into project approval and business planning processes.
Internal stakeholder satisfaction measured at >80% for MLA IT infrastructure Project Governance and Management
Internal stakeholder satisfaction measured at 94% for MLA IT Systems and Support.
Reduce project approval and contracting times by 30%, while maintaining or improving governance levels
New systems under development, for completion in 2019–20.
Simplify and fast-track current contract variation process, resulting in a 25% reduction in process times
Variation governance and audit enhanced, but process times not reduced.

114
APPENDIX B
COMARKETING PROGRAM PARTICIPANTS 2018–19
Lamb CoMarketing $
Andrews Meat Industries 2,533
China Marketing Solutions 4,419
Dardanup Butchering Co 33,247
Dorper Lamb 20,882
Fletcher International 1,407
Flinders Island Meat 6,500
JBS Australia 97,890
Junee Lamb 16,106
KC Natural 6,337
McMahon Brothers 2,800
McPhee Bros (Export) 803
Meat Tender 1,834
Mikoni Park 88
Mulwarra 24,550
Outback Lamb 3,501
Thomas Foods International 162,769
Top Cut Foods 9,426
V&V Walsh 13,599
WAMMCO 126,398
Western Meat Packers 2,399
White Stripe Foods 18,228
Total 555,716
Goat CoMarketing $
Gourmet Goat Lady 1,083
McPhee Bros (Export) 3,683
Thomas Foods International 11,199
Total 15,965
Beef CoMarketing (continued) $
Speckle Park Group 15,995
Stanbroke Beef 46,699
Stockyard Pty Ltd 55,215
Stone Axe Pastoral 17,500
Tabuan Pty Ltd 10,042
Tasmania Feedlot 80,000
Teys Australia 187,870
The North Australian Pastoral Co 54,362
Thomas Foods International 94,298
Top Cut Foods 10,374
Warmoll Foods 45,167
Western Meat Packers 11,401
White Stripe 38,617
Yearn Nutrition 3,955
Total 2,775,047
Beef CoMarketing $
AACo 135,740
Andrews Meat Industries 17,947
Arcadian Organic Meat 207,180
Argyle Prestige Meats 96,373
Australian Country Choice 16,392
Australian Meat Group 31,520
Australian Organic Meats 39,020
Beefcorp 11,525
Biggenden Meatworks 12,521
Bindaree Beef Group 98,432
China Marketing Solutions 4,675
Coral Coast Beef 6,075
Dardanup Butchering Co 46,566
Elanor Enterprises 20,492
Elders International 7,542
G&K O'Connor 5,779
Greenham Tasmania 167,914
Hancock Beef Marketing 1,174
Hardwick Meatworks 3,520
Harvey Industries Group 238,643
Irongate Nominees 1,358
JBS Australia 235,869
John Dee 4,247
KC Natural 1,139
Kilcoy Pastoral Company 72,529
Latitude 28 35,000
Lotte International 50,000
Margaret River Premium Meats 22,498
Matrad 35,000
McMahon Brothers 2,800
McPhee Bros (Export) 13,415
Meat Tender 1,000
Mort & Co 49,712
Mulwarra 30,235
Murray Greys 800
New England Exports 16,483
New World Foods 9,833
NH Foods 119,253
Nolan Meats 16,257
Northern Co-operative Meat Co 85,745
OBE Organic 30,997
Outback Beef 6,682
Providore Global 8,716
Rangeland Quality Meats 4,316
Rangers Valley 39,275
Richard Gunner Fine Meats 8,499
S Kidman & Co 4,438
Signature Beef 3,426
South Australian Cattle Co 25,000

115
Overview
Report to stakeholders
About
MLA
Financial report
Supporting inform
ationAPPENDIX C
RURAL R&D FOR PROFIT PROJECTS
The Australian Government’s Rural R&D for Profit program boosts funding to the rural Research and Development Corporations (RDCs) – of which MLA is one – for nationally coordinated, strategic research that delivers outcomes for Australian producers. Four rounds of funding have been announced to date. Below are the projects which have been awarded funding where MLA is either the lead or a partner organisation. For more information go to agriculture.gov.au and search ‘R&D for profit’.
Project Lead organisation
Round Contributors Total budget Expected finish date
Developing and commercialising advanced measurement technologies and feedback systems into globally competitive Australian meat value chains
MLA 4 Australian Meat Processor Corporation; Murdoch University; Australian Pork Limited; PorkScan Pty Ltd; University of Adelaide; Woolworths; JBS Australia; Teys Australia; Fletcher International Exports; Gundagai Meat Processors; Stockyard; WAMMCO; Primary Industries and Regions South Australia; Department of Primary Industries NSW; Department of Economic Development, Jobs, Transport & Resources Victoria; Department of Primary Industries and Regional Development WA; University of New England; University of Melbourne; University of Technology Sydney; Frontmatec Group; Angus Australia; Scott Automation and Robotics; Thomas Foods International; Coles
$19,043,427 5/4/22
Underpinning agricultural productivity and biosecurity by weed biological control
AgriFutures Australia
4 Grains Research & Development Corporation; Meat & Livestock Australia; Cotton Research & Development Corporation; CSIRO; Department of Primary Industries NSW; Queensland Department of Agriculture and Fisheries; Department of Economic Development, Jobs, Transport & Resources Victoria; AgForce; Bundaberg Regional Council; Castlereagh Macquarie County Council; Cramond Clan Environmental Consultants; Far North Queensland Regional Organisation of Councils; Gympie Regional Council; Hancock Queensland Plantations Pty Ltd; Hudson Pear Taskforce; Landcare Research; Malanda Beef Plan Group Inc; Mareeba Shire Council; Noosa & District Landcare Group Inc; NSW Environmental Trust; NSW Weed Biocontrol Taskforce; Primary Industries and Regions South Australia; South East Queensland Water; South East Local Land Services NSW; SunWater; Tablelands Regional Council; TasWeed Biocontrol; University of Queensland; University of Southern Queensland; US Department of Agriculture
$15,842,570 2022
Forewarned is forearmed: equipping farmers and agricultural value chains to proactively manage the impacts of extreme climate events
MLA 3 Grains Research & Development Corporation; AgriFutures Australia; Cotton Research & Development Corporation; Sugar Research Australia; Wine Australia; Dairy Australia; Australian Pork Limited; Australian Bureau of Meteorology; University of Melbourne; University of Southern Queensland; Queensland Department of Agriculture and Fisheries; Suncorp; Monash University; South Australian Research & Development Institute; Department of Economic Development, Jobs, Transport & Resources Victoria
$14,662,435 28/2/22
Wastes to profits: Technologies and business models for the management of wastes in the animal industries
MLA 3 Australian Meat Processor Corporation; Dairy Australia Limited; Australian Pork Limited; Queensland University of Technology; University of Queensland; University of Southern Queensland; Murdoch University; Pacific Northwest National Laboratory; JBS Australia; Teys Australia; Australian Country Choice; Australian Lamb Company; Harvey Beef; Ridley Corporation Ltd; Aduro Biopolymers; Zeolite Australia Pty Ltd; Barwon Water; Queensland Urban Utilities
$14,373,729 24/1/22
Soil engineers – community-based realisation and augmentation of soil ecosystem services from Dung beetles
MLA 3 CSIRO; Invetus Pty Ltd; University of Western Australia; Landcare Research New Zealand; Mingenew Irwin Group; University of New England; Charles Sturt University; WA Department of Agriculture and Food; Dung Beetles for Landcare Farming; Dung Beetle Solutions Australia; Warren Catchment Council; Leschenault Catchment Council
$22,693,536 31/3/22
Boosting profit and reducing risk of mixed farms in low and medium rainfall areas with newly discovered legume pastures enabled by innovative management methods
Grains Research & Development Corporation
3 Australian Wool Innovation; Meat & Livestock Australia; Murdoch University; South Australian Research & Development Institute; WA Department Agriculture and Food; Charles Sturt University; CSIRO
$16,558,866 28/4/22
Accelerating precision agriculture to decision agriculture
Cotton Research & Development Corporation
2 Meat & Livestock Australia; Dairy Australia; Grains Research & Development Corporation; Sugar Research Australia; AgriFutures Australia; Australian Wool Innovation; Horticulture Innovation Australia; Australian Pork Limited; Wine Australia; Forest and Wood Products Australia; Fisheries Research and Development Corporation; Australian Meat Processing Corporation; Australian Livestock Export Corporation Limited (LiveCorp); Australian Egg Corporation; Australian Farm Institute; Data to Decisions Cooperative Research Centre; University of New England; Griffith University; University of the Sunshine Coast; CSIRO
$3,557,976 Completed 2018 - report available

116
Project Lead organisation
Round Contributors Total budget Expected finish date
Globally competitive Australian meat value chains enabled by advanced measurement technologies and integrated flock feedback systems
MLA 2 Australian Pork Limited; Scott Technology Ltd; Murdoch University; University of Technology Sydney; WA Department of Agriculture and Food; VIC Department of Economic Development, Jobs, Transport and Resources; NSW Department of Primary Industries; South Australian Research and Development Institute; JBS Australia; Australian Cattle and Beef Holdings; Australian Country Choice Pty Ltd; Teys Australia Management Pty Ltd; Harvey Beed; Carometec; PorkScan Private; University of Melbourne; Australian Meat Processor Corporation
$11,947,000 1/8/19
Phosphorus efficient pastures – delivering high nitrogen and water use efficiently and reducing of production across southern Australia
MLA 2 Dairy Australia; Australian Wool Innovation; CSIRO; Department of Primary Industries NSW; University of Western Australia; Murdoch University; Bookham Agricultural Bureau; Tablelands Farming Systems; Central Ranges Grassland Society; Monaro Farming Systems; Association for Sheep Husbandry, Excellence, Evaluation and Production (ASHEEP); Southern Dirt; Boggabri grazing group; Purlewaugh NSW Farmers
$8,437,829 1/5/20
Improved surveillance, preparedness and return to trade for emergency animal disease incursions using FMD as a model.
MLA 2 CSIRO; Animal Health Australia; Charles Sturt University; Bureau of Meteorology; Australian Bureau of Agricultural and Resource Economics and Sciences; Australian Government Department of Agriculture – Animal Health Policy Branch
$11,739,936 30/6/20
Enhancing supply chain profitability through reporting and utilisation of peri-mortem information by livestock producers
Australian Pork Limited
2 Meat & Livestock Australia; Australian Meat Processor Association; South Australian Research & Development Institute; Department of Economic Development, Jobs, Transport & Resources Victoria
$1,725,594 30/6/20
Enhancing the profitability and productivity of livestock farming through virtual herding technology
Dairy Australia
2 Meat & Livestock Australia; Australian Wool Innovation; Australian Pork Limited; CSIRO; Tasmanian Institute of Agriculture at University of Tasmania; University of Sydney; University of New England; University of Melbourne; Agersens Pty Ltd
$3,965,000 1/5/20
Improved use of seasonal forecasting to increase farmer profitability
AgriFutures Australia
1 Cotton Research & Development Corporation; Grains Research & Development Corporation; Meat & Livestock Australia; Sugar Research Australia; Horticulture Innovation Australia; South Australian Research & Development Institute; WA Department of Agriculture and Food; Australian Bureau of Meteorology; University of Southern Queensland; Birchip Cropping Group; Department of Economic Development, Jobs, Transport & Resources Victoria; Department of Primary Industries NSW; Monash University
$5,388,698 Completed 2018
Stimulating private sector extension in Australian agriculture to increase returns from R&D
Dairy Australia
1 Meat & Livestock Australia; University of Melbourne; Cotton Research & Development Corporation; Australian Pork Limited; Sugar Research Australia; Horticulture Innovation Australia; Department of Economic Development, Jobs, Transport & Resources; Victoria Department of Primary Industries NSW
$3,190,000 Completed 2018
Waste to revenue: novel fertilisers and feeds
Australian Pork Limited
1 Dairy Australia; Sugar Research Australia; AgriFutures Australia; Meat & Livestock Australia; University of Queensland; University of Western Australia
$2,084,069 Completed 2018
Fast-tracking and maximising the long-lasting benefits of weed biological control for farm productivity
MLA 1 CSIRO; Department of Primary Industries NSW; Department of Primary Industries and Regions SA; Department of Agriculture and Fisheries Queensland; Department of Economic Development, Jobs, Transport & Resources Victoria; TasWeed Biocontrol; Murdoch University; NSW Local Land Service – Murray; Victoria Gorse Taskforce and Landcare Groups; Pilbara Mesquite Management Committee; South Australian Grains Industry Trust Fund; SA Government Adelaide and Mount Loft Ranges Natural Resources Management Board
$2,846,877 Completed 2018
Market and consumer insights to drive food value chain innovation and growth
MLA 1 Department of Economic Development, Jobs, Transport & Resources Victoria; Horticulture Innovation Australia; CSIRO; Australian Seafood Cooperative Research Centre; Fisheries Research & Development Corporation
$8,846,005 Completed 2018

117
Overview
Report to stakeholders
About
MLA
Financial report
Supporting inform
ation
Acronyms
AGM Annual General MeetingCSIRO Commonwealth Scientific and Industrial Research
OrganisationDEXA dual-energy X-ray absorptiometryEBV estimated breeding valueEU European UnionFTA free trade agreementKPI key performance indicatorLDL Livestock Data LinkLEP Livestock Export ProgramLPA Livestock Production Assurance MDC MLA Donor CompanyMLA Meat & Livestock AustraliaMSA Meat Standards AustraliaNLIS National Livestock Identification SystemNVD National Vendor DeclarationOTH Over-the-hooksR&D research and developmentRMAC Red Meat Advisory CouncilTPP Trans-Pacific PartnershipUAE United Arab EmiratesUS United States
GlossaryDual-energy X-ray absorptiometry (DEXA)An objective measurement tool which measures meat, fat and bone in a carcase.
Livestock Data Link (LDL)LDL is an online application that facilitates improved information sharing across the supply chain, enabling feedback to be received, analysed and compared in an efficient way.
Livestock Production Assurance (LPA)The LPA program is the Australian livestock industry’s on-farm assurance program covering food safety, animal welfare and biosecurity.
Meat Standards Australia (MSA)MSA is Australia’s eating quality grading system which predicts the eating quality of cuts within a carcase.
National Livestock Identification System (NLIS)NLIS is Australia’s system for the identification and traceability of cattle, sheep and goats. It ensures lifetime movements of these species can be identified and recorded within Australia.
National Vendor Declaration (NVD)Producers use the NVD to declare information about the food safety status of their livestock being sold. It is a key tool underpinning Australia’s food safety reputation for livestock.
About MLAAlignment with Australian Government priorities ...............................53 At a glance ...................................................................................................... 2 Board committees ......................................................................................57 Board Directors’ biographies ..........................................................63–65 Collaboration ................................................................................................55CoMarketing Program .......................................................................26, 114Consultation .................................................................................................55Corporate governance ...................................................................... 57–62Decision making processes .............................................................54–55Funding ..........................................................................................................56History ............................................................................................................... 2Human resources .......................................................................................69Locations ......................................................................................................... 3Members .......................................................................................................55MLA Leadership Team biographies .......................................................66Organisational chart ....................................................................................67Stakeholders ................................................................................................54Strategic framework ...................................................................................54Subsidiary companies ...............................................................................68
FinancialsDirectors’ report .......................................................................................... 74Financial report ............................................................................................70Financial summary ....................................................................................... 71
OperationsAnimal health and welfare .................................................................. 16–17 Automation ........................................................................................... 38–39Building capability................................................................................ 44–45Community engagement ..................................................................... 14–21Crisis planning ..............................................................................................46Events .......................................................................................................... 3, 51Genetics and genomics ............................................................................. 37Highlights ......................................................................................................... 4Key performance indicators .................................................................... 100Livestock exports .................................................................................. 40–41 Marketing ............................................................................................... 22–27Meat Standards Australia .................................................................... 30–31Nutrition ...................................................................................................20–21Objective carcase measurement .................................................... 38–39On-farm productivity ........................................................................... 36–37Off-farm productivity ........................................................................... 38–39Product integrity ................................................................................... 32–33Trade and market access ..................................................................24–25Risk management ................................................................................. 47, 58
IndexThe index is arranged by key area and then alphabetically word by word. References below indicate the primary reference/s.
ACRONYMS, GLOSSARY AND INDEX

118
MLA’s Annual Report 2018–19 is available online at mla.com.au/annualreport
Registered address:
Level 1, 40 Mount StreetNorth Sydney NSW 2060
Postal address:
PO Box 1961North Sydney NSW 2059
Phone: 02 9463 9333Fax: 02 9463 9393Website: www.mla.com.au
Meat & Livestock Australia LimitedABN 39 081 678 364