final notice of construction supporting information report ...g/kwm-hr grams per mechanical...
TRANSCRIPT

130 2nd Avenue South Edmonds, WA 98020
(425) 778-0907
June 11, 2014
Prepared for
The Microsoft Corporation One Microsoft Way
Redmond, Washington 98052
Final Notice of Construction
Supporting Information Report Microsoft Project Oxford Data Center
Quincy, Washington

06/11/14 P:\1409\001\010\FileRm\R\NOC Application\Final NOC Report Jun-2014\Final Project Oxford NOC_rpt-06-11-14.docx LANDAU ASSOCIATES
i
THIS REPORT HAS BEEN PREPARED TO PROVIDE SUPPORTING DOCUMENTATION FOR
WASHINGTON STATE DEPARTMENT OF ECOLOGY FORM NO. ECY 070-410, NOTICE OF
CONSTRUCTION APPLICATION: NEW PROJECT OR MODIFICATION OF EXISTING STATIONARY
SOURCE. EACH SECTION OF THIS REPORT PROVIDES A CROSS-REFERENCE TO THE
SECTION OF FORM NO. ECY 070-410 FOR WHICH SUPPORTING DOCUMENTATION IS BEING
PROVIDED.

06/11/14 P:\1409\001\010\FileRm\R\NOC Application\Final NOC Report Jun-2014\Final Project Oxford NOC_rpt-06-11-14.docx LANDAU ASSOCIATES
ii
TABLE OF CONTENTS
Page
LIST OF ABBREVIATIONS AND ACRONYMS vi
1.0 PROJECT DESCRIPTION (SECTION III OF NOC APPLICATION FORM) 1-1 1.1 FACILITY DESCRIPTION 1-1
1.1.1 Diesel-Powered Emergency Generators 1-1 1.1.2 Mechanical Draft Cooling Towers 1-2
1.2 GENERATOR RUNTIME SCENARIOS AND PROPOSED GENERATOR
RUNTIME LIMITS 1-4 1.2.1 Generator Activity at Idle Load (i.e., up to 10 Percent Load) 1-4 1.2.2 Generator Activity Designed for Approximately 80 Percent Average
Generator Load 1-5 1.2.3 Generator Activity Designed for a Wide Range of Generator Loads (Up to
100 Percent Load) 1-5 1.2.4 Infrequent or One-Time Generator Activity 1-6
1.3 COMPLIANCE WITH STATE AND FEDERAL REGULATIONS 1-7
2.0 AIR POLLUTANT EMISSIONS ESTIMATES (SECTIONS V AND VI OF
NOC APPLICATION FORM) 2-1 2.1 GENERATOR RUNTIME SCENARIOS AND FACILITY-WIDE FUEL USAGE 2-1 2.2 DERIVATION OF EMISSION FACTORS FOR DIESEL GENERATORS 2-1
2.2.1 Load-Specific Steady-State Emission Limits 2-1 2.2.2 Cold-Start ‘Black Puff’ Initial Spike Factors 2-2 2.2.3 Catalyst Cold-Start Activation Delay Period 2-3 2.2.4 Ammonia Slip Emission Calculation 2-4
2.3 FACILITY-WIDE EMISSION RATES FOR COMBINED PHASES 1 AND 2 2-4 2.3.1 Emissions From Diesel Emergency Generators 2-4 2.3.2 Emission Rates from Mechanical Draft Cooling Towers 2-5
3.0 EMISSION STANDARD COMPLIANCE (SECTION VII OF NOC APPLICATION FORM) 3-1
4.0 BEST AVAILABLE CONTROL TECHNOLOGY ANALYSIS (SECTION VIII OF
NOC APPLICATION FORM) 4-1 4.1 GENERAL APPROACH FOR BEST AVAILABLE CONTROL TECHNOLOGY
ASSESSMENT 4-1 4.2 STEPS 1, 2, AND 3: IDENTIFY FEASIBLE CONTROL TECHNOLOGIES FOR
DIESEL GENERATORS 4-2 4.3 STEP 4: EVALUATE TECHNICALLY FEASIBLE TECHNOLOGIES FOR
DIESEL GENERATORS 4-2 4.3.1 Methodology for Cost-Effectiveness Analyses For Diesel Generators 4-3 4.3.2 Cost-Effectiveness Analysis for Integrated Control Package
(DPF, DOC, Plus SCR) 4-4 4.3.3 Cost-Effectiveness Analysis for SCR By Itself 4-4 4.3.4 Cost-Effectiveness Analysis for Catalyzed DPF (DPF Plus DOC) 4-4 4.3.5 Cost-Effectiveness Analysis for DOC Alone 4-5 4.3.6 Toxics Best Available Control Technology for Toxic Air Pollutants 4-5
4.4 STEP 5: RECOMMENDED BEST AVAILABLE CONTROL TECHNOLOGY
FOR DIESEL EMERGENCY GENERATORS 4-6

06/11/14 P:\1409\001\010\FileRm\R\NOC Application\Final NOC Report Jun-2014\Final Project Oxford NOC_rpt-06-11-14.docx LANDAU ASSOCIATES
iii
4.5 BEST AVAILABLE CONTROL TECHNOLOGY FOR COOLING TOWER DRIFT 4-6
5.0 AMBIENT AIR QUALITY IMPACT ANALYSIS (SECTION IX OF NOC APPLICATION
FORM) 5-1 5.1 AIR DISPERSION MODELING – MODEL AND MODEL ASSUMPTIONS 5-1
5.1.1 Stack Heights and Building Downwash Input Parameter Modeling 5-1 5.1.2 Receptor Grid Spacing and Terrain Height Input Modeling 5-2 5.1.3 Meteorological Input Parameter Modeling 5-2 5.1.4 AERMOD Air Dispersion Modeling 5-3 5.1.5 Dispersion Factors and Plume Volume Molar Reaction Model
Reactive Plume Model 5-4 5.2 ASSUMED BACKGROUND CONCENTRATIONS 5-5 5.3 CRITERIA AIR POLLUTANT IMPACTS 5-6
5.3.1 24-Hour PM10 NAAQS Compliance During A Facility-Wide Power Outage 5-6 5.3.2 24-Hour PM2.5 NAAQS Compliance 5-7 5.3.3 1-Hour NO2 NAAQS Compliance During Annual
Electrical Bypass Maintenance 5-8 5.4 FIRST-TIER SCREENING OF TOXIC AIR POLLUTANT IMPACTS 5-9
5.4.1 Toxic Air Pollutant Emission Rates Compared to Small-Quantity
Emission Rates 5-9 5.4.2 Toxic Air Pollutant Ambient Concentration Impacts Compared to ASILs 5-10 5.4.3 Annual-Average DEEP Impacts 5-10 5.4.4 1-Hour NO2 Impacts During Facility-Wide Power Outage 5-10
6.0 SIGNATURES 6-1
7.0 REFERENCES 7-1

06/11/14 P:\1409\001\010\FileRm\R\NOC Application\Final NOC Report Jun-2014\Final Project Oxford NOC_rpt-06-11-14.docx LANDAU ASSOCIATES
iv
FIGURES
Figure Title
1 Vicinity Map
2 Site Plan
3 Maximum AERMOD Impact Locations
TABLES
Table Title
1 Emergency Generator Runtime Scenarios and Proposed Runtime Limits
2 Uncontrolled (EPA Tier 2-Compliant) Generator Emission Rates Applicable to Cold-Start
Conditions
3 Controlled [Tier 4 (Final) Compliant] Generator Emission Rates for Warmed-Up Conditions
4 Facility-Wide Emission Rates for Criteria Air Pollutants
5 Facility-Wide Emission Rates for Toxic Air Pollutants
6 Ranking of Technically Feasible Control Technologies
7 Summary of Cost-Effectiveness Analyses for Individual Criteria Air Pollutants
8 Summary of tBACT Cost Effectiveness for Toxic Air Pollutants
9 AERMET Model Input Parameters
10 Air Dispersion Modeling Results
11 24-Hour PM10 Compliance Modeling Results
12 24-Hour PM2.5 NAAQS Compliance Modeling Results
13 1-Hour NO2 NAAQS Compliance Modeling Results
APPENDICES
Appendix Title
A Generator Specifications
B Mechanical Draft Cooling Tower Technical Information
C Derivation of Theoretical Maximum 12-Month Emission Rates
D Derivation of Cold-Start Emission Factors
E Ammonia Emission Rates and Ambient Impact Calculations
F Best Available Control Technology Cost Spreadsheets
G Ambient Air Quality Modeling
H AERMOD Files (provided under separate cover)

06/11/14 P:\1409\001\010\FileRm\R\NOC Application\Final NOC Report Jun-2014\Final Project Oxford NOC_rpt-06-11-14.docx LANDAU ASSOCIATES
v
This page intentionally left blank.

06/11/14 P:\1409\001\010\FileRm\R\NOC Application\Final NOC Report Jun-2014\Final Project Oxford NOC_rpt-06-11-14.docx LANDAU ASSOCIATES
vi
LIST OF ABBREVIATIONS AND ACRONYMS
µg/m3 Microgram per Cubic Meter
AERMAP AMS/EPA Regulatory Model Terrain Pre-processor
AERMET AERMOD Meteorological Pre-Processor
AERMOD AMS/EPA Regulatory Model
AMS American Meteorological Society
ASIL Acceptable Source Impact Level
AZ Activity Zone
BACT Best Available Control Technology
BPIP Building Profile Input Program
CFR Code of Federal Regulations
CO Carbon Monoxide
CNR Core Network Room Buildings
DEEP Diesel Engine Exhaust Particulate Matter
DOC Diesel Oxidation Catalyst
DPF Diesel Particulate Filter
Ecology Washington State Department of Ecology
EPA U.S. Environmental Protection Agency
g/kWm-hr Grams per Mechanical Kilowatt-Hour
GEP Good Engineering Practice
HAP Hazardous Air Pollutant
kWe Kilowatts Electrical Output
m Meter
mg/L Milligrams per Liter
Microsoft The Microsoft Corporation
NAAQS National Ambient Air Quality Standards
NESHAP National Emission Standards for Hazardous Air Pollutants
NO2 Nitrogen Dioxide
NOC Notice of Construction
NOx Nitrogen Oxides
NSPS New Source Performance Standard
NSR New Source Review
NWS National Weather Service
PM Particulate Matter
PM2.5 Particulate Matter with an Aerodynamic Diameter Less Than or
Equal to 2.5 Microns
PM10 Particulate Matter with an Aerodynamic Diameter Less Than or
Equal to 10 Microns
PRIME Plume Rise Model Enhancements
PSD Prevention of Significant Deterioration
PVMRM Plume Volume Molar Reaction Model
RCW Revised Code of Washington
RICE Reciprocating Internal Combustion Engines
SCR Selective Catalytic Reduction
SO2 Sulfur Dioxide
SQER Small-Quantity Emission Rate
TAP Toxic Air Pollutant
TDS Total Dissolved Solids

06/11/14 P:\1409\001\010\FileRm\R\NOC Application\Final NOC Report Jun-2014\Final Project Oxford NOC_rpt-06-11-14.docx LANDAU ASSOCIATES
vii
LIST OF ABBREVIATIONS AND ACRONYMS (Cont.)
VOC Volatile Organic Compound
WAAQS Washington Ambient Air Quality Standards
WAC Washington Administrative Code
WCTI Water Conservation Technology International, Inc.

06/11/14 P:\1409\001\010\FileRm\R\NOC Application\Final NOC Report Jun-2014\Final Project Oxford NOC_rpt-06-11-14.docx LANDAU ASSOCIATES
1-1
1.0 PROJECT DESCRIPTION
(SECTION III OF NOC APPLICATION FORM)
1.1 FACILITY DESCRIPTION
This Final Notice of Construction (NOC) Supporting Information Report updates the version that
was originally submitted to the Washington State Department of Ecology (Ecology) on March 13, 2014,
to incorporate the information contained in follow-up submittals to Ecology after that date.
The Microsoft Corporation (Microsoft) proposes to construct and operate the Project Oxford Data
Center in Quincy, Washington (Figure 1). This document has been prepared for Microsoft to support the
submittal of an NOC application for installation and operation of new emergency generators and
mechanical draft cooling towers, under air quality regulations promulgated by Ecology. The Project
Oxford Data Center will be located approximately ¾ mile west of Microsoft’s existing Columbia Data
Center. Construction of the Project Oxford Data Center will be conducted in four phases. Phases 1 and 2
are expected to begin construction before the end of 2015, while the construction of Phases 3 and 4 will
be based on market demand and is unlikely to begin before 2016. Under state regulations, an NOC
approval becomes invalid if construction of the source is not commenced within 18 months of receipt of
the NOC approval unless Ecology approves an extension of the NOC approval [WAC 173-400-111(7)].
Therefore, this NOC application addresses the air permitting requirements associated with the
construction of Phases 1 and 2. Future phases of construction at the Project Oxford Data Center will be
permitted, if appropriate, when actual plans and specifications are developed and when those phases are
funded for construction.
Phases 1 and 2 collectively include the construction of eight “Activity Zone (AZ)” buildings that
will house banks of servers to support Microsoft’s services. Additional equipment will be housed in the
“Core Network Room (CNR)” buildings and an administrative building. The data center will be equipped
with stable electrical power delivery systems, air cooling and cleaning systems, and emergency back-up
diesel power generation capability. The project will also include site infrastructure, such as the
development of internal roads for traffic egress/access and internal circulation, and parking for employees
and visitors, as well as all required utility corridors to support the data center buildings. A site plan for
Phases 1 and 2 of the proposed development is provided on Figure 2.
1.1.1 DIESEL-POWERED EMERGENCY GENERATORS
This section describes emissions from the exhaust stacks of the diesel-fired engines that are
included with each generator. The generator includes a diesel-powered engine that drives an alternator
section to produce electricity. The alternator section does not emit any air pollutants, so the overall
06/11/14 P:\1409\001\010\FileRm\R\NOC Application\Final NOC Report Jun-2014\Final Project Oxford NOC_rpt-06-11-14.docx LANDAU ASSOCIATES
1-2
emissions from a diesel generator are produced only from the diesel engine. The terms “generator” and
“engine” are used interchangeably in this report. State and federal air quality regulations apply only to
the emissions from the diesel engines.
Appendix A includes specifications for the Caterpillar diesel generators to be used. Each of the
eight AZ buildings for Phases 1 and 2 will be supported by four diesel-powered emergency generators,
each rated at 2,500 kilowatts electrical capacity (kWe). In addition, the combined CNR buildings will be
supported by four 2,000-kWe diesel-powered emergency generators, while the administration building
will be supported by one 750-kWe diesel generator. Therefore, the combined Phases 1 and 2 will require
a total of 37 emergency generators.
Each generator will be operated only as an emergency generator, with generator usage and
runtime hours limited to those for “emergency generators” by the federal New Source Performance
Standard (NSPS) Subpart IIII. NSPS Subpart IIII requires that emergency engines satisfy Tier 2 emission
standards as defined by the federal regulations (40 CFR Part 89). Even though the federal regulations
require the emergency generators to satisfy only U.S. Environmental Protection Agency (EPA) Tier 2
emission limits, Microsoft voluntarily proposes the use of an emission control package designed to satisfy
the EPA Tier 4 (Final) emission standards based on the weighted average of testing at five engine loads.
To achieve the more protective emission limits, Microsoft will equip each of the emergency generators
with a catalyzed diesel particulate filter (DPF) to reduce particulate emissions and urea selective catalytic
reduction (SCR) to reduce emissions of nitrogen oxides (NOx) and nitrogen dioxide (NO2). The SCR
catalysts used to control NOx emissions will emit small amounts of ammonia gas as a result of “ammonia
slip.” To provide a high removal efficiency for NOx, urea must be injected into the catalyst system at
nearly stoichiometric rates. A small amount of the injected urea nitrogen does not react with NOx inside
the catalyst, and that extra urea forms ammonia that is emitted through the exhaust stack.
Each of the emergency generators will be housed inside its own acoustical enclosure at the
locations shown on Figure 2. Each generator enclosure will have its own 46-foot-tall vertical exhaust
stack. Serial numbers for the proposed generators will be provided to Ecology once the generators have
been ordered and the serial numbers are available from the manufacturer. Specifications for the proposed
new generators and their diesel engines are provided in Appendix A.
1.1.2 MECHANICAL DRAFT COOLING TOWERS
Technical information for the mechanical draft cooling towers is provided in Appendix B. As
shown on Figure 2, each of the eight AZ buildings will be supported by four mechanical draft cooling
towers, to provide cold air and water to the AZ buildings’ air handling systems. The cooling towers will
not be pre-treated with toxic chemicals, but the dissolved solids in the recirculation water will emit

06/11/14 P:\1409\001\010\FileRm\R\NOC Application\Final NOC Report Jun-2014\Final Project Oxford NOC_rpt-06-11-14.docx LANDAU ASSOCIATES
1-3
cooling tower drift droplets that will evaporate downwind to form particulate emissions. Each of the 32
cooling towers (eight AZ buildings, each with four cooling towers) will have multiple cells, and each cell
will have its own induced draft fan.
Microsoft is currently considering options for the source of the water supplied to its cooling
towers (City water supply from local wells, or pre-treated reused industrial wastewater to be provided by
the City of Quincy). For this NOC permit application, the cooling tower water supply option that would
result in the highest cooling tower emission rates is presented. The makeup water to the cooling towers
is, therefore, assumed to be pre-treated wastewater from the City of Quincy’s industrial wastewater
treatment plant. The pre-treated wastewater will be treated further before being fed to the cooling towers,
using a polishing treatment process consisting of a combination of coagulation, sand filtration, and
possibly reverse osmosis treatment. It is uncertain at this time if the pre-treated water fed to the cooling
towers will require further treatment using chlorine disinfection, so for this air quality permit application
it was conservatively assumed that the water will be disinfected, and the emission inventory accounted for
possible concentrations of residual chlorine disinfection byproducts that would eventually volatilize from
the cooling towers. The approximate concentrations of trace metals and chlorine disinfection byproducts
that were assumed to be present in the cooling tower makeup water are provided in Appendix B.
The recirculation water in the cooling towers will be pre-softened using the proprietary Water
Conservation Technology International (WCTI) “pre-treatment system” to replace scale-forming mineral
compounds (e.g., calcium and magnesium) with other non-toxic, non-scaling mineral compounds (e.g.,
sodium), which will allow the cooling towers to be operated with very high “cycles of concentration.”
The elevated cycles of concentration will cause total dissolved solids (TDS) in the recirculation water to
reach concentrations of 69,000 milligrams per liter (mg/L). This will provide an overall water quality
benefit because Microsoft will require less makeup water and will discharge only relatively low volumes
of cooling tower blowdown to the municipal sewer system. However, the elevated TDS concentrations in
the recirculation water will increase the drift particulate emissions from the cooling towers compared to
similar towers that do not use the WCTI pre-treatment system. For the purpose of estimating drift
emission rates, the key operational parameters for the 32 cooling towers are as follows:
Water recirculation flow rate in each of the 32 cooling towers: 950 gallons per minute based
on site-specific cooling system calculations (Cheng, R., 2014, personal communication).
TDS concentration in recirculation water: 69,000 mg/L (46 cycles of concentration compared
to the estimated TDS concentration of 1,500 mg/L in the cooling tower makeup water).
Drift eliminator efficiency: Drift droplets limited to 0.0005 percent of recirculation flow rate.
Based on the above assumptions, the calculated emission rate for evaporated solid particles
(total suspended particulates) emitted as cooling tower drift is 0.1643 pounds per hour from
each of the 32 cooling towers. For the purpose of AERMOD to demonstrate compliance with
the National Ambient Air Quality Standards (NAAQS) for this NOC application, it was

06/11/14 P:\1409\001\010\FileRm\R\NOC Application\Final NOC Report Jun-2014\Final Project Oxford NOC_rpt-06-11-14.docx LANDAU ASSOCIATES
1-4
determined that only 13 percent of the evaporated solid drift particles are smaller than 2.5
microns in diameter and only 56 percent are smaller than 10 microns diameter, based on
manufacturer data on the size distribution of the liquid droplets emitted from the cooling
towers (see Appendix B for an analysis of the size distribution of the liquid droplets and the
evaporated solid particles).
In addition, the vapor emission rates of volatile chlorine disinfection byproducts present in the
cooling tower makeup water provided by the City were calculated based on an estimated facility-wide
makeup water flow rate of 300 gallons per minute (Cheng, R., 2014, personal communication), and based
on historical aqueous concentrations of constituents found in the City water (see Appendix B for
analytical data). It was assumed that all of the volatile constituents in the makeup water will be emitted as
vapors.
Because Microsoft will pre-treat the cooling tower makeup water using the WCTI softening
system, water treatment chemicals will not need to be added to prevent corrosion or scaling.
1.2 GENERATOR RUNTIME SCENARIOS AND PROPOSED GENERATOR
RUNTIME LIMITS
The emission estimates and ambient impact modeling presented in this permit application are
based on the following operating modes for the 37 new generators (summarized in Table 1), which are
categorized based on the generator load during each activity. This section also describes Microsoft’s
proposed runtime limits to reduce emissions to comply with the NAAQS for NO2 and particulate matter
with an aerodynamic diameter less than or equal to 2.5 microns (PM2.5). No runtime limits are required to
comply with the Acceptable Source Impact Level (ASIL) for NO2, which is governed by the emissions
from all facility-wide generators during a full power outage. The emissions and annual-average ambient
impacts for diesel engine exhaust particulate matter (DEEP) are governed by the annual runtime limits
specified in Table 1. Microsoft requests that if Ecology sets annual hourly runtime limits in the Approval
Order, then those runtime limits should be specified as the combined runtimes at each generator load with
the averaging provisions listed in Table 1.
1.2.1 GENERATOR ACTIVITY AT IDLE LOAD (I.E., UP TO 10 PERCENT LOAD)
Microsoft will operate each generator for up to 29 hours per year at idle load, represented as a
generator load of up to 10 percent. This category of runtime will include scheduled weekly generator
testing, and “generator cooldown” when each generator that is operated for more than ½ hour at high load
(i.e., greater than 50 percent load) must be cooled down by running at idle (i.e., up to 10 percent load) for
10 minutes to allow the generator to cool down. Manufacturer data for emissions at 10 percent load were
used to represent emissions at idle conditions up to 10 percent load.
06/11/14 P:\1409\001\010\FileRm\R\NOC Application\Final NOC Report Jun-2014\Final Project Oxford NOC_rpt-06-11-14.docx LANDAU ASSOCIATES
1-5
1.2.2 GENERATOR ACTIVITY DESIGNED FOR APPROXIMATELY 80 PERCENT AVERAGE
GENERATOR LOAD
Microsoft will operate each generator for up to 40 hours per year for two combined runtime
activities:
Unplanned power outages. In the event of a power outage, all of the 37 generators would
activate at an approximate average of 80 percent load for the duration of the outage.
Scheduled annual electrical bypass for switchgear and transformer maintenance. Every
year, each of the transformers within the AZ and CNR buildings will undergo preventive
maintenance, during which time one generator at a time in each building will be operated at
an average of approximately 80 percent load to bypass power around the transformer until the
maintenance is completed. Microsoft proposes the following operational limits to ensure
compliance with the NAAQS:
– For the purpose of reducing emissions to comply with the 1-hour NAAQS for NO2,
Microsoft will limit the generator usage for electrical bypass transformer maintenance to
no more than four generators operating simultaneously on any given hour, at an average
generator load of approximately 80 percent (averaged across all generators being used on
any given day for electrical bypass maintenance).
– For the purpose of reducing emissions to comply with the 24-hour PM2.5 NAAQS,
Microsoft will limit the maximum daily generator usage for electrical bypass transformer
maintenance to no more than 192,000 kWe-hours per day. That maximum daily limit is
equivalent to four generators operating at 80 percent generator load for a full 24-hour
day, but Microsoft may use more than four generators on any single day as long as the
total usage is less than 192,000 kWe-hours per day.
1.2.3 GENERATOR ACTIVITY DESIGNED FOR A WIDE RANGE OF GENERATOR LOADS
(UP TO 100 PERCENT LOAD)
Certain types of activities will require Microsoft to cycle the generators over a range of loads,
from idle up to 100 percent. Microsoft will operate each generator for up to 17.5 hours per year for the
three combined activities described below. For the purpose of simplifying the emission calculations, all
generator runtime in these categories was assumed to be done at 100 percent generator load because that
load represents a conservatively high emission rate.
Monthly Testing. Each generator will be subject to load-bank testing, cycling between idle
to 100 percent load.
Semiannual Testing and DPF Regeneration. Every 6 months, each generator will be
cycled between loads from idle to 100 percent. The amount of runtime at 100 percent load
will be extended as needed to regenerate the DPFs, to burn off accumulated particulate
matter.
As-Needed Corrective Testing. If the weekly or monthly testing indicates a problem with
any generator, then Microsoft may be required to conduct additional diagnostic testing on that
generator.

06/11/14 P:\1409\001\010\FileRm\R\NOC Application\Final NOC Report Jun-2014\Final Project Oxford NOC_rpt-06-11-14.docx LANDAU ASSOCIATES
1-6
For the purpose of reducing emissions to comply with the 1-hour NAAQS for NO2, Microsoft
will limit the generator usage for generator testing at 100 percent load to no more than three generators
operating simultaneously during any given hour.
1.2.4 INFREQUENT OR ONE-TIME GENERATOR ACTIVITY
In addition to the routine annual scenarios described above and listed in the top section of
Table 1, the AERMOD modeling for annual-average ambient impacts for criteria air pollutants and toxic
air pollutants also accounted for emissions from the following occasional, one-time-only operating modes
or occasional recurring operating modes:
Startup Commissioning (One Time Only). Each generator will undergo up to 50 hours of
onsite commissioning testing before it is released by the supplier for use at the data center.
The commissioning tests will be spread over approximately 12 operating days spread over a
multi-week calendar period. Although commissioning testing will be done by running each
generator across a range of loads, for this permit application the emission calculations
assumed that all of the commissioning runtime will be done at an average of 80 percent load.
The estimated fuel usage to commission each generator is 7,630 gallons. The commissioning
emissions from each generator were distributed over a 70-year period for the purpose of
modeling the 70-year annual-average emissions of DEEP. As described in the technical
memorandum in Appendix C, the commissioning activity will not contribute to the theoretical
maximum 12-month emission rates because there will be a substantial lag time between the
end of generator commissioning and the start of routine data center operation. A detailed
breakdown of the approximate operating conditions for commissioning a typical generator is
shown in the table below.
Commissioning Test Typical
Runtime Hours Typical Generator Load (percent electrical load)
No. of Generators at Same Time
Full Load Test 20 100% Typically 1-2
Step Test 2 0-100% (average 50%) Typically 1-2
Generator/Utility Transfer Test
4 0-100% (average 50%) Typically 1-2
Electrical System Generator Compatibility Test
4 0-100% (average 50%) Typically 1-2
Mechanical System Generator Compatibility Test
4 0-100% (average 50%) Typically 1-2
Integrated System Test 4 50-100% (average 80%)( 4
Uninterrupted Power System Compatibility Test
10 0-100% (average 50%) Typically 1-2
TOTALS Approx. 48 Overall average approximately 80% Maximum of 4 generators
at a time
Recurring Compliance Stack Testing. Ecology has required most data centers to conduct
periodic stack emission testing for their diesel generators. Source testing requires engine
runtime. As a conservative assumption for this NOC application, the emission estimates and
ambient air quality analyses account for a conservatively high intensity of stack testing of up
to two generators per year, on a 3-year recurring basis.
06/11/14 P:\1409\001\010\FileRm\R\NOC Application\Final NOC Report Jun-2014\Final Project Oxford NOC_rpt-06-11-14.docx LANDAU ASSOCIATES
1-7
1.3 COMPLIANCE WITH STATE AND FEDERAL REGULATIONS
The engines on the proposed generators will comply with the following applicable air regulations,
in accordance with the Clean Air Act. These requirements are specified in:
Chapter 70.94 Revised Code of Washington (RCW) (Washington Clean Air Act)
Chapter 173-400 Washington Administrative Code (WAC) (General Regulations for Air
Pollution Sources)
Chapter 173-460 WAC (Controls for New Sources of Toxic Air Pollutants)
40 Code of Federal Regulations (CFR) Part 60 Subpart A (General Provisions)
40 CFR Part 60 Subpart IIII (Stationary Compression Ignition Internal Combustion Engines)
40 CFR Part 63 Subpart ZZZZ [National Emission Standards for Hazardous Air Pollutants
(NESHAP) for Reciprocating Internal Combustion Engines (RICE)].
Specifically, the proposed project includes sources of air contaminants and will follow applicable
air contaminant regulations as listed in:
RCW 70.94.152
WAC 173-400-113
WAC 173-460-040.
The facility is located in an attainment area for all Clean Air Act criteria pollutants. Since the
maximum potential-to-emit for all criteria pollutants will be less than 250 tons per year, the permittee is
applying for an approval order to meet minor New Source Review (NSR) requirements. Facilities that
produce more than 100 tons per year of any criteria pollutant are considered major sources under the
federal regulation 40 CFR Part 70 and the state regulation WAC 173-410 et seq., and those that produce
less than 100 tons per year are considered minor sources. Potential-to-emit estimates provided in Section
2.0 demonstrate that the facility will emit:
Less than 100 tons per year of any criteria pollutant [particulate matter (PM), carbon
monoxide (CO), nitrogen dioxide (NO2), sulfur dioxide (SO2), and volatile organic
compounds (VOCs)
Less than 10 tons per year of any EPA hazardous air pollutant (HAP)
Less than 25 tons per year of total HAPs.
As a result, neither a Prevention of Significant Deterioration (PSD) NSR pre-construction permit
nor a Title V operating permit is required.
All of the generators will be operated in a manner that satisfies the definition of “emergency
engines” according to the federal regulations NSPS Subpart IIII and NESHAP Subpart ZZZZ. Therefore,
NSPS Subpart IIII requires that each generator shall be manufactured and certified to meet EPA Tier 2
emission limits. The applicable sections of NESHAP Subpart ZZZZ indicate that compliance with the
NESHAP for emergency engines requires each generator to meet the EPA Tier 2 emission standards, and

06/11/14 P:\1409\001\010\FileRm\R\NOC Application\Final NOC Report Jun-2014\Final Project Oxford NOC_rpt-06-11-14.docx LANDAU ASSOCIATES
1-8
each generator must be operated and maintained in accordance with the requirements of NSPS
Subpart IIII.
The mechanical draft cooling towers are not subject to the federal NESHAP (40 CFR Part 63
Subpart Q, Industrial Process Cooling Towers) because the Project Oxford Data Center will not emit
hazardous air pollutants at rates high enough to designate the facility as a major source. Regardless,
Microsoft will comply with the main operational restriction that would be required under that NESHAP.
Microsoft will not use chromium-containing chemicals to pre-treat the cooling tower makeup water.
06/11/14 P:\1409\001\010\FileRm\R\NOC Application\Final NOC Report Jun-2014\Final Project Oxford NOC_rpt-06-11-14.docx LANDAU ASSOCIATES
2-1
2.0 AIR POLLUTANT EMISSIONS ESTIMATES
(SECTIONS V AND VI OF NOC APPLICATION FORM)
Air pollutant emission rates were calculated for the sources identified in Section 1.0 per the
requirements of WAC 173-400-113 and WAC 173-460-050. Emission rates were quantified for criteria
pollutants and toxic air pollutants (TAPs). The basis for emissions calculations is described in the
following sections. Detailed emission calculation spreadsheets are provided in Appendix C.
2.1 GENERATOR RUNTIME SCENARIOS AND FACILITY-WIDE FUEL
USAGE
Table 1 lists the forecast generator runtime modes and the anticipated maximum runtime during
each mode of operation. If each generator operated at its maximum anticipated duration for each mode of
operation, then each generator would operate for an average of 86.5 hours per year at a range of loads, not
including initial generator commissioning or periodic stack emission testing. If initial commissioning and
periodic stack testing are included, then the 70-year average runtime used to assess long-term DEEP
emissions is equivalent to 88.3 hours per generator.
The maximum theoretical facility-wide generator runtime during the maximum 12-month period
would occur while both Phase 1 and Phase 2 are operating, during a year when three generators are stack-
tested. During that maximum 12-month period, each of the generators subject to stack testing could
operate for up to 116 hours (86.5 hours for routine operation, plus 30 hours for stack emission testing). A
detailed description of how the generator runtimes and generator emissions were derived for the
theoretical maximum 12-month period is provided in Appendix C. The theoretical maximum 12-month
emission rates are only slightly higher than the 70-year average emission rates, due to the conservatively
high assumptions used to develop the 70-year averages. For example, the theoretical maximum 12-month
DEEP emission rate is only 0.9 percent higher than the 70-year average.
As listed in the generator specification sheets provided in Appendix A, the hourly fuel
consumption varies depending on the generator load. If all 37 generators operated at the maximum
runtimes listed in Table 1, then the combined generators would use a total of 431,000 gallons per year
during the maximum theoretical 12-month period of operation (see the calculation spreadsheets in
Appendix C for the derivation of this facility-wide fuel consumption).
2.2 DERIVATION OF EMISSION FACTORS FOR DIESEL GENERATORS
2.2.1 LOAD-SPECIFIC STEADY-STATE EMISSION LIMITS
Two sets of load-specific emission forecasts were developed. The first set of data assumes the
generators will emit in a manner consistent with the EPA Tier 2 emission standards, which would occur

06/11/14 P:\1409\001\010\FileRm\R\NOC Application\Final NOC Report Jun-2014\Final Project Oxford NOC_rpt-06-11-14.docx LANDAU ASSOCIATES
2-2
during the first 10 to 15 minutes after a cold start while the emission control catalysts heat up to their
activation temperature. The load-specific emission factors for the “Tier 2 cold start period” are listed in
Table 2. These load-specific emission data were derived from Tier 2 emission data provided by the
generator manufacturers. The listed emission estimates for particulate matter include adjustment factors
to account for condensable PM (the “back-half” particulate fraction measured by EPA Method 202). All
of the emission calculations used for this permit application account for back-half PM. By doing so, this
permit application provides a conservatively high estimate of the PM emissions. As described later, even
with that conservative assumption the ambient impact assessment demonstrated compliance with all PM
ambient limits.
The second set of emission data applies to the controlled, fully warmed up, steady-state condition
that begins 10 to 15 minutes after a cold start, after the emission control catalysts are activated. These
controlled emission rates are listed in Table 3. These controlled emission rates were derived from limited
data from equipment manufacturers. The manufacturers’ load-specific controlled emission data were
adjusted upward so the resulting five-load weighted average emission rates are equal to the average
emission limits allowed under the EPA Tier 4 (Final) regulation. Two sets of emission data for PM are
listed in Table 3. One set of data shows the estimated emission rates of “filterable fraction” or “front-half
fraction” measured by EPA Method 5. The second set of data shows the estimated emission rates for the
combined front-half fraction plus back-half fraction measured by combined EPA Methods 5/202. All of
the emission calculations used for this permit application account for back-half PM, to provide a
conservatively high estimate of PM emission rates and ambient PM impacts.
The emission factors for gaseous organic TAPs were derived based on emission factors from
EPA’s AP-42 (EPA 1995), with an assumed 90 percent destruction efficiency provided by the oxidized
DPF included in the emission control package. The DEEP emissions were assumed to be equal to the PM
emission rates, including the sum of the front-half plus back-half particulates. The emission rate for
primary NO2 emitted directly from the generator exhaust stack was estimated to be 10 percent of the total
oxides of nitrogen (NOx).
2.2.2 COLD-START ‘BLACK PUFF’ INITIAL SPIKE FACTORS
The emission data described in the previous section are based on manufacturer test data that apply
to steady-state operating conditions after the generator being tested has warmed up. However, most of the
runtime scenarios at the Project Oxford facility require a “cold start.” It is widely recognized that all
diesel generators exhibit a brief “black puff” spike in emissions of PM, CO, and VOCs lasting for several
seconds immediately after the generator is activated, during which time the generator burns off fuel and
crankcase oil that has accumulated on the cold engine cylinders. To account for this, the initial 10- to 15-

06/11/14 P:\1409\001\010\FileRm\R\NOC Application\Final NOC Report Jun-2014\Final Project Oxford NOC_rpt-06-11-14.docx LANDAU ASSOCIATES
2-3
minute average emission factors for PM, CO, VOCs, and NOx were adjusted upward by the following
“black puff cold start spike” factors:
PM: 1.26
CO: 1.56
VOCs: 1.26
NOx: 1.00.
The “black puff cold start spike factors” were derived based on limited test data from the
California Energy Commission document Air Quality Implications of Backup Generators in California
(CEC 2005). Details on the derivation are provided in Appendix D. The cold-start adjusted emission
factors used for emission calculations and air quality dispersion modeling for DEEP, CO, and VOCs were
calculated by multiplying the steady-state emission factor times the relevant cold-start factor. A black-
puff cold-start factor of 1.0 was used for NOx because the California Energy Commission tests showed no
short-term spike in NOx emissions during a cold start. The black-puff cold-start spike factor applied to
PM is conservatively high. In reality, it is likely PM emissions will experience a less intense short-term
spike upon startup, because each generator will be equipped with a DPF that will likely remove solid
particles from the generator emissions during the initial startup regardless of the initial exhaust
temperature.
2.2.3 CATALYST COLD-START ACTIVATION DELAY PERIOD
After a cold start and the initial 10-second “black puff,” some of the emission control devices do
not begin to function until the catalysts heat up to their activation temperatures. The DPF functions
immediately during a cold start, but the oxidation catalyst embedded in the DPF and the SCR catalyst
experience cold-start delays. For the purpose of calculating emissions after a cold start, the following
delay periods were assumed:
Cold start under idle load (i.e., up to 10 percent load). It was assumed that the oxidation
catalyst and the SCR catalyst would be delayed by 15 minutes, during which time the VOC,
CO and NOx emissions would be the equivalent of a generator equipped with EPA Tier 2
emission controls (Table 2). After the initial delay, subsequent emissions would be the
equivalent of a generator capable of meeting EPA Tier 4 (Final) emission standards (Table 3).
Cold start under high load. It was assumed that the oxidation catalyst and the SCR catalyst
would be delayed by 10 minutes, during which time the VOC, CO and NOx emissions would
be the equivalent of a generator equipped with EPA Tier 2 emission controls (Table 2). After
the initial 10-minute delay, subsequent emissions would be the equivalent of a generator
capable of meeting EPA Tier 4 (Final) emission standards (Table 3).

06/11/14 P:\1409\001\010\FileRm\R\NOC Application\Final NOC Report Jun-2014\Final Project Oxford NOC_rpt-06-11-14.docx LANDAU ASSOCIATES
2-4
2.2.4 AMMONIA SLIP EMISSION CALCULATION
Ammonia emissions were calculated based on an assumed emission factor of 0.32 pounds of
ammonia per hour per MWe of electrical output, which was derived based on the allowable ammonia slip
emissions for similar diesel-powered generators at the Vantage Data Center in Quincy. Ammonia slip
occurs only during fully warmed-up operating conditions because the control system is designed to inject
urea into the system only after the SCR catalyst reaches its normal operating temperature. Therefore,
there are no “cold start” adjustments for ammonia emissions.
Emission calculations for the hourly, daily, and annual-average ammonia emission rates are
presented in Appendix E.
2.3 FACILITY-WIDE EMISSION RATES FOR COMBINED PHASES 1 AND 2
2.3.1 EMISSIONS FROM DIESEL EMERGENCY GENERATORS
The bid specification issued by Microsoft requires that all generators be certified by the EPA to
meet emission standards for emergency generators, and that each generator be equipped with emission
controls to reduce the emissions to be “Tier 4 (Final)-Compliant” [i.e., the controlled emission rates must
satisfy the EPA Tier 4 (Final) emission standards expressed as the five-load weighted average as specified
by federal regulations 40 CFR Part 89].
Conservatively high load-specific emission rates for each pollutant were developed for this permit
application by using the following general steps (detailed information on the emission calculations is
provided in the calculation spreadsheets in Appendix C):
The generators were assumed to exhibit gaseous pollutant emissions equivalent to a Tier 2
generator during the first 10 to 15 minutes after each cold start. Load-specific, vendor-
supplied emissions data were obtained from three generator manufacturers (Cummins,
Caterpillar, and MTU). At each load, the “uncontrolled” (Tier 2-compliant) emissions rate
was selected as the highest of any of the values provided by the three manufacturers. Then,
to further simulate the uncontrolled emissions during the initial period after a cold start, the
“cold start spike factors” described previously were applied to the worst-case Tier 2-
compliant emission rate. The resulting uncontrolled (Tier 2-compliant) emission rates are
listed in Table 2.
After the first 10 to 15 minutes after a cold start (consisting of the 10-second “black puff
spike” followed by the catalyst cold start delay period), each generator was assumed to
exhibit warmed-up emissions rates with a five-load weighted average equal to the EPA Tier 4
(Final) emissions standard. Field test data for load-specific emissions rates from a Tier 4
(Final)-compliant generator were obtained from Cummins. The load-specific emissions rates
from the Cummins generator were scaled upward, until the five-load weighted average
equaled the Tier 4 (Final) standard.
Removal efficiency data for SCR control devices on controlled Caterpillar engines were
obtained from Caterpillar. If the Caterpillar data indicated a higher emissions rate at any
given load than the Cummins data, then the higher Caterpillar data were used.
06/11/14 P:\1409\001\010\FileRm\R\NOC Application\Final NOC Report Jun-2014\Final Project Oxford NOC_rpt-06-11-14.docx LANDAU ASSOCIATES
2-5
Load-specific information for condensable particulates (i.e., “back-half particulates”) were
available from Caterpillar and MTU. Those data were used to develop load-specific
emissions rates for condensable PM.
The resulting warmed-up emissions rates [Tier 4 (Final)-compliant rates] are listed in
Table 3. Microsoft anticipates that if Ecology requires stack testing for demonstration of
compliance with permit conditions, then all testing will be conducted under warmed-up
conditions.
The facility-wide emission rates for each pollutant emitted by the emergency generators were
calculated by applying the load-specific hourly emission rate data from Table 2 and Table 3 to the
generator runtime forecasts listed in Table 1. Table 4 lists the forecast short-term and annual-average
emission rates for the criteria pollutants (NOx, PM, CO, and VOCs), for both the 70-year average
emission rates and the theoretical maximum 12-month emission rates. The annual-average facility-wide
emission calculations include runtimes for initial generator commissioning and periodic stack emission
testing. The emission calculations include adjustment factors for the “initial spike cold start” and the 10-
to 15-minute cold-start delay before the emission control catalysts reach their activation temperature. The
emission calculations for PM include the sum of the front-half and back-half fractions.
Table 5 lists the forecast facility-wide emission rates for the TAPs regulated under WAC
173-460. The averaging period for each TAP is consistent with the averaging period specified by the
Ecology regulation. The annual values listed in Table 5 apply to the maximum theoretical generator
runtime during any 12-month period. For each pollutant, the forecast facility-wide emission rate is
compared to its Small-Quantity Emission Rate (SQER), and a “SQER Ratio” is calculated by dividing the
facility-wide emission rate by the SQER. If the SQER Ratio for a given TAP exceeds 1.0, then the
ambient concentration for that TAP must be estimated using the American Meteorological Society
(AMS)/EPA Regulatory Model (AERMOD) dispersion model, and the health impacts for that TAP must
be accounted for. As listed in Table 5, the emission rates for only four TAPs were forecast to exceed their
respective SQERs:
DEEP
NO2
CO
Ammonia
Acrolein.
2.3.2 EMISSION RATES FROM MECHANICAL DRAFT COOLING TOWERS
The emission rates for criteria pollutants and TAPs emitted from the 32 cooling towers for the
combined Phases 1 and 2 were calculated using mass balances. Emission calculation spreadsheets for the

06/11/14 P:\1409\001\010\FileRm\R\NOC Application\Final NOC Report Jun-2014\Final Project Oxford NOC_rpt-06-11-14.docx LANDAU ASSOCIATES
2-6
cooling towers are provided in Appendix B. In summary, the cooling tower emission rates were
calculated using the following approach:
If the makeup water is chlorinated, then it will contain trace concentrations of volatile
chlorination disinfection byproducts. It was assumed that all of the VOCs in the makeup
water will volatilize from the cooling towers.
The cooling towers will be operated with 46 “cycles of concentration,” which will cause the
TDS concentration in the recirculation water to increase to 69,000 mg/L.
The cooling tower supplier will be required to certify that the drift eliminators installed on
each cooling tower reduce the drift droplet rate to at most 0.0005 percent of the recirculation
water flow rate.
It was assumed that the non-volatile chemical concentrations in the drift droplets will be
identical to the non-volatile aqueous concentrations in the recirculation water, and the drift
droplets will quickly evaporate to form solid drift particles containing those non-volatile
compounds.
It is understood that the size distribution of the liquid droplets that penetrate the drift
eliminators is large, so that after the droplets evaporate most of the resulting solid particles
will be larger than 2.5 microns in diameter. A description of how the size distributions for
the liquid droplets and the evaporated solid particles were determined is provided in
Appendix B. The size distribution of the liquid droplets for mechanical draft cooling towers
with a drift performance of 0.0005 percent was based on data from SPX/Marley, a major
manufacturer of cooling towers. The size distribution of the evaporated solid particles was
calculated based on the liquid droplet size distribution and the assumption that the TDS
concentration inside the liquid droplets will be 69,000 mg/L (the same as the TDS
concentration within the cooling tower recirculation water). Based on those factors, it was
determined that the size distribution of the evaporated solid particles will be large, with only
56 percent of the evaporated particles smaller than 10 microns in diameter and only 13
percent smaller than 2.5 microns in diameter.
Table 4 lists the forecast cooling tower drift emission rate for total suspended particulates, PM2.5,
and PM10 for the 32 cooling towers for the combined Phases 1 and 2. Based on the droplet size analysis
described above, the forecast PM2.5 emission rate is 2.99 tons per year, with the conservative assumption
that the cooling towers will operate continuously throughout the year at the rated capacity.
Table 5 lists the TAP emission rates for the trace metals and chlorination byproduct compounds
forecast to be present in the cooling tower makeup water. The emission rates for each of those TAPs will
be less than their respective SQERs. Note, the emission rates for particulate TAPs entrained in the
cooling tower drift were not adjusted downward to account for the large particle size distribution.

06/11/14 P:\1409\001\010\FileRm\R\NOC Application\Final NOC Report Jun-2014\Final Project Oxford NOC_rpt-06-11-14.docx LANDAU ASSOCIATES
3-1
3.0 EMISSION STANDARD COMPLIANCE
(SECTION VII OF NOC APPLICATION FORM)
The emergency diesel generators are subject to the emission control requirements under NSPS
Subpart IIII, “Standards of Performance for Stationary Compression Ignition Internal Combustion
Engines.” The runtime limits requested for the generators satisfy the definition of “emergency generator”
as specified by NSPS Subpart IIII. Based on that definition of “emergency generators,” NSPS Subpart
IIII indicates that the new generators are subject to EPA Tier 2 emission limits as specified by 40 CFR
Part 89.
Microsoft will conduct all notifications, generator maintenance, recordkeeping, and reporting as
required by NSPS Subpart IIII.
The new generators are also subject to the NESHAP requirements under Subpart ZZZZ,
“National Emission Standards for Hazardous Air Pollutants for Reciprocating Internal Combustion
Engines (RICE).” NESHAP Section 63.6590(c)(1) specifies requirements for emergency RICEs that are
also subject to NSPS Subpart IIII. Because the Project Oxford facility is an “area source” of federal
HAPs, NESHAP Section 63.6590(c)(1) indicates that the new emergency generators are not required to
comply with any portions of Subpart ZZZZ as long as the generators are equipped with EPA Tier 2
emission controls and Microsoft operates the generators in compliance with NSPS Subpart IIII.
The proposed mechanical draft cooling towers are not subject to the operational restrictions
specified by NSPS Subpart Q “Industrial Process Cooling Towers” because the Project Oxford facility
will not be a major source of HAP emissions. That regulation prohibits the use of water treatment
chemicals containing hexavalent chromium. Microsoft will not use any such water treatment compounds.
06/11/14 P:\1409\001\010\FileRm\R\NOC Application\Final NOC Report Jun-2014\Final Project Oxford NOC_rpt-06-11-14.docx LANDAU ASSOCIATES
4-1
4.0 BEST AVAILABLE CONTROL TECHNOLOGY ANALYSIS
(SECTION VIII OF NOC APPLICATION FORM)
4.1 GENERAL APPROACH FOR BEST AVAILABLE CONTROL
TECHNOLOGY ASSESSMENT
Best available control technology (BACT) is an emission limitation based on the maximum
degree of reduction that can be feasibly achieved for each air pollutant emitted from any new or modified
stationary source. Most Ecology permit writers determine BACT using a “top-down” approach as
described in the EPA’s draft New Source Review Workshop Manual: Prevention of Significant
Deterioration and Non-Attainment Area Permitting (EPA 1990). The following five steps are involved in
the top-down process:
1. The first step in the top-down analysis is to identify all available control technologies that can
be practicably applied for each emission unit.
2. The second step is to determine the technical feasibility of potential control options and to
eliminate options that are demonstrated to be technically infeasible.
3. The third step is to rank all remaining options based on control effectiveness, with the most
effective control alternative at the top.
4. The fourth step is to evaluate the remaining control alternatives. If the top-ranked control
alternative is considered unacceptable based on disproportionate economic, environmental,
and/or energy impacts, it is discarded. Justifications for discarding top-ranked control
options must be approved by Ecology.
5. The fifth and final step is to choose the top-ranked alternative from the list of control options
remaining after applying Steps 1 through 4. This option becomes the BACT, including the
resulting emission rate.
Control options for potential reductions in criteria pollutant and, as practical, TAP emissions were
identified for each source. In Washington State, the term BACT refers to the control technology applied
to achieve reductions in criteria pollutant emission rates. The term “tBACT” refers to BACT applied to
achieve reductions in TAP emission rates. Technologies were identified by considering Ecology’s
previous environmental permitting experience for diesel generators in Washington State. Available
controls that are judged to be technically feasible are further evaluated based on an analysis of economic,
environmental, and energy impacts.
This section summarizes the findings and recommended BACT determination. Detailed cost
spreadsheets to support the BACT assessment are provided in Appendix F.
06/11/14 P:\1409\001\010\FileRm\R\NOC Application\Final NOC Report Jun-2014\Final Project Oxford NOC_rpt-06-11-14.docx LANDAU ASSOCIATES
4-2
4.2 STEPS 1, 2, AND 3: IDENTIFY FEASIBLE CONTROL TECHNOLOGIES
FOR DIESEL GENERATORS
Based on Landau Associates’ experience with permitting diesel generators at computer data
centers, the following technologies were considered to be commercially available and technically feasible
for use at the Project Oxford Data Center:
Integrated Control Package consisting of an integrated diesel particulate filter (DPF), diesel
oxidation catalyst (DOC), and urea-based selective catalytic reduction (SCR). This is the
system that Microsoft proposes to install on each generator at the Project Oxford facility.
This system is highly efficient for control of NOx, PM2.5/DEEP, CO, VOCs, and particulate
and gaseous TAPs. This technology would provide the maximum removal efficiencies for all
pollutants.
Urea-SCR system consisting of a urea-based SCR. This system is highly efficient for control
of NOx and NO2. Urea-SCR has been retained for this analysis.
Catalyzed DPF, which includes a DPF and a DOC in a single package. This system is highly
efficient for control of PM2.5/DEEP, CO, VOCs, and particulate and gaseous TAPs.
DOC by itself. This system is highly efficient for removal of CO, VOCs, and gaseous TAPs.
It is marginally effective for removal of PM2.5/DEEP.
Emission controls inherent to EPA Tier 2-certified engines.
In previous permit applications for data centers, Ecology has also considered three-way catalysts
to be technologically feasible for use on diesel generators. However, recent compliance stack tests
required at the Titan Data Center in Moses Lake, Washington indicated that three-way catalysts were
ineffective for removal of NOx, and that device actually increased the emission rate for NO2. Based on
those tests, three-way catalysts were dropped from consideration for this analysis for the Project Oxford
Data Center.
Table 6 lists the estimated removal efficiencies provided by each of the candidate technologies.
The estimated removal efficiencies listed for the proposed Integrated Control Package (which is proposed
by Microsoft) are realistically low values that account for the catalyst cold-start delay periods. The listed
removal efficiencies for the other technologies are conservatively high values that were provided by one
generator manufacturer (Caterpillar Corporation), and which apply only to the warmed-up, steady-state
operating condition. Information on Caterpillar’s estimated removal efficiencies are provided in
Appendix F.
4.3 STEP 4: EVALUATE TECHNICALLY FEASIBLE TECHNOLOGIES FOR
DIESEL GENERATORS
All of the technologies listed in Table 6 are assumed to be commercially available, reasonably
reliable, and safe for use on backup diesel generators. None of them would pose unreasonable liabilities
related to system reliability or energy consumption. One potential concern with the use of DOCs by
06/11/14 P:\1409\001\010\FileRm\R\NOC Application\Final NOC Report Jun-2014\Final Project Oxford NOC_rpt-06-11-14.docx LANDAU ASSOCIATES
4-3
themselves is their tendency to increase the emission rate for NO2. Regardless of that concern, use of
DOCs by themselves has not been eliminated from consideration based solely on that tendency.
4.3.1 METHODOLOGY FOR COST-EFFECTIVENESS ANALYSES FOR DIESEL GENERATORS
Detailed calculation spreadsheets for the BACT cost-effectiveness analyses are provided in
Appendix F. For the individual pollutants, cost effectiveness was calculated by dividing the total life-
cycle annual cost ($/year) by the tons of facility-wide pollutant removed by the control device. The
derived cost effectiveness was then compared to the following cost-effectiveness criteria values, which
were developed based on Landau Associates’ understanding of Ecology’s most recent BACT evaluation
for diesel generators in eastern Washington as of December 2012:
Criteria air pollutants: $10,000 per ton of removed pollutants
Toxic air pollutants: $20,000 per ton of removed TAPs.
The cost-effectiveness analysis for this application was conducted using assumptions that provide
a reasonable but conservatively low estimate of the capital and operating costs, and a reasonable but
conservatively high estimate of the pollutant removal efficiencies. The capital cost, operating cost, life-
cycle annualized cost, and cost effectiveness (dollars per ton of destroyed VOC) were calculated using the
methodology specified in the EPA Air Pollution Control Cost Manual (EPA 2002). Detailed cost
spreadsheets are provided in Appendix F. Rough order of magnitude purchase price information for each
control device to be evaluated and removal efficiencies for each pollutant were obtained from one of the
potential bidders for the diesel generators (Caterpillar Corporation, see Appendix F). Indirect cost factors
to derive a conservatively low total installation cost were obtained from the EPA Air Pollution Control
Cost Manual (EPA 2002). The annual capital recovery costs were calculated assuming a 25-year system
lifetime and a 4 percent annual discount rate. Conservatively low estimates of annual operation and
maintenance costs for each control option were derived by assuming that there would be no operating cost
for electricity or equipment maintenance. To provide a conservatively low estimate of the annual
operating cost, the operational unit costs for each control strategy were set to zero.
As described in the following sections, all of the add-on control technologies are considered to be
economically prohibitive based on their unacceptable cost effectiveness (expressed as life-cycle annual
cost per ton of removed pollutant). Table 7 summarizes the BACT cost-effectiveness analyses for each
control option for criteria air pollutants. As described in the following sections, the cost effectiveness for
each add-on control option is prohibitively high, based on the individual-pollutant criteria and the multi-
pollutant criteria.
Therefore, regardless of Microsoft’s voluntary proposal to install add-on emission controls onto
EPA Tier 2-certified generators, this assessment concludes that BACT for Microsoft’s Project Oxford
06/11/14 P:\1409\001\010\FileRm\R\NOC Application\Final NOC Report Jun-2014\Final Project Oxford NOC_rpt-06-11-14.docx LANDAU ASSOCIATES
4-4
Data Center should be defined as EPA Tier 2-certified emergency generators. Based on Microsoft’s
voluntary proposal to install additional emission controls on the emergency generators at the Project
Oxford Data Center, it is anticipated that the permit conditions will be tied to the more protective
emission limits proposed in this NOC application.
4.3.2 COST-EFFECTIVENESS ANALYSIS FOR INTEGRATED CONTROL PACKAGE
(DPF, DOC, PLUS SCR)
The Integrated Control Package (which is proposed by Microsoft for installation on all generators
at the Project Oxford facility) is so expensive that it would normally be considered cost-prohibitive for the
purpose of reducing air pollutant emissions. However, Microsoft proposes the use of the Integrated
Control Package to protect ambient air quality and to minimize the emissions profile of the data center.
The individual-pollutant cost effectiveness for NOx, PM, CO, and VOCs is presented in Table 7. The
forecast cost-effectiveness values for each individual pollutant exceed their acceptable thresholds.
The Integrated Control Package proposed by Microsoft will provide substantial removal
efficiencies for multiple pollutants including PM, CO, VOCs, and NOx. However, the integrated system
failed the multi-pollutant BACT cost-effectiveness evaluation. Table 7 shows the multi-pollutant
evaluation. The actual annual cost to own and operate the system would be $28,400 per combined ton of
removed pollutant, which exceeds the presumptive cost criterion for the combined pollutants.
4.3.3 COST-EFFECTIVENESS ANALYSIS FOR SCR BY ITSELF
The SCR control system (by itself) exhibits a prohibitively high cost effectiveness. The
individual-pollutant cost effectiveness for NOx, PM, CO, and VOCs is presented in Table 7. The forecast
cost-effectiveness values for each individual pollutant exceed their acceptable thresholds.
The SCR Control Package would provide substantial removal efficiencies for NOx. However, the
SCR system failed the multi-pollutant cost-effectiveness evaluation. Table 7 shows the multi-pollutant
evaluation. The combined cost effectiveness would be $$19,100 per combined ton, which exceeds the
presumptive acceptable cost criterion for the combined pollutants.
4.3.4 COST-EFFECTIVENESS ANALYSIS FOR CATALYZED DPF (DPF PLUS DOC)
The Catalyzed DPF control option (by itself) exhibits a prohibitively high cost effectiveness. The
individual-pollutant cost effectiveness for NOx, PM, CO, and VOCs is presented in Table 7. The forecast
cost-effectiveness values for each individual pollutant exceed their acceptable thresholds.
The Catalyzed DPF control option would provide substantial removal efficiencies for multiple
pollutants including PM, CO, and VOCs. However, the system failed the multi-pollutant cost-

06/11/14 P:\1409\001\010\FileRm\R\NOC Application\Final NOC Report Jun-2014\Final Project Oxford NOC_rpt-06-11-14.docx LANDAU ASSOCIATES
4-5
effectiveness evaluation. Table 7 shows the combined-pollutant cost effectiveness would be $62,800 per
combined ton, which exceeds the cost criterion for the combined pollutants.
4.3.5 COST-EFFECTIVENESS ANALYSIS FOR DOC ALONE
The DOC-Alone control option exhibits a prohibitively high cost effectiveness. The individual-
pollutant cost effectiveness for NOx, PM, CO, and VOCs is presented in Table 7. The forecast cost-
effectiveness values for each individual pollutant exceed their acceptable thresholds.
The DOC-Alone control option would provide substantial removal efficiencies for multiple
pollutants including PM, CO, and VOCs. However, the system failed the multi-pollutant cost
effectiveness evaluation. Table 7 shows the multi-pollutant cost effectiveness would be $27,700 per
combined ton, which exceeds the acceptable cost criterion for the combined pollutants.
4.3.6 TOXICS BEST AVAILABLE CONTROL TECHNOLOGY FOR TOXIC AIR POLLUTANTS
TAPs emitted by the emergency generators at rates exceeding the SQERs include DEEP, NO2,
CO, and acrolein. The criteria air pollutant emission control options described previously would be
effective at various ranges of efficiencies for control of TAPs. The cost-effectiveness calculations for
each TAP control option are provided in Appendix F. Table 8 summarizes the calculated TAP cost
effectiveness for each control option, and compares the calculated cost effectiveness to the presumed
threshold of $20,000 per ton of removed TAP.
DEEP is identical to PM (including back-half) emitted from the emergency generator. Control
technologies and costs evaluated for PM are the same for DEEP. The minimum treatment cost of
$630,000 per ton of removed DEEP exceeds the cost-effectiveness threshold; therefore, DPFs are rejected
as tBACT on the basis of the disproportionate cost analysis.
NO2 is a minor component of NOx; therefore, control technologies evaluated for NOx are
applicable to NO2 and costs are proportionately applicable (the in-stack ratio of NO2 to NOx is assumed to
be 10 percent). All of the control options exhibit prohibitively high cost effectiveness for NOx and NO2
(for example, the SCR system exhibits a cost effectiveness of greater than $191,000 per ton of removed
NO2); therefore, compliance with the EPA’s Tier 2 emission limits for NOx is recommended as tBACT
for NO2.
BACT was evaluated for CO as a criteria pollutant in Section 4.4.5. Ecology currently considers
costs greater than $20,000 per ton of TAPs removed to be disproportionately expensive. The minimum
treatment cost of $34,000 per ton of CO exceeds the cost-effectiveness threshold; therefore, all add-on
controls are rejected as tBACT on the basis of the disproportionate cost analysis.

06/11/14 P:\1409\001\010\FileRm\R\NOC Application\Final NOC Report Jun-2014\Final Project Oxford NOC_rpt-06-11-14.docx LANDAU ASSOCIATES
4-6
Acrolein emissions could be treated using the same control options applicable for VOCs.
However, all of the evaluated control options exhibit prohibitively high cost effectiveness. If costs were
assumed to be comparable to those estimated for VOCs, the treatment cost for acrolein by itself would be
billions of dollars per ton of removed acrolein. Add-on controls for acrolein control are therefore rejected
as tBACT on the basis of the disproportionate cost analysis.
4.4 STEP 5: RECOMMENDED BEST AVAILABLE CONTROL
TECHNOLOGY FOR DIESEL EMERGENCY GENERATORS
Although all of the add-on control technology options (the Integrated Control Package proposed
by Microsoft, Urea-SCR, Catalyzed DPF, and DOC-alone) are technically feasible, each of them failed
the BACT cost-effectiveness evaluation. Therefore, none of the add-on controls should be considered
BACT, regardless of Microsoft’s voluntary proposal to install the Integrated Control Package on all of its
generators. Instead, the emission controls inherent to EPA Tier 2-certified generators should be required
as BACT. The proposed BACT for CO and VOCs is based on compliance with the EPA’s Tier 2
emissions limitations for non-road diesel engines: 0.20 grams per mechanical kilowatt-hour (g/kWm-hr)
for PM2.5, 3.5 g/kWm-hr for CO, and 6.4 g/kWm-hr for combined NOx plus VOCs.
4.5 BEST AVAILABLE CONTROL TECHNOLOGY FOR COOLING TOWER
DRIFT
The Project Oxford facility will use 32 cooling towers. The cooling tower is used to cool non-
contact process water to a temperature that is useful for the process. The direct contact between the
cooling water and air results in entrainment of some of the liquid water into the air. The resulting drift
droplets contain total dissolved solids (TDS) in the cooling tower water, which form solid particles after
the drift droplets evaporate downwind of the towers.
The Project Oxford cooling towers will use high-efficiency drift eliminators, and will be
constructed with a configuration that will achieve a liquid droplet drift rate of no more than 0.0005
percent of the recirculation flow rate within each cooling tower. Microsoft consulted with several cooling
tower manufacturers to determine if they could provide cooling towers with more efficient drift
eliminators. As described in the correspondence included in Appendix B, the manufacturers indicated
that they cannot provide cooling towers with drift eliminators with efficiencies better than 0.0005 percent.
Therefore, the high-efficiency drift eliminators at the Project Oxford Data Center (0.0005
percent) are proposed as BACT.
06/11/14 P:\1409\001\010\FileRm\R\NOC Application\Final NOC Report Jun-2014\Final Project Oxford NOC_rpt-06-11-14.docx LANDAU ASSOCIATES
5-1
5.0 AMBIENT AIR QUALITY IMPACT ANALYSIS
(SECTION IX OF NOC APPLICATION FORM)
This section presents the air dispersion modeling results and provides a comparison of the results
to the National Ambient Air Quality Standards (NAAQS) and Washington Ambient Air Quality
Standards (WAAQS) for criteria pollutants and the Washington State Acceptable Source Impact Levels
(ASILs) for TAPs. Air dispersion model input values are provided in Appendix G. Electronic modeling
files have been provided to Ecology under separate cover, as cited in Appendix H.
As described in the following sections, the ambient impacts caused by the Project Oxford
facility’s emissions are less than the NAAQS and WAAQS, after adding local and regional background
levels. With the exception of one TAP (DEEP), the ambient TAP impacts are less than the ASILs.
5.1 AIR DISPERSION MODELING – MODEL AND MODEL ASSUMPTIONS
Air dispersion modeling was conducted in general accordance with the EPA’s Revision to the
Guideline on Air Quality Models: Adoption of a Preferred General Purpose (Flat and Complex Terrain)
Dispersion Model and Other Revisions; Final Rule (EPA 2005). AERMOD was used to estimate
ambient pollutant concentrations at the facility’s boundary associated with emissions from the facility.
AERMOD was used to calculate maximum ambient impact concentrations of criteria pollutants and TAPs
that would be emitted from the facility. AERMOD requires input from several models in order to process
meteorological parameters, downwash parameters, and terrain heights. The following sections contain a
description of these input models, as provided in EPA, Electric Power Research Institute, and Lakes
Environmental guidance documents.
5.1.1 STACK HEIGHTS AND BUILDING DOWNWASH INPUT PARAMETER MODELING
All generator stacks were modeled to be 46-foot-tall vertical stacks on the individual generator
enclosures. The parapet walls of the buildings were modeled to be 29.7 feet high.
Building downwash occurs when the aerodynamic turbulence induced by nearby buildings causes
a pollutant emitted from an elevated source to be mixed rapidly toward the ground (downwash), resulting
in higher ground-level concentrations. The Building Profile Input Program (BPIP) with Plume Rise
Model Enhancements (PRIME) was used to determine if exhaust from emission units would be affected
by nearby building structures. In general, these determinations are made if a stack’s height is less than the
height defined by the EPA’s Good Engineering Practice (GEP) stack height. GEP stack height is defined
as the height of the nearby structure(s) measured from the ground-level elevation at the base of the stack,
plus 1.5 times the lesser dimension, height, or projected width of the nearby structure(s). All of the

06/11/14 P:\1409\001\010\FileRm\R\NOC Application\Final NOC Report Jun-2014\Final Project Oxford NOC_rpt-06-11-14.docx LANDAU ASSOCIATES
5-2
Project Oxford facility’s generator stacks will be approximately the same height as the nearby data center
buildings, so all stacks will be lower than GEP stack height.
5.1.2 RECEPTOR GRID SPACING AND TERRAIN HEIGHT INPUT MODELING
Receptor heights were set at 1.5 meters (m) above ground height to approximate the human
breathing zone height. To model complex terrain, AERMOD requires information about the surrounding
terrain. This information includes a height scale and a base elevation for each receptor. The AMS/EPA
Regulatory Model Terrain Pre-processor (AERMAP) was used to obtain a height scale and the base
elevation for a receptor, and to develop receptor grids with terrain effects.
The receptor grid beyond the facility boundary consists of Cartesian flagpole receptor grids
placed at a height of 1.5 m above ground. The grid spacing varies with distance from the facility
boundary, as listed below:
10-m spacing from emission source to 350 m
25-m spacing from 350 m to 800 m
50-m spacing from 500 m to 2,000 m
100 m spacing beyond 2,000 m.
AERMAP requires the use of topography data to estimate surface elevations above mean sea
level. Digital topographical data (in the form of Digital Elevation Model files) for the analysis region
were obtained from the Web GIS website (www.webgis.com) and processed for use in AERMOD. The
Shuttle Radar Topography Mission data used for this project have a resolution of approximately 30 m (1
arc-second).
AERMAP produces a Receptor Output File (*.rou) containing the calculated terrain elevations
and scale height for each receptor. The *.rou file was used as an input runstream file (AERMOD Input
File) for the Receptor Pathway in the Terrain Options page of the Control Pathway. AERMAP also
produces a Source Output File (*.sou). This file contains the calculated base elevations for all sources.
5.1.3 METEOROLOGICAL INPUT PARAMETER MODELING
The AERMOD Meteorological Pre-Processor (AERMET) is the pre-processor model that
estimates boundary layer parameters for use in AERMOD. AERMET processes three types of
meteorological input data in three stages, and from this process it generates two input files for the
AERMOD model. The two AERMOD input files produced by AERMET are the Surface File with hourly
boundary layer parameter estimates and the Profile File with multi-level observations of wind speed, wind
direction, temperature, and standard deviations of fluctuating wind components. The three types of
06/11/14 P:\1409\001\010\FileRm\R\NOC Application\Final NOC Report Jun-2014\Final Project Oxford NOC_rpt-06-11-14.docx LANDAU ASSOCIATES
5-3
AERMET input data are described below and consist of surface observations, upper air soundings, and
site-specific data.
Five years of hourly surface data were used for AERMET from the National Weather Service
(NWS) hourly surface observations, taken from Moses Lake, Washington. The 5 years of data processed
cover the period 2001 to 2005.
Five years of upper air data were used for AERMET from the NWS twice-daily upper air
soundings from Spokane, Washington. The 5 years of data processed cover the period 2001 to 2005.
The site-specific data required for AERMET include albedo, Bowen ratio, and surface roughness.
Albedo is a measure of the solar radiation reflected back from earth into space. The Bowen ratio is an
evaporation-related measurement and is defined as the ratio of sensible heat to latent heat. The surface
roughness length is the theoretical height above ground where the wind speed becomes zero. Source
information for the hourly surface air, upper air, and site-specific meteorological data is summarized in
Table 9.
AERSURFACE was used to approximate the albedo, Bowen ratio, and surface roughness within
12 equal sectors of a circle that has a 1-kilometer radius and is centered on the surface station tower at
Grant County International Airport in Moses Lake, Washington. Looking at each sector individually,
AERSURFACE determined the percentage of land use type within each sector. Land cover data from the
U.S. Geological Survey National Land Cover Data 1992 archives were used as an input to
AERSURFACE (USGS 1992). Default seasonal categories were used in AERSURFACE to represent the
four seasonal categories as follows: 1) midsummer with lush vegetation; 2) autumn with unharvested
cropland; 3) late autumn after frost and harvest, or winter with no continuous snow; and 4) transitional
spring with partial green coverage or short annuals.
5.1.4 AERMOD AIR DISPERSION MODELING
The AERMOD interface provided by Lakes Environmental was used for all Project Oxford
facility air dispersion modeling. This version of the Lakes Environmental software incorporates the most
recent version of AERMOD (version 12345). AERMOD incorporates the data from the pre-processors
described above with emission estimates and physical emission point characteristics to model ambient
impacts at and beyond the property boundary.
The AERMOD model was used to estimate the short-term impacts (i.e., 24-hour average or less)
of PM, PM10, PM2.5, CO, NO2, and SO2 emissions and long-term impacts (i.e., annual average) of PM,
PM10, PM2.5, NO2, and SO2 emissions.
The AERMOD modeling for the facility-wide diesel generator emissions was originally done
using a generator configuration consisting of 32 large generators (2,500 kWe) and five small generators
06/11/14 P:\1409\001\010\FileRm\R\NOC Application\Final NOC Report Jun-2014\Final Project Oxford NOC_rpt-06-11-14.docx LANDAU ASSOCIATES
5-4
(1,500 kWe). After the AERMOD modeling was completed, Microsoft modified the design of the facility
to include a different mix of generators [36 large generators (2,500 kWe) and one small generator (750
kWe)]. The facility-wide emission rates for the revised configuration increased by a small amount (a 2 to
6 percent increase, depending on the pollutant). To account for these small emission increases, the
original ground-level concentrations predicted by AERMOD for the original generator configuration were
manually scaled upward by adjustment factors ranging from 1.02 to 1.06. A table showing the specific
adjustment factors for each pollutant and averaging period is provided in Appendix G. These adjustments
were small (only 2 to 6 percent), and had a negligible impact on the conclusions of the ambient air quality
analyses.
The preliminary AERMOD modeling of the facility-wide particulate emissions from the 32
cooling towers was originally done using assumed emission rates of either 0.33 or 0.39 pounds per hour
from each tower. The two emission rates that were used for preliminary modeling were each based on a
different set of preliminary design and operating assumptions. Because the latest understanding of
cooling tower design and operations for the project have changed since preliminary modeling was
conducted, those preliminary modeling results were used to develop a “dispersion factor” for downwind
particulate impacts. The calculated particulate emission rates from the cooling towers were later reduced
to the values listed in Table 4 (the PM10 emission rate is 0.0913 pounds per hour from each tower, and the
PM2.5 emission rate is 0.0213 pounds per hour from each tower). The cooling towers’ ambient PM10 and
PM2.5 impacts presented in this application were finally calculated by multiplying the reduced per-tower
emission rates times the original dispersion factors. A table showing the original dispersion factors, the
final emission rates, and the final adjusted modeling results is provided in Appendix G.
5.1.5 DISPERSION FACTORS AND PLUME VOLUME MOLAR REACTION MODEL REACTIVE
PLUME MODEL
The AERMOD model was used to derive “dispersion factors” to calculate the ground-level
concentration of the non-reactive pollutant acrolein and SO2. The acrolein and ammonia dispersion
factors, based on a 24-hour averaging period, were developed assuming a 24-hour-long facility-wide
power outage, which represents the worst-case emission condition for compliance with the ASILs for
ammonia and acrolein. Similar methodologies were used to model the 1-hour average impacts for those
two pollutants and the annual-average impact for ammonia for the purpose of including those pollutants
in the cumulative non-cancer risk analysis for the second-tier risk assessment. Additionally, an annual
average dispersion factor was developed for SO2 assuming the generators would operate the maximum
number of hours that Microsoft is requesting that these generators be allowed to operate, which represents
the worst-case emission condition for compliance with the NAAQS for SO2. The “dispersion factor” for
06/11/14 P:\1409\001\010\FileRm\R\NOC Application\Final NOC Report Jun-2014\Final Project Oxford NOC_rpt-06-11-14.docx LANDAU ASSOCIATES
5-5
a 24-hour averaging period has units of micrograms per cubic meter (µg/m3) per gram/second of facility-
wide emission rate. After the facility-wide emission rates were calculated for each regulated pollutant,
the dispersion factor was applied to calculate the maximum ambient concentration for each pollutant and
averaging period.
Ambient NO2 concentrations were modeled using the Plume Volume Molar Reaction Model
(PVMRM) module of AERMOD. It was assumed that the primary NO2 emission rate was 10 percent of
the primary NOx emission rate; this is the same assumption that Ecology has required for PVMRM
modeling for all other computer data centers in Washington. Additionally, it was assumed that the
ambient ozone concentration was 49 parts per billion during the entire year based on project coordinate-
specific design values obtained from the Washington State University NW Airquest website (WSU
website 2013).
5.2 ASSUMED BACKGROUND CONCENTRATIONS
This evaluation included “regional background” values contributed by existing regional emission
sources in the project vicinity (e.g., permitted sources, highway vehicles, area sources) and “local
background” values contributed by the other data centers in the vicinity. Project coordinate-specific
regional background values were obtained from the Washington State University NW Airquest website
(WSU website 2013). The reported regional background values were:
PM10 (24-hour average) 81 µg/m3
PM2.5 (annual average) 6.5 µg/m3
PM2.5 (24-hour average) 21 µg/m3
NO2 (1-hour average) 15.6 µg/m3.
“Local background” values for PM2.5 and NO2 consist of the ambient impacts, at Project Oxford’s
maximum impact location, caused by emissions from the nearby emergency generators and industrial
emission sources at the Columbia Data Center, Dell Data Center, and ConAgra Foods. Emissions from
each of those facilities were assumed to be equal to their respective permit limits. After the location and
date of the maximum impact caused by Project Oxford’s proposed new generators were determined,
AERMOD was used to model the “local background” ambient impacts at that same location and date
caused by simultaneous activity at each of the adjacent data centers and industrial facilities. The modeled
“local background” values were as follows:
24-Hour PM2.5 (Monthly Testing). It was assumed that each nearby data center would
conduct its scheduled monthly maintenance testing on the same calendar day that the Project
Oxford facility would conduct its annual electrical bypass maintenance. It was assumed that
each data center would test one generator at a time at low load, and would test all of its
generators in 1 calendar day. It was assumed that the ConAgra facility would emit at its
06/11/14 P:\1409\001\010\FileRm\R\NOC Application\Final NOC Report Jun-2014\Final Project Oxford NOC_rpt-06-11-14.docx LANDAU ASSOCIATES
5-6
permitted rate. The modeled “local background” value at Project Oxford’s maximum impact
point was 0.021 µg/m3.
1-Hour NO2 (Monthly testing). It was assumed that each nearby data center would conduct
its scheduled monthly maintenance testing on the same hour that the Project Oxford facility
would conduct its annual electrical bypass maintenance, while the ConAgra facility would
emit at its permitted rates. It was assumed the Dell Data Center operates seven generators at
high load while the Columbia Data Center operates five generators at low load, based on
operating limits listed in those facilities’ air quality permits. The modeled “local
background” value at Project Oxford’s maximum impact point is 0.28 µg/m3.
5.3 CRITERIA AIR POLLUTANT IMPACTS
NAAQS set by the EPA include both primary and secondary standards for criteria pollutants.
Primary standards are designed to establish limits to protect public health, including the health of
“sensitive” populations such as asthmatics, children, and the elderly. Secondary standards set limits to
protect public welfare, including protection against decreased visibility and damage to animals, crops,
vegetation, and buildings.
Air dispersion modeling was conducted to estimate ambient pollutant concentrations caused by
emissions from the diesel emergency generators to show compliance with the NAAQS and WAAQS. To
estimate worst-case ambient impacts of criteria pollutants for models with averaging periods greater than
1 hour (i.e., 3-hour, 8-hour, 24-hour, and annual averaging periods) and for the SO2 model with a 1-hour
averaging period, it was conservatively assumed that the generators would operate at their maximum
emission rate 24 hours per day, 365 days per year, and the AERMOD model automatically selected the
location and date of the maximum impact.
A summary of NAAQS compliance modeling is provided in Table 10, and the locations of the
maximum modeled ambient impacts are shown on Figure 3. The listed annual impacts are the theoretical
maximum-annual values that account for full-buildout operations, initial commissioning testing of three
generators, and recurring stack testing.
5.3.1 24-HOUR PM10 NAAQS COMPLIANCE DURING A FACILITY-WIDE POWER OUTAGE
As described in this section, the modeled ambient impact for 24-hour PM10 is less than the
NAAQS, after accounting for regional background levels.
For 24-hour PM10, AERMOD was used to simulate the effects of a full power outage, lasting for a
full calendar day, while the 32 cooling towers continue to operate at their design loads. This is a worst-
case scenario that assumes that both of these occur on a single day and is the scenario with the highest
emissions for PM10. All days were modeled with these worst-case PM10 emissions using a worst-case
screening scenario, whereby a facility-wide power outage affecting all generators was assumed to last 365
days per year, 24 hours per day, and the 32 cooling towers were assumed to operate continuously. The
06/11/14 P:\1409\001\010\FileRm\R\NOC Application\Final NOC Report Jun-2014\Final Project Oxford NOC_rpt-06-11-14.docx LANDAU ASSOCIATES
5-7
AERMOD model selected the location and date for the 1st-highest 24-hour impact at any receptor for each
modeling year.
As shown in Table 11, the resulting Project Oxford-only PM10 impact is 8.7 µg/m3 for the cooling
towers (assuming that 56 percent of the evaporated solid drift particles are smaller than 10 microns in
diameter, as described in Appendix B) and 11 µg/m3
for the generators, with a combined project-only
impact of 20 µg/m3. That impact associated with Project Oxford operations is only a small fraction of the
NAAQS. As shown on Figure 3, the location of the maximum PM10 impact is on the eastern facility
boundary, and the maximum impact occurs when the wind blows eastward. When the wind blows in that
direction, the plumes from the local background sources (ConAgra Foods, Dell Data Center, and
Columbia Data Center) would all blow away from the Project Oxford facility. Therefore, a model to
estimate local background impacts was not run for PM10, and it was assumed that the local background
impact would be negligible. The 1st-highest 24-hour PM10 impact during a full power outage is 101
µg/m3, which is lower than the NAAQS of 150 µg/m
3.
5.3.2 24-HOUR PM2.5 NAAQS COMPLIANCE
As described in this section, the modeled ambient impact for 24-hour PM2.5 emitted by the
generators and the cooling towers is less than the NAAQS, after accounting for local and regional
background levels. This section presents the compliance demonstration for the 24-hour PM2.5 NAAQS,
which is based on the 3-year rolling average of the 98th-percentile 24-hour impact in each year. The
compliance demonstration is provided for the Project Oxford operating scenario for annual electrical
bypass maintenance and continuous operation of the cooling towers. Electrical bypass maintenance
exhibits the generators’ highest daily-average PM2.5 emission rate of any operating scenario other than
emergency power outages, which are expected to occur no more than 1 or 2 days per year. Therefore,
electrical bypass maintenance is the most appropriate operating scenario for evaluating compliance with
the 24-hour PM2.5 NAAQS. The key operating assumptions are:
During annual electrical bypass maintenance, four generators (one generator in each of the
four buildings closest to the northeastern boundary of the Phase 1 data center) will operate at
80 percent load for 24 hours in a calendar day. As a conservative assumption, the four
generators to be used were placed in the four buildings closest to the northern facility
boundary (see Figure 3).
All 32 cooling towers were set to their normal full load operating conditions with the
assumption that 13 percent of the solid evaporated cooling tower drift particles would be
small enough to be regulated as PM2.5 (see Appendix B for information on the particle size
distribution of the drift particulate emissions).
The AERMOD model was set with the four generators and the 32 cooling towers operating
continuously for 24 hours per day, 365 days per year, and the AERMOD model selected the 1st- through

06/11/14 P:\1409\001\010\FileRm\R\NOC Application\Final NOC Report Jun-2014\Final Project Oxford NOC_rpt-06-11-14.docx LANDAU ASSOCIATES
5-8
8th-highest modeled values. The NAAQS compliance limit applies to the 8
th-highest day each year.
Because hypothetical power outages (which would cause a daily PM2.5 emission rate higher than the daily
emission rate for annual electrical bypass maintenance) could theoretically occur on several days per year,
this analysis evaluated the 3-year rolling average of the 4th-highest daily impacts caused by the generators
and cooling towers operating during electrical bypass maintenance.
Local background impacts were modeled by assuming that the Dell Data Center and Columbia
Data Center will conduct their monthly maintenance testing simultaneously with the annual electrical
bypass maintenance at the Project Oxford facility, while the ConAgra facility will emit continuously at its
permitted rates.
The results of the ambient air quality analysis are listed in Table 12. The modeled Project
Oxford-only PM2.5 impact is 0.7 µg/m3 for the cooling towers and 2.37 µg/m
3 for the generators, with the
combined impact associated with Project Oxford operations modeled to be only 3 µg/m3. The impact
associated with Project Oxford operations is only a small fraction of the NAAQS. The combined impacts
from the Project Oxford facility, local background levels, and regional background levels are 24 µg/m3
and are less than the NAAQS.
5.3.3 1-HOUR NO2 NAAQS COMPLIANCE DURING ANNUAL ELECTRICAL BYPASS
MAINTENANCE
As described in this section, the modeled ambient impact for 1-hour NO2 concentrations caused
by annual electrical bypass maintenance is less than the NAAQS, after accounting for local and regional
background levels.
For 1-hour NO2, AERMOD/PVMRM was used to simulate the effects of annual electrical bypass
maintenance. Four generators (one generator in each of the four buildings closest to the northeastern
boundary of the Phase 1 data center) will operate at 80 percent load for 16 hours in a calendar day. This
type of maintenance is expected to be done for 8 days or more per year on a rotating basis throughout the
facility. Electrical bypass maintenance is expected to be done for at least 8 days per year, and exhibits the
highest hourly NOx emission rate of any operating scenario other than emergency power outages, which
are expected to occur no more than 1 or 2 days per year. Therefore, electrical bypass maintenance is the
most appropriate operating scenario for evaluating compliance with the 1-hour NO2 NAAQS.
As a conservative assumption, the four generators to be used for electrical bypass maintenance
were placed in the four buildings closest to the northern facility boundary (see Figure 3). It was
conservatively assumed that the Columbia Data Center and the Dell Data Center conduct their monthly
testing at the same time, while ConAgra operates its boilers at their permitted rates. All days were
modeled with these emissions using a worst-case screening approach, whereby all generators are activated
06/11/14 P:\1409\001\010\FileRm\R\NOC Application\Final NOC Report Jun-2014\Final Project Oxford NOC_rpt-06-11-14.docx LANDAU ASSOCIATES
5-9
for 365 days per year, 24 hours per day, and the AERMOD model selects the 1st-highest 1-hour impact at
any receptor. The maximum simulated value was used in the comparison with the NAAQS.
The 1-hour NO2 NAAQS considers the 3-year average of the 98th percentile of the highest daily
1-hour NO2 value per year. Using the EPA’s standard post-processing software, this is the 8th-highest
modeled value per year. However, to account for the possibility that unforeseen high-emission events
such as occasional power outages might occasionally cause elevated ambient pollutant concentrations on
several days per year, the 1st-highest AERMOD value was used to evaluate the impacts from monthly
testing.
As shown in Table 13, the resulting 3-year rolling 1st-highest 1-hour Project Oxford-only impact
is approximately 160 µg/m3. After accounting for regional background and local background values, and
assuming that the other nearby data centers are doing their own generator testing on the same day and
hour as the Project Oxford facility, the total NO2 impact is 176 µg/m3, which is lower than the NAAQS.
As shown on Figure 3, the maximum impact occurs at the northern boundary of the Project Oxford
facility, during an hour when the plumes from Project Oxford and ConAgra overlap while the wind blows
from the southeast.
5.4 FIRST-TIER SCREENING OF TOXIC AIR POLLUTANT IMPACTS
As described in this section, the modeled ambient pollutant concentration impacts for all TAPs,
other than DEEP, are less than their respective ASILs.
5.4.1 TOXIC AIR POLLUTANT EMISSION RATES COMPARED TO SMALL-QUANTITY EMISSION
RATES
The first-tier TAP assessment compares the forecast emission rates to the SQERs and compares
the maximum ambient impacts at any sensitive receptor to the ASILs. Table 5shows the calculated
emission rates for each TAP emitted from the Project Oxford emergency generators and cooling towers,
and compares the emission rates to the SQERs. The SQERs are emission thresholds, below which
Ecology does not require an air quality impact assessment for the listed TAP. The table lists the “SQER
Ratio” of the Project Oxford emission rate compared to the SQER. The maximum emission rates for
DEEP, NO2, CO, ammonia, and acrolein exceed their respective SQERs, so an ambient impact
assessment is required for those pollutants.
Ecology requires facilities to conduct a first-tier screening analysis for each TAP whose emission
exceeds its SQER by modeling the 1st-highest 1-hour, 1
st-highest 24-hour, and annual impacts at or
beyond the project boundary, then comparing the modeled values to the ASILs (WAC 173-460-080). The
1-hour and 24-hour impacts were modeled for the worst-case screening scenario of a facility-wide power
06/11/14 P:\1409\001\010\FileRm\R\NOC Application\Final NOC Report Jun-2014\Final Project Oxford NOC_rpt-06-11-14.docx LANDAU ASSOCIATES
5-10
outage lasting 24 hours per day for 365 days per year for 5 years, with AERMOD automatically selecting
the highest 1-hour and 24-hour impacts for each of the 5 modeling years. The annual impacts were
modeled based on the maximum requested generator runtimes and generator loads listed in Table 1. For
TAPs emitted by the cooling towers, it was assumed that the cooling towers would run continuously
throughout the year.
5.4.2 TOXIC AIR POLLUTANT AMBIENT CONCENTRATION IMPACTS COMPARED TO ASILS
The first-tier ambient concentration screening analysis is summarized in Table 10. The modeled
DEEP concentration at the unoccupied facility boundary exceeds its ASIL by a wide margin, but the
impacts for all TAPs other than DEEP are less than their respective ASILs. The annual impacts listed in
Table 10 are the theoretical maximum-annual values that account for full-buildout operations, initial
commissioning testing, and compliance stack testing during the same year of operation.
5.4.3 ANNUAL-AVERAGE DEEP IMPACTS
The DEEP analysis was conducted by assuming all generators at the facility will operate at the
requested maximum runtimes and generator loads listed in Table 1. The modeled theoretical maximum
12-month annual impact is 0.080 µg/m3, and exceeds the DEEP ASIL value of 0.0033 µg/m
3. The
location of the maximum annual-average DEEP impact is shown on Figure 3.
Therefore, a draft second-tier risk assessment for DEEP has been prepared and submitted to
Ecology under separate cover (Landau Associates 2014). The risk assessment demonstrates that the
estimated incremental increase in cancer risks over a 70-year period caused by the Project Oxford
generators is less than 10 per million at all maximally-impacted receptors. The risk assessment also
demonstrates that the hazard quotient for non-cancer risks is less than 1.0. According to Ecology’s
regulations, no third-tier DEEP analysis is required [WAC 173-460-090(7)].
5.4.4 1-HOUR NO2 IMPACTS DURING FACILITY-WIDE POWER OUTAGE
As described in this section, the modeled ambient impact for 1-hour NO2 during an unplanned
power outage is less than the ASIL.
A worst-case screening analysis was conducted to demonstrate compliance with the ASIL for
NO2. The AERMOD/PVMRM model was set to assume that the Project Oxford facility would
experience a facility-wide power outage for 365 days per year, 24 hours per day, and the model selected
the 1st-highest 1-hour NO2 impact for each of the 5 modeling years. The maximum Project Oxford-only,
1-hour modeled ambient concentration of NO2 at the project boundary for the full power outage scenario

06/11/14 P:\1409\001\010\FileRm\R\NOC Application\Final NOC Report Jun-2014\Final Project Oxford NOC_rpt-06-11-14.docx LANDAU ASSOCIATES
5-11
is 388 µg/m3, which is less than the NO2 ASIL of 470 µg/m
3. The location of the modeled impact is
shown on Figure 3.
Therefore, ASIL compliance for NO2 is confirmed using the first-tier screening analysis. No
second-tier risk assessment for NO2 is required.
06/11/14 P:\1409\001\010\FileRm\R\NOC Application\Final NOC Report Jun-2014\Final Project Oxford NOC_rpt-06-11-14.docx LANDAU ASSOCIATES
6-1
6.0 SIGNATURES
This document has been prepared under the supervision and direction of the following key staff.
LANDAU ASSOCIATES, INC.
Jim Wilder, P.E.
Senior Associate
Charles P. Halbert, P.E.
Principal
JMW/CPH/ccy

06/11/14 P:\1409\001\010\FileRm\R\NOC Application\Final NOC Report Jun-2014\Final Project Oxford NOC_rpt-06-11-14.docx LANDAU ASSOCIATES
7-1
7.0 REFERENCES
CEC. 2005. Air Quality Implications of Backup Emergency Generators in California. Report No.
CEC-500-2005-049. California Energy Commission. July.
Cheng, Ray. 2014. Personal communication (telephone conversations with Jim Wilder, Senior Associate
Engineer, Landau Associates). Ray Cheng, Senior Mechanical Engineer, Microsoft Corporation. Re:
Cooling Tower Design Values. January.
EPA. 2005. Revision to the Guideline on Air Quality Models: Adoption of a Preferred General Purpose
(Flat and Complex Terrain) Dispersion Model and Other Revisions; Final Rule. U.S. Environmental
Protection Agency. Available at http://www.epa.gov/scram001/guidance/guide/appw_05.pdf.
November 9.
EPA. 2002. EPA Air Pollution Control Cost Manual. Sixth Edition. EPA/452/B-02-001. Office of Air
Quality Planning and Standards, U.S. Environmental Protection Agency. Available at
http://www.epa.gov/ttn/catc/dir1/c_allchs.pdf. January.
EPA. 1995. Compilation of Air Pollutant Emission Factors, Volume I: Stationary Point and Area
Sources. Fifth Edition. AP-42. Office of Air Quality Planning and Standards, Office of Air and
Radiation, U.S. Environmental Protection Agency. January.
EPA. 1990. Draft: New Source Review Workshop Manual, Prevention of Significant Deterioration and
Non-Attainment Area Permitting. U.S. Environmental Protection Agency. Available at
http://www.epa.gov/ttn/nsr/gen/wkshpman.pdf. October.
Landau Associates. 2014. Revised Second-Tier Risk Analysis for Diesel Engine Exhaust Particulate
Matter, Microsoft Project Oxford Data Center, Quincy, Washington. Prepared for The Microsoft
Corporation. March 13.
USGS. 1992. National Land Cover Data 1992. U.S. Geological Survey.
WSU website. 2013. NW Airquest. http://lar.wsu.edu/nw-airquest/lookup.html. Northwest International
Air Quality Environmental Science and Technology Consortium, Washington State University. Accessed
November 19.
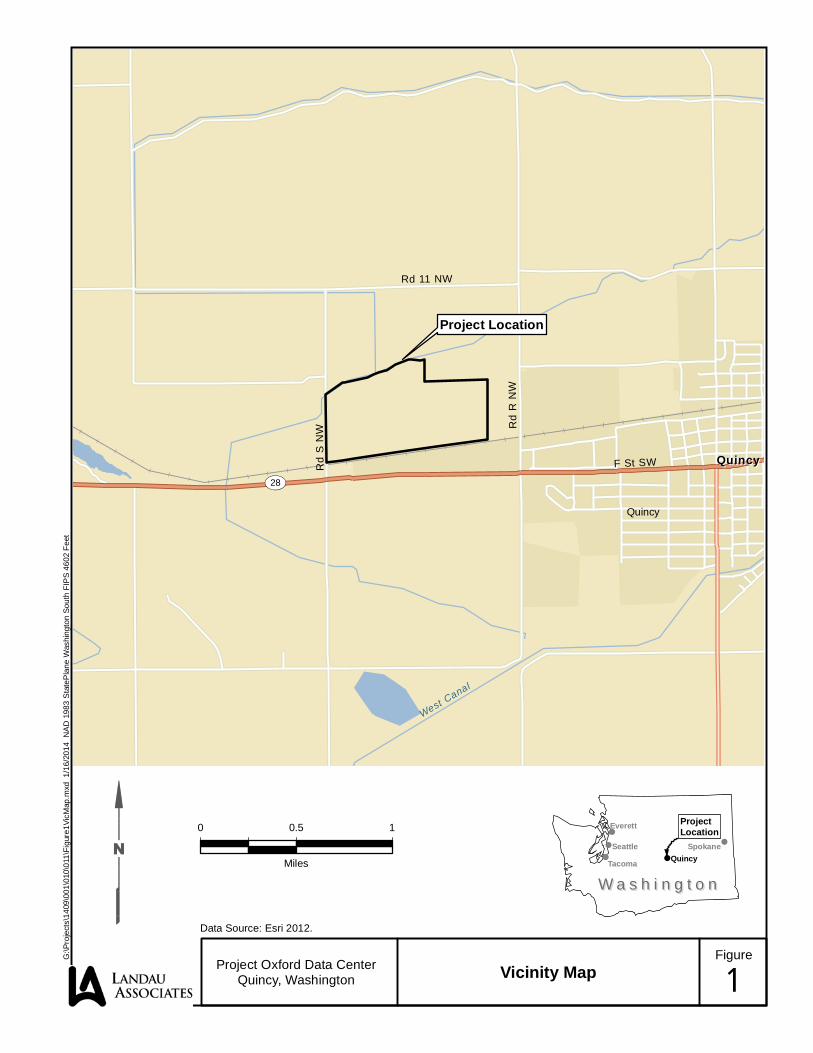
Rd
R N
W
Rd
S N
W
Rd 11 NW
ST28
F St SW QuincyQuincy
West Canal
Quincy
Data Source: Esri 2012.
Project Oxford Data CenterQuincy, Washington Vicinity Map
Figure
1
0 0.5 1
Miles
G:\
Pro
ject
s\1
409
\00
1\0
10\0
11\F
igur
e1
Vic
Map
.mxd
1
/16
/20
14
N
AD
19
83
Sta
teP
lan
e W
ash
ing
ton
So
uth
FIP
S 4
60
2 F
eet
!
!
!
!
!
W a s h i n g t o nW a s h i n g t o n
QuincyTacomaSpokane
Everett
Seattle
ProjectLocation
Project Location

Figure
2 Site Plan
06/11/14 P:\1409\001\010\FileRm\R\NOC Application\Final NOC Report Jun-2014\Final Project Oxford NOC_fig2.docx
Project Oxford Data Center Quincy, Washington
Data Source: Microsoft
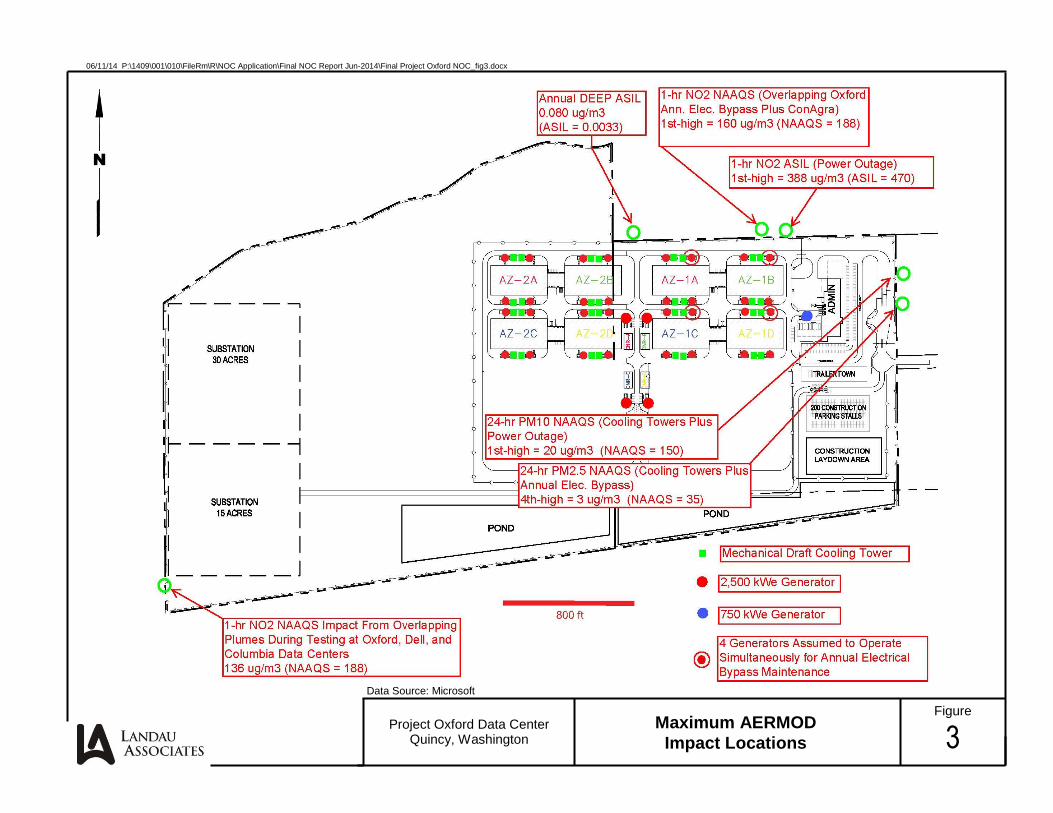
Figure
3
Maximum AERMOD
Impact Locations
06/11/14 P:\1409\001\010\FileRm\R\NOC Application\Final NOC Report Jun-2014\Final Project Oxford NOC_fig3.docx
Project Oxford Data Center Quincy, Washington
Data Source: Microsoft

Page 1 of 1 TABLE 1
EMERGENCY GENERATOR RUNTIME SCENARIOS AND PROPOSED RUNTIME LIMITS MICROSOFT PROJECT OXFORD DATA CENTER
QUINCY, WASHINGTON
06/11/14 P:\1409\001\010\FileRm\R\NOC Application\Final NOC Report Jun-2014\Final Project Oxford NOC_rpt-06-11-14.docx LANDAU ASSOCIATES
Runtime Event Per-Generator Annual Hours/Year of Runtime at Indicated Load
Idle (10% Load) 80% Load 100% Load
Per-Generator Runtime for Recurring Annual Events
Total Annual Runtime for Combined Runtime Scenarios
29 hrs/yr for combined weekly testing and generator cooldown. Runtime averaged across all generators in service. Runtime averaged over a 3-year rolling period.
40 hrs/yr for combined emergency power outages and electrical bypass for transformer maintenance. Runtime averaged across all generators in service. Runtime averaged over a 3-year rolling period.
17.5 hrs/yr for combined monthly load bank testing, semiannual load bank testing, and as-needed generator corrective maintenance. Runtime averaged across all generators in service. Runtime averaged over a 3-year rolling period.
Operational Limit To Comply with 1-Hour NO2 NAAQS
N/A
Up to four 2,500-kW generators operating simultaneously during electrical bypass transformer maintenance, at an average generator load of 80 percent.
Up to three 2,500-kW generators tested simultaneously
Operational Limit To Comply with 24-Hour PM2.5 NAAQS
N/A
Maximum daily generator usage during electrical bypass transformer maintenance limited to 192,000 kWe-hours per day.
N/A
One-Time-Only or Infrequent Events Accounted for in 70-Year Average DEEP Risk Assessment
Initial Generator Commissioning (50 hours per generator, conducted once during the 70-year averaging period)
N/A
Each generator is tested once for 50 hrs over a full range of loads (average load assumed to be 80%). Distributed over 70 years, this is equivalent to 50/70 or 0.7 hrs/yr.
N/A
Periodic Stack Emission Testing on 3-yr cycle (2-3 gensets per year, each genset tested once every 24 years)
N/A
Each generator runs for 30 hrs/test over a range of loads (average load assumed to be 80%). Each generator is tested every 24 years. Distributed over 24 years, this is equivalent to 30/24 or 1.25 hours/year for each generator.
N/A
Note: Detailed breakdown of the daily, weekly, monthly, and annual runtime hours for each operating scenario is provided in
Appendix C.

Page 1 of 1 TABLE 2
UNCONTROLLED (EPA TIER 2-COMPLIANT) GENERATOR EMISSION RATES APPLICABLE TO COLD-START CONDITIONS
MICROSOFT PROJECT OXFORD DATA CENTER QUINCY, WASHINGTON
06/11/14 P:\1409\001\010\FileRm\R\NOC Application\Final NOC Report Jun-2014\Final Project Oxford NOC_rpt-06-11-14.docx LANDAU ASSOCIATES
Pollutant Generator Load
Tier 2-Compliant Emission Rates (lbs/hour)
0.75 MW 2.5 MW
NOx
10% 5.7 7.02
80% 22 40.95
100% 37 61.89
PM (Includes back-half
particulate fraction)
10% 0.49 1.19
80% 0.58 0.46
100% 0.54 0.53
CO
10% 4 4.62
80% 6 4.71
100% 4.1 6.01
VOCs
10% 0.59 0.96
80% 0.53 1.19
100% 0.4 1.31

Page 1 of 1
TABLE 3 CONTROLLED [TIER 4 (FINAL)-COMPLIANT] GENERATOR EMISSION RATES
FOR WARMED-UP CONDITIONS MICROSOFT PROJECT OXFORD DATA CENTER
QUINCY, WASHINGTON
06/11/14 P:\1409\001\010\FileRm\R\NOC Application\Final NOC Report Jun-2014\Final Project Oxford NOC_rpt-06-11-14.docx LANDAU ASSOCIATES
Pollutant Load
0.75-MW Generators 2.0-MW
Generators 2.5-MW Generators
Emission Rate
(Front Half Only For PM) (lb/hr)
Emission Rate
(Front + Back
Halves For PM) (lb/hr)
Emission Rate
(Including Front Half and Back Half For
PM) (lb/hr)
Emission Rate
(Front Half Only For PM) (lb/hr)
PM Emission
Rate (Front +
Back Halves) (lb/hr)
NOx
10% 5.7 -- 0.49 0.5 --
80% 1.8 -- 2.6 3.37 --
100% 2.6 -- 2.2 2.47 --
PM
10% 0.06 0.18 0.48 0.076 0.379
80% 0.03 0.1 0.21 0.08 0.288
100% 0.042 0.12 0.148 0.077 0.283
CO
10% 0.8 -- 2.6 2.93 --
80% 0.75 -- 10.1 15.04 --
100% 0.53 -- 4.45 7.61 --
Ammonia
10% 0.024 -- 0.064 0.080 --
80% 0.19 -- 0.51 0.64 --
100% 0.24 -- 0.64 0.80 --
VOCs
10% 0.2 -- 0.14 0.13 --
80% 0.1 -- 0.82 0.8 --
100% 0.1 -- 0.27 0.32 --
Note: The NOx emission rate at 10% load for the 0.75-MW generators assumes that the exhaust temperature at that load might be
so low that the SCR catalyst would not function.
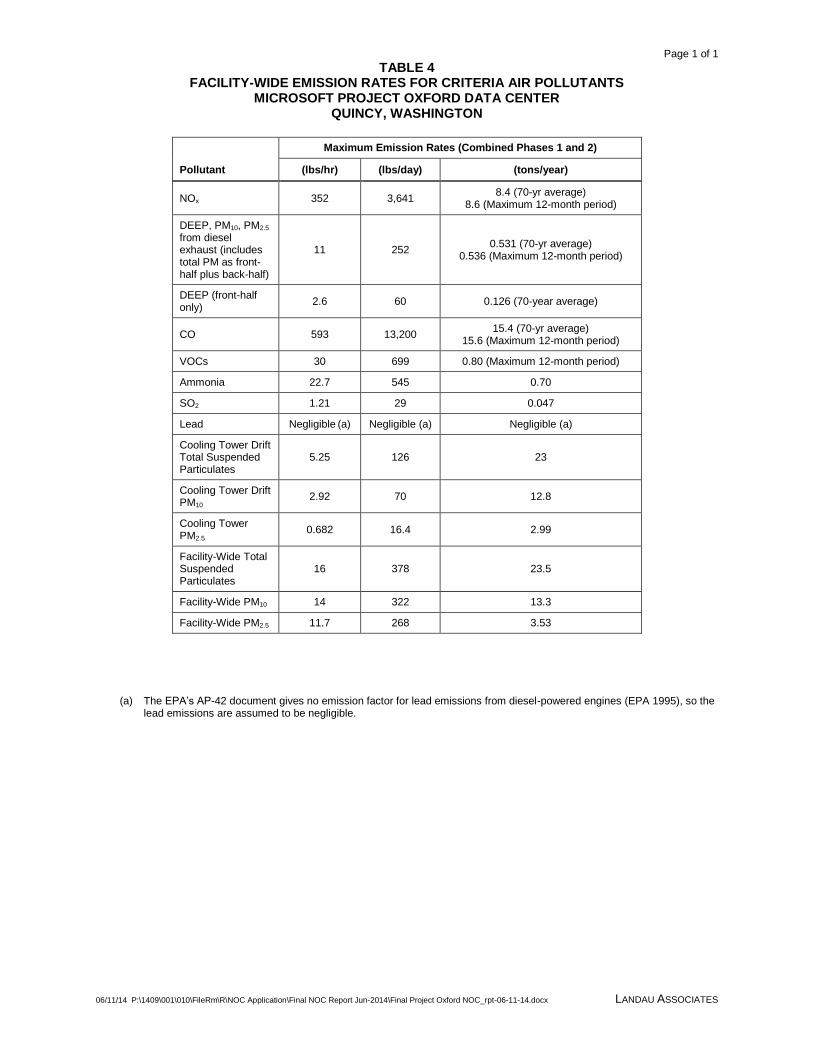
Page 1 of 1
TABLE 4 FACILITY-WIDE EMISSION RATES FOR CRITERIA AIR POLLUTANTS
MICROSOFT PROJECT OXFORD DATA CENTER QUINCY, WASHINGTON
06/11/14 P:\1409\001\010\FileRm\R\NOC Application\Final NOC Report Jun-2014\Final Project Oxford NOC_rpt-06-11-14.docx LANDAU ASSOCIATES
Pollutant
Maximum Emission Rates (Combined Phases 1 and 2)
(lbs/hr) (lbs/day) (tons/year)
NOx 352 3,641 8.4 (70-yr average)
8.6 (Maximum 12-month period)
DEEP, PM10, PM2.5 from diesel exhaust (includes total PM as front-half plus back-half)
11 252 0.531 (70-yr average)
0.536 (Maximum 12-month period)
DEEP (front-half only)
2.6 60 0.126 (70-year average)
CO 593 13,200 15.4 (70-yr average)
15.6 (Maximum 12-month period)
VOCs 30 699 0.80 (Maximum 12-month period)
Ammonia 22.7 545 0.70
SO2 1.21 29 0.047
Lead Negligible (a) Negligible (a) Negligible (a)
Cooling Tower Drift Total Suspended Particulates
5.25 126 23
Cooling Tower Drift PM10
2.92 70 12.8
Cooling Tower PM2.5
0.682 16.4 2.99
Facility-Wide Total Suspended Particulates
16 378 23.5
Facility-Wide PM10 14 322 13.3
Facility-Wide PM2.5 11.7 268 3.53
(a) The EPA’s AP-42 document gives no emission factor for lead emissions from diesel-powered engines (EPA 1995), so the
lead emissions are assumed to be negligible.
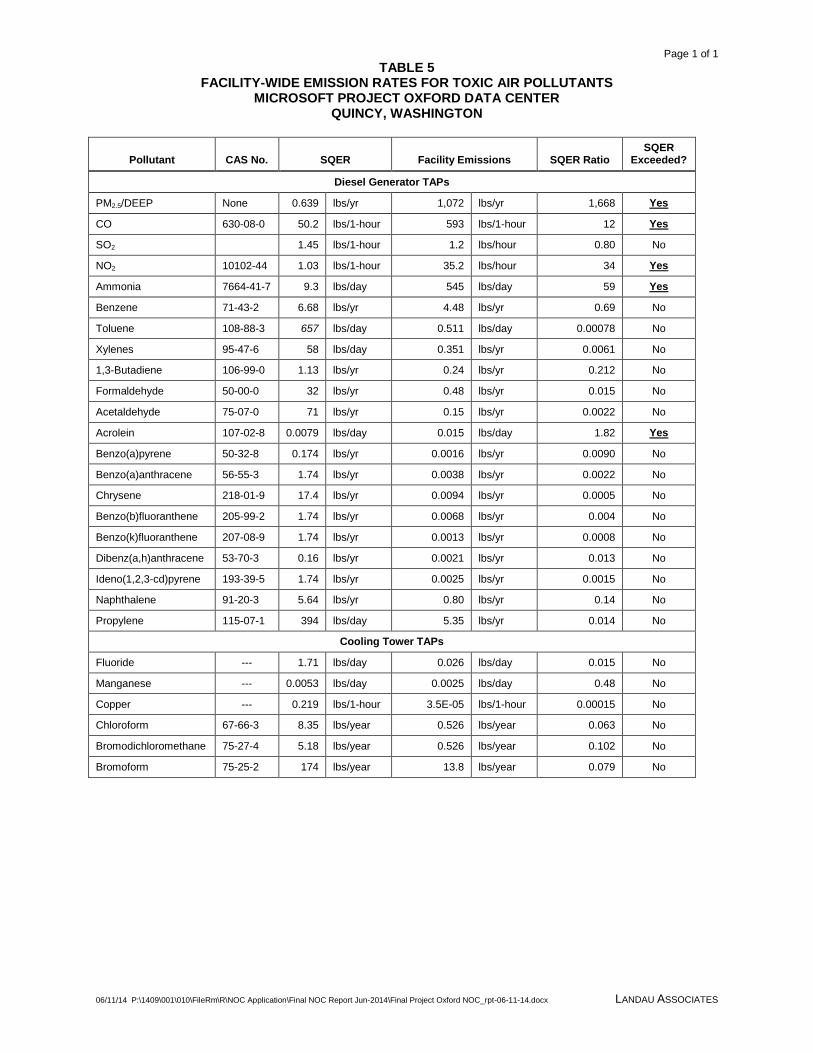
Page 1 of 1
TABLE 5 FACILITY-WIDE EMISSION RATES FOR TOXIC AIR POLLUTANTS
MICROSOFT PROJECT OXFORD DATA CENTER QUINCY, WASHINGTON
06/11/14 P:\1409\001\010\FileRm\R\NOC Application\Final NOC Report Jun-2014\Final Project Oxford NOC_rpt-06-11-14.docx LANDAU ASSOCIATES
Pollutant CAS No. SQER Facility Emissions SQER Ratio SQER
Exceeded?
Diesel Generator TAPs
PM2.5/DEEP None 0.639 lbs/yr 1,072 lbs/yr 1,668 Yes
CO 630-08-0 50.2 lbs/1-hour 593 lbs/1-hour 12 Yes
SO2 1.45 lbs/1-hour 1.2 lbs/hour 0.80 No
NO2 10102-44 1.03 lbs/1-hour 35.2 lbs/hour 34 Yes
Ammonia 7664-41-7 9.3 lbs/day 545 lbs/day 59 Yes
Benzene 71-43-2 6.68 lbs/yr 4.48 lbs/yr 0.69 No
Toluene 108-88-3 657 lbs/day 0.511 lbs/day 0.00078 No
Xylenes 95-47-6 58 lbs/day 0.351 lbs/yr 0.0061 No
1,3-Butadiene 106-99-0 1.13 lbs/yr 0.24 lbs/yr 0.212 No
Formaldehyde 50-00-0 32 lbs/yr 0.48 lbs/yr 0.015 No
Acetaldehyde 75-07-0 71 lbs/yr 0.15 lbs/yr 0.0022 No
Acrolein 107-02-8 0.0079 lbs/day 0.015 lbs/day 1.82 Yes
Benzo(a)pyrene 50-32-8 0.174 lbs/yr 0.0016 lbs/yr 0.0090 No
Benzo(a)anthracene 56-55-3 1.74 lbs/yr 0.0038 lbs/yr 0.0022 No
Chrysene 218-01-9 17.4 lbs/yr 0.0094 lbs/yr 0.0005 No
Benzo(b)fluoranthene 205-99-2 1.74 lbs/yr 0.0068 lbs/yr 0.004 No
Benzo(k)fluoranthene 207-08-9 1.74 lbs/yr 0.0013 lbs/yr 0.0008 No
Dibenz(a,h)anthracene 53-70-3 0.16 lbs/yr 0.0021 lbs/yr 0.013 No
Ideno(1,2,3-cd)pyrene 193-39-5 1.74 lbs/yr 0.0025 lbs/yr 0.0015 No
Naphthalene 91-20-3 5.64 lbs/yr 0.80 lbs/yr 0.14 No
Propylene 115-07-1 394 lbs/day 5.35 lbs/yr 0.014 No
Cooling Tower TAPs
Fluoride --- 1.71 lbs/day 0.026 lbs/day 0.015 No
Manganese --- 0.0053 lbs/day 0.0025 lbs/day 0.48 No
Copper --- 0.219 lbs/1-hour 3.5E-05 lbs/1-hour 0.00015 No
Chloroform 67-66-3 8.35 lbs/year 0.526 lbs/year 0.063 No
Bromodichloromethane 75-27-4 5.18 lbs/year 0.526 lbs/year 0.102 No
Bromoform 75-25-2 174 lbs/year 13.8 lbs/year 0.079 No

Page 1 of 1
TABLE 6 RANKING OF TECHNICALLY FEASIBLE CONTROL TECHNOLOGIES
MICROSOFT PROJECT OXFORD DATA CENTER QUINCY, WASHINGTON
06/11/14 P:\1409\001\010\FileRm\R\NOC Application\Final NOC Report Jun-2014\Final Project Oxford NOC_rpt-06-11-14.docx LANDAU ASSOCIATES
Technology and Runtime Condition
Percent Removal Efficiency For Each Pollutant
PM2.5/DEEP CO VOCS NOx
Tier-4F Capable Integrated System (Cold-Start, Catalyst-Delay Average Efficiency)
54% 90% 80% 84%
Urea-SCR for NOx Control (Steady-State, Warmed-Up Removal Efficiency)
Ineffective Ineffective Ineffective 89%
Catalyzed DPF By Itself (Steady-State, Warmed-Up Removal Efficiency)
85% 90% 80% Ineffective
Diesel Oxidation Catalyst By Itself (Steady-State, Warmed-Up Removal Efficiency)
20% 90% 80% Ineffective

Page 1 of 1
TABLE 7 SUMMARY OF COST-EFFECTIVENESS ANALYSES FOR INDIVIDUAL CRITERIA AIR POLLUTANTS
MICROSOFT PROJECT OXFORD DATA CENTER QUINCY, WASHINGTON
06/11/14 P:\1409\001\010\FileRm\R\NOC Application\Final NOC Report Jun-2014\Final Project Oxford NOC_rpt-06-11-14.docx LANDAU ASSOCIATES
Control Device
Cost-Effectiveness ($/ton)
PM CO VOCs NOX Combined Pollutants
Tier-4F Capable Integrated Control System (Catalyzed DPF + SCR)
$2,260,000 $199,000 $1,420,000 $34,400 $28,400
Urea-SCR Alone Ineffective Ineffective Ineffective $19,100 $19,100
Catalyzed DPF Alone $595,000 $84,000 $432,000 Ineffective $62,800
Diesel Oxidation Catalyst Alone $1,090,000 $34,000 $175,000 Ineffective $27,700
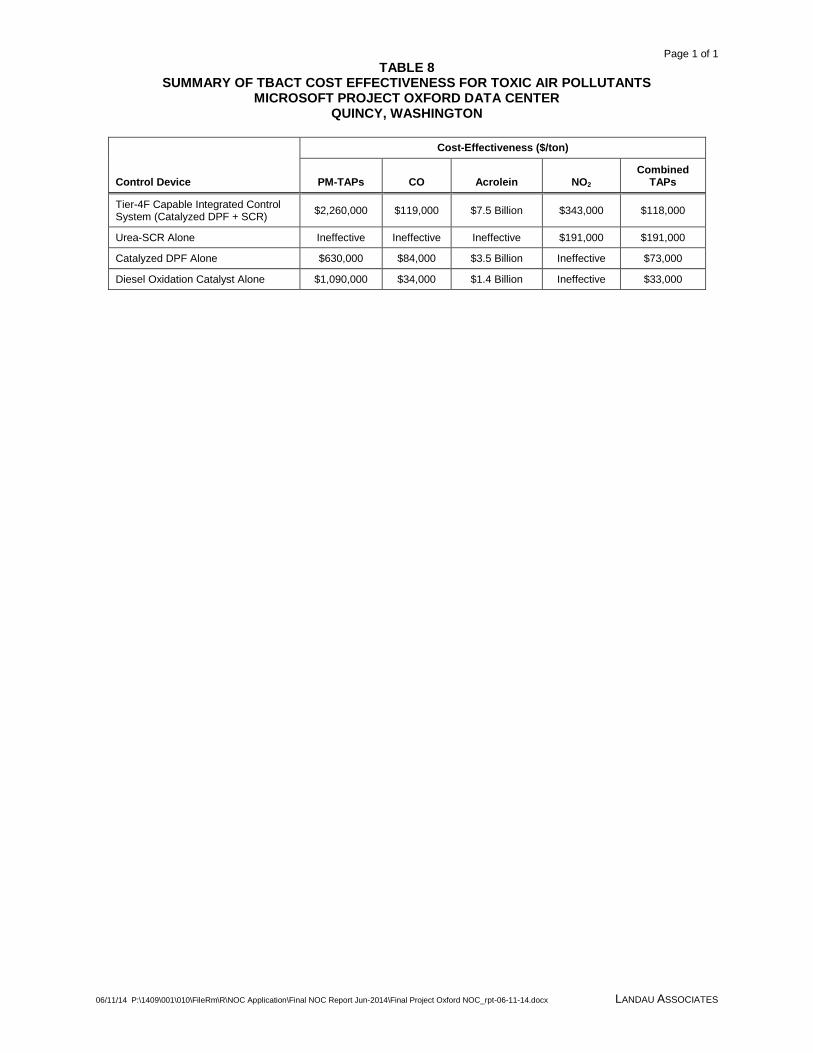
Page 1 of 1
TABLE 8 SUMMARY OF TBACT COST EFFECTIVENESS FOR TOXIC AIR POLLUTANTS
MICROSOFT PROJECT OXFORD DATA CENTER QUINCY, WASHINGTON
06/11/14 P:\1409\001\010\FileRm\R\NOC Application\Final NOC Report Jun-2014\Final Project Oxford NOC_rpt-06-11-14.docx LANDAU ASSOCIATES
Control Device
Cost-Effectiveness ($/ton)
PM-TAPs CO Acrolein NO2 Combined
TAPs
Tier-4F Capable Integrated Control System (Catalyzed DPF + SCR)
$2,260,000 $119,000 $7.5 Billion $343,000 $118,000
Urea-SCR Alone Ineffective Ineffective Ineffective $191,000 $191,000
Catalyzed DPF Alone $630,000 $84,000 $3.5 Billion Ineffective $73,000
Diesel Oxidation Catalyst Alone $1,090,000 $34,000 $1.4 Billion Ineffective $33,000

Page 1 of 1
TABLE 9 AERMET MODEL INPUT PARAMETERS
MICROSOFT PROJECT OXFORD DATA CENTER QUINCY, WASHINGTON
06/11/14 P:\1409\001\010\FileRm\R\NOC Application\Final NOC Report Jun-2014\Final Project Oxford NOC_rpt-06-11-14.docx LANDAU ASSOCIATES
Data Type Source (a) Source
IDs Station Type Latitude Longitude
Hourly Surface Observations 2001-2005
Grant County International Airport Moses Lake, WA
72782 24111
ASOS-FAA 47.19N 119.31W
Twice-Daily Upper Air Soundings 2001-2005
Spokane, WA 72785 4106
NEXRAD 47.67N 117.62W
Site-Specific Data AERMET User’s guide AERSURFACE
N/A N/A 47.19N 119.31W
Notes:
(a) Surface and upper air data purchased from the National Climatic Data Center.
ASOS-FAA = Automated Surface Observation System.
NEXRAD = Next Generation Radar.
N/A = Not applicable.

Page 1 of 2
TABLE 10 AIR DISPERSION MODELING RESULTS
MICROSOFT PROJECT OXFORD DATA CENTER QUINCY, WASHINGTON
06/11/14 P:\1409\001\010\FileRm\R\NOC Application\Final NOC Report Jun-2014\Final Project Oxford NOC_rpt-06-11-14.docx LANDAU ASSOCIATES
Standards in µg/m3
Maximum Ambient Impact
Concentration (µg/m
3)
Maximum Ambient
Impact Concentration Added to Background (µg/m
3) (If Available)
National Standards Washington State
Standards
AERMOD Background Concentrations
(µg/m3) (a) Criteria Pollutant Primary Secondary Filename
Total Suspended Particulates
Annual average -- -- 60 0.08 + 1.079 = 1.16 PM10-121313a 6.5 (Regional) 7.65
1st-Highest 24-hour
average during power outage with cooling
towers -- -- 150 15.7 + 11.3 = 27.0 PM10-121313b 81 (Regional) 108
Particulate Matter (PM10)
Annual average -- -- 50 0.08 + 1.079 = 1.16 PM10-121313a 6.5 (Regional) 7.7
1st-Highest 24-hour
average during power outage with cooling
towers 150 150 150 8.7 + 11.3 = 20 PM10-121313b 81(Regional) 101
Particulate Matter (PM2.5)
Annual average 12 15 -- 0.08 + 0.25 = 0.33 PM10-121313a 6.5 (Regional) 6.8
4th-highest 24-hour
average for cooling towers and electrical bypass 35 35 -- 0.69 + 2.37 = 3.1 PM25-120613a-e, f
21 (Regional) + 0.021 (Local) 24.4
Carbon Monoxide (CO)
8-hour average 10,000 -- 10,000 873 CO-112713a 482 1,355
1-hour average 40,000 -- 40,000 1507 CO-112713a 842 2,349
Nitrogen Oxides (NO2)
Annual average (b) 100 100 100 1.1 NOx-120413a 2.8 3.9
1-hour average 188 -- -- 160 NOx-112413b thru f 15.6 (Regional),
0.28 (local) 176
Sulfur Dioxide (SO2)
Annual arithmetic mean -- -- 80 0.0066 (c) 0.26 0.27
24-hour average -- -- 365 1.2 SO2-120413a 1.0 2.2
3-hour average -- 1,300 -- 2.3 SO2-120413a 2.1 4.4
1-hour average 195 -- 319 3.1 SO2-120413a 2.6 5.7
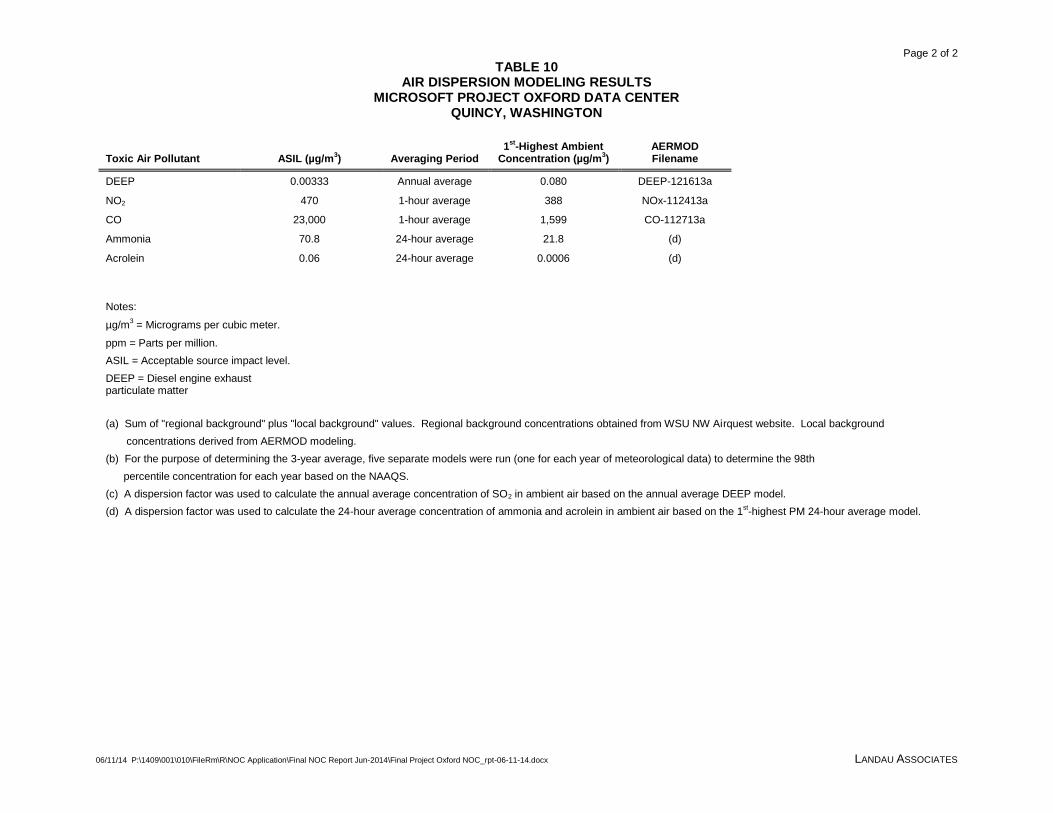
Page 2 of 2
TABLE 10 AIR DISPERSION MODELING RESULTS
MICROSOFT PROJECT OXFORD DATA CENTER QUINCY, WASHINGTON
06/11/14 P:\1409\001\010\FileRm\R\NOC Application\Final NOC Report Jun-2014\Final Project Oxford NOC_rpt-06-11-14.docx LANDAU ASSOCIATES
Toxic Air Pollutant ASIL (µg/m3) Averaging Period
1st-Highest Ambient
Concentration (µg/m3)
AERMOD Filename
DEEP 0.00333 Annual average 0.080 DEEP-121613a
NO2 470 1-hour average 388 NOx-112413a
CO 23,000 1-hour average 1,599 CO-112713a
Ammonia 70.8 24-hour average 21.8 (d)
Acrolein 0.06 24-hour average 0.0006 (d)
Notes:
µg/m3 = Micrograms per cubic meter.
ppm = Parts per million.
ASIL = Acceptable source impact level.
DEEP = Diesel engine exhaust particulate matter
(a) Sum of "regional background" plus "local background" values. Regional background concentrations obtained from WSU NW Airquest website. Local background
concentrations derived from AERMOD modeling.
(b) For the purpose of determining the 3-year average, five separate models were run (one for each year of meteorological data) to determine the 98th
percentile concentration for each year based on the NAAQS.
(c) A dispersion factor was used to calculate the annual average concentration of SO2 in ambient air based on the annual average DEEP model.
(d) A dispersion factor was used to calculate the 24-hour average concentration of ammonia and acrolein in ambient air based on the 1st-highest PM 24-hour average model.
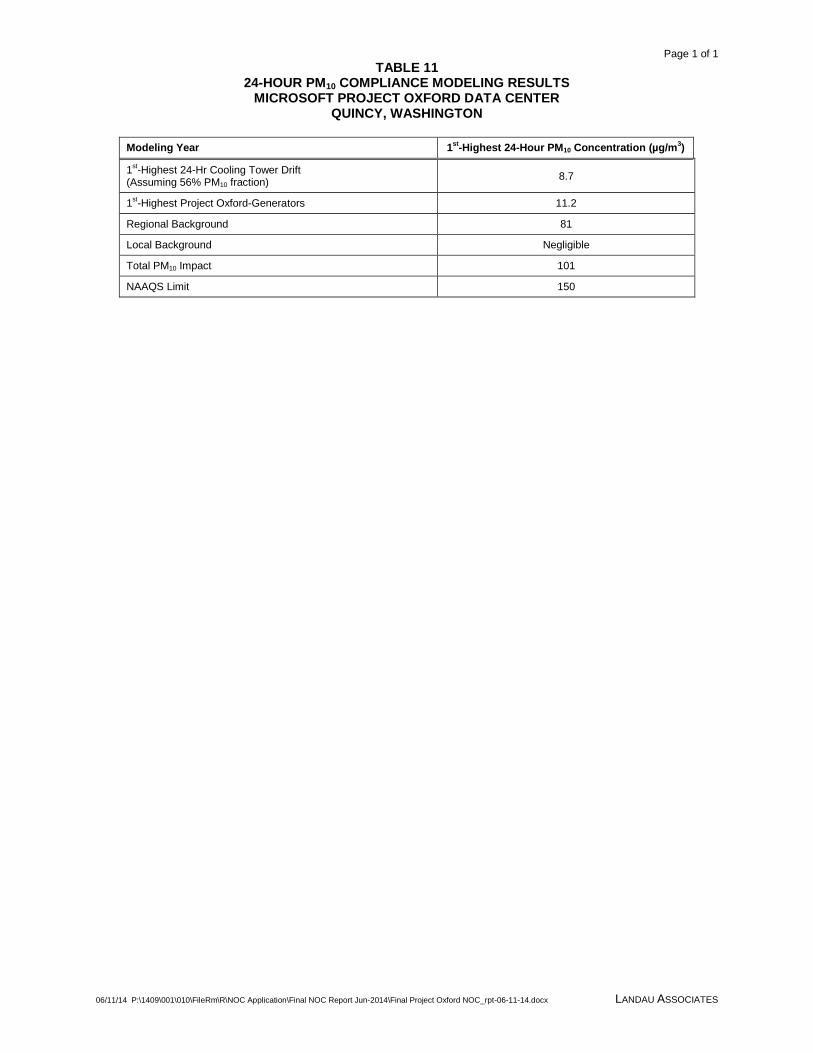
Page 1 of 1
TABLE 11 24-HOUR PM10 COMPLIANCE MODELING RESULTS
MICROSOFT PROJECT OXFORD DATA CENTER QUINCY, WASHINGTON
06/11/14 P:\1409\001\010\FileRm\R\NOC Application\Final NOC Report Jun-2014\Final Project Oxford NOC_rpt-06-11-14.docx LANDAU ASSOCIATES
Modeling Year 1st-Highest 24-Hour PM10 Concentration (µg/m
3)
1st-Highest 24-Hr Cooling Tower Drift
(Assuming 56% PM10 fraction) 8.7
1st-Highest Project Oxford-Generators 11.2
Regional Background 81
Local Background Negligible
Total PM10 Impact 101
NAAQS Limit 150
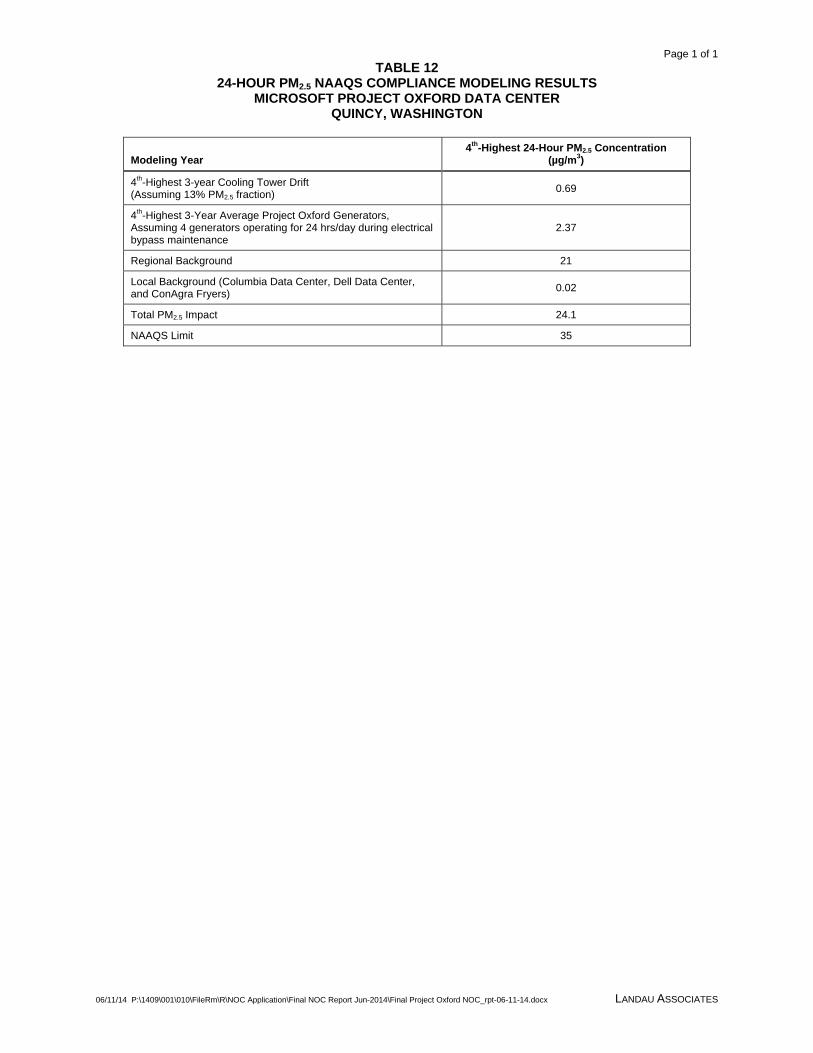
Page 1 of 1 TABLE 12
24-HOUR PM2.5 NAAQS COMPLIANCE MODELING RESULTS MICROSOFT PROJECT OXFORD DATA CENTER
QUINCY, WASHINGTON
06/11/14 P:\1409\001\010\FileRm\R\NOC Application\Final NOC Report Jun-2014\Final Project Oxford NOC_rpt-06-11-14.docx LANDAU ASSOCIATES
Modeling Year 4th-Highest 24-Hour PM2.5 Concentration
(µg/m3)
4th-Highest 3-year Cooling Tower Drift (Assuming 13% PM2.5 fraction)
0.69
4th-Highest 3-Year Average Project Oxford Generators, Assuming 4 generators operating for 24 hrs/day during electrical bypass maintenance
2.37
Regional Background 21
Local Background (Columbia Data Center, Dell Data Center, and ConAgra Fryers)
0.02
Total PM2.5 Impact 24.1
NAAQS Limit 35
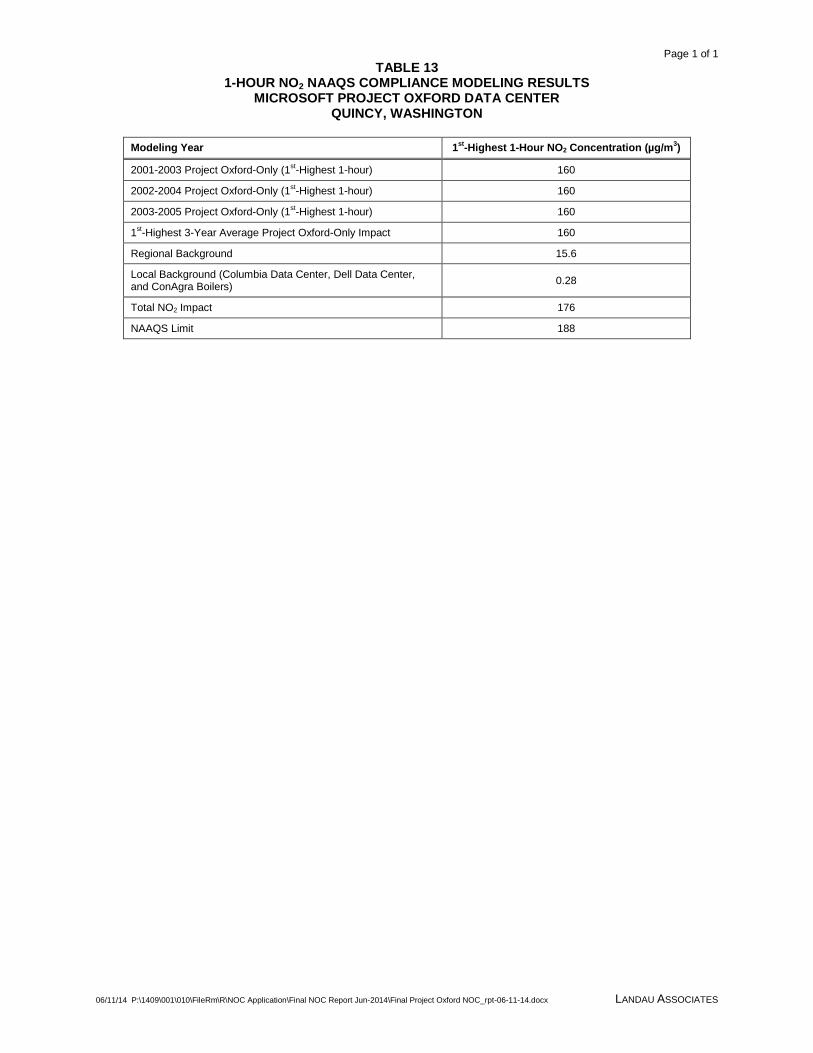
Page 1 of 1
TABLE 13 1-HOUR NO2 NAAQS COMPLIANCE MODELING RESULTS
MICROSOFT PROJECT OXFORD DATA CENTER QUINCY, WASHINGTON
06/11/14 P:\1409\001\010\FileRm\R\NOC Application\Final NOC Report Jun-2014\Final Project Oxford NOC_rpt-06-11-14.docx LANDAU ASSOCIATES
Modeling Year 1st-Highest 1-Hour NO2 Concentration (µg/m
3)
2001-2003 Project Oxford-Only (1st-Highest 1-hour) 160
2002-2004 Project Oxford-Only (1st-Highest 1-hour) 160
2003-2005 Project Oxford-Only (1st-Highest 1-hour) 160
1st-Highest 3-Year Average Project Oxford-Only Impact 160
Regional Background 15.6
Local Background (Columbia Data Center, Dell Data Center, and ConAgra Boilers)
0.28
Total NO2 Impact 176
NAAQS Limit 188

APPENDIX A
Generator Specifications
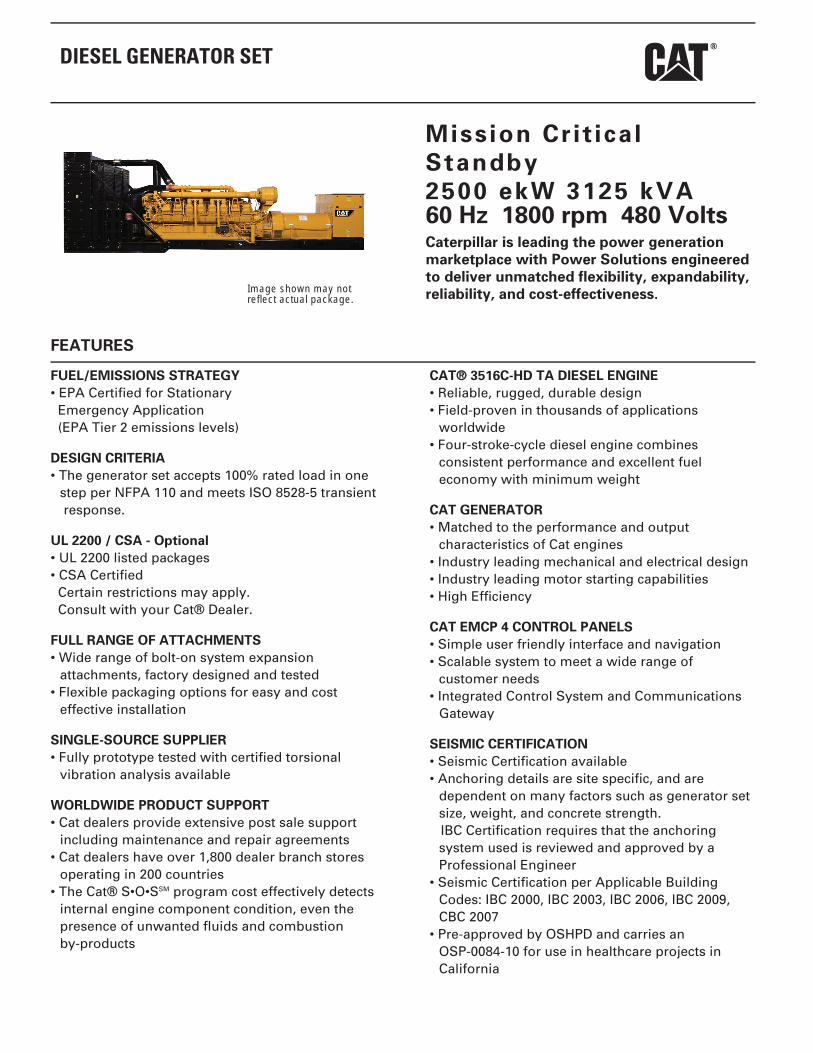
DIESEL GENERATOR SET
Mission Crit icalStandby2500 ekW 3125 kVA60 Hz 1800 rpm 480 VoltsCaterpillar is leading the power generationmarketplace with Power Solutions engineeredto deliver unmatched flexibility, expandability,reliability, and cost-effectiveness.Image shown may not
reflect actual package.
FEATURES
FUEL/EMISSIONS STRATEGY• EPA Certified for Stationary
Emergency Application(EPA Tier 2 emissions levels)
DESIGN CRITERIA• The generator set accepts 100% rated load in one
step per NFPA 110 and meets ISO 8528-5 transientresponse.
UL 2200 / CSA - Optional• UL 2200 listed packages• CSA Certified
Certain restrictions may apply.Consult with your Cat® Dealer.
FULL RANGE OF ATTACHMENTS• Wide range of bolt-on system expansion
attachments, factory designed and tested• Flexible packaging options for easy and cost
effective installation
SINGLE-SOURCE SUPPLIER• Fully prototype tested with certified torsional
vibration analysis available
WORLDWIDE PRODUCT SUPPORT• Cat dealers provide extensive post sale support
including maintenance and repair agreements• Cat dealers have over 1,800 dealer branch stores
operating in 200 countries• The Cat® S•O•SSM program cost effectively detects
internal engine component condition, even thepresence of unwanted fluids and combustionby-products
CAT® 3516C-HD TA DIESEL ENGINE• Reliable, rugged, durable design• Field-proven in thousands of applications
worldwide• Four-stroke-cycle diesel engine combines
consistent performance and excellent fueleconomy with minimum weight
CAT GENERATOR• Matched to the performance and output
characteristics of Cat engines• Industry leading mechanical and electrical design• Industry leading motor starting capabilities• High Efficiency
CAT EMCP 4 CONTROL PANELS• Simple user friendly interface and navigation• Scalable system to meet a wide range of
customer needs• Integrated Control System and Communications
Gateway
SEISMIC CERTIFICATION• Seismic Certification available• Anchoring details are site specific, and are
dependent on many factors such as generator setsize, weight, and concrete strength.IBC Certification requires that the anchoringsystem used is reviewed and approved by aProfessional Engineer
• Seismic Certification per Applicable BuildingCodes: IBC 2000, IBC 2003, IBC 2006, IBC 2009,CBC 2007
• Pre-approved by OSHPD and carries anOSP-0084-10 for use in healthcare projects inCalifornia

Mission Critical Standby 2500 ekW 3125 kVA60 Hz 1800 rpm 480 Volts
FACTORY INSTALLED STANDARD & OPTIONAL EQUIPMENT
System Standard OptionalAir Inlet • Single element canister type air cleaner
• Service indicator[ ] Dual element & heavy duty air cleaners[ ] Air inlet adapters & shut-off
Cooling • Radiator with guard• Coolant drain line with valve• Fan and belt guards• Cat® Extended Life Coolant
[ ] Radiator duct flange
Exhaust • Dry exhaust manifold• Flanged faced outlets
[ ] Mufflers and Silencers[ ] Stainless steel exhaust flex fittings[ ] Elbows, flanges, expanders & Y adapters
Fuel • Secondary fuel filters• Fuel priming pump• Flexible fuel lines• Fuel cooler*
[ ] Water separator[ ] Duplex fuel filter
Generator • Cat digital voltage regulator (CDVR) with kVAR/PFcontrol, 3-phase sensing
• Winding temperature detectors• Anti-condensation heaters
[ ] Oversize & premium generators[ ] Bearing temperature detectors
Power Termination • Bus bar (NEMA or IEC mechanical lug holes)- rightside standard
• Top and bottom cable entry
[ ] Circuit breakers, UL listed, 3 pole with shunttrip,100% rated, manual or electrically operated
[ ] Circuit breakers, IEC compliant, 3 or 4 pole withshunt trip, manual or electrically operated
[ ] Bottom cable entry[ ] Power terminations can be located on the right, left
and/or rear as an option.Governor • ADEM™ 3 [ ] Load share module
Control Panels • EMCP 4.2 Genset controller [ ] Digital I/O Module[ ] Generator temperature monitoring & protection
Lube • Lubricating oil and filter• Oil drain line with valves• Fumes disposal• Gear type lube oil pump
[ ] Oil level regulator[ ] Deep sump oil pan[ ] Electric & air prelube pumps[ ] Manual prelube with sump pump[ ] Duplex oil filter
Mounting • Rails - engine / generator / radiator mounting• Rubber anti-vibration mounts (shipped loose)
[ ] Spring-type vibration isolator[ ] IBC Isolators
Starting/Charging • 24 volt starting motor(s)• Batteries with rack and cables• Battery disconnect switch
[ ] Battery chargers[ ] Charging alternator[ ] Oversize batteries[ ] Ether starting aid[ ] Heavy duty starting motors[ ] Barring device (manual)[ ] Air starting motor with control & silencer[ ] Jacket water heater
General • Right-hand service• Paint - Caterpillar Yellow except rails and radiators
are gloss black• SAE standard rotation• Flywheel and flywheel housing - SAE No. 00
[ ] UL 2200[ ] CSA certification[ ] CE Certificate of Conformance[ ] Seismic Certification per Applicable Building Codes:
IBC 2000, IBC 2003, IBC 2006, IBC 2009, CBC 2007
Note Standard and optional equipment may vary for UL2200 Listed Packages. UL 2200 Listed packages mayhave oversized generators with a differenttemperature rise and motor starting characteristics.
November 06 2012 13:05 PM2
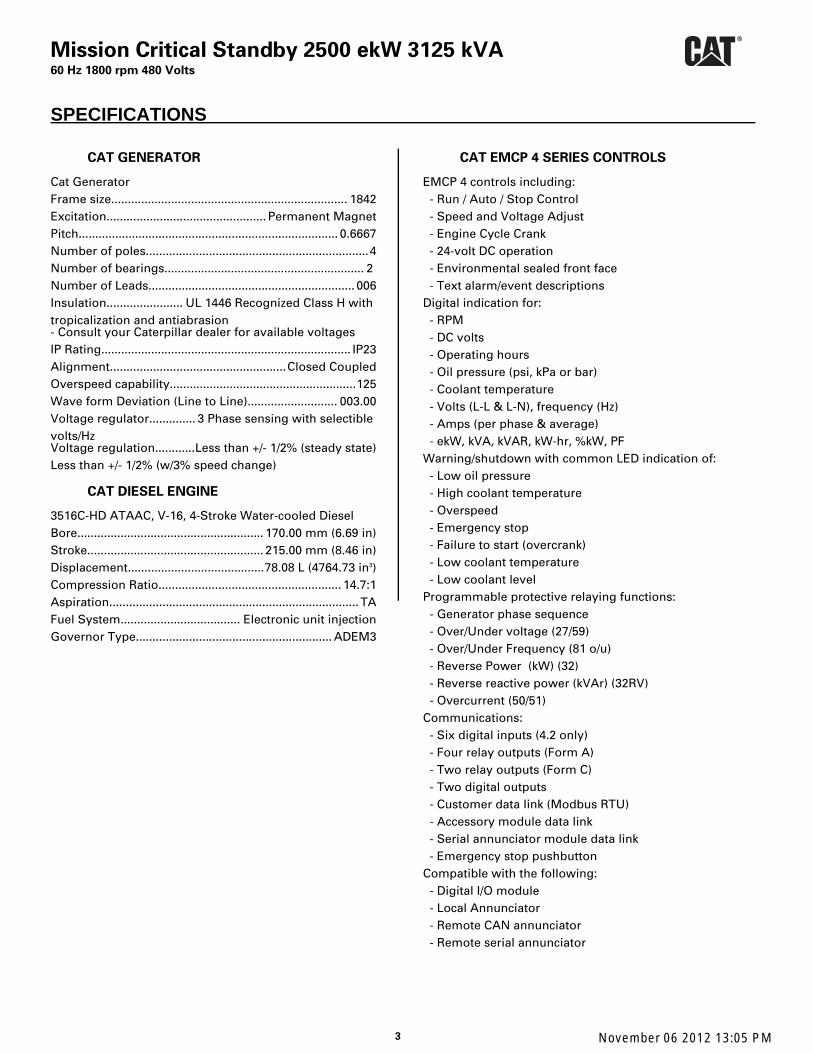
Mission Critical Standby 2500 ekW 3125 kVA60 Hz 1800 rpm 480 Volts
SPECIFICATIONS
CAT GENERATOR
Cat GeneratorFrame size....................................................................... 1842Excitation................................................ Permanent MagnetPitch.............................................................................. 0.6667Number of poles...................................................................4Number of bearings............................................................ 2Number of Leads.............................................................. 006Insulation....................... UL 1446 Recognized Class H withtropicalization and antiabrasion- Consult your Caterpillar dealer for available voltagesIP Rating........................................................................... IP23Alignment.....................................................Closed CoupledOverspeed capability........................................................125Wave form Deviation (Line to Line)........................... 003.00Voltage regulator.............. 3 Phase sensing with selectiblevolts/HzVoltage regulation............Less than +/- 1/2% (steady state)Less than +/- 1/2% (w/3% speed change)
CAT DIESEL ENGINE
3516C-HD ATAAC, V-16, 4-Stroke Water-cooled DieselBore........................................................ 170.00 mm (6.69 in)Stroke..................................................... 215.00 mm (8.46 in)Displacement.........................................78.08 L (4764.73 in3)Compression Ratio....................................................... 14.7:1Aspiration........................................................................... TAFuel System.................................... Electronic unit injectionGovernor Type........................................................... ADEM3
CAT EMCP 4 SERIES CONTROLS
EMCP 4 controls including:- Run / Auto / Stop Control- Speed and Voltage Adjust- Engine Cycle Crank- 24-volt DC operation- Environmental sealed front face- Text alarm/event descriptions
Digital indication for:- RPM- DC volts- Operating hours- Oil pressure (psi, kPa or bar)- Coolant temperature- Volts (L-L & L-N), frequency (Hz)- Amps (per phase & average)- ekW, kVA, kVAR, kW-hr, %kW, PF
Warning/shutdown with common LED indication of:- Low oil pressure- High coolant temperature- Overspeed- Emergency stop- Failure to start (overcrank)- Low coolant temperature- Low coolant level
Programmable protective relaying functions:- Generator phase sequence- Over/Under voltage (27/59)- Over/Under Frequency (81 o/u)- Reverse Power (kW) (32)- Reverse reactive power (kVAr) (32RV)- Overcurrent (50/51)
Communications:- Six digital inputs (4.2 only)- Four relay outputs (Form A)- Two relay outputs (Form C)- Two digital outputs- Customer data link (Modbus RTU)- Accessory module data link- Serial annunciator module data link- Emergency stop pushbutton
Compatible with the following:- Digital I/O module- Local Annunciator- Remote CAN annunciator- Remote serial annunciator
November 06 2012 13:05 PM3
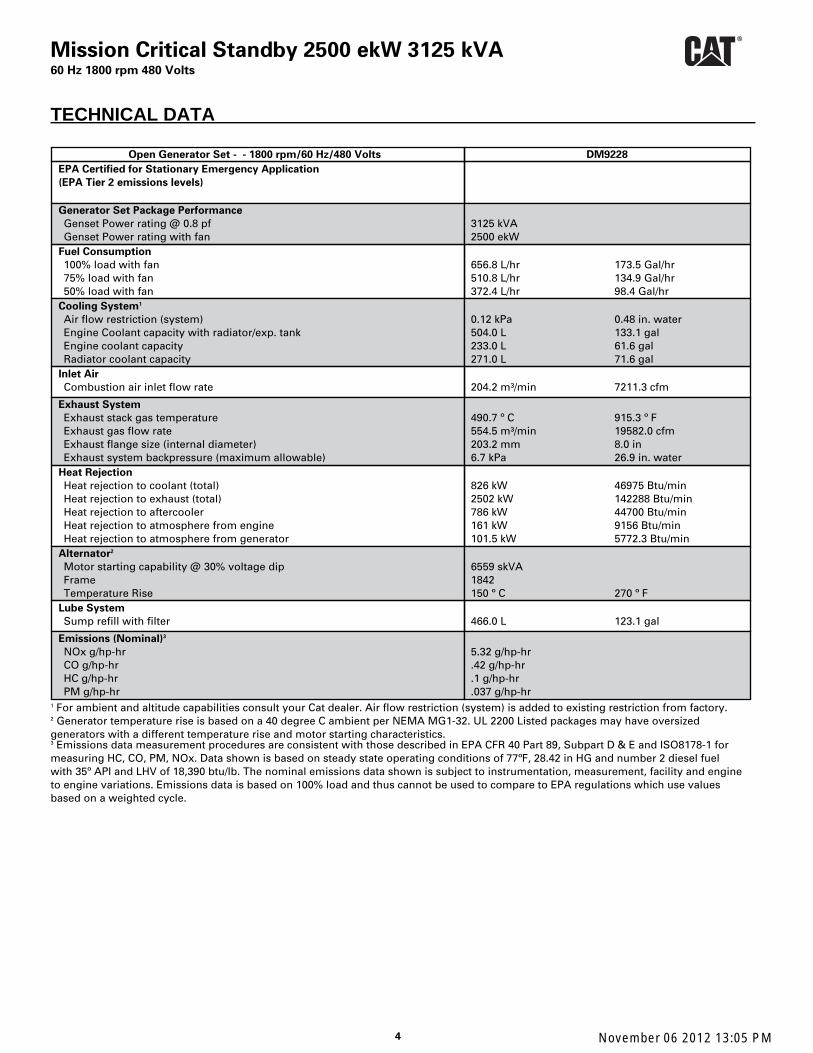
Mission Critical Standby 2500 ekW 3125 kVA60 Hz 1800 rpm 480 Volts
TECHNICAL DATA
Open Generator Set - - 1800 rpm/60 Hz/480 Volts DM9228EPA Certified for Stationary Emergency Application(EPA Tier 2 emissions levels)
Generator Set Package PerformanceGenset Power rating @ 0.8 pfGenset Power rating with fan
3125 kVA2500 ekW
Fuel Consumption100% load with fan75% load with fan50% load with fan
656.8 L/hr 173.5 Gal/hr510.8 L/hr 134.9 Gal/hr372.4 L/hr 98.4 Gal/hr
Cooling System1
Air flow restriction (system)Engine Coolant capacity with radiator/exp. tankEngine coolant capacityRadiator coolant capacity
0.12 kPa 0.48 in. water504.0 L 133.1 gal233.0 L 61.6 gal271.0 L 71.6 gal
Inlet AirCombustion air inlet flow rate 204.2 m³/min 7211.3 cfm
Exhaust SystemExhaust stack gas temperatureExhaust gas flow rateExhaust flange size (internal diameter)Exhaust system backpressure (maximum allowable)
490.7 º C 915.3 º F554.5 m³/min 19582.0 cfm203.2 mm 8.0 in6.7 kPa 26.9 in. water
Heat RejectionHeat rejection to coolant (total)Heat rejection to exhaust (total)Heat rejection to aftercoolerHeat rejection to atmosphere from engineHeat rejection to atmosphere from generator
826 kW 46975 Btu/min2502 kW 142288 Btu/min786 kW 44700 Btu/min161 kW 9156 Btu/min101.5 kW 5772.3 Btu/min
Alternator2
Motor starting capability @ 30% voltage dipFrameTemperature Rise
6559 skVA1842150 º C 270 º F
Lube SystemSump refill with filter 466.0 L 123.1 gal
Emissions (Nominal)3
NOx g/hp-hrCO g/hp-hrHC g/hp-hrPM g/hp-hr
5.32 g/hp-hr.42 g/hp-hr.1 g/hp-hr.037 g/hp-hr
1 For ambient and altitude capabilities consult your Cat dealer. Air flow restriction (system) is added to existing restriction from factory.2 Generator temperature rise is based on a 40 degree C ambient per NEMA MG1-32. UL 2200 Listed packages may have oversizedgenerators with a different temperature rise and motor starting characteristics.3 Emissions data measurement procedures are consistent with those described in EPA CFR 40 Part 89, Subpart D & E and ISO8178-1 formeasuring HC, CO, PM, NOx. Data shown is based on steady state operating conditions of 77ºF, 28.42 in HG and number 2 diesel fuelwith 35º API and LHV of 18,390 btu/lb. The nominal emissions data shown is subject to instrumentation, measurement, facility and engineto engine variations. Emissions data is based on 100% load and thus cannot be used to compare to EPA regulations which use valuesbased on a weighted cycle.
November 06 2012 13:05 PM4
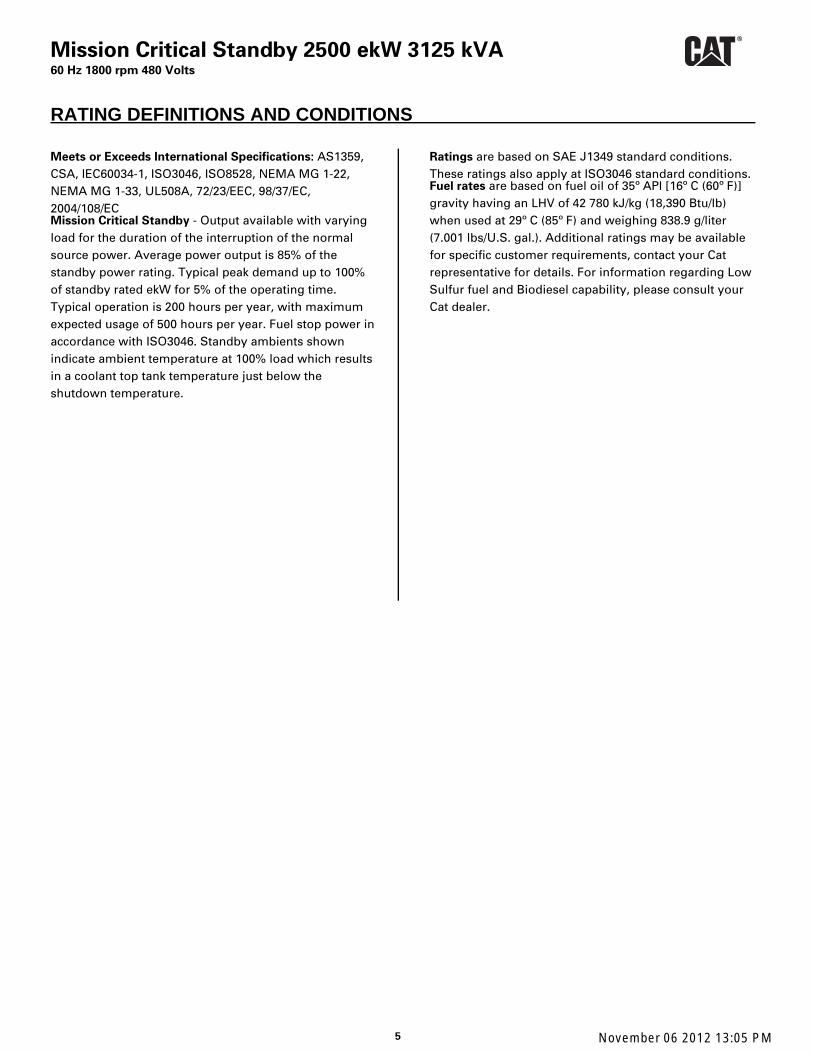
Mission Critical Standby 2500 ekW 3125 kVA60 Hz 1800 rpm 480 Volts
RATING DEFINITIONS AND CONDITIONS
Meets or Exceeds International Specifications: AS1359,CSA, IEC60034-1, ISO3046, ISO8528, NEMA MG 1-22,NEMA MG 1-33, UL508A, 72/23/EEC, 98/37/EC,2004/108/ECMission Critical Standby - Output available with varyingload for the duration of the interruption of the normalsource power. Average power output is 85% of thestandby power rating. Typical peak demand up to 100%of standby rated ekW for 5% of the operating time.Typical operation is 200 hours per year, with maximumexpected usage of 500 hours per year. Fuel stop power inaccordance with ISO3046. Standby ambients shownindicate ambient temperature at 100% load which resultsin a coolant top tank temperature just below theshutdown temperature.
Ratings are based on SAE J1349 standard conditions.These ratings also apply at ISO3046 standard conditions.Fuel rates are based on fuel oil of 35º API [16º C (60º F)]gravity having an LHV of 42 780 kJ/kg (18,390 Btu/lb)when used at 29º C (85º F) and weighing 838.9 g/liter(7.001 lbs/U.S. gal.). Additional ratings may be availablefor specific customer requirements, contact your Catrepresentative for details. For information regarding LowSulfur fuel and Biodiesel capability, please consult yourCat dealer.
November 06 2012 13:05 PM5
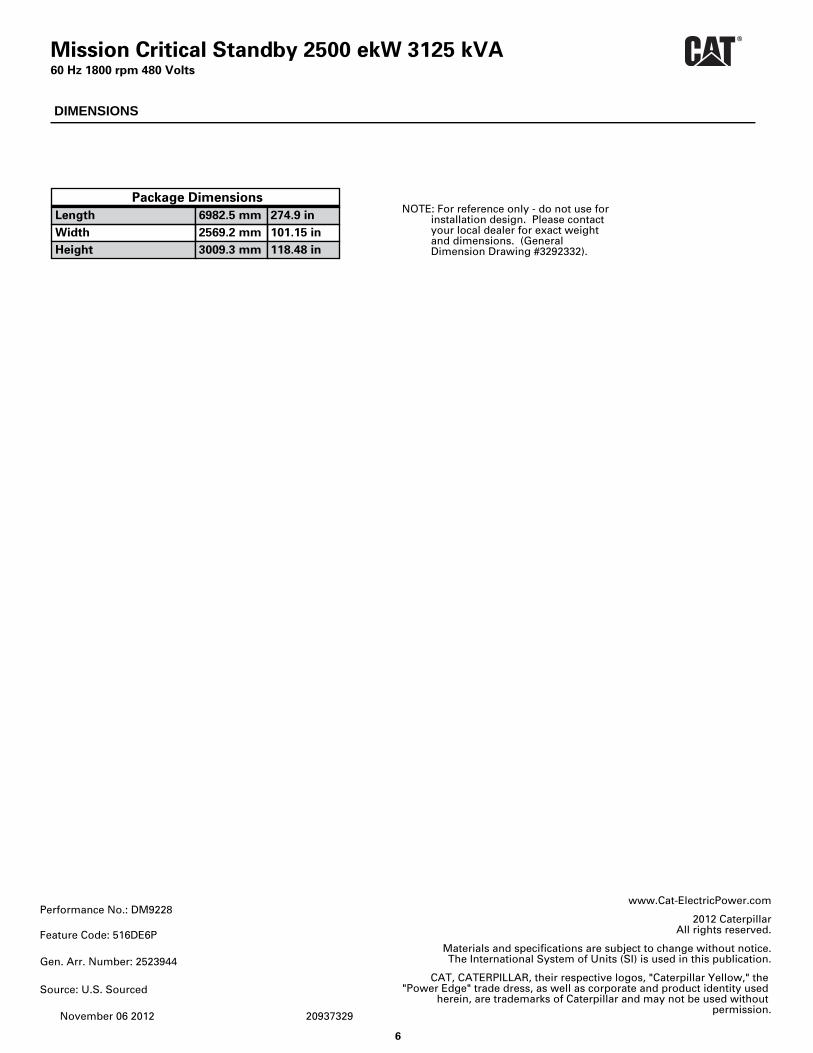
Mission Critical Standby 2500 ekW 3125 kVA60 Hz 1800 rpm 480 Volts
DIMENSIONS
Package DimensionsLength 6982.5 mm 274.9 inWidth 2569.2 mm 101.15 inHeight 3009.3 mm 118.48 in
NOTE: For reference only - do not use forinstallation design. Please contactyour local dealer for exact weightand dimensions. (GeneralDimension Drawing #3292332).
www.Cat-ElectricPower.com
2012 CaterpillarAll rights reserved.
Materials and specifications are subject to change without notice.The International System of Units (SI) is used in this publication.
CAT, CATERPILLAR, their respective logos, "Caterpillar Yellow," the"Power Edge" trade dress, as well as corporate and product identity used
herein, are trademarks of Caterpillar and may not be used withoutpermission.
20937329
Performance No.: DM9228
Feature Code: 516DE6P
Gen. Arr. Number: 2523944
Source: U.S. Sourced
November 06 2012
6
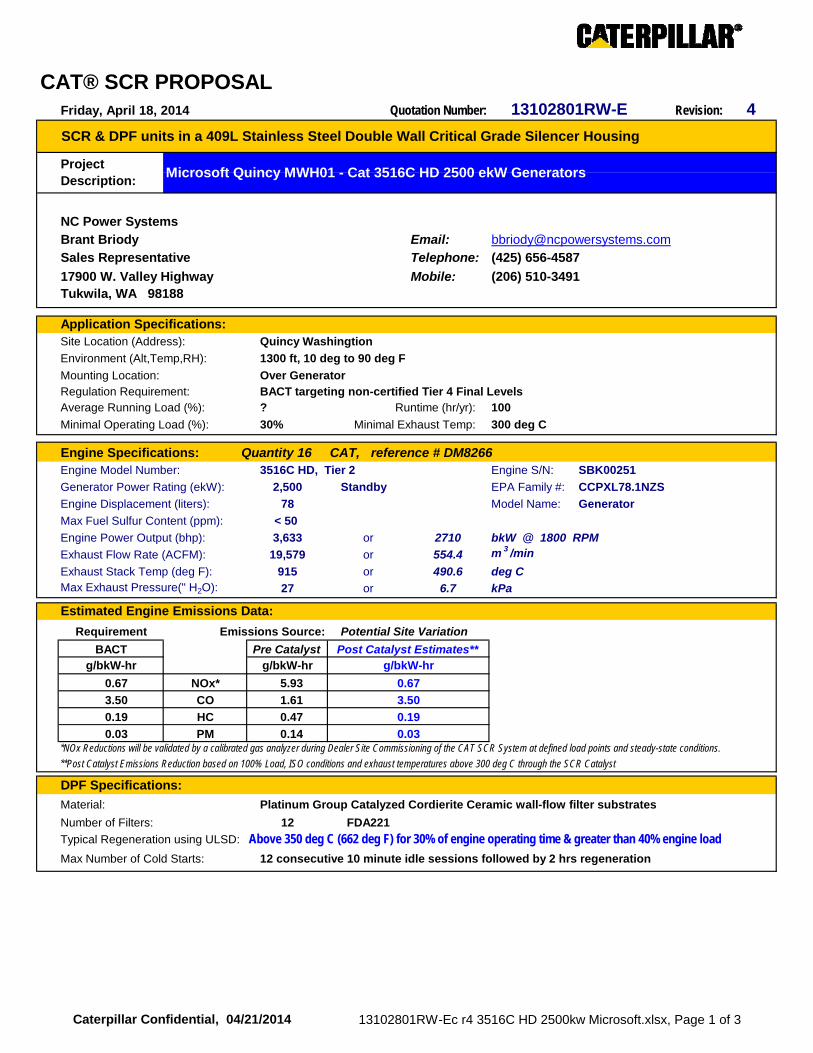
CAT® SCR PROPOSALQuotation Number: Revision: 4
NC Power Systems
Brant Briody Email: [email protected]
Sales Representative Telephone:
17900 W. Valley Highway Mobile:Tukwila, WA 98188
Application Specifications:Site Location (Address): Quincy Washingtion
Environment (Alt,Temp,RH): 1300 ft, 10 deg to 90 deg F
Mounting Location: Over GeneratorRegulation Requirement: BACT targeting non-certified Tier 4 Final LevelsAverage Running Load (%): ? Runtime (hr/yr): 100
Minimal Operating Load (%): 30% Minimal Exhaust Temp: 300 deg C
Engine Specifications: Quantity 16 CAT, reference # DM8266Engine Model Number: 3516C HD, Tier 2 Engine S/N: SBK00251
Generator Power Rating (ekW): 2,500 Standby EPA Family #: CCPXL78.1NZS
Engine Displacement (liters): 78 Model Name: Generator
Max Fuel Sulfur Content (ppm): < 50
Engine Power Output (bhp): 3,633 or 2710 bkW @ 1800 RPM
Exhaust Flow Rate (ACFM): 19,579 or 554.4 m 3 /min
Exhaust Stack Temp (deg F): 915 or 490.6 deg CMax Exhaust Pressure(" H2O): 27 or 6.7 kPa
Estimated Engine Emissions Data:
Requirement Emissions Source: Potential Site Variation
BACT % O2 Correction Pre Catalystg/bkW-hr 5% g/bkW-hr
0.67 NOx* 5.93
3.50 CO 1.61
0.19 HC 0.47
0.03 PM 0.14
DPF Specifications:
Material: Platinum Group Catalyzed Cordierite Ceramic wall-flow filter substrates
Number of Filters: 12 FDA221
Typical Regeneration using ULSD:
Max Number of Cold Starts: 12 consecutive 10 minute idle sessions followed by 2 hrs regeneration
0.67
3.50
0.19
0.03*NOx Reductions will be validated by a calibrated gas analyzer during Dealer Site Commissioning of the CAT SCR System at defined load points and steady-state conditions.
**Post Catalyst Emissions Reduction based on 100% Load, ISO conditions and exhaust temperatures above 300 deg C through the SCR Catalyst
Above 350 deg C (662 deg F) for 30% of engine operating time & greater than 40% engine load
g/bkW-hr
Friday, April 18, 2014 13102801RW-E
SCR & DPF units in a 409L Stainless Steel Double Wall Critical Grade Silencer Housing
Project Description:
Microsoft Quincy MWH01 - Cat 3516C HD 2500 ekW Generators
(425) 656-4587
(206) 510-3491
Post Catalyst Estimates**
Caterpillar Confidential, 04/21/2014 13102801RW-Ec r4 3516C HD 2500kw Microsoft.xlsx, Page 1 of 3
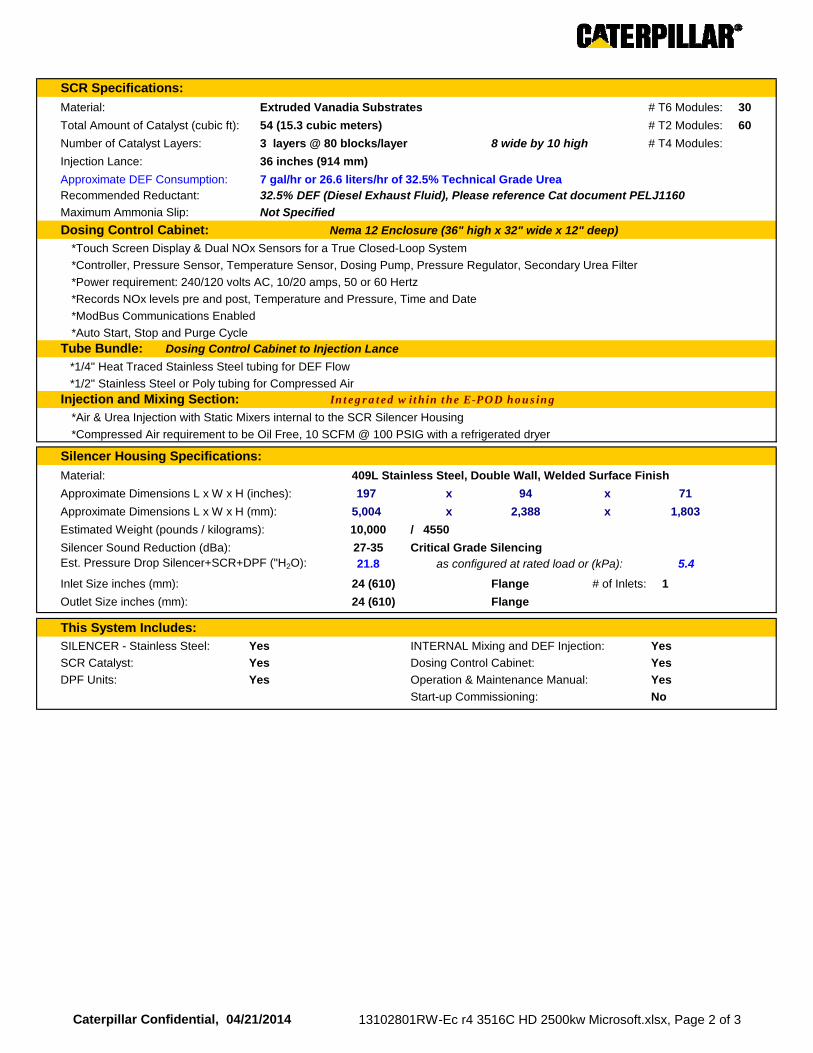
SCR Specifications:
Material: Extruded Vanadia Substrates # T6 Modules: 30
Total Amount of Catalyst (cubic ft): 54 (15.3 cubic meters) # T2 Modules: 60
Number of Catalyst Layers: 3 layers @ 80 blocks/layer 8 wide by 10 high # T4 Modules:
Injection Lance: 36 inches (914 mm)
Approximate DEF Consumption: 7 gal/hr or 26.6 liters/hr of 32.5% Technical Grade UreaRecommended Reductant: 32.5% DEF (Diesel Exhaust Fluid), Please reference Cat document PELJ1160
Maximum Ammonia Slip: Not Specified
Dosing Control Cabinet: Nema 12 Enclosure (36" high x 32" wide x 12" deep)
*Touch Screen Display & Dual NOx Sensors for a True Closed-Loop System
*Controller, Pressure Sensor, Temperature Sensor, Dosing Pump, Pressure Regulator, Secondary Urea Filter
*Power requirement: 240/120 volts AC, 10/20 amps, 50 or 60 Hertz
*Records NOx levels pre and post, Temperature and Pressure, Time and Date
*ModBus Communications Enabled
*Auto Start, Stop and Purge CycleTube Bundle: Dosing Control Cabinet to Injection Lance
*1/4" Heat Traced Stainless Steel tubing for DEF Flow
*1/2" Stainless Steel or Poly tubing for Compressed AirInjection and Mixing Section: Integrated within the E-POD housing
*Air & Urea Injection with Static Mixers internal to the SCR Silencer Housing
*Compressed Air requirement to be Oil Free, 10 SCFM @ 100 PSIG with a refrigerated dryer
Silencer Housing Specifications:
Material: 409L Stainless Steel, Double Wall, Welded Surface Finish
Approximate Dimensions L x W x H (inches): 197 x 94 x 71
Approximate Dimensions L x W x H (mm): 5,004 x 2,388 x 1,803
Estimated Weight (pounds / kilograms): 10,000 / 4550
Silencer Sound Reduction (dBa): 27-35 Critical Grade SilencingEst. Pressure Drop Silencer+SCR+DPF ("H2O): 21.8 5.4
Inlet Size inches (mm): Flange # of Inlets: 1
Outlet Size inches (mm): Flange
This System Includes:SILENCER - Stainless Steel: Yes INTERNAL Mixing and DEF Injection: Yes
SCR Catalyst: Yes Dosing Control Cabinet: Yes
DPF Units: Yes Operation & Maintenance Manual: Yes
Start-up Commissioning: No
24 (610)
24 (610)
as configured at rated load or (kPa):
Caterpillar Confidential, 04/21/2014 13102801RW-Ec r4 3516C HD 2500kw Microsoft.xlsx, Page 2 of 3

Notes:
Terms & Conditions: Incoterms: FCA Santa Fe
Warranty: 24 months or 8,000 hours of operation, whichever comes first, from date of commissioning
Pricing:Closed-Loop System
Ref/Cat # Description Quantity Unit Price
1 12041601AE
2 12041601AE-IB
Estimated Freight:
Total:
Recommended Equipment:Ref/Cat # Description Quantity Unit Price
1 376-8483 16Atlas Copco SF-4 Air Compressor (typically 460 Volt/ 3 phase, call for options)
M310P28768A88160E8459
Dealer Net
Total (USD)
Recommended minimum engine load of 20% and 360 degrees C through the particulate filters to ensure filter regeneration and prevent wet stacking the catalyst. If this is not possible then following 4 hours of cumulative runtime at low loads the engines should be run with at least 50% load for 2 hours to regenerate the filter media.
Dealer Net
Total (USD)
CAT® SCR w/ SCR & DPF in a 409L Stainless Steel Double Wall Critical Grade Silencer
Custom Insulating Blanket
Caterpillar Confidential, 04/21/2014 13102801RW-Ec r4 3516C HD 2500kw Microsoft.xlsx, Page 3 of 3
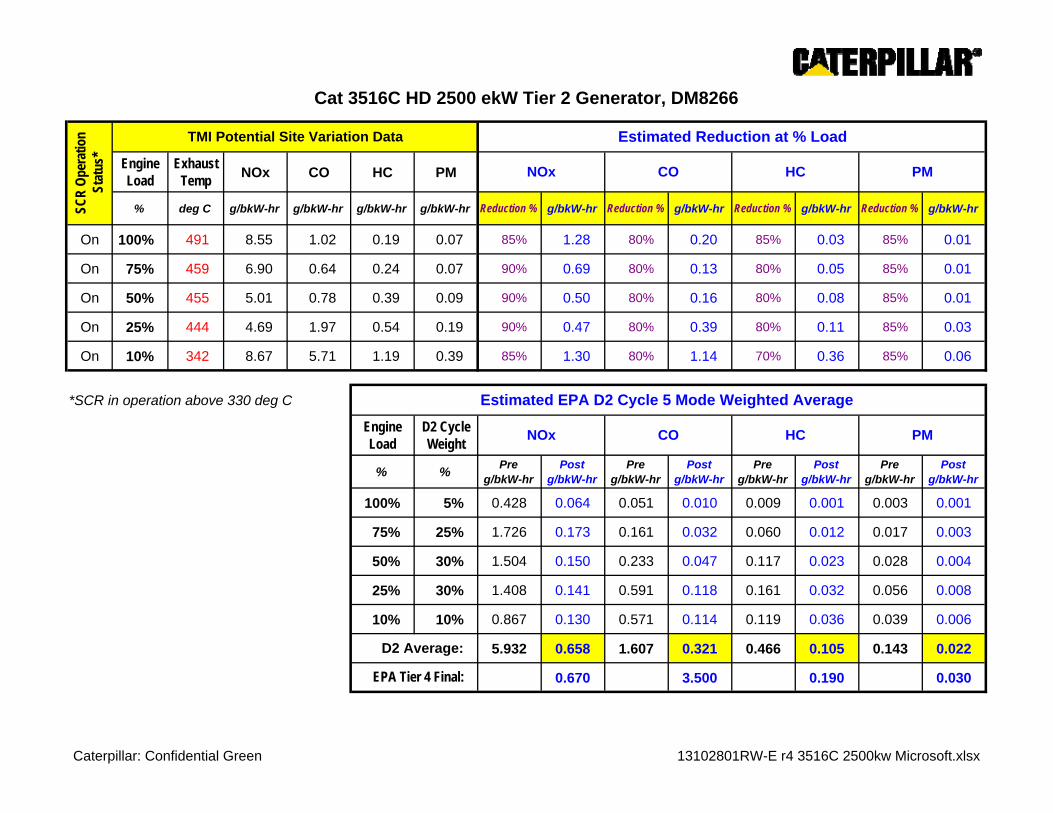
Engine Load
Exhaust Temp
NOx CO HC PM
% deg C g/bkW-hr g/bkW-hr g/bkW-hr g/bkW-hr Reduction % g/bkW-hr Reduction % g/bkW-hr Reduction % g/bkW-hr Reduction % g/bkW-hr
On 100% 491 8.55 1.02 0.19 0.07 85% 1.28 80% 0.20 85% 0.03 85% 0.01
On 75% 459 6.90 0.64 0.24 0.07 90% 0.69 80% 0.13 80% 0.05 85% 0.01
On 50% 455 5.01 0.78 0.39 0.09 90% 0.50 80% 0.16 80% 0.08 85% 0.01
On 25% 444 4.69 1.97 0.54 0.19 90% 0.47 80% 0.39 80% 0.11 85% 0.03
On 10% 342 8.67 5.71 1.19 0.39 85% 1.30 80% 1.14 70% 0.36 85% 0.06
*SCR in operation above 330 deg C
Engine Load
D2 Cycle Weight
% %Pre
g/bkW-hrPost
g/bkW-hrPre
g/bkW-hrPost
g/bkW-hrPre
g/bkW-hrPost
g/bkW-hrPre
g/bkW-hrPost
g/bkW-hr
100% 5% 0.428 0.064 0.051 0.010 0.009 0.001 0.003 0.001
75% 25% 1.726 0.173 0.161 0.032 0.060 0.012 0.017 0.003
50% 30% 1.504 0.150 0.233 0.047 0.117 0.023 0.028 0.004
25% 30% 1.408 0.141 0.591 0.118 0.161 0.032 0.056 0.008
10% 10% 0.867 0.130 0.571 0.114 0.119 0.036 0.039 0.006
5.932 0.658 1.607 0.321 0.466 0.105 0.143 0.022
0.670 3.500 0.190 0.030EPA Tier 4 Final:
Cat 3516C HD 2500 ekW Tier 2 Generator, DM8266
Estimated EPA D2 Cycle 5 Mode Weighted Average
NOx CO HC PM
Estimated Reduction at % Load
SCR
Ope
ratio
n St
atus
*
TMI Potential Site Variation Data
D2 Average:
NOx CO HC PM
Caterpillar: Confidential Green 13102801RW-E r4 3516C 2500kw Microsoft.xlsx

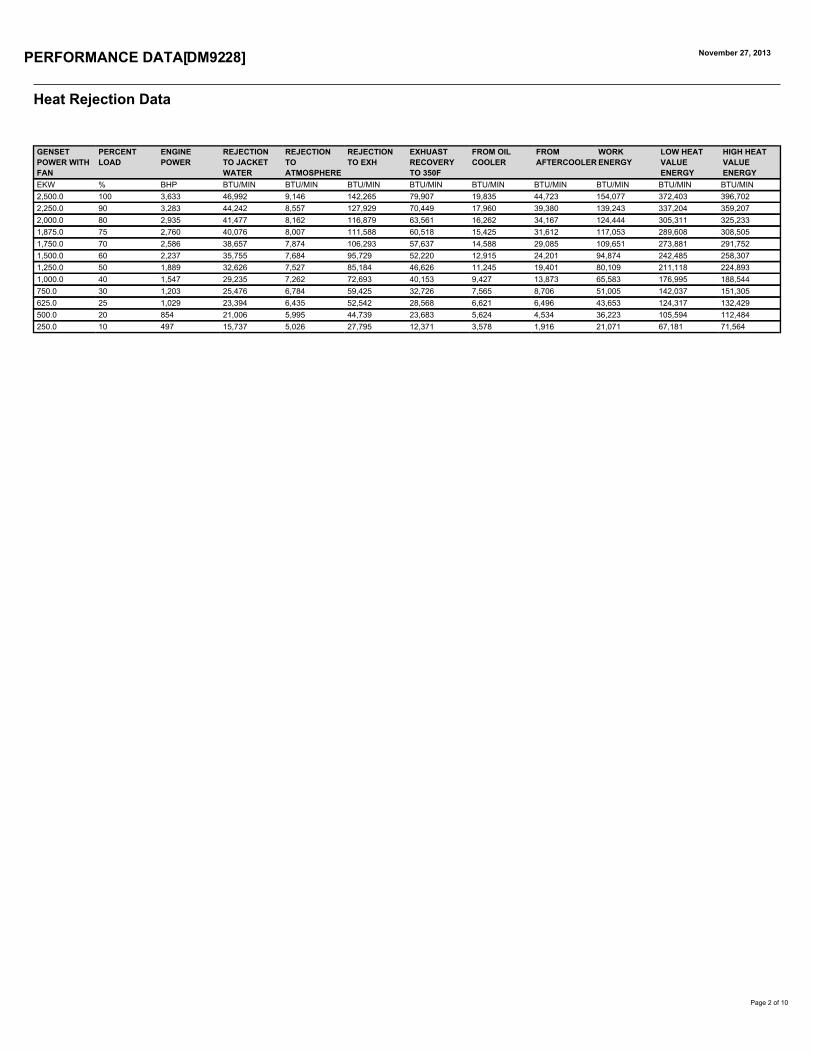
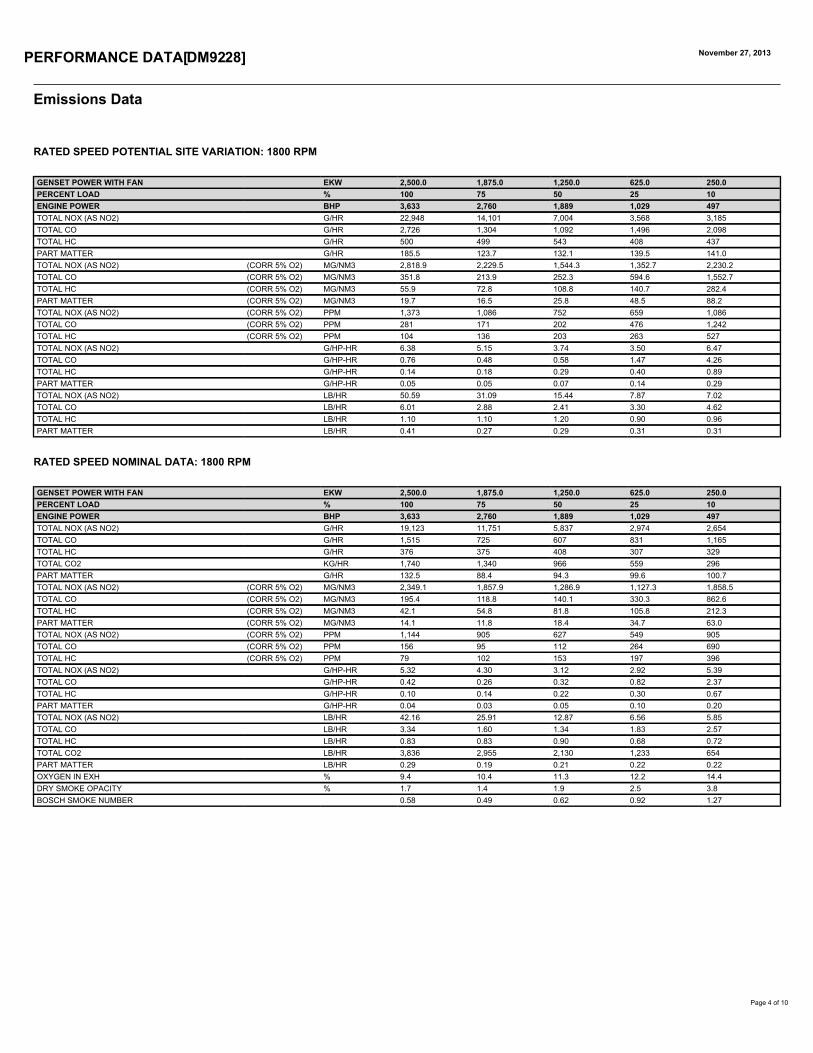

DIESEL GENERATOR SET
Mission Crit ical
Standby
2000 ekW 2500 kVA60 Hz 1800 rpm 480 VoltsCaterpillar is leading the power generation
marketplace with Power Solutions engineered
to deliver unmatched flexibility, expandability,
reliability, and cost-effectiveness.Image shown may notreflect actual package.
FEATURES
FUEL/EMISSIONS STRATEGY
• EPA Certified for StationaryEmergency Application(EPA Tier 2 emissions levels)
DESIGN CRITERIA
• The generator set accepts 100% rated load in onestep per NFPA 110 and meets ISO 8528-5 transientresponse.
UL 2200 / CSA - Optional
• UL 2200 listed packages• CSA Certified
Certain restrictions may apply.Consult with your Cat® Dealer.
FULL RANGE OF ATTACHMENTS
• Wide range of bolt-on system expansionattachments, factory designed and tested
• Flexible packaging options for easy and costeffective installation
SINGLE-SOURCE SUPPLIER
• Fully prototype tested with certified torsionalvibration analysis available
WORLDWIDE PRODUCT SUPPORT
• Cat dealers provide extensive post sale supportincluding maintenance and repair agreements
• Cat dealers have over 1,800 dealer branch storesoperating in 200 countries
• The Cat® S•O•SSM program cost effectively detectsinternal engine component condition, even thepresence of unwanted fluids and combustionby-products
CAT® 3516C TA DIESEL ENGINE
• Reliable, rugged, durable design• Field-proven in thousands of applications
worldwide• Four-stroke-cycle diesel engine combines
consistent performance and excellent fueleconomy with minimum weight
CAT GENERATOR
• Matched to the performance and outputcharacteristics of Cat engines
• Industry leading mechanical and electrical design• Industry leading motor starting capabilities• High Efficiency
CAT EMCP 4 CONTROL PANELS
• Simple user friendly interface and navigation• Scalable system to meet a wide range of
customer needs• Integrated Control System and Communications
Gateway
SEISMIC CERTIFICATION
• Seismic Certification available• Anchoring details are site specific, and are
dependent on many factors such as generator setsize, weight, and concrete strength.IBC Certification requires that the anchoringsystem used is reviewed and approved by aProfessional Engineer
• Seismic Certification per Applicable BuildingCodes: IBC 2000, IBC 2003, IBC 2006, IBC 2009,CBC 2007
• Pre-approved by OSHPD and carries anOSP-0084-10 for use in healthcare projects inCalifornia
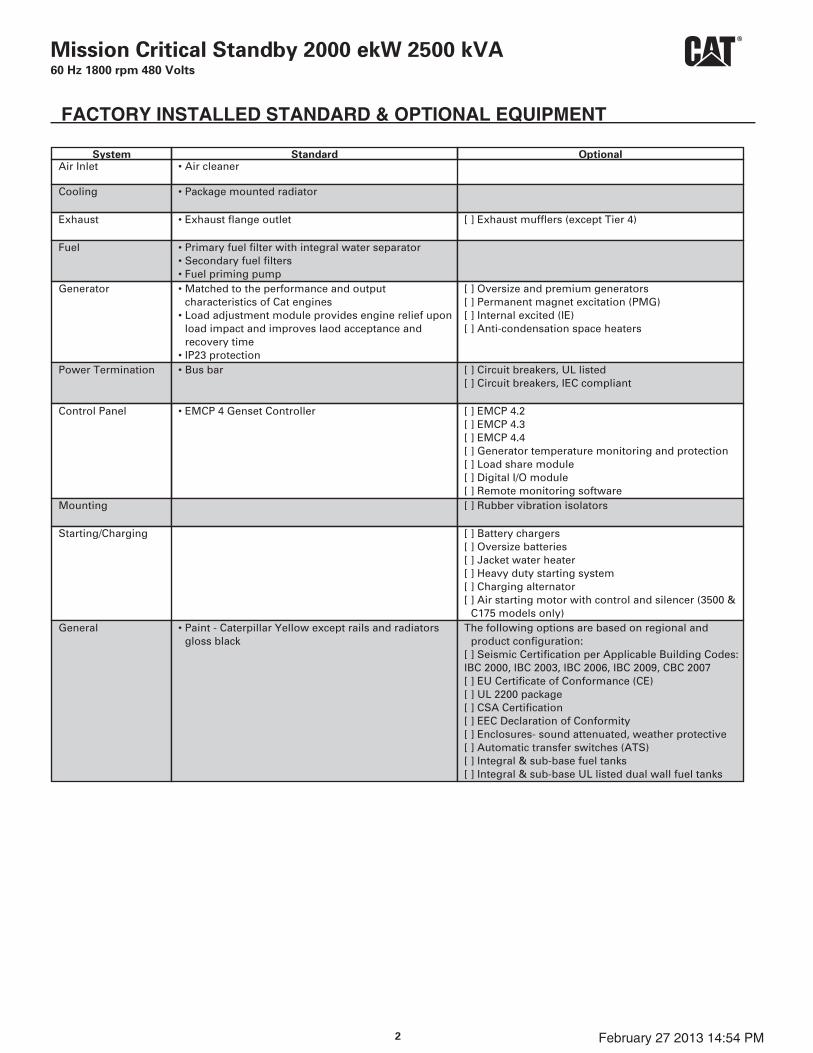
Mission Critical Standby 2000 ekW 2500 kVA60 Hz 1800 rpm 480 Volts
FACTORY INSTALLED STANDARD & OPTIONAL EQUIPMENT
System Standard OptionalAir Inlet • Air cleaner
Cooling • Package mounted radiator
Exhaust • Exhaust flange outlet [ ] Exhaust mufflers (except Tier 4)
Fuel • Primary fuel filter with integral water separator• Secondary fuel filters• Fuel priming pump
Generator • Matched to the performance and outputcharacteristics of Cat engines
• Load adjustment module provides engine relief uponload impact and improves laod acceptance andrecovery time
• IP23 protection
[ ] Oversize and premium generators[ ] Permanent magnet excitation (PMG)[ ] Internal excited (IE)[ ] Anti-condensation space heaters
Power Termination • Bus bar [ ] Circuit breakers, UL listed[ ] Circuit breakers, IEC compliant
Control Panel • EMCP 4 Genset Controller [ ] EMCP 4.2[ ] EMCP 4.3[ ] EMCP 4.4[ ] Generator temperature monitoring and protection[ ] Load share module[ ] Digital I/O module[ ] Remote monitoring software
Mounting [ ] Rubber vibration isolators
Starting/Charging [ ] Battery chargers[ ] Oversize batteries[ ] Jacket water heater[ ] Heavy duty starting system[ ] Charging alternator[ ] Air starting motor with control and silencer (3500 &
C175 models only)General • Paint - Caterpillar Yellow except rails and radiators
gloss blackThe following options are based on regional and
product configuration:[ ] Seismic Certification per Applicable Building Codes:IBC 2000, IBC 2003, IBC 2006, IBC 2009, CBC 2007[ ] EU Certificate of Conformance (CE)[ ] UL 2200 package[ ] CSA Certification[ ] EEC Declaration of Conformity[ ] Enclosures- sound attenuated, weather protective[ ] Automatic transfer switches (ATS)[ ] Integral & sub-base fuel tanks[ ] Integral & sub-base UL listed dual wall fuel tanks
February 27 2013 14:54 PM2

Mission Critical Standby 2000 ekW 2500 kVA60 Hz 1800 rpm 480 Volts
SPECIFICATIONS
CAT GENERATOR
Cat GeneratorFrame size......................................................................... 825Excitation................................................ Permanent MagnetPitch.............................................................................. 0.6667Number of poles...................................................................4Number of bearings...................................... Single bearingNumber of Leads.............................................................. 006Insulation....................... UL 1446 Recognized Class H withtropicalization and antiabrasion- Consult your Caterpillar dealer for available voltagesIP Rating........................................................................... IP23Alignment.............................................................. Pilot ShaftOverspeed capability........................................................150Wave form Deviation (Line to Line)........................... 003.00Voltage regulator.............. 3 Phase sensing with selectiblevolts/HzVoltage regulation............Less than +/- 1/2% (steady state)Less than +/- 1/2% (w/3% speed change)
CAT DIESEL ENGINE
3516C ATAAC, V-16, 4-Stroke Water-cooled DieselBore........................................................ 170.00 mm (6.69 in)Stroke..................................................... 190.00 mm (7.48 in)Displacement.........................................69.00 L (4210.64 in3)Compression Ratio....................................................... 14.7:1Aspiration........................................................................... TAFuel System.................................... Electronic unit injectionGovernor Type........................................................... ADEM3
CAT EMCP 4 SERIES CONTROLS
EMCP 4 controls including:- Run / Auto / Stop Control- Speed and Voltage Adjust- Engine Cycle Crank- 24-volt DC operation- Environmental sealed front face- Text alarm/event descriptions
Digital indication for:- RPM- DC volts- Operating hours- Oil pressure (psi, kPa or bar)- Coolant temperature- Volts (L-L & L-N), frequency (Hz)- Amps (per phase & average)- ekW, kVA, kVAR, kW-hr, %kW, PF
Warning/shutdown with common LED indication of:- Low oil pressure- High coolant temperature- Overspeed- Emergency stop- Failure to start (overcrank)- Low coolant temperature- Low coolant level
Programmable protective relaying functions:- Generator phase sequence- Over/Under voltage (27/59)- Over/Under Frequency (81 o/u)- Reverse Power (kW) (32)- Reverse reactive power (kVAr) (32RV)- Overcurrent (50/51)
Communications:- Six digital inputs (4.2 only)- Four relay outputs (Form A)- Two relay outputs (Form C)- Two digital outputs- Customer data link (Modbus RTU)- Accessory module data link- Serial annunciator module data link- Emergency stop pushbutton
Compatible with the following:- Digital I/O module- Local Annunciator- Remote CAN annunciator- Remote serial annunciator
February 27 2013 14:54 PM3
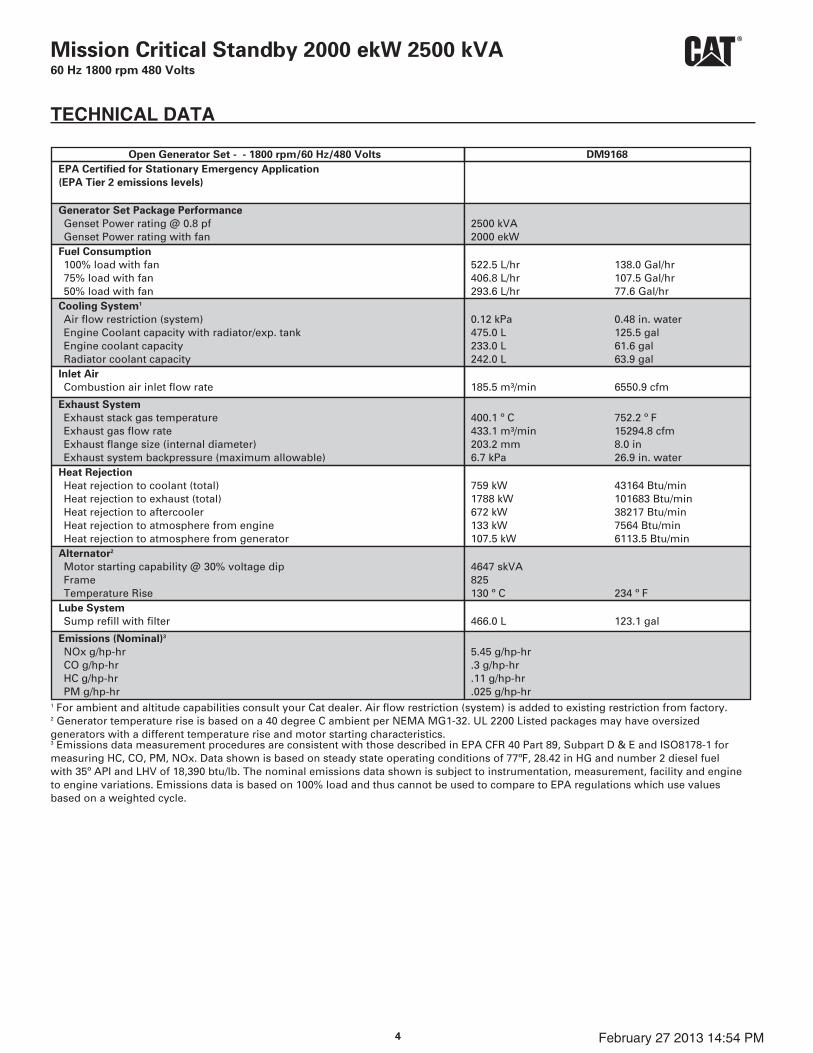
Mission Critical Standby 2000 ekW 2500 kVA60 Hz 1800 rpm 480 Volts
TECHNICAL DATA
Open Generator Set - - 1800 rpm/60 Hz/480 Volts DM9168
EPA Certified for Stationary Emergency Application
(EPA Tier 2 emissions levels)
Generator Set Package Performance
Genset Power rating @ 0.8 pfGenset Power rating with fan
2500 kVA2000 ekW
Fuel Consumption
100% load with fan75% load with fan50% load with fan
522.5 L/hr 138.0 Gal/hr406.8 L/hr 107.5 Gal/hr293.6 L/hr 77.6 Gal/hr
Cooling System1
Air flow restriction (system)Engine Coolant capacity with radiator/exp. tankEngine coolant capacityRadiator coolant capacity
0.12 kPa 0.48 in. water475.0 L 125.5 gal233.0 L 61.6 gal242.0 L 63.9 gal
Inlet Air
Combustion air inlet flow rate 185.5 m³/min 6550.9 cfm
Exhaust System
Exhaust stack gas temperatureExhaust gas flow rateExhaust flange size (internal diameter)Exhaust system backpressure (maximum allowable)
400.1 º C 752.2 º F433.1 m³/min 15294.8 cfm203.2 mm 8.0 in6.7 kPa 26.9 in. water
Heat Rejection
Heat rejection to coolant (total)Heat rejection to exhaust (total)Heat rejection to aftercoolerHeat rejection to atmosphere from engineHeat rejection to atmosphere from generator
759 kW 43164 Btu/min1788 kW 101683 Btu/min672 kW 38217 Btu/min133 kW 7564 Btu/min107.5 kW 6113.5 Btu/min
Alternator2
Motor starting capability @ 30% voltage dipFrameTemperature Rise
4647 skVA825130 º C 234 º F
Lube System
Sump refill with filter 466.0 L 123.1 gal
Emissions (Nominal)3
NOx g/hp-hrCO g/hp-hrHC g/hp-hrPM g/hp-hr
5.45 g/hp-hr.3 g/hp-hr.11 g/hp-hr.025 g/hp-hr
1 For ambient and altitude capabilities consult your Cat dealer. Air flow restriction (system) is added to existing restriction from factory.2 Generator temperature rise is based on a 40 degree C ambient per NEMA MG1-32. UL 2200 Listed packages may have oversizedgenerators with a different temperature rise and motor starting characteristics.3 Emissions data measurement procedures are consistent with those described in EPA CFR 40 Part 89, Subpart D & E and ISO8178-1 formeasuring HC, CO, PM, NOx. Data shown is based on steady state operating conditions of 77ºF, 28.42 in HG and number 2 diesel fuelwith 35º API and LHV of 18,390 btu/lb. The nominal emissions data shown is subject to instrumentation, measurement, facility and engineto engine variations. Emissions data is based on 100% load and thus cannot be used to compare to EPA regulations which use valuesbased on a weighted cycle.
February 27 2013 14:54 PM4

Mission Critical Standby 2000 ekW 2500 kVA60 Hz 1800 rpm 480 Volts
RATING DEFINITIONS AND CONDITIONS
Applicable Codes and Standards: AS1359, CSA C22.2 No100-04, UL142, UL489, UL601, UL869, UL2200, NFPA 37,NFPA 70, NFPA 99, NFPA 110, IBC, IEC60034-1, ISO3046,ISO8528, NEMA MG 1-22, NEMA MG 1-33, 72/23/EEC,98/37/EC, 2004/108/ECMission Critical Standby - Output available with varyingload for the duration of the interruption of the normalsource power. Average power output is 85% of thestandby power rating. Typical peak demand up to 100%of standby rated ekW for 5% of the operating time.Typical operation is 200 hours per year, with maximumexpected usage of 500 hours per year.
Ratings are based on SAE J1349 standard conditions.These ratings also apply at ISO3046 standard conditions.Fuel Rates are based on fuel oil of 35º API (16º C or 60º F)gravity having an LHV of 42 780 kJ/kg (18,390 Btu/lb)when used at 29º C (85º F) and weighing 838.9 g/liter(7.001 lbs/U.S. gal.).Additional Ratings may be available for specificcustomer requirements. Consult your Cat representativefor details.
February 27 2013 14:54 PM5
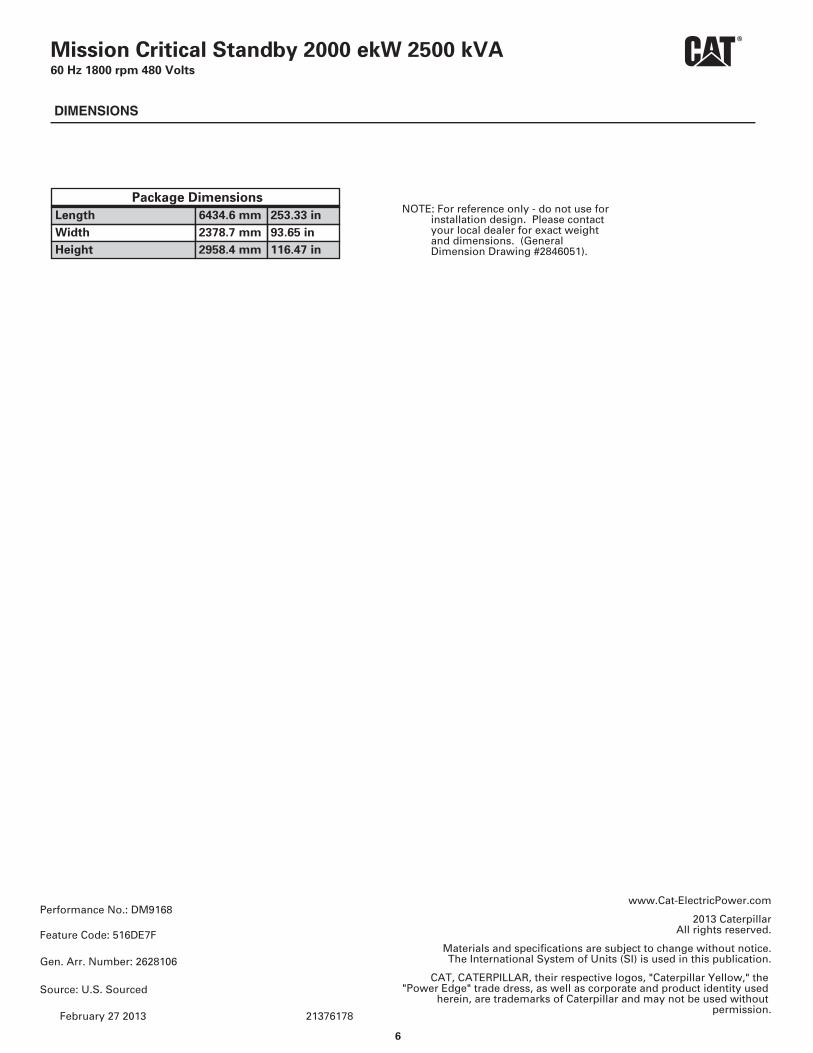
Mission Critical Standby 2000 ekW 2500 kVA60 Hz 1800 rpm 480 Volts
DIMENSIONS
Package Dimensions
Length 6434.6 mm 253.33 in
Width 2378.7 mm 93.65 in
Height 2958.4 mm 116.47 in
NOTE: For reference only - do not use forinstallation design. Please contactyour local dealer for exact weightand dimensions. (GeneralDimension Drawing #2846051).
www.Cat-ElectricPower.com
2013 CaterpillarAll rights reserved.
Materials and specifications are subject to change without notice.The International System of Units (SI) is used in this publication.
CAT, CATERPILLAR, their respective logos, "Caterpillar Yellow," the"Power Edge" trade dress, as well as corporate and product identity used
herein, are trademarks of Caterpillar and may not be used withoutpermission.
21376178
Performance No.: DM9168
Feature Code: 516DE7F
Gen. Arr. Number: 2628106
Source: U.S. Sourced
February 27 2013
6

Engine Load
Exhaust Temp
NOx CO HC PM
% deg C g/bkW-hr g/bkW-hr g/bkW-hr g/bkW-hr Reduction % g/bkW-hr Reduction % g/bkW-hr Reduction % g/bkW-hr Reduction % g/bkW-hr
On 100% 400 8.77 0.72 0.20 0.05 92% 0.70 80% 0.14 85% 0.03 85% 0.01
On 75% 363 6.22 0.51 0.31 0.07 93% 0.44 80% 0.10 80% 0.06 85% 0.01
On 50% 346 5.12 0.80 0.46 0.11 93% 0.36 80% 0.16 80% 0.09 85% 0.02
On 25% 339 6.76 2.84 0.66 0.42 90% 0.68 80% 0.57 80% 0.13 85% 0.06
OFF 10% 289 9.56 5.84 1.45 0.66 80% 1.91 80% 1.17 70% 0.43 85% 0.10
*SCR in operation above 330 deg C
Engine Load
D2 Cycle Weight
Pre Post Pre Post Pre Post Pre Post
g/bkW-hr g/bkW-hr g/bkW-hr g/bkW-hr g/bkW-hr g/bkW-hr g/bkW-hr g/bkW-hr
100% 5% 0.438 0.035 0.036 0.007 0.010 0.002 0.003 0.000
75% 25% 1.555 0.109 0.127 0.025 0.077 0.015 0.017 0.003
50% 30% 1.536 0.108 0.241 0.048 0.137 0.027 0.032 0.005
25% 30% 2.027 0.203 0.853 0.171 0.197 0.039 0.125 0.019
10% 10% 0.956 0.191 0.584 0.117 0.145 0.043 0.066 0.010
6.512 0.645 1.842 0.368 0.566 0.127 0.242 0.036
0.670 3.500 0.190 0.030
Using 80% NOx Reduction @ 10% load for D2 Calculations
%%
EPA Tier 4 Final:
Cat 3516C 2000 ekW Tier 2 Generator, DM8263
Estimated EPA D2 Cycle 5 Mode Weighted Average
NOx CO HC PM
SCR
Ope
ratio
n St
atus
*
TMI Potential Site Variation Data Estimated Reduction at % Load
HC PM
D2 Average:
NOx CO
Caterpillar: Confidential Green 14022801RW-E 3516C 2000kw Microsoft.xlsx
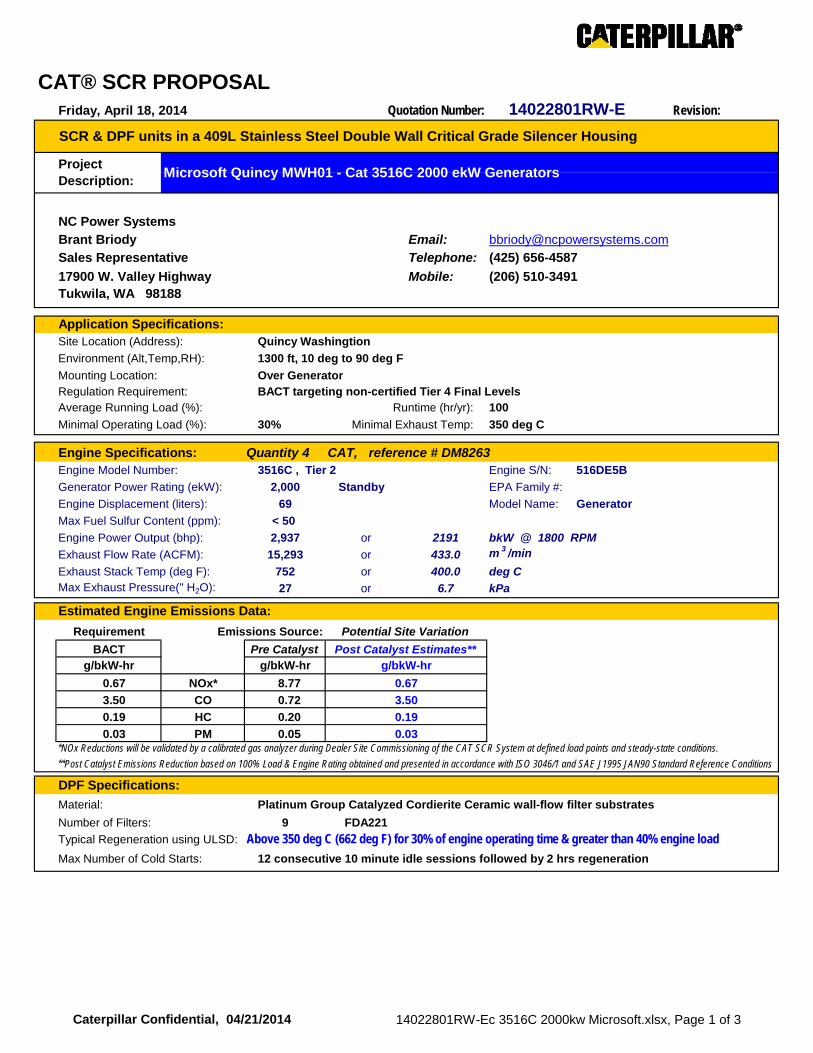
CAT® SCR PROPOSALQuotation Number: Revision:
NC Power Systems
Brant Briody Email: [email protected]
Sales Representative Telephone:
17900 W. Valley Highway Mobile:Tukwila, WA 98188
Application Specifications:Site Location (Address): Quincy Washingtion
Environment (Alt,Temp,RH): 1300 ft, 10 deg to 90 deg F
Mounting Location: Over GeneratorRegulation Requirement: BACT targeting non-certified Tier 4 Final LevelsAverage Running Load (%): Runtime (hr/yr): 100
Minimal Operating Load (%): 30% Minimal Exhaust Temp: 350 deg C
Engine Specifications: Quantity 4 CAT, reference # DM8263Engine Model Number: 3516C , Tier 2 Engine S/N: 516DE5B
Generator Power Rating (ekW): 2,000 Standby EPA Family #:
Engine Displacement (liters): 69 Model Name: Generator
Max Fuel Sulfur Content (ppm): < 50
Engine Power Output (bhp): 2,937 or 2191 bkW @ 1800 RPM
Exhaust Flow Rate (ACFM): 15,293 or 433.0 m 3 /min
Exhaust Stack Temp (deg F): 752 or 400.0 deg CMax Exhaust Pressure(" H2O): 27 or 6.7 kPa
Estimated Engine Emissions Data:
Requirement Emissions Source: Potential Site Variation
BACT % O2 Correction Pre Catalystg/bkW-hr 5% g/bkW-hr
0.67 NOx* 8.77
3.50 CO 0.72
0.19 HC 0.20
0.03 PM 0.05
DPF Specifications:
Material: Platinum Group Catalyzed Cordierite Ceramic wall-flow filter substrates
Number of Filters: 9 FDA221
Typical Regeneration using ULSD:
Max Number of Cold Starts: 12 consecutive 10 minute idle sessions followed by 2 hrs regeneration
0.67
3.50
0.19
0.03*NOx Reductions will be validated by a calibrated gas analyzer during Dealer Site Commissioning of the CAT SCR System at defined load points and steady-state conditions.
**Post Catalyst Emissions Reduction based on 100% Load & Engine Rating obtained and presented in accordance with ISO 3046/1 and SAE J1995 JAN90 Standard Reference Conditions
Above 350 deg C (662 deg F) for 30% of engine operating time & greater than 40% engine load
g/bkW-hr
Friday, April 18, 2014 14022801RW-E
SCR & DPF units in a 409L Stainless Steel Double Wall Critical Grade Silencer Housing
Project Description:
Microsoft Quincy MWH01 - Cat 3516C 2000 ekW Generators
(425) 656-4587
(206) 510-3491
Post Catalyst Estimates**
Caterpillar Confidential, 04/21/2014 14022801RW-Ec 3516C 2000kw Microsoft.xlsx, Page 1 of 3

SCR Specifications:
Material: Extruded Vanadia Substrates # T6 Modules: 24
Total Amount of Catalyst (cubic ft): 43 (12.2 cubic meters) # T2 Modules: 48
Number of Catalyst Layers: 3 layers @ 64 blocks/layer 8 wide by 8 high # T4 Modules:
Injection Lance: 36 inches (914 mm)
Approximate DEF Consumption: 8.4 gal/hr or 31.8 liters/hr of 32.5% Technical Grade UreaRecommended Reductant: 32.5% DEF (Diesel Exhaust Fluid), Please reference Cat document PELJ1160
Maximum Ammonia Slip: Not Specified
Dosing Control Cabinet: Nema 12 Enclosure (36" high x 32" wide x 12" deep)
*Touch Screen Display & Dual NOx Sensors for a True Closed-Loop System
*Controller, Pressure Sensor, Temperature Sensor, Dosing Pump, Pressure Regulator, Secondary Urea Filter
*Power requirement: 240/120 volts AC, 10/20 amps, 50 or 60 Hertz
*Records NOx levels pre and post, Temperature and Pressure, Time and Date
*ModBus Communications Enabled
*Auto Start, Stop and Purge CycleTube Bundle: Dosing Control Cabinet to Injection Lance
*1/4" Heat Traced Stainless Steel tubing for DEF Flow
*1/2" Stainless Steel or Poly tubing for Compressed AirInjection and Mixing Section: Integrated within the E-POD housing
*Air & Urea Injection with Static Mixers internal to the SCR Silencer Housing
*Compressed Air requirement to be Oil Free, 10 SCFM @ 100 PSIG with a refrigerated dryer
Silencer Housing Specifications:
Material: 409L Stainless Steel, Double Wall, Welded Surface Finish
Approximate Dimensions L x W x H (inches): 182 x 94 x 58
Approximate Dimensions L x W x H (mm): 4,623 x 2,388 x 1,473
Estimated Weight (pounds / kilograms): 10,000 / 4550
Silencer Sound Reduction (dBa): 27-35 Critical Grade SilencingEst. Pressure Drop Silencer+SCR+DPF ("H2O): 20.6 5.1
Inlet Size inches (mm): Flange # of Inlets: 1
Outlet Size inches (mm): Flange
This System Includes:SILENCER - Stainless Steel: Yes INTERNAL Mixing and DEF Injection: Yes
SCR Catalyst: Yes Dosing Control Cabinet: Yes
DPF Units: Yes Operation & Maintenance Manual: Yes
Start-up Commissioning: No
24 (610)
20 (508)
as configured at rated load or (kPa):
Caterpillar Confidential, 04/21/2014 14022801RW-Ec 3516C 2000kw Microsoft.xlsx, Page 2 of 3

Notes:
Terms & Conditions: Incoterms: FCA Santa Fe
Warranty: 24 months or 8,000 hours of operation, whichever comes first, from date of commissioning
Pricing:Closed-Loop System
Ref/Cat # Description Quantity Unit Price
1 12080201AE
2 12080201AE-IB
Estimated Freight:
Total:
Recommended Equipment:Ref/Cat # Description Quantity Unit Price
1 376-8483Atlas Copco SF-4 Air Compressor (typically 460 Volt/ 3 phase, call for options)
M312P33992A93752E9370
Dealer Net
Total (USD)
Engine should be run with a Load Bank during normal operation to provide minimum of 40% load in order to regenerate the DPF units.
Recommended minimum engine load of 40% and 360 degrees C through the particulate filters to ensure filter regeneration and prevent wet stacking the catalyst. If this is not possible then following 4 hours of cumulative runtime at low loads the engines should be run with at least 60% load for 2 hours to regenerate the filter media.
Dealer Net
Total (USD)
CAT® SCR w/ SCR & DPF in a 409L Stainless Steel Double Wall Critical Grade Silencer
Custom Insulating Blanket
Caterpillar Confidential, 04/21/2014 14022801RW-Ec 3516C 2000kw Microsoft.xlsx, Page 3 of 3


MISSION CRITICAL
750 ekW 938 kVA60Hz 1800rpm 480VoltsCaterpillar is leading the power generation
marketplace with Power Solutions engineered
to deliver unmatched flexibility, expandability,
reliability, and cost-effectiveness.
Image shown may notreflect actual package.
FEATURES
FUEL/EMISSIONS STRATEGY
EPA for StationaryEmergency Application(EPA Tier 2 emissions levels)
DESIGN CRITERIA
The generator set accepts 100% rated load in onestep per NFPA 110 and meets ISO 8528-5 transientresponse.
UL 2200/ CSA - Optional
UL 2200 listed packagesCSACertain restrictions may apply.Consult with your Cat® Dealer.
FULL RANGE OF ATTACHMENTS
Wide range of bolt-on system expansionattachments, factory designed and testedFlexible packaging options for easy and cost
installation
SINGLE-SOURCE SUPPLIER
Fully prototype tested with torsionalvibration analysis available
WORLDWIDE PRODUCT SUPPORT
Cat dealers provide extensive post sale supportincluding maintenance and repair agreementsCat dealers have over 1,800 dealer branch storesoperating in 200 countriesThe Cat® SM program cost detectsinternal engine component condition, even thepresence of unwanted and combustionby-products
CAT® C27ATAAC DIESEL ENGINE
Utilizes ACERT™ TechnologyReliable, rugged, durable designFour-cycle diesel engine combines consistentperformance and excellent fuel economy withminimum weightElectronic engine control
CAT GENERATOR
Designed to match the performance and outputcharacteristics of Cat diesel enginesSingle point access to accessory connectionsUL 1446 recognized Class H insulation
CAT EMCP 4 CONTROL PANELS
Simple user friendly interface and navigationScalable system to meet a wide range ofcustomer needsIntegrated Control System and CommunicationsGateway
SEISMIC CERTIFICATION
Seismic availableAnchoring details are site and aredependent on many factors such as generator setsize, weight, and concrete strength.IBC requires that the anchoringsystem used is reviewed and approved by aProfessional EngineerSeismic per Applicable BuildingCodes: IBC 2000, IBC 2003, IBC 2006, IBC 2009,CBC 2007Pre-approved by OSHPD and carries anOSP-0084-10 for use in healthcare projects inCalifornia
DIESEL GENERATOR SET
LEHE0456-00
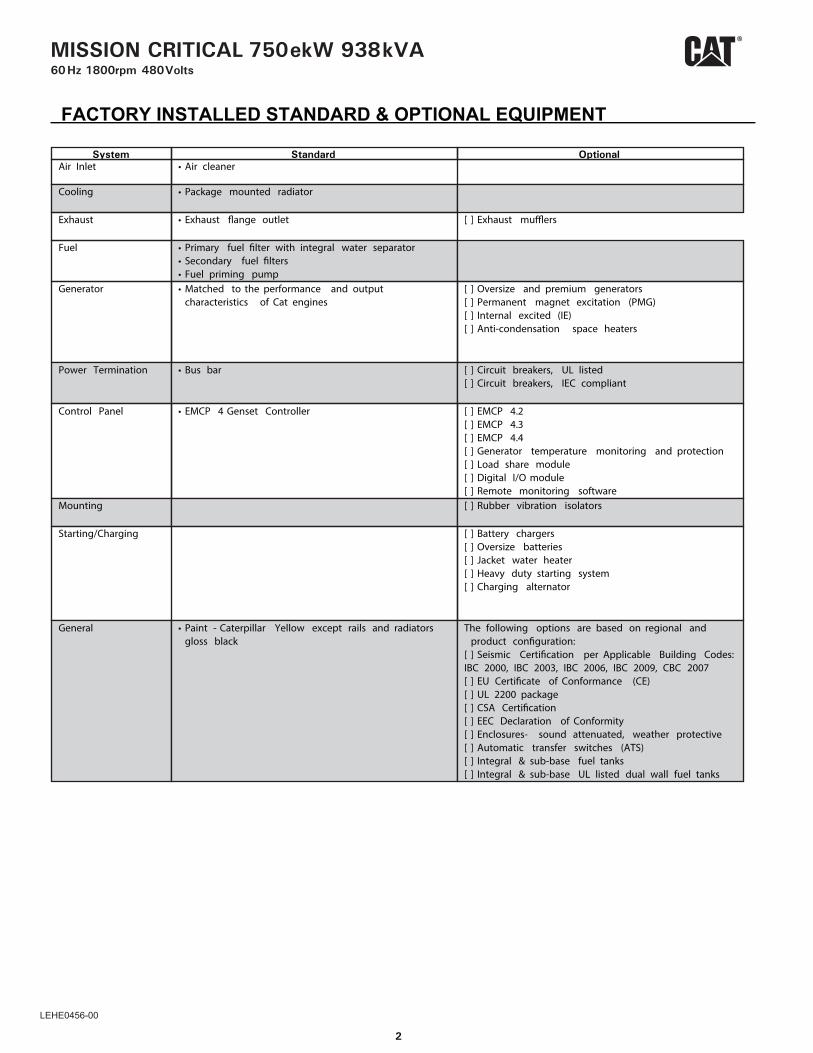
FACTORY INSTALLED STANDARD & OPTIONAL EQUIPMENT
System Standard OptionalAir Inlet Air cleaner
Cooling Package mounted radiator
Exhaust Exhaust outlet [ ] Exhaust
Fuel Primary fuel with integral water separatorSecondary fuelFuel priming pump
Generator Matched to the performance and outputcharacteristics of Cat engines
[ ] Oversize and premium generators[ ] Permanent magnet excitation (PMG)[ ] Internal excited (IE)[ ] Anti-condensation space heaters
Power Termination Bus bar [ ] Circuit breakers, UL listed[ ] Circuit breakers, IEC compliant
Control Panel EMCP 4 Genset Controller [ ] EMCP 4.2[ ] EMCP 4.3[ ] EMCP 4.4[ ] Generator temperature monitoring and protection[ ] Load share module[ ] Digital I/O module[ ] Remote monitoring software
Mounting [ ] Rubber vibration isolators
Starting/Charging [ ] Battery chargers[ ] Oversize batteries[ ] Jacket water heater[ ] Heavy duty starting system[ ] Charging alternator
General Paint - Caterpillar Yellow except rails and radiatorsgloss black
The following options are based on regional andproduct
[ ] Seismic per Applicable Building Codes:IBC 2000, IBC 2003, IBC 2006, IBC 2009, CBC 2007[ ] EU of Conformance (CE)[ ] UL 2200 package[ ] CSA[ ] EEC Declaration of Conformity[ ] Enclosures- sound attenuated, weather protective[ ] Automatic transfer switches (ATS)[ ] Integral & sub-base fuel tanks[ ] Integral & sub-base UL listed dual wall fuel tanks
2
MISSION CRITICAL 750ekW 938kVA60Hz 1800rpm 480Volts
LEHE0456-00
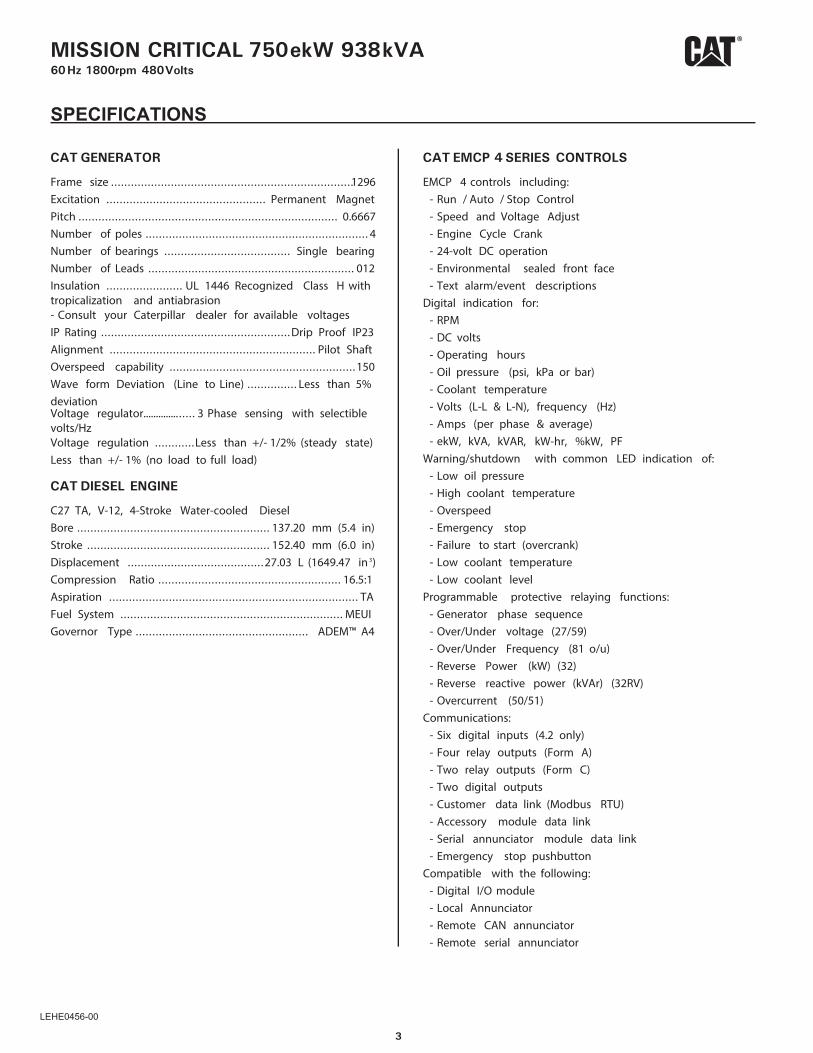
SPECIFICATIONS
CAT GENERATOR
Frame size ... . . . . . . . . . . . . . . . . . . . . . . . . . . . . . . . . . . . . . . . . . . . . . . . . . . . . . . . . . . . . . . . . . . . . . .1296Excitation ... . . . . . . . . . . . . . . . . . . . . . . . . . . . . . . . . . . . . . . . . . . . . . Permanent MagnetPitch ... . . . . . . . . . . . . . . . . . . . . . . . . . . . . . . . . . . . . . . . . . . . . . . . . . . . . . . . . . . . . . . . . . . . . . . . . . . . 0.6667Number of poles .. . . . . . . . . . . . . . . . . . . . . . . . . . . . . . . . . . . . . . . . . . . . . . . . . . . . . . . . . . . . . . . . . . 4Number of bearings ... . . . . . . . . . . . . . . . . . . . . . . . . . . . . . . . . . . . Single bearingNumber of Leads ... . . . . . . . . . . . . . . . . . . . . . . . . . . . . . . . . . . . . . . . . . . . . . . . . . . . . . . . . . . . 012Insulation ... . . . . . . . . . . . . . . . . . . . . UL 1446 Recognized Class H withtropicalization and antiabrasion- Consult your Caterpillar dealer for available voltagesIP Rating ... . . . . . . . . . . . . . . . . . . . . . . . . . . . . . . . . . . . . . . . . . . . . . . . . . . . . . . Drip Proof IP23Alignment ... . . . . . . . . . . . . . . . . . . . . . . . . . . . . . . . . . . . . . . . . . . . . . . . . . . . . . . . . . . . Pilot ShaftOverspeed capability .. . . . . . . . . . . . . . . . . . . . . . . . . . . . . . . . . . . . . . . . . . . . . . . . . . . . . . . 150Wave form Deviation (Line to Line) .. . . . . . . . . . . . . . Less than 5%deviationVoltage regulator.............. . . . . . 3 Phase sensing with selectiblevolts/HzVoltage regulation ... . . . . . . . . .Less than +/- 1/2% (steady state)Less than +/- 1% (no load to full load)
CAT DIESEL ENGINE
C27 TA, V-12, 4-Stroke Water-cooled DieselBore ... . . . . . . . . . . . . . . . . . . . . . . . . . . . . . . . . . . . . . . . . . . . . . . . . . . . . . . . 137.20 mm (5.4 in)Stroke ... . . . . . . . . . . . . . . . . . . . . . . . . . . . . . . . . . . . . . . . . . . . . . . . . . . . . 152.40 mm (6.0 in)Displacement ... . . . . . . . . . . . . . . . . . . . . . . . . . . . . . . . . . . . . . . 27.03 L (1649.47 in 3)Compression Ratio .. . . . . . . . . . . . . . . . . . . . . . . . . . . . . . . . . . . . . . . . . . . . . . . . . . . . . . 16.5:1Aspiration ... . . . . . . . . . . . . . . . . . . . . . . . . . . . . . . . . . . . . . . . . . . . . . . . . . . . . . . . . . . . . . . . . . . . . . . . . TAFuel System ... . . . . . . . . . . . . . . . . . . . . . . . . . . . . . . . . . . . . . . . . . . . . . . . . . . . . . . . . . . . . . . . . MEUIGovernor Type ... . . . . . . . . . . . . . . . . . . . . . . . . . . . . . . . . . . . . . . . . . . . . . . . . . ADEM™ A4
CAT EMCP 4 SERIES CONTROLS
EMCP 4 controls including:- Run / Auto / Stop Control- Speed and Voltage Adjust- Engine Cycle Crank- 24-volt DC operation- Environmental sealed front face- Text alarm/event descriptions
Digital indication for:- RPM- DC volts- Operating hours- Oil pressure (psi, kPa or bar)- Coolant temperature- Volts (L-L & L-N), frequency (Hz)- Amps (per phase & average)- ekW, kVA, kVAR, kW-hr, %kW, PF
Warning/shutdown with common LED indication of:- Low oil pressure- High coolant temperature- Overspeed- Emergency stop- Failure to start (overcrank)- Low coolant temperature- Low coolant level
Programmable protective relaying functions:- Generator phase sequence- Over/Under voltage (27/59)- Over/Under Frequency (81 o/u)- Reverse Power (kW) (32)- Reverse reactive power (kVAr) (32RV)- Overcurrent (50/51)
Communications:- Six digital inputs (4.2 only)- Four relay outputs (Form A)- Two relay outputs (Form C)- Two digital outputs- Customer data link (Modbus RTU)- Accessory module data link- Serial annunciator module data link- Emergency stop pushbutton
Compatible with the following:- Digital I/O module- Local Annunciator- Remote CAN annunciator- Remote serial annunciator
3
MISSION CRITICAL 750ekW 938kVA60Hz 1800rpm 480Volts
LEHE0456-00
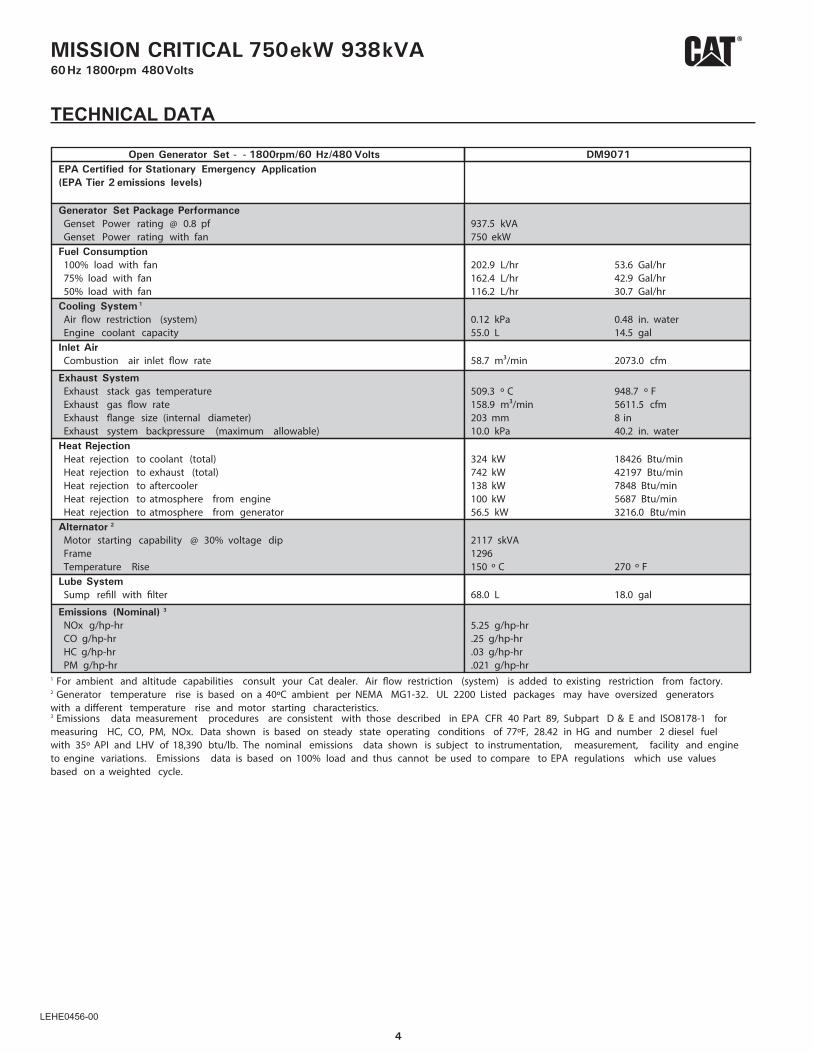
TECHNICAL DATA
Open Generator Set - - 1800rpm/60 Hz/480 Volts DM9071
EPA Certified for Stationary Emergency Application
(EPA Tier 2 emissions levels)
Generator Set Package Performance
Genset Power rating @ 0.8 pfGenset Power rating with fan
937.5 kVA750 ekW
Fuel Consumption
100% load with fan75% load with fan50% load with fan
202.9 L/hr 53.6 Gal/hr162.4 L/hr 42.9 Gal/hr116.2 L/hr 30.7 Gal/hr
Cooling System 1
Air restriction (system)Engine coolant capacity
0.12 kPa 0.48 in. water55.0 L 14.5 gal
Inlet Air
Combustion air inlet rate 58.7 m³/min 2073.0 cfm
Exhaust System
Exhaust stack gas temperatureExhaust gas rateExhaust size (internal diameter)Exhaust system backpressure (maximum allowable)
509.3 º C 948.7 º F158.9 m³/min 5611.5 cfm203 mm 8 in10.0 kPa 40.2 in. water
Heat Rejection
Heat rejection to coolant (total)Heat rejection to exhaust (total)Heat rejection to aftercoolerHeat rejection to atmosphere from engineHeat rejection to atmosphere from generator
324 kW 18426 Btu/min742 kW 42197 Btu/min138 kW 7848 Btu/min100 kW 5687 Btu/min56.5 kW 3216.0 Btu/min
Alternator 2
Motor starting capability @ 30% voltage dipFrameTemperature Rise
2117 skVA1296150 º C 270 º F
Lube System
Sump with 68.0 L 18.0 gal
Emissions (Nominal) 3
NOx g/hp-hrCO g/hp-hrHC g/hp-hrPM g/hp-hr
5.25 g/hp-hr.25 g/hp-hr.03 g/hp-hr.021 g/hp-hr
1 For ambient and altitude capabilities consult your Cat dealer. Air restriction (system) is added to existing restriction from factory.2 Generator temperature rise is based on a 40ºC ambient per NEMA MG1-32. UL 2200 Listed packages may have oversized generatorswith a temperature rise and motor starting characteristics.3 Emissions data measurement procedures are consistent with those described in EPA CFR 40 Part 89, Subpart D & E and ISO8178-1 formeasuring HC, CO, PM, NOx. Data shown is based on steady state operating conditions of 77ºF, 28.42 in HG and number 2 diesel fuelwith 35º API and LHV of 18,390 btu/lb. The nominal emissions data shown is subject to instrumentation, measurement, facility and engineto engine variations. Emissions data is based on 100% load and thus cannot be used to compare to EPA regulations which use valuesbased on a weighted cycle.
4
MISSION CRITICAL 750ekW 938kVA60Hz 1800rpm 480Volts
LEHE0456-00
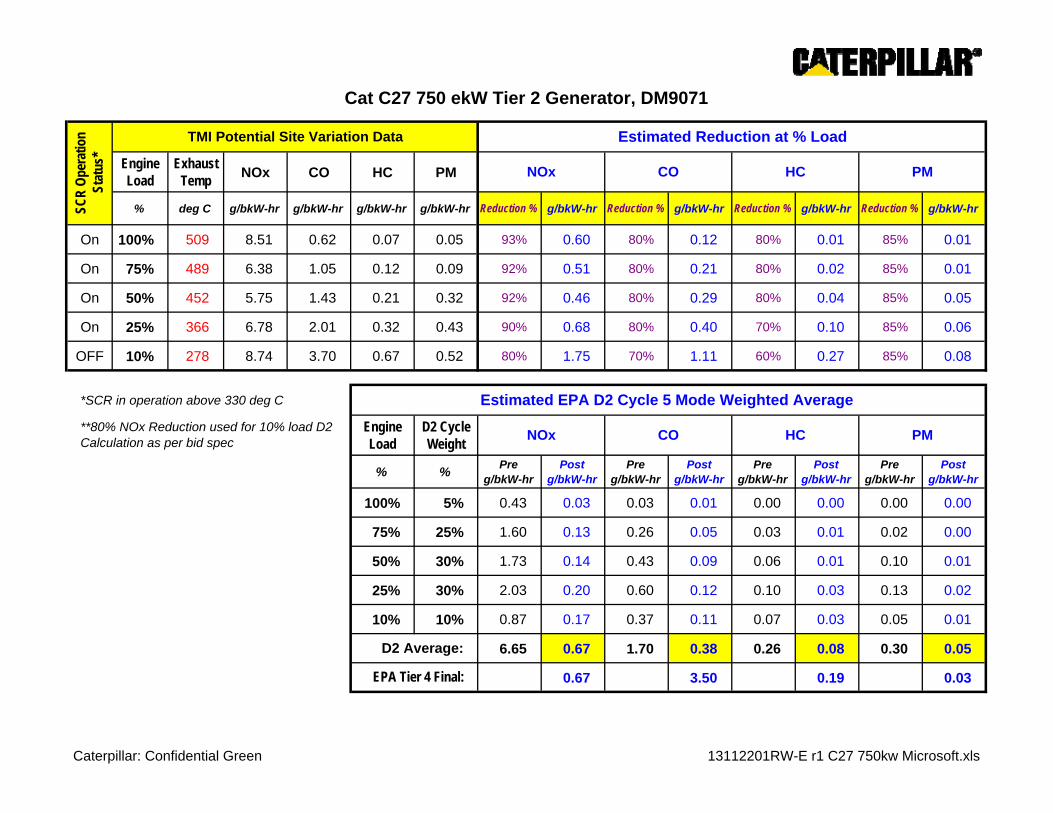
Engine Load
Exhaust Temp
NOx CO HC PM
% deg C g/bkW-hr g/bkW-hr g/bkW-hr g/bkW-hr Reduction % g/bkW-hr Reduction % g/bkW-hr Reduction % g/bkW-hr Reduction % g/bkW-hr
On 100% 509 8.51 0.62 0.07 0.05 93% 0.60 80% 0.12 80% 0.01 85% 0.01
On 75% 489 6.38 1.05 0.12 0.09 92% 0.51 80% 0.21 80% 0.02 85% 0.01
On 50% 452 5.75 1.43 0.21 0.32 92% 0.46 80% 0.29 80% 0.04 85% 0.05
On 25% 366 6.78 2.01 0.32 0.43 90% 0.68 80% 0.40 70% 0.10 85% 0.06
OFF 10% 278 8.74 3.70 0.67 0.52 80% 1.75 70% 1.11 60% 0.27 85% 0.08
*SCR in operation above 330 deg C
Engine Load
D2 Cycle Weight
% %Pre
g/bkW-hrPost
g/bkW-hrPre
g/bkW-hrPost
g/bkW-hrPre
g/bkW-hrPost
g/bkW-hrPre
g/bkW-hrPost
g/bkW-hr
100% 5% 0.43 0.03 0.03 0.01 0.00 0.00 0.00 0.00
75% 25% 1.60 0.13 0.26 0.05 0.03 0.01 0.02 0.00
50% 30% 1.73 0.14 0.43 0.09 0.06 0.01 0.10 0.01
25% 30% 2.03 0.20 0.60 0.12 0.10 0.03 0.13 0.02
10% 10% 0.87 0.17 0.37 0.11 0.07 0.03 0.05 0.01
6.65 0.67 1.70 0.38 0.26 0.08 0.30 0.05
0.67 3.50 0.19 0.03
**80% NOx Reduction used for 10% load D2 Calculation as per bid spec
NOx CO
D2 Average:
EPA Tier 4 Final:
SCR
Ope
ratio
n St
atus
*
TMI Potential Site Variation Data
Cat C27 750 ekW Tier 2 Generator, DM9071
Estimated EPA D2 Cycle 5 Mode Weighted Average
NOx CO HC PM
Estimated Reduction at % Load
HC PM
Caterpillar: Confidential Green 13112201RW-E r1 C27 750kw Microsoft.xls
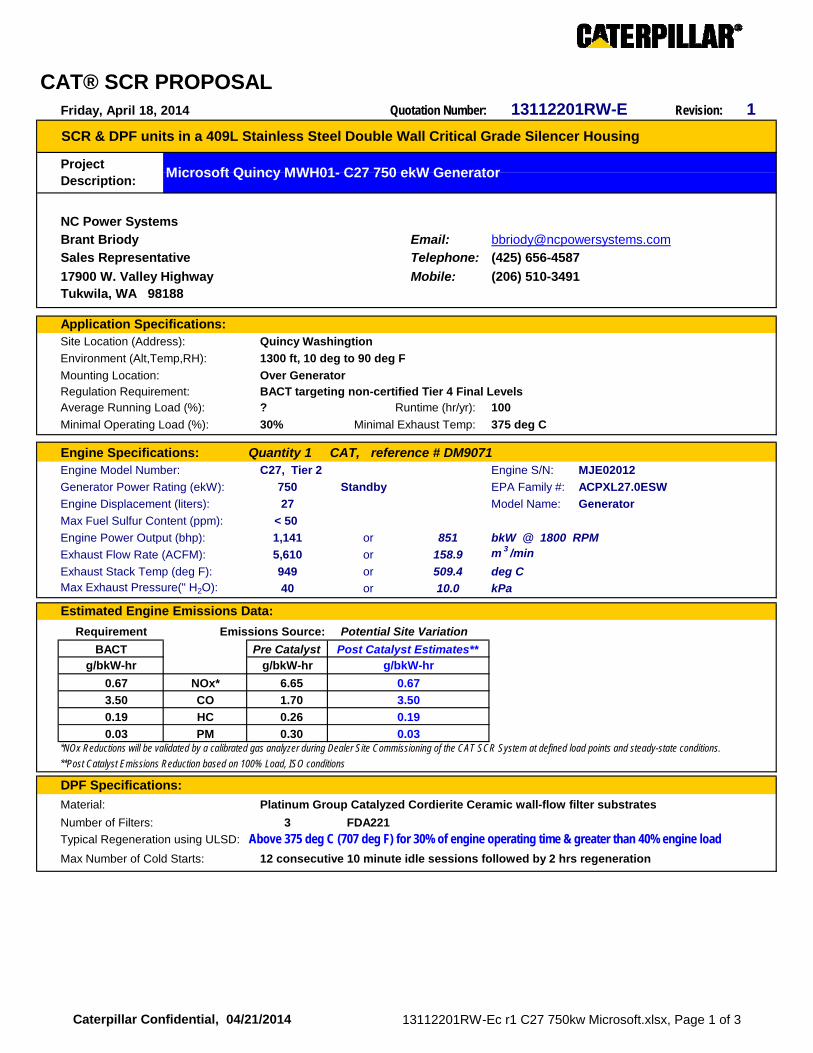
CAT® SCR PROPOSALQuotation Number: Revision: 1
NC Power Systems
Brant Briody Email: [email protected]
Sales Representative Telephone:
17900 W. Valley Highway Mobile:Tukwila, WA 98188
Application Specifications:Site Location (Address): Quincy Washingtion
Environment (Alt,Temp,RH): 1300 ft, 10 deg to 90 deg F
Mounting Location: Over GeneratorRegulation Requirement: BACT targeting non-certified Tier 4 Final LevelsAverage Running Load (%): ? Runtime (hr/yr): 100
Minimal Operating Load (%): 30% Minimal Exhaust Temp: 375 deg C
Engine Specifications: Quantity 1 CAT, reference # DM9071Engine Model Number: C27, Tier 2 Engine S/N: MJE02012
Generator Power Rating (ekW): 750 Standby EPA Family #: ACPXL27.0ESW
Engine Displacement (liters): 27 Model Name: Generator
Max Fuel Sulfur Content (ppm): < 50
Engine Power Output (bhp): 1,141 or 851 bkW @ 1800 RPM
Exhaust Flow Rate (ACFM): 5,610 or 158.9 m 3 /min
Exhaust Stack Temp (deg F): 949 or 509.4 deg CMax Exhaust Pressure(" H2O): 40 or 10.0 kPa
Estimated Engine Emissions Data:
Requirement Emissions Source: Potential Site Variation
BACT % O2 Correction Pre Catalystg/bkW-hr 5% g/bkW-hr
0.67 NOx* 6.65
3.50 CO 1.70
0.19 HC 0.26
0.03 PM 0.30
DPF Specifications:
Material: Platinum Group Catalyzed Cordierite Ceramic wall-flow filter substrates
Number of Filters: 3 FDA221
Typical Regeneration using ULSD:
Max Number of Cold Starts: 12 consecutive 10 minute idle sessions followed by 2 hrs regeneration
0.67
3.50
0.19
0.03*NOx Reductions will be validated by a calibrated gas analyzer during Dealer Site Commissioning of the CAT SCR System at defined load points and steady-state conditions.
**Post Catalyst Emissions Reduction based on 100% Load, ISO conditions
Above 375 deg C (707 deg F) for 30% of engine operating time & greater than 40% engine load
g/bkW-hr
Friday, April 18, 2014 13112201RW-E
SCR & DPF units in a 409L Stainless Steel Double Wall Critical Grade Silencer Housing
Project Description:
Microsoft Quincy MWH01- C27 750 ekW Generator
(425) 656-4587
(206) 510-3491
Post Catalyst Estimates**
Caterpillar Confidential, 04/21/2014 13112201RW-Ec r1 C27 750kw Microsoft.xlsx, Page 1 of 3

SCR Specifications:
Material: Iron Zeolite Catalyzed Cordierite Ceramic Substrates # T6 Modules: 36
Total Amount of Catalyst (cubic ft): 17 (4.8 cubic meters) # T2 Modules:
Number of Catalyst Layers: 3 layers @ 24 blocks/layer 4 wide by 6 high # T4 Modules:
Injection Lance: 36 inches (914 mm)
Approximate DEF Consumption: 2.5 gal/hr or 9.4 liters/hr of 32.5% Technical Grade UreaRecommended Reductant: 32.5% DEF (Diesel Exhaust Fluid), Please reference Cat document PELJ1160
Maximum Ammonia Slip: Not Specified
Dosing Control Cabinet: Nema 12 Enclosure (36" high x 32" wide x 12" deep)
*Touch Screen Display & Dual NOx Sensors for a True Closed-Loop System
*Controller, Pressure Sensor, Temperature Sensor, Dosing Pump, Pressure Regulator, Secondary Urea Filter
*Power requirement: 240/120 volts AC, 10/20 amps, 50 or 60 Hertz
*Records NOx levels pre and post, Temperature and Pressure, Time and Date
*ModBus Communications Enabled
*Auto Start, Stop and Purge CycleTube Bundle: Dosing Control Cabinet to Injection Lance
*1/4" Heat Traced Stainless Steel tubing for DEF Flow
*1/2" Stainless Steel or Poly tubing for Compressed AirInjection and Mixing Section: Integrated within the E-POD housing
*Air & Urea Injection with Static Mixers internal to the SCR Silencer Housing
*Compressed Air requirement to be Oil Free, 10 SCFM @ 100 PSIG with a refrigerated dryer
Silencer Housing Specifications:
Material: 409L Stainless Steel, Double Wall, Welded Surface Finish
Approximate Dimensions L x W x H (inches): 120 x 80 x 45
Approximate Dimensions L x W x H (mm): 3,048 x 2,032 x 1,143
Estimated Weight (pounds / kilograms): 4,400 / 2000
Silencer Sound Reduction (dBa): 27-35 Critical Grade SilencingEst. Pressure Drop Silencer+SCR+DPF ("H2O): 20.9 5.2
Inlet Size inches (mm): Flange # of Inlets: 1
Outlet Size inches (mm): Flange
This System Includes:SILENCER - Stainless Steel: Yes INTERNAL Mixing and DEF Injection: Yes
SCR Catalyst: Yes Dosing Control Cabinet: Yes
DPF Units: Yes Operation & Maintenance Manual: Yes
Start-up Commissioning: No
This System Excludes:Delivery/Freight Expenses, Consumables and Utilities
Installation and supply of interconnecting power, control cables, conduit, reductant tanks, plumbing, supply pumps, etc.
Installation, Commissioning of the Proposed System and any required permitting
Exhaust piping insulation (Recommend insulating the exhaust from the engine to the inlet of the emissions control system)
12 (305)
12 (305)
as configured at rated load or (kPa):
Caterpillar Confidential, 04/21/2014 13112201RW-Ec r1 C27 750kw Microsoft.xlsx, Page 2 of 3

Notes:
Terms & Conditions: Incoterms: FCA Santa Fe
Warranty: 24 months or 8,000 hours of operation, whichever comes first, from date of commissioning
Pricing:Closed-Loop System
Ref/Cat # Description Quantity Unit Price
1 12031201AE
2 12031201AE-IB
Estimated Freight:
Total:
Recommended Equipment:Ref/Cat # Description Quantity Unit Price
1 376-8483Atlas Copco SF-4 Air Compressor (typically 460 Volt/ 3 phase, call for options)
M315P32175A73952E7759
Dealer Net
Total (USD)
Recommended minimum engine load of 30% and 375 degrees C through the particulate filters to ensure filter regeneration and prevent wet stacking the catalyst. If this is not possible then following 4 hours of cumulative runtime at low loads the engines should be run with at least 50% load for 2 hours to regenerate the filter media.
Dealer Net
Total (USD)
CAT® SCR w/ SCR & DPF in a 409L Stainless Steel Double Wall Critical Grade Silencer
Custom Insulating Blanket
Caterpillar Confidential, 04/21/2014 13112201RW-Ec r1 C27 750kw Microsoft.xlsx, Page 3 of 3
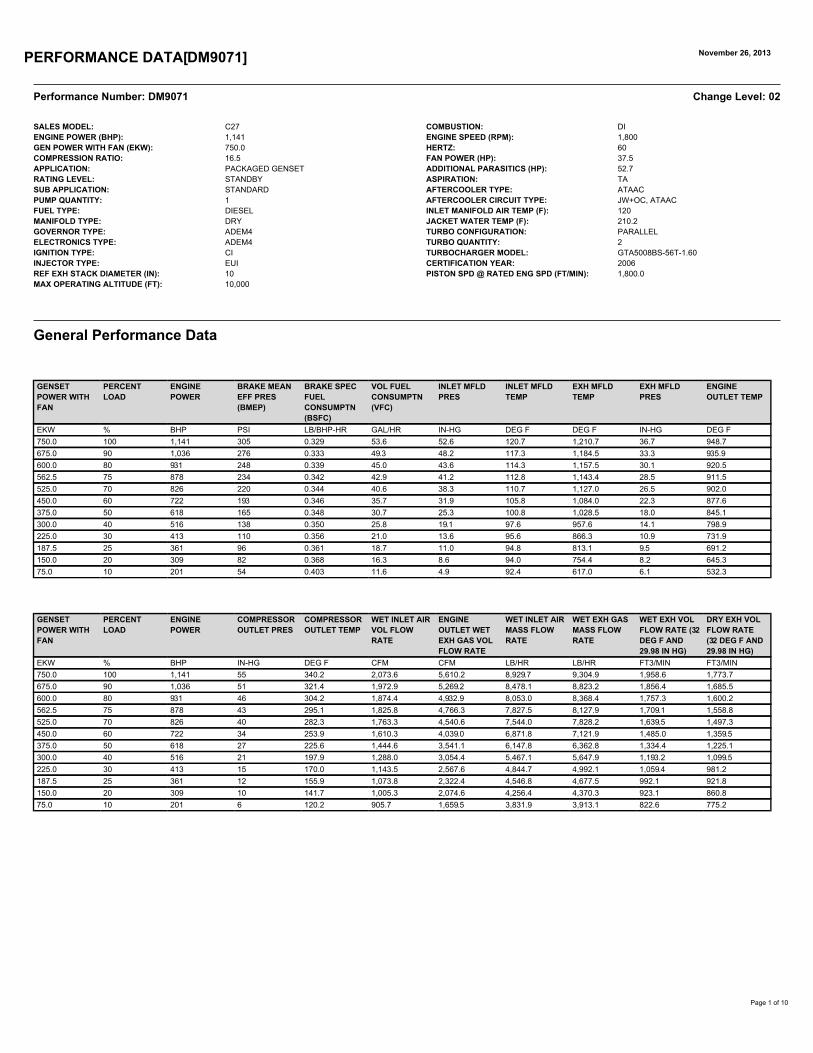

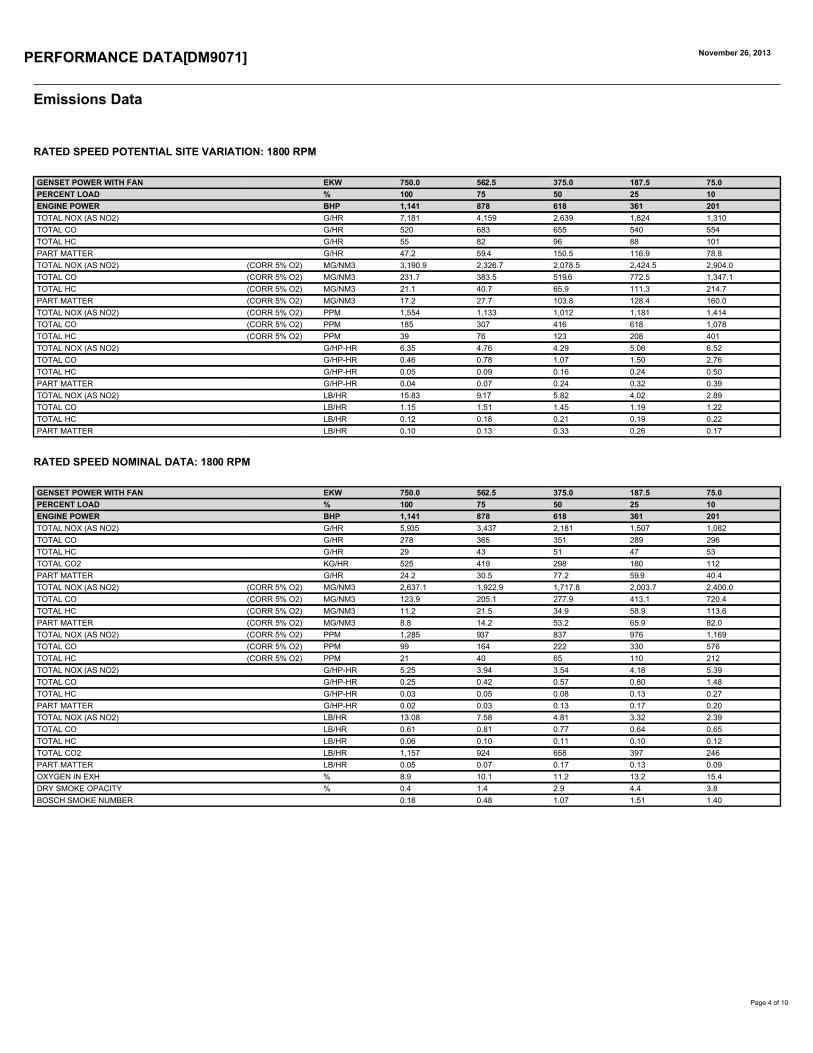
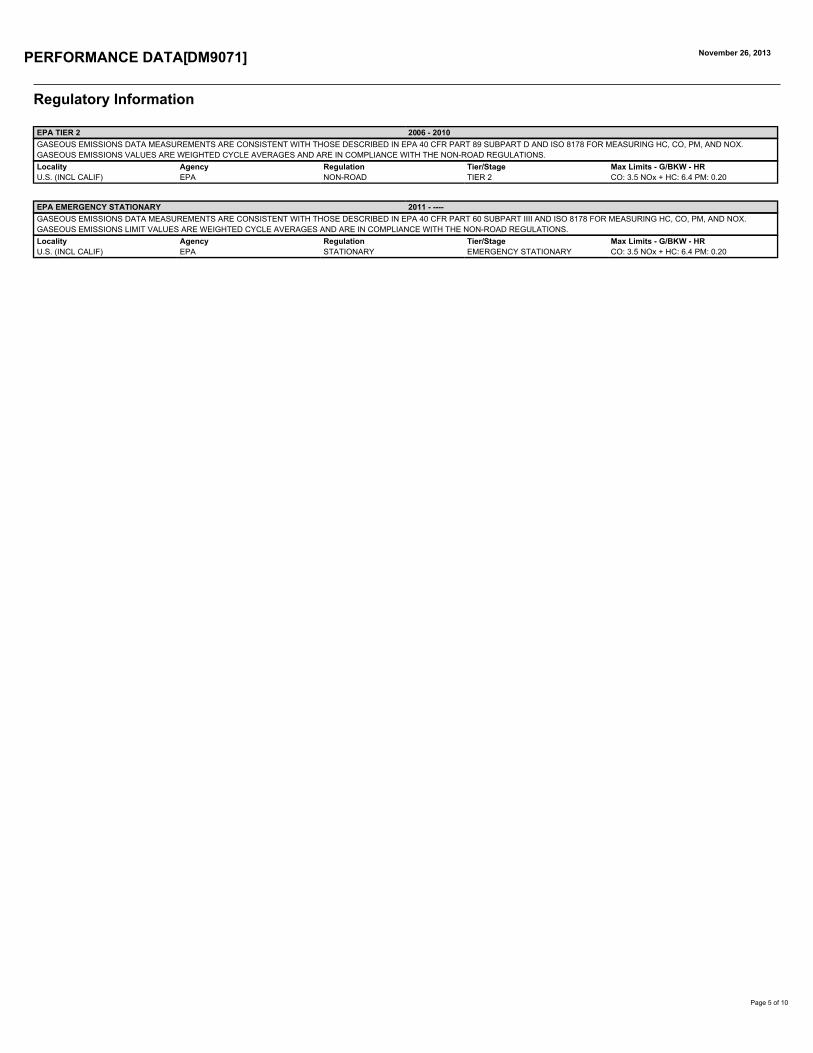
APPENDIX B
Mechanical Draft Cooling TowerTechnical Information
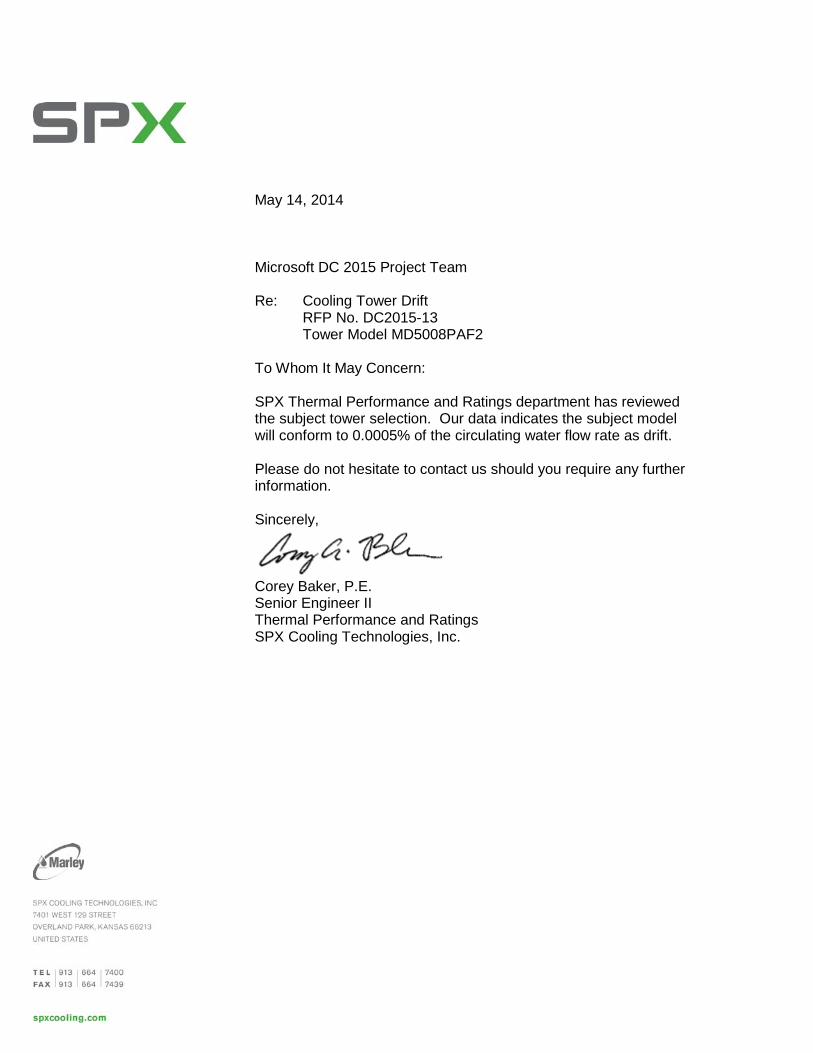
May 14, 2014 Microsoft DC 2015 Project Team Re: Cooling Tower Drift RFP No. DC2015-13 Tower Model MD5008PAF2 To Whom It May Concern: SPX Thermal Performance and Ratings department has reviewed the subject tower selection. Our data indicates the subject model will conform to 0.0005% of the circulating water flow rate as drift. Please do not hesitate to contact us should you require any further information. Sincerely,
Corey Baker, P.E. Senior Engineer II Thermal Performance and Ratings SPX Cooling Technologies, Inc.

1
Jim Wilder
From: Jim WilderSent: Tuesday, June 03, 2014 8:05 AMTo: [email protected]; [email protected]: Jim Wilder; Ray Cheng; John Radick; Kevin Williams (DCS); Cohen, MatthewSubject: FW: Microsoft Oxford: Flowrate-specific Cooling tower specs for winning bidder (SPX-
Marley)
Hello Gary ‐ The preceding email messages confirm that the SPX‐Marley cooling towers at Microsoft Project Oxford are certified for the 0.0005% drift rate at the design water and air flowrates. This information is provided based on your request of May 21. We trust this information will allow you to proceed briskly with the public comment period. Please call me to discuss the upcoming schedule. Thanks!
From: Bougher, Doug [mailto:[email protected]] Sent: Tuesday, June 03, 2014 6:26 AM To: Ray Cheng; Jim Wilder Cc: Paul Boege Subject: RE: Microsoft Project Oxford: Cooling tower specs for winning bidder (SPX-Marley) Ray, Mike, SPX certifies that the drift rate is 0.0005% at Microsoft’s design water flow rate of 950 gpm and an air flow rate 143,600cfm for the 4 cell cooling towers used in Project Oxford. ‐Doug
Doug Bougher Director HVAC & Refrigeration Sales Evaporative Cooling SPX Cooling Technologies, Inc. 7401 West 129th Street Overland Park, Kansas 66213 TEL +1 913-664-7540 MOB +1 913-827-7573 FAX +1 913-693-9506 [email protected] www.spx.com
The information contained in this electronic mail transmission is intended by SPX Corporation for the use of the named individual or entity to which it is directed and may contain information that is confidential or privileged. If you have received this electronic mail transmission in error, please delete it from your system without copying or forwarding it, and notify the sender of the error by reply email so that the sender’s address records can be corrected.
From: Ray Cheng [mailto:[email protected]] Sent: Thursday, May 29, 2014 1:22 PM
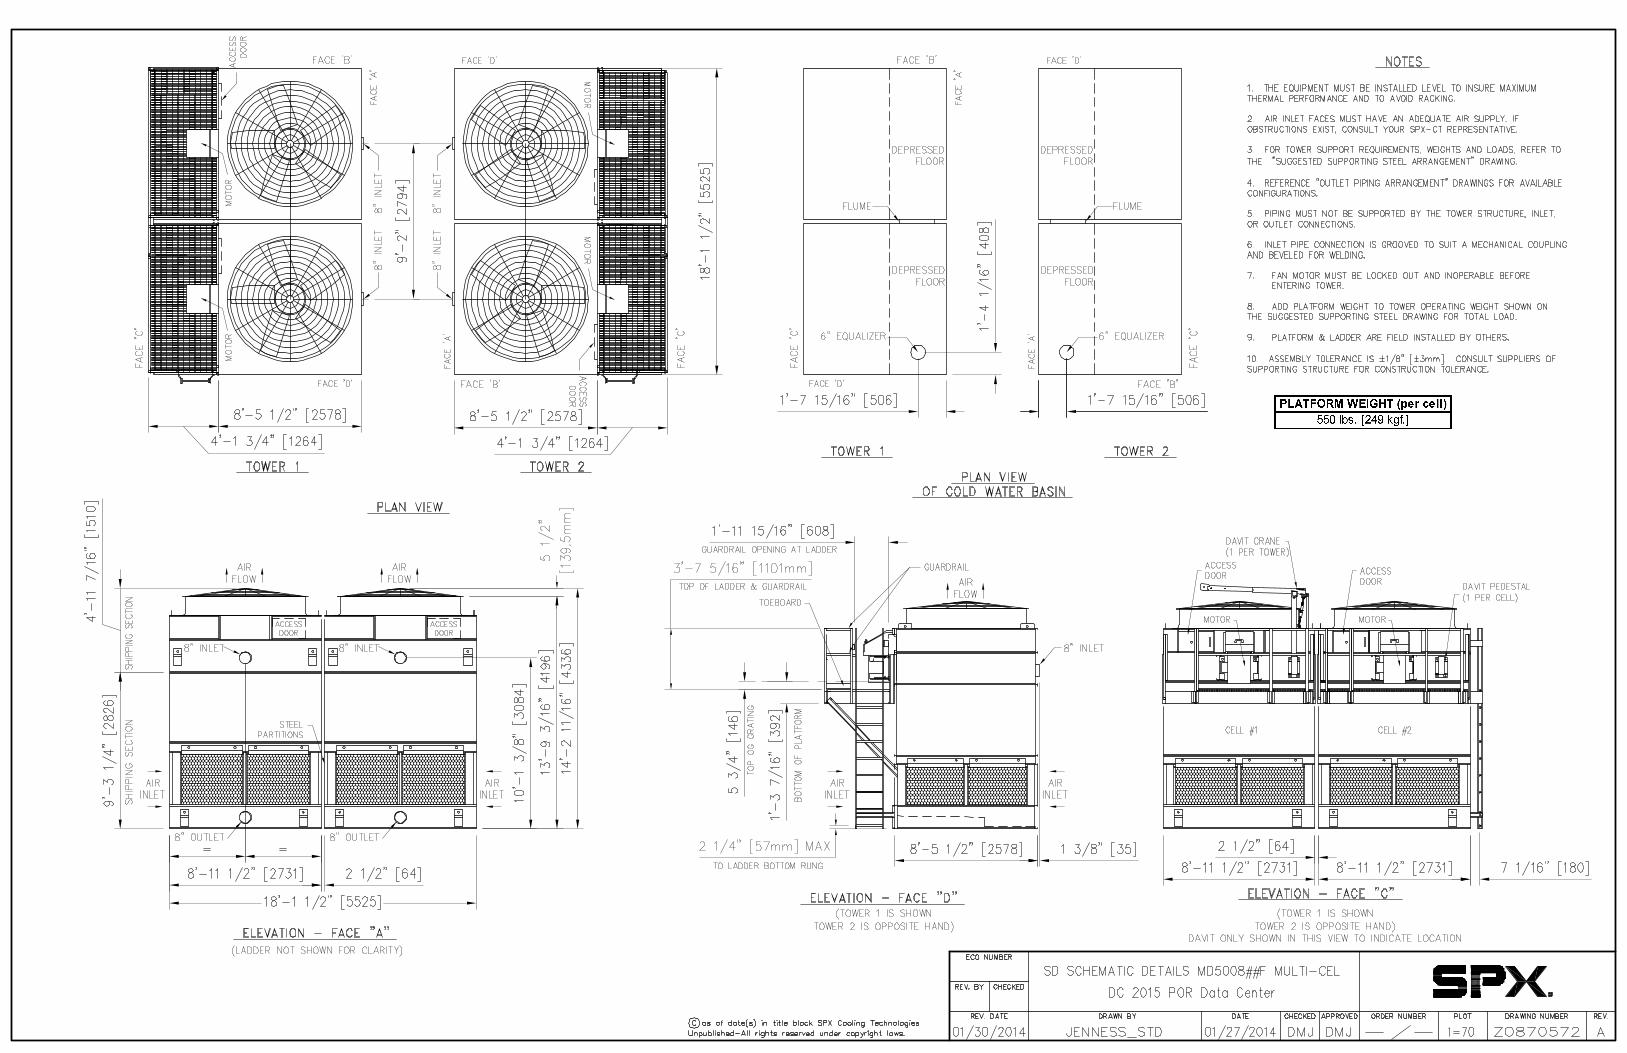


Marley MD 5000COU NTE R FLOW COOLI NG TOWE R
E NG I N E E R I NG DATA
AN D S PECI FICATION S
MD towers are galvanized steel, factory assembled, counterflow cooling towers, designed to serve air conditioning and refrigeration systems as well as light to medium industrial process loads on clean water. The Marley MD evolved from a factory-assembled concept of towers pioneered by Marley some 75 years ago, and incorporates all of the design advancements that our customers have found valuable. MD towers represent the current state of the art in this cooling tower category.
The specifications portion of this publication not only relates the language to use in describing an appropriate MD cooling tower—but also defines why certain items and features are important enough to specify with the intention of insisting upon compliance by all bidders. The left hand column of pages 40 thru 53 provides appropriate text for the various specification paragraphs, whereas the right hand column comments on the meaning of the subject matter and explains its value.
Pages 40 through 44 indicate those paragraphs which will result in the purchase of a basic cooling tower—one that accomplishes the specified thermal performance, but which will lack many operation—and maintenance-enhancing accessories and features that are usually desired by those persons who are responsible for the continuing operation of the system of which the cooling tower is part. It will also incorporate those standard materials which testing and experience has proven to provide acceptable longevity in normal operating conditions.
Pages 45 through 53 provide paragraphs intended to add those features, components, and materials that will customize the cooling tower to meet the user‘s requirements.
MD Steel Cooling Tower 2
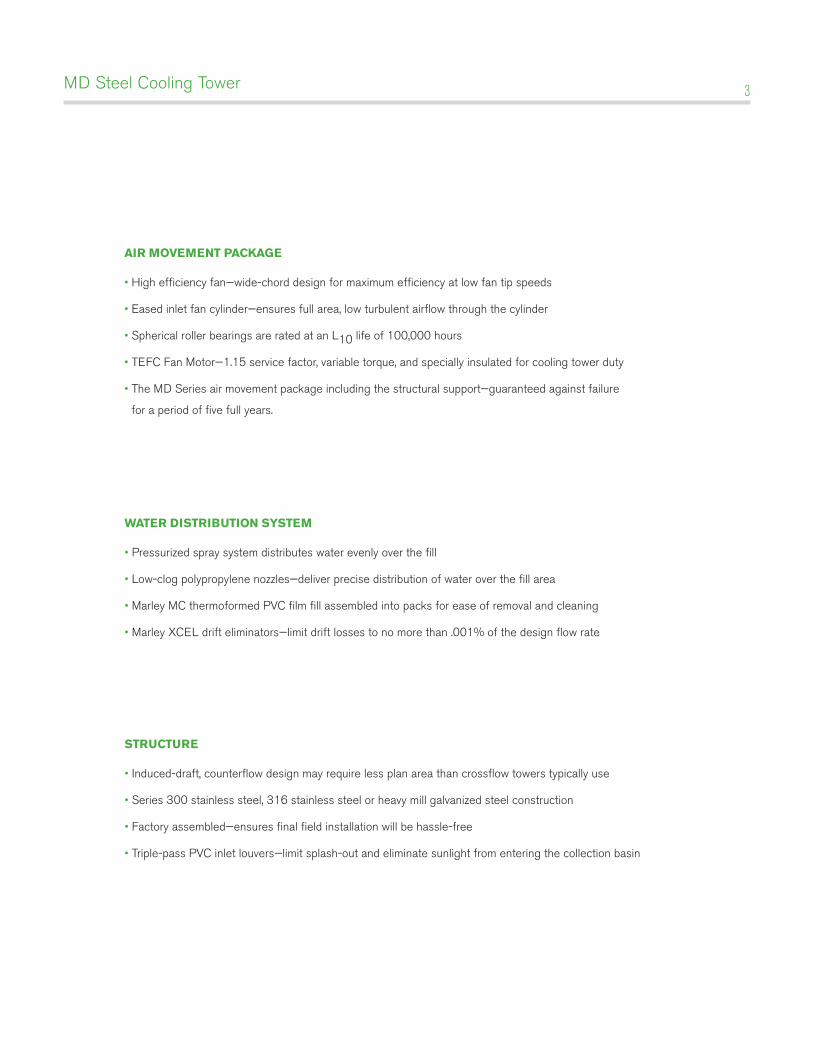
WATER DISTRIBUTION SYSTEM
• Pressurized spray system distributes water evenly over the fill
• Low-clog polypropylene nozzles—deliver precise distribution of water over the fill area
• Marley MC thermoformed PVC film fill assembled into packs for ease of removal and cleaning
• Marley XCEL drift eliminators—limit drift losses to no more than .001% of the design flow rate
STRUCTURE
• Induced-draft, counterflow design may require less plan area than crossflow towers typically use
• Series 300 stainless steel, 316 stainless steel or heavy mill galvanized steel construction
• Factory assembled—ensures final field installation will be hassle-free
• Triple-pass PVC inlet louvers—limit splash-out and eliminate sunlight from entering the collection basin
AIR MOVEMENT PACKAGE
• High efficiency fan—wide-chord design for maximum efficiency at low fan tip speeds
• Eased inlet fan cylinder—ensures full area, low turbulent airflow through the cylinder
• Spherical roller bearings are rated at an L10 life of 100,000 hours
• TEFC Fan Motor—1.15 service factor, variable torque, and specially insulated for cooling tower duty
• The MD Series air movement package including the structural support—guaranteed against failure
for a period of five full years.
MD Steel Cooling Tower 3
Engineering Data
Schematic 6Support 34Outlet Connection 36Hoisting Info 37Freeze Prevention 38Water Quality 39
Specifications / Base
Base 40Thermal Performance 40Performance Warranty 40Design Loading 41Construction 41Mechanical Equipment 42Fill, Louvers and Drift Eliminators 43Hot Water Distribution System 43Casing and Fan Guard 44Access 44Collection Basin 44Warranty 44
Specifications / Options
Stainless Steel OptionsStainless Steel Collection Basin 45All Stainless Steel Cooling Tower 45
Convenience and Safety OptionsMechanical Access Platform 46Ladder Extension 46Ladder Safety Cage 46Motor Davit 46Motor and Fan Davit 47
Control OptionsFan Motor Starter Control Panel 47Vibration Limit Switch 48Basin Heater 48Water Level Control 48Fan Motor All Weather Variable Speed Drive 49Fan Motor Premium Variable Speed Drive 50
Miscellaneous OptionsEqualizer Flume Weir Gates 51Sound Control 52Splash Attenuation 52Outlet Sound Attenuation 52Ultra Quiet Fan 53
MD Steel Cooling Tower — Table of Contents 4
MD Steel Cooling Tower — Operational and Environmental Awareness 5
C A U T I O N
The cooling tower must be located at such distance
and direction to avoid the possibility of contaminated
discharge air being drawn into building fresh air
intake ducts. The purchaser should obtain the
services of a Licensed Professional Engineer or
Registered Architect to certify that the location of
the cooling tower is in compliance with applicable air
pollution, fire and clean air codes.
SYSTEM CLEANLINESS
Cooling towers are very effective air washers. Atmospheric dust able to pass through the relatively small louver openings will enter the circulating water system. Increased concentrations can intensify system maintenance by clogging screens and strainers—and smaller particulates can coat system heat transfer surfaces. In areas of low flow velocity—such as the cold water basin—sedimentary deposits can provide a breeding ground for bacteria.
In areas prone to dust and sedimentation, you should consider installing some means for keeping the cold water basin clean. Typical devices include side stream filters and a variety of filtration media.
WATER TREATMENT
To control the buildup of dissolved solids resulting from water evaporation, as well as airborne impurities and biological contaminants including Legionella, an effective consistent water treatment program is required. Simple blowdown may be adequate to control corrosion and scale, but biological contamination can only be controlled with biocides.
An acceptable water treatment program must be compatible with the variety of materials incorporated in a cooling tower—ideally the pH of the circulating water should fall between 6.5 and 9.0. Batch feeding of chemicals directly into the cooling tower is not a good practice since localized damage to the tower is possible. Specific startup instructions and additional water quality recommendations can be found in the MD User Manual which accompanies the tower and also is available from your local Marley sales representative. For complete water treatment recommendations, consult a competent, qualified water treatment supplier.
TYPICAL APPLICATIONS
The MD tower is an excellent choice for normal applications requiring cold water for the dissipation of heat. This includes condenser water cooling for air conditioning, refrigeration, and thermal storage systems, as well as their utilization for free-cooling in all of those systems. The MD can also be used in the cooling of jacket water for engines and air compressors, and are widely applied to dissipate waste heat in a variety of industrial, power and manufacturing processes.
Choosing the all stainless steel construction option, the MD can be confidently applied in unusually corrosive processes and operating environments. However, no single product line can answer all problems, and selective judgement should be exercised in the following situations
APPLICATIONS REqUIRING ALTERNATIVE COOLING TOWER SELECTIONS
Certain types of applications are incompatible with any cooling tower with film fill—whether MD or a competitive tower of similar manufacture. Film fill is subject to distortion in high water temperatures, and the narrow passages are easily clogged by turbid or debris-laden water. Some of the applications, which call for alternative tower designs are:
• Water temperatures exceeding 135°F—adversely affects the service life and performance of normal counterflow PVC fill. Higher temperature fill materials are available.
• Ethylene glycol content—can plug fill passages as slime and algae accumulate to feed on the available organic materials.
• Fatty acid content—found in processes such as soap and detergent manufacturing and some food processing—fatty acids pose a serious threat for plugging fill passages.
• Particulate carry over—often found in steel mills and cement plants—can both cause fill plugging, and can build up to potentially damaging levels on tower structure.
• Pulp carry over—typical of the paper industry and food processing where vacuum pumps or barometric condensers are used. Causes fill plugging which may be intensified by algae.
ALTERNATIVE SELECTIONS
In addition to the MD, SPX Cooling Technologies offers a full scope of products in various designs and capacities to meet the special demands of specific applications.
spxcooling.com—visit us on the web for a complete list of products, services, publications and to find your nearest sales representative.
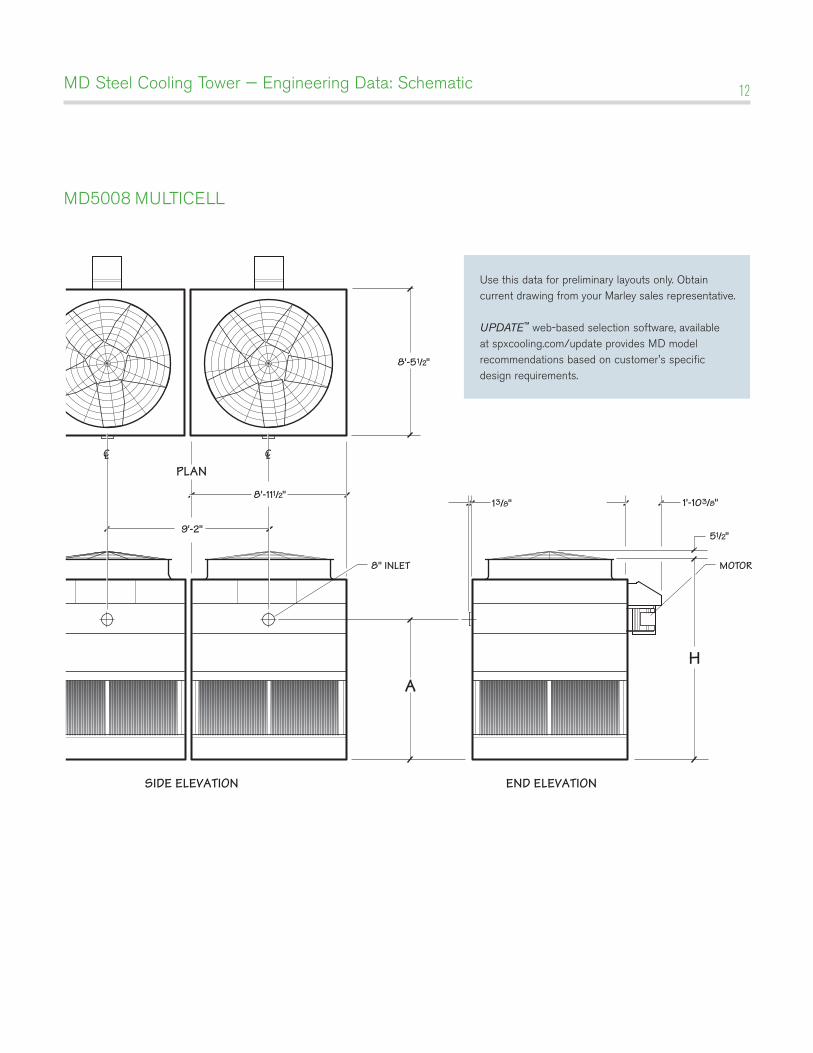
MD Steel Cooling Tower — Engineering Data: Schematic 12
HA
13/8"
MOTOR
CLPLAN
SIDE ELEVATION END ELEVATION
8" INLET
CL
1'-103/8"
8'-51/2"
8'-111/2"
9'-2" 51/2"
MD5008 MULTICELL
Use this data for preliminary layouts only. Obtain current drawing from your Marley sales representative.
UPDATE™ web-based selection software, available at spxcooling.com/update provides MD model recommendations based on customer's specific design requirements.

MD Steel Cooling Tower — Engineering Data: Schematic Data 13
MD5008 MULTICELL
Model note 2
Nominal Tons note 3
Motor hp
dBA 5'-0" from air
inlet face
dBA 5'-0" above fan outlet
Dimensions Design Operating
Weight lb
Shipping Weight lb
H note 5 A Weight/CellHeaviest Section
MD5008KLC2L 149 5 79 76
11'-613⁄16" 7'-11" 6772 3798 1965
MD5008MAC2L 165 7.5 80 80
MD5008NAC2L 179 10 81 81
MD5008PAC2L 202 15 81 84
MD5008QAC2L 216 20 81 85
MD5008KLD2L 161 5 79 76
12'-613⁄16" 8'-11" 7049 4075 2110
MD5008MAD2L 180 7.5 80 80
MD5008NAD2L 197 10 81 81
MD5008PAD2L 223 15 81 84
MD5008QAD2L 239 20 81 85
MD5008KLF2L 166 5 79 76
13'-613⁄16" 9'-11" 7326 4352 2387
MD5008MAF2L 189 7.5 80 80
MD5008NAF2L 207 10 81 81
MD5008PAF2L 234 15 81 84
MD5008QAF2L 255 20 81 85
A Sound dBA Approach
Various low sound options are available for up to 16 dB reduction from the standard dBA options in the schematic data table. Consult UPDATE selection software for performance, sound levels and dimensions.
NOTE
1 Use this bulletin for preliminary layouts only. Obtain current drawings from your Marley sales representative. All table data is per cell.
2 Last two characters of the model number indicate number of cells and cell configuration.
3 Nominal tons are based upon 95°F HW, 85°F CW, 78°F WB and 3 GPM/ton. The Marley UPDATE web-based selection software provides MD model recommendations based on specific design requirements.
4 Standard overflow is a 3" dia. FPT connection located on the side of the collection basin. Makeup water connection is 2" dia. MPT connection located on the side of the tower. A 3" FPT drain connection is located on the side of the collection basin.
5 Models with an Ultra Quiet Fan option require a taller fan cylinder, add 1'-111⁄2" to this dimension for correct height.
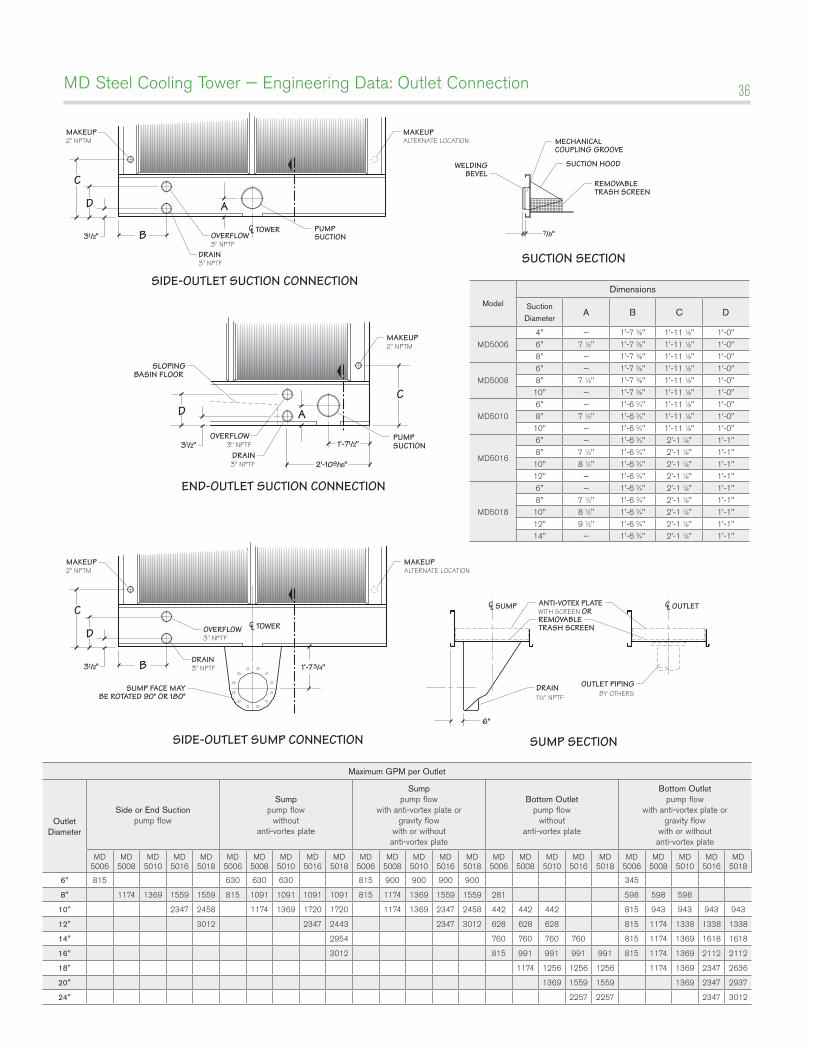
MD Steel Cooling Tower — Engineering Data: Outlet Connection 36
A
B
C
D
CL TOWER PUMPSUCTION
MAKEUP2" NPTM
MAKEUPALTERNATE LOCATION
OVERFLOW 3" NPTF
31/2" 7/8"
SUCTION HOODWELDINGBEVEL
MECHANICALCOUPLING GROOVE
REMOVABLETRASH SCREEN
DRAIN3" NPTF
SIDE-OUTLET SUCTION CONNECTION
END-OUTLET SUCTION CONNECTION
SIDE-OUTLET SUMP CONNECTION
SUCTION SECTION
SUMP SECTION
B
CL TOWER
CL SUMP
SUMP FACE MAYBE ROTATED 90° OR 180°
MAKEUP2" NPTM
MAKEUPALTERNATE LOCATION
OVERFLOW 3" NPTF
6"
1’-7 3/4"
ANTI-VOTEX PLATEWITH SCREEN ORREMOVABLETRASH SCREEN
DRAIN3" NPTF
DRAIN11/2" NPTF
OUTLET PIPINGBY OTHERS
CL OUTLETC
D
31/2"
Model
Dimensions
Suction
DiameterA B C D
MD5006
4" — 1'-7 3⁄8" 1'-11 1⁄8" 1'-0"
6" 7 1⁄2" 1'-7 3⁄8" 1'-11 1⁄8" 1'-0"
8" — 1'-7 3⁄8" 1'-11 1⁄8" 1'-0"
MD5008
6" — 1'-7 3⁄8" 1'-11 1⁄8" 1'-0"
8" 7 1⁄2" 1'-7 3⁄8" 1'-11 1⁄8" 1'-0"
10" — 1'-7 3⁄8" 1'-11 1⁄8" 1'-0"
MD5010
6" — 1'-6 3⁄4" 1'-11 1⁄8" 1'-0"
8" 7 1⁄2" 1'-6 3⁄4" 1'-11 1⁄8" 1'-0"
10" — 1'-6 3⁄4" 1'-11 1⁄8" 1'-0"
MD5016
6" — 1'-6 3⁄4" 2'-1 1⁄8" 1'-1"
8" 7 1⁄2" 1'-6 3⁄4" 2'-1 1⁄8" 1'-1"
10" 8 1⁄2" 1'-6 3⁄4" 2'-1 1⁄8" 1'-1"
12" — 1'-6 3⁄4" 2'-1 1⁄8" 1'-1"
MD5018
6" — 1'-6 3⁄4" 2'-1 1⁄8" 1'-1"
8" 7 1⁄2" 1'-6 3⁄4" 2'-1 1⁄8" 1'-1"
10" 8 1⁄2" 1'-6 3⁄4" 2'-1 1⁄8" 1'-1"
12" 9 1⁄2" 1'-6 3⁄4" 2'-1 1⁄8" 1'-1"
14" — 1'-6 3⁄4" 2'-1 1⁄8" 1'-1"
Maximum GPM per Outlet
Outlet Diameter
Side or End Suction pump flow
Sump pump flow
without anti-vortex plate
Sump pump flow
with anti-vortex plate or gravity flow
with or without anti-vortex plate
Bottom Outlet pump flow
without anti-vortex plate
Bottom Outlet pump flow
with anti-vortex plate or gravity flow
with or without anti-vortex plate
MD5006
MD5008
MD5010
MD5016
MD5018
MD5006
MD5008
MD5010
MD5016
MD5018
MD5006
MD5008
MD5010
MD5016
MD5018
MD5006
MD5008
MD5010
MD5016
MD5018
MD5006
MD5008
MD5010
MD5016
MD5018
6" 815 630 630 630 815 900 900 900 900 345
8" 1174 1369 1559 1559 815 1091 1091 1091 1091 815 1174 1369 1559 1559 281 598 598 598
10" 2347 2458 1174 1369 1720 1720 1174 1369 2347 2458 442 442 442 815 943 943 943 943
12" 3012 2347 2443 2347 3012 628 628 628 815 1174 1338 1338 1338
14" 2954 760 760 760 760 815 1174 1369 1618 1618
16" 3012 815 991 991 991 991 815 1174 1369 2112 2112
18" 1174 1256 1256 1256 1174 1369 2347 2636
20" 1369 1559 1559 1369 2347 2937
24" 2257 2257 2347 3012
A
CD
PUMPSUCTION
MAKEUP2" NPTM
OVERFLOW 3" NPTF31/2" 1'-71/2"
2'-109/16"
SLOPINGBASIN FLOOR
DRAIN3" NPTF

MD Steel Cooling Tower — Engineering Data: Hoisting 37
Model
Base Module Top Module
WidthSling Length
MinimumWeight
lbWidth
Sling Length Minimum
Weight lb
MD5006 6'-0" 9'-0" 1700 8'-6" 5'-0" 1800
MD5008 8'-6" 10'-0" 2400 9'-0" 8'-0" 2000
MD5010 8'-6" 12'-0" 3100 8'-6" 10'-0" 2400
MD5016 12'-0" 12'-0" 3900 12'-0" 10'-0" 4700
MD5018 12'-0" 15'-0" 8700 12'-0" 15'-0" 4000
1 Hoisting operations can be dangerous and suitable safety precautions should be taken to protect personnel and the equipment being hoisted.
2 All hoisting equipment should be certified and comply with local and national safety regulations.
NOTE
3 Ensure that slings are of sufficient length so not to impose bending loads onto the casing—use of spreader bars is essential.
4 For overhead lifts or where additional safety is required, add slings beneath the tower unit
OFFSET MAY BE REQUIREDFOR BALANCED LIFT
CENTER OFTOWER
CENTER OFTOWER
WIDTH WIDTH
LIFTINGSLING
LIFTINGSLING
70° MAXBOTH MODULES
OFFSET MAY BE REQUIREDFOR BALANCED LIFT
Maximum GPM per Outlet
Outlet Diameter
Side or End Suction pump flow
Sump pump flow
without anti-vortex plate
Sump pump flow
with anti-vortex plate or gravity flow
with or without anti-vortex plate
Bottom Outlet pump flow
without anti-vortex plate
Bottom Outlet pump flow
with anti-vortex plate or gravity flow
with or without anti-vortex plate
MD5006
MD5008
MD5010
MD5016
MD5018
MD5006
MD5008
MD5010
MD5016
MD5018
MD5006
MD5008
MD5010
MD5016
MD5018
MD5006
MD5008
MD5010
MD5016
MD5018
MD5006
MD5008
MD5010
MD5016
MD5018
6" 815 630 630 630 815 900 900 900 900 345
8" 1174 1369 1559 1559 815 1091 1091 1091 1091 815 1174 1369 1559 1559 281 598 598 598
10" 2347 2458 1174 1369 1720 1720 1174 1369 2347 2458 442 442 442 815 943 943 943 943
12" 3012 2347 2443 2347 3012 628 628 628 815 1174 1338 1338 1338
14" 2954 760 760 760 760 815 1174 1369 1618 1618
16" 3012 815 991 991 991 991 815 1174 1369 2112 2112
18" 1174 1256 1256 1256 1174 1369 2347 2636
20" 1369 1559 1559 1369 2347 2937
24" 2257 2257 2347 3012
MD Steel Cooling Tower — Engineering Data: Freeze Prevention 38
When the ambient air temperature falls below 32°F, the water in a cooling tower can freeze. Marley Technical Report #H-003 “Operating Cooling Towers in Freezing Weather” describes how to prevent freezing during operation. Available at spxcooling.com or ask your Marley sales representative for a copy.
During shutdown, water collects in the cold water basin and may freeze solid. You can prevent freezing by adding heat to the water left in the tower—or, you can drain the tower and all exposed pipework at shutdown.
ELECTRIC BASIN HEATERS
An automatic basin water heater system is available consisting of the following components:
• Stainless steel electric immersion heater(s).
—Threaded couplings are provided in the side of the collection basin.
• NEMA 4 enclosure containing:
—Magnetic contactor to energize heater.
—Transformer to convert power supply to 24 volts for control circuit.
—Solid state circuit board for temperature and low-water cutoff.
Enclosure may be mounted on the side of the tower.
• Control probe in the collection basin to monitor water temperature and level.
Heater components are normally shipped separately for installation by others.
Note: any exposed piping that is still filled with water at shutdown—including the makeup water line—should be electrically traced and insulated (by others).
INDOOR STORAGE TANK
With this type of system, water flows from an indoor tank, through the load system, and back to the tower, where it is cooled. The cooled water flows by gravity from the tower to the tank located in a heated space. At shutdown, all exposed water drains into the tank, where it is safe from freezing.
The amount of water needed to successfully operate the system depends on the tower size and GPM and on the volume of water contained in the piping system to and from the tower. You must select a tank large enough to contain those combined volumes—plus a level sufficient to maintain a flooded suction on your pump. Control makeup water according to the level where the tank stabilizes during operation.
MD Steel Cooling Tower — Engineering Data: Water Quality 39
The MD cooling tower can be a very effective air washer. Atmospheric dust able to pass through the relatively small louver openings will enter the recirculating water system. Increased concentrations can intensify systems maintenance by clogging screens and strainers—and smaller particulates can coat system heat transfer surfaces. In areas of low flow velocity—such as the collection basin—sedimentary deposits can provide a breeding ground for bacteria.
In areas prone to dust and sedimentation, you should consider installing some means for keeping the collection basin clean. Typical devices include side stream filters and a variety of filtration media.
BlOwdOwN
Blowdown or Bleedoff is the continuous removal of a small portion of the water from the open recirculating system. Blowdown is used to prevent the dissolved solids from concentrating to the point where they will form scale. The amount of blowdown required depends on the cooling range—the difference between the hot and cold water temperatures of the closed circuit— and the composition of the makeup water.
wATer TreATmeNT
To control the buildup of dissolved solids resulting from water evaporation, as well as airborne impurities and biological contaminants including Legionella, an effective consistent water treatment program is required. Simple blowdown may be adequate to control corrosion and scale, but biological contamination can only be controlled with biocides.
An acceptable water treatment program must be compatible with the variety of materials incorporated in a cooling tower—ideally the pH of the recirculating water should fall between 6.5 and 9.0. Batch feeding of the chemicals directly into the cooling tower is not a good practice since localized damage to the cooling tower is possible. Specific startup instructions and additional water quality recommendations can be found in the MD Cooling Tower User Manual which accompanies the cooling tower and also is available at spxcooling.com.
C A U T I O N
The cooling tower must be located at such distance
and direction to avoid the possibility of contaminated
discharge air being drawn into building fresh air
intake ducts. The purchaser should obtain the
services of a Licensed Professional Engineer or
Registered Architect to certify that the location of
the cooling tower is in compliance with applicable air
pollution, fire and clean air codes.
Specifications Specification Value
MD Steel Cooling Tower — Specifications: Base 40
1.0 Base:
1.1 Furnish and install an induced-draft, counterflow-type, factory assembled, film fill, industrial duty, cooling tower. Unit shall consist of _____ cell(s), as shown on plans. The limiting overall dimen-sions of the tower shall be _____ wide, _____ long, and _____ high. Total operat-ing power of all fans shall not exceed _____ hp, consisting of_____ @ _____ hp motor(s). Tower shall be similar and equal in all aspects to Marley Model _____________________.
2.0 Thermal Performance:
2.1 The tower shall be capable of cooling _____ GPM of water from ____ °F to _____ °F at a design entering air wet-bulb temperature of _____ °F. The thermal per-formance rating shall be Certified by the Cooling Technology Institute.
2.2 The tower shall be capable of minimum _____ GPM/hp efficiency at 95°F-85°F-75°F, per ASHRAE Standard 90.1.
3.0 Performance warranty:
3.1 CTI Certification notwithstanding, the cooling tower manufacturer shall guar-antee that the cooling tower supplied will meet the specified performance conditions when the tower is installed as shown on the plans. If, because of a sus-pected thermal performance deficiency, the owner chooses to conduct an on-site thermal performance test under the supervision of a qualified, disinterested third party in accordance with CTI or ASME standards during the first year of operation; and if the tower fails to perform within the limits of test tolerance; then the cooling tower manufacturer will pay for the cost of the test and will make such corrections as are appropriate and agree-able to the owner to compensate for the performance deficiency.
■ Your specification base establishes the type, configuration, base material, and physical limitations of the cooling tower to be quoted. During the planning and layout stages of your project, you will have focused your attention on a cool-ing tower selection that fits your space allotment, and whose power usage is acceptable. Limitations on physical size and total operating horsepower avoid the introduction of unforeseen operational and site-related influences. Specifying the number of cells, and the maximum fan hp/cell will work to your advantage. You are specifying a counterflow tower, which is a type noted—and often speci-fied—for its economical use of plan area. It effectively replaces most makes of older towers—both forced-draft and induced-draft—usually without major rede-sign of the existing site.
■ CTI Certification means that the cooling tower has been tested under operating
conditions and found to perform as rated by the manufacturer under those circumstanc-es. It assures the buyer that the tower is not intentionally or inadvertently undersized by the manufacturer. A list of CTI certified cool-ing towers can be found at cti.org.
■ The minimum efficiency per ASHRAE Standard 90.1 for induced draft open cool-ing towers applied to comfort cooling is 38.2 GPM/hp @ 95/85/75. There are no efficiency requirements for non-comfort cooling applications. If you want greater efficiency you can require it by specifying a higher ASHRAE Standard 90.1 GPM/hp. Each model's ASHRAE Standard 90.1 rating can be viewed in our online sizing and selection software at spxcooling.com/update.
■ CTI certification alone is not sufficient to assure you that the cooling tower will perform satisfactorily in your situation. Certification is established under relatively controlled conditions, and cooling towers seldom operate under such ideal circumstances. They are affected by nearby structures, machinery, enclo-sures, effluent from other sources, etc. Responsible and knowledgeable bidders will take such site-specific effects into consideration in selecting the cooling tower—but the specifier must insist by the written specification that the design-er/manufacturer guarantee this “real world” performance. Any reluctance on the part of the bidder should cause you some concern.
Specifications Specification Value
MD Steel Cooling Tower — Specifications: Base 41
4.0 design loading:
4.1 The tower structure, anchorage and all its components shall be designed by licensed professional engineers, employed by the manufacturer, per the International Building Code to withstand a wind load of 30 psf, as well as a .3g seismic load. Maintenance platforms and guardrails, where specified shall be capable of with-standing a 200 lb concentrated live load in any direction and shall be designed in accordance with OSHA guidelines.
5.0 Construction:
5.1 Except where otherwise specified, all components of the cooling tower shall be fabricated of heavy-gauge steel, protected against corrosion by G-235 galvaniz-ing. After passivation of the galvanized steel (8 weeks at pH 7-8, and calcium hardness and alkalinity at 100-300 ppm each), the cooling tower shall be capable of withstanding water having a pH of 6.5 to 9.0; a chloride content up to 500 ppm as NaCl (300 ppm as Cl-); a sulfate con-tent (as SO4) up to 250 ppm; a calcium content (as CaCO3) up to 500 ppm; silica (as SiO2) up to 150 ppm; and design hot water temperatures up to 130°F. The cir-culating water shall contain no oil, grease, fatty acids, or organic solvents.
Fiberglass casing, polyurethane barriers, and thermosetting hybrids and the com-ponents they are adhered to shall be con-sidered non-recyclable and not allowed.
5.2 The specifications, as written, are intend-ed to indicate those materials that will be capable of withstanding the above water quality in continuing service, as well as the loads described in paragraph 4.1. They are to be regarded as minimum requirements. Where component materials unique to individual tower designs are not specified, the manufacturers shall take the above water quality and load carrying capabilities into account in the selection of their materials of manufacture.
■ It is important to understand the distinction between structure and anchor-age. Specifying that only the anchorage meet these requirements means the tower can become non-functional, even fall down, yet remain attached to the foundation. Specifying structure will require the tower to remain operational. The indicated design values are the minimums allowed under accepted design standards. They give you assurance that the tower can be shipped, handled, hoisted—and ultimately operated in a normal cooling tower environment. Most MD models will withstand significantly higher wind and seismic loads. If your geographic location dictates higher wind load or seismic load values, please make the appropriate changes, after discussion with your Marley sales repre-sentative. Some countries and states, like Florida, require structure and anchorage to meet a given loading. Check with your local officials. 30 psf windload, .3g seismic load—applicable for most applications but consult the local code official for actual requirements. 60 psf live load, 200 lb concentrated load—ensures the tower can be safely accessed for routine maintenance when a guardrail is installed as well ensuring the end user complies with government safety laws.
■ In the history of cooling towers, no other coating for carbon steel has exhibited the success and longevity of galvanization in exposure to the normal cooling tower water quality defined at left. No paints or electrostatically-applied coat-ings, however exotic they may be, can approach galvanization's history of suc-cess. If extended longevity of the cooling tower is required—or unusually harsh operat-ing conditions are expected—consider specifying stainless steel as either the base construction material, or the material utilized for specific components of your choice. See Stainless Steel Options on page 45.

Specifications Specification Value
MD Steel Cooling Tower — Specifications: Base 42
6.0 mechanical equipment:
6.1 Fan(s) shall be propeller-type, incorporat-ing aluminum alloy blades attached to galvanized hubs with U-bolts. Blades shall be individually adjustable Fan(s) shall be driven through a one-piece multi-groove, solid back V-type belt, sheaves (pulleys), and tapered roller bearings. Bearings shall be rated at an L10 life of 100,000 hours, or greater. Both motor and fan sheaves (pulleys) shall be all cast aluminum to pre-vent premature corrosion.
6.1 (alternate)* Fan(s) shall be propeller-type, incorporating aluminum alloy blades attached to galvanized hubs with U-bolts. Blades shall be individually adjustable. Maximum fan tip speed shall be 13,000 ft/min. Fan(s) shall be driven through a right angle, industrial duty, oil lubricated, geared speed reducer that requires no oil changes for the first five (5) years of operation. All gearbox bearings shall be rated at an L10A service life of 100,000 hours or greater and the gear sets shall have AGMA Quality Class of 9 or greater. The gearbox shall include any modifica-tions to enable operation down to 10% of full speed. *Currently available on MD5016 and MD5018 models only.
6.2 Motor(s) shall be ____ hp maximum,
NEMA Premium Efficiency, TEFC, 1.15 service factor, variable torque, inverter duty and insulated for cooling tower duty. Speed and electrical characteristics shall be ______ RPM, single-winding, 3 phase, ____ hertz, ____ volts. Motor shall operate shaft-down position for belt drive towers and in the shaft-horizontal position for geardrive towers. Nameplate power shall not be exceeded at design operation. TEAO motors are not acceptable.
6.3 The complete mechanical equipment
assembly for each cell shall be supported by a rigid, hot-dip galvanized steel struc-tural support that resists misalignment between the motor and sheaves (pul-leys). For belt-drive towers with motors mounted outside the airstream, a pro-tective cover shall be mounted over the motor and sheave to protect it from the weather and prevent inadvertent contact. The mechanical equipment assembly shall
■ Propeller-type fans require only half the operating hp of blower-type fans. However, they should be readily adjustable to permit compensation for jobsite conditions. The Marley Power Belt drive system features all-aluminum sheaves, power band belts and long-life bearings for dependable service. TEFC motors offer additional benefits over TEAO motors whose only source of cooling is the flow of air produced by the cooling tower fan. This air rate is not always ideal due to motor position, blockage, variable speed operation, etc. TEFC ensures the motor will always be cooled properly. Unless otherwise specified, motor speed will be 1800 RPM in 60 Hertz areas and 1500 RPM in 50 Hertz areas on standard models. Low sound models will use motor speeds appropriate for the specific model. The value of a 5 year mechanical equipment warranty speaks for itself. Except for the motor, virtually all of the mechanical equipment on a Marley tower is designed and manufactured by SPX Cooling Technologies. Cooling tower ven-dors who purchase commercial fans, driveshafts, etc. may require that you deal directly with those commercial suppliers for warranty satisfaction.

Specifications Specification Value
MD Steel Cooling Tower — Specifications: Base 43
be warranted against any failure caused by defects in materials and workmanship for no less than five (5) years following the date of tower shipment. This warranty shall cover the fan(s), premium efficiency motor(s), speed reducer(s), drive shaft(s) and coupling(s), and the mechanical equipment support. The bearing assem-blies and V-belts shall be warranted for 18 months.
7.0 Fill, louvers and drift eliminators:
7.1 Fill shall be cross-corrugated, counterflow film type, thermoformed from 15 mil thick PVC. Fill shall be supported on channel sections supported from the tower struc-ture and have a flame spread rating less than 25.
7.2 Drift eliminators shall be 17 mil thick PVC with a minimum of three changes in air direction, and shall limit drift losses to 0.005% or less of the design water flow rate.
7.3 Air inlet louvers shall be a minimum of 5" air travel, triple pass PVC to limit water splashout and prevent direct sunlight from entering the collection basin. For ease of service and long life of louvers, PVC louvers shall be enclosed in a removable frame that attaches to the air inlet without tools. Louvers with less than three chang-es in air direction are unacceptable.
8.0 Hot water distribution System:
8.1 A pressured spray system shall distribute water evenly over the fill. The branch arms shall be corrosion resistant PVC with poly-propylene spray nozzles attached to the branch arms with a rubber socket con-nection for ease of removal and cleaning. To ensure proper spray system operation, nozzles shall seat in branch arms without regard for direction or alignment.
■ Fill modules can be removed for inspection and cleaning in accordance with local anti legioinella guidelines.
■ Drift rate varies with design water loading and air rate, as well as drift eliminator depth and number of directional changes. A drift rate of 0.001% is readily avail-able on many standard models. If a lower rate is required, please discuss with your Marley sales representative.
■ Triple-pass inlet louvers
■ The combination of PVC piping and polypropylene nozzles is very resistant to the build-up of scale and slime.

Specifications Specification Value
MD Steel Cooling Tower — Specifications: Base 44
9.0 Casing and Fan Guard:
9.1 The casing shall be heavy gauge G-235 galvanized steel and shall be capable of withstanding the loads described in para-graph 4.1. Casing panels shall encase the fill on all four sides of the tower. The top of the fan cylinder shall be equipped with a conical, non-sagging, removable fan guard, fabricated of welded 5/16" and 7 gauge rods, and hot dip galvanized after fabrication.
10.0 Access:
10.1 A large rectangular access door shall be located in the plenum on the motor side of the tower.
11.0 Cold water Collection Basin:
11.1 The collection basin shall be heavy-gauge galvanized steel and shall include the number and type of suction connec-tions required to accommodate the out-flow piping system shown on the plans. Suction connections shall be equipped with debris screens. A factory installed, float operated, mechanical make-up valve shall be included. An overflow and drain connection shall be provided in each cell of the tower. The basin floor shall slope toward the drain to allow complete flush out of debris and silt which may accumu-late. Towers of more than one cell shall include steel flumes for flow and equaliza-tion between cells.
13.0 warranty:
13.1 The MD cooling tower shall be free from defects in materials and workmanship for a period of eighteen (18) months from the date of shipment.
■ The MD tower design offers side-suction as standard. Bottom outlets may be supplied to accommodate a variety of piping schemes. Unless so specified, the tower you may be asked to approve may only be available with one type of suc-tion connection requiring you to redesign your piping layout. The sloping floor and low-level drain is valuable because it provides a way to achieve flush-out cleanability.
Specifications Specification Value
MD Steel Cooling Tower — Specifications: Options 45
Stainless Steel Options
Stainless Steel Collection Basin:
11.1 Replace paragraph 11.1 with the follow-ing: The collection basin shall be welded 301L stainless steel construction. Only low-carbon stainless steel alloys will be accepted in order to minimize the risk of intergranular corrosion in the weld zones. The basin shall include the number and type of suction connections required to accommodate the out-flow piping system shown on the plans. Basin suction con-nections shall be equipped with debris screens. A factory installed, float oper-ated, mechanical make-up valve shall be included. An overflow and drain connec-tion shall be provided in each cell of the tower. The basin floor shall slope toward the drain to allow complete flush out of debris and silt which may accumulate.
All Stainless Cooling Tower:
5.1 Replace paragraph 5.1 with the follow-ing: Except where otherwise specified, all components of the cooling tower shall be fabricated of heavy-gauge, series 301L stainless steel. Only low-carbon stainless steel alloys will be accepted in order to minimize the risk of intergranular corro-sion in the weld zones. The tower shall be capable of withstanding water having a chloride content (NaCl) up to 750 ppm; a sulfate content (SO4) up to 1200 ppm; a calcium content (CaCO3) up to 800 ppm; silica (SiO2) up to 150 ppm; and design hot water temperatures up to 135°F. The circulating water shall contain no oil, grease, fatty acids, or organic solvents.
■ The cold water basin is the only part of the tower that is subject to periods of stagnant water, concentrated with treatment chemicals and customary contami-nants. It is also the most expensive and difficult part of any tower to repair or replace. For these reasons, many customers—particularly those who are replac-ing older towers—choose to specify stainless steel cold water basins.
■ The 316 alloy was designed to increase resistance to chlorides. Generally, cooling towers in HVAC service utilize water sources, which do not approach the limits of 300 series stainless, even up to several cycles of concentration. Industrial cooling towers, generally circulating more aggressive water, use 300 series stainless as standard metallurgy, upgrading to 316 for situations such as estuary water or other significant source of chlorides. The vast majority of cooling tower water sources result in an acceptable environment for 300 series stainless steel, with HVAC systems typically being on the mild end of the spec-trum. If you have one of the rare instances where water quality exceeds 900 ppm Cl, talk to you Marley sales representative about 316SS.
■ Where water quality falls outside the limits indicated in Paragraph 5.1, an all-stainless tower is worthy of your consideration. For pure resistance to cor-rosion—coupled with the capability to meet stringent fire and building codes—there is no substitute for stainless steel. No paints or electostatically-applied coatings, however exotic they may be, can match stainless steel's ability to with-stand adverse operating conditions.
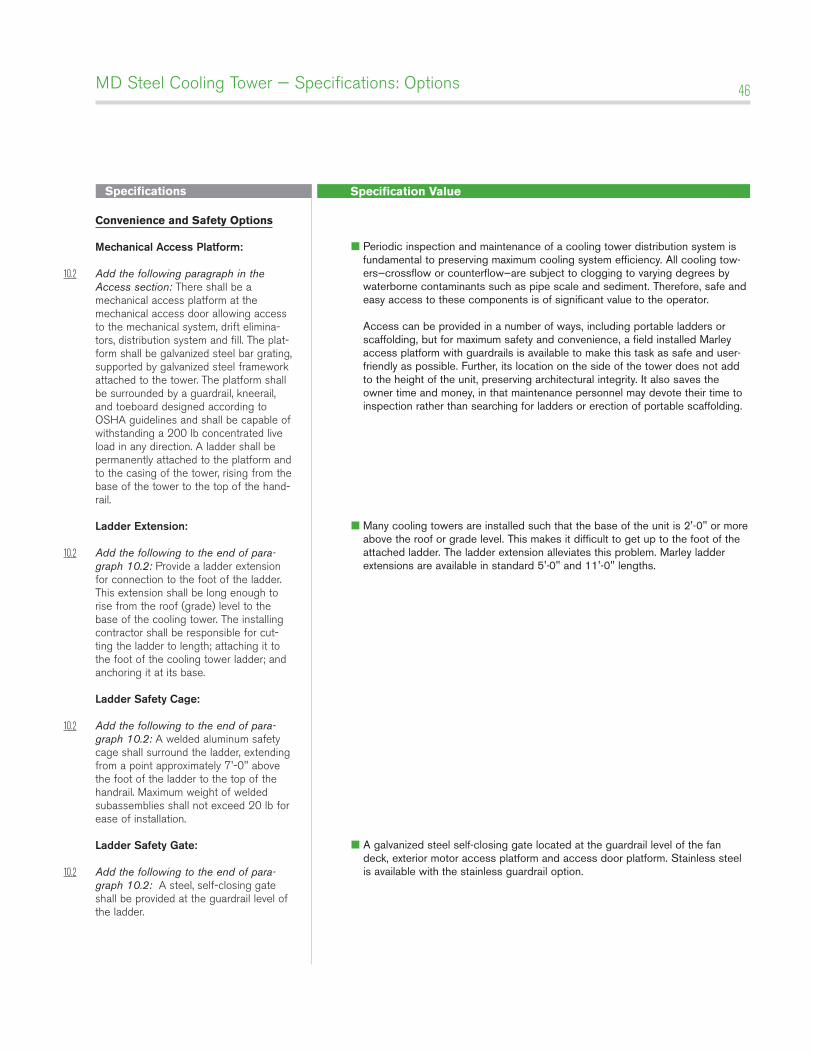
Specifications Specification Value
MD Steel Cooling Tower — Specifications: Options 46
Convenience and Safety Options
mechanical Access Platform:
10.2 Add the following paragraph in the Access section: There shall be a mechanical access platform at the mechanical access door allowing access to the mechanical system, drift elimina-tors, distribution system and fill. The plat-form shall be galvanized steel bar grating, supported by galvanized steel framework attached to the tower. The platform shall be surrounded by a guardrail, kneerail, and toeboard designed according to OSHA guidelines and shall be capable of withstanding a 200 lb concentrated live load in any direction. A ladder shall be permanently attached to the platform and to the casing of the tower, rising from the base of the tower to the top of the hand-rail.
ladder extension:
10.2 Add the following to the end of para-graph 10.2: Provide a ladder extension for connection to the foot of the ladder. This extension shall be long enough to rise from the roof (grade) level to the base of the cooling tower. The installing contractor shall be responsible for cut-ting the ladder to length; attaching it to the foot of the cooling tower ladder; and anchoring it at its base.
ladder Safety Cage:
10.2 Add the following to the end of para-graph 10.2: A welded aluminum safety cage shall surround the ladder, extending from a point approximately 7'-0" above the foot of the ladder to the top of the handrail. Maximum weight of welded subassemblies shall not exceed 20 lb for ease of installation.
ladder Safety Gate:
10.2 Add the following to the end of para-graph 10.2: A steel, self-closing gate shall be provided at the guardrail level of the ladder.
■ Periodic inspection and maintenance of a cooling tower distribution system is fundamental to preserving maximum cooling system efficiency. All cooling tow-ers—crossflow or counterflow—are subject to clogging to varying degrees by waterborne contaminants such as pipe scale and sediment. Therefore, safe and easy access to these components is of significant value to the operator. Access can be provided in a number of ways, including portable ladders or scaffolding, but for maximum safety and convenience, a field installed Marley access platform with guardrails is available to make this task as safe and user-friendly as possible. Further, its location on the side of the tower does not add to the height of the unit, preserving architectural integrity. It also saves the owner time and money, in that maintenance personnel may devote their time to inspection rather than searching for ladders or erection of portable scaffolding.
■ Many cooling towers are installed such that the base of the unit is 2'-0" or more above the roof or grade level. This makes it difficult to get up to the foot of the attached ladder. The ladder extension alleviates this problem. Marley ladder extensions are available in standard 5'-0" and 11'-0" lengths.
■ A galvanized steel self-closing gate located at the guardrail level of the fan deck, exterior motor access platform and access door platform. Stainless steel is available with the stainless guardrail option.

Specifications Specification Value
MD Steel Cooling Tower — Specifications: Options 47
motor davit:
10.4 Add the following paragraph in the Access section: A powder coated davit crane with hot dipped galvanized mount-ing base shall be field installed on the motor face of the cooling tower and shall have a maximum capacity of 500 lb.
motor and Fan davit:
10.4 Add the following paragraph in the Access section: A powder coated davit crane with hot dipped galvanized mount-ing base shall be field installed on the motor face of the cooling tower. The davit shall have maximum capacity of 500 lbs at a 5"-6 boom extension and 1000 lbs at a 3'-0 boom extension.
Control Options
Fan motor Starter Control Panel:
6.4 Add the following paragraph in the Mechanical Equipment section: Each cell of the cooling tower shall be equipped with a UL / CUL 508 listed control panel in a NEMA 3R or 4X outdoor enclosure capable of controlling single-speed or two-speed motors as required, and designed specifically for cooling tower applications. The panel shall include a main circuit breaker or main fused discon-nect with an external operating handle, lockable in the off position for safety. Full voltage non-reversing magnetic starter shall be controlled with a thermostatic or solid-state temperature controller. Door mounted selector switches shall be provided to enable automatic or manual control and wired for 120VAC control. Control circuit to be wired out to terminal blocks for field connection to a remote vibration switch, overload trip alarms and remote temperature control devices. The temperature controller shall be adjustable for the required cold-water temperature. If a thermostatic controller is used it shall be mounted on the side of the tower with the temperature sensing bulb installed in the cold water basin using a suspension mounting bracket. If a solid-state tem-perature controller is used the controller will be door mounted on the control panel. The solid-state temperature controller will
■ Simplify the removal of the fan motor when required. If you would prefer stain-less steel construction change powder coated and hot dipped galvanized to stainless steel in the description. Available with this option is a zinc plated hand crank winch with 45'-0 of 3/16" diameter galvanized aircraft cable with swivel hook with swaged ball fitting.
■ Simplify the removal of the fan motor or fan assemble when required. If you would prefer stainless steel construction change powder coated and hot dipped galvanized to stainless steel in the description. Available with this option is a zinc plated hand crank winch with 60'-0 of 1/4" diameter galvanized aircraft cable with swivel hook and swaged ball fitting. Also available with this options is a 115V electric winch with a 6'-0 pendant control. Includes 60'-0 of 1/4" diameter galvanized aircraft cable with swivel hook with swaged ball fitting.
■ If it is your opinion that the control system for the cooling tower be part of the cooling tower manufacturer’s responsibility, we are in wholehearted agreement with you. Who better to determine the most efficient mode and manner of a cooling tower’s operation—and to apply a system most compatible with it—than the designer and manufacturer of the cooling tower? Marley variable speed drives are also available for the ultimate in temperature control, energy management, and mechanical equipment longevity.
➠

Specifications Specification Value
MD Steel Cooling Tower — Specifications: Options 48
display two temperatures, one for outgo-ing water and the other for set point. Water temperature input shall be obtained using a three-wire RTD with dry well in the outlet water piping and wired back to the solid-state temperature controller in the control panel.
Vibration Limit Switch:
6.5 Add the following paragraph in the Mechanical Equipment section: A vibra-tion limit switch in a NEMA 4 housing shall be installed on the mechanical equipment support and wired to the shut-down circuit of the fan motor starter or VFD. The purpose of this switch will be to interrupt control power voltage to a safety circuit in the event of excessive vibration causing the starter or VFD equipment to de-energize the motor. It shall be adjust-able for sensitivity, and include a means to reset the switch.
Basin Heater:
11.2 Add the following paragraph in the Cold Water Basin section: Provide a system of electric immersion heaters and con-trols for each cell of the tower to prevent freezing of water in the collection basin during periods of shutdown. The system shall consist of one or more stainless steel electric immersion heaters installed in threaded couplings provided in the side of the basin. A NEMA 4 enclosure shall house a magnetic contactor to energize heaters; a transformer to provide 24-volt control circuit power; and a solid-state cir-cuit board for temperature and low water cut-off. A control probe shall be located in the basin to monitor water level and tem-perature. The system shall be capable of maintaining 40°F water temperature at an ambient air temperature of _____ °F.
water level Control System:
11.2 Add the following paragraph to the Cold Water Basin section: Provide a water level control system including a NEMA 4X control panel, water level probes and probe stilling chamber. The control system shall monitor the water level in the cold-water basin to determine level events used for cold-water make-up, high and low alarms or pump shut down. The
■ Unless specified otherwise, a Marley M-5 vibration switch will be provided. The requirement for manual reset assures that the cooling tower will be visited to determine the cause of excessive vibration.
■ The Marley basin heater components described at left represent our recommendation for a reliable automatic system for the prevention of basin freezing. They are normally shipped separately for installation at the jobsite by the install-ing contractor. When purchased in conjunction with the enhanced Control System option, however, they are customarily factory-mounted and tested. Submerged in basin water, in which zinc ions are present, copper immersion heaters must not be used. Insist upon stainless steel. The ambient air temperature that you insert in the specifications should be the lowest 1% level of winter temperature prevalent at site.
■ Solid-state liquid level controls provide you with state of the art systems to con-trol and monitor the water level in your cooling tower collection basin. Relays operating in conjunction with suspended stainless steel electrode probes monitor basin water levels, providing simple solenoid-valve water makeup or discrete on/off signals to more sophisticated automation controls. Optional con-figurations might include makeup along with high and low water level alarm and cutoff, or pump cutoff. Packaged systems including any of these variations are available. Consult you Marley sales representative or download a copy of ACC-NC-9D from spxcooling.com for additional information.
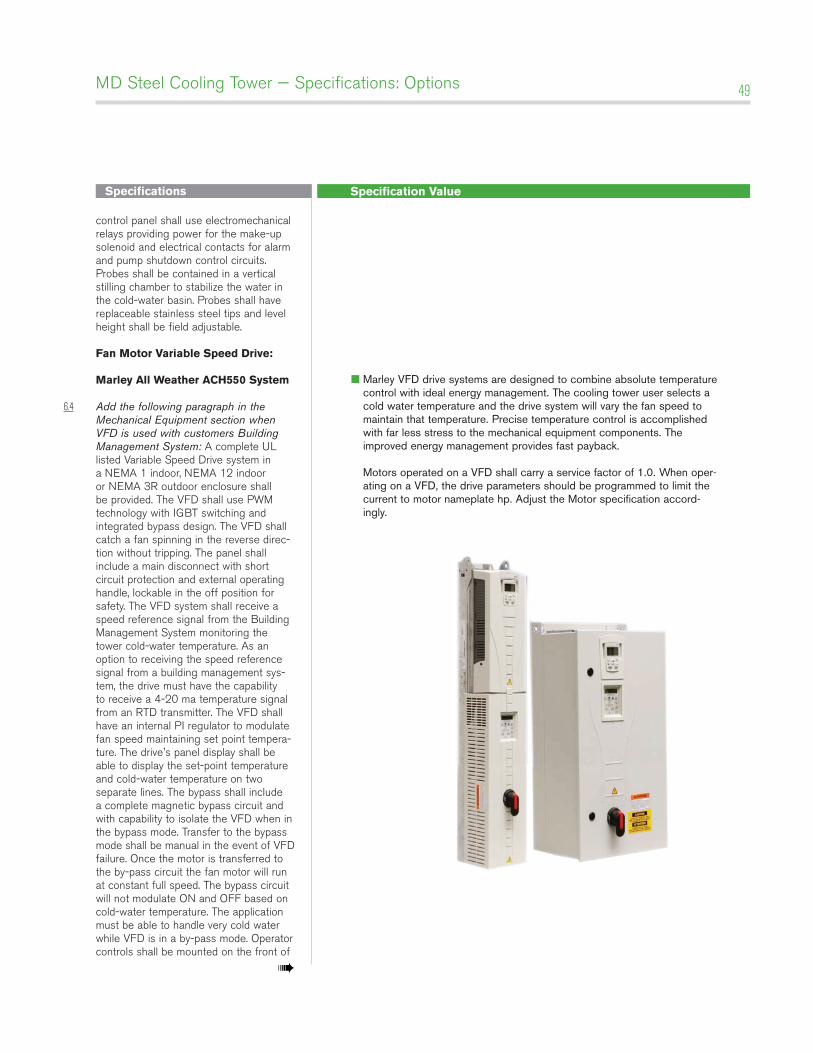
Specifications Specification Value
MD Steel Cooling Tower — Specifications: Options 49
control panel shall use electromechanical relays providing power for the make-up solenoid and electrical contacts for alarm and pump shutdown control circuits. Probes shall be contained in a vertical stilling chamber to stabilize the water in the cold-water basin. Probes shall have replaceable stainless steel tips and level height shall be field adjustable.
Fan Motor Variable Speed Drive:
Marley All Weather ACH550 System
6.4 Add the following paragraph in the Mechanical Equipment section when VFD is used with customers Building Management System: A complete UL listed Variable Speed Drive system in a NEMA 1 indoor, NEMA 12 indoor or NEMA 3R outdoor enclosure shall be provided. The VFD shall use PWM technology with IGBT switching and integrated bypass design. The VFD shall catch a fan spinning in the reverse direc-tion without tripping. The panel shall include a main disconnect with short circuit protection and external operating handle, lockable in the off position for safety. The VFD system shall receive a speed reference signal from the Building Management System monitoring the tower cold-water temperature. As an option to receiving the speed reference signal from a building management sys-tem, the drive must have the capability to receive a 4-20 ma temperature signal from an RTD transmitter. The VFD shall have an internal PI regulator to modulate fan speed maintaining set point tempera-ture. The drive's panel display shall be able to display the set-point temperature and cold-water temperature on two separate lines. The bypass shall include a complete magnetic bypass circuit and with capability to isolate the VFD when in the bypass mode. Transfer to the bypass mode shall be manual in the event of VFD failure. Once the motor is transferred to the by-pass circuit the fan motor will run at constant full speed. The bypass circuit will not modulate ON and OFF based on cold-water temperature. The application must be able to handle very cold water while VFD is in a by-pass mode. Operator controls shall be mounted on the front of
■ Marley VFD drive systems are designed to combine absolute temperature control with ideal energy management. The cooling tower user selects a cold water temperature and the drive system will vary the fan speed to maintain that temperature. Precise temperature control is accomplished with far less stress to the mechanical equipment components. The improved energy management provides fast payback. Motors operated on a VFD shall carry a service factor of 1.0. When oper-ating on a VFD, the drive parameters should be programmed to limit the current to motor nameplate hp. Adjust the Motor specification accord-ingly.
➠
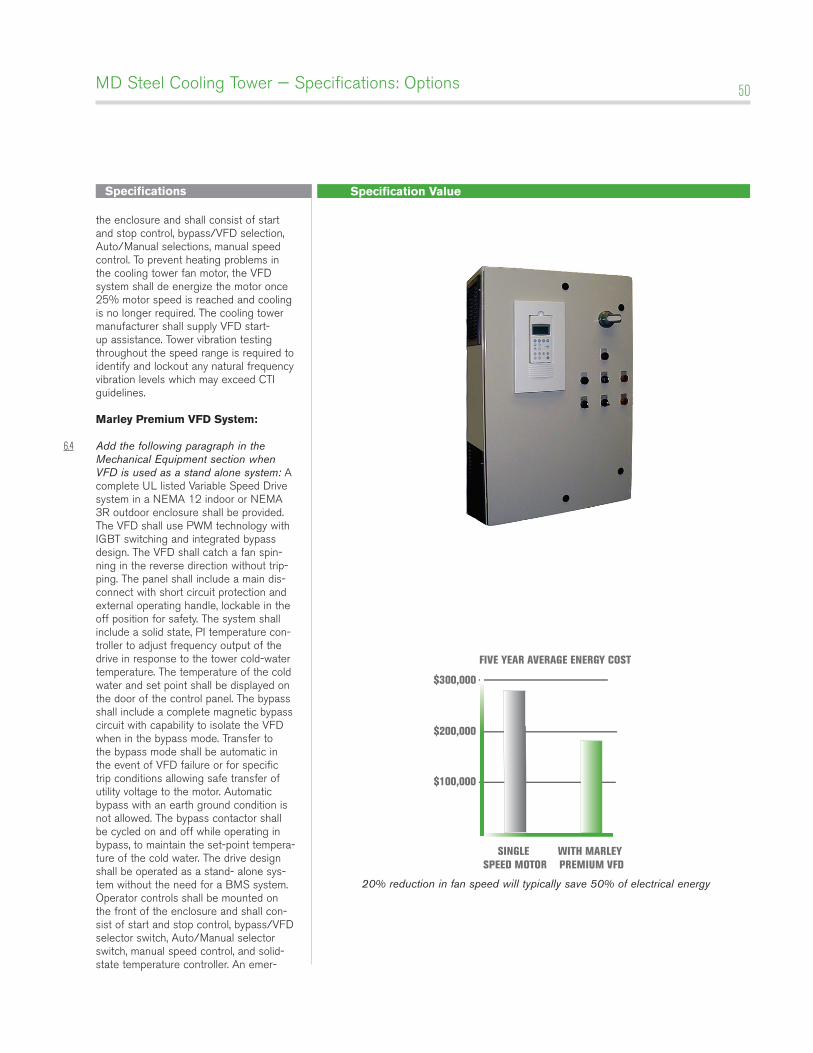
Specifications Specification Value
MD Steel Cooling Tower — Specifications: Options 50
the enclosure and shall consist of start and stop control, bypass/VFD selection, Auto/Manual selections, manual speed control. To prevent heating problems in the cooling tower fan motor, the VFD system shall de energize the motor once 25% motor speed is reached and cooling is no longer required. The cooling tower manufacturer shall supply VFD start-up assistance. Tower vibration testing throughout the speed range is required to identify and lockout any natural frequency vibration levels which may exceed CTI guidelines.
Marley Premium VFD System:
6.4 Add the following paragraph in the Mechanical Equipment section when VFD is used as a stand alone system: A complete UL listed Variable Speed Drive system in a NEMA 12 indoor or NEMA 3R outdoor enclosure shall be provided. The VFD shall use PWM technology with IGBT switching and integrated bypass design. The VFD shall catch a fan spin-ning in the reverse direction without trip-ping. The panel shall include a main dis-connect with short circuit protection and external operating handle, lockable in the off position for safety. The system shall include a solid state, PI temperature con-troller to adjust frequency output of the drive in response to the tower cold-water temperature. The temperature of the cold water and set point shall be displayed on the door of the control panel. The bypass shall include a complete magnetic bypass circuit with capability to isolate the VFD when in the bypass mode. Transfer to the bypass mode shall be automatic in the event of VFD failure or for specific trip conditions allowing safe transfer of utility voltage to the motor. Automatic bypass with an earth ground condition is not allowed. The bypass contactor shall be cycled on and off while operating in bypass, to maintain the set-point tempera-ture of the cold water. The drive design shall be operated as a stand- alone sys-tem without the need for a BMS system. Operator controls shall be mounted on the front of the enclosure and shall con-sist of start and stop control, bypass/VFD selector switch, Auto/Manual selector switch, manual speed control, and solid-state temperature controller. An emer-
WITH MARLEY PREMIUM VFD
SINGLE SPEED MOTOR
$300,000
$100,000
FIVE YEAR AVERAGE ENERGY COST
$200,000
20% reduction in fan speed will typically save 50% of electrical energy

Specifications Specification Value
MD Steel Cooling Tower — Specifications: Options 51
■ Where it is your intention to be able to operate both cells of the tower while the flume cover plate is installed, separate outlet connections, float valves and overflows must be provided for each cell. Likewise, this would require separate sensors and controls for basin heater systems, if installed.
■ Extensions are available in nominal 1'-0" increments to a maximum height that varies by model. Such extensions may be considered necessary in order to elevate the discharge beyond the bounds of an enclosure. Discuss applicability with your local Marley sales representative.
gency bypass selector switch internal to the panel allowing the cooling tower fan motor to be run at full speed shall be fur-nished. To prevent heating problems in the cooling tower fan motor, the VFD system shall de energize the motor once 25% motor speed is reached and cooling is no longer required. The VFD shall include de-icing logic with auto canceling and adjustable time. Speed in De-Ice mode shall not exceed 50 % motor speed. The cooling tower manufacturer shall supply VFD start-up assistance. Tower vibration testing throughout the speed range is required to identify and lockout any natu-ral frequency vibration levels which may exceed CTI guidelines.
miscellaneous Options
Equalizer Flume Weir Gates:
11.2 Add the following paragraph under Cold Water Collection Basin: The intercon-necting flume between cells shall be equipped with a removable cover plate to permit the shutdown of one cell for main-tenance purposes, or to permit indepen-dent cell operation.
Fan Cylinder extensions:
9.1 Insert the following before the last sen-tence: Fan cylinder extensions shall be provided to elevate the fan discharge to a height of ___ ft above the fan deck level.
Basin Sweeper Piping:
11.2 Add the following paragraph to the Cold Water Collection Basin section: The cold water basin shall be equipped with factory installed corrosion resistant PVC sweeper piping with plastic nozzles. The sweeper piping system shall be designed to force dirt and debris towards a dedicated drain in the depressed section of the collection basin.
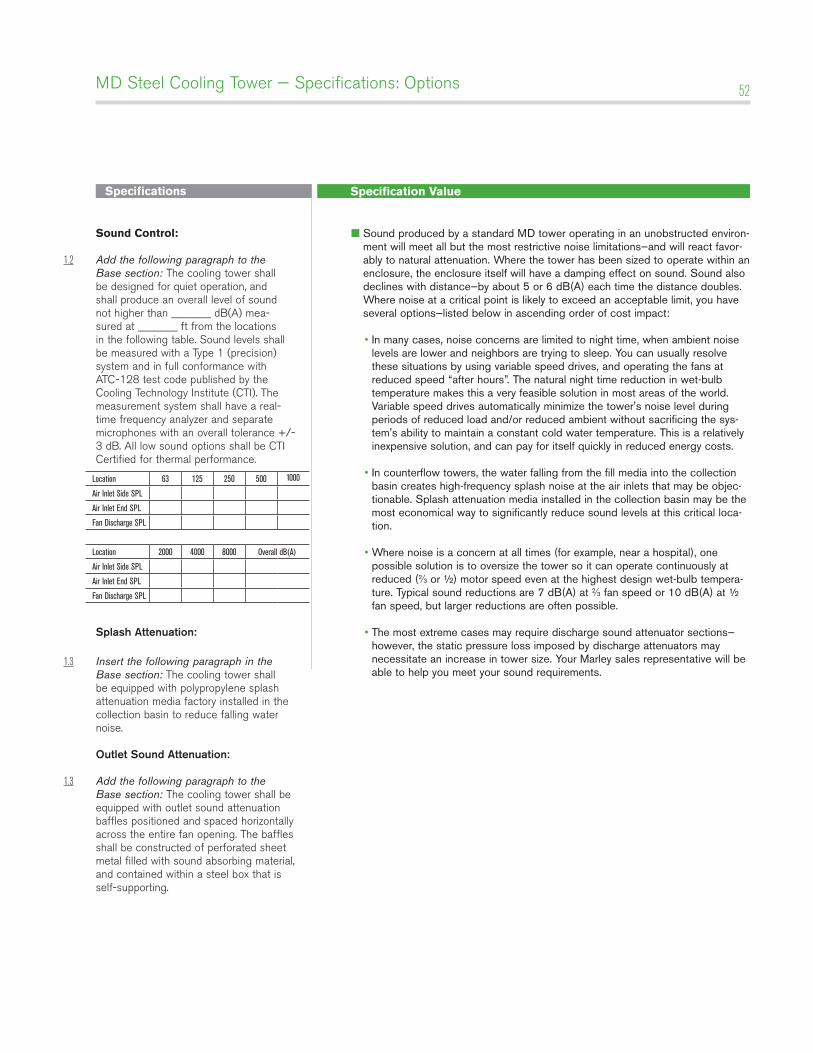
Specifications Specification Value
MD Steel Cooling Tower — Specifications: Options 52
■ Sound produced by a standard MD tower operating in an unobstructed environ-ment will meet all but the most restrictive noise limitations—and will react favor-ably to natural attenuation. Where the tower has been sized to operate within an enclosure, the enclosure itself will have a damping effect on sound. Sound also declines with distance—by about 5 or 6 dB(A) each time the distance doubles. Where noise at a critical point is likely to exceed an acceptable limit, you have several options—listed below in ascending order of cost impact:
• In many cases, noise concerns are limited to night time, when ambient noise levels are lower and neighbors are trying to sleep. You can usually resolve these situations by using variable speed drives, and operating the fans at reduced speed “after hours”. The natural night time reduction in wet-bulb temperature makes this a very feasible solution in most areas of the world. Variable speed drives automatically minimize the tower's noise level during periods of reduced load and/or reduced ambient without sacrificing the sys-tem's ability to maintain a constant cold water temperature. This is a relatively inexpensive solution, and can pay for itself quickly in reduced energy costs.
• In counterflow towers, the water falling from the fill media into the collection basin creates high-frequency splash noise at the air inlets that may be objec-tionable. Splash attenuation media installed in the collection basin may be the most economical way to significantly reduce sound levels at this critical loca-tion.
• Where noise is a concern at all times (for example, near a hospital), one possible solution is to oversize the tower so it can operate continuously at reduced (2⁄3 or ½) motor speed even at the highest design wet-bulb tempera-ture. Typical sound reductions are 7 dB(A) at 2⁄3 fan speed or 10 dB(A) at ½ fan speed, but larger reductions are often possible.
• The most extreme cases may require discharge sound attenuator sections—however, the static pressure loss imposed by discharge attenuators may necessitate an increase in tower size. Your Marley sales representative will be able to help you meet your sound requirements.
Sound Control:
1.2 Add the following paragraph to the Base section: The cooling tower shall be designed for quiet operation, and shall produce an overall level of sound not higher than _______ dB(A) mea-sured at _______ ft from the locations in the following table. Sound levels shall be measured with a Type 1 (precision) system and in full conformance with ATC-128 test code published by the Cooling Technology Institute (CTI). The measurement system shall have a real-time frequency analyzer and separate microphones with an overall tolerance +/- 3 dB. All low sound options shall be CTI Certified for thermal performance.
Splash Attenuation:
1.3 Insert the following paragraph in the Base section: The cooling tower shall be equipped with polypropylene splash attenuation media factory installed in the collection basin to reduce falling water noise.
Outlet Sound Attenuation:
1.3 Add the following paragraph to the Base section: The cooling tower shall be equipped with outlet sound attenuation baffles positioned and spaced horizontally across the entire fan opening. The baffles shall be constructed of perforated sheet metal filled with sound absorbing material, and contained within a steel box that is self-supporting.
Location 63 125 250 500 1000
Air Inlet Side SPL
Air Inlet End SPL
Fan Discharge SPL
Location 2000 4000 8000 Overall dB(A)
Air Inlet Side SPL
Air Inlet End SPL
Fan Discharge SPL
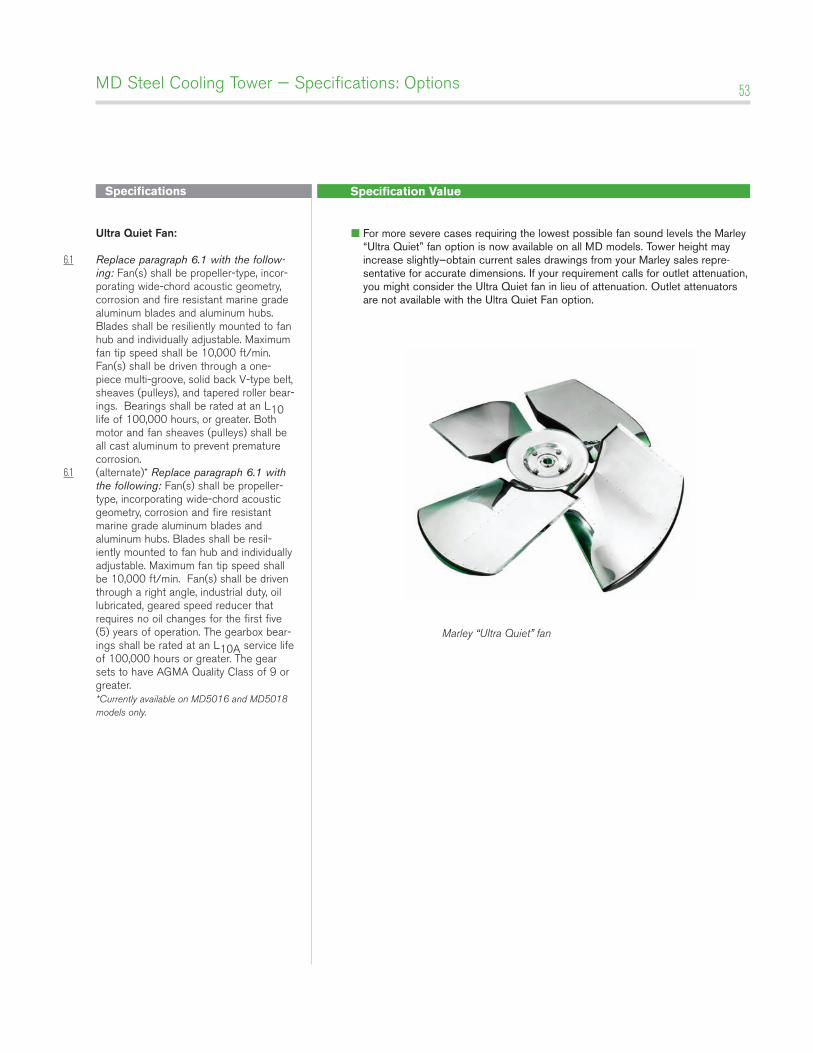
Specifications Specification Value
MD Steel Cooling Tower — Specifications: Options 53
Ultra Quiet Fan:
6.1 Replace paragraph 6.1 with the follow-ing: Fan(s) shall be propeller-type, incor-porating wide-chord acoustic geometry, corrosion and fire resistant marine grade aluminum blades and aluminum hubs. Blades shall be resiliently mounted to fan hub and individually adjustable. Maximum fan tip speed shall be 10,000 ft/min. Fan(s) shall be driven through a one-piece multi-groove, solid back V-type belt, sheaves (pulleys), and tapered roller bear-ings. Bearings shall be rated at an L10 life of 100,000 hours, or greater. Both motor and fan sheaves (pulleys) shall be all cast aluminum to prevent premature corrosion.
6.1 (alternate)* Replace paragraph 6.1 with the following: Fan(s) shall be propeller-type, incorporating wide-chord acoustic geometry, corrosion and fire resistant marine grade aluminum blades and aluminum hubs. Blades shall be resil-iently mounted to fan hub and individually adjustable. Maximum fan tip speed shall be 10,000 ft/min. Fan(s) shall be driven through a right angle, industrial duty, oil lubricated, geared speed reducer that requires no oil changes for the first five (5) years of operation. The gearbox bear-ings shall be rated at an L10A service life of 100,000 hours or greater. The gear sets to have AGMA Quality Class of 9 or greater. *Currently available on MD5016 and MD5018 models only.
Marley “Ultra Quiet” fan
■ For more severe cases requiring the lowest possible fan sound levels the Marley “Ultra Quiet” fan option is now available on all MD models. Tower height may increase slightly—obtain current sales drawings from your Marley sales repre-sentative for accurate dimensions. If your requirement calls for outlet attenuation, you might consider the Ultra Quiet fan in lieu of attenuation. Outlet attenuators are not available with the Ultra Quiet Fan option.
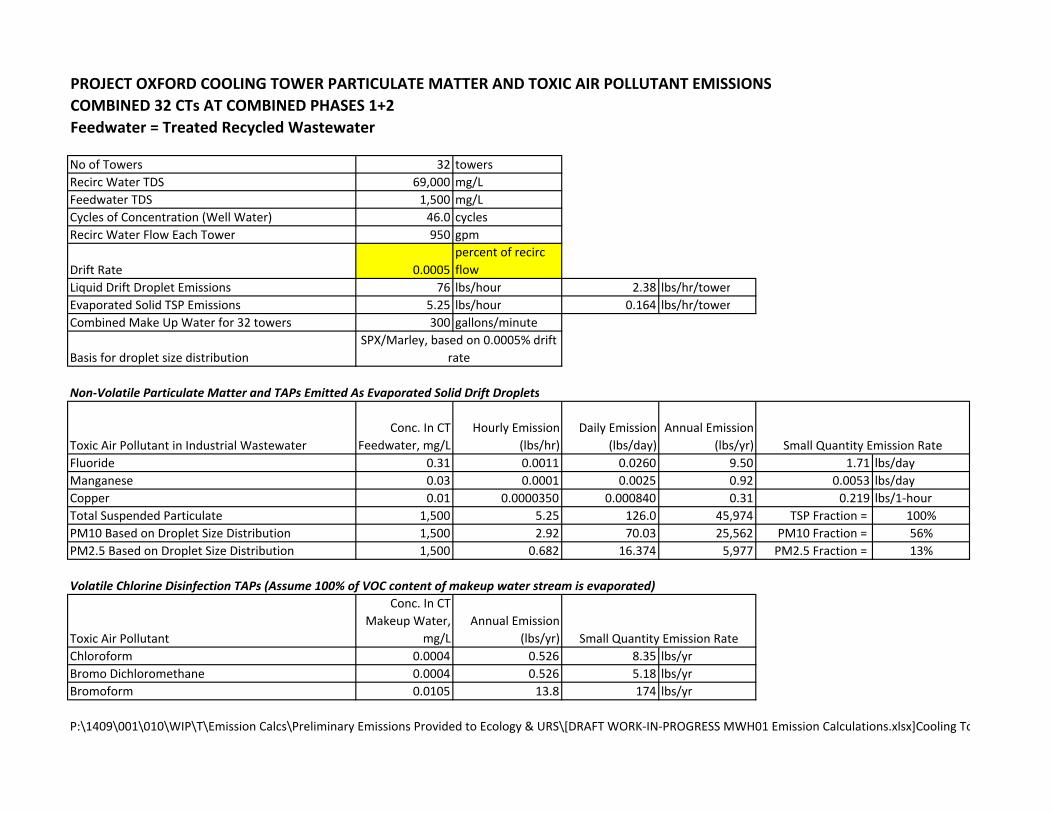
PROJECT OXFORD COOLING TOWER PARTICULATE MATTER AND TOXIC AIR POLLUTANT EMISSIONSCOMBINED 32 CTs AT COMBINED PHASES 1+2Feedwater = Treated Recycled Wastewater
No of Towers 32 towersRecirc Water TDS 69,000 mg/LFeedwater TDS 1,500 mg/LCycles of Concentration (Well Water) 46.0 cyclesRecirc Water Flow Each Tower 950 gpm
Drift Rate 0.0005percent of recirc flow
Liquid Drift Droplet Emissions 76 lbs/hour 2.38 lbs/hr/towerEvaporated Solid TSP Emissions 5.25 lbs/hour 0.164 lbs/hr/towerCombined Make Up Water for 32 towers 300 gallons/minute
Basis for droplet size distribution
Non‐Volatile Particulate Matter and TAPs Emitted As Evaporated Solid Drift Droplets
Toxic Air Pollutant in Industrial WastewaterConc. In CT
Feedwater, mg/LHourly Emission
(lbs/hr)Daily Emission
(lbs/day)Annual Emission
(lbs/yr)Fluoride 0.31 0.0011 0.0260 9.50 1.71 lbs/dayManganese 0.03 0.0001 0.0025 0.92 0.0053 lbs/dayCopper 0.01 0.0000350 0.000840 0.31 0.219 lbs/1‐hourTotal Suspended Particulate 1,500 5.25 126.0 45,974 TSP Fraction = 100%PM10 Based on Droplet Size Distribution 1,500 2.92 70.03 25,562 PM10 Fraction = 56%PM2.5 Based on Droplet Size Distribution 1,500 0.682 16.374 5,977 PM2.5 Fraction = 13%
Volatile Chlorine Disinfection TAPs (Assume 100% of VOC content of makeup water stream is evaporated)
Toxic Air Pollutant
Conc. In CT Makeup Water,
mg/LAnnual Emission
(lbs/yr)Chloroform 0.0004 0.526 8.35 lbs/yrBromo Dichloromethane 0.0004 0.526 5.18 lbs/yrBromoform 0.0105 13.8 174 lbs/yr
P:\1409\001\010\WIP\T\Emission Calcs\Preliminary Emissions Provided to Ecology & URS\[DRAFT WORK‐IN‐PROGRESS MWH01 Emission Calculations.xlsx]Cooling To
Small Quantity Emission Rate
Small Quantity Emission Rate
SPX/Marley, based on 0.0005% drift rate

Table E3: IWTP Effluent Analysis. One twenty-four hour composite sample was taken each day on seven separate days.
Parameter 1/23/2008 1/24/2008 1/25/2008 1/28/2008 1/29/2008 1/30/2008 1/31/2008 Average Units PQL Method
Alkalinity 571 569 568 570 571 569 567 569.29 mg/L 10 SM2320BAluminum 0.0138 0.0148 0.0149 0.0201 0.0166 0.0135 0.0134 0.02 mg/L 0.01 EPA 200.8NH3-N 0.401 0.577 0.397 0.467 0.433 0.442 0.572 0.47 mg/L 0.05 SM4500NH3GFecal Coliform 13 1600 220 220 140 500 500 456.14 MPN/100mL 2 SM9221ETotal Coliform 80 1600 300 500 500 500 500 568.57 MPN/100mL 2 SM9221BBarium 0.0199 0.0226 0.0213 0.0238 0.0249 0.0245 0.0248 0.02 mg/L 0.001 EPA 200.8Bicarbonate 571 569 568 570 571 569 567 569.29 mg/L 10 SM2320BBOD 5.1 5.45 5.09 4.02 4.22 4.57 3.9 4.62 mg/L 2 SM5210BBoron 0.0295 0.0331 0.034 0.0356 0.0448 0.0462 0.0451 0.04 mg/L 0.01 EPA 200.8Bromide ND ND ND ND ND ND ND mg/L 0.1 EPA 300.0Cadmium ND ND ND ND ND ND ND mg/L 0.001 EPA 200.8Calcium 43.3 47.3 42.6 43.4 46 46.1 44.5 44.74 mg/L 0.01 EPA 200.8Carbonate ND ND ND ND ND ND ND mg/L 10 SM2320BChloride 286 296 273 274 291 289 261 281.43 mg/L 2 EPA 300.0Chromium ND ND ND ND ND ND ND mg/L 0.001 EPA 200.8COD 38.1 12.1 32 39.3 29 39.4 34 31.99 mg/L 5 EPA 410.4Conductivity 2080 2160 2130 2160 2173 2153 2194 2,150.00 μmhos/cm 10 SM2510BCopper 0.00256 0.00313 0.00276 0.00288 0.00926 0.00715 0.012 0.01 mg/L 0.001 EPA 200.8Fluoride 0.371 0.34 0.352 0.221 0.319 0.22 0.323 0.31 mg/L 0.1 EPA 300.0Hardness 209 227 206 213 218 223 215 215.86 mg/L 1 EPA 200.8Magnesium 24.4 26.3 24.1 25.4 25.1 26.1 25.1 25.21 mg/L 0.1 EPA 200.8Iron 0.0479 0.0606 0.0594 0.061 0.0704 0.0591 0.0453 0.06 mg/L 0.01 EPA 200.8Lead ND ND ND ND ND ND ND mg/L 0.001 EPA 200.8Lithium ND ND ND ND ND ND ND mg/L 0.001 EPA 200.8Manganese 0.0142 0.0257 0.0254 0.0296 0.0421 0.0378 0.0369 0.03 mg/L 0.001 EPA 200.8Molybdenum 0.00128 0.00116 0.0011 0.00109 ND ND ND mg/L 0.001 EPA 200.8Nickel ND ND ND ND ND ND ND mg/L 0.001 EPA 200.8NO3/N 4.67 1.65 0.975 0.95 0.305 0.206 0.482 1.32 mg/L 0.1 EPA 300.0NO2/N ND ND ND ND ND ND ND mg/L 0.1 EPA 300.0pH 7.91 7.86 7.87 7.98 7.76 7.95 7.94 7.90 ph Units EPA 150.1PO4/P 4.95 1.89 5.2 1.11 1.85 2.79 1.22 2.72 mg/L 0.05 EPA 300.0Potassium 249 279 246 274 315 362 353 296.86 mg/L 0.01 EPA 200.8Silica (as SiO2) 25.8 27.2 24.8 25.9 25.7 25.9 25 25.76 mg/L 1 EPA 200.8Silica (Molybdate)* 38.5 42.1 31.7 39 43.2 57.6 57.1 44.17 mg/L 10 SM 4500 SIO2CSodium 247 250 221 228 216 249 234 235.00 mg/L 0.1 EPA 200.8TDS (measured) 1353 1370 1328 1253 1392 1325 1343 1,337.71 mg/L 10 EPA 160.1TSS 5 228 0 6 6 7 7 37.00 mg/L 5 EPA 160.2TVS 277 276 249 989 741 640 380 507.43 mg/L 5 SM2540EStrontium 0.221 0.223 0.213 0.227 0.204 0.211 0.208 0.22 mg/L 0.01 EPA 200.8Sulfate 80.4 83.1 82.6 83.1 82.1 85.5 83.5 82.90 mg/L 2 EPA 300.0Sulfide 0.0826 0.0885 0.0671 0.0667 0.0831 0.0819 0.0814 0.08 mg/L 0.05 SM4500S2FSulfite ND ND ND ND ND ND ND mg/L 0.5 SM 4500 SO3BTKN 2.48 2.49 2.61 2.39 1.66 1.05 1.15 1.98 mg/L 0.1 SM4500NORGCTOC 9.07 9.52 8.7 8.64 9.07 8.73 8.54 8.90 mg/L 1 SM5310CTotal P 5.08 3.82 5.63 3.55 2.09 3.08 1.45 3.53 mg/L 0.01 SM4500PFTotal Residual Chlorine 0.28 0.07 0.07 0.1 0.08 0.14 0.08 0.12 mg/L 0.01 SM 4500CL-GVanadium 0.0273 0.0251 0.0238 0.025 0.0158 0.0162 0.0201 0.02 mg/L 0.001 EPA 200.8Zinc 0.0159 0.0181 0.0178 0.0238 0.0235 0.0229 0.0222 0.02 mg/L 0.001 EPA 200.8
Equivalence values Charge balance verification Total Anions 938.26 Major: bicarbonate, chloride, sulfateMonovalent cations: 17.84 meq Cations: 22.1 meq Total Cations 602.01 Major: Ca, Mg, Na, K
Divalent cations: 4.31 meq Anions: 19.1 meq TDS - summed 1,540.27M:R ratio; 4.14 Variance from average: 7.5%
City water comparisonCations: 6.1 meqAnions: 5.3 meq
Variance from average: 7.0%Per Higgins and Novak, 1997a and b, typical M:D of <2:1 is indicative of good settling sludge.
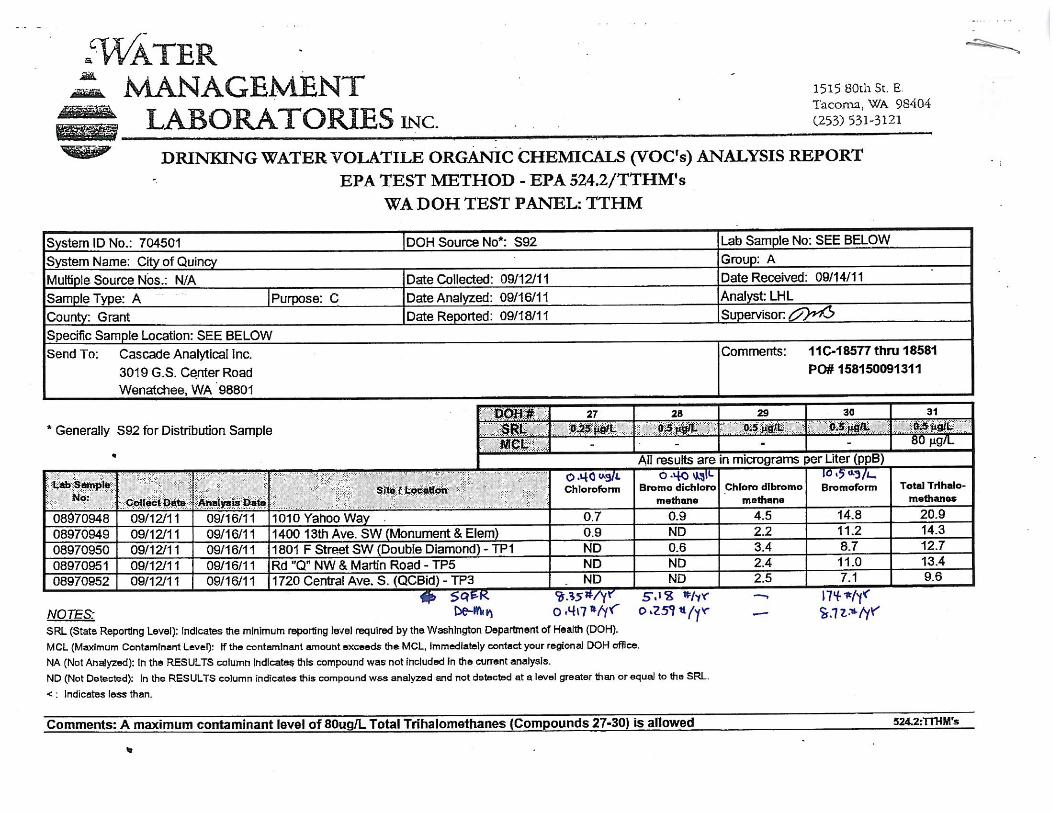
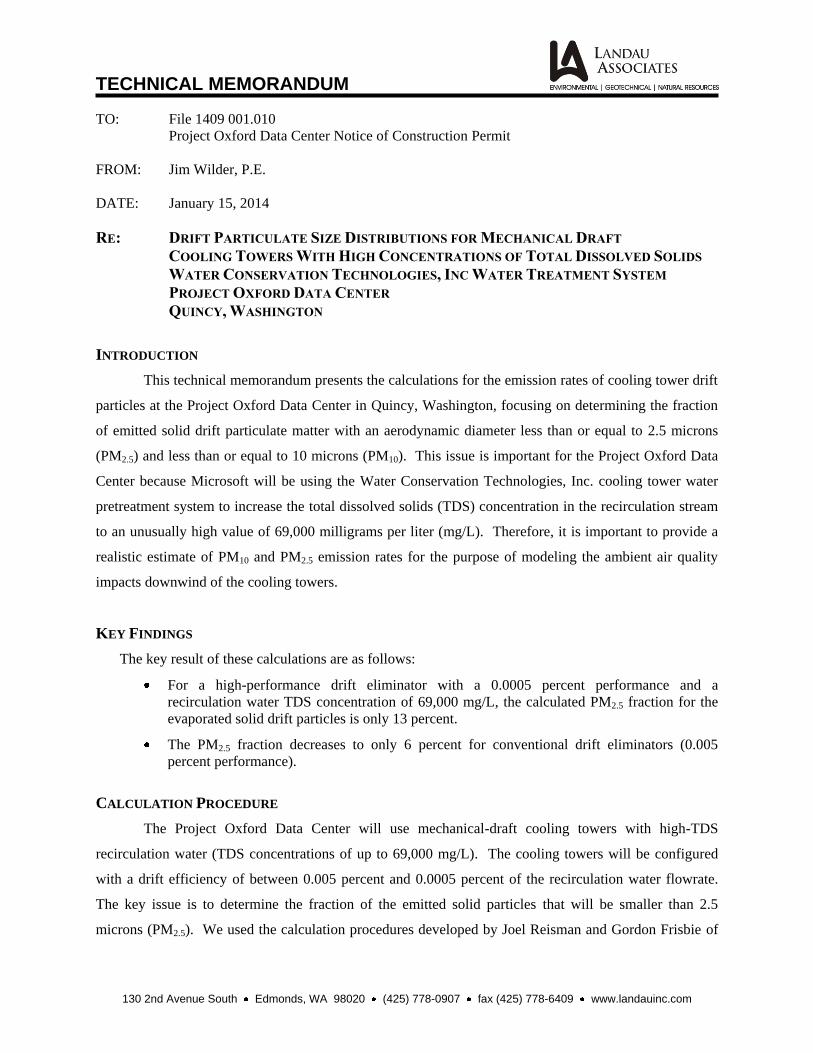
TECHNICAL MEMORANDUM
130 2nd Avenue South Edmonds, WA 98020 (425) 778-0907 fax (425) 778-6409 www.landauinc.com
TO: File 1409 001.010
Project Oxford Data Center Notice of Construction Permit
FROM: Jim Wilder, P.E.
DATE: January 15, 2014
RE: DRIFT PARTICULATE SIZE DISTRIBUTIONS FOR MECHANICAL DRAFT
COOLING TOWERS WITH HIGH CONCENTRATIONS OF TOTAL DISSOLVED SOLIDS
WATER CONSERVATION TECHNOLOGIES, INC WATER TREATMENT SYSTEM
PROJECT OXFORD DATA CENTER
QUINCY, WASHINGTON
INTRODUCTION
This technical memorandum presents the calculations for the emission rates of cooling tower drift
particles at the Project Oxford Data Center in Quincy, Washington, focusing on determining the fraction
of emitted solid drift particulate matter with an aerodynamic diameter less than or equal to 2.5 microns
(PM2.5) and less than or equal to 10 microns (PM10). This issue is important for the Project Oxford Data
Center because Microsoft will be using the Water Conservation Technologies, Inc. cooling tower water
pretreatment system to increase the total dissolved solids (TDS) concentration in the recirculation stream
to an unusually high value of 69,000 milligrams per liter (mg/L). Therefore, it is important to provide a
realistic estimate of PM10 and PM2.5 emission rates for the purpose of modeling the ambient air quality
impacts downwind of the cooling towers.
KEY FINDINGS
The key result of these calculations are as follows:
For a high-performance drift eliminator with a 0.0005 percent performance and a
recirculation water TDS concentration of 69,000 mg/L, the calculated PM2.5 fraction for the
evaporated solid drift particles is only 13 percent.
The PM2.5 fraction decreases to only 6 percent for conventional drift eliminators (0.005
percent performance).
CALCULATION PROCEDURE
The Project Oxford Data Center will use mechanical-draft cooling towers with high-TDS
recirculation water (TDS concentrations of up to 69,000 mg/L). The cooling towers will be configured
with a drift efficiency of between 0.005 percent and 0.0005 percent of the recirculation water flowrate.
The key issue is to determine the fraction of the emitted solid particles that will be smaller than 2.5
microns (PM2.5). We used the calculation procedures developed by Joel Reisman and Gordon Frisbie of

01/15/14 P:\1409\001\010\FileRm\R\Cooling Tower Info\Drift Droplet Distribution_tm.docx LANDAU ASSOCIATES
2
Graystone Environmental Industries (see Attachment 1) to calculate the particle size distribution for the
evaporated solid particles.
There is already a regulatory precedent for conducting realistic estimates of the particle sizes for
cooling tower drift emissions. As shown by the regulatory citations in Attachment 2, this cooling tower
drift calculation methodology has been accepted by at least two air quality agencies (Texas Commission
for Environmental Quality, and the State of Mississippi) for the purpose of allowing applicants to forecast
the PM2.5 and PM10 fractions of drift emissions for air quality permit applications.
For any given diameter of a liquid drift droplet emitted from a cooling tower, the diameter of the
evaporated solid particle is forecast using the following equation:
Dp = Dd [(TDS)(dw/dp)]1/3
, where
Dp is the diameter of the evaporated solid particle (microns)
Dd is the diameter of the liquid droplet
TDS is the TDS concentration within the cooling tower recirculation stream (weight fraction)
dw is the specific gravity of water (1.0)
dp is the specific gravity of the evaporated salt particle (2.2 for sodium chloride particles).
This calculation is performed for liquid droplets in each size category of the known droplet size
distribution. The resulting size distribution for the evaporated solid particles is then inspected to
determine the cumulative fractions of particles smaller than 10 microns and 2.5 microns.
DRIFT DROPLET SIZE DISTRIBUTIONS FOR VARIOUS DRIFT ELIMINATOR CONFIGURATIONS
One of the cooling tower manufacturers that is bidding to provide the cooling towers at the
Project Oxford Data Center (SPX/Marley) has published droplet size distributions for various
configurations. Droplet size distributions for two tower configurations are shown in Attachment 3:
Conventional drift rate of 0.005 percent, which exhibits a large droplet size distribution (mass
median diameter of approximately 50 microns)
High-efficiency drift rate of 0.0005 percent, which exhibits a smaller droplet size distribution
(mass median diameter of approximately 30 microns).
CALCULATED PM2.5 FRACTION AND PM2.5 EMISSION RATES
The solid particle fractions for total suspended particulates, PM10, and PM2.5 emitted from the
Project Oxford mechanical draft cooling towers were estimated from the droplet size distributions shown
in Attachment 3 using the Reisman and Frisbie method (Attachment 1). In all cases, the cooling tower
feedwater was assumed to be chlorinated, pre-treated industrial re-use wastewater received from the City
of Quincy system. The assumptions were as follows:
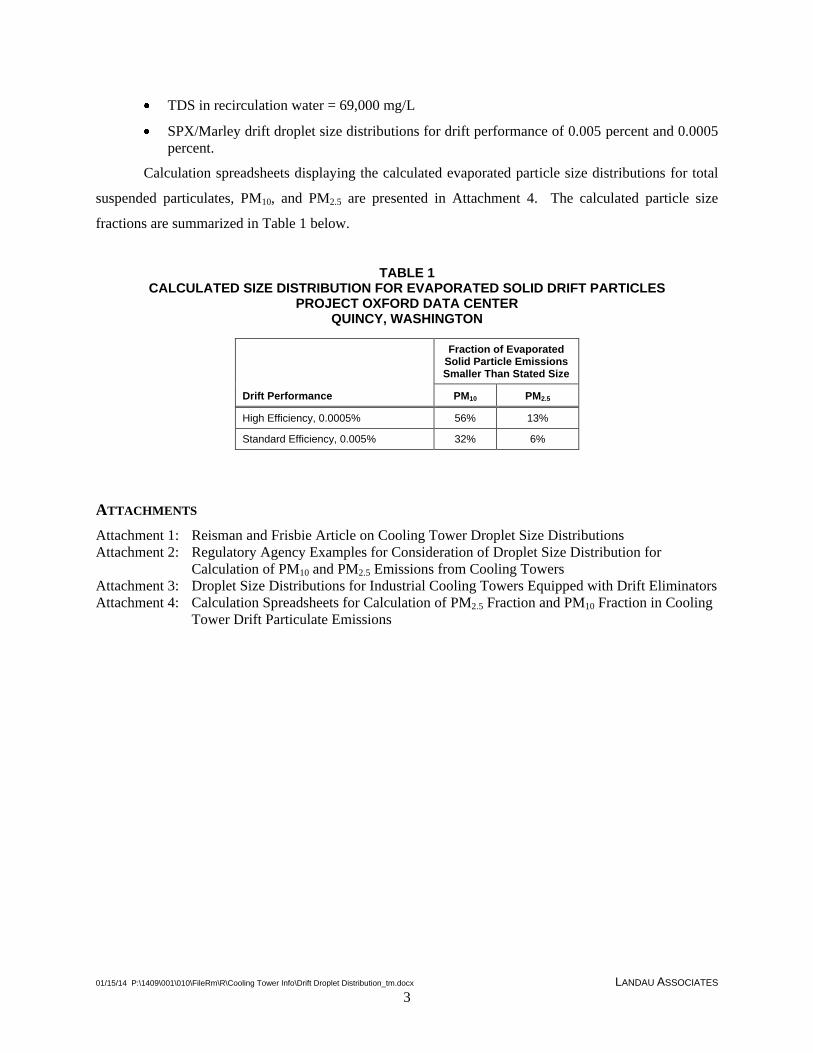
01/15/14 P:\1409\001\010\FileRm\R\Cooling Tower Info\Drift Droplet Distribution_tm.docx LANDAU ASSOCIATES
3
TDS in recirculation water = 69,000 mg/L
SPX/Marley drift droplet size distributions for drift performance of 0.005 percent and 0.0005
percent.
Calculation spreadsheets displaying the calculated evaporated particle size distributions for total
suspended particulates, PM10, and PM2.5 are presented in Attachment 4. The calculated particle size
fractions are summarized in Table 1 below.
TABLE 1 CALCULATED SIZE DISTRIBUTION FOR EVAPORATED SOLID DRIFT PARTICLES
PROJECT OXFORD DATA CENTER QUINCY, WASHINGTON
Drift Performance
Fraction of Evaporated Solid Particle Emissions Smaller Than Stated Size
PM10 PM2.5
High Efficiency, 0.0005% 56% 13%
Standard Efficiency, 0.005% 32% 6%
ATTACHMENTS
Attachment 1: Reisman and Frisbie Article on Cooling Tower Droplet Size Distributions
Attachment 2: Regulatory Agency Examples for Consideration of Droplet Size Distribution for
Calculation of PM10 and PM2.5 Emissions from Cooling Towers
Attachment 3: Droplet Size Distributions for Industrial Cooling Towers Equipped with Drift Eliminators
Attachment 4: Calculation Spreadsheets for Calculation of PM2.5 Fraction and PM10 Fraction in Cooling
Tower Drift Particulate Emissions
ATTACHMENT 1
Reisman and Frisbie Article onCooling Tower Droplet Size Distributions
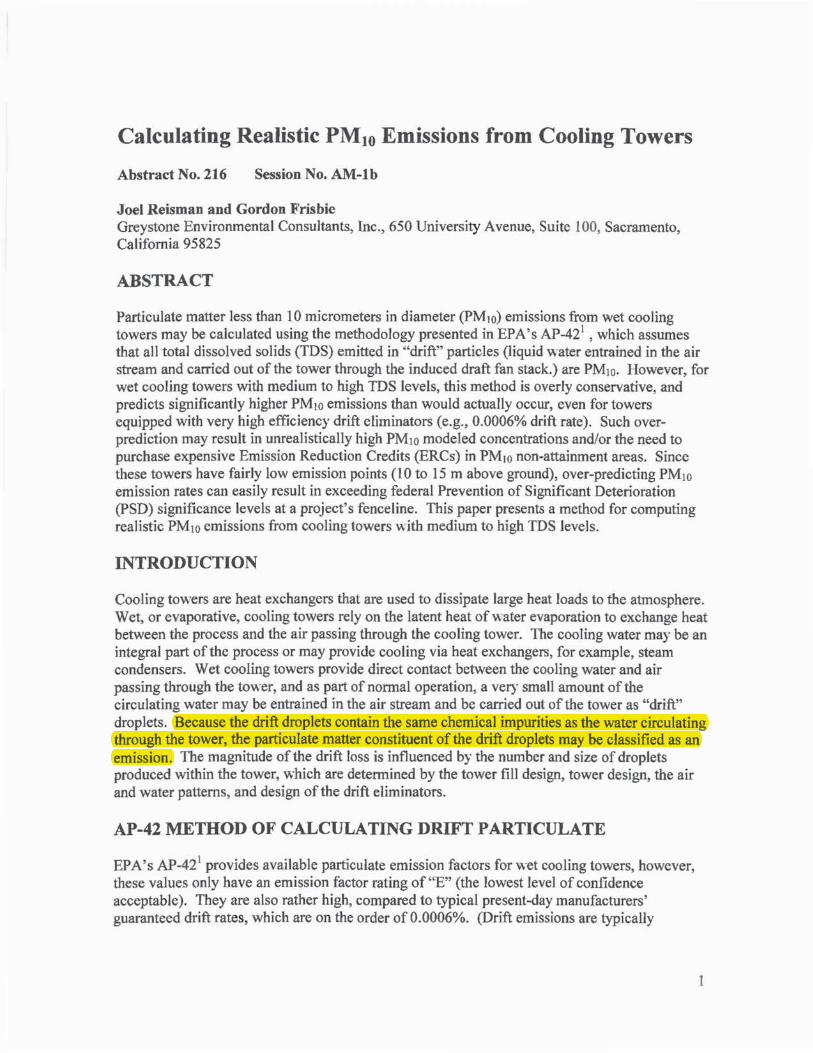

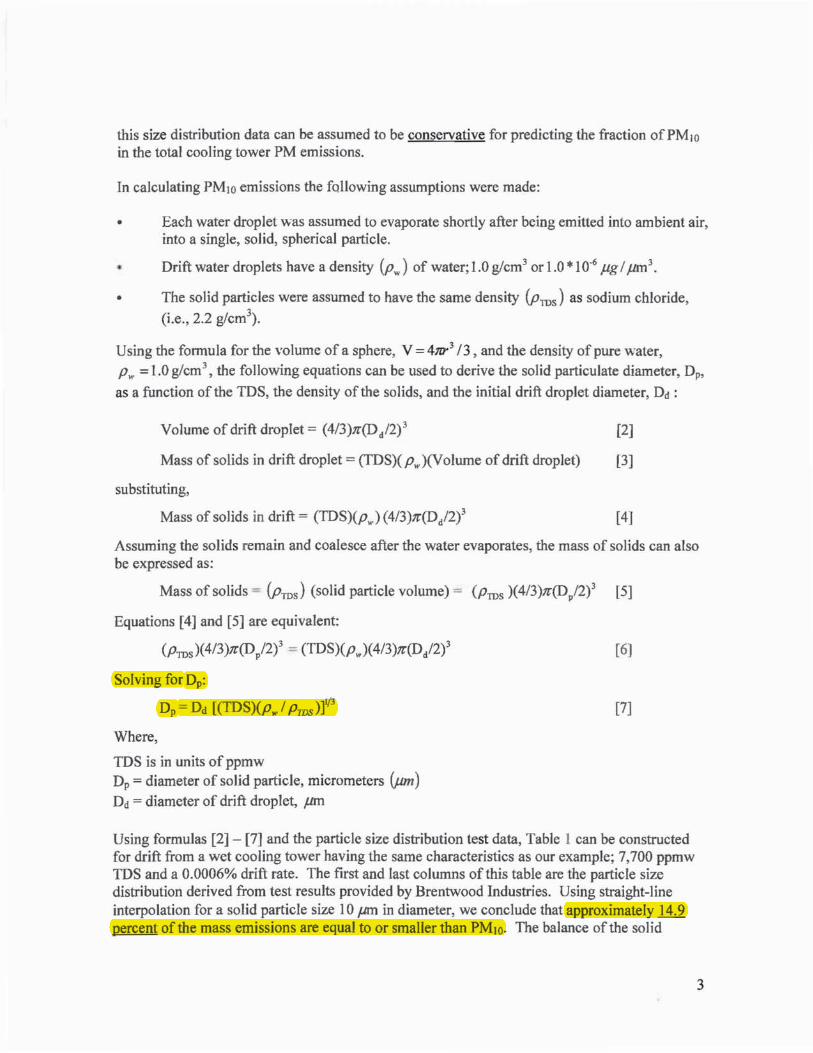


ATTACHMENT 2
Regulatory Agency Examples for Consideration of Droplet Size Distribution for Calculation of PM10
and PM2.5 Emissions from Cooling Towers

Texas Commission on Environmental QualityINTEROFFICE MEMORANDUM
To: Chemical Section Permit Reviewers Date: February 9, 2009
Thru: Dana Poppa Vermillion, PE; Manager, Chemical Section
From: Kurt Kind, PhD PE, Technical Specialist, Chemical Section
Subject: Particulate Emissions from Cooling Towers
For all permit applications received after March 1, Chemical section will require PM emissions be quantified and authorized from cooling towers that are subject to review (including renewals). This review should be performed as follows:
New or modified sourcesPerform the review as for any other new or modified facility (BACT, NAAQS, etc). PM emissions from cooling tower drift (droplets of cooling water that are entrained in ambient air rather than returning to the cooling tower basin) must be quantified (Tier 1 BACT for drift is no more than 0.001% of cooling water to the tower). The drift and total dissolved solids (TDS) concentration in the cooling water are used to estimate total PM emissions.
For new cooling towers, a particle size distribution should be provided for drift from the proposed cooling tower which can be used to determine the fraction of drift that will result in PM10 emissions. Note that the particle size distribution must be specific to the tower proposed because the limited information available indicates that the particle size distribution can vary significantly from tower to tower. If a particle size distribution is not available, all PM emissions must be treated as PM10.
At renewalEstimate the cooling tower PM emissions based on manufacturer's data or operating experience. Only use the AP-42 factor (0.02%) if neither of these options are available. Assume all PM is emitted as PM10 unless there is a particle size distribution available for the cooling tower.
If the cooling tower PM emissions to be added to the permit are not significant (<15 tpy PM10 and <25 tpy PM) add them to the MAERT with the boilerplate cooling tower PM monitoring condition per the March 10, 1997 memo from Victoria Hsu, P.E., Director, New Source Review Permitting Division, entitled “Permit Renewal Requirements.”
If the emissions are significant, a permit amendment will be necessary and should be reviewed as described above. If the emission increase is still significant following the application of BACT, PSD review may apply. The permit holder may do a retrospective PSD applicability analysis to demonstrate that the additional PM emissions from the cooling tower(s) would not have made the original construction project subject to PSD review. Another option available would be to

treat the authorization of cooling tower PM emissions as a project occurring today. In either case, PSD review would be required unless the net emission increase is not significant.
This topic and the emission calculations associated with it will be discussed in detail at the next Chemical section meeting.
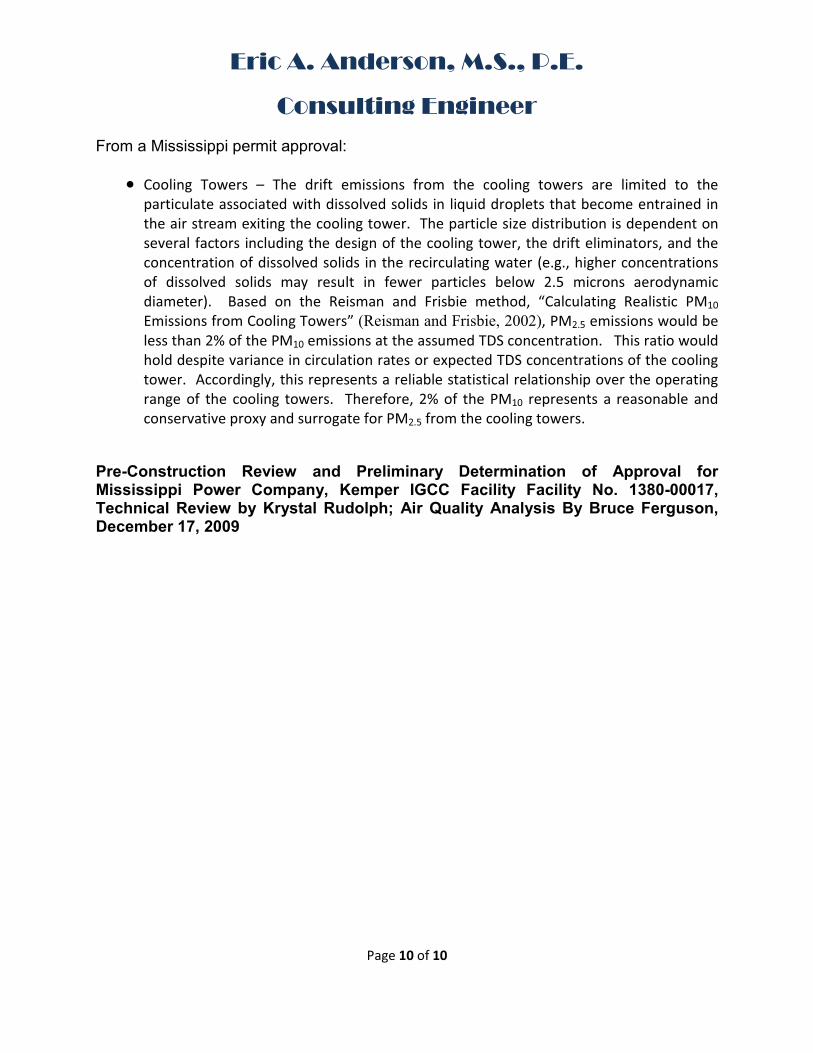
Eric A. Anderson, M.S., P.E.
Consulting Engineer
Page 10 of 10
From a Mississippi permit approval:
� Cooling Towers – The drift emissions from the cooling towers are limited to the particulate associated with dissolved solids in liquid droplets that become entrained in the air stream exiting the cooling tower. The particle size distribution is dependent on several factors including the design of the cooling tower, the drift eliminators, and the concentration of dissolved solids in the recirculating water (e.g., higher concentrations of dissolved solids may result in fewer particles below 2.5 microns aerodynamic diameter). Based on the Reisman and Frisbie method, “Calculating Realistic PM10 Emissions from Cooling Towers” (Reisman and Frisbie, 2002), PM2.5 emissions would be less than 2% of the PM10 emissions at the assumed TDS concentration. This ratio would hold despite variance in circulation rates or expected TDS concentrations of the cooling tower. Accordingly, this represents a reliable statistical relationship over the operating range of the cooling towers. Therefore, 2% of the PM10 represents a reasonable and conservative proxy and surrogate for PM2.5 from the cooling towers.
Pre-Construction Review and Preliminary Determination of Approval for Mississippi Power Company, Kemper IGCC Facility Facility No. 1380-00017, Technical Review by Krystal Rudolph; Air Quality Analysis By Bruce Ferguson, December 17, 2009

ATTACHMENT 3
Droplet Size Distributions for Industrial Cooling Towers Equipped with Drift Eliminators


ATTACHMENT 4
Calculation Spreadsheets for Calculation ofPM2.5 Fraction and PM10 Fraction
in Cooling Tower Drift Particulate Emissions

Cooling Tower Drift Droplet and Evaporated Particle Size DistributionsHigh‐Efficiency Drift Configuration = 0.0005%
Cooling TowerDrift Efficiency 0.0005%Recirc. Water TDS Conc., mg/L 69,000
Drift Droplet Density, g/cc 1.0Evaporated salt particle density, g/cc 2.2
Diameter of Drift Droplets or Evaporated Particles (microns)
Liquid Droplet Size Distribution (percent)
Percent Smaller Size Distribution
Evaporated Solid Particle Diameter (microns)
10 13 13 3.2 13%20 18.5 31.5 6.330 24.1 55.6 9.5 56%40 22.2 77.8 12.650 16.7 94.5 15.860 5.6 100.1 18.9708090100110120Total 100.1
P:\1409\001\010\WIP\T\Emission Calcs\Preliminary Emissions Provided to Ecology & URS\[DRAFT WORK‐IN‐PROGRESS MWH01 Emission Calculations.xlsx]Extra high effcy 0.0005%
Methodology for calculating the evaporated solid particle size distribution based on the droplet size distribution is taken from "Calculating Realistic PM10 Emissions from Cooling Towers", Reisman and Frisbie, Environmental Progress, July 2002.
SPX Cooling Technology for 0.0005% drift eliminator
PM2.5 Fraction
PM10 Fraction

APPENDIX C
Derivation of Theoretical Maximum12-Month Emission Rates


03/12/14 P:\1409\001\010\FileRm\R\Derivation of Max 12-Month Emission Rates TM\Derivation of Max 12-Month Emission Rates_tm-03-12-14.docx LANDAU ASSOCIATES 2
(NAAQS) and the annual-average Acceptable Source Impact Levels (ASILs) must be based on the
theoretical maximum emission rates for any 12-month rolling period, rather than the 70-year average.
This document describes how the theoretical maximum 12-month emission rates were derived.
Generator usage during the theoretical maximum 12-month period would include a combination
of generator commissioning, fully operational data center activity, and periodic stack emission testing.
For this assessment, we considered the following 12-month operating scenarios:
Scenario 1:70-year average as used for the DEEP risk assessment, distributing the generator
commissioning and periodic stack testing over the 70-year exposure period
Scenario 2: Commissioning of 21 Phase 1 generators, followed by installation of the Phase 1
data center servers, followed by a partial year of full operation of Phase 1
Scenario 3: Full year of operation for Phase 1, plus commissioning of 16 Phase 2 generators,
followed by installation of the Phase 2 data center servers, followed by a partial year of full
operation of Phase 2, including stack emission testing of two generators for Phase 1
Scenario 4: 12 months of full operation of combined Phases 1+2, including stack emission
testing of two generators for either Phase 1 or Phase 2.
The anticipated sequence of events and the schedule for commissioning of Phase 1 and Phase 2
generators were provided by Microsoft. Based on those anticipated sequences, for each scenario we
compiled the maximum theoretical combination of generator runtime that could occur during any 12-
month period. The maximum theoretical 12-month generator usage for Scenario 2 is derived in Table 1.
The maximum theoretical runtime for Scenario 3 is derived in Table 2. The maximum theoretical runtime
for Scenario 4 is derived in Table 3.
The theoretical maximum diesel usage rates and the annual emission rates for DEEP, nitrogen
oxides (NOx), carbon monoxide (CO) and volatile organic compounds (VOC) corresponding to each
12-month scenario were calculated using the same methods that were used to calculate the 70-year
average emissions. A screen shot of the emission calculation spreadsheet that was provided to Ecology is
shown in Attachment 1.
Table 4 lists the “menu” of annual emissions caused by each subset of activity. The 12-month
emission rates for each scenario were then calculated by summing the individual subset activities relevant
for that scenario. The calculated 12-month emission rates for Scenario 1, Scenario 2, Scenario 3, and
Scenario 4 are shown in Tables 5 through 8, respectively. The last line in Tables 5 through 8 shows the
“adjustment factor” for that scenario, which is the ratio of that scenario’s theoretical maximum 12-month
emissions compared to the 70-year average emission rates presented in the January 2014 permit
application.
Depending on the pollutant being considered, the calculated 12-month emissions are highest for
either Scenario 3 or Scenario 4. To provide a conservatively high estimate, for each pollutant the higher
value from either of those scenarios was selected, and the values for each pollutant were combined to
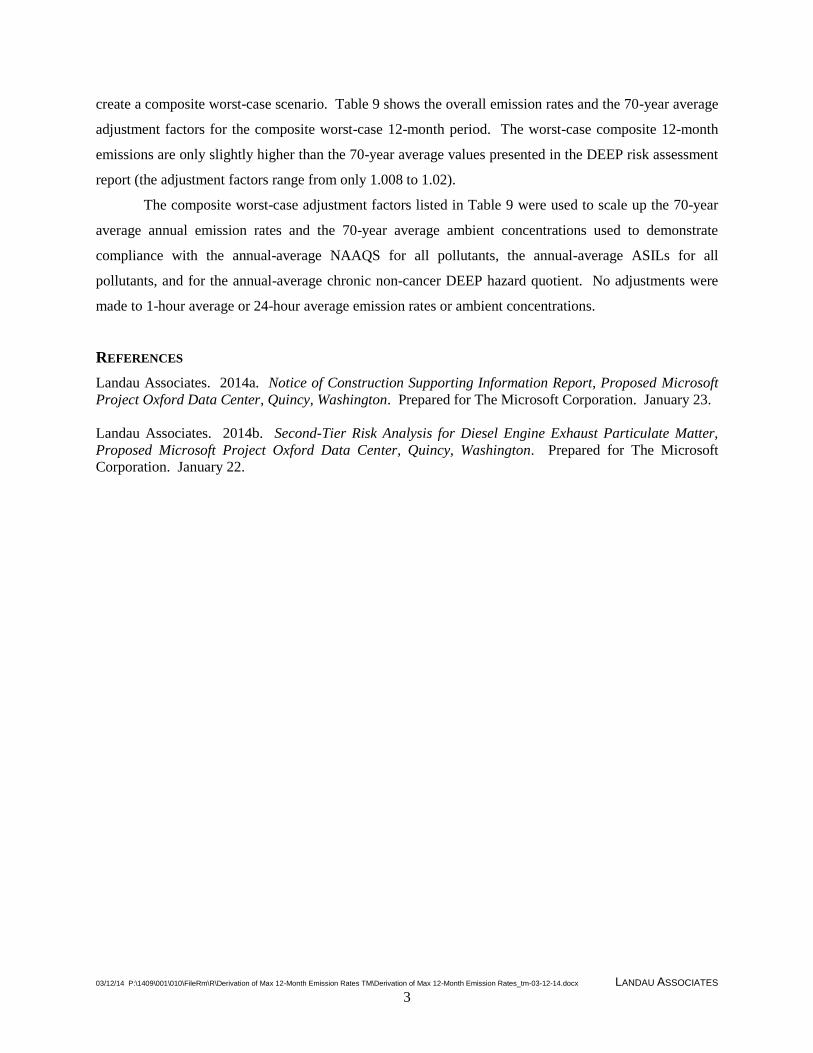
03/12/14 P:\1409\001\010\FileRm\R\Derivation of Max 12-Month Emission Rates TM\Derivation of Max 12-Month Emission Rates_tm-03-12-14.docx LANDAU ASSOCIATES 3
create a composite worst-case scenario. Table 9 shows the overall emission rates and the 70-year average
adjustment factors for the composite worst-case 12-month period. The worst-case composite 12-month
emissions are only slightly higher than the 70-year average values presented in the DEEP risk assessment
report (the adjustment factors range from only 1.008 to 1.02).
The composite worst-case adjustment factors listed in Table 9 were used to scale up the 70-year
average annual emission rates and the 70-year average ambient concentrations used to demonstrate
compliance with the annual-average NAAQS for all pollutants, the annual-average ASILs for all
pollutants, and for the annual-average chronic non-cancer DEEP hazard quotient. No adjustments were
made to 1-hour average or 24-hour average emission rates or ambient concentrations.
REFERENCES
Landau Associates. 2014a. Notice of Construction Supporting Information Report, Proposed Microsoft
Project Oxford Data Center, Quincy, Washington. Prepared for The Microsoft Corporation. January 23.
Landau Associates. 2014b. Second-Tier Risk Analysis for Diesel Engine Exhaust Particulate Matter,
Proposed Microsoft Project Oxford Data Center, Quincy, Washington. Prepared for The Microsoft
Corporation. January 22.
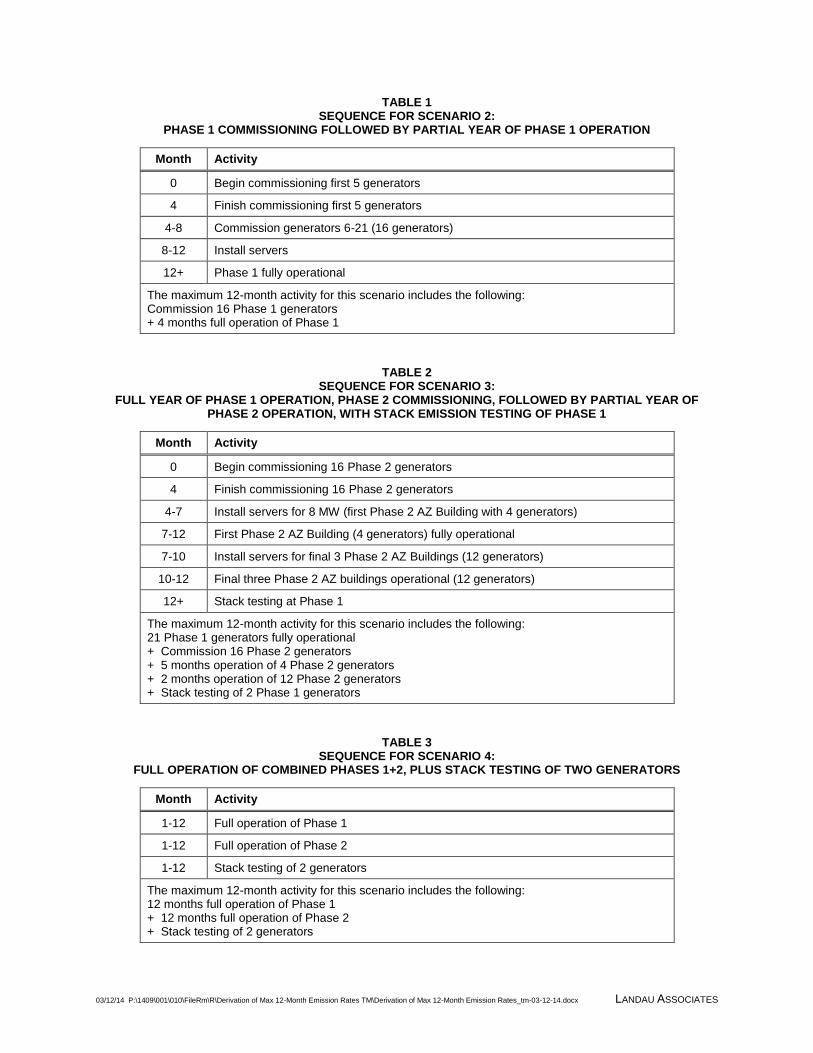
03/12/14 P:\1409\001\010\FileRm\R\Derivation of Max 12-Month Emission Rates TM\Derivation of Max 12-Month Emission Rates_tm-03-12-14.docx LANDAU ASSOCIATES
TABLE 1 SEQUENCE FOR SCENARIO 2:
PHASE 1 COMMISSIONING FOLLOWED BY PARTIAL YEAR OF PHASE 1 OPERATION
Month Activity
0 Begin commissioning first 5 generators
4 Finish commissioning first 5 generators
4-8 Commission generators 6-21 (16 generators)
8-12 Install servers
12+ Phase 1 fully operational
The maximum 12-month activity for this scenario includes the following: Commission 16 Phase 1 generators + 4 months full operation of Phase 1
TABLE 2 SEQUENCE FOR SCENARIO 3:
FULL YEAR OF PHASE 1 OPERATION, PHASE 2 COMMISSIONING, FOLLOWED BY PARTIAL YEAR OF PHASE 2 OPERATION, WITH STACK EMISSION TESTING OF PHASE 1
Month Activity
0 Begin commissioning 16 Phase 2 generators
4 Finish commissioning 16 Phase 2 generators
4-7 Install servers for 8 MW (first Phase 2 AZ Building with 4 generators)
7-12 First Phase 2 AZ Building (4 generators) fully operational
7-10 Install servers for final 3 Phase 2 AZ Buildings (12 generators)
10-12 Final three Phase 2 AZ buildings operational (12 generators)
12+ Stack testing at Phase 1
The maximum 12-month activity for this scenario includes the following: 21 Phase 1 generators fully operational + Commission 16 Phase 2 generators + 5 months operation of 4 Phase 2 generators + 2 months operation of 12 Phase 2 generators + Stack testing of 2 Phase 1 generators
TABLE 3 SEQUENCE FOR SCENARIO 4:
FULL OPERATION OF COMBINED PHASES 1+2, PLUS STACK TESTING OF TWO GENERATORS
Month Activity
1-12 Full operation of Phase 1
1-12 Full operation of Phase 2
1-12 Stack testing of 2 generators
The maximum 12-month activity for this scenario includes the following: 12 months full operation of Phase 1 + 12 months full operation of Phase 2 + Stack testing of 2 generators
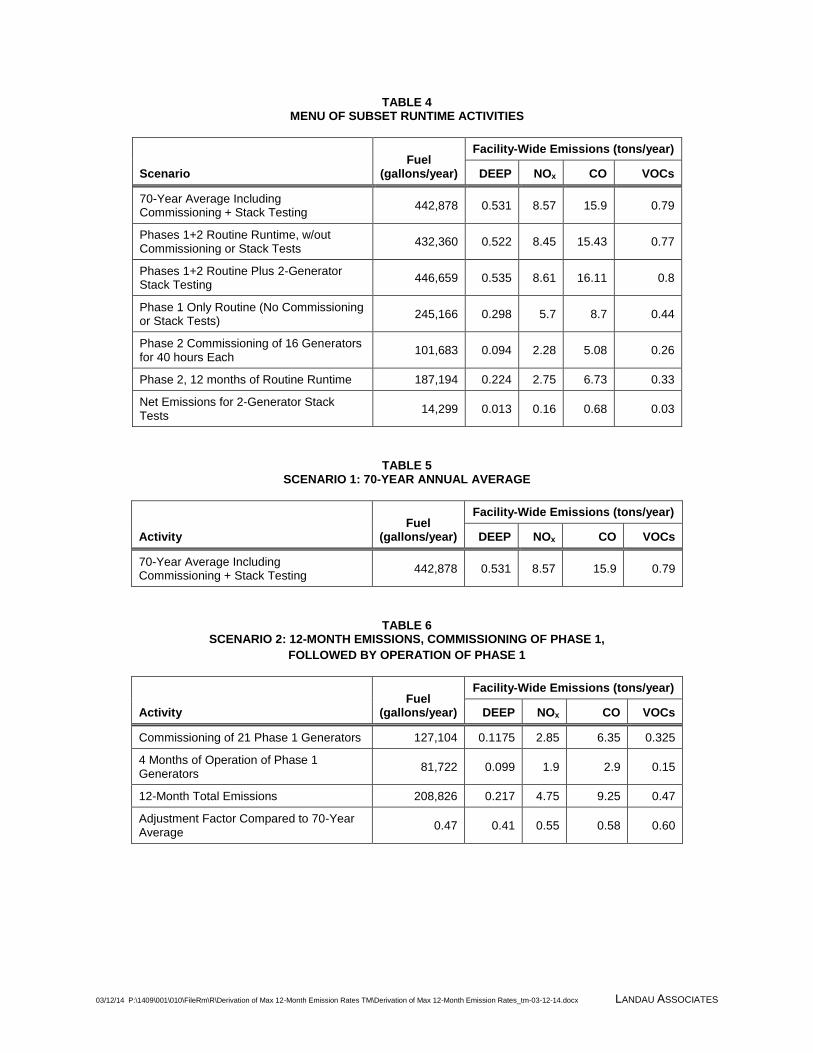
03/12/14 P:\1409\001\010\FileRm\R\Derivation of Max 12-Month Emission Rates TM\Derivation of Max 12-Month Emission Rates_tm-03-12-14.docx LANDAU ASSOCIATES
TABLE 4 MENU OF SUBSET RUNTIME ACTIVITIES
Scenario Fuel
(gallons/year)
Facility-Wide Emissions (tons/year)
DEEP NOx CO VOCs
70-Year Average Including Commissioning + Stack Testing
442,878 0.531 8.57 15.9 0.79
Phases 1+2 Routine Runtime, w/out Commissioning or Stack Tests
432,360 0.522 8.45 15.43 0.77
Phases 1+2 Routine Plus 2-Generator Stack Testing
446,659 0.535 8.61 16.11 0.8
Phase 1 Only Routine (No Commissioning or Stack Tests)
245,166 0.298 5.7 8.7 0.44
Phase 2 Commissioning of 16 Generators for 40 hours Each
101,683 0.094 2.28 5.08 0.26
Phase 2, 12 months of Routine Runtime 187,194 0.224 2.75 6.73 0.33
Net Emissions for 2-Generator Stack Tests
14,299 0.013 0.16 0.68 0.03
TABLE 5 SCENARIO 1: 70-YEAR ANNUAL AVERAGE
Activity Fuel
(gallons/year)
Facility-Wide Emissions (tons/year)
DEEP NOx CO VOCs
70-Year Average Including Commissioning + Stack Testing
442,878 0.531 8.57 15.9 0.79
TABLE 6 SCENARIO 2: 12-MONTH EMISSIONS, COMMISSIONING OF PHASE 1,
FOLLOWED BY OPERATION OF PHASE 1
Activity Fuel
(gallons/year)
Facility-Wide Emissions (tons/year)
DEEP NOx CO VOCs
Commissioning of 21 Phase 1 Generators 127,104 0.1175 2.85 6.35 0.325
4 Months of Operation of Phase 1 Generators
81,722 0.099 1.9 2.9 0.15
12-Month Total Emissions 208,826 0.217 4.75 9.25 0.47
Adjustment Factor Compared to 70-Year Average
0.47 0.41 0.55 0.58 0.60
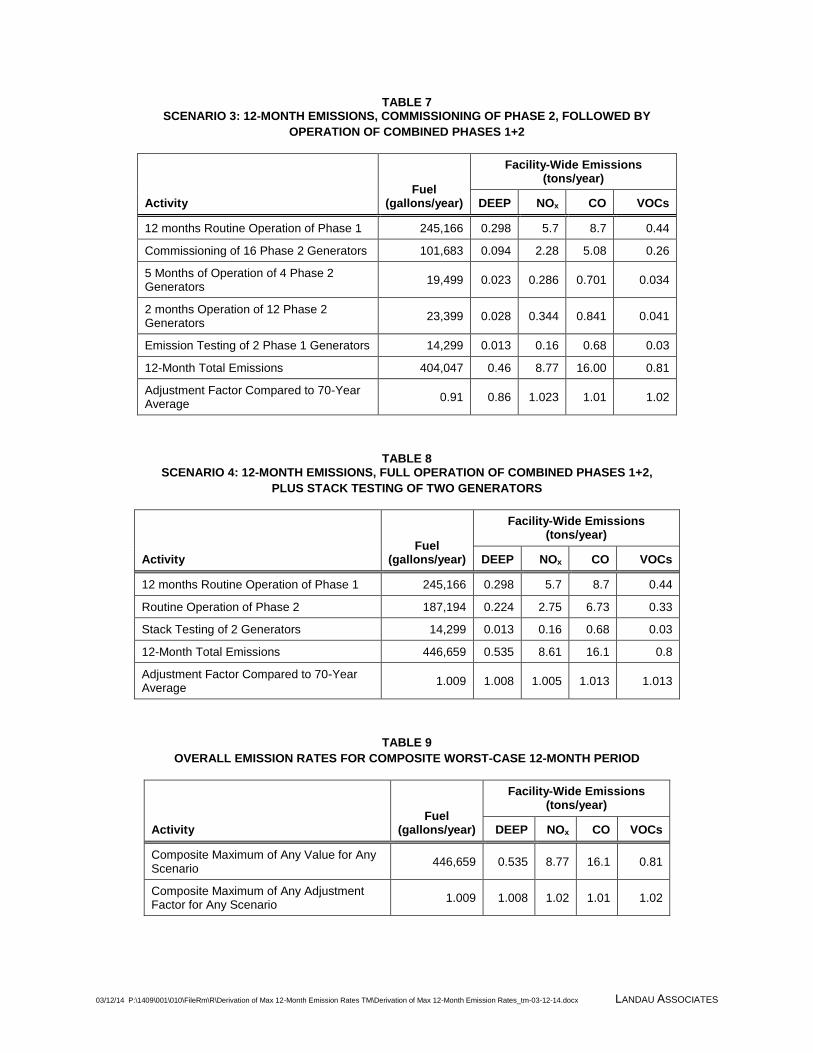
03/12/14 P:\1409\001\010\FileRm\R\Derivation of Max 12-Month Emission Rates TM\Derivation of Max 12-Month Emission Rates_tm-03-12-14.docx LANDAU ASSOCIATES
TABLE 7 SCENARIO 3: 12-MONTH EMISSIONS, COMMISSIONING OF PHASE 2, FOLLOWED BY
OPERATION OF COMBINED PHASES 1+2
Activity Fuel
(gallons/year)
Facility-Wide Emissions (tons/year)
DEEP NOx CO VOCs
12 months Routine Operation of Phase 1 245,166 0.298 5.7 8.7 0.44
Commissioning of 16 Phase 2 Generators 101,683 0.094 2.28 5.08 0.26
5 Months of Operation of 4 Phase 2 Generators
19,499 0.023 0.286 0.701 0.034
2 months Operation of 12 Phase 2 Generators
23,399 0.028 0.344 0.841 0.041
Emission Testing of 2 Phase 1 Generators 14,299 0.013 0.16 0.68 0.03
12-Month Total Emissions 404,047 0.46 8.77 16.00 0.81
Adjustment Factor Compared to 70-Year Average
0.91 0.86 1.023 1.01 1.02
TABLE 8 SCENARIO 4: 12-MONTH EMISSIONS, FULL OPERATION OF COMBINED PHASES 1+2,
PLUS STACK TESTING OF TWO GENERATORS
Activity Fuel
(gallons/year)
Facility-Wide Emissions (tons/year)
DEEP NOx CO VOCs
12 months Routine Operation of Phase 1 245,166 0.298 5.7 8.7 0.44
Routine Operation of Phase 2 187,194 0.224 2.75 6.73 0.33
Stack Testing of 2 Generators 14,299 0.013 0.16 0.68 0.03
12-Month Total Emissions 446,659 0.535 8.61 16.1 0.8
Adjustment Factor Compared to 70-Year Average
1.009 1.008 1.005 1.013 1.013
TABLE 9
OVERALL EMISSION RATES FOR COMPOSITE WORST-CASE 12-MONTH PERIOD
Activity Fuel
(gallons/year)
Facility-Wide Emissions (tons/year)
DEEP NOx CO VOCs
Composite Maximum of Any Value for Any Scenario
446,659 0.535 8.77 16.1 0.81
Composite Maximum of Any Adjustment Factor for Any Scenario
1.009 1.008 1.02 1.01 1.02
ATTACHMENT 1
Screen Shot of Excel Spreadsheet Calculations

03/12/14 P:\1409\001\010\FileRm\R\Derivation of Max 12-Month Emission Rates TM\Derivation of Max 12-Month Emission Rates_tm-03-12-14.docx LANDAU ASSOCIATES
Worst-Case Annual Emission Scenarios Compared to 70-Year Average
Menu of Runtime Scenarios
DEEP Nox CO HC
70-Year Average Including Commissioning + Stack Testing 442,878 0.531 8.57 15.9 0.79
Phases 1+2 Routine Runtime, W/out Commissioning or Stack Tests432,360 0.522 8.45 15.43 0.77
Phases 1+2 Routine Plus 3-Generator Stack Testing 446,659 0.535 8.61 16.11 0.8
Phase 1 Only Routine (No Commissioning or Stack Tests) 245,166 0.298 5.7 8.7 0.44
Phase 2 Commisioning of 16 Gens for 40 hrs Each 101,683 0.094 2.28 5.08 0.26
Phase 2, 12 months of Routine Runtime 187,194 0.224 2.75 6.73 0.33
Net Emissions for 3-Gen Stack Tests 14,299 0.013 0.16 0.68 0.03
Scenario 1. 70-Year Annual Average
DEEP Nox CO HC
70-Year Average Including Commissioning + Stack Testing 442,878 0.531 8.57 15.9 0.79
Scenario 2. Commissioning of Phase 1, Followed By Operation of Phase 1
DEEP Nox CO HC
Commissioning of 20 Phase 1 Generators 127,104 0.1175 2.85 6.35 0.325
4 Months of Operation of Phase 1 Generators 81,722 0.099 1.9 2.9 0.15
12-Month Total Emissions 208,826 0.217 4.75 9.25 0.47
Ajustment Factor Compared to 70-Year Average 0.47 0.41 0.55 0.58 0.60
Scenario 3. Commissioning of Phase 2, Followed By Operation of Combined Phases 1 +2
DEEP Nox CO HC
12 months Routine Operation of Phase 1 245,166 0.298 5.7 8.7 0.44
Commissioning of 16 Phase 1 Generators 101,683 0.094 2.28 5.08 0.26
5 Months of Operation of 4 Phase 2 Generators 19,499 0.023 0.286 0.701 0.034
2 months Operation of 12 Phase 2 Generators 23,399 0.028 0.344 0.841 0.041
Emission Testing of 3 Phase 1 Generators 14,299 0.013 0.16 0.68 0.03
12-Month Total Emissions 404,047 0.46 8.77 16.00 0.81
Ajustment Factor Compared to 70-Year Average 0.91 0.86 1.023 1.01 1.02
Scenario 4. Full Operation of Combined Phases 1+2, Plus Stack Testing of 3 Generators
DEEP Nox CO HC
12 months Routine Operation of Phase 1 245,166 0.298 5.7 8.7 0.44
Routine Operation of Phase 2 187,194 0.224 2.75 6.73 0.33
Stack Testing of 3 Generators 14,299 0.013 0.16 0.68 0.03
12-Month Total Emissions 446,659 0.535 8.61 16.11 0.8
Ajustment Factor Compared to 70-Year Average 1.009 1.008 1.005 1.013 1.013
Overall Adjustment Factors for Worst-Case Annual Compared to 70-Year Annual Average
DEEP Nox CO HC
Maximum of Any Value for Any Scenario 446,659 0.535 8.77 16.1 0.81
Maximum of Any Adjustment Factor for Any Scenario 1.009 1.008 1.02 1.01 1.02
Scenario Fuel, gal/year
Facility-Wide Emissions, tons/year
P:\1409\001\010\WIP\T\Emission Calcs\Preliminary Emissions Provided to Ecology
& URS\[Rev-1 - CNR 2500 Emission Calculations.xlsx]Worst Case Annual
Activity
Fuel,
gal/year
Facility-Wide Emissions, tons/year
Activity
Fuel,
gal/year
Facility-Wide Emissions, tons/year
Activity
Fuel,
gal/year
Facility-Wide Emissions, tons/year
Activity
Fuel,
gal/year
Facility-Wide Emissions, tons/year
Activity
Fuel,
gal/year
Facility-Wide Emissions, tons/year

APPENDIX D
Derivation of Cold-Start Emission Factors

DIESEL GENERATOR “COLD START SPIKE” ADJUSTMENT FACTORS
Short-term concentration trends for VOC, CO and NOx emissions immediately following a cold start by a
large diesel backup generator were measured by the California Energy Commission in their document
entitled Air Quality Implications of Backup Generators in California, dated July 2005. They used
continuous monitors to measure the following trends, which are shown in the attached figure.
As shown in the following figure, during the first 14 seconds after a cold start, the VOC concentration
spiked to a maximum value of 900 ppm before dropping back to the steady state value of 30 ppm. The
triangular area under the measured 14-second concentration-vs-time curve represents a “VOC spike” of
6,300 ppm-seconds.
On the other hand, the NOx concentration did not “spike”. To the contrary, it took 8 seconds for the NOx
concentration to ramp up from the initial value of zero to its steady state value of 38 ppm. The area under
the concentration-vs-time curve represents the “NOx deficit” of 160 ppm-seconds.
The California Energy Commission was unable to measure the time trend of DPM concentrations during
the first several seconds after a cold start. Therefore, for purposes of estimating the DPM trend, it was
assumed that DPM would exhibit the same concentration-vs-time trend as VOC emissions.
The numerical value of the Cold Start Spike Adjustment Factor was derived by dividing the area under
the “cold start spike” by the area under the steady-state concentration profile for the 15-minute averaging
period.
Example: Cold Start Spike Factor for VOC, First 15 Minutes After Cold Start at Low Load
The triangular area under the “VOC spike” is 6,300 ppm-sec. The steady-state VOC concentration is 30
ppm. For the 15-minute steady state period the area under the steady-state concentration-vs-time curve is
30 ppm x 15 minutes x 60 seconds or 27,000 ppm-sec.
The “VOC cold start spike factor” is the area of the spike divided by the area under the warmed up steady
state curve. :
VOC cold start spike ratio = (6300 ppm-sec) / (6300+27,000 ppm-sec) = 0.189
So the VOC Cold Start Spike Factor = 1.189 for the initial 15-minute period.
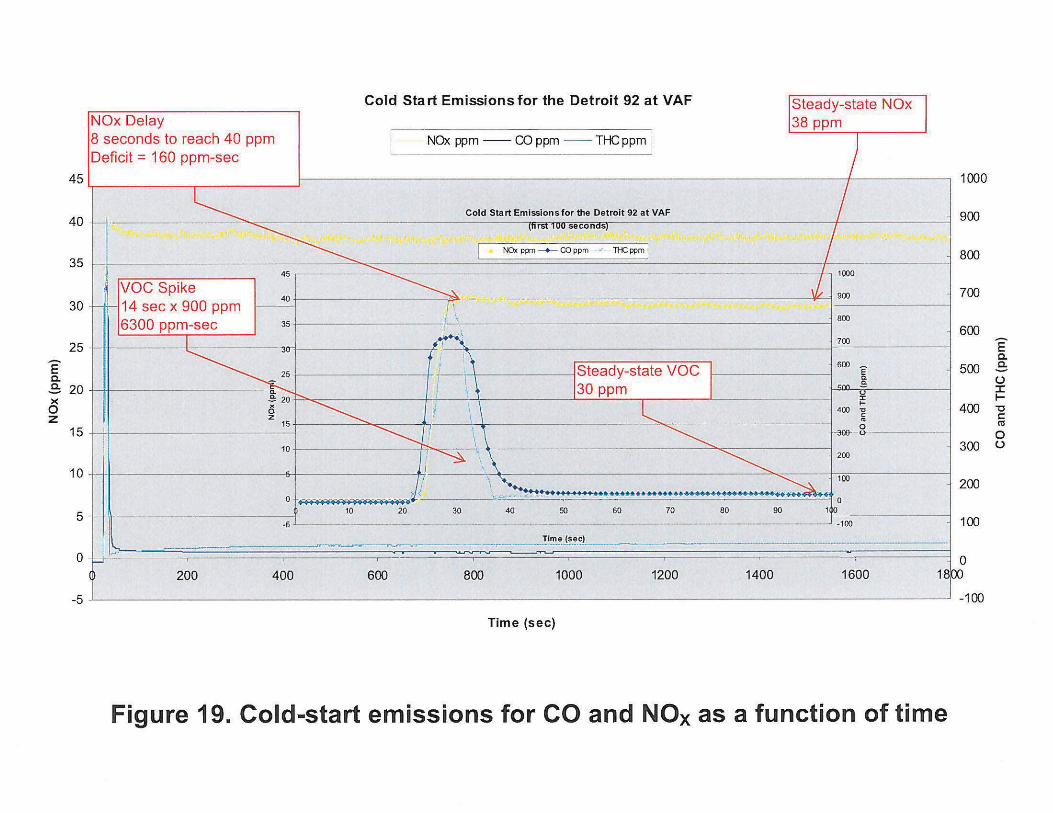

VOC/PM Black Puff Cold-Start Spike Adjustment Factors
LoadSpike Area (ppm-sec)
Steady-State Area (ppm-sec)
Total Area (ppm-sec)
Black Puff Factor
10% (15 min) 6300 27000 33300 1.18980% (10 min) 6300 18000 24300 1.259100% (10 min) 6300 18000 24300 1.259
CO Black Puff Cold-Start Spike Adjustment Factors
LoadSpike Area (ppm-sec)
Steady-State Area (ppm-sec)
Total Area (ppm-sec)
Black Puff Factor
10% (15 min) 15000 18000 33000 1.45580% (10 min) 15000 12000 27000 1.556100% (10 min) 15000 12000 27000 1.556
Cold‐Start Spike Adjustment Factors for CO, VOC, PM
12/31/2013, 8:58 AM

APPENDIX E
Ammonia Emission Rates and Ambient Impact Calculations
(Calculation spreadsheet was provided to the Washington State Department of Ecology
under separate cover)

Ammonia Emission Rates and Ambient Risk AssessmentMicrosoft MWH-01 Data Center
Emission Factor from Vantage Data Center: 0.32 (lbs/hr NH3)/(Mwe)
70-Year Average Emission Rates Including All Activity
Gen # Load Condition No. Gens
Hrs/Yr Warmed Up With
Ammonia Slip
Mwe, Warmed Up With
Ammonia Slip
Mwe-Hrs/Year Warmed Up
Condition With Ammonia Slip
NH3 Emission Factor, lbs/Mwe
Annual Ammonia
Emissions, tons/yr
2.5 MW @ 100% load Cold start 32 2.67 0 0 0 02.5 MW @ 100% load Warmed up 32 14.83 2.5 1,186 0.32 0.19 2.5 MW @ 80% load Cold start 32 0.67 0 0 0 02.5 MW @ 80% load Warmed up 32 41.27 2 2,641 0.32 0.42 2.5 MW @ 10% load Cold start 32 13.00 0 0 0 02.5 MW @ 10% load Warmed up 32 16.01 0.25 128 0.32 0.02 2 MW @ 100% load Cold start 4 2.67 0 0 0 02 MW @ 100% load Warmed up 4 14.83 2 119 0.32 0.02 2.MW @ 80% load Cold start 4 0.67 0 0 0 02 MW @ 80% load Warmed up 4 41.27 1.6 264 0.32 0.042 2 MW @ 10% load Cold start 4 13.00 0 0 0 02 MW @ 10% load Warmed up 4 16.01 0.2 13 0.32 0.0020
0.75 MW @ 100% load Cold start 1 2.67 0 0 0 00.75 MW @ 100% load Warmed up 1 14.83 0.75 11 0.32 0.0018 0.75 MW @ 80% load Cold start 1 0.67 0 0 0 00.75 MW @ 80% load Warmed up 1 41.27 0.6 25 0.32 0.0040 0.75 MW @ 10% load Cold start 1 13.00 0 0 0 00.75 MW @ 10% load Warmed up 1 16.00 0.075 1.2 0.32 0.0002
0.702
Facility-Wide Daily NH3 Emission Rate During a 24-hour Power Outage
Generators No. Gens Rated Mwe LoadDaily Runtime,
hours MW-hrs/day
NH3 Emission Factor, lbs/MW-
hr
Daily NH3 Emissions,
lbs/day2.5 MW AZ Generators 32 2.5 0.8 24 1,536 0.32 4922.0 MW CNR Generators 4 2 0.8 24 154 0.32 490.75 Admin building 1 0.75 0.8 24 14 0.32 5
54522.7
24-Hour Ambient Air Quality Impact Assessment for Tier-1 ASIL Comparison (Use AERMOD for Acrolein to develop dispersion factorAcrolein emission rate 0.015 lbs/dayAcrolein ambient conc. 0.0006 ug/m3Acrolein dipsersion factor 0.040 (ug/m3)/(lbs/day)Facility-wide NH3 emissions during 24-hour power outage 545 lbs/day
Maximum 24-hour NH3 ambient impact at property line 21.8 ug/m324-hr ASIL for ammonia 70.8 ug/m3
Hazard Quotient Assessment at Key Risk Assessment ReceptorsReceptorAveraging Period 1-hour Annual 1-hour Annual 1-hour Annual 1-hour Annual 1-hour AnnualAcrolein 1-hr Impact, ug/m3 0.001 -- 0.0006 -- 0.00072 -- 0.00069 -- 0.0007 --Acrolein 1-hr Emission, lbs/hr 5.97E-04 -- 5.97E-04 -- 5.97E-04 -- 5.97E-04 -- 5.97E-04 --Acrolein Dispersion Factor, ug/m3/(lbs/hr) 1.68E+00 -- 1.01E+00 -- 1.21E+00 -- 1.16E+00 -- 1.17E+00 --Ammonia Hourly Emission Rate, lbs/hour 22.7 -- 22.7 -- 22.7 -- 22.7 -- 22.7 --
Ammonia 1-hr Impact, ug/m3 38.1 -- 22.8 -- 27.4 -- 26.3 -- 26.6 --
Ammonia 1-hr Acute REL, ug/m3 3,200 -- 3,200 -- 3,200 -- 3,200 -- 3,200 --Ammonia Acute HQ 0.012 -- 0.007 -- 0.009 -- 0.008 -- 0.008 --DEEP annual, ug/m3 -- 0.08 -- 0.028 -- 0.014 -- 0.007 -- 0.003DEEP emissions, tons/yr -- 0.536 -- 0.536 -- 0.536 -- 0.536 -- 0.536DEEP Dispersion Factor, ug/m3/(tpy) -- 0.149 -- 0.052 -- 0.026 -- 0.013 -- 0.006Ammonia Annual Emission Rate, tons/yr -- 0.702 -- 0.702 -- 0.702 -- 0.702 -- 0.702
Ammonia Annual Impact, ug/m3 -- 0.105 -- 0.037 -- 0.018 -- 0.009 -- 0.004Ammonia Annual chronic REL, ug/m3 -- 200 -- 200 -- 200 -- 200 -- 200Ammonia Acute HQ -- 0.00052 -- 0.00018 -- 0.00009 -- 0.00005 -- 0.00002
Hourly Stack Test Limits
0.75 Mwe 2.0 MWE 2.5 Mwe 0.75 Mwe 2.0 MWE 2.5 Mwe10% 0.08 0.20 0.25 0.024 0.064 0.080
80% 0.60 1.60 2.00 0.19 0.51 0.64
100% 0.75 2.00 2.50 0.24 0.64 0.80
P:\1409\001\010\WIP\T\Emission Calcs\Preliminary Emissions Provided to Ecology & URS\[Rev-3-NH3-CNR 2000 Emission Calculations.xlsx]NH3 Emissions
Ammonia
Mwe at indicated load NH3 Emiss (lbs/hr) at indicated load
Hospital
Facility-Wide 1-Hour NH3 Emission Rate During a Power Outage, lbs/day
School
Facility-Wide Total Ammonia Emissions, tons/year
Facility-Wide Daily NH3 Emission Rate During a 24-hour Power Outage, lbs/day
MIBR MICR MIRR
APPENDIX F
Best Available Control TechnologyCost Spreadsheets
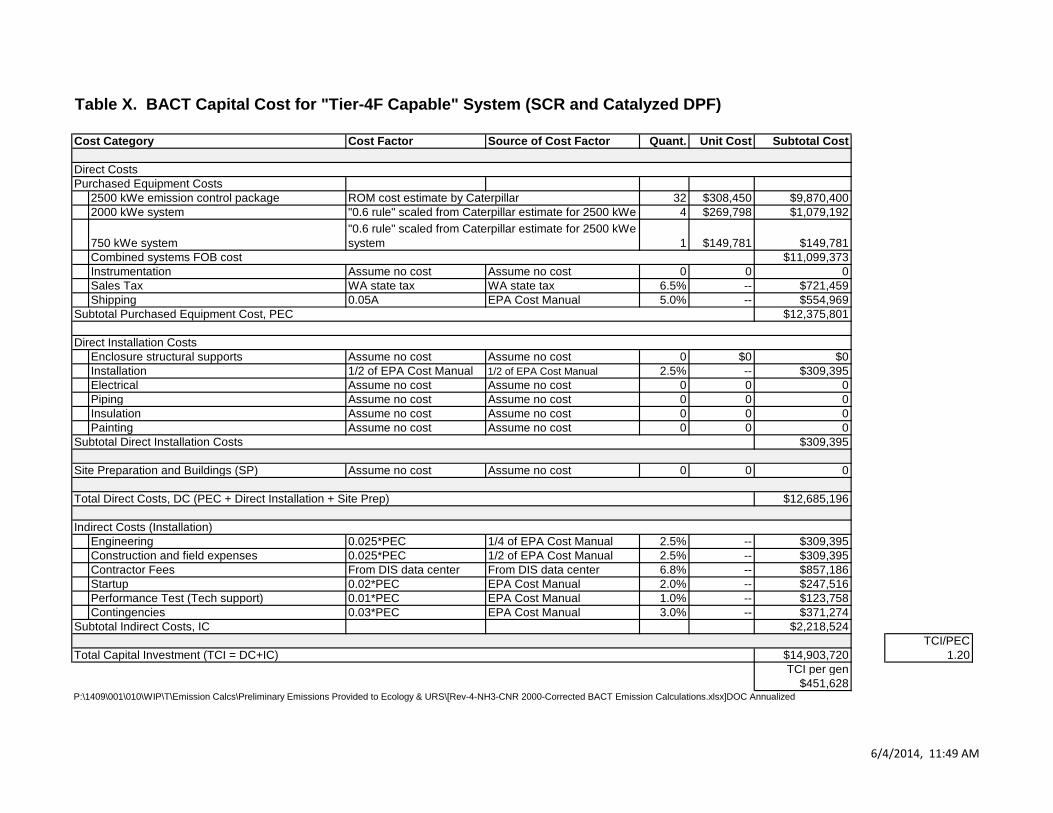
6/4/2014, 11:49 AM
Table X. BACT Capital Cost for "Tier-4F Capable" System (SCR and Catalyzed DPF)
Cost Factor Source of Cost Factor Quant. Unit Cost Subtotal Cost
Purchased Equipment Costs
2500 kWe emission control package 32 $308,450 $9,870,400
2000 kWe system 4 $269,798 $1,079,192
750 kWe system 1 $149,781 $149,781
$11,099,373
Instrumentation Assume no cost Assume no cost 0 0 0
Sales Tax WA state tax WA state tax 6.5% -- $721,459
Shipping 0.05A EPA Cost Manual 5.0% -- $554,969
$12,375,801
Enclosure structural supports Assume no cost Assume no cost 0 $0 $0
Installation 1/2 of EPA Cost Manual 1/2 of EPA Cost Manual 2.5% -- $309,395
Electrical Assume no cost Assume no cost 0 0 0
Piping Assume no cost Assume no cost 0 0 0
Insulation Assume no cost Assume no cost 0 0 0
Painting Assume no cost Assume no cost 0 0 0
$309,395
Site Preparation and Buildings (SP) Assume no cost Assume no cost 0 0 0
$12,685,196
Engineering 0.025*PEC 1/4 of EPA Cost Manual 2.5% -- $309,395
Construction and field expenses 0.025*PEC 1/2 of EPA Cost Manual 2.5% -- $309,395
Contractor Fees From DIS data center From DIS data center 6.8% -- $857,186
Startup 0.02*PEC EPA Cost Manual 2.0% -- $247,516
Performance Test (Tech support) 0.01*PEC EPA Cost Manual 1.0% -- $123,758
Contingencies 0.03*PEC EPA Cost Manual 3.0% -- $371,274
Subtotal Indirect Costs, IC $2,218,524
TCI/PEC
$14,903,720 1.20
TCI per gen
$451,628
Total Capital Investment (TCI = DC+IC)
P:\1409\001\010\WIP\T\Emission Calcs\Preliminary Emissions Provided to Ecology & URS\[Rev-4-NH3-CNR 2000-Corrected BACT Emission Calculations.xlsx]DOC Annualized
Subtotal Direct Installation Costs
Total Direct Costs, DC (PEC + Direct Installation + Site Prep)
Indirect Costs (Installation)
Direct Installation Costs
ROM cost estimate by Caterpillar
"0.6 rule" scaled from Caterpillar estimate for 2500 kWe
system
Combined systems FOB cost
Cost Category
Direct Costs
Subtotal Purchased Equipment Cost, PEC
"0.6 rule" scaled from Caterpillar estimate for 2500 kWe

6/4/2014, 11:49 AM
Item Quantity Units Unit cost Subtotal
$14,903,720
0.06401
$953,987
Annual Admin charges 0.02 $298,074
Annual Property tax 0.01 $149,037
Annual Insurance 0.01 $149,037 Annual O&M Cost Based on CARB Factors
$0Annual operation + maintenance (lowermost
CARB estimate) 131,552 Installed hp $3.00 $394,656
$596,149
$1,550,13665.3
54.64
$28,373
Criteria Pollutants Multi-Pollutant Cost-Effectiveness (Reasonable vs. Actual Control Cost) Criteria Pollutants Removal Tonnages (Nominal-Controlled)
Pollutant
Ecology Acceptable Unit
Cost ($/ton)Forecast Removal
(tons/yr) Pollutant PM (FH+BH) CO VOC NOX OtherNOX $10,000 45.10 $451,019 per year Tier-2 Uncontrolled TPY 1.21 8.62 1.881 53.5CO $5,000 7.76 $38,790 per year Controlled TPY 0.527 0.862 0.793 8.44VOC $9,999 1.09 $10,881 per year Tons Removed/Year 0.69 7.76 1.088 45.1PM (FH+BH) $23,200 0.69 $15,935 per year Combined Uncontrolled Tons/yr
Other Combined tons/yr Removed
$516,626 per year Overall Cold-Start Removal Effcy 57% 90% 58% 84%
$1,550,136 per year Annualized Cost ($/yr) $1,550,136 $1,550,136 $1,550,136 $1,550,136 $1,550,136
Indiv Poll $/Ton Removed $2,256,844 $199,809 $1,424,500 $34,370
TAPs Multi-Pollutant Cost-Effectiveness (Reasonable vs. Actual Control Cost) TAPs Removal Tonnages (Nominal-Controlled)
Pollutant
Ecology Acceptable Unit
Cost ($/ton)Forecast Removal
(tons/yr) PollutantDEEP
(FH+BH) COCarcinogen
VOC NO2
Non Carcinogen
VOC AcroleinNO2 $20,000 4.51 $90,204 per year Tier-2 Uncontrolled TPY 1.21 8.62 0.0299 5.35 0.0950 0.00023CO $5,000 7.76 $38,790 per year Controlled TPY 0.527 0.862 0.00299 0.84 0.00950 0.00002Carcinogen VOC $9,999 0.0269 $269 per year Tons Removed/Year 0.687 7.76 0.0269 4.51 0.0855 0.000206DEEP (FH+BH) $23,200 0.687 $15,935 per year Combined Uncontrolled Tons/yr
Non-carcinogen VOC $5,000 0.0855 $427 per year Combined tons/yr Removed
$145,626 per year Overall Cold-Start Removal Effcy 57% 90% 90% 84% 90% 90%
$1,550,136 per year Annualized Cost ($/yr) $1,550,136 $1,550,136 $1,550,136 $1,550,136 $1,550,136 $1,550,136
Indiv Poll $/Ton Removed $2,256,844 $199,809 $57,693,311 $343,696 $18,135,567 $7,530,126,622
Combined TAPs $/Ton Removed
Subtotal Direct Annual Costs
Table X. BACT Cost-Effectiveness for "Tier-4F Capable" System
Annualized Capital RecoveryTotal Capital Cost
Capital Recovery Factor, 25 yrs, 4% discount rate
Subtotal Annualized 25-year Capital Recovery Cost
Direct Annual Costs2% of TCI (EPA Manual)
1% of TCI (EPA Manual)
1% of TCI (EPA Manual)
Annual operation/labor/maintenance costs: Upperbound estimate would assume CARB's value of
$3.00/hp/year and would result in $423,000/year. Lower bound estimate would assume zero annual O&M.
Mid-range value would account for urea, fuel for pressure drop, increased inspections, periodic OEM visits,
and the costs for Ecology's increased emission testing requirements. For this screening-level analysis we assumed the lower-bound annual O&M cost of zero.
Total Annual Cost (Capital Recovery + Direct Annual Costs)Uncontrolled emissions (Combined Pollutants)Annual Tons Removed (Combined Pollutants)Cost Effectiveness ($ per tons combined pollutant destroyed)
Subtotal Reasonable Annual Cost ($/year)
65.26
54.64
Total Reasonable Annual Control Cost for Combined PollutantsActual Annual Control Cost
Is The Control Device Reasonable? NO (Actual >> Acceptable)
P:\1409\001\010\WIP\T\Emission Calcs\Preliminary Emissions Provided to Ecology & URS\[Rev-4-NH3-CNR 2000-Corrected BACT Emission Calculations.xlsx]DOC Annualized
Subtotal Reasonable Annual Cost ($/year)
Total Reasonable Annual Control Cost for Combined PollutantsActual Annual Control Cost
Is The Control Device Reasonable? NO (Actual >> Acceptable)
15.31
13.07
$118,624
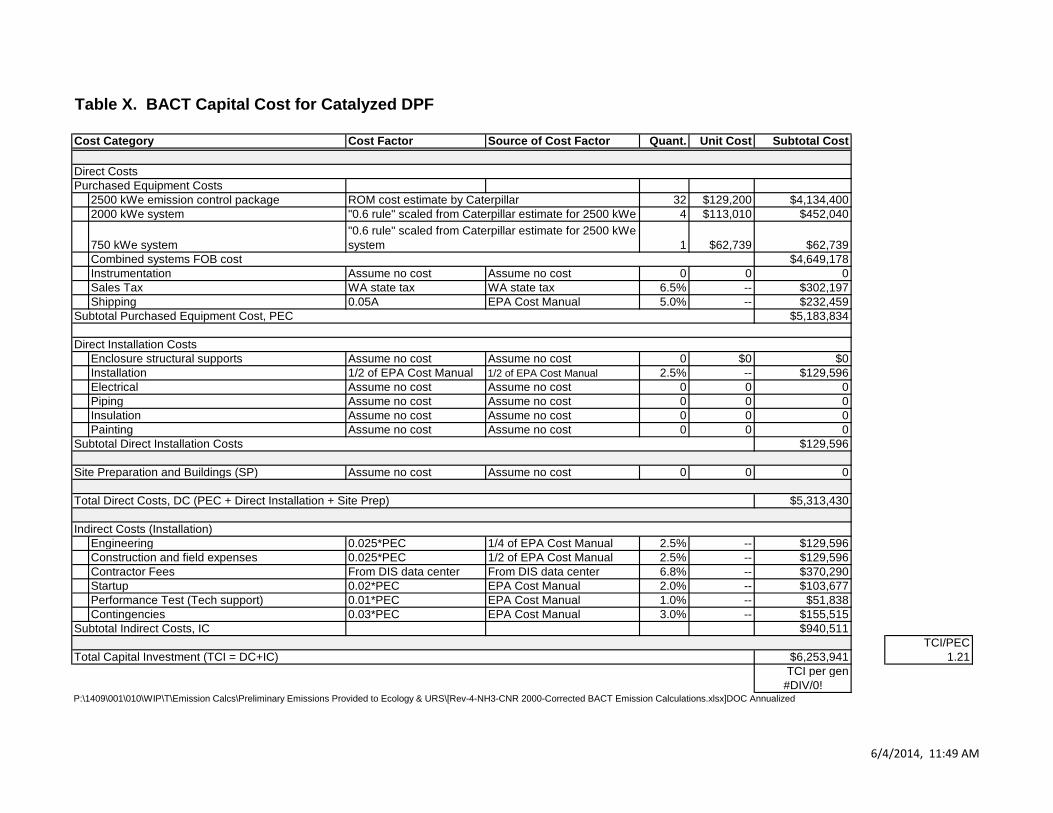
6/4/2014, 11:49 AM
Table X. BACT Capital Cost for Catalyzed DPF
Cost Factor Source of Cost Factor Quant. Unit Cost Subtotal Cost
Purchased Equipment Costs
2500 kWe emission control package 32 $129,200 $4,134,400
2000 kWe system 4 $113,010 $452,040
750 kWe system 1 $62,739 $62,739
$4,649,178
Instrumentation Assume no cost Assume no cost 0 0 0
Sales Tax WA state tax WA state tax 6.5% -- $302,197
Shipping 0.05A EPA Cost Manual 5.0% -- $232,459
$5,183,834
Enclosure structural supports Assume no cost Assume no cost 0 $0 $0
Installation 1/2 of EPA Cost Manual 1/2 of EPA Cost Manual 2.5% -- $129,596
Electrical Assume no cost Assume no cost 0 0 0
Piping Assume no cost Assume no cost 0 0 0
Insulation Assume no cost Assume no cost 0 0 0
Painting Assume no cost Assume no cost 0 0 0
$129,596
Site Preparation and Buildings (SP) Assume no cost Assume no cost 0 0 0
$5,313,430
Engineering 0.025*PEC 1/4 of EPA Cost Manual 2.5% -- $129,596
Construction and field expenses 0.025*PEC 1/2 of EPA Cost Manual 2.5% -- $129,596
Contractor Fees From DIS data center From DIS data center 6.8% -- $370,290
Startup 0.02*PEC EPA Cost Manual 2.0% -- $103,677
Performance Test (Tech support) 0.01*PEC EPA Cost Manual 1.0% -- $51,838
Contingencies 0.03*PEC EPA Cost Manual 3.0% -- $155,515
Subtotal Indirect Costs, IC $940,511
TCI/PEC
$6,253,941 1.21
TCI per gen
#DIV/0!
Combined systems FOB cost
Cost Category
Direct Costs
ROM cost estimate by Caterpillar
"0.6 rule" scaled from Caterpillar estimate for 2500 kWe
system
"0.6 rule" scaled from Caterpillar estimate for 2500 kWe
P:\1409\001\010\WIP\T\Emission Calcs\Preliminary Emissions Provided to Ecology & URS\[Rev-4-NH3-CNR 2000-Corrected BACT Emission Calculations.xlsx]DOC Annualized
Subtotal Purchased Equipment Cost, PEC
Direct Installation Costs
Subtotal Direct Installation Costs
Total Direct Costs, DC (PEC + Direct Installation + Site Prep)
Indirect Costs (Installation)
Total Capital Investment (TCI = DC+IC)
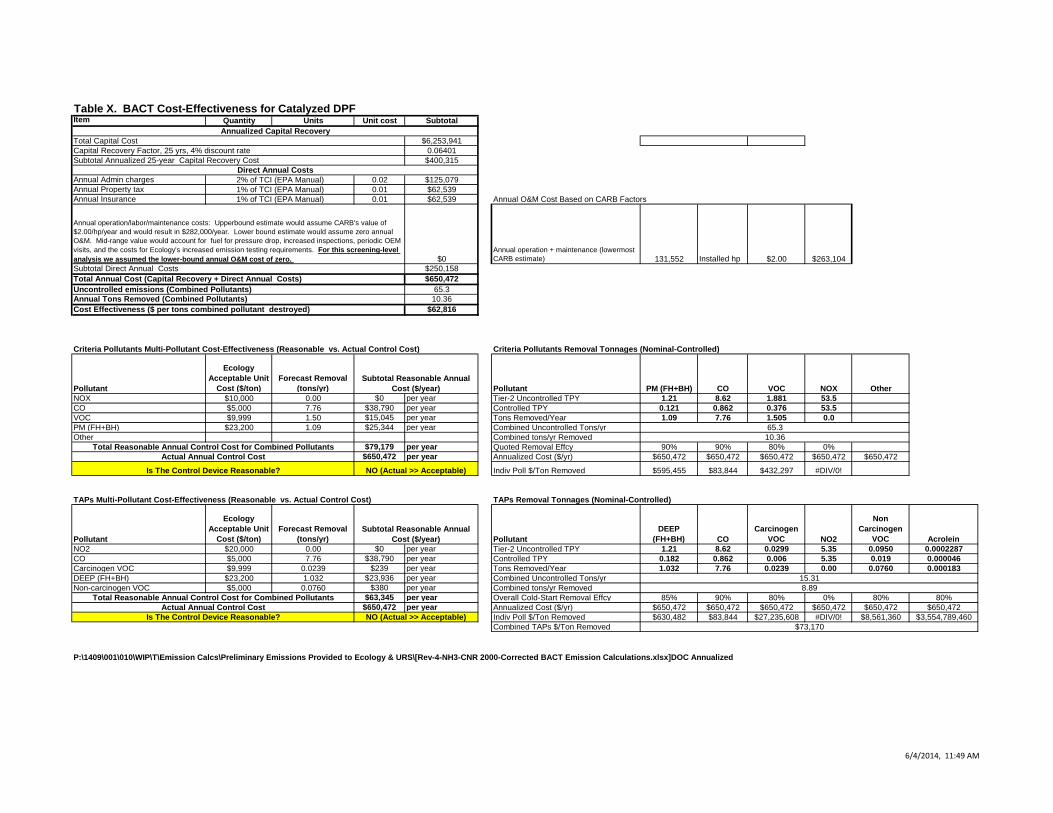
6/4/2014, 11:49 AM
Item Quantity Units Unit cost Subtotal
$6,253,941
0.06401
$400,315
Annual Admin charges 0.02 $125,079
Annual Property tax 0.01 $62,539
Annual Insurance 0.01 $62,539 Annual O&M Cost Based on CARB Factors
$0
Annual operation + maintenance (lowermost
CARB estimate) 131,552 Installed hp $2.00 $263,104
$250,158
$650,47265.3
10.36
$62,816
Criteria Pollutants Multi-Pollutant Cost-Effectiveness (Reasonable vs. Actual Control Cost) Criteria Pollutants Removal Tonnages (Nominal-Controlled)
Pollutant
Ecology Acceptable Unit
Cost ($/ton)Forecast Removal
(tons/yr) Pollutant PM (FH+BH) CO VOC NOX OtherNOX $10,000 0.00 $0 per year Tier-2 Uncontrolled TPY 1.21 8.62 1.881 53.5CO $5,000 7.76 $38,790 per year Controlled TPY 0.121 0.862 0.376 53.5VOC $9,999 1.50 $15,045 per year Tons Removed/Year 1.09 7.76 1.505 0.0PM (FH+BH) $23,200 1.09 $25,344 per year Combined Uncontrolled Tons/yr
Other Combined tons/yr Removed
$79,179 per year Quoted Removal Effcy 90% 90% 80% 0%
$650,472 per year Annualized Cost ($/yr) $650,472 $650,472 $650,472 $650,472 $650,472
Indiv Poll $/Ton Removed $595,455 $83,844 $432,297 #DIV/0!
TAPs Multi-Pollutant Cost-Effectiveness (Reasonable vs. Actual Control Cost) TAPs Removal Tonnages (Nominal-Controlled)
Pollutant
Ecology Acceptable Unit
Cost ($/ton)Forecast Removal
(tons/yr) PollutantDEEP
(FH+BH) COCarcinogen
VOC NO2
Non Carcinogen
VOC AcroleinNO2 $20,000 0.00 $0 per year Tier-2 Uncontrolled TPY 1.21 8.62 0.0299 5.35 0.0950 0.0002287CO $5,000 7.76 $38,790 per year Controlled TPY 0.182 0.862 0.006 5.35 0.019 0.000046Carcinogen VOC $9,999 0.0239 $239 per year Tons Removed/Year 1.032 7.76 0.0239 0.00 0.0760 0.000183DEEP (FH+BH) $23,200 1.032 $23,936 per year Combined Uncontrolled Tons/yr
Non-carcinogen VOC $5,000 0.0760 $380 per year Combined tons/yr Removed
$63,345 per year Overall Cold-Start Removal Effcy 85% 90% 80% 0% 80% 80%
$650,472 per year Annualized Cost ($/yr) $650,472 $650,472 $650,472 $650,472 $650,472 $650,472
Indiv Poll $/Ton Removed $630,482 $83,844 $27,235,608 #DIV/0! $8,561,360 $3,554,789,460
Combined TAPs $/Ton Removed
Subtotal Annualized 25-year Capital Recovery Cost
Table X. BACT Cost-Effectiveness for Catalyzed DPF
Annualized Capital RecoveryTotal Capital Cost
Capital Recovery Factor, 25 yrs, 4% discount rate
65.3
Direct Annual Costs2% of TCI (EPA Manual)
1% of TCI (EPA Manual)
1% of TCI (EPA Manual)
Annual operation/labor/maintenance costs: Upperbound estimate would assume CARB's value of
$2.00/hp/year and would result in $282,000/year. Lower bound estimate would assume zero annual
O&M. Mid-range value would account for fuel for pressure drop, increased inspections, periodic OEM
visits, and the costs for Ecology's increased emission testing requirements. For this screening-level analysis we assumed the lower-bound annual O&M cost of zero. Subtotal Direct Annual Costs
Total Annual Cost (Capital Recovery + Direct Annual Costs)Uncontrolled emissions (Combined Pollutants)Annual Tons Removed (Combined Pollutants)Cost Effectiveness ($ per tons combined pollutant destroyed)
Subtotal Reasonable Annual Cost ($/year)
15.31
8.89
10.36
Total Reasonable Annual Control Cost for Combined PollutantsActual Annual Control Cost
Is The Control Device Reasonable? NO (Actual >> Acceptable)
Subtotal Reasonable Annual Cost ($/year)
P:\1409\001\010\WIP\T\Emission Calcs\Preliminary Emissions Provided to Ecology & URS\[Rev-4-NH3-CNR 2000-Corrected BACT Emission Calculations.xlsx]DOC Annualized
Total Reasonable Annual Control Cost for Combined PollutantsActual Annual Control Cost
Is The Control Device Reasonable? NO (Actual >> Acceptable)$73,170

6/4/2014, 11:49 AM
Table X. BACT Capital Cost for Urea-SCR By Itself
Cost Factor Source of Cost Factor Quant. Unit Cost Subtotal Cost
Purchased Equipment Costs
2500 kWe emission control package 32 $200,600 $6,419,200
2000 kWe system 4 $175,463 $701,851
750 kWe system 1 $97,410 $97,410
$6,516,610
Instrumentation Assume no cost Assume no cost 0 0 0
Sales Tax WA state tax WA state tax 6.5% -- $423,580
Shipping 0.05A EPA Cost Manual 5.0% -- $325,831
$7,266,020
Enclosure structural supports Assume no cost Assume no cost 0 $0 $0
Installation 1/2 of EPA Cost Manual 1/2 of EPA Cost Manual 2.5% -- $181,651
Electrical Assume no cost Assume no cost 0 0 0
Piping Assume no cost Assume no cost 0 0 0
Insulation Assume no cost Assume no cost 0 0 0
Painting Assume no cost Assume no cost 0 0 0
$181,651
Site Preparation and Buildings (SP) Assume no cost Assume no cost 0 0 0
$7,447,671
Engineering 0.025*PEC 1/4 of EPA Cost Manual 2.5% -- $181,651
Construction and field expenses 0.025*PEC 1/2 of EPA Cost Manual 2.5% -- $181,651
Contractor Fees From DIS data center From DIS data center 6.8% -- $511,254
Startup 0.02*PEC EPA Cost Manual 2.0% -- $145,320
Performance Test (Tech support) 0.01*PEC EPA Cost Manual 1.0% -- $72,660
Contingencies 0.03*PEC EPA Cost Manual 3.0% -- $217,981
Subtotal Indirect Costs, IC $1,310,516
TCI/PEC
$8,758,186 1.21
TCI per gen
#DIV/0!
Combined systems FOB cost
Cost Category
Direct Costs
ROM cost estimate by Caterpillar
"0.6 rule" scaled from Caterpillar estimate for 2500 kWe
system
"0.6 rule" scaled from Caterpillar estimate for 2500 kWe
P:\1409\001\010\WIP\T\Emission Calcs\Preliminary Emissions Provided to Ecology & URS\[Rev-4-NH3-CNR 2000-Corrected BACT Emission Calculations.xlsx]DOC Annualized
Subtotal Purchased Equipment Cost, PEC
Direct Installation Costs
Subtotal Direct Installation Costs
Total Direct Costs, DC (PEC + Direct Installation + Site Prep)
Indirect Costs (Installation)
Total Capital Investment (TCI = DC+IC)

6/4/2014, 11:49 AM
Item Quantity Units Unit cost Subtotal
$8,758,186
0.06401
$560,612
Annual Admin charges 0.02 $175,164
Annual Property tax 0.01 $87,582
Annual Insurance 0.01 $87,582 Annual O&M Cost Based on CARB Factors
$0
Annual operation + maintenance (lowermost
CARB estimate) 131,552 Installed hp $3.00 $394,656
$350,327
$910,93965.3
47.65
$19,115
Criteria Pollutants Multi-Pollutant Cost-Effectiveness (Reasonable vs. Actual Control Cost) Criteria Pollutants Removal Tonnages (Nominal-Controlled)
Pollutant
Ecology Acceptable Unit
Cost ($/ton)Forecast Removal
(tons/yr) Pollutant PM (FH+BH) CO VOC NOX OtherNOX $10,000 47.65 $476,545 per year Tier-2 Uncontrolled TPY 1.21 8.62 1.881 53.5CO $5,000 0.00 $0 per year Controlled TPY 1.214 8.620 1.881 5.9VOC $9,999 0.00 $0 per year Tons Removed/Year 0.00 0.00 0.000 47.7PM (FH+BH) $23,200 0.00 $0 per year Combined Uncontrolled Tons/yr
Other Combined tons/yr Removed
$476,545 per year Quoted Removal Effcy 0% 0% 0% 89%
$910,939 per year Annualized Cost ($/yr) $910,939 $910,939 $910,939 $910,939 $910,939
Indiv Poll $/Ton Removed #DIV/0! #DIV/0! #DIV/0! $19,115
TAPs Multi-Pollutant Cost-Effectiveness (Reasonable vs. Actual Control Cost) TAPs Removal Tonnages (Nominal-Controlled)
Pollutant
Ecology Acceptable Unit
Cost ($/ton)Forecast Removal
(tons/yr) PollutantDEEP
(FH+BH) COCarcinogen
VOC NO2
Non Carcinogen
VOC AcroleinNO2 $20,000 4.77 $95,309 per year Tier-2 Uncontrolled TPY 1.21 8.62 0.0299 5.35 0.0950 0.0002287CO $5,000 0.00 $0 per year Controlled TPY 1.214 8.620 0.030 0.59 0.095 0.000229Carcinogen VOC $9,999 0.0000 $0 per year Tons Removed/Year 0.000 0.00 0.0000 4.77 0.0000 0.000000DEEP (FH+BH) $23,200 0.000 $0 per year Combined Uncontrolled Tons/yr
Non-carcinogen VOC $5,000 0.0000 $0 per year Combined tons/yr Removed
$95,309 per year Overall Cold-Start Removal Effcy 0% 0% 0% 89% 0% 0%
$910,939 per year Annualized Cost ($/yr) $910,939 $910,939 $910,939 $910,939 $910,939 $910,939
Indiv Poll $/Ton Removed #DIV/0! #DIV/0! #DIV/0! $191,155 #DIV/0! #DIV/0!
Combined TAPs $/Ton Removed
Subtotal Annualized 25-year Capital Recovery Cost
Table X. BACT Cost-Effectiveness for Urea-SCR By Itself
Annualized Capital RecoveryTotal Capital Cost
Capital Recovery Factor, 25 yrs, 4% discount rate
65.3
Direct Annual Costs2% of TCI (EPA Manual)
1% of TCI (EPA Manual)
1% of TCI (EPA Manual)
Annual operation/labor/maintenance costs: Upperbound estimate would assume CARB's value of
$3.00/hp/year and would result in $423,000/year. Lower bound estimate would assume zero annual
O&M. Mid-range value would account for urea, fuel for pressure drop, increased inspections, periodic
OEM visits, and the costs for Ecology's increased emission testing requirements. For this screening-level analysis we assumed the lower-bound annual O&M cost of zero. Subtotal Direct Annual Costs
Subtotal Reasonable Annual Cost ($/year)
Total Annual Cost (Capital Recovery + Direct Annual Costs)Uncontrolled emissions (Combined Pollutants)Annual Tons Removed (Combined Pollutants)Cost Effectiveness ($ per tons combined pollutant destroyed)
Subtotal Reasonable Annual Cost ($/year)
47.65
Total Reasonable Annual Control Cost for Combined PollutantsActual Annual Control Cost
Is The Control Device Reasonable? NO (Actual >> Acceptable)
$191,155
P:\1409\001\010\WIP\T\Emission Calcs\Preliminary Emissions Provided to Ecology & URS\[Rev-4-NH3-CNR 2000-Corrected BACT Emission Calculations.xlsx]DOC Annualized
15.31
4.77
Total Reasonable Annual Control Cost for Combined PollutantsActual Annual Control Cost
Is The Control Device Reasonable? NO (Actual >> Acceptable)

6/4/2014, 11:49 AM
Table X. BACT Capital Cost for DOC By Itself
Cost Factor Source of Cost Factor Quant. Unit Cost Subtotal Cost
Purchased Equipment Costs
2500 kWe emission control package 32 $52,100 $1,667,200
2000 kWe system 4 $45,571 $182,285
750 kWe system 1 $25,299 $25,299
$1,874,785
Instrumentation Assume no cost Assume no cost 0 0 0
Sales Tax WA state tax WA state tax 6.5% -- $121,861
Shipping 0.05A EPA Cost Manual 5.0% -- $93,739
$2,090,385
Enclosure structural supports Assume no cost Assume no cost 0 $0 $0
Installation 1/2 of EPA Cost Manual 1/2 of EPA Cost Manual 2.5% -- $52,260
Electrical Assume no cost Assume no cost 0 0 0
Piping Assume no cost Assume no cost 0 0 0
Insulation Assume no cost Assume no cost 0 0 0
Painting Assume no cost Assume no cost 0 0 0
$52,260
Site Preparation and Buildings (SP) Assume no cost Assume no cost 0 0 0
$2,142,645
Engineering 0.025*PEC 1/4 of EPA Cost Manual 2.5% -- $52,260
Construction and field expenses 0.025*PEC 1/2 of EPA Cost Manual 2.5% -- $52,260
Contractor Fees From DIS data center From DIS data center 6.8% -- $160,863
Startup 0.02*PEC EPA Cost Manual 2.0% -- $41,808
Performance Test (Tech support) 0.01*PEC EPA Cost Manual 1.0% -- $20,904
Contingencies 0.03*PEC EPA Cost Manual 3.0% -- $62,712
Subtotal Indirect Costs, IC $390,805
TCI/PEC
$2,533,450 1.21
TCI per gen
#DIV/0!
Combined systems FOB cost
Cost Category
Direct Costs
ROM cost estimate by Caterpillar
"0.6 rule" scaled from Caterpillar estimate for 2500 kWe
system
"0.6 rule" scaled from Caterpillar estimate for 2500 kWe
P:\1409\001\010\WIP\T\Emission Calcs\Preliminary Emissions Provided to Ecology & URS\[Rev-4-NH3-CNR 2000-Corrected BACT Emission Calculations.xlsx]DOC Annualized
Subtotal Purchased Equipment Cost, PEC
Direct Installation Costs
Subtotal Direct Installation Costs
Total Direct Costs, DC (PEC + Direct Installation + Site Prep)
Indirect Costs (Installation)
Total Capital Investment (TCI = DC+IC)

6/4/2014, 11:49 AM
Item Quantity Units Unit cost Subtotal
$2,533,450
0.06401
$162,166
Annual Admin charges 0.02 $50,669
Annual Property tax 0.01 $25,335
Annual Insurance 0.01 $25,335 Annual O&M Cost Based on CARB Factors
$0
Annual operation + maintenance (lowermost
CARB estimate) 131,552 Installed hp $0.20 $26,310
$101,338
$263,50465.3
9.51
$27,721
Criteria Pollutants Multi-Pollutant Cost-Effectiveness (Reasonable vs. Actual Control Cost) Criteria Pollutants Removal Tonnages (Nominal-Controlled)
Pollutant
Ecology Acceptable Unit
Cost ($/ton)Forecast Removal
(tons/yr) Pollutant PM (FH+BH) CO VOC NOX OtherNOX $10,000 0.00 $0 per year Tier-2 Uncontrolled TPY 1.21 8.62 1.881 53.5CO $5,000 7.76 $38,790 per year Controlled TPY 0.971 0.862 0.376 53.5VOC $9,999 1.50 $15,045 per year Tons Removed/Year 0.24 7.76 1.505 0.0PM (FH+BH) $23,200 0.24 $5,632 per year Combined Uncontrolled Tons/yr
Other Combined tons/yr Removed
$59,468 per year Quoted Removal Effcy 20% 90% 80% 0%
$263,504 per year Annualized Cost ($/yr) $263,504 $263,504 $263,504 $263,504 $263,504
Indiv Poll $/Ton Removed $1,085,476 $33,965 $175,122 #DIV/0!
TAPs Multi-Pollutant Cost-Effectiveness (Reasonable vs. Actual Control Cost) TAPs Removal Tonnages (Nominal-Controlled)
Pollutant
Ecology Acceptable Unit
Cost ($/ton)Forecast Removal
(tons/yr) PollutantDEEP
(FH+BH) COCarcinogen
VOC NO2
Non Carcinogen
VOC AcroleinNO2 $20,000 0.00 $0 per year Tier-2 Uncontrolled TPY 1.21 8.62 0.0299 5.35 0.0950 0.0002287CO $5,000 7.76 $38,790 per year Controlled TPY 0.971 0.862 0.006 5.35 0.019 0.000046Carcinogen VOC $9,999 0.0239 $239 per year Tons Removed/Year 0.243 7.76 0.0239 0.00 0.0760 0.000183DEEP (FH+BH) $23,200 0.243 $5,632 per year Combined Uncontrolled Tons/yr
Non-carcinogen VOC $5,000 0.0760 $380 per year Combined tons/yr Removed
$45,041 per year Overall Cold-Start Removal Effcy 20% 90% 80% 0% 80% 80%
$263,504 per year Annualized Cost ($/yr) $263,504 $263,504 $263,504 $263,504 $263,504 $263,504
Indiv Poll $/Ton Removed $1,085,476 $33,965 $11,033,051 #DIV/0! $3,468,177 $1,440,033,028
Combined TAPs $/Ton Removed
Subtotal Annualized 25-year Capital Recovery Cost
Table X. BACT Cost-Effectiveness for DOC By Itself
Annualized Capital RecoveryTotal Capital Cost
Capital Recovery Factor, 25 yrs, 4% discount rate
65.3
Direct Annual Costs2% of TCI (EPA Manual)
1% of TCI (EPA Manual)
1% of TCI (EPA Manual)
Annual operation/labor/maintenance costs: Upperbound estimate would assume CARB's value of
$0.20/hp/year and would result in $28,000/year. Lower bound estimate would assume zero annual
O&M. Mid-range value would account for fuel for pressure drop, increased inspections, periodic OEM
visits, and the costs for Ecology's increased emission testing requirements. For this screening-level analysis we assumed the lower-bound annual O&M cost of zero. Subtotal Direct Annual Costs
Subtotal Reasonable Annual Cost ($/year)
Total Annual Cost (Capital Recovery + Direct Annual Costs)Uncontrolled emissions (Combined Pollutants)Annual Tons Removed (Combined Pollutants)Cost Effectiveness ($ per tons combined pollutant destroyed)
Subtotal Reasonable Annual Cost ($/year)
9.51
Total Reasonable Annual Control Cost for Combined PollutantsActual Annual Control Cost
Is The Control Device Reasonable? NO (Actual >> Acceptable)
$32,528
P:\1409\001\010\WIP\T\Emission Calcs\Preliminary Emissions Provided to Ecology & URS\[Rev-4-NH3-CNR 2000-Corrected BACT Emission Calculations.xlsx]DOC Annualized
15.31
8.10
Total Reasonable Annual Control Cost for Combined PollutantsActual Annual Control Cost
Is The Control Device Reasonable? NO (Actual >> Acceptable)

APPENDIX G
Ambient Air Quality Modeling
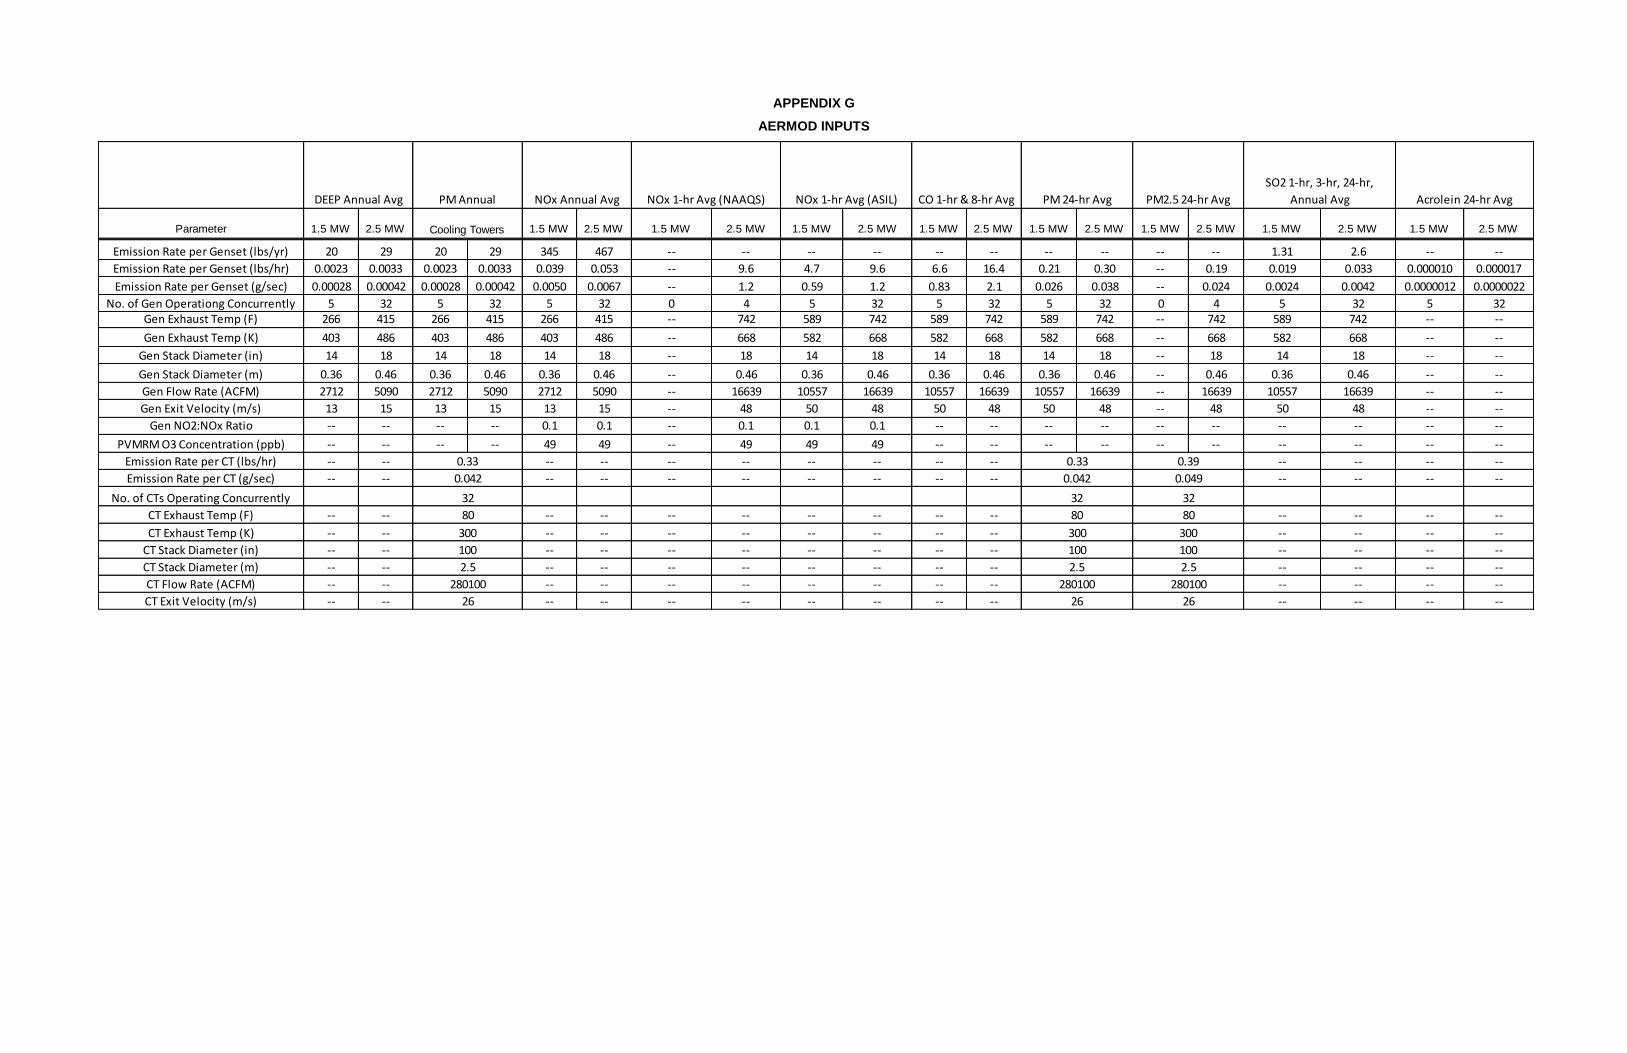
APPENDIX G
AERMOD INPUTS
Parameter 1.5 MW 2.5 MW 1.5 MW 2.5 MW 1.5 MW 2.5 MW 1.5 MW 2.5 MW 1.5 MW 2.5 MW 1.5 MW 2.5 MW 1.5 MW 2.5 MW 1.5 MW 2.5 MW 1.5 MW 2.5 MW
Emission Rate per Genset (lbs/yr) 20 29 20 29 345 467 -- -- -- -- -- -- -- -- -- -- 1.31 2.6 -- --
Emission Rate per Genset (lbs/hr) 0.0023 0.0033 0.0023 0.0033 0.039 0.053 -- 9.6 4.7 9.6 6.6 16.4 0.21 0.30 -- 0.19 0.019 0.033 0.000010 0.000017
Emission Rate per Genset (g/sec) 0.00028 0.00042 0.00028 0.00042 0.0050 0.0067 -- 1.2 0.59 1.2 0.83 2.1 0.026 0.038 -- 0.024 0.0024 0.0042 0.0000012 0.0000022
No. of Gen Operationg Concurrently 5 32 5 32 5 32 0 4 5 32 5 32 5 32 0 4 5 32 5 32Gen Exhaust Temp (F) 266 415 266 415 266 415 -- 742 589 742 589 742 589 742 -- 742 589 742 -- --
Gen Exhaust Temp (K) 403 486 403 486 403 486 -- 668 582 668 582 668 582 668 -- 668 582 668 -- --
Gen Stack Diameter (in) 14 18 14 18 14 18 -- 18 14 18 14 18 14 18 -- 18 14 18 -- --
Gen Stack Diameter (m) 0.36 0.46 0.36 0.46 0.36 0.46 -- 0.46 0.36 0.46 0.36 0.46 0.36 0.46 -- 0.46 0.36 0.46 -- --
Gen Flow Rate (ACFM) 2712 5090 2712 5090 2712 5090 -- 16639 10557 16639 10557 16639 10557 16639 -- 16639 10557 16639 -- --
Gen Exit Velocity (m/s) 13 15 13 15 13 15 -- 48 50 48 50 48 50 48 -- 48 50 48 -- --
Gen NO2:NOx Ratio -- -- -- -- 0.1 0.1 -- 0.1 0.1 0.1 -- -- -- -- -- -- -- -- -- --
PVMRM O3 Concentration (ppb) -- -- -- -- 49 49 -- 49 49 49 -- -- -- -- -- -- -- -- -- --
Emission Rate per CT (lbs/hr) -- -- -- -- -- -- -- -- -- -- -- -- -- --
Emission Rate per CT (g/sec) -- -- -- -- -- -- -- -- -- -- -- -- -- --
No. of CTs Operating Concurrently
CT Exhaust Temp (F) -- -- -- -- -- -- -- -- -- -- -- -- -- --
CT Exhaust Temp (K) -- -- -- -- -- -- -- -- -- -- -- -- -- --
CT Stack Diameter (in) -- -- -- -- -- -- -- -- -- -- -- -- -- --
CT Stack Diameter (m) -- -- -- -- -- -- -- -- -- -- -- -- -- --
CT Flow Rate (ACFM) -- -- -- -- -- -- -- -- -- -- -- -- -- --
CT Exit Velocity (m/s) -- -- -- -- -- -- -- -- -- -- -- -- -- --26
32 32 32
80
300
100
2.5
280100
26
80
300
100
2.5
280100
26
80
300
100
2.5
280100
0.042
0.33
0.042
0.39
0.049
Acrolein 24-hr Avg
SO2 1-hr, 3-hr, 24-hr,
Annual AvgPM 24-hr AvgNOx 1-hr Avg (NAAQS) CO 1-hr & 8-hr Avg PM2.5 24-hr AvgNOx 1-hr Avg (ASIL)DEEP Annual Avg NOx Annual AvgPM Annual
Cooling Towers
0.33

Adjusted AERMOD Dispersion FactorsOriginal AERMOD Configuration: CNR Gensets = 1500 kW; Admin Genset = 1500 kWRevised Configuration: CNR Gensets = 2500 kW; Admin Genset = 750 kW
Pollutant and Averaging Period Operating Scenario
Original Gnerator Ambient Impact
(ug/m3) with CNR Gens = 1500
kWe
Original Facility-Wide Emission
Rate for CNR Gens = 1500
kWeEmission Rate
Units
Adjusted Facility-Wide Emission
Rate for CNR Gens = 2500 kW
Emission Rate Adjustment
Factor for CNR Gens = 2500 kWe
Revised Generator
Ambient Impact (ug/m3) for CNR
Gens = 2500 kWe24-hr PM10 NAAQS Facility Wide Power Outage 11 246 lbs/day DEEP 252 1.024 11.31-hr NO2 ASIL Facility Wide Power Outage 366 332 lbs/hr Nox 352 1.060 3881-hr CO NAAQS Facility Wide Power Outage 1507 559 lbs/hr CO 593 1.061 15998-hr CO NAAQS Facility Wide Power Outage 873 559 lbs/hr CO 593 1.061 926Annual NO2 Combined Annual Operations 1.1 8.33 tons/year NOX 8.57 1.029 1.1Annual DEEP at MIBR Combined Annual Operations 0.077 0.516 tons/year DEEP 0.531 1.029 0.079
P:\1409\001\010\WIP\T\Emission Calcs\Preliminary Emissions Provided to Ecology & URS\[CNR 2500 Emission Calculations.xlsx]Adjusted Dispersion Factors
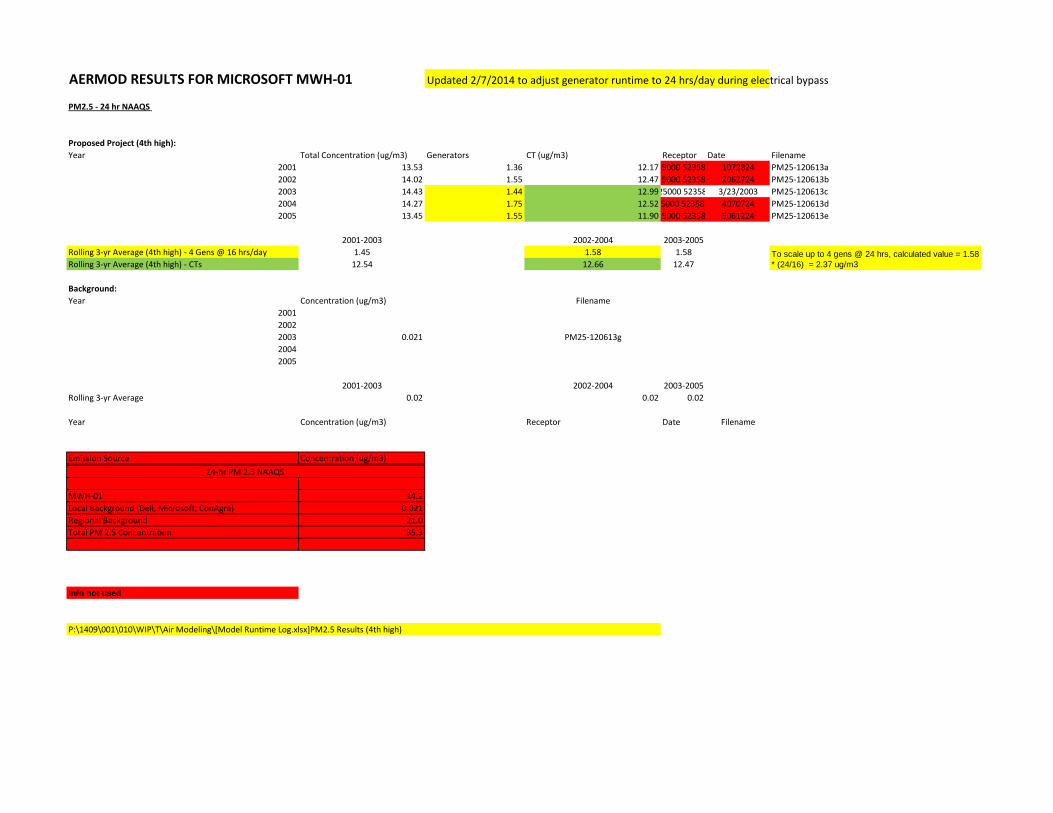
AERMOD RESULTS FOR MICROSOFT MWH-01 Updated 2/7/2014 to adjust generator runtime to 24 hrs/day during electrical bypass
PM2.5 - 24 hr NAAQS
Proposed Project (4th high):Year Total Concentration (ug/m3) Generators CT (ug/m3) Receptor Date Filename
2001 13.53 1.36 12.1725000 52358 1072824 PM25-120613a2002 14.02 1.55 12.4725000 52358 2062724 PM25-120613b2003 14.43 1.44 12.99 25000 52358 3/23/2003 PM25-120613c2004 14.27 1.75 12.52 5000 523588 4070724 PM25-120613d2005 13.45 1.55 11.9025000 52358 5061224 PM25-120613e
2001-2003 2002-2004 2003-2005Rolling 3-yr Average (4th high) - 4 Gens @ 16 hrs/day 1.45 1.58 1.58Rolling 3-yr Average (4th high) - CTs 12.54 12.66 12.47
Background:Year Concentration (ug/m3) Filename
200120022003 0.021 PM25-120613g20042005
2001-2003 2002-2004 2003-2005Rolling 3-yr Average 0.02 0.02 0.02
Year Concentration (ug/m3) Receptor Date Filename
Emission Source Concentration (ug/m3)
MWH-01 14.2Local Background (Dell, Microsoft, ConAgra) 0.021Regional Background 21.0Total PM 2.5 Concentration 35.3
Info not used
P:\1409\001\010\WIP\T\Air Modeling\[Model Runtime Log.xlsx]PM2.5 Results (4th high)
24-hr PM 2.5 NAAQS
To scale up to 4 gens @ 24 hrs, calculated value = 1.58
* (24/16) = 2.37 ug/m3
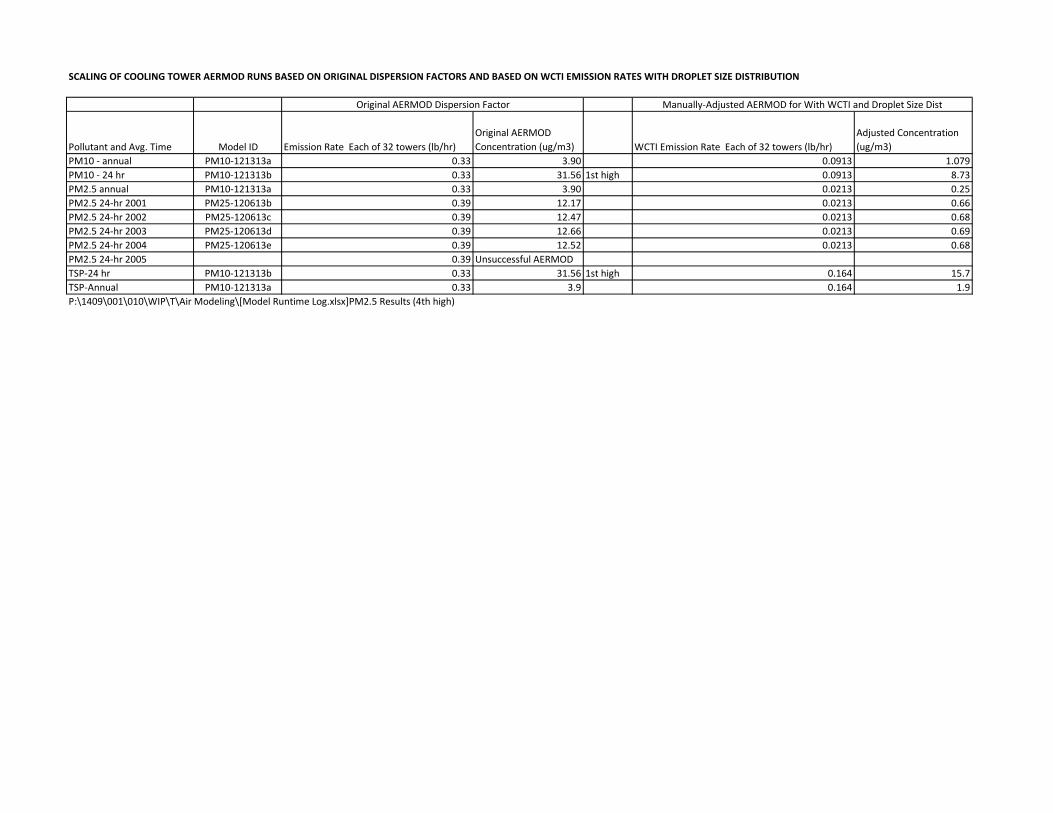
SCALING OF COOLING TOWER AERMOD RUNS BASED ON ORIGINAL DISPERSION FACTORS AND BASED ON WCTI EMISSION RATES WITH DROPLET SIZE DISTRIBUTION
Pollutant and Avg. Time Model ID Emission Rate Each of 32 towers (lb/hr)Original AERMOD Concentration (ug/m3) WCTI Emission Rate Each of 32 towers (lb/hr)
Adjusted Concentration (ug/m3)
PM10 - annual PM10-121313a 0.33 3.90 0.0913 1.079PM10 - 24 hr PM10-121313b 0.33 31.56 1st high 0.0913 8.73PM2.5 annual PM10-121313a 0.33 3.90 0.0213 0.25PM2.5 24-hr 2001 PM25-120613b 0.39 12.17 0.0213 0.66PM2.5 24-hr 2002 PM25-120613c 0.39 12.47 0.0213 0.68PM2.5 24-hr 2003 PM25-120613d 0.39 12.66 0.0213 0.69PM2.5 24-hr 2004 PM25-120613e 0.39 12.52 0.0213 0.68PM2.5 24-hr 2005 0.39 Unsuccessful AERMODTSP-24 hr PM10-121313b 0.33 31.56 1st high 0.164 15.7TSP-Annual PM10-121313a 0.33 3.9 0.164 1.9P:\1409\001\010\WIP\T\Air Modeling\[Model Runtime Log.xlsx]PM2.5 Results (4th high)
Original AERMOD Dispersion Factor Manually-Adjusted AERMOD for With WCTI and Droplet Size Dist

APPENDIX H
AERMOD Files(Provided under separate cover)