final project report - california...1 project summary this final project report provides a brief...
TRANSCRIPT

Beach Monitoring Phylochip ProjectClean Beaches Grant Program, Proposition 50
Final Project Report
Agreement 07-576-550-02
Between the State Water Resources Control Boardand
County of Marin Environmental Health Services
Funding for this project was provided by the State Water Resources Control Boardand came from Proposition 50: the Water Security, Clean Drinking Water, Coastaland Beach Protection Act of 2002. Additional funding provided by the Rathmann
Family Foundation.
Project Cost: $942,237.10
August 2012


Table of Contents
Project Summary 1
Table One: Items for Review 9
Project Monitoring, including Table Two and Location Maps 10
Project Costs, Public Outreach 15
PAEP: Analysis and Conclusions 19
Lessons Learned 24
Recommendations and Future Research 27
List of Appendices 29
Appendices 31 et seq


1
PROJECT SUMMARY
This final project report provides a brief project description, a summary of the activities completed,references to deliverables sent during the project timeline and a link to the web site developed aspart of the project. Also included are several peer-reviewed scientific papers prepared byresearchers associated with the project. These are attached as appendices, which are listed on page29 of this report.
Project Purpose, Scope and Goals
The purpose of this research project was to conduct microbial censuses, source identification anddevelop test procedures for water quality analysis. As described in detail in the grant agreement,the project goals can be succinctly summarized as follows:
1. Adapt the original PhyloChip to give it the capability to conduct a microbial census ofrecreational waters. Pathogen specific primers and probes on the microarray were to bevalidated. Particular attention was to be paid to the three beaches at Muir, Campbell Coveand Baker Beach, San Francisco as these sites had been identified by the Clean BeachesTask Force. (Task 1.1, 1.2).
2. Develop a suitable testing protocol and establish baselines by sampling waters in parallelwith the standard AB411 beach water quality tests. Conduct baseline monitoring at thesesites (Tasks 1.1 & 4).
3. Establish a website to publicize the project and disseminate information on progress. (Task1.3).
4. Perform microbial census analyses on specific sources of water pollution such as septicsystem or sewage effluent, agricultural runoff etc. Specific event testing was a goal e.g.waters affected by a known sewage spill would give information about the microbialmakeup of such waters. (Task 3).
5. Develop a QPCR protocol using keystone indicator species identified through thePhyloChip-based work. The test method was to be evaluated by conducting testing ofretrospective samples to compare them with tests conducted using the standard methods.Diffusion chamber testing was also required to investigate the fate of bacteria in the beachenvironment. (Task 5).
How the Project Addressed the Stated Goals
Previous studies and empirical field experience gained during conventional beach water qualitysampling highlighted several shortcomings of the testing methods now in widespread use. Testingagencies are concerned that the present “indicator paradigm” where the presence of certain
2
organisms as a surrogate for human sewage may be inaccurate as only those organisms that areculturable on particular media are counted by this method and many species of concern cannot bedetected. It was widely suspected that the indicator bacteria may often originate from sources otherthan human sewage. More recently, these bacteria have been shown to regrow in the beachenvironment, further calling into question the results obtained by the standard method of testing.Substantial variability between samples taken in close temporal and spatial proximity andtimeliness of test results are also problematic.
A major goal of the project was to develop a testing protocol to conduct a comprehensive census ofbacteria present in beach waters. Before this project, beach water quality testing was largely limitedto traditional laboratory culture methods, which have significant limitations. Not all bacteria foundin water bodies can be cultured and the traditional analytical methods are usually slow and time-consuming.
Water quality testing centered on recreational waters at three beaches that had been identified bythe State Water Resources Control Board staff and the Clean Beaches Task Forces as “ProblemBeaches.” Traditional water quality sampling conducted at these sites had indicated persistent highlevels of fecal bacteria. The presence of these bacteria in significant quantities is widely regardedas indicative of fecal pollution and can be cause for beach water quality advisories, with attendantpossible loss of beneficial uses. For more information on the coastal monitoring program see theSWRCB web page at this link: http://tinyurl.com/7qkkbec
The three sites chosen were Campbell Cove in Sonoma County, Muir Beach in Marin County andBaker Beach in San Francisco (see Table 2 and maps on pages 10-14). Staff from the threeCounties conducted routine water quality monitoring at these locations using the methods andstandards contained in the monitoring program commonly known as Assembly Bill 411 (or AB411). These routine samples were split and analyzed by both LBNL and the County laboratoriesthat carried out the standard indicator bacteria testing methods. Samples were also frozen so thatwaters that were found to violate the AB411 water quality standards could be retrospectivelyanalyzed using the PhyloChip to see which groupings of bacteria might be present and to gain anunderstanding of their relative abundance. For more details of the water sampling protocols andmethods, see Appendices A and B of the Quality Assurance Program Plan (QAPP) for this project.
Results of the routine testing conducted by traditional methods e.g. multiple tube fermentation werecompared to the results obtained by the PhyloChip method. For example, in the samples taken fromwaters adjacent to Campbell Cove, the PhyloChip detected 1524 different types of bacteria usingthe second-generation PhyloChip. By contrast, only a few species could be identified by traditionalculture methods; the PhyloChip method does not require the growth of bacteria in order to reliablydetect them. The LBNL staff developed specific primers and genetic probes on the PhyloChip tolook for the various types of bacteria of interest. Incorporated into the PhyloChip are error checkingand quality control/assurance systems, which are described in detail in the QAPP.
Another objective of the project was to determine whether the analytical capability of thePhyloChip (when adapted to aquatic sampling) could help to differentiate sources of bacterialpollution in receiving waters. If this were possible, then source tracking projects could harness thepotential of the PhyloChip to more accurately determine and enumerate the sources of bacteria in

3
bodies of water such as Tomales Bay, where a TMDL had relied on estimates of contributions ofbacteria from various sources. More details of these goals and the results achieved are provided inthe remainder of this section, in the Project Evaluation and Effectiveness section beginning on page13, and in Appendix 5 (see first paper). In particular, the a summary of the results of the part of theresearch focused on source differentiation conducted as part of this project can be found in the thirdpanel of the poster presentation entitled: Application of comprehensive bacterial communityanalysis to discriminate common sources of fecal pollution (Appendix 5). Also see Appendix 3,line 140
Water quality testing was conducted in other locations, notably during a sizeable sewage spill thatoccurred in February 2009 off the shoreline of Sausalito, CA. This unfortunate event provided asource of known human sewage contamination with which to verify the PhyloChip’s ability todetect and display distinct groupings of bacteria, such that the presence of human sewage could bereliably distinguished from other sources of bacteria e.g. avian, pinniped, bovine etc. For moredetails on the testing conducted during the 730,000-gallon sewage spill, including a map of thesampling, locations, see Appendix 2, Page 40.
The final aim of the project (Task 5) as it was initially conceived was to design a real-timequantitative polymerase chain reaction (qPCR) test to detect specific bacteria of human origin inrecreational waters. Early on in the project it became apparent that the analytical and discriminativecapabilities of the third generation PhyloChip greatly exceeded that of the (comparably priced)qPCR test that was originally envisaged by the project proponents. The project team carefullyconsidered an alternative to the PhyloChip that would test for a limited suite of bacteria of interest.However, tests using “simulated qPCR” methodology did not exclude sources of bacteria with anacceptably high degree of statistical confidence. Furthermore, once the complexity of the receivingwaters became apparent as revealed by the third-generation PhyloChip, staff realized that theability of the PhyloChip to resolve and display groupings of source bacteria with a high degree ofprecision could not be matched by a more limited set of indicators. Project staff consultedadvisors at Southern California Coastal Water Research Project and SWRCB staff (Gjerde,Peterson) who agreed that the best approach would be to develop analytical and data displaytechniques using the PhyloChip, rather than pursuing development of a qPCR method. Thereforethis task was modified to provide microbial analytical techniques using the PhyloChip as describedin Appendix 4. The Introduction to this section on page 1 provides further background, elucidationand rationale for the decision to emphasize the source tracking capabilities of the PhyloChip ratherthan pursuing the qPCR methodology.
A related goal of this project was to conduct diffusion chamber testing. Succinctly, this type of testwas designed to track the fate of indicator bacteria such as E. coli in the beach environment.Specialized containers holding the bacteria are placed in the beach environment and periodicallytested to see if survival or reproduction occurred. The results of this testing are described inAppendix 2, page 40 et seq.

4
Roles and Responsibilities
The project was coordinated and managed by the grantee, the County of Marin’s EnvironmentalHealth Services Division (County). The project director managed the administrative and financialaspects of the grantee’s side of the project with assistance from the County’s administrative staff.
In order to develop the tools and to retain the expertise necessary to conduct the “microbial census”of recreational and other water bodies, the County contracted with a laboratory headed by Dr.’sTerry Hazen and Gary Andersen at Lawrence Berkeley National Laboratory, Earth SciencesDivision, Ecology Department (LBNL). A scientific coordinator, John Hulls, was retained undercontract to the County to act as a liaison between the County and LBNL staffs, and to assist incoordinating field sampling activities. To provide public outreach, County staff established a website under the domain name phylochip.com and updated this site as developments occurred.
A principal early goal of the project was to adapt the gene chip known as the PhyloChip to waterquality sampling purposes. The original version of the PhyloChip was developed by LBNL usingfunding from the Department of Homeland Security in order to detect and give warning of thepresence of pathogenic microorganisms in the air. Central aspects of this project were the transferof the technology of the existing PhyloChip to aquatic testing and subsequent application of thattechnology to address public health problems in the recreational water environment.
During the project, the LBNL staff enhanced the capabilities of the PhyloChip through severalsuccessive redesigns, each time increasing its scope of analytical capability. The final, third-generation, PhyloChip is capable of detecting and reporting over 59,000 discrete taxa of bacteria.This is almost an order of magnitude greater testing capability than that of the original PhyloChip.
The PhyloChip’s design incorporates robust multiple onboard error-checking systems to ensurereliable output data. Affymetrix Corporation of Santa Clara, CA manufactured the PhyloChips usedin the project.
Regular meetings were held at the County facilities and LBNL to assess progress and coordinatework on the project. LBNL hired post-doctoral researchers (Cindy Wu, Eric Dubinsky and others)to work on the project and they co-authored some of the scientific papers (see Appendices 3-6).
During the project, staff worked closely with subject matter experts such as the Beach WaterQuality Workgroups that meet regularly in Northern and Southern California. Valuable advice andcooperation was also received from the scientists at the Southern California Coastal WaterResearch Project (SCCRWRP), particularly its Director, Dr. Steve Weisberg. SCCRWRPpersonnel are listed as co-authors on a paper recently published in Environmental Science. Projectscientific personnel were invited to give presentations were given at several conferences includingthe EPA National Beaches Conference and International Society of Microbial Ecology (seeAppendix 5).

5
Background & Discussion
This project began when Marin County environmental health officials became concerned about theaccurate detection of risk posed by pathogenic bacteria in its many recreational waters. Of specialconcern was the detection of pathogens at public bathing beaches, especially at those beaches thatlacked a storm drain outfall that could be contributing bacteria from human and urban sources. Atthe time the project was proposed, little was known about the microbial communities in therecreational water environment, and the PhyloChip was seen as a method to gain understanding ofthe microbiome in these settings. Secondarily, in Tomales Bay and the tributaries and watershedsthat fed into it, there was substantial debate regarding the sources of pathogens in the watershed. Inparticular, assertions were made by various local groups that the causes of bacterial exceedances ofstandards were associated with specific sources ranging from defective septic tank systems towildlife to agriculture. Thus, two primary goals of the project were to evaluate the effectiveness ofconventional indicator bacteria in predicting the presence of human waste in recreational and otherwaters, and to see if it was possible to use the PhyloChip technology to reliably and accuratelydetect the sources of bacteria in the receiving waters. See Appendix 2, page 48 for furtherelucidation on this topic.
Since approximately 2001, the County of Marin has tested marine and fresh recreational watersusing traditional laboratory methods. In recent years, the process of sampling, testing and reportingresults has been accelerated somewhat by using faster methods such as the proprietary Enteroalertand Colilert tests manufactured by Idexx Laboratories. However, even the results from thesemethods are typically not available for one or two days and then a staff member must drive to thesite to post a warning sign, incurring a further delay. The web site is also updated regularly to showthe most recent testing results. Wider concerns have been expressed statewide about the accuracyof the traditional “indicator organism paradigm” that relies upon the presence of certainmicroorganisms and their concentration to assess the safety of recreational waters. Therefore theproject sought to determine whether improvements could be made to the current testing andreporting system.
A volunteer staff member working with Marin County’s Environmental Health Division wasfamiliar with research performed for Homeland Security by Lawrence Berkeley NationalLaboratory (LBNL) to conduct a broad census of airborne bacteria to support the detection ofairborne bioweapons. This system had the ability to detect nearly 9000 taxa of bacteria in a singletest. Subsequent discussions with LBLN determined that the same technology could be adapted toperform a comprehensive microbial community assessment in natural bodies of water. This led tothe County of Marin submitting a grant application to California State Water Resources ControlBoard (SWRCB) under the Proposition 50 Clean Beaches Initiative to use the LBNL technology toconduct a microbial census of selected recreational beaches in Marin, Sonoma and San Francisco.The survey would include selected “problem” beaches identified by the SWRCB “Clean Beaches”task force, who supported the project proposal.
Due to the advanced technical capabilities of LBNL, the County of Marin conducted the main partof the project by contracting with LBNL to develop the PhyloChip microarray and conduct therequired water sampling, tests and preparation of scientific papers. Several papers were prepared byLBNL staff, and are attached to this report in the appendices. Scientific liaison work between the

6
County of Marin and LBNL was carried out under contract to the County, by John R. Hulls. Mr.Hulls also took an active part in field sampling and worked closely with LBNL staff during allphases of the PhyloChip’s development as a tool to measure bacteria in recreational waters.
The LBNL technology uses a microarray known as the Phylochip, manufactured by AffymetrixCorporation, to detect specific taxa based on the unique structure of the 16S gene, which isconserved in all bacteria and archaea (another type of microscopic cell with no nucleus). DNA isextracted from the samples, and washed onto the microarray, where it bonds to specific syntheticnucleotide probes, which are then scanned by a laser to detect the presence or absence of specifictaxa of bacteria. Rapid development of the technology by LBNL enabled an even more powerfulversion of the PhyloChip to be used for the Clean Beaches project, capable of detecting 50,000 taxaof bacteria, thus enabling for the first time a rapid method of interrogating essentially entiremicrobial communities in a single test, which could be performed at a fraction of the cost and timeof conventional sequencing methods.
One of the main questions facing communities and regulators was the question of whether thecurrent indicator bacteria test methods were accurately indicating the presence of human fecalmatter in recreational waters, especially from non-point sources, such as septic system leakage, oragricultural runoff, as opposed to discharge from major municipal treatment discharges. Thus, atesting program was developed wherein Marin, Sonoma and San Francisco agencies responsible fortesting would collect parallel samples over portions of two recreational seasons of their Statemandated AB411 programs. The water samples given to the project would be frozen at -80 degreesCelsius for later extraction. Tests were also conducted over complete tidal cycles to determine theimpacts of tides in community composition.
In addition, tests were conducted using diffusion chambers. Essentially, a diffusion chamber is a‘cage’ for bacteria that is suspended in the receiving waters, which can diffuse through themembranes of the chamber. By testing the community composition over time, it was possible tosee the influence of the receiving waters on the community. The tests indicated that receiving watertype affects microbial community dynamics over time. The results of this research indicate thatcreek and bay water exert different effects on the fate of microbial communities derived fromwaste. Therefore, selection of indicators for monitoring should be based on waste type andpersistence of fecal taxa under various receiving waters.
Another major focus of the project was to look at the gut microbiomes of animals and birds thatmight contribute to the bacterial load in the waters of the test area, as well as potential humansources such as septic tank systems. To that end, samples of waste were collected for large grazinganimals (elk/cows/horses) as well as for birds, seals and sea lions. Human sources samples weretaken from septic tanks, septic holding tanks and municipal wastewater treatment plants. Thesewage contained approximately fifteen thousand discrete taxa. The animal and bird sourcescontained approximately three thousand taxa. Each group produced a substantial number of uniquetaxa which could be compared with the results of the AB 411 tests, with special emphasis given tothose samples that exceeded the AB 411 standards for recreational use.
The results of these tests are described in detail in the papers contained in the Appendices to thisreport. A more general overview is provided by the International Symposium of Microbial

7
Ecologists (ISME) poster sessions of the work in progress, presented in Seattle, WA and also in arecent presentation at the 2011 U.S. EPA National Beach Conference (see Appendix 5, posterTemporal Dynamics of Cattle and Human Fecal Microbial Communities in Fresh and MarineWaters and also Appendix 5, poster: Application of comprehensive bacterial community analysis todiscriminate common sources of fecal pollution. The results show the power of a comprehensivemicrobial community analysis to discriminate between different sources of pollution, even incomplex aquatic and microbial environments. The project was also able to monitor the results ofa 750,000 gallon sewage spill which occurred adjacent to one of the test sites. The test resultsclearly showed the impact of such a spill as measured over time and in comparison to the results ofthe diffusion chamber tests.
The tests were able to clearly identify and/or eliminate human sewage as a factor in several bathinglocations that had proved problematic with AB411 tests. For instance, the Baker Beach testsshowed that the outfall from Lobos Creek was strongly influenced by specific taxa associated withhumans and birds. In the areas tested in Tomales Bay where it had been thought that there was astrong influence from septic tanks and cattle, none of the taxa for those species were present as asignificant percentage of the unique taxa associated with those sources. While samples were notavailable for all of the bird species associated with Tomales Bay, the avian samples showed asignificant influence from gulls.
Muir Beach showed no exceedances of the AB411 beach water quality standards during samplingperiod. The Park Service was also undertaking a major reconstruction of the upstream wetlandsand as part of the process was modifying the topography and drainage flow of the area. Thereforeas there were no exceedances, no PhyloChip samples were analyzed as it would have been difficultto draw conclusions about what had caused prior violations of the AB411 water quality standards atthis location.
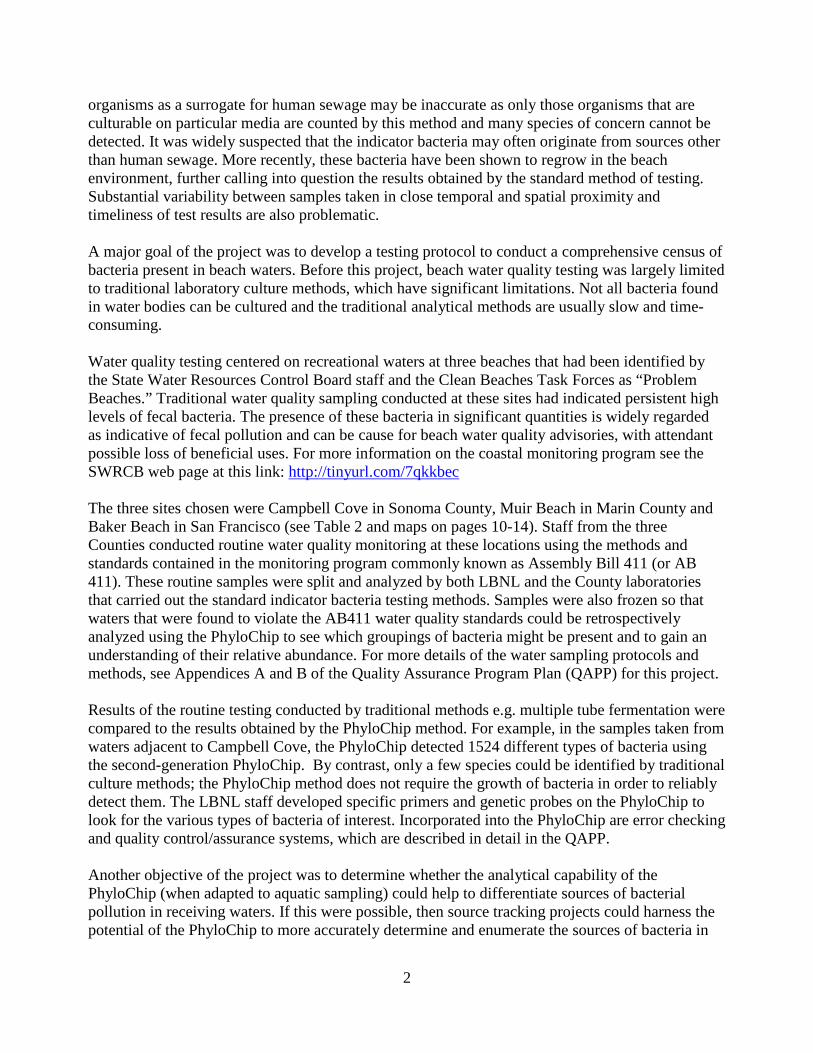
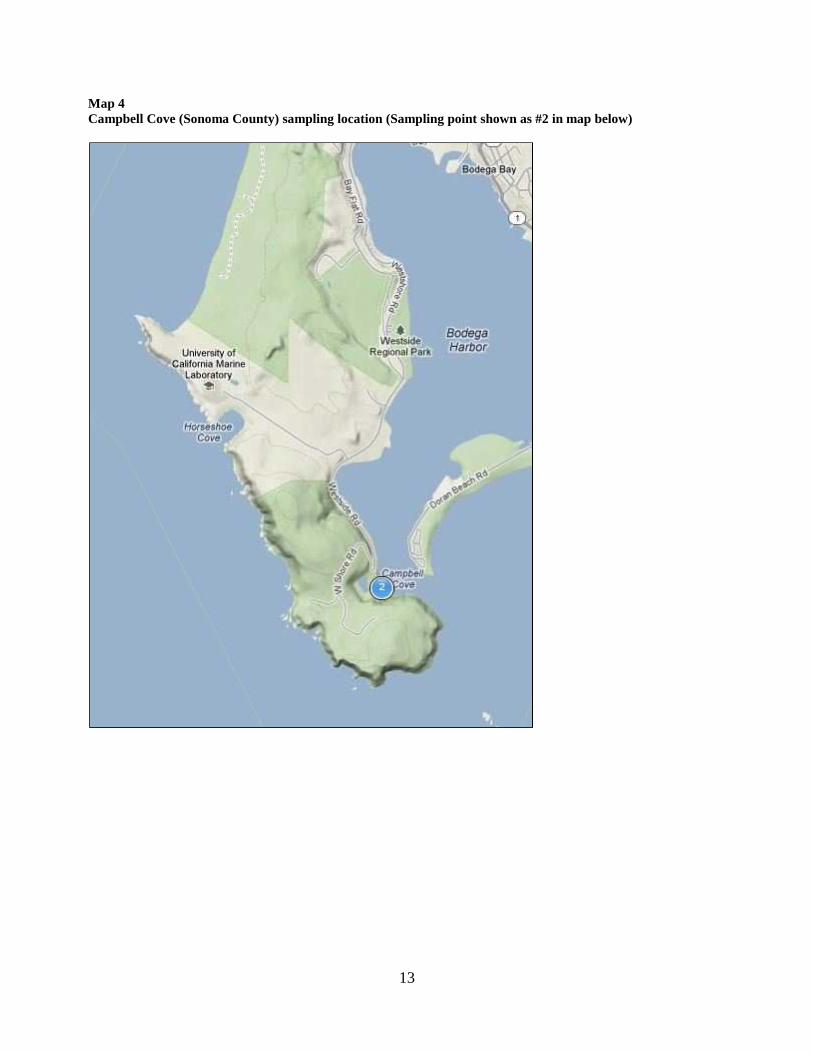
By contrast, PhyloChip samples analyzed from split samples taken at Campbell Cove in SonomaCounty clearly indicated that exceedances of the allowable bacterial counts under AB411 werecaused by birds, and excluded human sources. PhyloChip analysis of samples taken from BakerBeach indicated that human and bird sources contributed to the exceedances of the AB411 bacterialstandards at that location. For more details on the sampling locations see the table and maps onpages 10-14 below.
The Phylochip tests also showed that there are a large number of ‘cosmopolitan’ bacteria that areomnipresent in the environment. These bacteria appeared in stormwater events at all locations overwidely differing types of landscapes and land uses. These bacteria, if present in sufficient quantity,are capable of triggering exceedances under the AB 411 tests, even though no bacteria of humanorigin are present.
The near-universal presence of the cosmopolitan bacteria underscores the point that conventionaltesting for E-coli and coliform bacteria is incapable of discriminating whether a source of fecalcontamination originates from humans or from animal sources, whereas the Phylochipcomprehensive microbial community test is capable of detecting 700 taxa that are unique to humansewage. Another example of the power of the Phylochip is evident when it is considered that theAB411 tests look at generic tests for E-coli, enterococcus and coliform, whereas the chip contains

8
2105 specific probes for coliforms alone. The large number of unique probes for sewage made itpossible to accomplish one of the major goals of the project, namely that of determining whetherhuman sewage is present in receiving waters where large numbers of potential sources of bacteriaare present that would be detected by conventional tests. In Tomales Bay, ability to discriminatelarge numbers of unique taxa associated with birds and grazing animals, and to lesser extentpinnipeds, makes it possible to largely eliminate agriculture and septic tank systems as significantcontributors to exceedances of AB411 water quality standards. More details of these findings canbe found in the papers written by LBNL staff (these papers are included in the appendices). Inparticular see Appendix 2 beginning on page 37.
The project has already attracted considerable interest, with the result that RWQCB Region 1 isconducting a Phylochip survey of segments of the Russian River, and USGS and the City ofMalibu have conducted preliminary surveys of the Malibu Creek lagoon and beaches. In addition,the Phylochip is being used to determine the microbiome of more potential sources of microbialcontamination. This work is being conducted in conjunction with SCCWRP, Stanford Universityand UC Santa Barbara in the State of California Source Identification Pilot Project (SIPP) forsource tracking development. Finally, it should be noted that many other uses of the PhyloChip’sunique capabilities to address complex microbiomes have been further developed during the courseof the project, including work on the human microbiome with UCSF and others, detection ofbacterial contamination in NASA spacecraft assembly clean room facilities to prevent outboundcontamination of vehicles such as the Mars rovers, and the testing protocols developed for theSWRCB project, which were used to identify the oil-consuming bacteria during the Gulf oil spill.

9
TABLE ONE: ITEMS FOR REVIEW
Work Item Items for Review # Due Date% Of WorkComplete
DateSubmitted
EXHIBIT A Scope of Work1. GPS information for project site &monitoring locations
8/30/07 100% 2/16/2011
2. Project Assessment & EvaluationPlan (PAEP).
8/31/07 100% 07/26/07
3. Monitoring Plan 8/31/08 100% 2/16/20114. Quality Assurance Plan (QAPP) 8/31/08 100% 2/8/20115. Copy of final CEQA documentation 7/30/2007 100% 07/15/076. Land owner agreements N/A N/A None
wereneeded
7. Applicable Permits Asneeded
N/A Nonewere
neededB Work to be performed by grantee1.11.32.0
Develop beach testing protocolsEstablish Website/ databaseConduct standardization tests
August2008
Ongoingtask
100%100%100%
2/25/107/15/20075/10/2011
EXHIBIT BA. INVOICING 5/15/2011 100% 5/10/2011E. REPORTS
Progress and Final Reports Complete 100% 6/20/2012

10
PROJECT MONITORING, INCLUDING TABLE TWO AND LOCATION MAPS
As described in the Introduction, water quality monitoring (for bacteria) was conducted at thelocations specified in the table below. Project staff successfully completed the training offered bythe SWRCB for the Surface Water Ambient Monitoring Program. The purpose of the monitoringwas to obtain water samples that were spilt for analysis. One set was analyzed for traditionalbacterial cultures and counts under the AB411 beach monitoring program operated by CountyHealth Department laboratories. The other portion of the sample was frozen for possibleretrospective analysis using the PhyloChip method. Thus baseline tests, development of protocolsand standardization were accomplished. Details of the testing methods are contained in the QualityAssurance Program Plan prepared for the project. Testing was also carried out across tidal prismsto see what variations were apparent in the microbial communities across tide cycles and time ofday.
A further purpose of the monitoring activities was to develop the bacterial source trackingcapability of the PhyloChip. For an example, see the discussion of the Sausalito sewage spill onpage 49 of Appendix 2. Maps depicting the monitoring locations are provided on pages 10-13 ofthis section.
Table Two: Monitoring Locations
SamplingSiteLocation
Lat/long Sample type Parameterssampled
Furtherreferences
Sausalito,CA(Sewagespill inMarinCo.)
37.861505-122.487602
AB 411-type water quality tests (Idexx Labsmaterials/methods: Colilert/Enterolert) &PhyloChipThese samples were taken during thesewage spill incident of February 2009.
Bacteria (E.coli &enterococci)PhyloChipmicroarrayanalysis
Appendix2 page 42
MuirBeach,CA(MarinCo.)
37.85932-122.576394
Beach water, AB 411 water quality tests(Idexx Labs materials/methodsColilert/Enterolert) & PhyloChip
Bacteria(E. coli &enterococci)PhyloChipmicroarrayanalysis
Appendix2 page 38
CampbellCove, CA(SonomaCo.)
38.304907-123.057325
Beach water, AB 411 water quality tests(Idexx Labs materials/methodsColilert/Enterolert) & PhyloChip
Bacteria(E. coli &enterococci)PhyloChipmicroarrayanalysis
Appendix5: 3rd
paper, 3rd
panel
BakerBeach,CA (SanFranciscoCo.)
37.792626-122.484276
Beach water, AB 411 water quality tests(Idexx Labs materials/methodsColilert/Enterolert) & PhyloChip
Bacteria(E. coli &enterococci)PhyloChipmicroarrayanalysis
Appendix5: 3rd
paper, 3rd
panel

11
Map 1Sausalito sampling locations: General Vicinity
Map 2Sausalito sampling locations: detailed locations

12
Map 3Muir Beach sampling locations (The North sampling site is shown as point #21)
13
Map 4Campbell Cove (Sonoma County) sampling location (Sampling point shown as #2 in map below)
14
Map 5Baker Beach (City & County of San Francisco) sampling location (see blue dots)
15
PROJECT COSTS
Funding Sources:
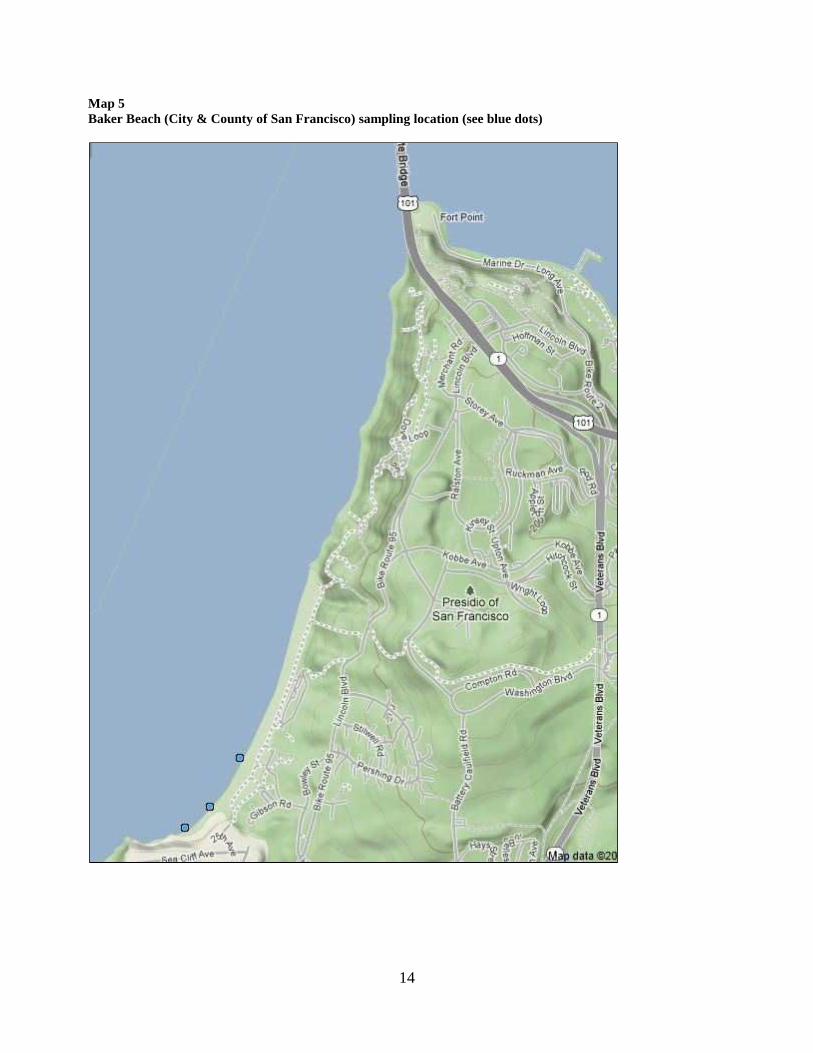
1. SWRCB Proposition 50 Nonpoint Source Grant in the amount of $848,0002. Rathmann Family Foundation Grant of $200,000 to perform additional work
The project’s final cost is as follows:
Amount invoiced to the SWCRB: $842,646.77Amount expended by the Rathmann Family Foundation: $99,590.33
Total $942,237.10
PUBLIC OUTREACH
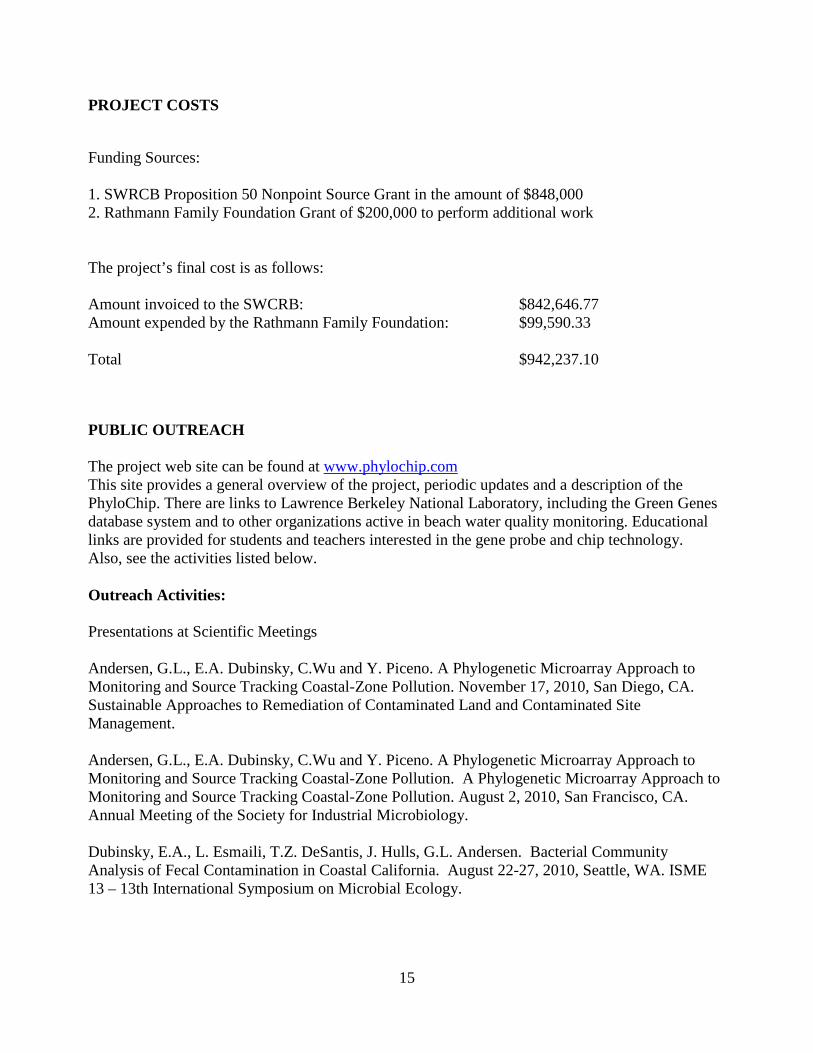
The project web site can be found at www.phylochip.comThis site provides a general overview of the project, periodic updates and a description of thePhyloChip. There are links to Lawrence Berkeley National Laboratory, including the Green Genesdatabase system and to other organizations active in beach water quality monitoring. Educationallinks are provided for students and teachers interested in the gene probe and chip technology.Also, see the activities listed below.
Outreach Activities:
Presentations at Scientific Meetings
Andersen, G.L., E.A. Dubinsky, C.Wu and Y. Piceno. A Phylogenetic Microarray Approach toMonitoring and Source Tracking Coastal-Zone Pollution. November 17, 2010, San Diego, CA.Sustainable Approaches to Remediation of Contaminated Land and Contaminated SiteManagement.
Andersen, G.L., E.A. Dubinsky, C.Wu and Y. Piceno. A Phylogenetic Microarray Approach toMonitoring and Source Tracking Coastal-Zone Pollution. A Phylogenetic Microarray Approach toMonitoring and Source Tracking Coastal-Zone Pollution. August 2, 2010, San Francisco, CA.Annual Meeting of the Society for Industrial Microbiology.
Dubinsky, E.A., L. Esmaili, T.Z. DeSantis, J. Hulls, G.L. Andersen. Bacterial CommunityAnalysis of Fecal Contamination in Coastal California. August 22-27, 2010, Seattle, WA. ISME13 – 13th International Symposium on Microbial Ecology.

16
Wu, C. H., E. A. Dubinsky, J. Hulls, S. R. Osman, T. C. Hazen, and G. L. Andersen. Temporaldynamics of cattle and human fecal microbial communities in fresh and marine waters. August 22-27, 2010, Seattle, WA. ISME 13 – 13th International Symposium on Microbial Ecology.
T. Z. DeSantis, S. R. Osman, E. A. Dubinsky, Y. M. Piceno, U. Karaoz, E. L. Brodie, G. L.Andersen. Quantitative Tracking of Microbial Community Dynamics using the BerkeleyPhyloChip. May 2010, San Diego, CA. American Society for Microbiology General Meeting.
Andersen, G.L., E.A. Dubinsky, T.Z. DeSantis, L. Esmaili, J. Hulls, C.H. Wu and T.C. Hazen. Acomprehensive microbial community approach to water quality research using the PhyloChip.Monterey Bay National Marine Sanctuary Symposium. April 2010. Monterey, CA.
Dubinsky, E.A., C. Wu, J. Hulls, T. Hazen and Gary Andersen. A complete microbial communityapproach to monitoring and source tracking coastal-zone pollution. September 2010, Oakland, CA.Biennial State of the San Francisco Estuary Conference. September 2009, Oakland, CA.
Esmaili, L., E.A. Dubinsky, J. Hulls, G.L. Andersen. Characterization of Microbial Communities inAnimal and Human Waste Sources Near San Francisco Bay. September 2010, Oakland, CA.Biennial State of the San Francisco Estuary Conference. September 2009, Oakland, CA.
Dubinsky, E.A., C. Wu, S. Osman, J. Hulls, T. Hazen, G. Andersen. A complete microbialcommunity approach to monitoring and source tracking coastal-zone pollution. April 2009,Huntington Beach, CA. U.S. EPA National Beach Conference.
Dubinsky, E.A., J. Hulls and G.L. Andersen. An overview of the Marin County/Lawrence BerkeleyNational Laboratory “Clean Beaches” PhyloChip project. October 2008, Long Beach, CA.Headwaters to Ocean Conference.
Dubinsky, E. A., L. Esmaili, J. Hulls and G.L. Andersen. Indicator Bacterial Communities of FecalContaminants in Coastal California. March 15-17, Miami, FL. U.S. EPA National BeachConference.
Dubinsky, E. A., L. Esmaili, J. Hulls and G.L. Andersen. Discriminating Sources of Fecal Pollutionwith Phylogenetic Microarrays. May 20-24, New Orleans, LA. American Society forMicrobiology General Meeting.
17
Water Quality Workgroup Meetings
Dubinsky, E.A. Bacterial Community Analysis of Fecal Contamination Sources in CoastalCalifornia Nov 17, 2010, Alameda, CA. SWRCB Central/Northern California Ocean and BayWater Quality Monitoring Group.
Dubinsky, E.A. A whole microbial community approach to water quality research. December 17,2009, Long Marine Laboratory, Santa Cruz, CA. Cyanobacteria and water quality workshop.
Hulls, J. and E.A. Dubinsky. Update on Phylochip Project: Learning to tell the forest by thephylogenetic trees. November 10, 2009. SWRCB Beach Water Quality Workgroup, Costa Mesa,CA
Dubinsky, E.A. A complete microbial community approach to water quality research October2009, Santa Rosa, CA. North Coast Regional Water Quality Control Board
Hulls, J. and E.A. Dubinsky. Update on Phylochip Project: Learning to tell the forest by thephylogenetic trees: Initial 3rd generation chip results in Tomales Bay and implications for waterquality issues. August 13, 2009, Alameda, CA. Central/Northern California Ocean and Bay WaterQuality Monitoring Group.
Community Outreach Activities
Dubinsky, E.A. and C.H. Wu. An Overview of the Clean Beaches Project. March 11, 2009, PointReyes Station, CA. An informal “science café” for the public.
Hulls, J., An Overview of the Clean Beaches Project. November 17, 2009 Point Reyes NationalSeashore hosted presentation to Tomales Bay Shellfish Technical Advisory Committee.
Hulls, J., Seeing the Microbiome: From vanLeeuwenhek’s Microscope to Lawrence Berkeley’sPhylochip. California Environmental Health Association 58th Annual Educational Symposium,Monterey, CA 15 April 2009

18

19
PAEP: ANALYSIS AND CONCLUSIONS
The original PAEP is attached here for reference and is followed by the updated analysis andcommentary on the original goals. This section is followed by a discussion of next steps andrecommendations for future research.

20
Project Performance Measures for Planning, Research, Monitoring, or Assessment Activities
Beach Monitoring Phylochip Project
Project Goals Desired Outcomes Output Indicators Outcome Indicators Measurement Toolsand Methods
Targets
1. Determine microbialpopulation of receivingwaters at various beachlocations in Marin, SanFrancisco and SonomaCounty on a seasonal basisand determine microbialpopulation of potentialnonpoint sources. (Septictank/dairy runoff/stormrunoff/specific events)
Identification andcataloging of allmicroorganisms presentbased on comparison with16s gene sequences.Identification of selectedpathogens based on specificgene sequences.
Understanding of diurnal,tidal and seasonalfluctuations in population
Identification in differencesbetween microbialpopulation of non-pointsources and receivingwaters
Phylochip providescomplete census of allmicroorganisms for which16s gene sequence isknown.
Accessible database ofmicrobial ecology for futureresearch, evaluation ofpollution control measures,population shifts fromenvironmental changes
Publication in scientificjournalPeer Reviewed report(Application ofcomprehensive bacterialcommunity analysis todiscriminate sources of fecalpollution at recreationalbeaches /Prepared by LBNL)Currently submitted to theProceedings of the NationalAcademy of Sciences for peerreview.
Microarray testing usingLawrence Berkeley NationalLaboratory “Phylochiptechnology, with outputsanalyzed using “Greengenes”database.
Broad acceptance of microbialcensus techniques as a researchtool for studies in the marineenvironment, especiallyevaluation of safety ofrecreational waters andevaluation of the efficacy ofpollution control measures.
2 Based on microbialcensus of receiving watersand potential non-pointsources, select indicatorspecies and develop andvalidate QPCR test forselected species based oncomparison withPhylochip tests and resultsof existing beach testingprotocols.
Comparison of Microarraytesting and existing countytests with QPCR tests
Microbial census showsdirect presence ofpathogens of interest andcomparison of censusresults with standardindicator bacteria andQPCR test results will showrelative efficacy of tests asindicators of potentialpathogens.
Publication in scientificjournalPeer reviewed report (pleasesee reference above).
1. Phylochip analysis
2. QPCR keystone tests
3. Colilert 18
4. Enterolert
5. Total Coliform
Broad acceptance of keystoneindicator/QPCR testing forpotential presence of pathogensin receiving waters where non-point sources predominate.
3. Assess reliability ofindicators for beachclosure indicatororganisms
Reduction in beach closuresfrom false positiveindication of presence ofpathogens using currentindicator species
QPCR keystone species testoutputs in comparison withcurrent indicatormethodology
Publication in scientificjournalPeer reviewed report(Please see reference above).
QPCR keystone species tests Broad acceptance of keystoneindicator/QPCR testing forpotential presence of pathogensin receiving waters
21
PAEP Item 1
In considering the PAEP analysis, it is important to recognize that, much like the analysis ofairborne microbiomes for Homeland Security, the Clean Beaches project is the first use of thePhylochip technology to perform a comprehensive microbial community analysis of ageographically distributed microbiome. As in the case of the airborne microbiome, the initialanalysis revealed a rich microbial community that was profoundly influenced by the nature of thereceiving waters, changing dramatically over time and location. In addition, the project was able touse the 3rd generation of the chip, which is capable of detecting @ 59,000 OTUs of bacteria andarchaea, as opposed to the @9000 OTUs capability of the previous generation.
The primary purpose of the project is to “Determine microbial population of receiving waters atvarious beach locations in Marin, San Francisco and Sonoma County on a seasonal basis anddetermine microbial population of potential nonpoint sources. (Septic tank/dairy runoff/stormrunoff/specific events),”
The desired outcome of this first goal is: Identification and cataloging of all microorganismspresent based on comparison with 16s gene sequences. Identification of selected pathogens basedon specific gene sequences. Understanding of diurnal, tidal and seasonal fluctuations inpopulation. Identification in differences between microbial population of non-point sources andreceiving waters.
The output indicators included the Phylochip census and database which is maintained by LBNL.
The project has been very successful in accomplishing these goals, identifying large, diversepopulations in salt and fresh receiving waters, even in samples well within the AB411 limits asdefined on Colilert and Enterolert tests currently employed. At this point, thanks to the RathmannFamily Foundation, it became possible to undertake a comprehensive survey of major potentialanimal contributors to the microbiome of Tomales Bay, including multiple samples of largegrazers, including cows, elk, and horses, extensive bird samples and also pinnipeds. All sampleswere taken from multiple individuals within at least 4 geographically dispersed populations.
Once again, a surprising diversity was found, including large numbers of OTUs that were unique toeach species. While the project had initially intended to use bacteroides markers as an indication ofsource, the increased resolution and sensitivity of the G3 Phylochip made it apparent that thepresence of specific sources could be ascertained from the unique OTUs associated with thepotential sources. Additionally, the diffusion chamber tests indicated that the potential sourcemicrobiomes reacted differently over time, showing a great variation in survival rates andpercentage of population based on time, and whether the receiving waters were saline or fresh.
As shown in the LBNL paper which forms the body of this report, the combination of all theseresults makes it possible to determine potential sources of fecal bacteria from a single test, which isinvaluable in evaluation of potential remedial measures.

22
The target of this project goal was the broad acceptance of microbial census techniques as aresearch tool for studies in the marine environment, especially evaluation of safety of recreationalwaters and evaluation of the efficacy of pollution control measures.
The use of the PhyloChip for comprehensive microbial community assessment is gainingwidespread interest, not only in the environmental testing field, but in areas as diverse as the NASAPlanetary Protection program, where it is used to screen NASA spacecraft assembly rooms, but inthe NIH human microbiome project. The development of the protocols under the CleanBeaches project led to the deployment of the PhyloChip technology in the Gulf oil spill response,where it lead to the understanding of the microbiome there and the identification of the oilconsuming bacterial population, as recently reported in the scientific press.
PAEP Item 2
Based on microbial census of receiving waters and potential non-point sources, select indicatorspecies and develop and validate QPCR test for selected species based on comparison withPhylochip tests and results of existing beach testing protocols.
Outcomes As mentioned in item 1, the sensitivity of the G3 PhyloChip enabled the identification oflarge numbers of unique OTUs from the potential source microbiomes, including human, largegrazers (cattle/elk/horses), birds and pinnipeds. It became apparent from the analysis that the G3‘census’ results were comprehensive enough to enable direct identification of the OTUscontributing to an exceedance under AB411 standards, and thus the source microbiomes associatedwith an exceedance of the standards. This is discussed at length in the source tracking section ofthis report.
It was decided that detecting the contributors to exceedances would provide the best indicator ofpotential risk as reliable detection of human sources of fecal contamination is primary indetermining risk, where specific pathogen detection based on individual strains of bacteria is likelyto miss both detection and the risk potential. Therefore, emphasis was placed on developing thesource tracking capabilities of the Phylochip, and methods to analyze the large amount of dataproduced by the test.
Development of a PCR test was not undertaken, as the research showed that that there are a largenumber of potential indicators, and that selection should be based on the receiving waterenvironment and potential fecal sources within the watershed to obtain reliable results from a smallgroup of indicator species. However, because of rapid developments in microarray and otherdetection technology currently underway, it is anticipated such testing will soon be within a rangeof price and availability such that indicator groups can be readily selected from a CMCA, asdemonstrated by the Phylochip assay results.
The additional surveys of gut microbiomes of potential sources, enabled the detection of largenumbers of unique bacteria for human, mammalian and avian sources sufficient to identify their

23
presence or absence in receiving waters (See ISME presentation on source tracking and section inpaper on Sausalito sewage spill for examples, where the Phylochip tests are compared withconventional Colilert, Enteroalert and Total Coliform samples. The AB411 test samples were alsoanalyzed with current indicator methods and sensitivity compared, as shown in the papercomprising the body of this report).
Targets
Data generated shows potential indicator species, and the microbial census provides a valuable dataset for other researchers doing risk analysis. The results have already lead to the Phylochip beingselected for participation in the SWRCB Source Indicator Pilot Program, involving SCCWRP,Stanford, and other universities both here and abroad.
PAEP Item 3
Task: Assess reliability of current indicators for beach closure indicator organisms
Desired Outcomes
Reduction in beach closures from false positive indication of presence of pathogens using currentindicator species
The project achieved far more positive results than anticipated in this area. As the research papersshow, the Phylochip was able to detect a very wide range of potential indicators that alloweddetermination of the specific OTUs that were causing a given exceedance.As the chip had probes for thousands of specific coliforms and enterococci, it was possible toassociate those OTUs that would trigger AB411 exceedances with the gut microbiomes of thesources that were analyzed. The tests specifically showed that many OTUs from bird sequenceswould register on AB411 tests. Of more interest was the detection of large numbers of‘cosmopolitan’ bacteria. Tests of receiving waters with no waste influence would showpopulations of several thousand OTUs. The ability to differentiate between receiving watermicrobiomes and source microbiomes is a unique outcome of the tests.
In addition, the tests show that in many areas, exceedances caused by rainfall events are not relatedto any of the specific source microbiomes in the area, even when cattle and septic tanks had beenimplicated as potential sources by conventional tests In tests sites where there was no pattern ofsource OTUs detected in non-rain events, there was no apparent specific source in the rain eventsequences, indicating that establishment of the background microbial census of cosmopolitanbacteria and potential source microbiomes will be essential to the success of selecting successfulremediation measures, especially in dealing with outflows caused by rain events.
The results, especially the Sausalito Sewage spill show that the Phylochip tests were far moresensitive than conventional tests, and detected human presence at lower concentrations thanconventional tests. The large number of potential indicators for various species and human

24
sources such as septic tanks (see ISME abstract and current report for details) make it possible toidentify sources, and because of the large number of unique taxa, the Phylochip test is less subjectto error than single marker species and general coliform and enterococcus tests. However, resultsshowed that the survival of indicator species is highly dependent on receiving water conditions, andrainy weather conditions produced large numbers of 'cosmopolitan', or generally present bacterianot associated with specific sources, as shown in the report. Further analysis of differentenvironmental conditions will be required to develop a QPCR keystone test with limited species,however, the results show that comprehensive microbial community assessment with the Phylochipis far more sensitive, and less subject to error because of the large number of unique taxa in anygiven species.
Targets
The use of comprehensive microbial community assessment has already gained acceptance (seeitem 2). Results show that the Phylochip is capable of detecting all of the sequenced OTUs presentin an environment , providing the ideal testing method for the development of pathogen TMDL’sand the selection of the appropriate remediation measures with the highest possibility of success, aswell as assessing the impact of treatment projects and remediation measures.
LESSONS LEARNED
The main lesson learned concerns the level of complexity of the microbial ecology in recreationalwaters, and the richness of potential sources. In the course of the project, we identified over 20,368bacterial OTU’s from mammals and birds as potential sources of fecal bacteria in water samples.
From this we also learned that, especially in the case of non-point sources, it is essential that acomprehensive microbial community assessment be performed before determining remediationmeasures, as attribution to given sources, be they natural or man-made, cannot be determined fromnormal surveys.
The lesson learned from subsequent tests with the PhyloChip (City of Malibu study) indicates thatspecific estuarine conditions can create microbial ecologies that contain numerous conventionalindicator bacteria without a known source, indicating that there is a relatively stable naturalpopulation that is sustained in a specific environment, such as the estuarine environment of MalibuLagoon. In this case, despite the presence of a large bird population, claims of avian and septictank impact impacts were not supported by the PhyloChip tests, which showed no specific sourceof fecal bacteria. Instead, a complex natural population was implicated as the most likely source.
Both the location of sampling points and the nature of receiving waters are critical to determiningsources of microbes. In the case of the Baker Beach samples, those taken at the outlet of LobosCreek showed clear indications of bird and human sources, whereas, at a sampling point slightlymore than 100 yards away, no source indicators rose above general background levels.
The nature of the receiving waters was found to exert a very significant effect on the survival ofsource bacteria, both in general and sustained over time. Diffusion chamber tests revealed
25
significant difference in fresh and saltwater populations over time. Thus, accounting for survival inreceiving waters is essential to understanding the impact of microbial sources over time.
This study found that there are large populations of bacteria that occur in conjunction with rainevents that contain the indicator bacteria tested for by conventional recreational water testingmethods. We conjecture is that these sources may result from interchange with marshlands andstream bank reservoirs that would be influenced by changes in water level during rain events.
Sensitivity in detecting low levels of bacteria unique to a particular source greatly increases theconfidence of determining a source, (as opposed to a single indicator) because of the large numberof discrete taxa associated with a given source, even if they are present only at low levels.

26

27
RECOMMENDATIONS AND FUTURE RESEARCH
The work to date clearly demonstrates the power of the comprehensive microbial communityanalysis (CMCA) in determining the microbial health and make-up of aquatic environments. Italso shows that careful attention must be paid to not only the nature of the receiving waters, but tothe selection of indicator species.
The data clearly shows that tests using only one indicator such as enterococcus are incapable ofproviding reliable indication of the presence of human fecal matter in non-point source situationswhere birds and wildlife are present, especially since the bird gut microbiome contains manyenterococci that are shared with mammals, including humans. The current study shows that it ispossible to differentiate human waste from other sources, but more analysis will be required toselect the minimum number of taxa to produce reliable results. LBNL is already participating inthe State of California Source Identification Pilot Project, providing CMCA’s and gut microbiomeanalysis to build up the library of potential animal source fecal matter. This research should becontinued and expanded as it will lead to much more reliable selection of indicator species,especially for downselected probe sets for routine testing.
The Phylochip is already being used in other recreational water testing environments, includingRegion 1 RWQCB, which is planning to use the results to deal with complicated source issues onthe Russian River. This is an entirely freshwater environment, in contrast to the current study, andwill greatly increase the understanding of watershed microbiomes.Further understanding of the microbiome of river systems will provide valuable insight into rivermanagement, especially under low-flow conditions. It is strongly recommended that watershedlevel microbiome studies be continued.
This study also shows that, given the complexity of the microbial aquatic community, there issimply no way of providing a single ‘magic bullet’ test that will accurately predict risk torecreational water users. This mirrors the results of the Phylochip tests of the airbornemicrobiome for Homeland security, where the results were used to develop new tests for bioterrororganisms without triggering false alarms from natural organisms in what turned out to be a farmore complex airborne microbial environment than had been anticipated. This study indicates thatthe best results will be obtained by calculating the probabilities of a given source being present,based on the percentage of probes for a given source (such as sewage) that ‘light up’ on a givensample. Calculation of such probabilities is also a fruitful area for further research.
In addition to protection of the environment, the prime goal of recreational water testing is toprotect public health. By calculating the probability of a given source being present by thepercentage of ‘hits’ on given sources, it would be possible to greatly improve the accuracy andresolution of Quantitative Microbial Risk Assessment (QMRA) for recreational waters and CMCAtesting would be of significant use in determining exposure from various fecal sources to facilitatemeaningful QMRA development.
While the CMCA/Phylochip approach is appropriate for research studies, preparation of pathogenTMDL’s and source tracking; it also indicates that much smaller sets of probes could be used withlow-cost chips for routine monitoring of recreational waters, or tracking of specific sources. The

28
field of probe and array development is evolving very rapidly, and research in this area could leadto the availability of low-cost, downsized probe sets and the development of accurate, rapid riskassessment tools.
29
LIST OF APPENDICES
1. Grant Summary Form
2. Scientific Paper: “Application of Comprehensive Bacterial Community Analysis toDiscriminate Sources of Fecal Pollution at Recreational Beaches.”
3. Scientific Paper: “Application of Phylogenetic Microarray Analysis to DiscriminateSources of Fecal Pollution.”
4. Peer Reviewed Article
“Characterization of Coastal Urban Watershed Bacterial Communities Leads to AlternativeCommunity-Based Indicators.” Cindy H. Wu et al
5. Selected presentations to EPA, ISME
1) Bacterial Community Analysis of Avian and Mammalian Sources of FecalContamination in Coastal California
2) Temporal Dynamics of Cattle and Human Fecal Microbial Communities in Fresh andMarine Waters.
3) Application of Comprehensive Bacterial Community Analysis to Discriminate CommonSources of Fecal Pollution

30

31
APPENDICES

32

33
1. Appendix 1: Grant Summary Form
CONTRACT SUMMARY
Date filled out: March 6, 2011
A) Contract Information
1. Contract Number: 07-576-550-2 (as amended)
2. Project Title: Beach Monitoring Phylochip Project
3. Project Purpose – Problem: Characterize Microbial Environment in Beach Water using PhyloChip and
assess potential for source tracking applications; Identify potential for improved beach water quality testing.
4. Project Goals:
a. Short-term Goals: Conduct Microbial Census of Recreational Waters and Nonpoint sources
b. Long-term Goals: Provide a basis for future development of rapid assessment of recreational waters.
5. Project Location: Various watersheds: Muir Beach (Marin), Campbell Cove (Sonoma), Baker Beach (S.F).
a. Physical Size of Project:
Size of watershed – N/A
b. Counties included in the project: Marin County
Sonoma County, San Francisco City/County
c. Legislative Districts: (Assembly and Senate) Senate Districts – 2, 3, 8
Assembly District – 1, 6, 12
6. Which SWRCB program is funding this contract? Please put an "X" by the one that applies.
X Prop 50 Coastal Nonpoint Source
B) Contract Contact: Refers to contract project director.
Name: Philip D. Smith Job Title: (formerly) Deputy Director,Environmental Health Services
Organization: County of Marin, Comm. Development Webpage Address: www.co.marin.ca.us/ehs
Address: 3501 Civic Center Drive, Rm 236San Rafael, CA 94903
Phone: 415-499-6907 Fax number: 415-507-4120
Email: [email protected]
C. Contract Time Frame: Refers to the implementation period of the contract.
From: October 26, 2006 To: April 1, 2011
D) Project Partner Information: Name all agencies/groups involved with project.
Marin County Environmental Health Services
Lawrence Berkeley National Laboratory
State Water Resources Control Board

34
San Francisco Dept. of Public Health; Environmental Health Division
Sonoma County Public Health Dept., Environmental Health Division
Southern California Coastal Water Research Project
University of California, Santa Barbara
E) Nutrient and Sediment LoadReduction Projection (if applicable):
NA
35
Appendix 2:
Scientific Paper: “Application of Comprehensive Bacterial Community Analysisto Discriminate Sources of Fecal Pollution at Recreational Beaches.”

36

37
Application of comprehensive bacterial community analysis to
discriminate sources of fecal pollution at recreational beaches /Prepared
by LBNL
Summary Project Description
Causes of fecal contamination in recreational waters are often unclear because human, agricultural
and wildlife sources co-occur in most watersheds. Most source tracking methods rely on the
detection of single biomarkers to identify or exclude individual sources. High-throughput DNA
sequence analysis has potential to improve the sensitivity and specificity of source tracking by
using the entire phylogenetic diversity of fecal microbial communities to identify sources of
contaminants. In this study we used phylogenetic microarray analysis to determine combinations
of bacterial taxa that can be used to detect suspected sources of animal and human fecal sources in
coastal California. Fresh feces were collected from 42 different populations of birds, pinnipeds
(seals, sea lions), cows, horses, elk and human sewage. Human wastes were gathered from
wastewater treatment plants, community septic tanks and holding tanks. We analyzed bacterial 16S
rRNA gene composition using the PhyloChip microarray, which is capable of quantifying
differences in the relative abundance of both rare and abundant bacterial taxa from the entire
targeted pool of 16S rRNA gene amplicons for 59,959 different taxa. Indicator species analysis
was used to determine unique combinations of bacterial taxa that discriminate sources. Cluster
analysis revealed strong differences in community composition among human wastes, birds,
pinnipeds and grazers. Bacterial communities from ruminants (cows, elk) clustered closely with
little variation among populations, while horses were distinct within the grazers. Actinobacteria,
Bacilli and many Gammaproteobacteria taxa discriminated birds from other sources. Many
Clostridia and Bacteroidetes taxa discriminated human wastes, grazers and pinnipeds. Hundreds of
different taxa that were unique to each source type and could be used for source identification.

38
Illustration 2: Phylochip Microarray
We found that birds are the most likely source of FIB contamination at Campbell Cove. Neither
human, grazer or bird sources are likely to be primarily responsible for high FIB counts observed in
Tomales Bay sites or Horseshoe Cove. Both human and bird sources are associated with high FIB
at Baker Beach in San Francisco. Lagunitas is impacted by a wide range of human, bird and grazer
sources.
Background
Each year more than a third of all beaches in the United States monitored for potential health risks
are closed or posted with an advisory at some point. Closures and public health advisories have a
major economic impact on coastal communities whose economies are based largely on tourism
from beach recreation. Likewise the closure of areas used for shellfish harvesting results in
substantial economic losses (Meschke and Boyle 2007).
Most closings and advisories are triggered by water samples that exceed microbial water quality
standards for “fecal indicator” bacteria, usually culturable coliforms, E. coli or enterococci that are
considered a proxy for human health risk in recreational waters. Because the direct measurement
of all human pathogens is often impractical and unreliable under field conditions, water monitoring
relies on the detection of bacterial indicators that have some demonstrated correlation with human
illness in areas mostly impacted by human sewage (Field and Samadpour 2007). These tests are
based on antiquated methods from the early 1900s and have several shortcomings that are well
documented. Many studies have demonstrated that these fecal indicator bacteria are detected in
several environmental sources aside from feces, including soils and sediments, algal wrack and
39
beach sands. These fecal indicators are therefore not always indicative of fecal inputs, and many
water bodies often contain measurable amounts of FIB even where anthropogenic or significant
animal inputs are absent. Importantly, fecal indicator bacteria tests provide no information about
the source of the bacteria, and thus provide no indication of health risk without additional source
tracking data.
Shortcomings of the current FIB monitoring approach combined with widespread development and
implementation of Total Maximum Daily Load (TMDL) requirements for microbiological
pollution are fueling interest in microbial source tracking (MST) methods. Many approaches to
source tracking are under development, most of which rely on single phenotypic or genotypic
biomarkers to measure sources. Good MST assays must be specific to the host and have a high
sensitivity of detection in the environment. Most importantly the MST signal must remain
detectable in the environment at least as long as indicator organisms and pathogens (EPA 2005).
Most MST approaches fall short of desired specificity, stability and sensitivity objectives.
Most existing MST tests were developed in an era when it was difficult and expensive to measure
the huge diversity of microorganisms that is resident in human and animal guts, and most studies
have evaluated the performance of single microbial sequences or biomarkers as the basis of source
tracking. A drawback of single targets is that no single gene sequence is known to be 100%
specific for any one type of waste (Domingo et al. 2007). Single targets, such as host-specific
Bacteroides, can be unreliable because they may vary in presence and abundance among
individuals, and primer sets may not be entirely specific to a particular host. In addition, MST
based on single targets is entirely dependent on the fate of this one target once it enters receiving
waters. Comprehensive sequence analysis potentially overcomes this problem by considering
multifactorial lines of evidence that a source is present or absent, and may be more robust to
differential persistence and decay due to changing environmental conditions because of a
redundancy and diversity in source-specific targets.
Approximately 1000 different microbial taxa are now known to reside in the human gut alone, but
the potential for this diversity to be used as a means for identifying sources remains largely
unexplored. To date there have been few comparative surveys of microbial community

40
composition among important sources of fecal contamination. New techniques for high-throughput
DNA sequence analysis enable identification of nearly all microbes that occur in a sample.
Targeting the whole microbial community for source identification is a fundamentally different
approach than traditional molecular methods that are dependent on the detection on one gene
sequence under complex environmental conditions. Sequence analysis of entire microbial
communities creates an opportunity to discover a multitude to different bacterial species that are
unique to fecal and environmental sources that contribute FIB to recreational waters. Rather than
relying on the detection of one single marker, a suite of bacterial species can be used as the basis of
assays to improve MST specificity and sensitivity. Using new high-throughput tools of sequence
analysis, a process of discovery is now available that was not readily available before –
comparative analysis of all the entire diversity of bacteria that compose the community of each
suspected source to identify unique combinations of bacterial taxa that are exclusive to a particular
source.
In this study we used a high-density oligonucleotide microarray to census the 16S rRNA gene
diversity in different sources of fecal contamination. The microarray targets 59,995 different 16S
rRNA gene polymorphisms that represent every known phylogenetic group of bacteria and archaea.
We test the assumption that a variety of common fecal sources select for specific populations of
bacteria due to differences in ecological conditions presented by their animal host. We screened a
variety of fecal sources of concern in coastal California to identify the microbial groups that are
source-specific, and then used these unique taxa to detect influence from these sources in marine
samples that exceed water quality limits for fecal indicator bacteria.
Methods
Feces sampling and DNA extraction
Human fecal wastes and freshly deposited fecal samples from animals were collected at numerous
locations throughout California. Human fecal sources included primary influent and effluent and
five different municipal wastewater treatment plants, two community septic tanks serving more

41
than 30 households each, and one composite sample of 10 holding tanks from individual
households. All animal samples consisted of composites of feces from at least five different
individuals in a single population. Sampled animal populations included cows (4), horses (4), tule
elk (4), western and California gulls (9), Canada geese (4), pelican (3), pigeon (2), cormorant (1),
sea lion (3), elephant seal (1). Composite fecal samples were homogenized and immediately frozen
upon collection and transported to the laboratory. Samples were stored at -80 °C until DNA
extraction.
Two DNA extraction methods were employed. The first was a modified Miller method (Miller et
al. 1999). Each fecal sample was extracted in triplicate. For each triplicate, 0.5 g of homogenized
fecal sample was added to a Lysing Matrix E tube (MP Biomedicals, Solon, OH). 300 μL of Miller
phosphate buffer and 300μL of Miller SDS lysis buffer were added and mixed. 600 μL
phenol:chloroform:isoamyl alcohol (25:24:1) was then added, and the tubes were bead- beat at
5.5m/s for 45sec in a FastPrep instrument. The tubes were spun at 16,000 x g for 5 min at 4°C. 540
μL of supernatant was transferred to a 2 ml tube and an equal volume of chloroform was added.
Tubes were mixed and then spun at 10,000 x g for 5 min 400 μL aqueous phase was transferred to
another tube and 2 volumes of Solution S3 (MoBio, Carlsbad, CA) was added and mixed by
inversion. The rest of the clean-up procedures followed the instructions in the MoBio Soil DNA
extraction kit. Samples were recovered in 60μL Solution S5 and stored at -80°C. The second DNA
extraction method was conducted with the DNA EZ extraction kit (Generite, North Brunswick, NJ)
per manufacturer’s instructions.
Water sampling and DNA extraction
Water monitoring samples were collected from the field from locations with both known and
unknown sources of contamination. One set of samples was collected during a 10-day period
following a 764,000 gallon spill of primary effluent from the Sausalito-Marin City Sanitary District
treatment plant in Sausalito, California that occurred in February 2009. Samples were collected at 8
onshore and offshore locations up to 1 km away from the plant daily for three days following the
spill, and then once more 10 days after the initial spill during an accidental rupture that occurred
during the repair. Water samples were collected in 1L bottles and stored at 4° C until laboratory

42
processing (within 6 hours of collection). For FIB tests, 20 mL of water was subsampled for FIB
tests of total coliforms and E. coli (Colilert, IDEXX Laboratories, Westbrook, ME) and
Enterococcus (Enterolert, IDEXX Laboratories). For DNA extraction, 250 mL x 3 of each sample
was vacuum filtered through Whatman Anodisc membrane filters (47 mm dia., 0.2 µm pore size)
and immediately frozen and stored at -80° C until DNA extraction. DNA was extracted from filters
using the DNA EZ kit per manufacturer’s instructions.
Water samples were also collected in conjunction with the State of California AB411 water quality
monitoring program at nine recreational beaches in San Francisco, Marin and Sonoma counties.
Marine beaches included Baker Beach (San Francisco Bay, 2 sampling locations), Horseshoe Cove
(San Francisco Bay, 3 sampling locations), Muir Beach (Pacific Ocean, 2 sampling locations),
Miller Point (Tomales Bay), Lawson’s Landing (Tomales Bay), Dillon Beach (Tomales Bay), and
Campbell Cove (Bodega Bay). Two freshwater beaches were located along Lagunitas Creek in
Marin County and included Inkwells and Green Bridge. Samples were collected weekly at each
location throughout the 2009 monitoring season (April-October). Samples were collected in knee
deep water in 1L sampling bottles and stored at 4° C until laboratory processing for FIB tests and
vacuum filtration as described above. Filters were stored at -80° C until DNA extraction.
Polymerase Chain Reaction
The 16S rRNA gene was amplified from each sample using PCR with primers 27F (5’-
AGAGTTTGATCCTGGCTCAG-3’) and 1492R (5’-GGTTACCTTGTTACGACTT-3’) for
bacteria and 4Fa (5’- TCCGGTTGATCCTGCCRG-3’) and 1492R for archaea. Each PCR reaction
contained 1× Ex Taq buffer (Takara Bio Inc., Japan), 0.025 units/μl Ex Taq polymerase, 0.8 mM
dNTP mixture, 1.0 µg/µl BSA, and 200 pM each primer and 1 ng genomic DNA (gDNA) as
template for fecal samples and 10 ng gDNA for water samples. For the PhyloChip assay each
sample was amplified in 8 replicate 25 µl reactions spanning a range of annealing temperatures.
PCR conditions were 95°C (3 min), followed by 30 cycles 95°C (30 s), 48-58°C (25 s), 72°C (2
min), followed by a final extension 72°C (10 min). Amplicons from each reaction were pooled for
each sample, purified with the QIAquick PCR purification kit (Qiagen, Valencia, CA), and eluted
in 50 µL elution buffer.

43
PhyloChip Assay Design
A complete description of the PhyloChip design and analysis is described in the supplementary
methods of (Hazen et al. 2010). The PhyloChip was designed to detect most 16S rRNA gene
sequences that identify bacteria and archaea. Aligned sequences were retrieved from the 16S
rRNA gene database, greengenes.lbl.gov (DeSantis et al. 2006). The sequences were clustered to
enable selection of perfectly complementary probes representing each sequence of a cluster.
Putative amplicons containing 17-mers with sequence identity to a cluster were included in that
cluster. The resulting 59,959 clusters, each encapsulating an average of 0.5% sequence divergence,
were considered operational taxonomic units (OTUs). The OTUs represented 2 domains, 147
phyla, 1,123 classes, and 1, 219 orders demarcated within the archaea and bacteria. Each OTU was
assigned to one of 1,464 families according to the placement of its member organisms in the
taxonomic outline as maintained by Philip Hugenholtz (Hugenholtz 2002).
For each OTU, multiple specific 25-mer targets were sought for prevalence in members of a given
OTU but dissimilar from sequences outside the given OTU. Probes complementary to target
sequences that were selected for fabrication are termed perfectly matching (PM) probes. As each
PM probe was chosen, it was paired with a control 25-mer (mismatching probe, MM), identical in
all positions except the thirteenth base. The MM probe did not contain a central 17-mer
complimentary to sequences in any OTU. The probe complementing the target PM and MM
probes constitute a probe pair analyzed together. The average number of probe pairs assigned to
each OTU was 37 (s.d. 9.6).
The chosen oligonucleotides were synthesized by a photolithographic method at Affymetrix Inc.
(Santa Clara, CA) directly onto a glass surface at an approximate density of 10,000 molecules per
μm2 and placed into “midi 100 format” hybridization cartridges. The entire array of 1,016,064
probe features was arranged as a grid of 1,008 rows and columns. Of these features, the majority
represents publicly available 16S rRNA genes, as described above. Additional probes are for
quality management, processing controls, image orientation, normalization controls, hierarchical
taxonomic identification, or for pathogen-specific signature detection and some implement
additional targeted regions of the chromosome.

44
Preparation of Samples for PhyloChip Assays
For PhyloChip hybridization, 500 ng of bacterial PCR product were prepared for PhyloChip
hybridization. PCR products were fragmented with DNAse I to a range of 50-200 bp as verified by
agarose gels. Commercial kits were utilized for DNA preparation: Affymetrix (Santa Clara, CA)
WT Double Stranded DNA Terminal Labeling, and Affymetrix GeneChip Hybridization, Wash,
and Stain kits were used for PhyloChip analysis. Briefly, fragmented 16S amplicons and non-16S
quantitative amplicon reference controls were labeled with biotin in 40 µL reactions containing: 8
μL of 5X TDF buffer, 40 units of TDF, 3.32 nanomoles of GeneChip labeling reagent. After
incubating at 37°C for 60 min, 2 µL of 0.5M EDTA was added to terminate the reaction. Labeled
DNA was combined with 65μL of 2X MES hybridization buffer, 20.4 μL of DMSO, 2 μL of
Affymetrix control oligo B2, and 0.4 μL nuclease free water. Each reaction mixture was injected
into the hybridization chamber of an array cartridge and incubated for 16 h in an Affymetrix
hybridization oven at 48°C and 60 RPM. Hybridization solution was then removed and the
microarrays were stained and scanned according to the manufacturer’s instructions.
PhyloChip Assay Analysis
Analysis procedures for fluorescent image files are described in detail in the supplemental material
of (Hazen et al. 2010). Briefly, each individual array feature occupied approximately 8x8 pixels in
the image file corresponding to a single probe 25mer on the surface. Probe intensities were
background-subtracted and scaled to quantitative standards (non-16S rRNA gene spike-ins) as
previously described (DeSantis et al. 2007). Presence/absence calling of each microbial taxon
(operational taxonomic unit – OTU) was based on positive hybridization of multiple probes that
correspond to an OTU (average of 37 probes/OTU). Differences in mean hybridization intensity
(fluorescence) of an OTU probe set among different PhyloChips reflected differences in the
relative abundance of the OTU (DeSantis et al. 2007).

45
Results and Discussion
Fecal source microbial communities
A total of 20,368 bacterial OTUs were detected across all fecal samples. Samples clustered by
source type indicating different samples of the same source type are more similar to each other than
they are to other sources. All birds were distinct from mammal sources (Figure 1). Within the
mammals samples clustered into three distinct groups comprising grazing animals (cows, elk,
horses), human wastes and pinnipeds. Grazing mammals were further partitioned into two clusters
comprising ruminants (cow, elk) and horses. Geese formed a distinct cluster within the birds. There
was no clustering among the other bird types (gulls, pelicans, pigeons, cormorants), and clustering
patterns were not related to geography.
Illustration 3: Collecting samples: Gale Ranch, Marin County.
Clostridia, lactic acid Bacilli and Bacteroidetes dominated taxonomic (OTU) richness of grazing
mammals (Figure 2). These bacteria are known to digest of cellulose and other plant
polysaccharides in the ruminant gut. Clostridia, Gammaproteobacteria (mostly coliforms) and

46
Bacteroidetes dominated taxonomic richness of human wastes. Gulls and pelicans had similar
composition of bacteria and were dominated by enteric Gammaproteobacteria and Bacilli.
Taxonomic richness in geese was distinct from other types of birds and dominated by
Actinobacteria, Alphaproteobacteria and Clostridia. Geese differ from other birds in this study
because of their unique diet and digestive system. Geese consume high-fiber feed, such as grass,
and contain a well-developed cecum that facilitates their breakdown in the large intestine. Canada
geese often forage for plants and insects in the soil, and thus ingest bacteria that are resident in soil
or on plant surfaces, and may explain the prominence of Actinobacteria and Alphaproteobacteria in
their feces. Clostridia and Gammaproteobacteria dominated the taxonomic richness of pinnipeds.
Based on similarities in community composition (Figure 1), the data were partitioned into four
major groups for identifier bacteria analysis: human wastes, birds, grazers and pinnipeds. Source
identifier taxa were defined as individual OTUs that were detected in a single source type, but
never detected in any samples from other sources. The criteria for identifier bacteria selection were
as follows: Identifier bacteria for animal sources needed to be present in at least three different
samples of each source type (birds, grazers, pinnipeds). Identifier bacteria for human sources
needed to be present in at least 7 samples. More stringent requirements were selected for human
sources because far more bacterial taxa were detected in human sources than animal sources, likely
due to overrepresentation of human-specific bacteria in the 16S rRNA gene database from human
microbiome sequencing projects. The number of OTUs present in at least three different
populations was 5385 for birds, 2989 for grazers and 140 for pinnipeds. The number of OTUs
present in at least seven different human waste samples was 1962. The number of these OTUs that
were unique to each source type was 304 for birds, 213 for grazers, 0 for pinnipeds, and 541 for
human wastes (Figure 3).
Diffusion chamber tests, in which samples of human and cattle source bacteria were placed in
chambers with membranes permeable to the receiving waters and samples taken over time to
determine the impacts of the receiving water on population. Results shown (Figure 4) show that
bay and creek waters showed different survival rates and relative abundance over time. These
tests, more fully reported in Appendix 4 show that is important to understand the fate of bacteria in
receiving waters. Therefore, selection of indicators for monitoring either human contamination or

47
other fecal contamination should be based on the waste type and persistence of fecal taxa in various
receiving waters.
Human identifier bacteria were primarily Bacteroidaceae and Clostridiales OTUs that matched
known human fecal bacteria 16S rRNA gene sequences (Figure 3). Human Clostridiales OTUs
were mainly found in the families Eubacterium, Faecalibacterium and Ruminococcus.
Verrucomicrobia in the family Akkermansia were also indicative of human wastes. These bacteria
known to be mucin degraders in the human GI tract.
Bird identifier taxa included several different groups of Bacilli, mainly Lactobacillales,
Staphylococcaceae (Figure 3). In addition, bird identifiers included one unclassified family in the
Clostridiales, Enterobacteriaceae and Fusobacteriaceae. Bacteroidetes are a minor component in
avian microbial communities (Lu et al. 2008). We found several Lactobacilli OTUs that are
included in the same subfamily as Catellicoccus marimammalium and are closely related to
Enterococcaceae. Lu et al. (2006) found gull feces were dominated by Bacilli (37% sequences),
most of which were closely related to Catellicoccus marimammalium.
Grazer identifier taxa included a variety of Clostridia, many of which are known from cattle rumen,
consisting of Clostridium, Ruminococcus, unclassified Clostridiales, RF6, RF30, RF39 and SHA-
32 (Figure 3). In addition, grazer identifiers included several Bacilli taxa found in the
Planococcaceae, and Bacteroidales taxa that were distinct from those found in human wastes
(Figure 3).
Pinniped microbial communities were distinct from other fecal sources, but all OTUs found in at
least three pinniped samples were also found in at least one other human or animal sample. Thus,
there are no OTUs represented on the PhyloChip that can be used to reliably distinguish pinniped
feces from other fecal sources tested in this analysis.

48
Application to source tracking: Sewage spill monitoring
The Sausalito-Marin City sewage spill into Richardson Bay was used to test the performance of the
fecal identifier bacteria in contaminated waters with a complex microbial background. The
PhyloChip was used to determine which bacterial taxa significantly increased in abundance in
samples with high FIB counts, and whether these enriched bacteria included the expected human
identifier bacteria described above. To determine which taxa were specifically associated with
high FIB counts, water samples with FIB concentrations that exceeded any 30-day geometric mean
concentration limit were compared to samples that fell below all FIB concentration limits. At all
sites, baseline microbial communities were defined by mean abundance of taxa in low FIB
samples. Taxa that significantly exceeded baseline (> mean + 2σ) were determined in high FIB
samples. The presence of source identifier bacteria in this enriched subset was used to determine
the association between human, bird or grazer feces and high fecal indicator counts. Results are
reported as the percent of expected identifier taxa that were detected in each sample. The expected
number of identifier taxa for a given source was calculated as the average number of source-
specific identifier taxa detected in any one fecal sample.

49
Illustration 4: Sampling sites associated with the Sausalito Sewage Spill
Out of 26 water samples collected in Richardson Bay, three exceeded the 1-day FIB concentration
limit and four exceeded 30-day geometric mean limits. These exceedance samples had distinct
microbial community compositions from baseline samples that fell below FIB limits (Figure 4).
All samples with high FIB counts contained most (78 - 96%) of the expected fecal identifier
bacteria for human fecal wastes (Figure 5). The human signal was obvious in samples that were
well below 1-day concentration limits and at or below 30-day limits (41 MPN/mL enterococcus,
120 MPN/mL E. Coli, 521 MPN/100mL total coliform), indicating the method is sensitive enough
to identify the presence of human fecal bacteria at minimum or below concentrations that pose a
potential health risk. In addition, the results showed no enrichment of bird or grazer identifier

50
bacteria in samples with high FIB counts, indicating the method was specific to human waste
(Figure 5).
Source identification of fecal indicator bacteria at AB411 beaches
Weekly water quality monitoring samples were analyzed from nine different beaches to determine
the source of FIB exceedances at each location. PhyloChip analysis was conducted on at least 10
samples from each site and included both FIB exceedance and non-exceedance (baseline) samples
that were collected throughout the monitoring season. A total of 125 samples were analyzed (Table
1). The analysis approach was similar to the sewage spill monitoring described above in which
FIB samples were analyzed at each site to establish the mean abundance and variance of each OTU
under baseline conditions. All OTUs detected in samples with FIB exceedances were compared to
their baseline values to determine if they were significantly enriched in relative abundance (> mean
+ 2σ above baseline). The presence of source identifier bacteria in this enriched subset was used to
determine the influence of human, bird and grazer sources.
Community analysis of all detected OTUs revealed that most samples with high FIB deviated in
bacterial composition from samples with low FIB (Figure 6). At marine sites, low FIB samples
were tightly clustered compared to the two freshwater sites (Figure 6). Thousands of OTUs were
significantly enriched in high FIB samples relative to baseline samples at each site, but the strength
of the enrichment and shift in bacterial composition varied by site (Figures 6 and 7).

51
Illustration 5: Selected AB 411 Beach Water Sampling Sites in Marin and Sonoma Counties
Map showing AB411 sites in Marin, Sonoma and San Francisco. Red circles indicate sites identified as ‘problem
beaches’ by SWRCB staff and the Clean Beaches Task Force.
Most exceedances at Campbell Cove in Bodega Bay were associated with enrichment of identifier
bacteria associated with birds (Figure 8). Human identifiers were not enriched in any high FIB
samples at Campbell Cove (Figure 8). Grazer identifiers were enriched in only one sample that
also included at enrichment of bird identifiers. From these results we conclude that birds are a
likely source of high FIB at Campbell Cove. These results are consistent with a previous source
tracking effort at this beach that used E. coli ribotyping to determine that birds and/or marine
mammals were the source of FIB. Gulls are frequently observed along the shoreline, and an
advisory is currently posted that warns of bird and marine mammal contamination. Interestingly,
all exceedances at this Campbell Cove were due to high enterococcus concentrations, while total

52
coliforms never exceeded 1-day concentration limits during the study. These results are consistent
with the findings of Lu et al. (2006) who found Bacilli related to enterococcus dominated gull
feces.
At the Tomales Bay sites, all exceedances were caused solely by high enterococcus concentrations,
and there was no enrichment of human or bird identifier bacteria in samples with FIB exceedances
(Figure 9). Grazer identifier bacteria were not enriched in high FIB samples with the exception of
one sample collected at Miller Point. No coliforms exceeded water quality limits. These results
indicate that the FIB source is unlikely to be human at the three sites monitored in Tomales Bay.
One exceedance sample indicated that grazers may be a potential source, but other exceedance
samples showed no evidence of links between grazers and high FIB. The primary source of FIB
appears to be from an environmental reservoir that was not characterized in this study. More
investigation of other potential sources is needed to pinpoint the FIB sources to Tomales Bay.
Exceedances at Horseshoe Cove were unassociated with human or grazer identifier bacteria (Figure
10). There was moderate enrichment of some (but <20%) of bird identifier taxa. The source of
FIB at this site is may include birds or other environmental sources, but is unlikely to be humans or
grazers. More investigation of other potential sources is needed to pinpoint the FIB source at this
location.
Exceedances at Baker Beach were associated with enrichment in both human and bird identifier
bacteria (Figure 11). There was no enrichment in grazer identifier bacteria. The magnitude of
exceedances was greater than at other marine sites and included exceedances in both enterococcus
and coliforms. The relative importance of human and bird fecal inputs cannot be determined in this
study; however the high coliform counts suggest that birds are not the primary cause of
exceedances at this site. At Baker Beach samples were collected in two locations. FIB were
clearly transported by Lobos Creek because nearly all exceedances occurred at station #15 at the
mouth of the creek. Station #16 further west down the beach rarely exceeded FIB limits. The
human signal observed at this site is concerning and potential human sources along Lobos Creek
need investigated.

53
Results from Lagunitas Creek (Inkwells, Green Bridge) showed evidence of contamination from
human, bird and grazer sources (Figure 12). These freshwater sites frequently exceeded FIB limits,
and were in continual violation throughout the late summer. The results indicate that fecal sources
to these sites were not consistent, and at times may have been human, bird or grazer in origin.
Future studies should investigate the relative contributions of these sources.
Conclusion
The results of this study show that 16S rRNA gene composition is strongly source-specific and can
be used to differentiate sources of fecal contamination in recreational waters. Universal 16S rRNA
gene amplification and analysis can serve as a rapid method for identifying sources of fecal
indicator bacteria without laborious culturing and fingerprinting methods. We found that birds are
the most likely source of FIB contamination at Campbell Cove. Neither human, grazer or bird
sources are likely to be primarily responsible for high FIB counts observed in Tomales Bay sites or
Horseshoe Cove. Both human and bird sources are associated with high FIB at Baker Beach in San
Francisco. Lagunitas Creek is impacted by a wide range of human, bird and grazer sources.
References
DeSantis, T. Z., E. L. Brodie, J. P. Moberg, I. X. Zubieta, Y. M. Piceno, and G. L. Andersen. 2007.High-density universal 16S rRNA microarray analysis reveals broader diversity than typicalclone library when sampling the environment. Microbial Ecology 53:371-383.
DeSantis, T. Z., P. Hugenholtz, N. Larsen, M. Rojas, E. L. Brodie, K. Keller, T. Huber, D. Dalevi,P. Hu, and G. L. Andersen. 2006. Greengenes, a chimera-checked 16S rRNA gene databaseand workbench compatible with ARB. Applied and Environmental Microbiology 72:5069-5072.
Domingo, J. W. S., D. G. Bambic, T. A. Edge, and S. Wuertz. 2007. Quo vadis source tracking?Towards a strategic framework for environmental monitoring of fecal pollution. WaterResearch 41:3539-3552.
Field, K. G. and M. Samadpour. 2007. Fecal source tracking, the indicator paradigm, and managingwater quality. Water Research 41:3517-3538.
Hazen, T. C., E. A. Dubinsky, T. Z. DeSantis, G. L. Andersen, Y. M. Piceno, N. Singh, J. K.Jansson, A. Probst, S. E. Borglin, J. L. Fortney, W. T. Stringfellow, M. Bill, M. E. Conrad,L. M. Tom, K. L. Chavarria, T. R. Alusi, R. Lamendella, D. C. Joyner, C. Spier, J. Baelum,M. Auer, M. L. Zemla, R. Chakraborty, E. L. Sonnenthal, P. D'Haeseleer, H. Y. N. Holman,S. Osman, Z. M. Lu, J. D. Van Nostrand, Y. Deng, J. Z. Zhou, and O. U. Mason. 2010.Deep-Sea Oil Plume Enriches Indigenous Oil-Degrading Bacteria. Science 330:204-208.

54
Hugenholtz, P. 2002. Exploring prokaryotic diversity in the genomic era. Genome Biology 3:1-8.Lu, J. R., J. W. Santo Domingo, R. Lamendella, T. Edge, and S. Hill. 2008. Phylogenetic diversity
and molecular detection of bacteria in gull feces. Applied and Environmental Microbiology74:3969-3976.
Miller, D. N., J. E. Bryant, E. L. Madsen, and W. C. Ghiorse. 1999. Evaluation and optimization ofDNA extraction and purification procedures for soil and sediment samples. Applied andEnvironmental Microbiology 65:4715-4724.

55
LIST OF TABLES
Table 1. Fecal indicator counts of samples selected for PhyloChip analysis.
LIST OF FIGURES
Figure 1. Cluster analysis dendrogram of 16S rRNA gene composition showing similarity amongmicrobial communities.
Figure 2. Composition of OTUs in each fecal source type. OTUs are shown that were detected inthe majority of samples for each source type.
Figure 3. Phylogenetic tree (a) and taxonomic composition (b) of source identifier OTUs forhuman wastes, birds and grazers.
Figure 4. Effects of Creek and Bay Water and Time on Fecal Communities
Figure 5. Microbial community analysis of water and sewage samples collected following the2009 sewage spill from the Sausalito Marin-City Sanitary District treatment plant.
Figure 6. Source identification of high FIB samples from February 2009 Sausalito sewage spillmonitoring.
Figure 7. Microbial community analysis of AB411 water samples.
Figure 8. Mean number of OTUs that were significantly enriched in high FIB samples.
Figure 9. Source identification of high FIB samples from AB411 monitoring at Campbell Cove,Bodega Bay.
Figure 10. Source identification of high FIB samples from AB411 monitoring at Tomales Bay sites(Dillon Beach, Lawson’s Landing, Miller Point).
Figure 11. Source identification of high FIB samples from AB411 monitoring at Horseshoe Covesites.
Figure 12. Source identification of high FIB samples from AB411 monitoring at Baker Beach inSan Francisco.
Figure 13. Source identification of high FIB samples from AB411 monitoring at Lagunitas Creeksites (Inkwells and Green Bridge).

56

57
LIST OF ILLUSTRATIONS
1. Cover photo: Muir Beach, CA (Wikimedia Commons) Page
2. Phylochip Microarray 6
3. Sample Collection: Gale Ranch 13
4. Sampling Sites during Sausalito Sewage Spill of 2009 17
5. Selected AB 411 Beach Monitoring Sites: Marin and Sonoma 19
Cover, Phylochip photos & maps

58

59
TABLE 1. Fecal indicator counts of samples selected for PhyloChip analysis.
Beach County DateEnterococcus
(MPN/100 mL)Escolar
(MPN/100 mL)Total Coliform(MPN/100 mL)
Green Bridge Marin 9/24/08 20 75 2247
Green Bridge Marin 10/15/08 135 148 629
Green Bridge Marin 10/22/08 41 145 789
Green Bridge Marin 10/29/08 189 110 8664
Green Bridge Marin 4/28/09 9 52 529
Green Bridge Marin 5/5/09 73 228 1086
Green Bridge Marin 5/12/09 9 86 689
Green Bridge Marin 6/9/09 30 74 749
Green Bridge Marin 7/14/09 9 20 1785
Green Bridge Marin 8/25/09 9 20 1455
Green Bridge Marin 9/1/09 31 20 6131
Green Bridge Marin 9/8/09 75 75 1106
Green Bridge Marin 9/15/09 74 74 11199
Green Bridge Marin 9/29/09 148 185 6015
Green Bridge Marin 10/6/09 20 31 1279
Green Bridge Marin 10/13/09 2489 2247 24192
Green Bridge Marin 10/20/09 24192 5475 24192
Green Bridge Marin 10/27/09 85 73 1012
Inkwells Marin 4/29/09 9 10 816
Inkwells Marin 5/6/09 134 121 2098
Inkwells Marin 5/13/09 63 135 1674
Inkwells Marin 6/10/09 41 228 2282
Inkwells Marin 7/15/09 52 160 4106
Inkwells Marin 7/29/09 86 62 2359
Inkwells Marin 8/26/09 30 9 2755
Inkwells Marin 9/9/09 160 9 2603
Inkwells Marin 9/30/09 530 10 1483
Inkwells Marin 10/7/09 108 9 706
Inkwells Marin 10/14/09 12997 17329 24192
Inkwells Marin 10/21/09 279 529 4352
Inkwells Marin 10/28/09 185 218 2489
Muir Beach North Marin 4/29/09 10 10 30
Muir Beach North Marin 5/6/09 96 31 288
Muir Beach North Marin 5/13/09 9 9 10
Muir Beach North Marin 6/17/09 10 85 156
Muir Beach North Marin 7/22/09 9 9 9
Muir Beach North Marin 8/26/09 9 20 31
Muir Beach North Marin 10/7/09 9 9 9
Muir Beach North Marin 10/14/09 41 52 249
Muir Beach North Marin 10/21/09 97 20 1017
Muir Beach North Marin 10/28/09 10 20 250
Horseshoe Cove NE Marin 10/15/08 9 10 63
Horseshoe Cove NE Marin 7/8/09 10 9 9
Horseshoe Cove NE Marin 8/19/09 10 9 530
Horseshoe Cove NE Marin 10/21/09 9 10 31
Horseshoe Cove NW Marin 10/15/08 31 31 83

60
Horseshoe Cove NW Marin 4/29/09 9 9 9
Horseshoe Cove NW Marin 5/6/09 9 109 109
Horseshoe Cove NW Marin 5/13/09 9 9 9
Horseshoe Cove NW Marin 6/17/09 9 10 142
Horseshoe Cove NW Marin 7/8/09 187 538 624
Horseshoe Cove NW Marin 8/19/09 148 10 214
Horseshoe Cove NW Marin 10/7/09 10 9 10
Horseshoe Cove NW Marin 10/14/09 256 10 473
Horseshoe Cove NW Marin 10/21/09 327 426 1414
Horseshoe Cove NW Marin 10/28/09 9 10 96
Horseshoe Cove SW Marin 10/15/08 109 1421 1607
Horseshoe Cove SW Marin 8/5/09 10 10 31
Horseshoe Cove SW Marin 8/19/09 9 10 52
Horseshoe Cove SW Marin 10/21/09 10 10 20
Dillon Beach Marin 4/29/09 9 9 9
Dillon Beach Marin 5/6/09 448 211 414
Dillon Beach Marin 5/13/09 9 9 9
Dillon Beach Marin 6/17/09 9 9 9
Dillon Beach Marin 7/22/09 9 20 31
Dillon Beach Marin 8/26/09 9 9 10
Dillon Beach Marin 10/7/09 9 9 9
Dillon Beach Marin 10/14/09 9 9 9
Dillon Beach Marin 10/28/09 9 9 9
Lawson’s Landing Marin 4/29/09 9 9 10
Lawson’s Landing Marin 5/6/09 122 41 85
Lawson’s Landing Marin 5/13/09 9 9 9
Lawson’s Landing Marin 6/17/09 9 9 10
Lawson’s Landing Marin 7/22/09 9 9 85
Lawson’s Landing Marin 8/26/09 9 9 86
Lawson’s Landing Marin 10/7/09 10 9 9
Lawson’s Landing Marin 10/14/09 471 135 295
Lawson’s Landing Marin 10/28/09 9 9 31
Miller Point Marin 4/29/09 10 9 9
Miller Point Marin 5/6/09 156 10 97
Miller Point Marin 6/17/09 9 9 9
Miller Point Marin 7/22/09 9 9 388
Miller Point Marin 8/26/09 9 9 197
Miller Point Marin 9/23/09 9 9 146
Miller Point Marin 9/30/09 243 218 323
Miller Point Marin 10/7/09 9 9 9
Miller Point Marin 10/14/09 189 187 473
Miller Point Marin 10/28/09 9 31 61
Baker Beach #15 San Francisco 10/1/08 884 473 17329
Baker Beach #15 San Francisco 10/15/08 10 31 63
Baker Beach #15 San Francisco 10/29/08 670 910 24196
Baker Beach #15 San Francisco 3/24/09 31 10 2143
Baker Beach #15 San Francisco 5/27/09 985 727 14136
Baker Beach #15 San Francisco 8/19/09 135 373 24196
Baker Beach #15 San Francisco 9/8/09 246 369 12033
Baker Beach #15 San Francisco 9/22/09 886 780 24196
Baker Beach #16 San Francisco 10/1/08 142 85 269
Baker Beach #16 San Francisco 10/15/08 298 107 7701
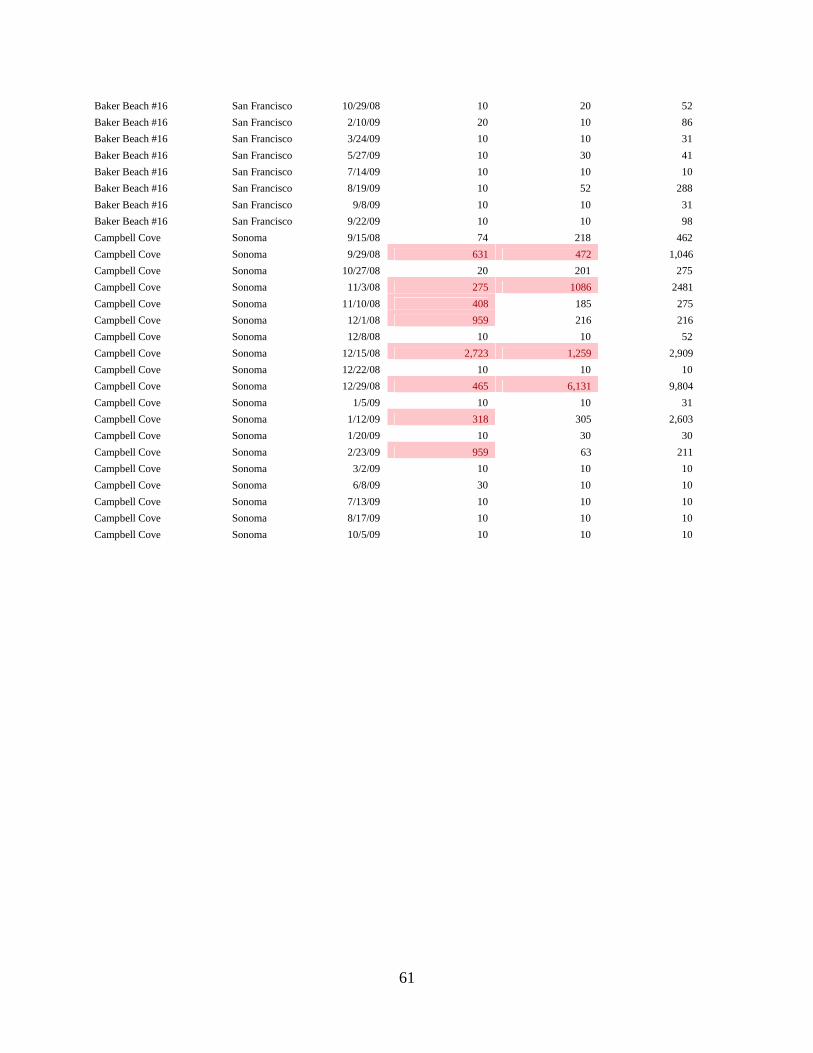
61
Baker Beach #16 San Francisco 10/29/08 10 20 52
Baker Beach #16 San Francisco 2/10/09 20 10 86
Baker Beach #16 San Francisco 3/24/09 10 10 31
Baker Beach #16 San Francisco 5/27/09 10 30 41
Baker Beach #16 San Francisco 7/14/09 10 10 10
Baker Beach #16 San Francisco 8/19/09 10 52 288
Baker Beach #16 San Francisco 9/8/09 10 10 31
Baker Beach #16 San Francisco 9/22/09 10 10 98
Campbell Cove Sonoma 9/15/08 74 218 462
Campbell Cove Sonoma 9/29/08 631 472 1,046
Campbell Cove Sonoma 10/27/08 20 201 275
Campbell Cove Sonoma 11/3/08 275 1086 2481
Campbell Cove Sonoma 11/10/08 408 185 275
Campbell Cove Sonoma 12/1/08 959 216 216
Campbell Cove Sonoma 12/8/08 10 10 52
Campbell Cove Sonoma 12/15/08 2,723 1,259 2,909
Campbell Cove Sonoma 12/22/08 10 10 10
Campbell Cove Sonoma 12/29/08 465 6,131 9,804
Campbell Cove Sonoma 1/5/09 10 10 31
Campbell Cove Sonoma 1/12/09 318 305 2,603
Campbell Cove Sonoma 1/20/09 10 30 30
Campbell Cove Sonoma 2/23/09 959 63 211
Campbell Cove Sonoma 3/2/09 10 10 10
Campbell Cove Sonoma 6/8/09 30 10 10
Campbell Cove Sonoma 7/13/09 10 10 10
Campbell Cove Sonoma 8/17/09 10 10 10
Campbell Cove Sonoma 10/5/09 10 10 10
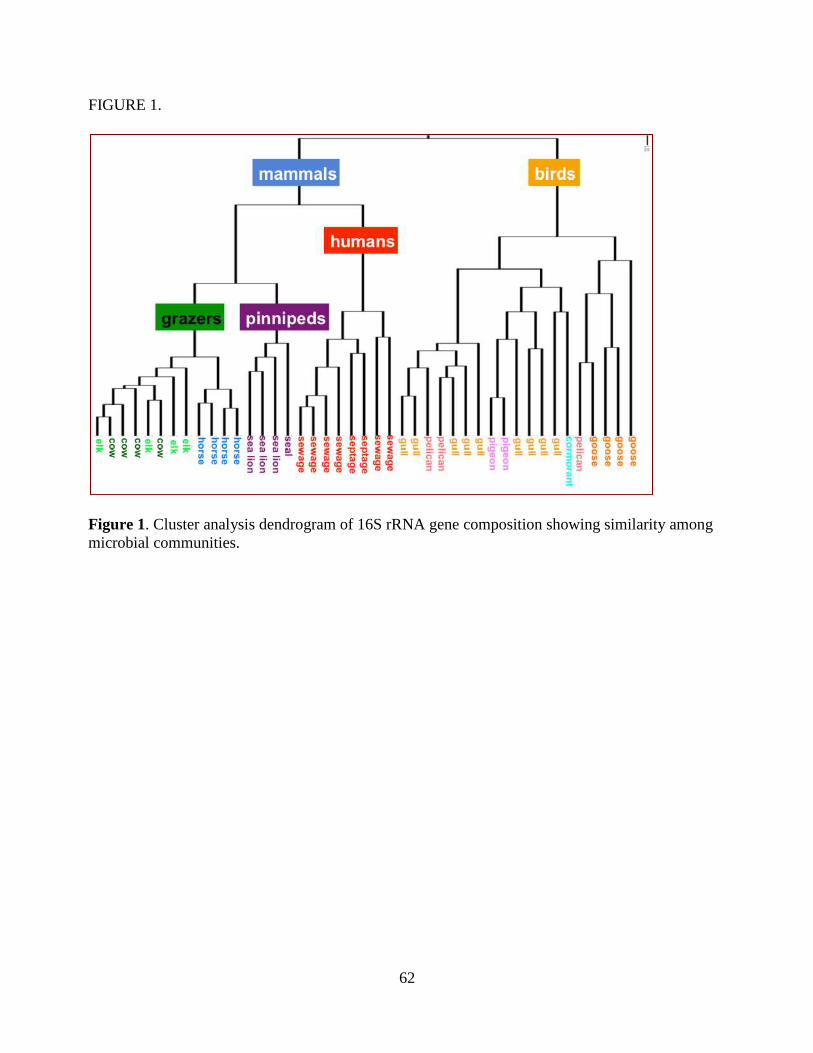
62
FIGURE 1.
Figure 1. Cluster analysis dendrogram of 16S rRNA gene composition showing similarity amongmicrobial communities.

63
FIGURE 2.
Figure 2. Composition of OTUs in each fecal source type. OTUs are shown that were detected inthe majority of samples for each source type. Total numbers of OTUs are shown in parentheses.Source type

64
FIGURE 3.
Figure 3. Phylogenetic tree (a) and taxonomic composition (b) of source identifier OTUs forhuman wastes, birds and grazers.

65
FIGURE 4

66
Figure 5
Figure 6. Microbial community analysis of water and sewage samples collected following the2009 sewage spill from the Sausalito Marin-City Sanitary District treatment plant. Ordination wasconducted using non-metric multidimensional scaling with the bray-curtis distance metric.

67
FIGURE 6
Figure 6. Source identification of high FIB samples from February 2009 Sausalito sewage spillmonitoring. Results from FIB tests (enterococcus, E. coli, total coliform) are plotted against thepercent of potential source-identifier taxa that were detected in high abundance (>mean baseline +2σ) by PhyloChip. Dashed line is the single-day FIB concentration limit for marine water. FIGURE 6

68
Figure 7. Microbial community analysis of AB411 water samples. Ordination was conductedusing non-metric multidimensional scaling with the bray-curtis distance metric. Circled clusters ofpoints show the distribution of samples in that were below FIB limits in different bodies of water.Samples that exceeded FIB limits are highlighted with red squares.

69
FIGURE 8
Figure 8. Mean number of OTUs that were significantly enriched in high FIB samples. EnrichedOTUs exceeded the mean baseline abundance by at least two standard deviations.
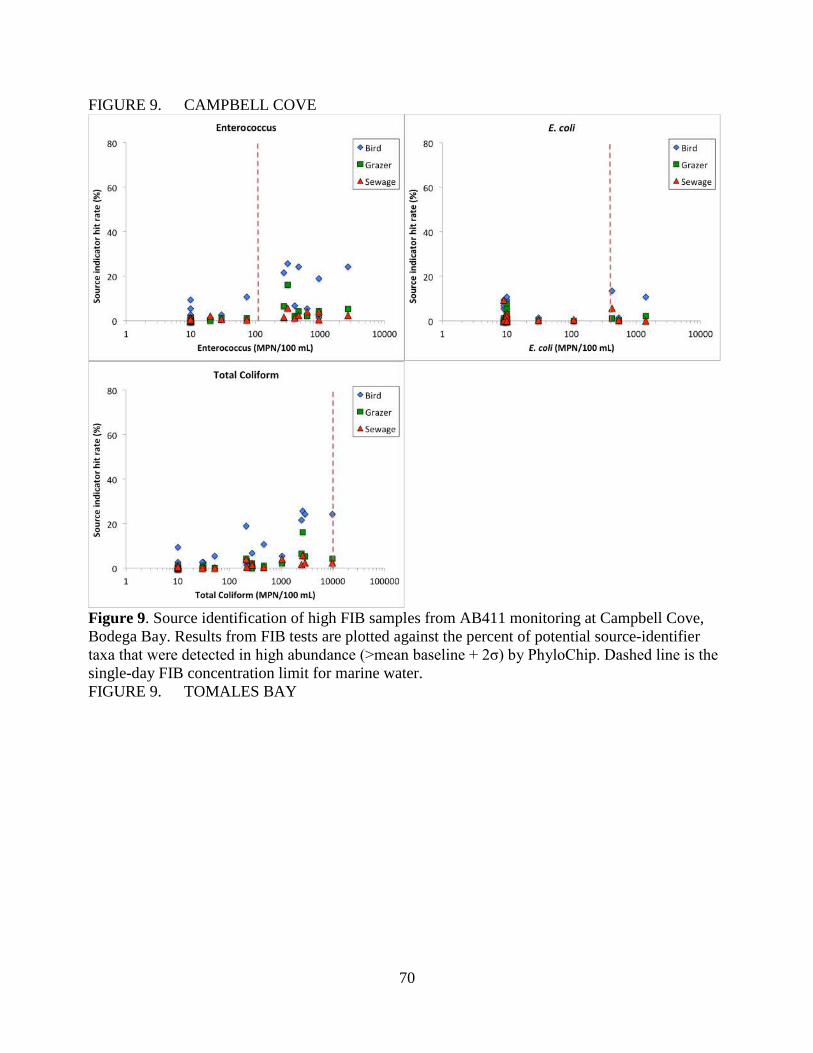
70
FIGURE 9. CAMPBELL COVE
Figure 9. Source identification of high FIB samples from AB411 monitoring at Campbell Cove,Bodega Bay. Results from FIB tests are plotted against the percent of potential source-identifiertaxa that were detected in high abundance (>mean baseline + 2σ) by PhyloChip. Dashed line is the single-day FIB concentration limit for marine water.FIGURE 9. TOMALES BAY
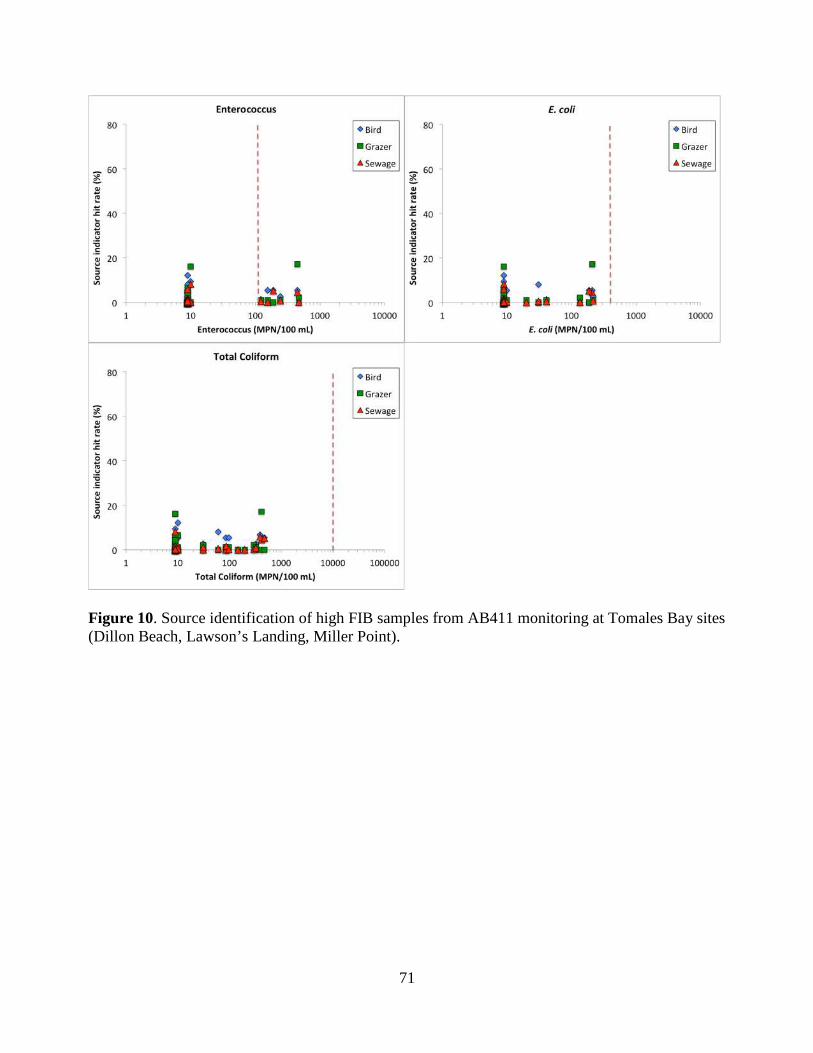
71
Figure 10. Source identification of high FIB samples from AB411 monitoring at Tomales Bay sites(Dillon Beach, Lawson’s Landing, Miller Point).
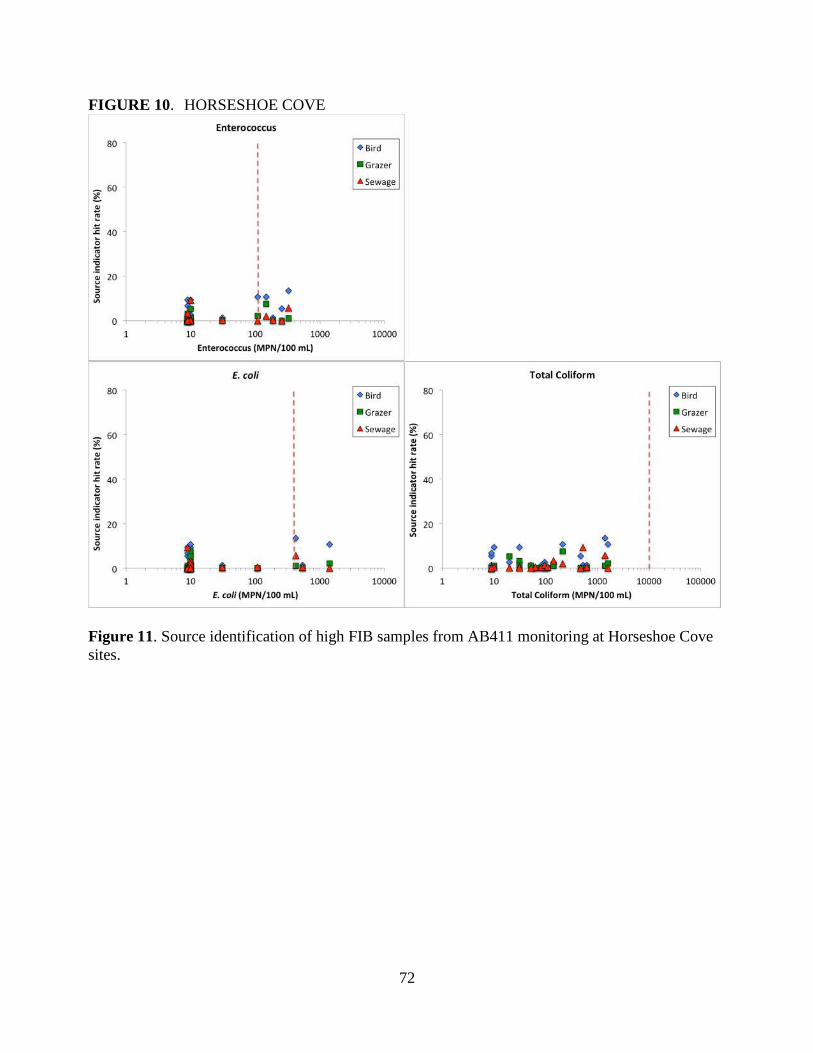
72
FIGURE 10. HORSESHOE COVE
Figure 11. Source identification of high FIB samples from AB411 monitoring at Horseshoe Covesites.

73
FIGURE 12. BAKER BEACH
Figure 12. Source identification of high FIB samples from AB411 monitoring at Baker Beach inSan Francisco.

74
FIGURE 13. LAGUNITAS CREEK
Figure 13. Source identification of high FIB samples from AB411 monitoring at Lagunitas Creeksites (Inkwells and Green Bridge).

Appendix 3:
Scientific Paper: “Application of Phylogenetic Microarray Analysis toDiscriminate Sources of Fecal Pollution.”


1 Application of Phylogenetic Microarray Analysis to Discriminate2 Sources of Fecal Pollution3 Eric A. Dubinsky,† Laleh Esmaili,† John R. Hulls,† Yiping Cao,‡ John F. Griffith,‡ and Gary L. Andersen*,†
4†Lawrence Berkeley National Laboratory, Earth Sciences Division, Berkeley, CA
5‡Southern California Coastal Water Research Project, Costa Mesa, CA
6 *S Supporting Information
7 ABSTRACT: Conventional methods for fecal source tracking8 typically use single biomarkers to systematically identify or9 exclude sources. High-throughput DNA sequence analysis can10 potentially identify all sources of microbial contaminants in a11 single test by measuring the total diversity of fecal microbial12 communities. In this study, we used phylogenetic microarray13 analysis to determine the comprehensive suite of bacteria that14 define major sources of fecal contamination in coastal California.15 Fecal wastes were collected from 42 different populations of16 humans, birds, cows, horses, elk, and pinnipeds. We characterized17 bacterial community composition using a DNA microarray that18 probes for 16S rRNA genes of 59 316 different bacterial taxa.19 Cluster analysis revealed strong differences in community20 composition among fecal wastes from human, birds, pinnipeds,21 and grazers. Actinobacteria, Bacilli, and many Gammaproteobac-22 teria taxa discriminated birds from mammalian sources. Diverse23 families within the Clostridia and Bacteroidetes taxa discrimi-24 nated human wastes, grazers, and pinnipeds from each other. We25 found 1058 different bacterial taxa that were unique to either human, grazing mammal, or bird fecal wastes. These OTUs can26 serve as specific identifier taxa for these sources in environmental waters. Two field tests in marine waters demonstrate the27 capacity of phylogenetic microarray analysis to track multiple sources with one test.
28 ■ INTRODUCTION29 Beach closures and public health advisories have a major30 economic impact on coastal communities whose economies are31 based largely on tourism from beach recreation. Most closings32 and advisories are triggered by water samples that exceed33 microbial water quality standards for fecal indicator bacteria34 (FIB), usually culturable coliforms, E. coli, or enterococci that35 are considered a proxy for human health risk in recreational36 waters. Because the direct measurement of all human pathogens37 is often impractical and unreliable under field conditions, water38 monitoring relies on the detection of bacterial indicators that39 have some demonstrated correlation with human illness in40 areas mostly impacted by human sewage.1,2 Sewage, however, is41 one of many potential sources of FIB, and monitoring results42 are often confounded by inputs from a variety of wildlife and43 nonfecal sources.1,3−5 FIB are common in most warm-blooded44 animals, and many studies demonstrate that FIB occur in45 several environmental sources aside from feces, including soils46 and sediments, algal wrack, and beach sands.3−5 Thus, water47 bodies often contain measurable amounts of FIB even where48 anthropogenic inputs are absent, and the presence of FIB49 provides an insufficient indication of health risk without50 additional source tracking data.
51Shortcomings of the current FIB monitoring approach52combined with widespread development and implementation53of total maximum daily load (TMDL) requirements for54microbiological pollution are fueling interest in microbial55source tracking (MST) methods.6,7 Many approaches to source56tracking are under development, most of which rely on single57phenotypic or genotypic biomarkers to measure sources.1,6 A58limitation of single targets is that no single assay is known to be59100% specific for any one type of waste,6 and MST based on60single targets is entirely dependent on the fate of one biomarker61once it enters receiving waters.8−10
62A huge diversity of microorganisms is resident in human and63animal guts. Approximately 1000 different microbial taxa are64now known to reside in the human gut alone, but the potential65for this diversity to be used as a means for identifying sources66remains largely unexplored and there have been few67comparative surveys of microbial community composition68among important sources of fecal contamination.11−13 New
Received: November 17, 2011Revised: February 23, 2012Accepted: February 23, 2012
Article
pubs.acs.org/est
© XXXX American Chemical Society A dx.doi.org/10.1021/es2040366 | Environ. Sci. Technol. XXXX, XXX, XXX−XXX
jwp00 | ACSJCA | JCA10.0.1408/W Unicode | research.3f (R2.3.i6:3256 | 2.0 alpha 39) 2012/02/22 10:29:02 | PROD-JCAVA | rq_1405477 | 3/08/2012 09:15:22 | 8

69 techniques for high-throughput DNA sequence analysis such as70 high-density microarrays and next-generation sequencing71 (NGS) technologies like pyrosequencing are enabling72 comprehensive surveys of diverse microbial communities that73 occur in a sample. Targeting the whole microbial community74 for source identification is a fundamentally different approach75 than traditional molecular methods that are dependent on the76 detection on one gene sequence under complex environmental77 conditions.11,14−16 Sequence analysis of entire microbial78 communities creates an opportunity to discover a multitude79 to different bacterial species that are unique to fecal and80 environmental sources of FIB in recreational waters.81 In this study, we used a high-density oligonucleotide82 microarray to census the 16S rRNA gene diversity in different83 sources of fecal contamination. The microarray targets 59 31684 different 16S rRNA gene polymorphisms that represent most85 known phyla of bacteria. We test the assumption that different86 avian and mammalian fecal sources can be distinguished on the87 basis of their bacterial community composition. We screened a88 variety of fecal sources of concern in coastal California to89 identify the microbial groups that are source-specific and then90 used these unique taxa to detect influence from these sources in91 marine samples that exceeded water quality limits for fecal92 indicator bacteria.
93 ■ METHODS94 Feces Sampling and DNA Extraction. Human fecal95 wastes and freshly deposited droppings from animals were96 collected at numerous locations throughout California97 (Supporting Information). Human fecal wastes included98 primary influent or effluent from eight different municipal99 wastewater treatment plants, leachate samples from two100 community septic tanks serving more than 30 households101 each, and one composite sample of 10 holding tanks from102 individual households. Sampled animal populations included103 cows (4), horses (4), tule elk (4), western and California gulls104 (9), Canada geese (4), pelican (3), pigeon (2), cormorant (1),105 sea lion (3), elephant seal (1). Each animal sample was a106 composite of droppings from at least five different individuals107 from one location and every replicate sample is from a unique108 population. Individual fecal samples were homogenized and109 immediately frozen upon collection. Samples were stored at110 −80 °C until DNA extraction.111 Each fecal sample was extracted in triplicate to obtain112 genomic DNA from the microbial community. Two extraction113 methods were employed: a CTAB extraction method and a kit114 extraction. In the CTAB method, 0.5 g of homogenized fecal115 sample were added to a Lysing Matrix E tube (MP Biomedicals,116 Solon, OH), and 650 μL TE buffer, 250 μL 10× phosphate117 buffered saline, and 100 μL 10% SDS were added. The tubes118 were bead-beat at 5.5 m/s for 25 s in a FastPrep-24 instrument119 (MP Biomedicals, Solon, OH), 5.5 m/s for 25 s, 10 μL of 20120 mg/mL Proteinase K was added and tubes were incubated at 37121 °C for 30 min. Following centrifugation at 10 000g for 5 min,122 supernatant was transferred to 2 mL microcentrifuge tube and123 amended with 80 μL 5 M NaCl and 80 μL 10% CTAB buffer124 solution. Tubes were heated at 65 °C for 10 min, 700 μL 24:1125 chloroform/isopropanol added and then centrifuged at 6000g126 for 5 min. Supernatant was transferred to a clean micro-127 centrifuge tube, amended with 0.8 volumes of isopropanol,128 gently mixed, and incubated at −20 °C for 1 h. Following129 centrifugation at 16 000g 4 °C for 15 min the supernatant was130 discarded and the remaining extract washed with ice-cold 70%
131ethanol. Following centrifugation at 16 000g at 4 °C for 5 min,132the supernatant was discarded, and the remaining DNA pellet133was air-dried and suspended in 30 μL elution buffer. The134second DNA extraction method was conducted with the DNA135EZ extraction kit (GeneRite, North Brunswick, NJ) per136manufacturer’s instructions. We extracted a subset of samples137with both methods and saw little difference in the measured138community profiles, and we saw no similarity patterns in our139final results that were explained by extraction method.140Water Sampling and DNA Extraction. Water monitoring141samples were collected from the field at sites with known142sources of contamination. One set of samples was collected143during a 10-day period following a 720 000 gallon spill of144primary effluent from the Sausalito-Marin City Sanitary District145treatment plant in Sausalito, California, that occurred in146February 2009. Samples were collected daily for three days147following the onset of the spill and then once more 10 days148after the initial spill during an accidental rupture that occurred149during the repair. Sample locations included eight onshore and150offshore sites ranging from directly adjacent to the ruptured151pipe at the plant to up to 1 km away from the spill origin. Water152samples were collected in 1 L bottles and stored at 4 °C until153laboratory processing (within 6 h of collection). For FIB tests,15420 mL of water was subsampled for total coliforms and E. coli155(Colilert, IDEXX Laboratories, Westbrook, ME) and Enter-156ococcus (Enterolert, IDEXX Laboratories). For DNA extrac-157tion, 250 mL × 3 of each sample was vacuum filtered through158Whatman Anodisc membrane filters (47 mm dia., 0.2 μm pore159size) and immediately frozen and stored at −80 °C until DNA160extraction. DNA was extracted from filters using the DNA EZ161kit per manufacturer’s instructions.162Water samples were also collected in conjunction with the163County of Sonoma as part of the State of California AB411164monitoring program at Campbell Cove, Bodega Bay. Samples165were collected weekly throughout 2008−2009 in knee-deep166water with 1 L sampling bottles and processed in the laboratory167as described above. A subset of samples was analyzed based on168FIB counts. The analysis focused on nine samples that169exceeded 1-day concentration limits and an additional 10170samples scattered throughout the sampling period that fell171below FIB limits.172Polymerase Chain Reaction. The bacterial 16S rRNA173gene was amplified from each sample using PCR with primers17427F (5′-AGAGTTTGATCCTGGCTCAG-3′) and 1492R (5′-175GGTTACCTTGTTACGACTT-3′) for bacteria. Each PCR176reaction contained 1× Ex Taq buffer (Takara Bio Inc., Japan),1770.025 units/μL Ex Taq polymerase, 0.8 mM dNTP mixture, 1.0178μg/μL BSA, and 200 pM each primer, and 1 ng genomic DNA179(gDNA) as template for fecal samples and 10 ng gDNA for180water samples. Each sample was amplified in 8 replicate 25 μL181reactions spanning a range of annealing temperatures. PCR182conditions were 95 °C (3 min), followed by 30 cycles 95 °C183(30 s), 48−58 °C (25 s), 72 °C (2 min), followed by a final184extension 72 °C (10 min). Amplicons from each reaction were185pooled for each sample, purified with the QIAquick PCR186purification kit (Qiagen, Valencia, CA), and eluted in 50 μL187elution buffer.188PhyloChip Assay Description and Analysis. A complete189description of the PhyloChip design and analysis is available in190the supplementary methods of Hazen et al.17 The PhyloChip191(Second Genome, San Bruno, CA) was designed to detect most19216S rRNA gene sequences that identify bacteria and archaea.193The PhyloChip probes for 59 959 different bacterial and
Environmental Science & Technology Article
dx.doi.org/10.1021/es2040366 | Environ. Sci. Technol. XXXX, XXX, XXX−XXXB

194 archaeal taxa that represent 147 phyla, 1123 classes, 1219195 orders, and 1464 families according to the placement of its196 member organisms in the taxonomic outline as maintained by197 Philip Hugenholtz.18 The microarray includes 1 016 064 probe198 features, the majority of which target 16S rRNA gene sequences199 that are useful for differentiating taxa. Additional probes are for200 quality management, processing controls, image orientation,201 and normalization controls.17
202 PhyloChip Assay Analysis. For PhyloChip hybridization,203 we used 500 ng of bacterial PCR product for each microarray.204 PCR products were fragmented with DNase I to a range of 50−205 200 bp as verified by agarose gels. Commercial kits were206 utilized for DNA preparation: Affymetrix (Santa Clara, CA)207 WT Double Stranded DNA Terminal Labeling, and Affymetrix208 GeneChip Hybridization, Wash, and Stain kits were used for209 PhyloChip analysis. Briefly, fragmented 16S amplicons and210 non-16S quantitative amplicon reference controls were labeled211 with biotin in 40 μL reactions containing: 8 μL of 5X TDF212 buffer, 40 units of TDF, 3.32 nanomoles of GeneChip labeling213 reagent. After incubating at 37 °C for 60 min, 2 μL of 0.5 M214 EDTA was added to terminate the reaction. Labeled DNA was215 combined with 65 μL of 2X MES hybridization buffer, 20.4 μL216 of DMSO, 2 μL of Affymetrix control oligo B2, and 0.4 μL217 nuclease free water. Each reaction mixture was injected into the218 hybridization chamber of an array cartridge and incubated for219 16 h in an Affymetrix hybridization oven at 48 °C and 60 rpm.220 Hybridization solution was removed and the microarrays were221 stained and scanned according to the manufacturers222 instructions.223 Analysis procedures for fluorescent image files are described224 in detail in the Supporting Information of Hazen et al.17 Briefly,225 each individual array feature occupied approximately 8 × 8226 pixels in the image file corresponding to a single probe 25mer227 on the surface. Probe intensities were background-subtracted228 and scaled to quantitative standards (non-16S rRNA gene229 spike-ins) as previously described.19 Presence/absence calling230 of each microbial taxon (operational taxonomic unit − OTU)231 was based on positive hybridization of multiple probes that232 correspond to an OTU (average of 37 probes/OTU).233 Differences in mean hybridization intensity (fluorescence) of234 an OTU probe set among different PhyloChips reflected235 differences in the relative abundance of the OTU.19 The236 PhyloChip data used in this study are available for download at237 http://greengenes.lbl.gov/Download/Microarray_Data/.238 PhyloChip results are output as lists of detected OTUs and239 their hybridization scores with associated taxonomic informa-240 tion and references to represented sequences in public 16S241 rRNA gene repositories (greengenes.lbl.gov). Hybridization242 results were reduced to a community profile from each243 PhyloChip assay to a format useful for multivariate statistics244 consisting of log transformed hybridization intensity values for245 all detected OTUs. Interprofile dissimilarity was calculated with246 the Bray−Curtis metric, and the resulting distance matrix was247 analyzed with hierarchical cluster analysis and nonmetric248 multidimensional scaling (NMDS) ordination using the Primer249 v.6.1.13 statistical package. Analysis of Similarity (ANOSIM)250 was used to test the significance of differences in community251 composition among sample groups.252 Determination of Source Identifier Taxa. Source253 identifier taxa were defined as individual OTUs that were254 detected in a single source type but never detected in any255 samples from other sources. The criteria for identifier bacteria256 selection were as follows: Identifier bacteria for animal sources
257needed to be unique to a single animal type and present in at258least three distinct populations. Identifier bacteria for human259sources needed to be present in at least 7 of 8 samples. More260stringent requirements were selected for human sources261because a greater number of bacterial taxa were detected in262human sources than animal sources likely due to over-263representation of human-specific bacteria in the 16S rRNA264gene database from human microbiome sequencing projects.265Source Identification in Environmental Water Sam-266ples. Application of PhyloChip for source identification in267marine waters was tested in two field scenarios with known268sources of human and avian contamination. The first was a269monitoring study of a 765 000 gallon spill that occurred in270Richardson Bay, an arm of San Francisco Bay, off the coast of271Sausalito, CA, in February 2009. The PhyloChip was used to272determine which bacterial taxa significantly increased in relative273abundance in samples with high FIB counts and whether these274enriched bacteria included the expected human identifier275bacteria described above. To determine which taxa were276specifically associated with high FIB counts, water samples with277FIB concentrations that exceeded any 30-day geometric mean278concentration limit were compared to samples that fell below279all FIB concentration limits. Baseline microbial communities280were defined by mean abundance of taxa in low FIB samples.281Taxa whose relative abundance significantly exceeded baseline282(>mean +2σ) were determined in high FIB samples. The283presence of source identifier bacteria in this enriched subset was284used to determine the association between fecal sources and285FIB exceedances. Results are reported as the percent of286expected identifier taxa that were detected in each sample. The287expected number of identifier taxa for a given source was288defined as the average number of source-specific identifier taxa289detected in individual populations of that source. A positive290signal for source detection was define as >20% enrichment of291expected identifier taxa in a sample. Significant association292between the detection of each source type and high FIB293exceedances (Enterococcus above regulatory limit) was tested294with contingency analysis (JMP 7.0.1).295The second field test occurred at Campbell Cove in Bodega296Bay, California, a recreational beach that frequently exceeds FIB297water quality limits. Contamination at this beach is not from298human sources and is likely due to gull feces.20 We collected299weekly monitoring samples over a 1-year period at this beach in300conjunction with the county as part of the California Clean301Beaches Initiative. Samples were split for both routine FIB302testing and filtration for subsequent PhyloChip analysis. The303analysis approach was similar to the sewage spill monitoring304described above in which low FIB samples were analyzed at305each site to establish the mean abundance and variance of each306OTU under baseline (nonexceedance) conditions, and307association between the enrichment of source identifier taxa308and high FIB counts was tested with contingency analysis.
309■ RESULTS AND DISCUSSION310Fecal Source Microbial Communities. A total of 20 368311bacterial OTUs were detected across all fecal samples. Samples312clustered by source type indicating fecal bacterial communities313of the same type of source animal were more similar to each314 f1other than to those of other sources (Figure 1). The deepest315branching clusters separated all mammalian sources from avian316sources indicating that microbial community composition is a317distinctive characteristic of these two classes of vertebrates.318Within the mammals, samples clustered into three distinct
Environmental Science & Technology Article
dx.doi.org/10.1021/es2040366 | Environ. Sci. Technol. XXXX, XXX, XXX−XXXC

319 groups comprised of grazing animals (cows, elk, horses),320 human wastes, and pinnipeds (Figure 1). Grazing mammals321 were further partitioned into two clusters comprising ruminants322 (cow, elk) and horses. Geese formed a distinct cluster within323 the birds. There was no obvious clustering among the other324 bird types (gulls, pelicans, pigeons, cormorants), and clustering325 patterns among these birds were not related to geography. All326 sources contained taxonomic groups that encompass E. coli and327 Enterococcus that are used as regulatory fecal indicators.328 Clostridia dominated the taxonomic (OTU) richness of the
f2 329 fecal bacteria in mammalian fecal sources (Figure 2). The
330 remainder of taxonomic diversity in mammals was comprised of331 mainly Bacteroidales, Gammaproteobacteria, and Bacilli. These332 results are consistent with previous surveys of other mammalian333 gut microbial communities.12,13,21 In contrast to mammals,334 avian feces contained far less taxa in the Clostridia and335 Bacteroidales and instead were dominated by Gammaproteo-336 bacteria and Bacilli (Figure 2).337 Analysis of avian fecal samples revealed that seabirds and338 pigeons had similar composition of bacteria and were339 dominated by Gammaproteobacteria (mostly Enterobacteria)340 and Bacilli (mostly Lactobacillales) (Figure 2). Fecal
341communities in these birds were also characterized by the342presence of Fusobacteriaceae OTUs that were generally absent343from mammalian and geese communities. Taxonomic compo-344sition in geese was distinct from other types of birds and345contained greater numbers of taxa in the Actinobacteria,346Alphaproteobacteria, and Clostridia. Geese differ from other347birds in this study because of their unique diet and digestive348system. Geese consume high-fiber feed, such as grass, and349contain a well-developed cecum that facilitates their breakdown350in the large intestine.22 This more rumenlike digestive system351facilitates the activity of fermentative Clostridia.23 Canada geese352often forage for plants and insects in the soil, and consequently353ingest bacteria that are resident in soil or on plant surfaces,354which may explain the prominence of Actinobacteria and355Alphaproteobacteria in their feces. Despite these differences356between geese and other birds, geese bacterial communities357were more similar to other types of birds than they were to any358mammalian fecal sources (Figure 1).359Within the mammals, a variety of Clostridia, Bacilli, and360Bacteroidetes dominated taxonomic (OTU) richness of grazing361mammals (Figure 2). These bacteria are known to digest362cellulose and other plant polysaccharides in the ruminant gut.363Clostridia, Gammaproteobacteria (mostly coliforms), and364Bacteroidetes dominated taxonomic richness of human wastes365(Figure 2). Human wastes were further distinguished by the366presence of several Betaproteobacteria and Verrucomicrobia.367Clostridia and Gammaproteobacteria dominated the taxonomic368richness of pinnipeds.369On the basis of similarities in community composition370(Figure 1), the data were partitioned into four major groups for371identifier bacteria analysis: human wastes, birds, grazers, and372pinnipeds. Source identifier taxa were defined as individual373OTUs that were detected in a single source type but never374detected in any samples from other sources. The number of375OTUs that met criteria for selection as source identifier taxa376was 304 for birds, 213 for grazers, 0 for pinnipeds, and 541 for377 f3human wastes (Figure 3).378Human identifier bacteria were primarily Bacteroidaceae and379Clostridiales OTUs that matched known human fecal bacteria38016S rRNA gene sequences (Figure 3). Human Clostridiales381OTUs were mainly found in the families Eubacterium,382Faecalibacterium and Ruminococcus. Verrucomicrobia in the383family Akkermansia were also indicative of human wastes, and384are known to be mucin degraders in the human GI tract.385Bird identifier taxa included several different groups of Bacilli,386mainly Lactobacillales, and Staphylococcaceae (Figure 3). In387addition, bird identifier bacteria included one unclassified388family in the Clostridiales, as well as Enterobacteriaceae and389Fusobacteriaceae. Bacteroidetes are a minor component in390avian microbial communities.24 We found several Lactobacilli391OTUs that are included in the same subfamily as Catellicoccus392marimammalium and that are closely related to Enterococcaceae.393Lu et al.24 found gull feces were dominated by Bacilli (37%394sequences), most of which were closely related to Catellicoccus395marimammalium.396Grazer identifier taxa included a variety of Clostridia, many of397which are known from cattle rumen, consisting of Clostridium,398Ruminococcus, unclassified Clostridiales, RF6, RF30, RF39,399and SHA-32 (Figure 3). In addition, grazer identifiers included400several Bacilli taxa found in the Planococcaceae, and401Bacteroidales taxa that were distinct from those found in402human wastes (Figure 3).
Figure 1. Cluster analysis dendrogram of 16S rRNA gene compositionshowing similarity among microbial communities in fecal sources. Eachsample represents a distinct animal population or sewage source and isa composite of individual fecal samples from the population.
Figure 2. Composition of OTUs detected in each fecal source. OTUsare shown that were detected in at least half of the samples for eachsource animal. Total number of OTUs is shown in parentheses andlists with taxonomic descriptions found in .
Environmental Science & Technology Article
dx.doi.org/10.1021/es2040366 | Environ. Sci. Technol. XXXX, XXX, XXX−XXXD

403 Pinniped microbial communities were distinct from other404 fecal sources, but all OTUs found in at least three pinniped405 samples were also found in at least one other human or animal406 sample. For this reason, this study did not generate identifier407 taxa for pinnipeds due to the potential for cross-reactivity.408 Source identification field tests. Application of Phy-409 loChip for source identification in marine waters was tested in410 two field scenarios with defined sources of human and avian411 contamination. The first test looked investigated microbial412 communities in Richardson Bay waters adjacent to a large413 sewage spill. Out of 26 water samples collected during the spill,414 two exceeded the 1-day Enterococcus concentration limit for415 marine water (104 MPN/mL) and an additional five exceeded416 the 30-day geometric mean limit (35 MPN/mL). These417 exceedance samples had significantly different microbial418 community compositions than samples that fell below FIB
f4 419 limits (Figure 4). All samples that were above Enterococcus420 limits contained most (78−96%) of the expected fecal identifier
f5 421 bacteria for human fecal wastes (Figure 5). In contrast, there422 was little enrichment of bird or grazer identifier bacteria (0−423 10%) in samples with high Enterococcus counts. Contingency424 analysis showed greater than expected numbers of samples with425 enrichment in human identifier taxa (>20% identifiers426 enriched) in high enterococcus samples (P < 0.001) but427 insignificant enrichment of grazer or bird identifier taxa (P >428 0.05). The results show the PhyloChip analysis is sensitive to429 human fecal signal in marine waters.430 The second field test was conducted along the beach of431 Campbell Cove in Bodega Bay, a site where a previous source432 tracking investigation found no evidence of human fecal433 contamination.20 We analyzed a total of nine samples with high434 enterococcus counts (>35 MPN/mL) and eleven nonexcee-435 dance samples collected over the course of one year. An average
436of 1093 out of 6046 detected OTUs were significantly enriched437over baseline relative abundances in high enterococcus samples.438Several samples with high enterococcus had significant439enrichment of identifier bacteria associated with bird feces440 f6(Figure 6). Contingency analysis showed greater than expected441numbers of samples with enrichment in bird identifier taxa442(>20% identifiers enriched) in high enterococcus samples (P =4430.033). Neither human nor grazer fecal identifiers were444significantly enriched when enterococcus counts were high (P
Figure 3. Phylogenetic tree (a) and taxonomic composition (b) of source identifier OTUs for human wastes, birds, and grazers. The phylogenetictree was constructed from using full-length 16S rRNA gene sequences of representative taxa in each OTU using the approximately maximumlikelihood algorithm implemented in FastTree,26 and the tree was displayed using the Interactive Tree of Life tool.27 The outer bar of thephylogenetic tree (a) represents major bacterial phyla, the next bar is proportional to the number of OTUs for each of the 1053 source identifierOTUs, and the inner circle represents the phylogenetic placement for each OTU with branch lengths proportional to change in 16S rRNA genesequence. Detailed taxonomic description and reference sequence information for each source identifier OTU is provided in Tables 1−3 of theSupporting Information.
Figure 4. Microbial community analysis of 28 water and two sewagesamples collected during the 2009 sewage spill from the SausalitoMarin-City Sanitary District treatment plant. Ordination wasconducted using nonmetric multidimensional scaling with the Bray−Curtis distance metric. Numerical values are Enterococcus counts(MPN/mL) of individual samples. Microbial community compositionin water samples that exceeded regulatory limits for Enterococcus(>35 MPN/mL) was significantly different than in samples with lowEnterococcus counts (ANOSIM, P < 0.05).
Environmental Science & Technology Article
dx.doi.org/10.1021/es2040366 | Environ. Sci. Technol. XXXX, XXX, XXX−XXXE

445 > 0.05). From these results, we conclude that birds and not
446 human or grazer fecal inputs were associated with high
447 enterococcus counts at Campbell Cove. These results are
448 consistent with the findings of the previous source tracking
449 investigation at this site that used E. coli ribotyping to
450 determine gulls and not humans were a fecal source.20 We
451 also found four high enterococcus samples at Campbell Cove
452 with negligible enrichment in any source identifier taxa
453 indicating additional sources of FIB that were not tested.454 Further investigation of the phylogenetic inventory of all
455bacterial taxa from this site, not just fecal identifiers, could help456reveal additional fecal or environmental sources of FIB.457The phylogenetic microarray approach to source identi-458fication uses simultaneous occurrence of many diverse taxa to459determine to detect fecal sources. Future work needs to address460how fate and transport influences detection rates of these461different taxa once they enter the environment. In the sewage462spill example presented in this study, almost all human source463identifier taxa were detected in water samples with high FIB.464These fecal bacteria were input from a large release of sewage465directly into the tested waters, and subject to little aging and466decay. This situation is in contrast to the nonpoint source
Figure 5. Source identification in San Francisco Bay water samplescollected during sewage spill monitoring (N = 28). Results fromEnterococcus FIB tests are plotted against the percent of source-identifier taxa that were significantly enriched above background (lowFIB) conditions. High and low dashed lines show the single-dayEnterococcus concentration limit and 30-day geometric mean limits,respectively. Higher than expected numbers of high enterococcussamples were enriched in human identifier taxa (P < 0.001) but notbird or grazer identifier taxa (P > 0.05).
Figure 6. Source identification at Campbell Cove, Bodega Bay (N =19). Results from Enterococcus FIB tests are plotted against thepercent of source-identifier taxa that were significantly enriched abovebackground (low FIB) conditions. High and low dashed lines show thesingle-day Enterococcus concentration limit and 30-day geometricmean limits, respectively. Higher than expected numbers of highenterococcus samples were enriched in bird identifier taxa (P = 0.033)but not human or grazer identifier taxa (P > 0.05).
Environmental Science & Technology Article
dx.doi.org/10.1021/es2040366 | Environ. Sci. Technol. XXXX, XXX, XXX−XXXF

467 situation at Campbell Cove where high FIB samples contained468 around 20% of the identifier taxa from a known fecal source469 (gull feces). Inputs of fecal bacteria at Campbell Cove were not470 necessarily direct into receiving waters but also from shoreline471 runoff and leaching through beach sands and sediments.20 As a472 result, fecal microbial communities were subject to more473 modification before entering receiving waters compared to474 direct inputs by the sewage spill. Application of the community475 identifier approach to source tracking will benefit from476 adjusting the analysis based on the expected persistence of477 different taxa.478 There are potential advantages and limitations to using a479 phylogenetic microarray for source identification. An advantage480 is sensitive detection of taxa with low abundance in the481 community.19 As fecal sources are diluted in receiving waters,482 taxa that are critical for source identification will decrease in483 relative abundance as they mix with the complex microbial484 background of the environment. The microarray probes for485 target sequences from the entire sample of PCR amplicons, and486 this amplicon pool consists of many billions of 16S rRNA gene487 sequences. Hybridization the entire pool amplified sequences488 may offer an advantage over pyrosequencing or other types of489 next generation sequencing because these methods randomly490 sequence a relatively small fraction of the amplified PCR491 product and consequently are not reliable for detecting less492 abundant members of the community that may be critical for493 source identification.25
494 A limitation in applying phylogenetic microarrays to MST495 may be the insufficient number of probes for sources that are496 underrepresented in 16S rRNA gene databases. For example,497 few studies have surveyed microbial diversity in pinnipeds, and498 as a likely consequence we found no unique taxa in pinnipeds499 using the PhyloChip. More thorough assessments of sequence500 composition in some source types will be needed to find501 additional host-specific targets. In addition, cost and complexity502 can be barriers to widespread adaptation of this technology in503 its current form. Measuring the full range of 16S rRNA gene504 sequences in the microbial community is not necessary,505 however, and a down-selected microarray that targets only506 the subset of microorganisms that is useful for source507 identification would simplify analysis and reduce cost.508 The results of this study show that 16S rRNA gene509 composition of the bacterial community can be used to510 discriminate sources of fecal contamination. Differences in the511 diversity among fecal sources reveal hundreds of unique taxa512 that are specific to human, bird and grazer feces. Several513 different phylogenetic lineages, most of which are not514 considered in existing MST assays, differentiate these sources515 and are mainly found in the Clostridia, Bacilli, and516 Bacteroidetes. Comprehensive interrogation of microbial517 communities for these diverse identifier taxa has great potential518 to improve the reliability of source detection in the environ-519 ment. Phylogenetic microarrays are an effective tool for rapidly520 measuring the full assortment of microbial taxa that distinguish521 fecal contaminants and deserve serious consideration for source522 tracking.
523 ■ ASSOCIATED CONTENT524 *S Supporting Information525 List of fecal types and source locations, list of human waste526 identifier taxa, list of bird identifer taxa, and list of grazer527 identifier taxa. This material is available free of charge via the528 Internet at http://pubs.acs.org.
529■ AUTHOR INFORMATION530Corresponding Author531*E-mail: [email protected] authors declare no competing financial interest.
534■ ACKNOWLEDGMENTS535We are grateful for funding and support provided by the536California State Water Resources Control Board Clean Beaches537Initiative (07-576-550-0), Rathmann Family Foundation,538County of Marin, National Institute of Health (R01-539ES013515), US Environmental Protection Agency and the540City of Dana Point. We thank Phil Smith for his assistance with541project administration, and Shariff Osman, Fran Reid, Donna542Ferguson, Darcy Ebentier, and Meredith Raith for their543assistance in the field and laboratory. The following individuals544and organizations facilitated sample collection: County of545Sonoma, Omar Arias (Sausalito-Marin City Sewage District),546California Dept. of Fish & Game, National Park Service, U.S.547Fish & Wildlife Service, Carly Schachter (SF Bay Bird548Observatory), Marine Mammal Center, Pier 39 Marina,549Oakland Zoo, Gale Ranch, Lunny Ranch, Strauss Family550Creamery, Nature Conservancy, Melinda Fowler, OKEANIS,551Lake Merritt Institute, and Stinson Beach County Water552District.
553■ REFERENCES(1) 554Field, K. G.; Samadpour, M. Fecal Source Tracking, the Indicator
555Paradigm, and Managing Water Quality. Water Res. 2007, 41 (16),5563517−3538.
(2) 557Wade, T. J.; Pai, N.; Eisenberg, J. N. S.; Colford, J. M.; Do, U. S.558Environmental Protection Agency Water Quality Guidelines for559Recreational Waters Prevent Gastrointestinal Illness? A Systematic560Review and Meta-Analysis. Environ. Health Perspect. 2003, 111 (8),5611102−1109.
(3) 562Boehm, A. B. Enterococci Concentrations in Diverse Coastal563Environments Exhibit Extreme Variability. Environ. Sci. Technol. 2007,56441 (24), 8227−8232.
(4) 565Boehm, A. B.; Yamahara, K. M.; Love, D. C.; Peterson, B. M.;566McNeill, K.; Nelson, K. L. Covariation and Photoinactivation of567Traditional and Novel Indicator Organisms and Human Viruses at a568Sewage-Impacted Marine Beach. Environ. Sci. Technol. 2009, 43 (21),5698046−8052.
(5) 570Yamahara, K. M.; Layton, B. A.; Santoro, A. E.; Boehm, A. B.571Beach Sands along the California Coast Are Diffuse Sources of Fecal572Bacteria to Coastal Waters. Environ. Sci. Technol. 2007, 41 (13), 4515−5734521.
(6) 574Santo Domingo, J. W.; Bambic, D. G.; Edge, T. A.; Wuertz, S.575Quo Vadis Source Tracking? Towards a Strategic Framework for576Environmental Monitoring of Fecal Pollution. Water Res. 2007, 41577(16), 3539−52.
(7) 578USEPA, Microbial Source Tracking Guide Document. In579Washington, D.C., 2005; p 131.
(8) 580Bae, S.; Wuertz, S. Rapid Decay of Host-Specific Fecal581Bacteroidales Cells in Seawater As Measured by Quantitative PCR582with Propidium Monoazide. Water Res. 2009, 43 (19), 4850−4859.
(9) 583Balleste, E.; Blanch, A. R. Persistence of Bacteroides Species584Populations in a River as Measured by Molecular and Culture585Techniques. Appl. Environ. Microbiol. 2010, 76 (22), 7608−7616.
(10) 586Walters, S. P.; Field, K. G. Survival and Persistence of Human587and Ruminant-Specific Faecal Bacteroidales in Freshwater Micro-588cosms. Environmental Microbiology 2009, 11 (6), 1410−1421.
(11) 589Cao, Y.; Wu, C. H.; Andersen, G. L.; Holden, P. A., Community590Analysis-Based Methods. In Microbial Source Tracking: Methods,591Applications, and Case Studies, Hagedorn, C.; Blanch, A. R.;592Harwood, V. J., Eds. Springer: New York, NY, 2011; pp 251−282.
Environmental Science & Technology Article
dx.doi.org/10.1021/es2040366 | Environ. Sci. Technol. XXXX, XXX, XXX−XXXG

(12)593 Lee, J. E.; Lee, S.; Sung, J.; Ko, G. Analysis of Human and594 Animal Fecal Microbiota for Microbial Source Tracking. The ISME595 journal 2011, 5 (2), 362−5.
(13)596 Unno, T.; Jang, J.; Han, D.; Kim, J. H.; Sadowsky, M. J.; Kim, O.597 S.; Chun, J.; Hur, H. G. Use of Barcoded Pyrosequencing and Shared598 OTUs To Determine Sources of Fecal Bacteria in Watersheds. Environ.599 Sci. Technol. 2010, 44 (20), 7777−7782.
(14)600 Wu, C. H.; Sercu, B.; Van de Werfhorst, L. C.; Wong, J.;601 DeSantis, T. Z.; Brodie, E. L.; Hazen, T. C.; Holden, P. A.; Andersen,602 G. L. Characterization of Coastal Urban Watershed Bacterial603 Communities Leads to Alternative Community-Based Indicators.604 PLoS One 2010, 5 (6), e11285.
(15)605 Cao, Y. P.; Van De Werfhorst, L. C.; Sercu, B.; Murray, J. L. S.;606 Holden, P. A. Application of an Integrated Community Analysis607 Approach for Microbial Source Tracking in a Coastal Creek. Environ.608 Sci. Technol. 2011, 45 (17), 7195−7201.
(16)609 Jeong, J. Y.; Park, H. D.; Lee, K. H.; Weon, H. Y.; Ka, J. O.610 Microbial Community Analysis and Identification of Alternative Host-611 Specific Fecal Indicators in Fecal and River Water Samples Using612 Pyrosequencing. J. Microbiol. 2011, 49 (4), 585−594.
(17)613 Hazen, T. C.; Dubinsky, E. A.; DeSantis, T. Z.; Andersen, G. L.;614 Piceno, Y. M.; Singh, N.; Jansson, J. K.; Probst, A.; Borglin, S. E.;615 Fortney, J. L.; Stringfellow, W. T.; Bill, M.; Conrad, M. E.; Tom, L. M.;616 Chavarria, K. L.; Alusi, T. R.; Lamendella, R.; Joyner, D. C.; Spier, C.;617 Baelum, J.; Auer, M.; Zemla, M. L.; Chakraborty, R.; Sonnenthal, E. L.;618 D’Haeseleer, P.; Holman, H. Y. N.; Osman, S.; Lu, Z. M.; Van619 Nostrand, J. D.; Deng, Y.; Zhou, J. Z.; Mason, O. U. Deep-Sea Oil620 Plume Enriches Indigenous Oil-Degrading Bacteria. Science 2010, 330621 (6001), 204−208.
(18)622 Hugenholtz, P. Exploring Prokaryotic Diversity in the Genomic623 Era. Genome Biology 2002, 3, 1−8.
(19)624 DeSantis, T. Z.; Brodie, E. L.; Moberg, J. P.; Zubieta, I. X.;625 Piceno, Y. M.; Andersen, G. L. High-Density Universal 16S rRNA626 Microarray Analysis Reveals Broader Diversity than Typical Clone627 Library When Sampling the Environment. Microbial Ecology 2007, 53,628 371−383.
(20)629 Sonoma, C. o. Final Interim Report for Bodega Bay-Campbell630 Cove Tidal Circulation Study, Water Quality Testing and Source631 Abatement Measures Project. In Services, H., Ed. Santa Rosa, CA,632 2004; p 14.
(21)633 Ley, R. E.; Hamady, M.; Lozupone, C.; Turnbaugh, P. J.;634 Ramey, R. R.; Bircher, J. S.; Schlegel, M. L.; Tucker, T. A.; Schrenzel,635 M. D.; Knight, R.; Gordon, J. I. Evolution of mammals and Their Gut636 Microbes. Science 2008, 320 (5883), 1647−1651.
(22)637 Clench, M. H.; Mathias, J. R. The Avian Cecum - A Review.638 Wilson Bulletin 1995, 107 (1), 93−121.
(23)639 Wang, Z. Y.; Shi, S. R.; Xu, M. J.; Yang, H. M. 16S rRNA-Based640 Analysis of Bacterial Diversity in the Microbial Flora of the Goose641 Intestinal Tract. Journal of Animal and Feed Sciences 2009, 18 (3),642 531−540.
(24)643 Lu, J. R.; Santo Domingo, J. W.; Lamendella, R.; Edge, T.; Hill,644 S. Phylogenetic Diversity and Molecular Detection of Bacteria in Gull645 Feces. Appl. Environ. Microbiol. 2008, 74 (13), 3969−3976.
(25)646 Zhou, J. Z.; Wu, L. Y.; Deng, Y.; Zhi, X. Y.; Jiang, Y. H.; Tu, Q.647 C.; Xie, J. P.; Van Nostrand, J. D.; He, Z. L.; Yang, Y. F.648 Reproducibility and Quantitation of Amplicon Sequencing-Based649 Detection. ISME Journal 2011, 5 (8), 1303−1313.
(26)650 Price, M. N.; Dehal, P. S.; Arkin, A. P., FastTree 2-651 Approximately Maximum-Likelihood Trees for Large Alignments.652 PLoS One 2010, 5, (3), Article No.: e9490.
(27)653 Letunic, I.; Bork, P. Interactive Tree Of Life (iTOL): An online654 tool for phylogenetic tree display and annotation. Bioinformatics 2007,655 23 (1), 127−128.
Environmental Science & Technology Article
dx.doi.org/10.1021/es2040366 | Environ. Sci. Technol. XXXX, XXX, XXX−XXXH

Appendix 4:
Peer Reviewed Article: “Characterization of Coastal Urban WatershedBacterial Communities Leads to Alternative Community-Based
Indicators.”

Characterization of Coastal Urban Watershed BacterialCommunities Leads to Alternative Community-BasedIndicatorsCindy H. Wu1, Bram Sercu2, Laurie C. Van De Werfhorst2, Jakk Wong1, Todd Z. DeSantis1, Eoin L. Brodie1,
Terry C. Hazen1, Patricia A. Holden2, Gary L. Andersen1*
1 Ecology Department, Earth Sciences Division, Lawrence Berkeley National Laboratory, Berkeley, California, United States of America, 2 Donald Bren of School of
Environmental Science and Management, University of California Santa Barbara, Santa Barbara, California, United States of America
Abstract
Background: Microbial communities in aquatic environments are spatially and temporally dynamic due to environmentalfluctuations and varied external input sources. A large percentage of the urban watersheds in the United States are affectedby fecal pollution, including human pathogens, thus warranting comprehensive monitoring.
Methodology/Principal Findings: Using a high-density microarray (PhyloChip), we examined water column bacterialcommunity DNA extracted from two connecting urban watersheds, elucidating variable and stable bacterial subpopulationsover a 3-day period and community composition profiles that were distinct to fecal and non-fecal sources. Two approacheswere used for indication of fecal influence. The first approach utilized similarity of 503 operational taxonomic units (OTUs)common to all fecal samples analyzed in this study with the watershed samples as an index of fecal pollution. A majority ofthe 503 OTUs were found in the phyla Firmicutes, Proteobacteria, Bacteroidetes, and Actinobacteria. The second approachincorporated relative richness of 4 bacterial classes (Bacilli, Bacteroidetes, Clostridia and a-proteobacteria) found to have thehighest variance in fecal and non-fecal samples. The ratio of these 4 classes (BBC:A) from the watershed samplesdemonstrated a trend where bacterial communities from gut and sewage sources had higher ratios than from sources notimpacted by fecal material. This trend was also observed in the 124 bacterial communities from previously published andunpublished sequencing or PhyloChip- analyzed studies.
Conclusions/Significance: This study provided a detailed characterization of bacterial community variability during dryweather across a 3-day period in two urban watersheds. The comparative analysis of watershed community compositionresulted in alternative community-based indicators that could be useful for assessing ecosystem health.
Citation: Wu CH, Sercu B, Van De Werfhorst LC, Wong J, DeSantis TZ, et al. (2010) Characterization of Coastal Urban Watershed Bacterial Communities Leads toAlternative Community-Based Indicators. PLoS ONE 5(6): e11285. doi:10.1371/journal.pone.0011285
Editor: Ching-Hong Yang, University of Wisconsin-Milwaukee, United States of America
Received February 10, 2010; Accepted May 1, 2010; Published June 23, 2010
Copyright: � 2010 Wu et al. This is an open-access article distributed under the terms of the Creative Commons Attribution License, which permits unrestricteduse, distribution, and reproduction in any medium, provided the original author and source are credited.
Funding: Part of this work was performed at Lawrence Berkeley National Laboratory under Department of Energy contract number DE-AC02-05CH11231 andfunded by the Rathmann Family Foundation and the California State Water Resources Control Board Prop. 50 Clean Beaches Initiative grant with additionalassistance by the Department of Public Health, Marin County California (CHW, JW, TZD, ELB, TCH, GLA). Additional funding was provided by the City of SantaBarbara through Measure B funding, the California State Water Resources Control Board Prop. 50 Clean Beaches Initiative grant and by the Switzer Foundationthrough a Leadership Grant. Flow data were provided through the NSF-funded Santa Barbara Long Term Ecological Research project, NSF OCE 9982105 and OCE0620276 (BS, LCVDW, PAH). The funders had no role in study design, data collection and analysis, decision to publish, or preparation of the manuscript.
Competing Interests: The authors have declared that no competing interests exist.
* E-mail: [email protected]
Introduction
Given that water sustains life, it is not surprising that a large
percentage of the world’s population lives near coastal regions
[1,2]. Coastal urban watersheds in the United States offer
aesthetics and recreational value, serve as catchments for storm
runoff, establish biological corridors for movements of wildlife, and
provide buffers between developed areas and downstream
waterways. As human populations increase, so does urbanization
and lasting anthropogenic affects on creeks and coastal ecosystems
[3]. According to a USEPA report (2007), 45% of streams and
rivers, and 32% of bays and estuaries are impaired in the United
States. Sources of impairment include pathogens and sewage
discharges [4]. The presence of bacterial pollutants warrants
comprehensive bacteriological characterization of these water
bodies in order for us to understand their fate and transport in the
environment.
Since pathogens often come from fecal sources, regulatory
agencies require monitoring fecal indicator bacteria (FIB) for water
quality assessments. Culture-dependent assays such as total
coliform, fecal coliform and enterococci, and culture-independent
assays such as quantitative PCR (qPCR) for Bacteroides and
Bifidobacterium spp. [5] have been used as proxies for fecal
pollution. However, enumeration of these indicator organisms
often does not accurately represent the health of the ecosystem or
associated risk [6] as these indicators are ubiquitous, persistent,
regenerative [7,8] and have low correlations with pathogen
survival [9,10] in the environment. Reliance upon single, even
PLoS ONE | www.plosone.org 1 June 2010 | Volume 5 | Issue 6 | e11285

source-specific, markers of fecal pollution can be ineffective if they
are labile or persistent relative to pathogens. The use of multiple
indicators for tracking fecal contamination could circumvent the
problem of single marker absence or presence and strengthen
overall diagnoses of microbiological water quality [6,7,8,9,11].
With the advent of high throughput culture-independent
characterization of microbial communities, such as microarray and
sequencing approaches [12,13,14,15,16], detailed studies of bacterial
community fluctuations due to physical, chemical and biological
influences are now feasible. One such phylogenetic microarray, the
PhyloChip, targets much of the known diversity within Bacteria and
Archaea, and has been employed in a number of complex
environments and conditions [17,18,19,20,21,22,23,24,25]. The
current version (G2) of the PhyloChip provides the capability of
identifying up to 8,741 Bacterial and Archaeal OTUs simultaneously
[17], and allows for relative quantification of individual OTUs over a
wide dynamic range [18,26]. The highly parallel and reproducible
nature of this array allows tracking community dynamics over time
and treatment.
Bacterial communities in urban watersheds are sensitive to
environmental perturbations and could provide information on
impacts of fecal influence and overall ecosystem health. It is
important to monitor the conditions of these watersheds because
they are intricately tied in with downstream waterways, which
could have public health risk and economic implications. Previous
studies monitoring FIB most probable numbers (MPN) in urban
creeks have found high temporal variability even during dry
weather [27,28,29]. In Santa Barbara, California, exfiltration from
sewer lines into the storm drain systems has been suspected to
cause the observed high densities of FIB and human-specific
Bacteroides markers (HBM) in urban watersheds that discharge into
a recreational beach [29]. Here we analyze whole bacterial
communities from the same Sercu et al. [29] samples in order to
gain insights regarding the temporal and spatial dynamics of urban
watershed bacterial community composition relevant to fecal
pollution. Amplified 16S rRNA gene sequences from creek
(including storm drains), lagoon and ocean sites in the Lower
Mission Creek and Laguna watersheds in Santa Barbara, CA,
along with 3 samples of fecal origin, were hybridized onto the
PhyloChip for a complete microbial community analysis. Char-
acterization of the whole bacterial community is crucial for
understanding fluctuations of various bacterial groups, and could
lead to more robust health risk indication by integrating data from
multiple bacteria taxa. This work represents the first application of
a comprehensive phylogenetic array for the purpose of character-
izing urban watershed bacterial communities. Findings from this
work suggest that such an approach could be useful for
complementing multiple individual tests that are now typically
employed to diagnose microbiological water quality related to
public health.
Results
Resolving community differences by habitatsSamples were categorized into 4 habitat types: fecal, ocean,
lagoon, and creek (Figure 1). Comparisons of Bray-Curtis
distances of the communities, using Multi-Response Permutation
Procedure (MRPP) [30], indicated significant differences between
the samples from the different habitat types. Non-metric
multidimensional scaling (NMDS) ordination illustrated that the
bacterial communities were separated by habitat types for most of
the samples, except for M2a and M2b (Figure 2). Salinity
measurements at one of the lagoon sites (M2) were low, at
,1 ppt, on days 1 (M2a) and 2 (M2b) (Table S1). On day 3 (M2c),
the salinity increased to 5.3 ppt, and a corresponding community
composition shift was observed (Figure 2). The bacterial
communities of M2a and M2b were more similar to creek samples
with low salinity and M2c was more similar to the M4a and M4b
lagoon samples, which had higher salinity measurements of 7.3–
9.5 ppt. Lagoon sample M4c had lower salinity measurements and
the community was more similar to creek samples than to M4a
and M4b.
Distributions of detected operational taxonomic units (OTUs) at
the class level were compared among all habitat types, shown as
relative richness (Figure 3A). The relative richness was normalized
to the total number of OTUs detected in all of the samples from
the same habitat type. We focused on classes that exhibited high
variability of relative richness across the 4 habitats. The top 10
classes with the highest standard deviations were (in descending
order): Clostridia, a-proteobacteria, Bacilli, c-proteobacteria, b-proteobac-
teria, Actinobacteria, Flavobacteria, Bacteroidetes, Cyanobacteria and e-
proteobacteria. Of those classes, only Clostridia, Bacilli, and Bacteroidetes
had higher relative richness in fecal samples than in creek, lagoon
and ocean samples (Figure 3B). Only a-proteobacteria had lower
richness in fecal samples than in creek, lagoon, and ocean samples
(Figure 3C). The characteristics and potential of these 4 classes as
indicators of fecal influence will be discussed further.
Fecal sample-associated OTUsIn order to define bacteria that were common to all 3 fecal
samples used in this study, a set of 503 OTUs, found in all fecal
samples but not ubiquitous in the 27 watershed samples, were
characterized and defined as fecal sample-associated OTUs
(FSAO). The FSAO subpopulation consisted of 43% Firmicutes
(out of the 503 OTUs), 28% Proteobacteria, 9% Bacteroidetes and 5%
Actinobacteria (Figure S1). Of the Firmicutes (218 OTUs), 56% were
Figure 1. Sampling sites along Mission (M4–M9) and Laguna Channel (M2 and M3) watersheds. Samples were delineated into differenthabitat types: creek (M3, M5–M9, where M6 and M9 were from drains), lagoon (M2 and M4), and ocean (M1). Open circles (#) represent storm drains,and filled circles (N) represent creek, lagoon or ocean sites.doi:10.1371/journal.pone.0011285.g001
Watershed Microbial Dynamics
PLoS ONE | www.plosone.org 2 June 2010 | Volume 5 | Issue 6 | e11285

from the order Clostridiales including the families Lachnospiraceae,
Peptostreptococcaceae, Peptococcaceae, Acidaminococcaceae and Clostridia-
ceae; 17% were from the order Bacillales including Bacillaceae,
Halobacillaceae, and Staphylococcaceae; and 17% were from Lactoba-
cillales which included the families of Lactobacillaceae, Enterococcaceae
and Streptococcaceae. In the Proteobacteria phylum (141 OTUs), 30%
were from Enterobacteriales including Enterobacteriaceae; 7% were
from Alteromonadales including Alteromonadaceae, and Shewanellaceae;
8% of the OTUs were from the order Burkholderiales including
Burkholderiaceae, Comamonadaceae, Alcaligenaceae, Oxalobacteraceae, and
Ralstoniaceae. The counts of FSAO for each of the three days are
shown in Figure S2. The FSAO counts were highest at M9, M8,
M6, M3 and M2 and lowest at M4 and M1. The 3-day average
FSAO counts for sites M9, M6, M3, and M2 were significantly
different (t-test, p-value,0.0001) from counts of M4, and M1.
Variable and stable subpopulationsPhyloChip analysis of subpopulations from each site for which
the fluorescence intensities fluctuated the most (variable) and the
least (stable) were examined over the course of the three-day
sampling period. These variable and stable subpopulations
consisted of OTUs from the top and bottom deciles after sorting
based on variance of fluorescence intensity over the 3 days. A
similarity metric, from the UniFrac [31] distance measure, was
illustrated with boxplots for comparison of the median, upper and
lower quartiles. Variable subpopulations of M6 were the most
similar to the FSAO composition in comparison to the other sites
(Figure 4A). Sites M9 and M3 were the second and third most
similar to the FSAO. However, the similarity to FSAO for site M9
was not significantly different from that of M6 or M3. A pattern of
decreasing similarity from M9, M6 and M3 to immediate
downstream sites was illustrated. The majority of FSAO detected
in the variable subpopulations was in the orders of Enterobacteriales
(39 out of 58 FSAO detected in the variable subpopulation) for
M6, Campylobacterales (6 out of 44) for M9, and Flavobacteriales (4 out
of 31) for M3. The M9 stable subpopulation was the most similar
to the FSAO, and was significantly different from the similarity to
FSAO of all other sites (Figure 4B). Many of the FSAO in the M9
stable subpopulation were in the order of Bacillales (17 out of 47).
Ratio of Bacilli, Bacteroidetes and Clostridia to a-proteobacteria
Four bacterial classes, which exhibited highly fluctuating
relative richness across the habitat types, were further explored
as representatives of the fecal bacterial community (Figure 3A).
The combined percentage of Bacilli, Bacteroidetes and Clostridia
relative richness was 28.5% of total detected in the fecal samples,
whereas in creek, lagoon and ocean they were less than 13.5%
(Figure 3B). Almost 15% of the relative richness in creek water,
lagoon and ocean samples were a-proteobacteria, while the
percentage of a-proteobacteria found in fecal samples was 7%
(Figure 3C). The relative richness ratio of Bacilli, Bacteroidetes and
Clostridia to a-proteobacteria (BBC:A) for fecal samples was more than
4-fold higher than the ratios of the other habitat types (Figure 3D).
The BBC:A ratio was calculated for each of the samples from the
different sites (Figure 5). Site M6 exhibited the highest BBC:A, and
sites M1 and M4 had low BBC:A ratios compared to the rest of the
sites.
Figure 2. NMDS plot of PhyloChip community distances. Bray-Curtis metric was used, and a stress of 8.14 was obtained. Each site isrepresented by a different color. The grey lines delineate grouping of creek, lagoon, ocean and fecal samples.doi:10.1371/journal.pone.0011285.g002
Watershed Microbial Dynamics
PLoS ONE | www.plosone.org 3 June 2010 | Volume 5 | Issue 6 | e11285

Figure 3. Bacterial community composition comparison across fecal, lagoon, creek and ocean samples. (A) Distribution of relativerichness at the class level. Number of OTUs in each sample types were divided by the total count for each sample type as indicated in parentheses onthe x-axis. (B) Relative richness of Bacilli, Bacteroidetes and Clostridia detected. (C) Relative richness of a-proteobacteria detected. (D) Bacillus,Bacteroidetes, Clostridia to a-proteobacteria ratios (BBC:A).doi:10.1371/journal.pone.0011285.g003
Figure 4. Boxplots of UniFrac similarity metrics between water and fecal-sample-associated OTUs (FSAO). (A) Variable subpopulations.(B) Stable populations. Each box represents similarity metrics from all 3 days at each site. Boxplots with different letters indicate significant differences(p-value,0.05), compared using the student t-test. The samples were arranged from upstream to downstream (left to right) for samples M9-M4, andM3-M2.doi:10.1371/journal.pone.0011285.g004
Watershed Microbial Dynamics
PLoS ONE | www.plosone.org 4 June 2010 | Volume 5 | Issue 6 | e11285

Retrospective comparison of BBC:A ratios from 16S rRNAgene clone library sequencing- and PhyloChip-analyzedsamples
The BBC:A ratios of 124 communities characterized by clone-
library sequencing and PhyloChip were compared (Figure 6).
Detailed descriptions of the communities are included in Table S2.
From published sequencing studies, we calculated the BBC:A
ratios of bacterial communities from 54 mammalian intestines [32],
5 sewage-associated samples [33,34,35,36,37], and 19 non-fecal
samples [23,38,39,40,41,42,43,44,45,46,47,48,49,50,51,52,53].
Likewise, from PhyloChip-analyzed samples, we determined
the BBC:A ratios from communities of 11 gut [Brodie et al.,
unpublished; Marchesi et al., unpublished; Nguyen et al.,
unpublished; This study] [54], 17 sewage-associated [Conrad
et al., unpublished; Sercu et al. unpublished; Wu et al.,
unpublished], and 18 non-fecal samples [Sercu et al., unpub-
lished; This study] [55]. Anoxic non-fecal samples were
included in this comparison as well. For both PhyloChip- and
library sequencing-analyzed bacterial communities, gut and
sewage-associated samples generally had higher BBC:A ratios
than non-fecal samples, except for anoxic non-fecal samples,
which had an overlapping range with sewage-associated
samples. There were also a few communities that did not follow
the general BBC:A ratio trend. The community of a nitrifying-
denitrifying activated sludge [35] had much lower BBC:A ratio
than the rest of the sequenced sewage-associated communities.
Also, beetle posterior hindgut and midgut communities had
lower BBC:A ratios than beetle anterior hindgut communities
and the other PhyloChip-analyzed gut samples [Nguyen et al.,
unpublished].
Discussion
Microbial communities in surface waters are highly responsive
to perturbation, shifting with tidal cycles [56], salinity gradients
[57,58], dissolved organic matter concentration [59], and
chemical stress [60,61,62]. The detection of short-term fluctua-
tions in community composition suggests changes in environmen-
tal conditions, nutrients or bacterial sources. An effect of increased
salinity due to tidal influence on bacterial composition was
observed in this study where the coastal lagoon communities were
more similar to creek communities with comparable salinity
measurements (Figure 2). Salinity was more strongly correlated to
community composition than the other environmental variables
measured based on canonical correspondence analysis (data not
shown). This result corroborated observations by others
[63,64,65]. In addition to being highly sensitive to environmental
fluctuations, the response time of community composition shift
was within a 24-hour period.
The detection of this rapid community response could be useful
for indication of external bacterial inputs, such as from fecal
sources. FSAO, derived from the human fecal and untreated
sewage samples, were used to represent fecal communities. One
caveat is that the OTUs in the FSAO list are specific to the 3 fecal
samples used in this study, and do not represent all fecal
communities in all environments. However, the prevalent bacterial
phyla found in the FSAO are the same as those observed in
published studies of human gastrointestinal tract samples
[66,67,68,69] and turkey cecal samples [70]. Therefore, commu-
nity similarity to FSAO could potentially indicate the presence of
fecal bacteria. This hypothesis was tested by comparing the
community distances between FSAO and variable/stable subpop-
ulations at each of the site (Figure 4A and 4B).
Examination of the variable and stable subpopulations brings to
light the bacterial temporal fluctuations across the 3 days. The
variable subpopulation represents OTUs with highly fluctuating
relative abundances, perhaps due to rapid growth, decay or large
sporadic influx of bacterial sources. The stable subpopulation
represents OTUs with constant relative abundances. These stable
subpopulation OTUs are likely associated with endemic bacteria
that are able to grow and persist under the in situ environmental
conditions or are from consistent external sources.
UniFrac analysis showed that the variable subpopulation of M6
was the most similar to the FSAO (Figure 4A). This suggested
intermittent exposure to fecal sources at this site, which was
supported by elevated but numerically variable HBM densities
and FIB MPN (Figure S3). The prevalence of Enterobacteriales in the
variable subpopulation falls in line with the high FIB MPN
observed at site M6, and further supports the use of similarity of
the variable subpopulation with FSAO for demonstrating fecal
pollution. Similarity of M9 variable subpopulation to FSAO was
not significantly different from that of the M6 (Figure 4A). This
Figure 5. Bacillus, Bacteroidetes, Clostridia to a-proteobacteria ratios (BBC:A) from each site. Ratio from each day is represented by a bar ofdifferent color.doi:10.1371/journal.pone.0011285.g005
Watershed Microbial Dynamics
PLoS ONE | www.plosone.org 5 June 2010 | Volume 5 | Issue 6 | e11285

indicated that there were OTUs in the M9 variable subpopulation
that were also found in the FSAO, but they were mostly from the
order of Campylobacterales, and not represented by FIB or HBM
detection. The similarity to FSAO decreased gradually from drains
to downstream sites (i.e. M9 to M7 and M6 to M4), illustrating
possible fecal community presence at the drains and die-off or
dilution effects as the communities flow downstream.
Interestingly, the stable subpopulation at M9 was most similar
to FSAO out of all the sites, even though the FIB densities met the
California water quality standards on 2 out of the 3 days and no
HBM was detected (Figure 4B and Figure S3). The non-detection
of HBM at M9 could be due to Bacteroides DNA concentration
being below the quantitative PCR detection limit of 0.56103–104
targets L21 [29] or that the fecal source was non-human. The top
three families present in the M9 stable subpopulation were
Bacillaceae, Staphylococcaceae and Lachnospiraceae. While Bacillaceae and
Staphylococcaceae have been observed in non-aquatic environments
[22,26], Lachnospiraceae are primarily associated with cow rumen
[71], human bowel [67] and anaerobic digesters [72]. Therefore,
the data suggested that some of the OTUs detected at M9 could
have a fecal, but non-human, origin. However, further confirma-
tory work is needed to distinguish between a consistent fecal source
or bacterial re-growth as the cause for the similarity between M9
stable subpopulation and FSAO.
The FSAO includes OTUs that contain fecal coliforms, which
have been demonstrated to re-grow and persist in the environment
leading to false-positive water quality diagnoses [6,8,73]. This
study further explores the potential of using alternative organisms
that are independent of coliforms as fecal indicators by introducing
the BBC:A ratio. The ratio excludes coliform bacteria, thus,
potentially avoids false-positive results associated with coliforms,
and integrates counts for organisms widespread in non-fecal
‘‘pristine’’ environments to assess ecosystem health.
Bacteroidetes and Clostridia are enriched within the gut microbiota
of many mammals [32,66,67,68,69,70], and specific species within
these 2 classes have been proposed as fecal indicators [5,10,74].
However, they are also found in anoxic saline aquatic environ-
ments [40,45,49], estuaries [38], the deep ocean [41], and high
elevation lakes [59]. The class of Bacilli, which includes the
indicator species Enterococcus, is commonly found in fecal samples
such as the human gastrointestinal tract [69], turkey intestines
[69,70] and aerobic thermophilic swine wastewater bioreactors
[75]. All 3 classes are dominant groups found in a chicken fecal
metagenomic study [76]. a-proteobacteria, have been found as
primary surface colonizers in coastal marine waters [77] and have
the ability to thrive under low-nutrient conditions [56]. The
BBC:A ratio incorporates the relative richness of OTUs prevalent
in these 4 bacterial classes associated with fecal and non-fecal
samples to reflect possible fecal inputs, rather than the use of single
organism presence or absence. Previous studies have suggested the
use of ratios for indicating human or non-human fecal pollution
[78], determining fecal age and enteric viral content [79,80],
representing the nutrient status of soil ecosystems [81,82],
identifying land use in wetland soils [83], and eutrophy in aquatic
systems [84].
In order to assess the applicability of the observations from our
watersheds to other samples, we calculated the BBC:A ratio from
previously published and unpublished studies (Table S2). BBC:A
ratios of gut samples analyzed by DNA sequencing or PhyloChip
are not completely comparable, mainly due to differences in
Figure 6. Bacillus, Bacteroidetes, Clostridia to a-proteobacteria ratios (BBC:A) of communities analyzed by sequencing or PhyloChip.Sample types include, gut (N), sewage-associated (&), and non-fecal (¤) associated samples. Unfilled diamond symbols (e) represent non-fecalsamples from anoxic environments.doi:10.1371/journal.pone.0011285.g006
Watershed Microbial Dynamics
PLoS ONE | www.plosone.org 6 June 2010 | Volume 5 | Issue 6 | e11285

sample processing including primers used, PCR conditions and
coverage differences across phylogenetic groups on the PhyloChip.
However, within communities analyzed by sequencing from
different research groups employing varying protocols, the gut,
sewage-associated and non-fecal samples exhibited the same
BBC:A ratio trend as those communities analyzed by PhyloChip
processed with a consistent standardized protocol. The distribu-
tion of BBC:A ratios from these studies illustrates that gut and
sewage-associated samples have higher BBC:A ratio than non-
fecal samples regardless of analysis methods (Figure 6). Anoxic
non-fecal polluted environments also have similar ratios of BBC:A
as sewage-associated samples (Figure 6). This is most likely an
attribute of similar growth conditions favoring both anaerobic and
fecal bacteria. The indication of anoxic non-fecal environments is
often times pertinent for determining public health risks. Anoxic
conditions could lead to eutrophication in both fresh and salt
water environments, which changes nutrient cycling, water quality
and biodiversity [84]. Eutrophication has led to toxic algal blooms
that adversely affect human and wildlife health [85,86].
Kendall rank correlation of FIB, HBM, FSAO and BBC:A
ratios from all sites indicated significant positive correlations of
BBC:A ratios with HBM, total coliform, enterococcus and FSAO
counts, but not with E. coli (Table S3). However, many of the
samples had reached the total coliform measurement maximum
detection limit of 24,196 MPN, therefore, the correlation of total
coliform with BBC:A ratio might be misleading. The result also
illustrated that even though the BBC:A ratio did not contain fecal
coliforms, the fecal pollution pattern was similar to that indicated
by the FSAO where coliforms were included. The drain site M6
was the only site where all lines of evidence, i.e. similarity of
variable subpopulations to FSAO, FIB, HBM, and BBC:A ratios,
pointed to the presence of fecal contamination. At site M1 (ocean),
all data indicated a community with the least fecal influence. The
data for the rest of the sites (M2, M3, M4, M5, M7, M8 and M9)
indicated varying degrees of influence by fecal sources. Also,
communities from drains (M6 and M9) were the most similar to
organisms found in the fecal samples, although different fecal
organisms were detected in the two drains.
Knowledge of who is there and how they change over time and
location is the hallmark of an ecosystems approach to studying
urban watersheds. We used this concept to track the microbial
community dynamics over a three-day period at a location with a
history of frequent fecal contamination. In spite of the confound-
ing effect of the movement of water through this watershed,
several patterns that correlated with the presence of human fecal
contamination were observed. By using the PhyloChip we are able
to identify a significantly greater number of bacterial OTUs than is
typically examined in coastal watersheds. Comparison of the
microbial inventory of the watershed samples with local sewage
samples and a human fecal sample led to the identification of
specific organisms that were associated with either potential
human fecal sources or with the watershed. From this information
we observed 503 OTUs that were common to the three fecal
samples (FSAO) and the ratios of observed classes of organisms
that demonstrated the largest differences between human fecal
sources and the receiving waters (BBC:A ratio). Whereas most
research for measuring fecal influences on coastal watersheds uses
a bottom-up approach to hypothesize that a specific organism is
representative of the source, we employed a top-down approach
that looked at a large number of potential bacterial contaminants
from a majority of the known bacterial diversity to identify a
diverse collection of organisms associated with fecal pollution. The
advantage of this approach is that we can use the findings of the
BBC:A ratio and the FSAO as the basis for additional bottom-up,
controlled experiments to examine their applicability at other
locations and with other human fecal sources. Using this more
detailed microbial community characterization, it may be possible
to move away from generic, single indicators to a community-
indicator approach for assessing fecal contamination or environ-
ments conducive to pathogen growth.
Materials and Methods
Ethics statementThe Human Subjects Committee of University of California,
Santa Barbara was informed of the anonymous human sample
used in this study, and declared that the sample did not meet the
definition of a human subject sample, therefore, no approval was
necessary for it’s use.
Sample description, collection and extractionMission Creek and Laguna Channel flow through an urbanized
area of downtown Santa Barbara and discharge at a popular
bathing beach. As described previously [29], water column
samples from 3 consecutive days (a = day 1, b = day 2, c = day
3), during the dry season (June 2005), were collected from 9
locations (M1–M9) within the Mission Creek and Laguna
watersheds in Santa Barbara, California (Figure 1). Samples were
delineated into different habitat types: creek (M3, M5–M9, where
M6 and M9 were from drains), lagoon (M2 and M4), and ocean
(M1). One sample per day was collected at approximately the
same time on each of the 3 days. No rain occurred at least
48 hours prior to or during the sampling. The creek flow rate,
taken at M5, was 0.016 m3s21. Both watersheds discharged into
the same lagoon at M2 and M4. Surface water flowed from the
lagoon into the ocean (M1) at the time of sampling. Three fecal
samples, 1 human feces (H), from Santa Barbara, and 2 raw
sewage, from the influent at El Estero Wastewater Treatment
plant (Santa Barbara, CA) (S1, S2), were also collected. Dissolved
oxygen (DO), pH, temperature and salinity were measured along
with each sampling [29]. Water samples were filtered in the lab
onto 0.22 mm filters on the day of the sampling and stored
at 220uC until nucleic acid extractions. DNA was extracted using
the UltraClean Water DNA kit (MoBio Laboratories, Inc.
Carlsbad, CA, USA), and archived at 220uC. Concentrations of
fecal indicator bacteria (FIB) which includes total coliforms, E. coli,
and Enterococcus spp., and quantitative PCR (qPCR) measurements
of Human-specific Bacteroides Marker (HBM) were reported
previously [29].
16S rRNA gene amplification for microarray analysisGenes encoding 16S rRNA were amplified from the gDNA
using non-degenerate Bacterial primers 27F and 1492R [87].
Polymerase chain reaction (PCR) was carried out using the
TaKaRa Ex Taq system (Takara Bio Inc, Otsu, Japan). The
amplification protocol was previously described [17].
Microarray processing, and image data analysisMicroarray analysis was performed using the PhyloChip, an
Affymetrix-platform microarray. The protocols were previously
reported [17]. Briefly, amplicons were concentrated to a volume less
than 40 ml by isopropanol precipitation. The DNA amplicons were
then fragmented with DNAse (Invitrogen, Carlsbad, CA, USA),
biotin labeled, denatured, and hybridized to the DNA microarray at
48uC overnight (.16 hr). The arrays were subsequently washed
and stained. Reagents, conditions, and equipments involved are
detailed elsewhere [88]. Arrays were scanned using a GeneArray
Scanner (Affymetrix, Santa Clara, CA, USA).
Watershed Microbial Dynamics
PLoS ONE | www.plosone.org 7 June 2010 | Volume 5 | Issue 6 | e11285

The CEL files obtained from the Affymetrix software that
produced information about the fluorescence intensity of each
probe were analyzed. The detailed criteria for scoring the probe
fluorescence intensities were described elsewhere [17,18,89].
Briefly, a probe set consisted of 11 or more specific 25-mers
(probes) that were prevalent in members of a given OTU but were
dissimilar from sequences outside the given OTU. Probes with
sequences complementing all 25 base pairs of the target sequences
were termed perfect match (PM) probes. Each PM probe was
matched with a control 25-mer, identical in all positions except the
13th base, termed mismatch (MM) probe. The PM and MM
constituted a probe pair that were analyzed together. The probe
pairs were scored as positive if the following two criteria were met:
1) the intensity of fluorescence from the PM probe was greater
than 1.3 times the intensity from the MM probe, and 2) the
difference in intensity (PM minus MM), was at least 500 times
greater than the squared noise value. The CEL files from this
study are available upon request.
The taxonomic position of each OTU as well as the accom-
panying NCBI accession numbers of the sequences composing
each OTU can be viewed in outline format at: http://greengenes.lbl.
gov/Download/Taxonomic_Outlines/G2_chip_SeqDescByOTU_
tax_outline.txt.
PhyloChip data normalizationPhyloChip data normalization was performed using R [90]. To
correct for variation associated with quantification of amplicon
target (quantification variation), and downstream variation
associated with target fragmentation, labeling, hybridization,
washing, staining and scanning (microarray technical variation) a
two-step normalization procedure was developed. First, for each
PhyloChip experiment, a scaling factor best explaining the
intensities of the spiked control probes under a multiplicative
error model was estimated using a maximum-likelihood procedure
[54]. The intensities in each experiment were multiplied with its
corresponding optimal scaling factor. Second, the intensities for
each experiment were corrected for the variation in total array
intensity by dividing the intensities with its corresponding total
array intensity separately for Bacteria and Archea. The normal-
ized data is available in Table S4.
Statistical AnalysisAll statistical analyses were carried out in R [90], except for the
canonical correspondence analysis (CCA). Bray-Curtis distances
were calculated using normalized fluorescence intensity with the
ecodist package [91]. Non-metric multidimensional scaling (NMDS)
and multi response permutation procedure (MRPP) was per-
formed using the vegan package. Student t-test and Kendall rank
correlation from the stats package were used to compare samples.
A relaxed neighbor-joining tree was generated using Clearcut [92]
and used for UniFrac analysis [31]. Unweighted UniFrac
distances, converted to similarity metrics, were calculated for
FSAO, variable and stable subpopulations. CCA was carried out
using PCOrd [93]. There were no DO, pH and salinity data for
sampling days 1 and 2 for site 6, and all 3 days of sampling for site
8. No environmental variables were measured for fecal sample
data. Therefore, best-estimate values were inserted based on
values measured from the nearest sites on the same day for the
CCA. Fecal sample environmental variables were estimated based
on reported values in literature.
PhyloChip derived parametersUnless otherwise stated, an OTU was considered present when
at least 90% of its assigned probe pairs for its corresponding probe
set were positive (positive fraction $0.9). For example, if 10 out of
11 probe pairs are positive, the positive fraction is 0.909 and the
OTU is considered present.
Fecal-sample associated OTUs (FSAO) - OTUs that were
present in all 3 fecal samples, and in all 27 water samples were
tabulated separately. The list of 503 FSAO was derived by
removing those OTUs found in all 27 water samples from the
OTUs that were present in the fecal samples. The OTUs in each
sample which were also found on the list of 503 FSAO were tallied
and presented as the FSAO count.
Variable and stable subpopulations - OTUs that were present in
at least one of the 3 samples from each site were tabulated and
variances of the fluorescence intensities across the 3 days for those
OTUs were generated. The OTUs were sorted by variance in
descending order. The OTUs in the top deciles (90th percentile)
were defined as the variable subpopulation, and OTUs in the
bottom deciles (10th percentile) were defined as the stable
subpopulation.
The BBC:A ratio of phyloChip samples - The number of OTUs
in the classes of Bacilli (Bac), Bacteroidetes (Bct), Clostridia (Cls), and a-
proteobacteria (A) where the positive fraction equal to 1 were tallied.
The ratio was calculated using the following formula:
BBC : A~BaczBctzCls
A
where
Bac~#OTUs
520
Bct~#OTUs
325
Cls~#OTUs
1073
A~#OTUs
827
The count for unique OTUs in each of the class was normalized
by dividing by the total number of OTUs in each class detectable
by the G2 PhyloChip. The denominators were predetermined
based on the number of OTUs assigned for each bacterial class on
the G2 PhyloChip design.
The BBC:A ratio of published 16S rRNA gene clone librarysequencing samples
Aligned sequences in the Greengenes [94] database were
downloaded and re-classified using the PhyloChip (G2) taxonomy
on the Greengenes website (http://greengene.lbl.gov). Aligned
DNA sequences of various environmental communities were also
obtained from [63]. The counts of unique OTUs were tallied for
each bacterial class. The BBC:A ratios were calculated using the
formulas mentioned above. If no OTU was detected for that class,
the count was set to 0.5.
Supporting Information
Figure S1 Phylum level profile of 503 fecal sample-associated
OTUs (FSAO), and order level profiles of Firmicutes and
Watershed Microbial Dynamics
PLoS ONE | www.plosone.org 8 June 2010 | Volume 5 | Issue 6 | e11285

Proteobacteria. Pie chart illustrates that the FSAO consist of 43%
Firmicutes and 28% Proteobacteria. Most of the Firmicutes OTUs
are in the order of Clostridiales, and most of the Proteobacteria
OTUs are in Enterobacteriales.
Found at: doi:10.1371/journal.pone.0011285.s001 (0.31 MB TIF)
Figure S2 Counts of fecal-sample-associated OTUs (FSAO) at
each site. Each bar represents one sample from each day. OTUs in
each sample which were also found on the list of the 503 FSAO
were tallied and presented as the FSAO count.
Found at: doi:10.1371/journal.pone.0011285.s002 (0.15 MB TIF)
Figure S3 Measurements of Human-specific Bacteroides Mark-
er (HBM), Total Coliform (TC), E. coli (EC), and Enterococcus
(ENT) counts. Bars represent HBM values. Lines represent TC,
EC and ENT most probable number (MPN).
Found at: doi:10.1371/journal.pone.0011285.s003 (0.49 MB TIF)
Table S1 Environmental variables measured concurrently with
the bacterial community samples. Dissolved oxygen, temperature,
salinity and pH were measured at the time of sampling and
reported here.
Found at: doi:10.1371/journal.pone.0011285.s004 (0.42 MB TIF)
Table S2 Description of bacterial communities analyzed by
sequencing and PhyloChip used in Figure 6. Gut, sewage-
associated and non-fecal samples analyzed by clone-library
sequencing and PhyloChip used for the Bacilli, Bacteroidetes,
Clostridia to a-proteobacteria ratio (BBC:A ratio) are described. All
DNA sequences from sequencing samples had a minimum length
of 1250 base pairs, except for those with the (*) symbol where the
minimum sequence length was 200 base pairs.
Found at: doi:10.1371/journal.pone.0011285.s005 (0.90 MB TIF)
Table S3 Kendall rank correlation tau coefficient and p-values
(in parenthesis). Measurements from all 27 water samples were
used. The (*) symbol denotes statistical significance (p-value,0.05)
differences. Abbreviations: Human Bacteroides Marker (HBM);
total coliform (TC); E. coli (EC); enterococcus (ENT); fecal-sample
associated OTUs (FSAO); Bacilli, Bacteroidetes, and Clostridia to a-
proteobacteria ratio (BBC:A).
Found at: doi:10.1371/journal.pone.0011285.s006 (0.09 MB TIF)
Table S4 Total OTUs detected by PhyloChip for all 30 samples.
Positive fraction and normalized fluorescence intensity values are
reported.
Found at: doi:10.1371/journal.pone.0011285.s007 (3.87 MB
XLS)
Acknowledgments
We are grateful to Yvette M. Piceno (LBNL) for PhyloChip processing
help, Ulas Karaoz (LBNL) for advice on R scripts, and Sherry Seybold
(LBNL) for making Figure 1. We would also like to thank Catherine
Lozupone for providing aligned DNA sequence files, as well as Julian
Marchesi, Nhu Nguyen and Mark Conrad for providing PhyloChip data
files. Additional assistance from the City of Santa Barbara and from UCSB
researchers was as per Sercu et al., 2009.
Author Contributions
Conceived and designed the experiments: CHW PAH GLA. Performed
the experiments: CHW BS LCVDW. Analyzed the data: CHW BS JW
TZD ELB TCH GLA. Contributed reagents/materials/analysis tools:
PAH GLA. Wrote the paper: CHW BS ELB TCH PAH GLA.
References
1. Stewart JR, Gast RJ, Fujioka RS, Solo-Gabriele HM, Meschke JS, et al. (2008)
The coastal environment and human health: microbial indicators, pathogens,
sentinels and reservoirs. Environ Health 7: 1476–1069X.
2. UNEP (2006) Marine and coastal ecosystems and human well-being: A synthesis
report based on the findings of the Millennium Ecosystem Assessment. Nairobi,
Kenya: United Nations Environmental Program. pp 1–76.
3. Platt RH (2006) Urban watershed management: Sustainability, one stream at a
time. Environment 48: 38–38.
4. USEPA (2007) National Water Quality Inventory: Report to Congress, 2002
Reporting Cycle. US Environmental Protection Agency.
5. Savichtcheva O, Okabe S (2006) Alternative indicators of fecal pollution:
Relations with pathogens and conventional indicators, current methodologies for
direct pathogen monitoring and future application perspectives. Water Res 40:
2463–2476.
6. Hazen TC, Toranzos GA (1990) Tropical source water McFeters GA, ed. New
York: Springer-Verlag.
7. Field KG, Bernhard AE, Brodeur TJ (2003) Molecular approaches to
microbiological monitoring: Fecal source detection. Environl Monit Assess 81:
313–326.
8. Harwood VJ, Levine AD, Scott TM, Chivukula V, Lukasik J, et al. (2005)
Validity of the indicator organism paradigm for pathogen reduction in reclaimed
water and public health protection. Appl Environ Microbiol 71: 3163–3170.
9. Savichtcheva O, Okayama N, Okabe S (2007) Relationships between
Bacteroides 16S rRNA genetic markers and presence of bacterial enteric
pathogens and conventional fecal indicators. Water Res 41: 3615–3628.
10. Wery N, Lhoutellier C, Ducray F, Delgenes JP, Godon JJ (2008) Behaviour of
pathogenic and indicator bacteria during urban wastewater treatment and
sludge composting, as revealed by quantitative PCR. Water Res 42: 53–62.
11. Shibata T, Solo-Gabriele HM, Fleming LE, Elmir S (2004) Monitoring marine
recreational water quality using multiple microbial indicators in an urban
tropical environment. Water Res 38: 3119–3131.
12. Andersen GL, He Z, DeSantis TZ, Brodie EL, Zhou J (2010) The Use of
Microarrays in Microbial Ecology. Environ Mol Microbiol. pp 87–109.
13. Cardenas E, Tiedje JM (2008) New tools for discovering and characterizing
microbial diversity. Curr Opin Biotechnol 19: 544–549.
14. Hamady M, Knight R (2009) Microbial community profiling for human micro-
biome projects: Tools, techniques, and challenges. Genome Res 19: 1141–1152.
15. Nelson KE, Bryan PA, White BA (2010) Genomics and Metagenomics: History
and Progress. Environ Mol Microbiol. pp 21–36.
16. Raes J, Bork P (2008) Systems microbiology - Timeline - Molecular eco-systems
biology: towards an understanding of community function. Nat Rev Microbiol 6:
693–699.
17. Brodie EL, DeSantis TZ, Joyner DC, Baek SM, Larsen JT, et al. (2006)
Application of a high-density oligonucleotide microarray approach to study
bacterial population dynamics during uranium reduction and reoxidation. Appl
Environ Microbiol 72: 6288–6298.
18. Brodie EL, DeSantis TZ, Parker JPM, Zubietta IX, Piceno YM, et al. (2007)
Urban aerosols harbor diverse and dynamic bacterial populations. Proc Nat
Acad Sci 104: 299–304.
19. Cruz-Martinez K, Suttle KB, Brodie EL, Power ME, Andersen GL, et al. (2009)
Despite strong seasonal responses, soil microbial consortia are more resilient to
long-term changes in rainfall than overlying grassland. ISME J 3: 738–744.
20. DeAngelis KM, Brodie EL, DeSantis TZ, Andersen GL, Lindow SE, et al.
(2009) Selective progressive response of soil microbial community to wild oat
roots. ISME J 3: 168–178.
21. Flanagan JL, Brodie EL, Weng L, Lynch SV, Garcia O, et al. (2007) Loss of
bacterial diversity during antibiotic treatment of intubated patients colonized
with Pseudomonas aeruginosa. J Clin Microbiol 45: 1954–1962.
22. Sagaram US, DeAngelis KM, Trivedi P, Andersen GL, Lu SE, et al. (2009)
Bacterial Diversity Analysis of Huanglongbing Pathogen-Infected Citrus, Using
PhyloChip Arrays and 16S rRNA Gene Clone Library Sequencing. Appl
Environ Microbiol 75: 1566–1574.
23. West NJ, Obernosterer I, Zemb O, Lebaron P (2008) Major differences of
bacterial diversity and activity inside and outside of a natural iron-fertilized
phytoplankton bloom in the Southern Ocean. Environ Microbiol 10: 738–
756.
24. Wrighton KC, Agbo P, Warnecke F, Weber KA, Brodie EL, et al. (2008) A
novel ecological role of the Firmicutes identified in thermophilic microbial fuel
cells. ISME J 2: 1146–1156.
25. Cox MJ, Huang YJ, Fujimura KE, Liu JT, McKean M, et al. (2010)
Lactobacillus casei Abundance Is Associated with Profound Shifts in the Infant
Gut Microbiome. PLoS One 5: e8745.
26. La Duc MT, Dekas A, Osman S, Moissl C, Newcombe D, et al. (2007) Isolation
and characterization of bacteria capable of tolerating the extreme conditions of
clean room environments. Appl Environ Microbiol 73: 2600–2611.
27. Isovitsch Parks SL, VanBriesen JM (2009) Evaluating Temporal Variability in
Bacterial Indicator Samples for an Urban Watershed. Journal of Environmental
Engineering 32: 1294–1303.
Watershed Microbial Dynamics
PLoS ONE | www.plosone.org 9 June 2010 | Volume 5 | Issue 6 | e11285

28. Petersen TM, Rifai HS, Suarez MP, Stein AR (2005) Bacteria loads from pointand nonpoint sources in an urban watershed. J Environ Eng-ASCE 131:
1414–1425.
29. Sercu B, Van De Werfhorst LC, Murray J, Holden PA (2009) Storm Drains areSources of Human Fecal Pollution during Dry Weather in Three Urban
Southern California Watersheds. Environ Sci Technol 43: 293–298.
30. Mielke PW, Berry KJ (1994) Permutation tests for common locations amongsamples with unequal variances. J Educ Behav Stat 19: 217–236.
31. Lozupone C, Knight R (2005) UniFrac: a new phylogenetic method for
comparing microbial communities. Appl Environ Microbiol 71: 8228–8235.
32. Ley RE, Hamady M, Lozupone C, Turnbaugh PJ, Ramey RR, et al. (2008)
Evolution of mammals and their gut microbes. Science 320: 1647–1651.
33. Chouari R, Le Paslier D, Daegelen P, Ginestet P, Weissenbach J, et al. (2005)Novel predominant archaeal and bacterial groups revealed by molecular analysis
of an anaerobic sludge digester. Environ Microbiol 7: 1104–1115.
34. Chouari R, Le Paslier D, Dauga C, Daegelen P, Weissenbach J, et al. (2005)Novel major bacterial candidate division within a municipal anaerobic sludge
digester. Appl Environ Microbiol 71: 2145–2153.
35. Juretschko S, Loy A, Lehner A, Wagner M (2002) The microbial communitycomposition of a nitrifying-denitrifying activated sludge from an industrial
sewage treatment plant analyzed by the full-cycle rRNA approach. Systematicand Applied Microbiology 25: 84–99.
36. LaPara TM, Nakatsu CH, Pantea L, Alleman JE (2000) Phylogenetic analysis of
bacterial communities in mesophilic and thermophilic bioreactors treatingpharmaceutical wastewater. Appl Environ Microbiol 66: 3951–3959.
37. Roest K, Heilig H, Smidt H, de Vos WM, Stams AJM, et al. (2005) Community
analysis of a full-scale anaerobic bioreactor treating paper mill wastewater.Systematic and Applied Microbiology 28: 175–185.
38. Acinas SG, Klepac-Ceraj V, Hunt DE, Pharino C, Ceraj I, et al. (2004) Fine-
scale phylogenetic architecture of a complex bacterial community. Nature 430:551–554.
39. Benlloch S, RodriguezValera F, MartinezMurcia AJ (1995) Bacterial diversity in
two coastal lagoons deduced from 16S rDNA PCR amplification and partialsequencing. FEMS Microbiol Ecol 18: 267–279.
40. Daffonchio D, Borin S, Brusa T, Brusetti L, van der Wielen P, et al. (2006)
Stratified prokaryote network in the oxic-anoxic transition of a deep-seahalocline. Nature 440: 203–207.
41. DeLong EF, Preston CM, Mincer T, Rich V, Hallam SJ, et al. (2006)
Community genomics among stratified microbial assemblages in the ocean’sinterior. Science 311: 496–503.
42. Franklin MP, McDonald IR, Bourne DG, Owens NJP, Upstill-Goddard RC,et al. (2005) Bacterial diversity in the bacterioneuston (sea surface microlayer):
the bacterioneuston through the looking glass. Environ Microbiology 7:
723–736.
43. Fuhrman JA, McCallum K, Davis AA (1993) Phylogenetic diversity of
subsurface marine microbial communities from the Atlantic and Pacific oceans.
Appl Environ Microbiol 59: 1294–1302.
44. Glockner FO, Zaichikov E, Belkova N, Denissova L, Pernthaler J, et al. (2000)
Comparative 16S rRNA analysis of lake bacterioplankton reveals globally
distributed phylogenetic clusters including an abundant group of actinobacteria.Appl Environ Microbiol 66: 5053–+.
45. Humayoun SB, Bano N, Hollibaugh JT (2003) Depth distribution of microbialdiversity in Mono Lake, a meromictic soda lake in California. Appl Environ
Microbiol 69: 1030–1042.
46. Madrid VM, Taylor GT, Scranton MI, Chistoserdov AY (2001) Phylogeneticdiversity of bacterial and archaeal communities in the anoxic zone of the
Cariaco Basin. Appl Environ Microbiol 67: 1663–1674.
47. Mosier AC, Murray AE, Fritsen CH (2007) Microbiota within the perennial icecover of Lake Vida, Antarctica. FEMS Microb Ecol 59: 274–288.
48. Urbach E, Vergin KL, Young L, Morse A, Larson GL, et al. (2001) Unusual
bacterioplankton community structure in ultra-oligotrophic Crater Lake.Limnology and Oceanography 46: 557–572.
49. van der Wielen P, Bolhuis H, Borin S, Daffonchio D, Corselli C, et al. (2005)
The enigma of prokaryotic life in deep hypersaline anoxic basins. Science 307:121–123.
50. Williams MM, Domingo JWS, Meckes MC, Kelty CA, Rochon HS (2004)
Phylogenetic diversity of drinking water bacteria in a distribution systemsimulator. J Appl Microbiol 96: 954–964.
51. Woebken D, Fuchs BA, Kuypers MAA, Amann R (2007) Potential interactions
of particle-associated anammox bacteria with bacterial and archaeal partners inthe Namibian upwelling system. Appl Environ Microbiol 73: 4648–4657.
52. Zaballos M, Lopez-Lopez A, Ovreas L, Bartual SG, D’Auria G, et al. (2006)
Comparison of prokaryotic diversity at offshore oceanic locations. FEMSMicrobiol Ecol 56: 389–405.
53. Zrafi-Nouira I, Guermazi S, Chouari R, Safi NMD, Pelletier E, et al. (2009)Molecular diversity analysis and bacterial population dynamics of an adapted
seawater microbiota during the degradation of Tunisian zarzatine oil.
Biodegradation 20: 467–486.
54. Ivanov II, Atarashi K, Manel N, Brodie EL, Shima T, et al. (2009) Induction of
Intestinal Th17 Cells by Segmented Filamentous Bacteria. Cell 139: 485–498.
55. DeSantis TZ, Brodie EL, Moberg JP, Zubieta IX, Piceno YM, et al. (2007)High-density universal 16S rRNA microarray analysis reveals broader diversity
than typical clone library when sampling the environment. Microb Ecol 53:
371–383.
56. Chauhan A, Cherrier J, Williams HN (2009) Impact of sideways and bottom-up
control factors on bacterial community succession over a tidal cycle. Proc Nat
Acad Sci 106: 4301–4306.
57. Crump BC, Hopkinson CS, Sogin ML, Hobbie JE (2004) Microbial
biogeography along an estuarine salinity gradient: Combined influences of
bacterial growth and residence time. App Environ Microbiol 70: 1494–1505.
58. Kaartokallio H, Laamanen M, Sivonen K (2005) Responses of Baltic Sea ice and
open-water natural bacterial communities to salinity change. Appl Environ
Microbiol 71: 4364–4371.
59. Nelson CE (2009) Phenology of high-elevation pelagic bacteria: the roles of
meteorologic variability, catchment inputs and thermal stratification in
structuring communities. ISME J 3: 13–30.
60. Bodtker G, Thorstenson T, Lillebo BLP, Thorbjornsen BE, Ulvoen RH, et al.
(2008) The effect of long-term nitrate treatment on SRB activity, corrosion rate
and bacterial community composition in offshore water injection systems. J Ind
Microbiol Biotechnol 35: 1625–1636.
61. Hirayama H, Takai K, Inagaki F, Yamato Y, Suzuki M, et al. (2005) Bacterial
community shift along a subsurface geothermal water stream in a Japanese gold
mine. Extremophiles 9: 169–184.
62. Wassel RA, Mills AL (1983) Changes in water and sediment bacterial
community structure in a lake receiving acid-mine drainage. Microbial Ecology
9: 155–169.
63. Lozupone CA, Knight R (2007) Global patterns in bacterial diversity. Proc Nat
Acad Sci 104: 11436–11440.
64. Hawkins RJ, Purdy KJ. Genotypic distribution of an indigenous model
microorganism along an estuarine gradient; 2007. pp 187–194.
65. Troussellier M, Schafer H, Batailler N, Bernard L, Courties C, et al. (2002)
Bacterial activity and genetic richness along an estuarine gradient (Rhone River
plume, France). Aquatic Microbial Ecology 28: 13–24.
66. Eckburg PB, Bik EM, Bernstein CN, Purdom E, Dethlefsen L, et al. (2005)
Diversity of the human intestinal microbial flora. Science 308: 1635–1638.
67. Frank DN, Amand ALS, Feldman RA, Boedeker EC, Harpaz N, et al. (2007)
Molecular-phylogenetic characterization of microbial community imbalances in
human inflammatory bowel diseases. Proc Nat Acad Sci 104: 13780–13785.
68. Mahowald MA, Rey FE, Seedorf H, Turnbaugh PJ, Fulton RS, et al. (2009)
Characterizing a model human gut microbiota composed of members of its two
dominant bacterial phyla. Proc Nat Acad Sci 106: 5859–5864.
69. Rajilic-Stojanovic M, Heilig H, Molenaar D, Kajander K, Surakka A, et al.
(2009) Development and application of the human intestinal tract chip, a
phylogenetic microarray: analysis of universally conserved phylotypes in the
abundant microbiota of young and elderly adults. Environ Microbiol 11:
1736–1751.
70. Scupham AJ, Patton TG, Bent E, Bayles DO (2008) Comparison of the cecal
microbiota of domestic and wild turkeys. Microbial Ecology 56: 322–331.
71. Dowd SE, Callaway TR, Wolcott RD, Sun Y, McKeehan T, et al. (2008)
Evaluation of the bacterial diversity in the feces of cattle using 16S rDNA
bacterial tag-encoded FLX amplicon pyrosequencing (bTEFAP). BMC Micro-
biol 8.
72. Cotta M, Forster R (2006) The family Lachnospiraceae, including the genera
Butyrivibrio, Lachnospira and Roseburia. In: Dworkin M, Schleifer K-H,
Rosenberg E, Falkow S, eds. The Prokaryotes - A handbook on the biology of
Bacteria: Bacteria: Firmicutes, Cyanobacteria. 3 ed. New YorkNY: Springer-Verlag
New York, LLC. pp 1002–1021.
73. Ishii S, Ksoll WB, Hicks RE, Sadowsky MJ (2006) Presence and growth of
naturalized Escherichia coli in temperate soils from lake superior watersheds.
Appl Environ Microbiol 72: 612–621.
74. Fogarty LR, Voytek MA (2005) Comparison of Bacteroides-Prevotella 16S
rRNA genetic markers for fecal samples from different animal species. Appl
Environl Microbiol 71: 5999–6007.
75. Juteau P, Tremblay D, Villemur R, Bisaillon JG, Beaudet R (2005) Analysis of
the bacterial community inhabiting an aerobic thermophilic sequencing batch
reactor (AT-SBR) treating swine waste. Appl Microbiol Biotechnol 66: 115–122.
76. Lu JR, Domingo JS, Shanks OC (2007) Identification of chicken-specific fecal
microbial sequences using a metagenomic approach. Water Res 41: 3561–3574.
77. Dang HY, Li TG, Chen MN, Huang GQ (2008) Cross-Ocean distribution of
Rhodobacterales bacteria as primary surface colonizers in temperate coastal
marine waters. Appl Environ Microbiol 74: 52–60.
78. Geldreich EE (1976) Fecal coliform and fecal streptococcus density relationships in
waste discharges and receiving waters. CRC Crit Rev Environ Contr 6:
349–369.
79. Black LE, Brion GM, Freitas SJ (2007) Multivariate logistic regression for
predicting total culturable virus presence at the intake of a potable-water
treatment plant: Novel application of the atypical coliform/total coliform ratio.
Appl Environ Microbiol 73: 3965–3974.
80. Nieman J, Brion GM. Novel bacterial ratio for predicting faecal age; 2003. pp
45–49.
81. Smit E, Leeflang P, Gommans S, van den Broek J, van Mil S, et al. (2001)
Diversity and seasonal fluctuations of the dominant members of the bacterial soil
community in a wheat field as determined by cultivation and molecular
methods. Appl Environ Microbiol 67: 2284–2291.
82. Sun HY, Deng SP, Raun WR (2004) Bacterial community structure and
diversity in a century-old manure-treated agroecosystem. Appl Environ
Microbiol 70: 5868–5874.
Watershed Microbial Dynamics
PLoS ONE | www.plosone.org 10 June 2010 | Volume 5 | Issue 6 | e11285

83. Hartman WH, Richardson CJ, Vilgalys R, Bruland GL (2008) Environmental
and anthropogenic controls over bacterial communities in wetland soils. Proc
Nat Acad Sci 105: 17842–17847.
84. Paerl HW, Dyble J, Moisander PH, Noble RT, Piehler MF, et al. (2003)
Microbial indicators of aquatic ecosystem change: current applications to
eutrophication studies. FEMS Microbiol Ecol 46: 233–246.
85. Graneli E, Weberg M, Salomon PS (2008) Harmful algal blooms of allelopathic
microalgal species: The role of eutrophication. Harmful Algae 8: 94–102.
86. Moustafa A, Loram JE, Hackett JD, Anderson DM, Plumley FG, et al. (2009)
Origin of Saxitoxin Biosynthetic Genes in Cyanobacteria. Plos One 4:
1932–6203.
87. Wilson KH, Blitchington RB, Greene RC (1990) Amplification of Bacterial 16S
ribosomal DNA with polymerase chain reaction. App Environ Microbiol 28:
1942–1946.
88. Masuda N, Church GM (2002) Escherichia coli gene expression responsive to
levels of the response regulator EvgA. J Bacteriol 184: 6225–6234.89. Mei R, Hubbell E, Bekiranov S, Mittmann M, Christians FC, et al. (2003) Probe
selection for high-density oligonucleotide arrays. Proc Nat Acad Sci 100:
11237–11242.90. Team RCD (2008) R: A language and environment for statistical computing.
91. Goslee SC, Urban DL (2007) The ecodist package for dissimilarity-basedanalysis of ecological data. J Stat Softw 22: 1–19.
92. Evans J, Sheneman L, Foster JA (2006) Relaxed neighbor-joining: a fast
distance-based phylogenetic tree. Construction method. J Mol Evol 62: 785–792.93. McCune B, Mefford MJ (2006) PC-ORD. Multivariate Analysis of Ecological
Data. Version 5. Gleneden Beach, Oregon, USA: MjM Software.94. DeSantis TZ, Hugenholtz P, Larsen N, Rojas M, Brodie EL, et al. (2006)
Greengenes, a chimera-checked 16S rRNA gene database and workbenchcompatible with ARB. Appl Environ Microbiol 72: 5069–5072.
Watershed Microbial Dynamics
PLoS ONE | www.plosone.org 11 June 2010 | Volume 5 | Issue 6 | e11285

Appendix 5:
Selected presentations to EPA, ISME
1) Bacterial Community Analysis of Avian and Mammalian Sources of FecalContamination in Coastal California
2) Temporal Dynamics of Cattle and Human Fecal Microbial Communities in Freshand Marine Waters.
3) Application of Comprehensive Bacterial Community Analysis to DiscriminateCommon Sources of Fecal Pollution

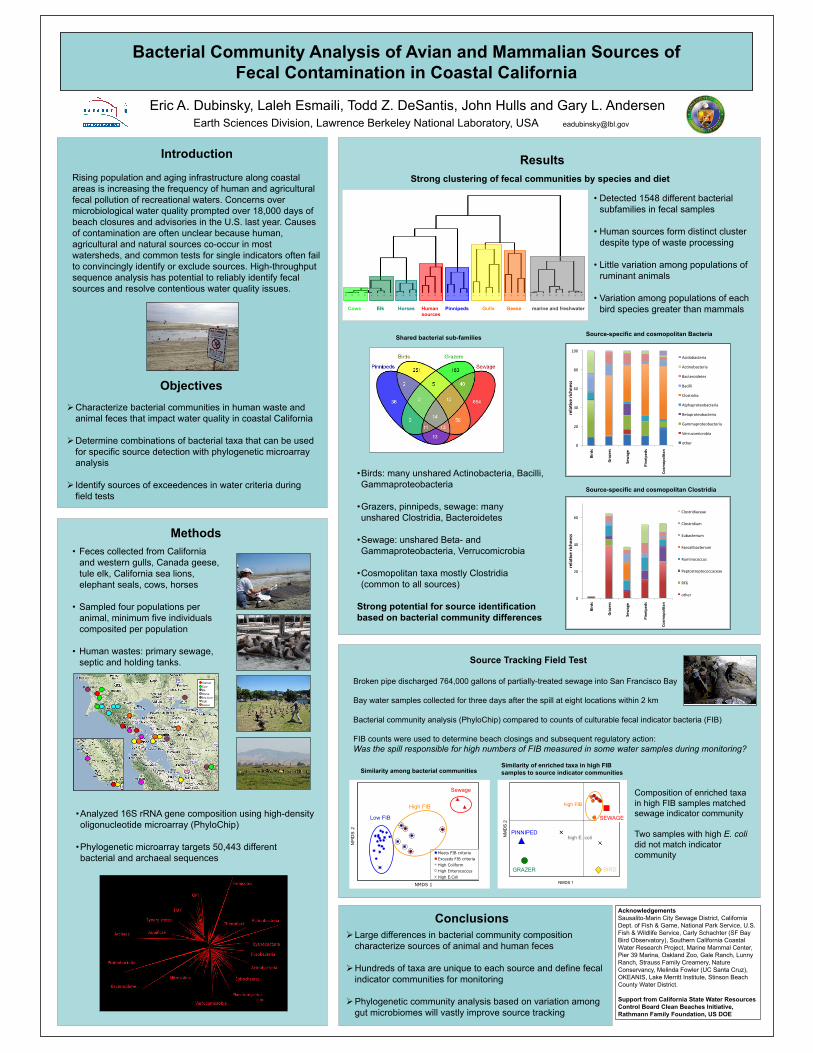
Bacterial Community Analysis of Avian and Mammalian Sources of Fecal Contamination in Coastal California
Eric A. Dubinsky, Laleh Esmaili, Todd Z. DeSantis, John Hulls and Gary L. Andersen Earth Sciences Division, Lawrence Berkeley National Laboratory, USA [email protected]
Introduction
Rising population and aging infrastructure along coastal areas is increasing the frequency of human and agricultural fecal pollution of recreational waters. Concerns over microbiological water quality prompted over 18,000 days of beach closures and advisories in the U.S. last year. Causes of contamination are often unclear because human, agricultural and natural sources co-occur in most watersheds, and common tests for single indicators often fail to convincingly identify or exclude sources. High-throughput sequence analysis has potential to reliably identify fecal sources and resolve contentious water quality issues.
Objectives Characterize bacterial communities in human waste and
animal feces that impact water quality in coastal California
Determine combinations of bacterial taxa that can be used for specific source detection with phylogenetic microarray analysis
Identify sources of exceedences in water criteria during field tests
Results
Conclusions
Large differences in bacterial community composition characterize sources of animal and human feces
Hundreds of taxa are unique to each source and define fecal indicator communities for monitoring
Phylogenetic community analysis based on variation among gut microbiomes will vastly improve source tracking
Acknowledgements Sausalito-Marin City Sewage District, California Dept. of Fish & Game, National Park Service, U.S. Fish & Wildlife Service, Carly Schachter (SF Bay Bird Observatory), Southern California Coastal Water Research Project, Marine Mammal Center, Pier 39 Marina, Oakland Zoo, Gale Ranch, Lunny Ranch, Strauss Family Creamery, Nature Conservancy, Melinda Fowler (UC Santa Cruz), OKEANIS, Lake Merritt Institute, Stinson Beach County Water District.
Support from California State Water Resources Control Board Clean Beaches Initiative, Rathmann Family Foundation, US DOE
• Detected 1548 different bacterial subfamilies in fecal samples
• Human sources form distinct cluster despite type of waste processing
• Little variation among populations of ruminant animals
• Variation among populations of each bird species greater than mammals
Strong clustering of fecal communities by species and diet
Broken pipe discharged 764,000 gallons of partially-treated sewage into San Francisco Bay
Bay water samples collected for three days after the spill at eight locations within 2 km
Bacterial community analysis (PhyloChip) compared to counts of culturable fecal indicator bacteria (FIB)
FIB counts were used to determine beach closings and subsequent regulatory action: Was the spill responsible for high numbers of FIB measured in some water samples during monitoring?
• Analyzed 16S rRNA gene composition using high-density oligonucleotide microarray (PhyloChip)
• Phylogenetic microarray targets 50,443 different bacterial and archaeal sequences
• Birds: many unshared Actinobacteria, Bacilli, Gammaproteobacteria
• Grazers, pinnipeds, sewage: many unshared Clostridia, Bacteroidetes
• Sewage: unshared Beta- and Gammaproteobacteria, Verrucomicrobia
• Cosmopolitan taxa mostly Clostridia (common to all sources)
Strong potential for source identification based on bacterial community differences
• Feces collected from California and western gulls, Canada geese, tule elk, California sea lions, elephant seals, cows, horses
• Sampled four populations per animal, minimum five individuals composited per population
• Human wastes: primary sewage, septic and holding tanks.
Methods
Source Tracking Field Test
Cows Pinnipeds Geese Elk Horses Gulls Human sources
marine and freshwater
Shared bacterial sub-families
Human Cow Elk Horse Sea Lion Gull Goose
!"
#!"
$!"
%!"
&!"
'!!"
!"#$%&
'#()*#%&
+*,(-*&&
."//"0*$%&
12%3
2024"5(/&
#*4(67*&#"89/*%%&
()*+,-.)/01*."
()23,-.)/01*."
4.)/01,*+0/05"
4.)*66*"
76,5/1*+*."
(689.81,/0,-.)/01*."
40/.81,/0,-.)/01*."
:.;;.81,/0,-.)/01*."
<011=),;*)1,-*."
,/901"
!"
#!"
$!"
%!"
!"#$%&
'#()*#%&
+*,(-*&&
."//"0*$%&
12%3
2024"5(/&
#*4(67*&#"89/*%%&
&'()*+,-,./0.0"
&'()*+,-,12"
314./*0+,12"
5.0/.',4./*0+,12"
612,7(/(//1)"
809*()*+09*(/(//./0.0"
65%"
(*:0+"
Source-specific and cosmopolitan Bacteria
Source-specific and cosmopolitan Clostridia
NM
DS 2
NMDS 1
Meets FIB criteria
Exceeds FIB criteria
High Coliform
High Enterococcus
High E.Coli
Composition of enriched taxa in high FIB samples matched sewage indicator community
Two samples with high E. coli did not match indicator community
Similarity among bacterial communities Similarity of enriched taxa in high FIB samples to source indicator communities
Sewage
High FIB
Low FIB
NM
DS
2
NMDS 1
SEWAGE
high FIB
GRAZER BIRD
PINNIPED high E. coli

TEMPORAL DYNAMICS OF CATTLE AND HUMAN FECAL MICROBIAL COMMUNITIES IN FRESH AND MARINE WATERS
Cindy H. Wu, Eric A. Dubinsky, John Hulls, Shariff R. Osman, Terry C. Hazen, Gary L. Andersen
Lawrence Berkeley National Laboratory. Berkeley, California, USA
Introduction
Objective To characterize the survival and persistence of fecal bacteria from different sources under various field conditions in order to quantify risks associated with cattle and human waste.
The presence of pathogenic bacteria at recreational beaches has been recognized as an important epidemiological and economic issue. Previous work has demonstrated that indicator species (Enterococcus and fecal coliforms) do not necessarily indicate the presence of pathogenic bacteria, and could lead to misguided decisions in beach closures. Urbanization and agricultural runoff have been shown to contribute to non-point source fecal pollution. However, it is unclear to what extent the fecal microbial communities from various sources (e.g. human and cattle) behave differently in the environment.
Experimental Setup & Methods 1. We utilized diffusion chambers with
2um membranes that have 100 ml holding volume. Human septage and cattle waste were injected into diffusion chambers (Fig. 1), and immersed in creek water and bay water (Fig. 2). Samples were taken at 6 time points up to 96 hr. Community compositions were characterized with a high-density microarray (PhyloChip) targeting the 16S rRNA gene of Bacteria and Archaea.
2. Samples were taken at various time points through sampling ports, vacuum filtered onto an inorganic membrane filter and kept at -80oC until sample processing.
3. Nucleic acids were extracted by a modified CTAB method, purified and separated using the AllPrep DNA/RNA Kit (Qiagen).
4. Microbial community composition was analyzed using a Affymetrix platform high-density microarray (G3 PhyloChip), targeting 16S rRNA of ~60,000 microbial taxa (Fig. 3). The 16S rRNA gene was amplified from gDNA extracts using modified universal primers:
Bacteria: 27F (5’ AGAGTTTGATCCTGGCTCAG) 1492R (5’ GGTTACCTTGTTACGACTT) Archaea: 4Fa (5’ TCCGGTTGATCCTGCCRG 3’) 1492R (Same as above)
Results and Discussion
Fig.1
Fig.3
Conclusions
Acknowledgement This project is supported by the US Department of Energy under contract # DE-AC02-05CH11231, the Rathmann Family Foundation and the California State Water Resources Control Board Prop. 50 Clean Beaches Initiative grant. We also like to thank Gale Ranch, and Strauss Family Creamery in making this research possible.
Receiving water type affects microbial community dynamics over time.
The results of this research indicate that creek and bay water exert different effects on the fate of waste microbial communities.
Therefore, selection of indicators for monitoring should be based on waste type and persistence of fecal taxa under various receiving waters.
Microbial Community Composition Similarity
Samples clustered by waste type
At 0 and 24 hours after incubation, microbial communities were similar in bay or creek water
At 96 hours, the microbial communities grouped by receiving water
Fig.2
Similar taxa from cattle and human wastes decreased over a period of 96 hours in both water types.
More Clostridia taxa detected over time in cattle waste.
More Enterobacteriales and Bacilli taxa detected over time in human waste.
Similar responses of cattle waste and human sepatage in creek water observed.
The waste communities responded differently in bay water.
Clostridia and many γ-proteobacteria, including coliforms, were more persistent in creek water.
β-proteobacteria were more persistent in bay water.
Potential Indicator Taxa
Bacteria and archaea that are unique to each waste and absent from receiving waters are presented
A total of 13,341 different taxa were detected in waste and receiving water samples
Number of potential indicator taxa 165 taxa identified for cattle waste 119 taxa identified for human waste
In cattle waste, more unique taxa were Clostridia. In human waste, more unique taxa were Proteobacteria.
Effects of Time on Cattle and Human Wastes
Effects of Creek and Bay Water on Fecal Communities
0-24 hours 96 hours 0-24 hours 96 hours Bay Creek
Human Cattle Receiving waters

Application of comprehensive bacterial community analysis to discriminate common sources of fecal pollution Eric A. Dubinsky, Laleh Esmaili, John Hulls and Gary L. Andersen
Earth Sciences Division, Lawrence Berkeley National Laboratory, USA [email protected]
Introduction Causes of fecal contamination in recreational waters are often unclear because human, agricultural and wildlife sources of fecal bacteria co-occur in many watersheds. Common tests for single indicators often fail to convincingly identify or exclude sources. High-throughput DNA sequence analysis has potential to reliably track fecal sources by profiling the entire community of microorganisms that differentiate fecal contaminants. In this study we used the Lawrence Berkeley National Laboratory PhyloChip to discriminate fecal sources based on the detection of over 59,000 different taxonomic groups of bacteria in a single test. We focused on suspected sources of fecal contamination at popular beaches in coastal California (human wastes, birds, cattle and other grazing animals). Measuring nearly all known types of bacteria in fecal samples allowed us to find hundreds of different taxa that were unique to each source type and could be used for reliable source identification. The power of this method was demonstrated in recreational waters with high counts of fecal indicator bacteria.
Results
Conclusions Large differences in bacterial community composition among fecal sources
Hundreds of taxa are unique to each source and define fecal identifier communities for source tracking
Tests in high FIB waters demonstrate a single microarray test is capable of identifying or excluding multiple sources Reliable source tracking based on a complete census of bacterial taxa has great promise for improving risk
assessment Acknowledgements Sausalito-Marin City Sewage District, California Dept. of Fish & Game, National Park Service, U.S. Fish & Wildlife Service, Carly Schachter (SF Bay Bird Observatory), Southern California Coastal Water Research Project, Marine Mammal Center, Pier 39 Marina, Oakland Zoo, Gale Ranch, Lunny Ranch, Strauss Family Creamery, Nature Conservancy, Melinda Fowler (UC Santa Cruz), OKEANIS, Lake Merritt Institute, Stinson Beach County Water District. Support from California State Water Resources Control Board Clean Beaches Initiative, Rathmann Family Foundation, US Department of Energy
• Detected 20,368 different bacterial taxa across all fecal samples
• Each source is distinct • Little variation among ruminant
microbial communities
• Bird communities are the most variable but still distinct from other animals
• Taxonomic (OTU) richness of grazing mammals is dominated by Clostridia, lactic acid Bacilli and Bacteroidetes - essential bacteria for digestion of cellulose and other plant polysaccharides.
• Taxonomic richness of human wastes is dominated by
Clostridia, Gammaproteobacteria (mostly coliforms) and Bacteroidetes.
• Gulls and geese have distinct richness profiles. Enteric Gammaproteobacteria and Bacilli dominate gulls. Actinobacteria, Alphaproteobacteria and Clostridia more dominant in geese.
• Pinnipeds dominated by Clostridia and Gammaproteobacteria.
Hundreds of bacterial taxa unique to each source
Fecal Samples • California and western gulls, Canada geese, tule elk, California
sea lions, elephant seals, cows, horses
• Sampled four populations per animal, minimum five individuals combined per population
• Human wastes: primary sewage, septic and holding tanks
Application to Source Tracking
• Greater than expected number of bird identifier taxa
• No increased detection of human or grazer identifier taxa
• Consistent with previous study that determined birds were a likely source
Sewage spill
Sausalito sanitary plant 764,000 gallon sewage spill in San Francisco Bay
Campbell Cove, Bodega Bay Poor water quality with no suspected human source
Baker Beach, San Francisco Poor water quality (high FIB) with potential human sources
Strong clustering of bacterial communities by source type
Bacterial community composition of fecal sources
!"#$! %&''&()*$! +))$)!,-.! /"0$)$! +1--$!/123'4
#3$5)$4!
230&')43'*460)$7#35)0!
1. Sewage spill monitoring: SF Bay water samples (1 L) from 2 km area for 10 days following spill. Fecal indicator tests for coliforms and enterococcus.
2. Beach monitoring: weekly samples collected for 1 year and analyzed for FIB. Samples preserved on filters and archived at -80°C until DNA extraction. Subset of samples analyzed by PhyloChip based on FIB exceedences.
3. At all sites, baseline microbial communities defined by mean abundance of
taxa in non-exceedence samples. Taxa that significantly exceed baseline (> mean + 2σ) determined for each sample.
4. Sources revealed by source identifier taxa that exceed baseline
Includes: 2,105 Enterobacteria (coliforms) 2,272 Bacteroidales 146 Enterococci 12,098 Clostridia 353 Cyanobacteria 643 Archaea
Human Cow Elk Horse Sea Lion Gull Goose
Methods Comprehensive microbial census with high-density oligonucleotide microarray (PhyloChip)
Simultaneous detection and quantification of 59,959 different bacterial and archaeal taxa
Designed from database of all known 16S rRNA gene sequences
Advantage over sequencing: reliable detection of rare taxa, profiles entire 16S rRNA gene pool
PhyloChip measures most bacterial diversity
2 Domains 147 Phyla 1,464 Families 10,993 Subfamilies 59,959 OTUs
• Sources can be identified based on hundreds of unique Clostridia, Bacilli, Bacteroidetes and Proteobacteria
Values in parenthesis are total richness of OTUs detected in the majority of samples for each source
• Nearly all human fecal identifier taxa found in waters
• Detection of bird or grazer taxa not greater than expected
• Some samples below enterococcus limit clearly impacted by sewage
• Greater than expected numbers of both human and bird identifier taxa
• Mixed sources of FIB: possibly leaking sewer lines, shoreline birds
Baker Beach Campbell Cove
Enterococcus concentration
Sour
ce id
entif
ier t
axa
Enterococcus water quality limit
human Human & bird
bird
Phylogenetic tree of source identifier taxa for major source types Composition of source identifier taxa