final report a. project information period: 1/2012 … report a. project information title:...
TRANSCRIPT

Final Report
A. Project Information
Title: Determination of root distribution, dynamics, phenology and physiology of almonds
to optimize fertigation practices.
Period: 1/2012 – 12/2014
FREP Grant Number: 11-0461-SA
Project Leader:
Patrick Brown
Professor
Department of Plant Sciences
One Shields Ave., University of California
Davis, CA 95616-8683
(530) 752-0929
Cooperators:
Jan Hopmans
Professor
Department of Land, Air and Water Resources
One Shields Ave., University of California
Davis, CA 95616-8683
Andres Olivos
Doctorate student
Department of Plant Sciences
One Shields Ave., University of California
Davis, CA 95616-8683
Co-PI: Blake Sanden
Irrigation & Agronomy Farm Advisor
University of California Cooperative Extension
1031 S. Mt Vernon Ave.
Bakersfield, CA 93307
Supporter: Paramount Farming Company. Belridge: Paramount Farming Company will
provide extensive free labor, irrigation design, fertilization management, and harvest assistance
as needed.
B. Objectives

1 Determine almond root growth and phenology and characterize root distribution and nutrient
uptake activity as influenced by tree nitrogen status, irrigation source, yield and plant
characteristics.
2 Determine the patterns and biological dynamics (Km, Vmax, Cmin/max) of tree nitrogen
uptake and the relationship to tree demand and phenology.
3 Integrate root phenology and uptake data into the HYDRUS 2D model to help interpret and
extend findings to a wider range of soils, irrigation and demand scenarios.
4 Publication and extension of results.
C. Abstract
Optimal fertilization practice can only be developed if knowledge of the 4 R’s (right source, right
rate, right place, and right time) are explicitly developed for the Almond production context. To
optimize nutrient use efficiency in fertigated almond it is essential that fertilizers injected into
irrigation system are provided at the optimal concentration and time to ensure that deposition
patterns coincide with maximal root nutrient uptake. To effectively fertigate information on the
biology and phenology of roots and uptake must then be integrated with fertigation system design
(micro-sprinkler, drip, volume, distribution pattern, etc.). In this project, two experiments have
been set to determine almond root characteristics such as nitrate uptake physiology, root phenology
and root distribution, according to different management practices. Results demonstrate
considerable adaptability in nitrate uptake with changing soil nitrate concentrations. When soil
nitrate concentrations are low, roots adapt and nitrate uptake mechanisms become more capable
of removing nitrate form low concentrations. Plants adapted to high nitrate soils cannot effectively
scavenge nitrate form low concentration soils. Plants adapted low nitrate conditions, however, are
not well adapted to nitrate uptake from soils high in nitrate. In both scenarios root swill adapt to
changing conditions though the speed with which this occurs is not known. From a practical
perspective, fertilization strategies that maintain a near constant soil nitrate concentration (high
frequency fertigation) will develop roots well adapted to scavenge nitrate from those soils.
The seasonal patterns and depth of root growth were investigated over a 2-year period utilizing
soil excavation and mini-rhizotrons. Fine active roots are predominantly located in the 0-20 inch
root depths, which coincides with the soil volume wetted during a typical fertigation event.
Additional roots were present at depths of up to 60 inches though these tended to be large roots
and were at a far lower root density. Two root flushes are observed in Almond, the first and major
flush (>90% of root growth) occurs coincident with leaf out, with a second, but variable, flush
commencing in October. The amount of root growth appears to be inversely proportional to yield,
with lowest root production in high yield years.
The data from this experiment will inform the design of fertigation strategies and the timing and
quantity of N application to achieve efficient nitrogen use.

D. Introduction
This project is designed to provide critical information on root growth and nutrient uptake to
provide fundamental information on root adaptability to changing soil nitrate and the seasonality
of root growth in Almond. This project complements the recently completed FREP project
‘Development of a nutrient budget approach and optimization of fertilizer management in
almond' that has established the scale and timing of N demand in almond. Better understanding
of the physiology and phenology of root growth and nitrogen uptake gained through this project
is essential to the optimization of N application strategies.
In California, almonds are the most important tree crop species and are California’s most
valuable export crop. Greater than 78% of almond growers currently provide N fertilization
generally as fertigated product; however there has been very little research to explicitly optimize
the use of fertilizers and to use the available fertigation systems to optimize nutrient use
efficiency and to develop best fertilizers management practice. A recent survey of almond
growers in California illustrated that most growers are dissatisfied with their current nutrient
management practices and wanted greater information on the integration of irrigation and
fertilization.
Optimal fertilization practice can only be developed if knowledge of the 4 R’s (right source, right
rate, right place, and right time) are explicitly developed for the Almond production context. To
optimize nutrient use efficiency in fertigated almond it is essential that fertilizers injected into
irrigation system are provided at the optimal concentration and time to ensure that deposition
patterns coincide with maximal root nutrient uptake. Unfortunately we have very little
information to make these decisions and under the best of current practice growers merely
attempt to inject fertilizers into irrigation sets so that the fertilizer band is ‘deposited’ in the
middle of the vertical wetted zone. To date, there has been no explicit attempt to optimize the use
of fertigation for almond nutrition from the perspective of plant biology and soil physics. In
order to optimize fertigation in almond, information on the spatial and temporal distribution of
nutrients and active roots in the soil profile, and knowledge of seasonal crop nutrient demand
patterns is required.
Root nitrogen uptake characteristics have been well documented under controlled conditions in a
wide range of species such as barley and corn (Kochian and Lucas, 1982; Siddiqi, Glass et al.,
1990) and shown to be determined by nutrient concentration in soil, and plant demand. In trees,
most of the attempts to measure nutrient uptake have been conducted using seedlings (Kelly and
Barber, 1991; Kronzucker, Siddiqi et al., 1997) , which may not represent the condition in the
field. In field experiments most of research has been focused in forest and ecological systems
(Kronzucker, Siddiqi et al., 1995; BassiriRad, Prior et al., 1999; Yanai, McFarlane et al., 2009).
This work has yielded valuable information of nutrient uptake at the root scale, and has
concluded that uptake of a specific nutrient will depend on nutrient concentration in the medium
and the demand of the plant for that specific nutrient at a determined time. To our knowledge
there has been no attempt to measure and characterize nutrient uptake at the root scale in Almond
trees in a field setting.
To develop fertilization best practices, knowledge of root phenology and nutrient uptake
behavior and patterns of crop demand is a prerequisite. To effectively fertigate information on

the biology and phenology of roots and uptake must then be integrated with fertigation system
design (micro-sprinkler, drip, volume, distribution pattern etc), soil type and fertilizer source
across the season. To address this complexity, computer models have been used to theoretically
optimize the localization of water in the rooting profile with both soil and system specificity
using the HYDRUS program (Andreu, Hopmans et al., 1997, Simunek et al, 1999; Gardenas,
Hopmans et al., 2005). Currently the HYDRUS model uses generalized estimates of root uptake
and crop demand that are derived from cereal crops and their relevance to tree crops is unknown.
While HYDRUS-2D has great potential as management tool, modeling results remain only
theoretical until results are compared with experimental field data by way of long term
monitoring under field-established treatments with a broad range in irrigation water application
and soil water stress conditions. The current proposal is designed to provide much of the
experimental root nutrient uptake and distribution data that the model needs to function. The root
nutrient uptake parameters obtained in the field and in the greenhouse settings will ‘feed’ the
model in order to perform future simulations and obtain the best fertilization practice to provide
growers with guidelines to optimize production and reduce environmental impacts.
E. Work Description
In order to achieve the objectives proposed in this project, two experimental trials have
been used contrasting different rates of nitrogen (N), fertigation methods and irrigation
methods.
1 Nitrogen rate experiment
The trees used in this proposed experiment have been selected from among those
currently under investigation in related Board and FREP Projects
(Brown/Smart/Sanden/Hopmans). The orchard is a high producing 13 year old
Nonpareil/Monterey planting located south of Lost Hills in Kern County. The existing
experiments provides preliminary individual tree data on yield, soil and plant water
(neutron probe and plant based), plant nutrient status (5 in-season leaf samples), tree
nutrient demand (sequential crop estimation and determination), leaf area index and
photosynthesis and Et0. The ongoing project of Brown has already established very clear
differences in crop yield and nitrogen demand and represents an ideal field site for this
work.
The treatments are described in table 1.

Table 1. Treatments utilized in the current project. Selected trees within RCBD with 6 x 15 tree
replicates per treatment.
Treatment N source N amount (lbs/ac)
A UAN32 125
B UAN32 200
C UAN32 275
D UAN32 350
2 Fertigation method experiment
The effect of fertigation technique (pulsed, continuous, drip, microjet) will be examined
in a subset of trees in the same orchard as above (Table 2) established in 2011.
Table 2. Fertigation treatments in the ongoing project. Selected trees within RCBD with
4 x 7 tree replicates per treatment.
Treatment N source K source Irrigation
Method
Fertilization method
E 100% UAN32 100% SOP Fanjet 4 fertigation events /
year
F 100% UAN32 60% SOP / 40% KTS Fanjet Continuous
(fertilization in each
irrigation
G 100% UAN32 100% SOP Drip 4 fertigation events /
year
H 100% UAN32 100% SOP Drip 4 fertigation events /
year
Task 1 / Objective 1: Determine almond root growth and phenology. Characterize root
distribution and nutrient uptake activity as influenced by tree nitrogen status, irrigation
source, yield and plant characteristics.
Forty minirhizotron access tubes were installed in both experimental trials to follow root
phenology (root flushes, root lifespan, growth, etc.) over multiple seasons under four
fertilization regimes. Root images have been collected during the 2012 and 2013 season
in 2 week basis and with less intensity in 2014. Images will be analyzed recording
number of roots, color, diameter and length. Image analysis was conducted in 2014 to
generate the graphs seen here. Additional analysis of the >300 hours of root growth
images will be conducted independent of this project in 2015/16.
Individual trees have been analyzed for leaf nutrient analysis, yield, nut size and crackout
percentage and contrasted among treatments (completed Dec 2014).
Task 2/ Objective 2: Determination of the patterns and biological dynamics (Km, Vmax,
Cmin/max) of tree nutrient uptake and the relationship to tree demand and phenology.
A total of 80 root bags filled with media were installed in the different treatments and N
uptake was measured in excised roots. The relationship between the parameters of root N
uptake and tree demand will be determined once yield and N content are obtained by leaf
and nut sampling at harvest. In addition, 72 soil solution access tubes (SSAT,
“lysimeters”) have been installed in each treatment at 3 depths (30, 60, 90 cm) in order to
sample soil solution and measure nitrate (NO3) concentration and transport through the
soil profile at each fertigation event. Data collection commenced in 2012. In 2013, and
2014 we repeated these experiments to address issues of excessive variability and to
increase the range and intensity of uptake measurements (completed Dec 2014). Very
considerable variability in experimental results compromised our ability to develop
specific biological parameters. To compensate for this difficulty we modified objective 3
as outlined below.
Task 3/Objective 3: Integrate root phenology and uptake data into the HYDRUS 2D model to
help interpret and extend findings to a wider range of soil, irrigation and demand scenarios.
The results obtained from the above tasks will be used to calibrate, validate and refine simulation
models that can predict soil and nutrient transport, as well as nutrient uptake. The model will be
used to perform simulations under different irrigation and fertilization practices. Data derived
from the CDFA FREP funded project of Hopmans is being integrated with the results derived in
this experiment to improve the modeling capability of HYDRUS. Results of the nitrate parameter
determination introduced two complexities to this task that are not yet resolved. 1) There was
very considerable variability in determination of soil nitrate concentrations and plant nitrate
uptake parameters, 2) Plant nitrate uptake parameters are strongly determined by soil nitrate
concentrations prevalent at time of sampling and change rapidly as soil nitrate changes. These
two results add great complexity to Hydrus modeling that must be resolved under more highly
controlled environments with more detailed measurement strategies. This is underway in a
separate FREP project. Modifications to the original objectives 2 and 3 were added to
compensate for our inability to resolve the biological parameters and develop Hydrus modeling
strategies. A new experiment (Fertigation Strategy) described in Table 2 was initiated to
replicate two typical fertigation strategies with the goal of developing semi-empirical
information on the integrated effects of root distribution, tree N demand and fertilization strategy
on the movement of nitrate through soils.
Task 4/Objective 4: Publication and extension of results.
This research is of use to growers, consultants and regulators. At the most fundamental level we
are attempting to provide information to answer the question “how do I integrate nutrients into
my irrigation regime to maximize efficiency of nutrient use”. With the information of root
growth patterns and phenology, nutrient concentrations that result in optimum uptake, the
interaction between above ground demand and nutrient uptake and the interactive effects of
water movement and solute flow under diverse soil and irrigation schemes; we will be able to
determine the best time and place for nutrients and therefore, minimize nutrient losses. In the
short term the information derived on root uptake and distribution, nutrient efficiency and
concentrations and patterns of annual demand represent valuable individual outcomes that can be
extended directly to growers.
This project will be integrated with results derived from recently completed almond and
pistachio nutrient budget projects to provide and integrated practice for fertilization rate and
management. Data from this project forms an integral part of the ongoing CDFA/UC/CAPCA N
Workshop Training series for CCA’s and has informed the development of new N management
guidelines.
F. Results And Discussion
1 Root Growth
Patterns of root growth derived from the minirhizotron tubes are shown in figures 1 and 2, and
show the pattern of root growth over the season. Irrespective of year, experiment or treatments,
almond roots showed a consistent growth pattern with a dual cycle, with the majority of new
roots being produced at two growth phases during the year (spring and fall). Spring root growth,
occurring from mid-March to June was significantly higher than the fall growth, mainly
occurring from mid-September to December. New root growth was very limited from Jun
through September when maximal carbon demand for growing nuts occurred. There was very
little root growth prior to leaf out with the predominant root growth period occurring after full
leaf out. This result and results of prior experiments on whole tree nitrogen uptake verify that
there is very little uptake of N from soil prior to leaf out in almonds.

Figure 1 Number of new roots produced during the growing season in Experiment 1: N rate
experiment. Note differences in scale used in these figures.
While the pattern of new root growth did not vary from year to year or between experiments the
total amount of roots produced per season varied significantly from year to year (figure 1: note
scales). Root growth in 2012 was significantly greater than in 2013. The reason for this is
uncertain however it should be noted that yield in 2011 was exceptionally high (>4500 lbs acre)
while in 2012 it was exceptionally low (900 lbs acre). The higher root growth in 2012 coincided
with a very low fruit load suggesting that competition between shoots and roots defines the rate
of new root growth. Interestingly this enhanced root growth occurred following an exceptionally
high yield year during which tree carbohydrate reserves would have been severely depleted.
This implies that new root growth is not dependent upon prior year carbohydrate storage.
Similarly, the lower root growth observed in 2013 coincided with good fruit yield (3,500 lbs)
further suggesting that current fruit load influences root growth. To further explore the
relationship between yield and root growth a simple linear regression between yield and total
2012
0
25
50
75
Jan Feb Mar Apr May Jun Jul Aug Sep Oct Nov Dec Jan
Ne
w r
oo
t p
rod
uctio
n (r
oo
ts m
2 d
ay
1)
NitrogenTreatment
140 kg ha1
224 kg ha1
309 kg ha1
392 kg ha1
2013
a
ab
b
a
ab
b
a
bb
a
bb0
5
10
Jan Feb Mar Apr May Jun Jul Aug Sep Oct Nov Dec Jan
Ne
w r
oo
t p
rod
uctio
n (r
oo
ts m
2 d
ay
1)

amount of roots was performed (figure 3) and results showed that when yields are high, root
production is low.
Figure 2 Number of new roots produced during the growing season in Experiment 2: Nitrogen
Fertigation experiment.
2012
0
50
100
150
200
Jan Feb Mar Apr May Jun Jul Aug Sep Oct Nov Dec Jan
Ne
w r
oo
t p
rod
uctio
n (r
oo
ts m
2 d
ay
1)
NitrogenTreatment
Continuous-Drip
Continuous-Fanjet
Standard-Drip
Standard-Fanjet
2013
0
10
20
30
40
Jan Feb Mar Apr May Jun Jul Aug Sep Oct Nov Dec Jan
Ne
w r
oo
t p
rod
uctio
n (r
oo
ts m
2 d
ay
1)
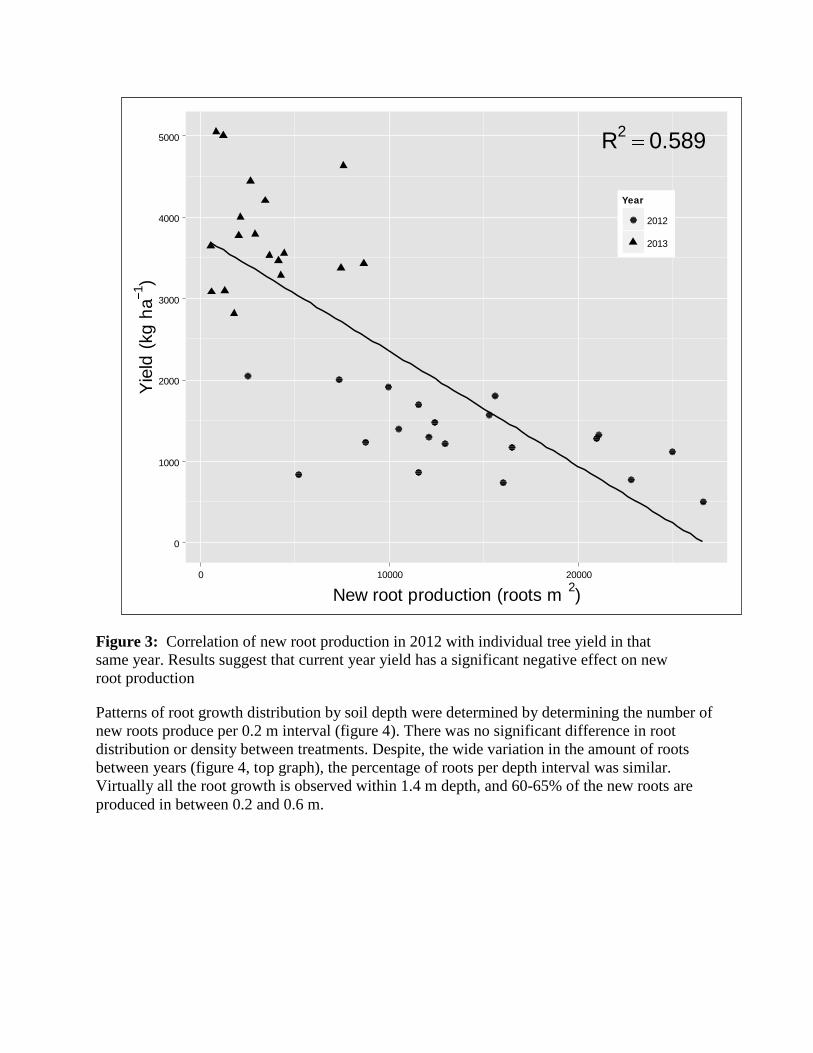
Figure 3: Correlation of new root production in 2012 with individual tree yield in that
same year. Results suggest that current year yield has a significant negative effect on new
root production
Patterns of root growth distribution by soil depth were determined by determining the number of
new roots produce per 0.2 m interval (figure 4). There was no significant difference in root
distribution or density between treatments. Despite, the wide variation in the amount of roots
between years (figure 4, top graph), the percentage of roots per depth interval was similar.
Virtually all the root growth is observed within 1.4 m depth, and 60-65% of the new roots are
produced in between 0.2 and 0.6 m.
R2
0.589
0
1000
2000
3000
4000
5000
0 10000 20000
New root production (roots m2)
Yie
ld (
kg
ha
1)
Year
2012
2013

Figure 4: Root production with depth over two years expressed as total new root length
per meter square of soil surface (top) and as percent of total root length (bottom).
2 Nitrate Uptake by roots
Determination of the impact of fertilization rate on root nitrate uptake under controlled
conditions was compromised by an extreme variability in the results, nevertheless some
valuable trends were observed. Experiments conducted in 2012 were repeated in 2013 at
0 2000 4000 6000 8000
0.00-0.20
0.20-0.40
0.40-0.60
0.60-0.80
0.80-1.00
1.00-1.20
1.20-1.40
Depth
(m
)New root production (roots m
2)
0 10 20 30 40
0.00-0.20
0.20-0.40
0.40-0.60
0.60-0.80
0.80-1.00
1.00-1.20
1.20-1.40
Depth
(m
)
Percent of total roots produced (%)
Year
2012
2013
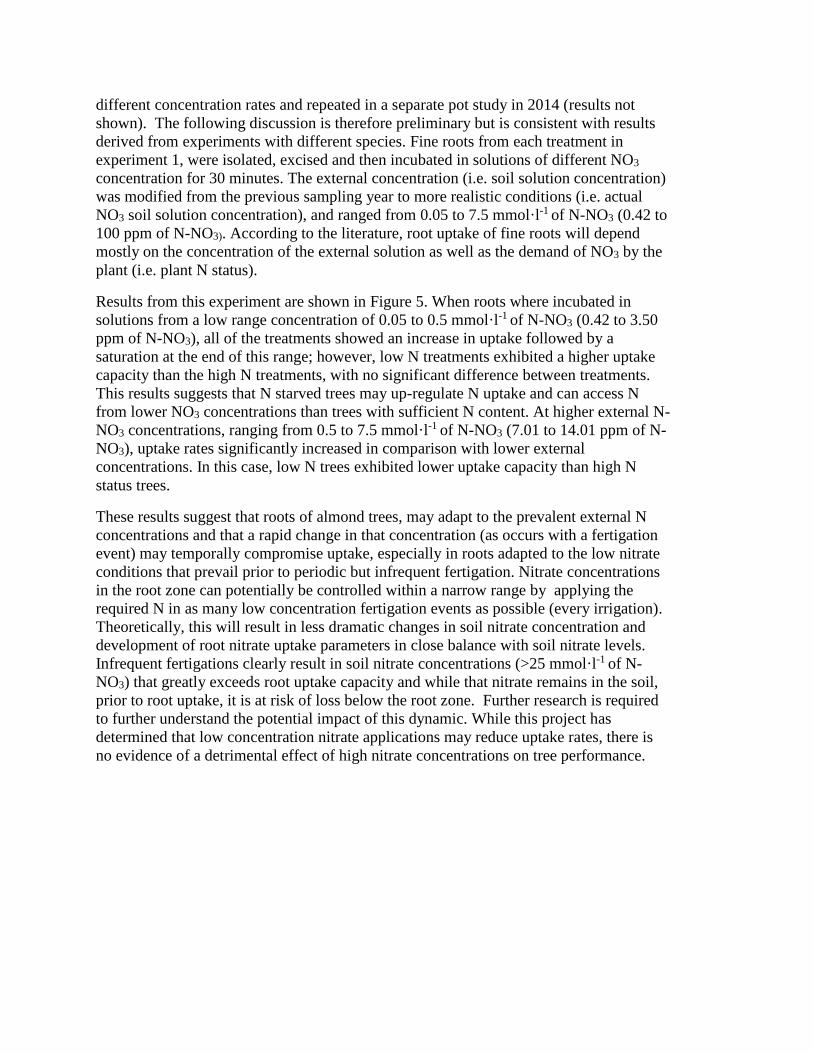
different concentration rates and repeated in a separate pot study in 2014 (results not
shown). The following discussion is therefore preliminary but is consistent with results
derived from experiments with different species. Fine roots from each treatment in
experiment 1, were isolated, excised and then incubated in solutions of different NO3
concentration for 30 minutes. The external concentration (i.e. soil solution concentration)
was modified from the previous sampling year to more realistic conditions (i.e. actual
NO3 soil solution concentration), and ranged from 0.05 to 7.5 mmol·l-1 of N-NO3 (0.42 to
100 ppm of N-NO3). According to the literature, root uptake of fine roots will depend
mostly on the concentration of the external solution as well as the demand of NO3 by the
plant (i.e. plant N status).
Results from this experiment are shown in Figure 5. When roots where incubated in
solutions from a low range concentration of 0.05 to 0.5 mmol·l-1 of N-NO3 (0.42 to 3.50
ppm of N-NO3), all of the treatments showed an increase in uptake followed by a
saturation at the end of this range; however, low N treatments exhibited a higher uptake
capacity than the high N treatments, with no significant difference between treatments.
This results suggests that N starved trees may up-regulate N uptake and can access N
from lower NO3 concentrations than trees with sufficient N content. At higher external N-
NO3 concentrations, ranging from 0.5 to 7.5 mmol·l-1 of N-NO3 (7.01 to 14.01 ppm of N-
NO3), uptake rates significantly increased in comparison with lower external
concentrations. In this case, low N trees exhibited lower uptake capacity than high N
status trees.
These results suggest that roots of almond trees, may adapt to the prevalent external N
concentrations and that a rapid change in that concentration (as occurs with a fertigation
event) may temporally compromise uptake, especially in roots adapted to the low nitrate
conditions that prevail prior to periodic but infrequent fertigation. Nitrate concentrations
in the root zone can potentially be controlled within a narrow range by applying the
required N in as many low concentration fertigation events as possible (every irrigation).
Theoretically, this will result in less dramatic changes in soil nitrate concentration and
development of root nitrate uptake parameters in close balance with soil nitrate levels.
Infrequent fertigations clearly result in soil nitrate concentrations (>25 mmol·l-1 of N-
NO3) that greatly exceeds root uptake capacity and while that nitrate remains in the soil,
prior to root uptake, it is at risk of loss below the root zone. Further research is required
to further understand the potential impact of this dynamic. While this project has
determined that low concentration nitrate applications may reduce uptake rates, there is
no evidence of a detrimental effect of high nitrate concentrations on tree performance.
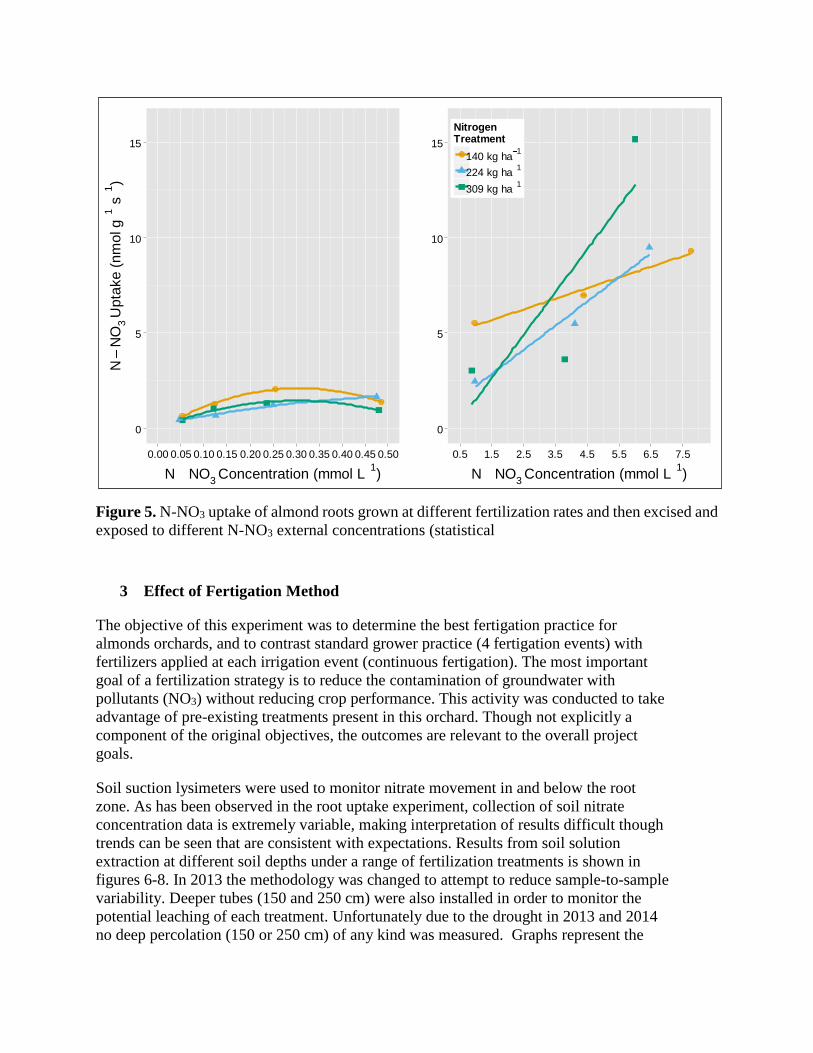
Figure 5. N-NO3 uptake of almond roots grown at different fertilization rates and then excised and
exposed to different N-NO3 external concentrations (statistical
3 Effect of Fertigation Method
The objective of this experiment was to determine the best fertigation practice for
almonds orchards, and to contrast standard grower practice (4 fertigation events) with
fertilizers applied at each irrigation event (continuous fertigation). The most important
goal of a fertilization strategy is to reduce the contamination of groundwater with
pollutants (NO3) without reducing crop performance. This activity was conducted to take
advantage of pre-existing treatments present in this orchard. Though not explicitly a
component of the original objectives, the outcomes are relevant to the overall project
goals.
Soil suction lysimeters were used to monitor nitrate movement in and below the root
zone. As has been observed in the root uptake experiment, collection of soil nitrate
concentration data is extremely variable, making interpretation of results difficult though
trends can be seen that are consistent with expectations. Results from soil solution
extraction at different soil depths under a range of fertilization treatments is shown in
figures 6-8. In 2013 the methodology was changed to attempt to reduce sample-to-sample
variability. Deeper tubes (150 and 250 cm) were also installed in order to monitor the
potential leaching of each treatment. Unfortunately due to the drought in 2013 and 2014
no deep percolation (150 or 250 cm) of any kind was measured. Graphs represent the
0
5
10
15
0.00 0.05 0.10 0.15 0.20 0.25 0.30 0.35 0.40 0.45 0.50
N NO3
Concentration (mmol L
1)
NN
O3
Upta
ke (
nm
ol g
1 s
1)
0
5
10
15
0.5 1.5 2.5 3.5 4.5 5.5 6.5 7.5
N NO3
Concentration (mmol L
1)
NitrogenTreatment
140 kg ha1
224 kg ha1
309 kg ha1

maximal N-NO3 concentration measured over the season in 2013. The treatments were as
follows:
C300-200KN = Fertilizer applied in every irrigation event in proportion to seasonal
demand. 200 lbs acre K provided as potassium nitrate and 193 lbs N as UAN (total N 300
lbs)
C300-200KN = Fertilizer applied in every irrigation event in proportion to seasonal
demand. 200SOP. 200 lbs acre K provided as potassium sulfate and 300 lbs N as UAN.
C300-275KN = Fertilizer applied in every irrigation event in proportion to seasonal
demand. 125 lbs acre K provided as potassium sulfate and 75 lbs K provided as
potassium nitrate. 273 lbs N provided as UAN (total N 300 lbs).
F300-275KN = Fertilizer applied in four fertigation events (March (20%), late April
(30%), late May, early July) in proportion to seasonal demand. 125 lbs acre K provided
as potassium sulfate and 75 lbs K provided as potassium nitrate. 273 lbs N provided as
UAN (total N 300 lbs).
The following analysis of N movement through soils as monitored by suction lysimeter
was performed immediately following the late May fertilization event. Prior to that date
all treatments had received 80 lbs of N. Continous fertigation treatments (C) had received
that amount distributed in 3 fertigation events while the fertigation (F) treatment had
received 80lbs in a single fertigation event March 11th. On May 23rd, C treatments
received 20 lbs of N (representing 1/5th of the May through July fertilizer demand, with
the remaining 4/5th to be applied in 4 subsequent irrigation events prior to July
fertilization) while F treatments received 100 lbs of N (representing the entire May – July
N demand). This approach was designed to replicate field practice and contrast
continuous with periodic fertigation management.
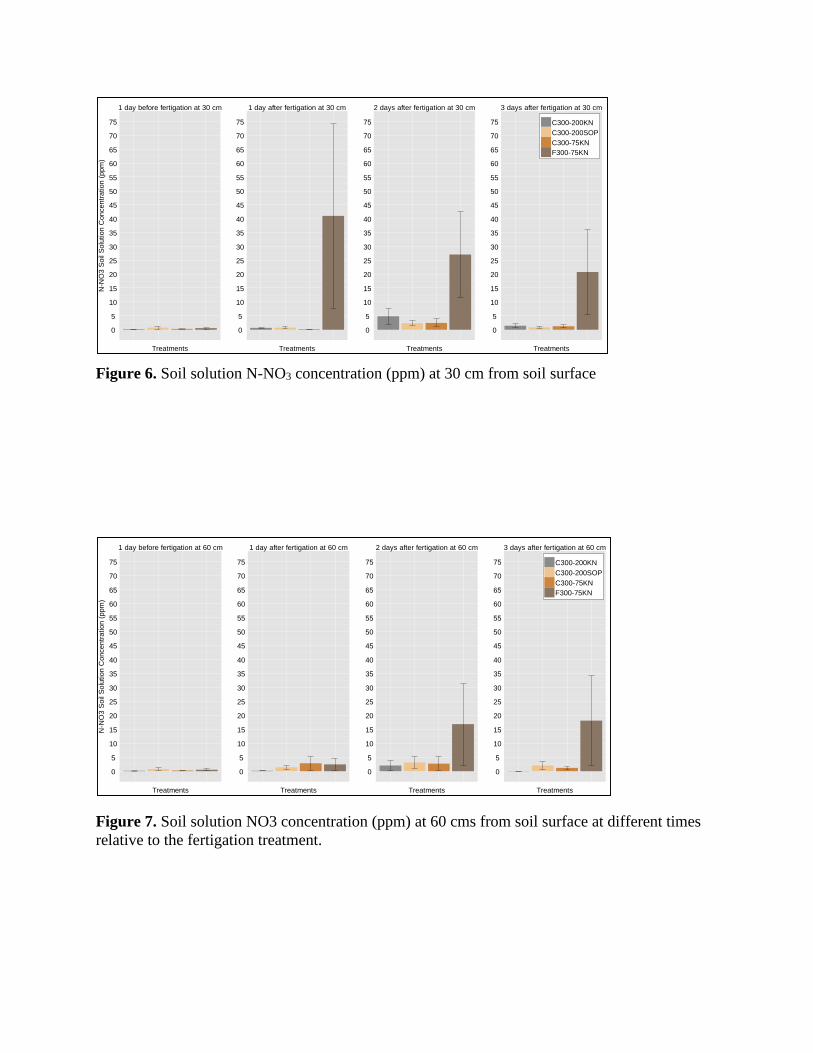
Figure 6. Soil solution N-NO3 concentration (ppm) at 30 cm from soil surface
Figure 7. Soil solution NO3 concentration (ppm) at 60 cms from soil surface at different times
relative to the fertigation treatment.
0
5
10
15
20
25
30
35
40
45
50
55
60
65
70
75
1 day before fertigation at 30 cm
Treatments
N-N
O3 S
oil
Solu
tion C
oncentr
ation (
ppm
)
0
5
10
15
20
25
30
35
40
45
50
55
60
65
70
75
1 day after fertigation at 30 cm
Treatments
0
5
10
15
20
25
30
35
40
45
50
55
60
65
70
75
2 days after fertigation at 30 cm
Treatments
0
5
10
15
20
25
30
35
40
45
50
55
60
65
70
75
3 days after fertigation at 30 cm
Treatments
C300-200KN
C300-200SOP
C300-75KN
F300-75KN
0
5
10
15
20
25
30
35
40
45
50
55
60
65
70
75
1 day before fertigation at 60 cm
Treatments
N-N
O3
So
il S
olu
tio
n C
on
ce
ntr
atio
n (
pp
m)
0
5
10
15
20
25
30
35
40
45
50
55
60
65
70
75
1 day after fertigation at 60 cm
Treatments
0
5
10
15
20
25
30
35
40
45
50
55
60
65
70
75
2 days after fertigation at 60 cm
Treatments
0
5
10
15
20
25
30
35
40
45
50
55
60
65
70
75
3 days after fertigation at 60 cm
Treatments
C300-200KN
C300-200SOP
C300-75KN
F300-75KN
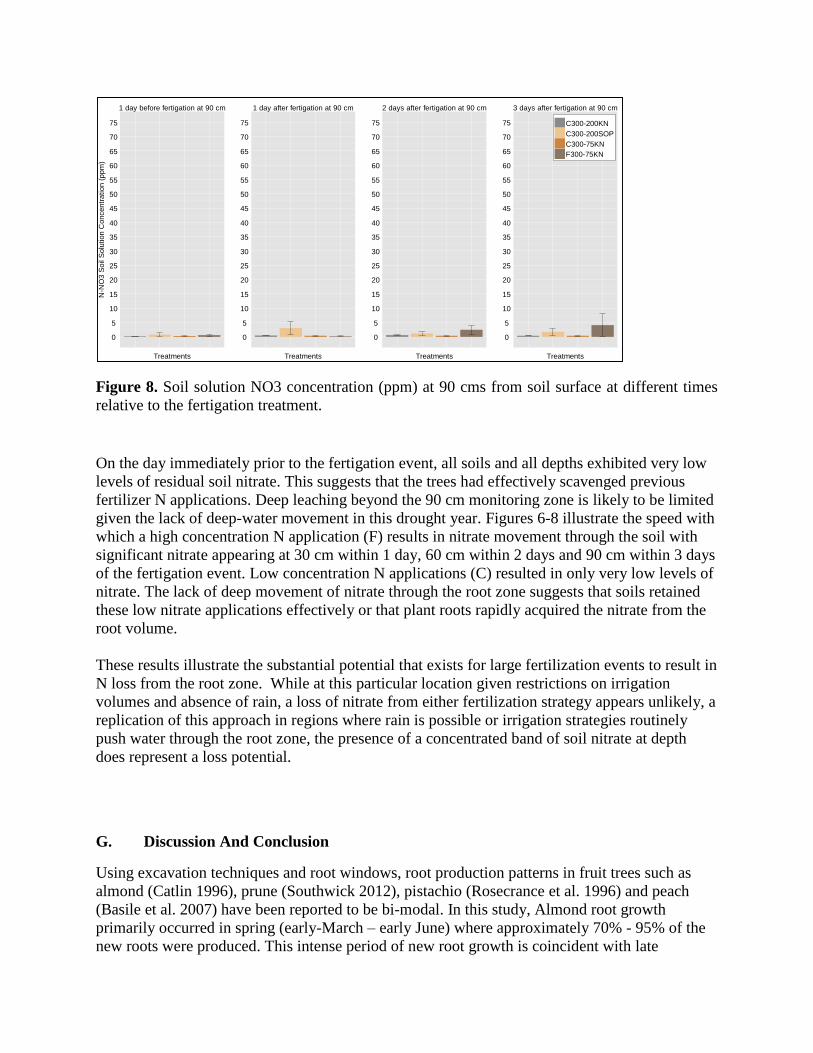
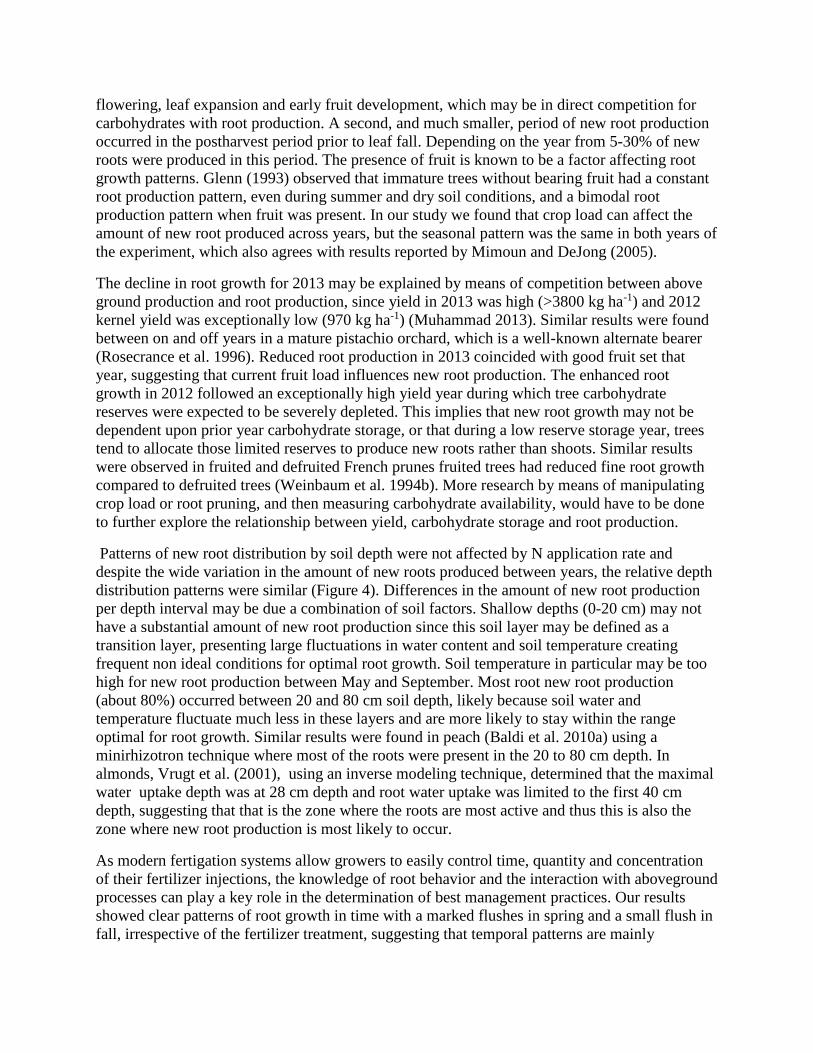
Figure 8. Soil solution NO3 concentration (ppm) at 90 cms from soil surface at different times
relative to the fertigation treatment.
On the day immediately prior to the fertigation event, all soils and all depths exhibited very low
levels of residual soil nitrate. This suggests that the trees had effectively scavenged previous
fertilizer N applications. Deep leaching beyond the 90 cm monitoring zone is likely to be limited
given the lack of deep-water movement in this drought year. Figures 6-8 illustrate the speed with
which a high concentration N application (F) results in nitrate movement through the soil with
significant nitrate appearing at 30 cm within 1 day, 60 cm within 2 days and 90 cm within 3 days
of the fertigation event. Low concentration N applications (C) resulted in only very low levels of
nitrate. The lack of deep movement of nitrate through the root zone suggests that soils retained
these low nitrate applications effectively or that plant roots rapidly acquired the nitrate from the
root volume.
These results illustrate the substantial potential that exists for large fertilization events to result in
N loss from the root zone. While at this particular location given restrictions on irrigation
volumes and absence of rain, a loss of nitrate from either fertilization strategy appears unlikely, a
replication of this approach in regions where rain is possible or irrigation strategies routinely
push water through the root zone, the presence of a concentrated band of soil nitrate at depth
does represent a loss potential.
G. Discussion And Conclusion
Using excavation techniques and root windows, root production patterns in fruit trees such as
almond (Catlin 1996), prune (Southwick 2012), pistachio (Rosecrance et al. 1996) and peach
(Basile et al. 2007) have been reported to be bi-modal. In this study, Almond root growth
primarily occurred in spring (early-March – early June) where approximately 70% - 95% of the
new roots were produced. This intense period of new root growth is coincident with late
0
5
10
15
20
25
30
35
40
45
50
55
60
65
70
75
1 day before fertigation at 90 cm
Treatments
N-N
O3
So
il S
olu
tio
n C
on
ce
ntr
atio
n (
pp
m)
0
5
10
15
20
25
30
35
40
45
50
55
60
65
70
75
1 day after fertigation at 90 cm
Treatments
0
5
10
15
20
25
30
35
40
45
50
55
60
65
70
75
2 days after fertigation at 90 cm
Treatments
0
5
10
15
20
25
30
35
40
45
50
55
60
65
70
75
3 days after fertigation at 90 cm
Treatments
C300-200KN
C300-200SOP
C300-75KN
F300-75KN
flowering, leaf expansion and early fruit development, which may be in direct competition for
carbohydrates with root production. A second, and much smaller, period of new root production
occurred in the postharvest period prior to leaf fall. Depending on the year from 5-30% of new
roots were produced in this period. The presence of fruit is known to be a factor affecting root
growth patterns. Glenn (1993) observed that immature trees without bearing fruit had a constant
root production pattern, even during summer and dry soil conditions, and a bimodal root
production pattern when fruit was present. In our study we found that crop load can affect the
amount of new root produced across years, but the seasonal pattern was the same in both years of
the experiment, which also agrees with results reported by Mimoun and DeJong (2005).
The decline in root growth for 2013 may be explained by means of competition between above
ground production and root production, since yield in 2013 was high (>3800 kg ha-1) and 2012
kernel yield was exceptionally low (970 kg ha-1) (Muhammad 2013). Similar results were found
between on and off years in a mature pistachio orchard, which is a well-known alternate bearer
(Rosecrance et al. 1996). Reduced root production in 2013 coincided with good fruit set that
year, suggesting that current fruit load influences new root production. The enhanced root
growth in 2012 followed an exceptionally high yield year during which tree carbohydrate
reserves were expected to be severely depleted. This implies that new root growth may not be
dependent upon prior year carbohydrate storage, or that during a low reserve storage year, trees
tend to allocate those limited reserves to produce new roots rather than shoots. Similar results
were observed in fruited and defruited French prunes fruited trees had reduced fine root growth
compared to defruited trees (Weinbaum et al. 1994b). More research by means of manipulating
crop load or root pruning, and then measuring carbohydrate availability, would have to be done
to further explore the relationship between yield, carbohydrate storage and root production.
Patterns of new root distribution by soil depth were not affected by N application rate and
despite the wide variation in the amount of new roots produced between years, the relative depth
distribution patterns were similar (Figure 4). Differences in the amount of new root production
per depth interval may be due a combination of soil factors. Shallow depths (0-20 cm) may not
have a substantial amount of new root production since this soil layer may be defined as a
transition layer, presenting large fluctuations in water content and soil temperature creating
frequent non ideal conditions for optimal root growth. Soil temperature in particular may be too
high for new root production between May and September. Most root new root production
(about 80%) occurred between 20 and 80 cm soil depth, likely because soil water and
temperature fluctuate much less in these layers and are more likely to stay within the range
optimal for root growth. Similar results were found in peach (Baldi et al. 2010a) using a
minirhizotron technique where most of the roots were present in the 20 to 80 cm depth. In
almonds, Vrugt et al. (2001), using an inverse modeling technique, determined that the maximal
water uptake depth was at 28 cm depth and root water uptake was limited to the first 40 cm
depth, suggesting that that is the zone where the roots are most active and thus this is also the
zone where new root production is most likely to occur.
As modern fertigation systems allow growers to easily control time, quantity and concentration
of their fertilizer injections, the knowledge of root behavior and the interaction with aboveground
processes can play a key role in the determination of best management practices. Our results
showed clear patterns of root growth in time with a marked flushes in spring and a small flush in
fall, irrespective of the fertilizer treatment, suggesting that temporal patterns are mainly

controlled by environmental factors. Furthermore, root spatial patterns observed in our findings,
and confirmed by other publications, showed that most of the active roots are confined within 80
cm depth, which is essential in proper water and nutrient management.
While it must be cautioned that data from uptake studies was highly variable results didsuggest
that N starved trees can up-regulate N uptake and can access N from lower NO3 concentrations
than trees with sufficient N content. Trees pretreated with high N application showed a low
capacity to absorb low concentrations of NO3 and at the lowest NO3 concentration (0.42 ppm) a
net efflux of NO3 from the roots system to the solution was observed. At high NO3 concentration
ranges (7.01 to 14.01 ppm of NO3) however, low N trees exhibited lower uptake capacity than
high N status trees.
The measurement of soil solution NO3- is notoriously difficult and inconsistent and in this
experiment we observed extremely variable soil NO3-concnetrations following application of
fertilizer N. Nevertheless clear effects of fertilizer strategy on soil NO3- were observed. The
application of a smaller number of fertilizer events, in this instance fertilization in 4 events
during the year (F), resulted in a substantially greater soil NO3- concentration and a rapid
movement of that NO3- through the soil profile than the application of a lower NO3
- in every
irrigation event (C). This is undoubtedly a consequence of the higher NO3- applied in the F
treatment however this is consistent with what would occur in this contrast under field
conditions. The persistence of a higher and deeper soil solution NO3- pulse does represent a
potential loss event if this pulse were to be followed by excessive irrigation or rain. Further
research on the relative mobility of NO3- under low and high NO3
- conditions and the impact on
root uptake parameters would need to be conducted. The application of the soil flux model
Hydrus would also be useful in estimating the relative risk of NO3- to leaching under each of
these scenarios.
In summary this project has demonstrated that the peak root activity (capacity soil exploration
and nutrient uptake) occurs in April through June when root proliferation and tree demand for
nutrients is greatest. Roots are concentrated in the soil zone 20-80 cm depth. The late season root
flush (September) may also provide an opportunity for nutrient uptake, though tree demand for N
following harvest is minimal. Roots appear to adapt to the prevalent soil NO3- status and tree N
status by altering the NO3- uptake parameters (Vmax, Km, Cmin), thus suggesting that the
maintenance of a constant soil NO3- application adequate to satisfy but not oversupply tree N
demand is preferable to infrequent N applications in which soil NO3- concentrations fluctuate
dramatically. Data from the fertigation treatments imposed here further suggest that the potential
for large concentration fluctuations and deep NO3- movement increases under infrequent but high
concentration NO3- applications in contrast to constant low NO3
- concentration fertigation.
Additional quantitative analyses are underway to better characterize the parameters of NO3-
uptake for use in Hydrus modeling. It is also unknown how quickly almond roots adapt to
changing soil NO3- concentrations. Supplemental experimentation is underway and results are in
preparation for publication.
I: Outreach Activities Summary

Below you can find a partial list of outreach activities in which results from this project has been
presented.
A. Brown, P. 2012. Management of N in Almonds. CDFA-FREP and WPHA Annual
Workshop. Modesto CA. 400 atten. Expert Panel Member presentation and
discussion.
B. Brown, P. 2012. Nutrient Budget and development of new sampling strategies for N
management. Northern San Joaquin Almond Day. Merced CA. 420 atten.
C. Sanden, B. 2012. "Irrigation Management to Maximize Almond Production in the
SJV", Organic Almond Farming Workshop, Selma CA. 64 atten.
D. Sanden, B. 2012. Kern almond meeting, irrigation management and workshop. Kern
Soil and Water Newsletter.
E. Sanden, B. et al. 2012. Almond Workgroup Tour, Kern County.
F. Brown, P. 2012. Nutrient Management of Almonds. Almond Board of
California: Sacramento CA.1800 atten.
G. Western Nutrient Management Meeting, California Agronomy Society Meeting,
Reno, March 7th, 2013. Managing Nitrogen in Orchards'.
H. Western Nutrient Management Meeting, CASS Meeting, Reno, March 7th, 2013
I. Brown, P. 2011. Update on Nutrient Management of Almonds. Almond Board
of California:Modesto CA.1800 atten. Brown, P. 2011. CDFA-FREP Annual
Conference. Management of N in Tree Crops. Paso Robles CA. 300 atten.
J. Brown, P. 2013. Nitrogen workshop. Almond Board of California: Sacramento
CA.400 atten.
K. Olivos, A. 2013. Determination of Root Distribution and Physiological Parameters
of Nitrogen Uptake in Almonds to Optimize Fertigation Practices. Poster
presentation. Almond Board of California: Sacramento CA. 1800 atten.
L. Olivos, A. 2014. Determination of Root Distribution and Physiological Parameters
of Nitrogen Uptake in Almonds to Optimize Fertigation Practices. Poster
presentation. Almond Board of California: Sacramento CA. 1800 atten
M. Brown, P H. Nitrogen Training Workshop for CCA’s. 140 minute and 120 minute
presentation. Fresno, Jan 13, 2014 (145 attendees): Woodland, Feb 18. 75 attendees;
Fresno Feb 25th (120 attendees); Tulare, March 12th (135 attendees).
N. Brown and Olivos, A. 2014. Determination of Root Distribution and Physiological
Parameters of Nitrogen Uptake in Almonds to Optimize Fertigation Practices. FREP
Conference. Modesto Oct 29-30th. (150 attendees)
J. Factsheet
1. Title: Determination of root distribution, dynamics, phenology and physiology of almonds to
optimize fertigation practices.
2. FREP Grant Number: 11-0461-SA
3. Project Leader:
Patrick Brown
Professor
Department of Plant Sciences
One Shields Ave., University of California
Davis, CA 95616-8683
(530) 752-0929
4. Period: 1/2012 – 12/2014
5. Locations: Paramount Farms, Belridge and Davis, Campus.
6. County: Kern County and Yolo County
7. Highlights:
The main period of root growth commences in April and is complete by early June, a
secondary flush of roots may also occur in October. The majority of active almond roots
are present in the 20-80 cm root depth.
Evidence suggests that the key parameters of root nitrate uptake are determined by the N
status of the tree, hence N replete trees are less capable of taking nitrate from low nitrate
concentration soils.
Application of nitrogen at lower concentrations in all irrigation events results eliminates
periods of persistently high soil nitrate and may reduce the risk of nitrate loss.
8. Introduction:
Optimal fertilization practice can only be developed if knowledge of the 4 R’s (right source, right
rate, right place, and right time) are explicitly developed for the Almond production context. To
optimize nutrient use efficiency in fertigated almond it is essential that fertilizers injected into
irrigation system are provided at the optimal concentration and time to ensure that deposition
patterns coincide with maximal root nutrient uptake. To effectively fertigate information on the
biology and phenology of roots and uptake must then be integrated with fertigation system
design (micro-sprinkler, drip, volume, distribution pattern, etc.). This project is designed to
provide critical information on root growth and nutrient uptake to provide fundamental
information on root adaptability to changing soil nitrate and the seasonality of root growth in
Almond. A better understanding of the physiology and phenology of root growth and nitrogen
uptake gained through this project is essential to the optimization of N application strategies.
9. Methods
Two long running N treatment experiments in mature almonds were used to determine almond
root characteristics such as nitrate uptake physiology, root phenology and root distribution, under
varying N and fertigation management practices. The seasonal patterns and depth of root growth
were investigated over a 2-year period utilizing soil excavation and mini-rhizotrons. A total of 80
root bags filled with media were installed in the different treatments and N uptake was measured
in excised roots. In addition, 72 soil solution access tubes (SSAT, “lysimeters”) were installed to
sample soil solution and measure nitrate (NO3) concentration and transport through the soil
profile at each fertigation event. A series of fertigation treatments varying in timing and type of
fertigation were instigated to determine the effect of these treatments on plant productivity and
nitrate movement through soils as monitored by suction lysimeters.
10. Findings
This project has demonstrated that the peak root activity (capacity soil exploration and nutrient
uptake) occurs in April through June when root proliferation and tree demand for nutrients is
greatest. Roots are concentrated in the soil zone 20-80 cm depth. The late season root flush
(September) may also provide an opportunity for nutrient uptake, though tree demand for N
following harvest is minimal. Roots appear to adapt to the prevalent soil NO3- status and tree N
status by altering the NO3- uptake parameters (Vmax, Km, Cmin), thus suggesting that the
maintenance of a constant soil NO3- application adequate to satisfy but not oversupply tree N
demand is preferable to infrequent N applications in which soil NO3- concentrations fluctuate
dramatically. It is also unknown how quickly almond roots adapt to changing soil NO3-
concentrations. Data from the fertigation treatments imposed here further suggest that the
potential for large concentration fluctuations and deep NO3- movement increases under
infrequent but high concentration NO3- applications as would occur with fertilizers applied in 4
or less fertigation events. In contrast the application of N fertilizer in every irrigation results in a
constant low NO3- concentration in the fertigation solution and a low concentration in soils.
There was no effect of fertigation method on yields or root growth parameters. Soil suction
lysimeters and field based nitrate uptake measurements are notoriously variable and as a
consequence we did not succeed in definitively characterizing the parameters of NO3- uptake for
use in Hydrus modeling. Additional experimentation is underway.