final report - appendix - state of california · final report - appendix december 30,1999. final...
TRANSCRIPT

Prepared for:
Prepared by:
In Association with:SYSTRA Consulting, Inc.The Duffey CompanyValley Research and Planning Associates
Final Report - Appendix
December 30,1999

Final Report - California High-Speed Rail Corridor Evaluation
Final ReportCalifornia High-Speed Rail CorridorEvaluation
Appendix
Prepared For:
California High-Speed Rail Authority
Prepared By:
Parsons Brinckerhoff Quade & Douglas, Inc.
In Association with:SYSTRA Consulting, Inc.The Duffey CompanyValley Research and Planning Associates
December 30, 1999

Draft Final Report - California High-Speed Rail Corridor Evaluation
TABLE OF CONTENTS
I Introduction I-11.1 Purpose I-11.2 Background I-11.3 Organization I-2
II Assumptions and Parameters II-12.1 Commission Proposed System (Baseline) II-1
Technology II-3Speeds II-4Electrification II-4Double Track/Guideway II-4Grade Separation II-4
2.2 Design Parameters II-5Design Speeds II-5Horizontal Alignment II-5Vertical Alignment II-6Clearance Requirements II-7Right-of-Way Requirements II-7Stations II-8
Station Design Parameters II-82.3 Capital Cost Assumptions II-9
Alignment Costs II-9Track and Guideway Items II-9Earthwork and Related Items II-9Structures, Tunnels and Walls II-10Grade Separations II-10Building Items II-11Rail and Utility Relocation II-11
Right-of-Way Items II-11Environmental Impact Mitigation II-11System Elements II-12
Signaling and Communications Items II-12Electrification Items II-12
Vehicle Costs II-12Support Facility Costs II-12Program Implementation Costs II-12Contingencies II-13Unit Costs II-13
2.4 Baseline Operating/Service Plan II-142.5 Operating and Maintenance (O&M) Cost Assumptions II-15
Non-Power Unit Cost Components II-15Power II-16
2.6 Travel Time Estimates II-17Speeds II-18
2.7 Compatibility Issues II-19FRA Safety Rules II-19Mixed Traffic II-19Other Considerations II-20
Remote Terminals II-20Compliant High-Speed Trainsets II-20Permitting Non-Compliant Trains in Mixed Traffic II-21
HSR Compatibility Assumption II-21Separation II-21Horizontal Separation II-21Vertical Separation II-21
2.8 Potential Freight Services II-22Small Package/Light Container II-22Special Medium-Weight Freight II-22Profile Grades II-23Freight Infrastructure II-23
III Regional Corridor Evaluation III-13.1 Methodology III-13.2 Regional Corridors Studied III-2
San Diego Area Alternatives III-2Inland Corridor III-3LOSSAN Corridor III-3
Los Angeles Area Alternatives III-4Inland Empire III-4Orange County III-5LAX III-5
Tehachapi Crossing III-6Central Valley Alternatives III-7Bay Area Access Alternatives III-8Bay Area Alternatives III-9Stockton-Sacramento Corridor III-10
3.3 Regional Segment Evaluation III-12San Diego Area Alternatives III-13Los Angeles Area Alternatives III-16
Inland Empire III-16Orange County III-19LAX III-20Additional Stations III-21
Tehachapi Crossing III-22Central Valley Alternatives III-25
Central Valley Community Constraints III-28

Draft Final Report - California High-Speed Rail Corridor Evaluation
Bay Area Access Alternatives III-30Reduced Stations III-32
Bay Area Alternatives III-333.4 LOSSAN Corridor Analysis III-40
Improvement Concept III-40Corridor Evaluation III-42
IV Overall Corridor Comparison IV-14.1 Alternative Definition IV-1
Staff Recommended IV-1Authority Option A IV-2Authority Option B IV-2
4.2 Alternative Comparison IV-34.3 Environmental Summary IV-14
Staff Recommended IV-14Authority Option A IV-15Authority Option B IV-16
V Operating Strategy Development V-15.1 Capacity V-15.2 Refined Conceptual Operating/Service Plan V-3
Example Operating Schedule V-55.3 Express Commute Service Analysis V-7
Parameters of Express Commute Service V-7San Diego Area V-8Los Angeles Area V-9San Francisco Bay Area V-10Express Commute Cost Analysis V-11
Separate Vehicles Scenario V-11Integrated Scenario V-11O&M Cost Estimates V-11Capital Cost Estimates V-12Conclusions V-12
VI Implementation VI-16.1 Project Staging/Phasing VI-1
Environmental Review Process VI-1Program Environmental Document and Conceptual Engineering VI-1Project Specific Environmental Process and Preliminary Engineering VI-2Design and Construction VI-3
6.2 Institutional Planning VI-4
Coordination VI-4Use of Rights-of-Way VI-4
6.3 Implementation of Freight Services VI-5Partnerships VI-5Freight Franchise VI-5
APPENDICES
A Typical Cross SectionsB Capital Unit CostsC Conceptual Operating PlanD Data SourcesE Plan and Profile SheetsF Capital Cost Summary SheetsG Travel Time/Speed Summary SheetsH Travel Time Matrices (Express and Local)I Environmental Constraints TablesJ O&M Calculation Worksheets

Appendix ATypical Cross Sections


Appendix BCapital Unit Costs

Appendix BAlignment Unit Costs
Track and Guideway ItemsEnglish Metric
Item No. Item Description Unit Unit Price Unit Unit Price1 HS/VHS Track - Ballasted mile $1,257,000 km $781,000 2 HS/VHS Track - Direct Fixation mile $2,376,000 km $1,477,000 3 Maglev - At Grade Slab & Track Beam mile $5,303,990 km $3,295,600 4 Maglev - Track Beam (Aerial and Tunnel) mile $3,487,130 km $2,166,750 5 Special Trackwork (VHS) % 15% of Mainline % 15% of Mainline
Trackwork Trackwork6 Special Trackwork (UHS) % 15% of Mainline % 15% of Mainline
Trackwork Trackwork
Earthwork and Related ItemsItem No. Item Description Unit Unit Price Unit Unit Price
1 Site Preparation acre $3,850 hectare $9,500 2 Earthwork Cu-yd $5.35 Cu-m $7.00 3 Imported Borrow Cu-yd $8 Cu-m $10.504 Landscaping/Erosion Control acre $2,570 hectare $6,350 5 Fencing (Both Sides of R/W) mile $144,000 km $80,000
6 Drainage Facilities %(5% of Earthwork
Cost) %(5% of Earthwork
Cost)
Structures, Tunnels and WallsItem No. Item Description Unit Unit Price Unit Unit Price
1 Standard Aerial Structures mile $17,284,000 km $10,800,000
2 Special Aerial Structures mile $47,283,000 km $29,550,000 3 Cut and Cover Tunnels mile $33,730,000 km $20,960,000 4 Double Track Tunnels - Drill and Blast mile $38,530,000 km $23,940,000 5 Double Track Tunnels - Mined (soft soil) mile $103,400,000 km $64,270,000 6 2 Single Track Tunnels - Drill and Blast mile $75,640,000 km $47,000,000 7 2 Single Track Tunnels - Tunnel Boring Machine mile $50,600,000 km $31,440,000 8 Seismic Chamber EA $60,680,000 EA $60,680,000 9 Retaining Walls mile $5,570,000 km $3,460,000 10 Crash Walls mile $1,900,000 km $1,180,000 11 Sound Walls mile $724,000 km $450,000

Appendix BAlignment Unit Costs
Grade SeparationsItem No. Item Description Unit Unit Price Unit Unit Price
1 Under Crossing - (Dense Urban, Urban) EA $14,100,000 EA $14,100,000 2 Over Crossing - (Dense Urban, Urban) EA $13,500,000 EA $13,500,000 3 Under Crossing - (Dense Suburban) EA $5,400,000 EA $5,400,000 4 Over Crossing - (Dense Suburban) EA $5,100,000 EA $5,100,000 5 Under Crossing - (Suburban, Undeveloped) EA $910,000 EA $910,000 6 Over Crossing - (Suburban, Undeveloped) EA $860,000 EA $860,000 7 Close Existing At Grade Crossing EA $140,000 EA $140,000 8 Waterway Crossing - Primary EA $5,400,000 EA $5,400,000 9 Waterway Crossing - Secondary EA $2,700,000 EA $2,700,000 10 Irrigation/Canal Crossing EA $320,000 EA $320,000
Building ItemsItem No. Item Description Unit Unit Price Unit Unit Price
1 Terminal LS $88,000,000 LS $88,000,000 3 Site Development/Parking (Terminal Station) LS $22,000,000 LS $22,000,000 2 Urban LS $44,000,000 LS $44,000,000 4 Site Development/Parking (Urban Station) LS $11,000,000 LS $11,000,000 5 Suburban LS $22,000,000 LS $22,000,000 6 Site Development/Parking (Suburban Station) LS $5,500,000 LS $5,500,000 7 Rural LS $11,000,000 LS $11,000,000 8 Site Development/Parking (Rural Station) LS $2,200,000 LS $2,200,000
Rail and Utility RelocationItem No. Item Description Unit Unit Price Unit Unit Price
1 Existing R/R Relocation mile $1,609,000 km $1,000,000 2 Utility Relocation - Dense Urban mile $1,127,000 km $700,000 3 Utility Relocation - Urban mile $861,000 km $535,000 4 Utility Relocation - Dense Suburban mile $604,000 km $375,000 5 Utility Relocation - Suburban mile $346,000 km $215,000 6 Utility Relocation - Undeveloped mile $17,700 km $11,000
Right of WayItem No. Item Description Unit Unit Price Unit Unit Price
1 Right-of-way - Dense Urban (50' Corridor) mile $7,920,000 km $4,920,000 2 Right-of-way - Urban (50' Corridor) mile $5,280,000 km $3,280,000 3 Right-of-way - Dense Suburban (50' Corridor) mile $2,640,000 km $1,640,000 4 Right-of-way - Suburban (100' Corridor) mile $1,848,000 km $1,150,000 5 Right-of-way - Undeveloped (100' Corridor) mile $1,320,000 km $820,000

Appendix BAlignment Unit Costs
Environmental Impact MitigationItem No. Item Description Unit Unit Price Unit Unit Price
2 Environmental Mitigation %( 3% of
Construction ) %( 3% of
Construction )
Signaling & CommunicationItem No. Item Description Unit Unit Price Unit Unit Price
1 Signaling (ATC) - VHS mile $1,070,000 km $665,000 2 Communications -VHS (w/Fiber Optic Backbone) mile $885,000 km $550,000 3 Signaling (ATC) - Maglev mile $1,239,000 km $770,000 4 Communications - Maglev (w/Fiber Optic Backbone) mile $885,000 km $550,000 5 Wayside Protection Systems (VHS & Maglev) mile $85,000 km $52,800
ElectrificationItem No. Item Description Unit Unit Price Unit Unit Price
1 Traction Power Supply - VHS mile $547,000 km $340,000 2 Traction Power Distribution - VHS mile $1,020,000 km $634,000 3 Traction Power Supply - Maglev mile $1,030,000 km $640,000 4 Traction Power Distribution - Maglev mile $3,927,000 km $2,440,000

Appendix CConceptual Operating Plan
Baseline Conceptual Operating Plan
Revised Conceptual Operating Plan
Example Weekday Train Schedule

Appendix C
BASELINE CONCEPTUAL SERVICE PLAN -- Revised March 18, 1999 -- (Weekday Operation)
Station LegendSD = San Diego LA = Los Angeles Union Sta BAK = Bakersfield SJ = San Jose PLE = Pleasonton SF = San Francisco
ESC = Escondido BUR = Burbank TUL = Tulare County MOD = Modesto NW = Newark STO = Stockton
RIV = Riverside SC = Santa Clarita FRO = Fresno TRA = Tracy/Altimont Pass RC = Redwood City SAC = Sacramento
ONT = Ontario PLM = Palmdale MER = Merced SFO = San Francisco Airport
NORTHBOUNDService Assumptions Station Stops
Train Departs Service TotalNo. Origin Destination LA Type SD ESC RIV ONT LA BUR SC PLM BAK TUL FRO MER MOD TRA PLE NW SJ RC SFO SF STO SAC Stops1 SD SF 600 Express * * * 12 SD SF/SJ/SAC 610 Local * * * * * * * * * * * * * * * * * * * * * * 203 SD SAC 620 Suburb-Ex * * * * * * * * * 74 SD SF 630 Suburb-Ex * * * * * * * * * 75 LA SF 645 Semi-Ex * * * * * 36 LA SF 700 Express * * 07 LA SF/SJ 710 Local * * * * * * * * * * * * * * * * * * * * 188 LA SAC 720 Semi-Ex * * * * * * 49 SD SAC 730 Express * * * * 210 SD SF 740 Suburb-Ex * * * * * * * * * 711 SD SJ 750 Suburb-Ex * * * * * * * * * 712 SD SF 800 Express * * * 113 SD SF/SJ/SAC 810 Local * * * * * * * * * * * * * * * * * * * * * * 2014 LA SAC 830 Express * * 015 SD SJ 845 Semi-Ex * * * * * * 416 LA SF 900 Express * * 017 SD SF/SJ 910 Local * * * * * * * * * * * * * * * * * * * * 1818 SD SAC 920 Semi-Ex * * * * * * * 519 LA SJ 930 Express * * 020 LA SF 1000 Express * * 021 SD SF/SJ/SAC 1010 Local * * * * * * * * * * * * * * * * * * * * * * 2022 LA SF 1100 Semi-Ex * * * * * 323 SD SF 1200 Express * * * 124 SD SF/SJ/SAC 1210 Local * * * * * * * * * * * * * * * * * * * * * * 2025 LA SAC 1230 Express * * 026 SD SJ 1245 Semi -Ex * * * * * * 427 LA SF 100 Express * * 028 LA SJ 110 Express * * 029 LA SF 120 Semi -Ex * * * * * 330 SD SF 200 Express * * * 131 SD SF/SJ/SAC 210 Local * * * * * * * * * * * * * * * * * * * * * * 2032 SD SJ 300 Semi -Ex * * * * * * 433 LA SF 400 Express * * 034 SD SF/SJ/SAC 410 Local * * * * * * * * * * * * * * * * * * * * * * 2035 SD SAC 420 Suburb-Ex * * * * 236 SD SF 430 Suburb-Ex * * * * * * * * 637 SD SAC 445 Semi -Ex * * * * * * * 5
Page 1 of 2 Appendix C-Op Plan; 1/21/00

Appendix C
BASELINE CONCEPTUAL SERVICE PLAN -- Revised March 18, 1999 -- (Weekday Operation)
Station LegendSD = San Diego LA = Los Angeles Union Sta BAK = Bakersfield SJ = San Jose PLE = Pleasonton SF = San Francisco
ESC = Escondido BUR = Burbank TUL = Tulare County MOD = Modesto NW = Newark STO = Stockton
RIV = Riverside SC = Santa Clarita FRO = Fresno TRA = Tracy/Altimont Pass RC = Redwood City SAC = Sacramento
ONT = Ontario PLM = Palmdale MER = Merced SFO = San Francisco Airport
NORTHBOUNDService Assumptions Station Stops
Train Departs Service TotalNo. Origin Destination LA Type SD ESC RIV ONT LA BUR SC PLM BAK TUL FRO MER MOD TRA PLE NW SJ RC SFO SF STO SAC Stops38 LA SF 500 Express * * 039 SD SF/SJ 510 Local * * * * * * * * * * * * * * * * * * * * 1840 SD SJ 520 Semi -Ex * * * * * * 441 LA SAC 530 Express * * * 142 SD SF 540 Suburb-Ex * * * * * * * * 643 SD SJ 550 Suburb-Ex * * * * * * 444 SD SJ 600 Express * * * 145 SD SF/SJ/SAC 610 Local * * * * * * * * * * * * * * * * * * * * * * 2046 LA SAC 630 Express * * 047 SD SAC 645 Semi -Ex * * * * * * * 548 LA SF 700 Express * * 049 LA SF/SJ 710 Local * * * * * * * * * * * * * * * * * * * * 1850 LA SF 720 Semi -Ex * * * * * 351 SD SF 800 Express * * * 152 SD SF/SJ/SAC 810 Local * * * * * * * * * * * * * * * * * * * * * * 20
TOTAL TRAINS 34 16 16 16 52 16 16 16 24 12 24 12 24 15 15 15 20 14 14 33 15 19
Page 2 of 2 Appendix C-Op Plan; 1/21/00

Appendix C
Revised Conceptual Service Plan Station Legend
(Weekday Operation) SD = San Diego RIV = Riverside BUR = Burbank TUL = Tulare County SJ = San Jose MER = Merced
Sorted by LA departure times MM = Mira Mesa ONT = Ontario SC = Santa Clarita FRO = Fresno RC = Redwood City MOD = Modesto
ESC = Escondido ESG = East San Gabriel Valley PLM = Palmdale LB = Los Banos SFO = San Francisco Airport STO = Stockton
TEM = Temecula LA = Los Angeles Union Station BAK = Bakersfield GIL = Gilroy SF = San Francisco SAC = Sacramento
NORTHBOUNDService Assumptions Station Stops
Train Departs Departs Service TotalNo. Origin Destination Origin LA Type SD MM ESC TEM RIV ONT ESG LA BUR SC PLM BAK TUL FRO LB GIL SJ RC SFO SF MER MOD STO SAC Stops
1 FRO SF/SJ - Regional * * * * * * * 5
2 FRO SF/SJ - Regional * * * * * * * 5
3 SD SF 500 600 Express * * * 1
4 SD SF 440 610 Local * * * * * * * * * * * * * * * * * * * * 18
5 SD SAC 450 620 Suburb-Ex * * * * * * * * * * * * * 11
6 SAC SF 910 - Reg.-Local * * * * * * * * * 8
7 SD SF 500 630 Suburb-Ex * * * * * * * * * * * * * * * * 14
8 LA SF 640 640 Semi-Ex * * * * * 3
9 SD SF 520 650 Suburb-Ex * * * * * * * * * * * * * * * * * 15
10 LA SF 700 700 Express * * 0
11 SD SAC 540 710 Local * * * * * * * * * * * * * * * * * * 16
12 SAC SF 1030 - Reg.-Local * * * * * * * * * 8
13 LA SAC 720 720 Semi-Ex * * * * * * 4
14 SAC SF 1010 - Reg.-Semi Ex * * 1
15 SD SAC 630 730 Express * * * 1
16 SAC SF 1000 - Reg.-Express * 0
17 SD SF 610 740 Suburb-Ex * * * * * * * * * * * * * * * * 14
18 SD SJ 620 750 Suburb-Ex * * * * * * * * * * * * * 11
19 SD SAC 625 755 Suburb-Ex * * * * * * * * * * * * * * 12
20 SAC SF 1045 - Reg.-Local * * * * * * * * * 8
21 SD SF 700 800 Express * * * 1
22 SD SJ 640 810 Local * * * * * * * * * * * * * * * * * 15
23 LA SAC 830 830 Express * * 0
24 SAC SF 1100 - Reg.-Semi Ex * * 1
25 SD SJ 750 850 Semi-Ex * * * * * 3
26 SD SF 725 855 Suburb-Ex * * * * * * * * * * * * * * * * * 15
27 LA SF 900 900 Express * * 0
28 SD SF 740 910 Local * * * * * * * * * * * * * * * * * * * * 18
29 SD SAC 820 920 Semi-Ex * * * * * * * 5
Appendix C-Op Plan:N-bnd1/21/00

Appendix C
Revised Conceptual Service Plan Station Legend
(Weekday Operation) SD = San Diego RIV = Riverside BUR = Burbank TUL = Tulare County SJ = San Jose MER = Merced
Sorted by LA departure times MM = Mira Mesa ONT = Ontario SC = Santa Clarita FRO = Fresno RC = Redwood City MOD = Modesto
ESC = Escondido ESG = East San Gabriel Valley PLM = Palmdale LB = Los Banos SFO = San Francisco Airport STO = Stockton
TEM = Temecula LA = Los Angeles Union Station BAK = Bakersfield GIL = Gilroy SF = San Francisco SAC = Sacramento
NORTHBOUNDService Assumptions Station Stops
Train Departs Departs Service TotalNo. Origin Destination Origin LA Type SD MM ESC TEM RIV ONT ESG LA BUR SC PLM BAK TUL FRO LB GIL SJ RC SFO SF MER MOD STO SAC Stops30 SAC SF 1210 - Reg.-Express * 0
31 LA SJ 930 930 Express * * 0
32 SD SF 815 945 Suburb-Ex * * * * * * * * * * * * * * * * * 15
33 LA SF 1000 1000 Express * * 0
34 SD SAC 840 1010 Local * * * * * * * * * * * * * * * * * * 16
35 SAC SF 130 - Reg.-Semi Ex * * 1
36 SD SJ 910 1040 Suburb-Ex * * * * * * * * * * * * * * 12
37 LA SF 1110 1110 Semi-Ex * * * * * 3
38 SD SAC 1005 1135 Suburb-Ex * * * * * * * * * * * * * * 12
39 SAC SF 225 - Reg.-Express * 0
40 SD SF 1100 1200 Express * * * 1
41 SD SJ 1040 1210 Local * * * * * * * * * * * * * * * * * 15
42 LA SAC 1230 1230 Express * * 0
43 SAC SF 300 - Reg.-Semi Ex * * 1
44 SD SJ 1145 1245 Semi-Ex * * * * * 3
45 SD SF 1120 1250 Suburb-Ex * * * * * * * * * * * * * * * * * 15
46 LA SF 100 100 Express * * 0
47 LA SJ 110 110 Express * * 0
48 LA SF 120 120 Semi-Ex * * * * * 3
49 SD SJ 1210 140 Suburb-Ex * * * * * * * * * * * * * * 12
50 SD SF 100 200 Express * * * 1
51 SD SF 1240 210 Local * * * * * * * * * * * * * * * * * * * * 18
52 SD SF 110 240 Suburb-Ex * * * * * * * * * * * * * * * * * 15
53 SD SJ 210 310 Semi-Ex * * * * * 3
54 SD SAC 205 335 Suburb-Ex * * * * * * * * * * * * * * 12
55 SAC SF 525 - Reg.-Semi Ex * * 1
56 LA SF 400 400 Express * * 0
57 SD SAC 240 410 Local * * * * * * * * * * * * * * * * * * 16
58 SAC SF 730 - Reg.-Express * 0
Appendix C-Op Plan:N-bnd1/21/00

Appendix C
Revised Conceptual Service Plan Station Legend
(Weekday Operation) SD = San Diego RIV = Riverside BUR = Burbank TUL = Tulare County SJ = San Jose MER = Merced
Sorted by LA departure times MM = Mira Mesa ONT = Ontario SC = Santa Clarita FRO = Fresno RC = Redwood City MOD = Modesto
ESC = Escondido ESG = East San Gabriel Valley PLM = Palmdale LB = Los Banos SFO = San Francisco Airport STO = Stockton
TEM = Temecula LA = Los Angeles Union Station BAK = Bakersfield GIL = Gilroy SF = San Francisco SAC = Sacramento
NORTHBOUNDService Assumptions Station Stops
Train Departs Departs Service TotalNo. Origin Destination Origin LA Type SD MM ESC TEM RIV ONT ESG LA BUR SC PLM BAK TUL FRO LB GIL SJ RC SFO SF MER MOD STO SAC Stops59 SD SAC 250 420 Suburb-Ex * * * * * * * * * * * * * 11
60 SAC SF 710 Reg.-Local * * * * * * * * * 8
61 SD SF 300 430 Suburb-Ex * * * * * * * * * * * * * * * * 14
62 SD SAC 345 445 Semi-Ex * * * * * * * 5
63 SAC SF 735 Reg.-Semi Ex * * 1
64 SD SF 320 450 Suburb-Ex * * * * * * * * * * * * * * * * * 15
65 LA SF 500 500 Express * * 0
66 SD SJ 340 510 Local * * * * * * * * * * * * * * * * * 15
67 SD SJ 420 520 Semi-Ex * * * * * 3
68 LA SAC 530 530 Express * * 0
69 SAC SF 800 Reg.-Express * 0
70 SD SF 410 540 Suburb-Ex * * * * * * * * * * * * * * * * 14
71 SD SJ 420 550 Suburb-Ex * * * * * * * * * * * * * 11
72 SD SJ 425 555 Suburb-Ex * * * * * * * * * * * * * * 12
73 SD SF 500 600 Express * * * 1
74 SD SF 440 610 Local * * * * * * * * * * * * * * * * * * * * 18
75 LA SAC 630 630 Express * * 0
76 SAC SF 900 Reg.-Semi Ex * * 1
77 SD SAC 550 650 Semi-Ex * * * * * * * 5
78 SAC SF 940 Reg.-Local * * * * * * * * * 8
79 LA SF 700 700 Express * * 0
80 SD SAC 540 710 Local * * * * * * * * * * * * * * * * * * 16
81 SAC SF 1030 Reg.-Express * 0
82 LA SF 720 720 Semi-Ex * * * * * 3
83 SD SF 700 800 Express * * * 1
84 SD SJ 640 810 Local * * * * * * * * * * * * * * * * * 15
85 SD BAK Regional * * * * * * * * * * * * 10
86 SD BAK Regional * * * * * * * * * * * * 10
TOTAL TRAINS 48 34 34 34 34 34 34 66 34 34 34 38 12 26 15 30 47 21 21 51 9 13 18 18
Appendix C-Op Plan:N-bnd1/21/00

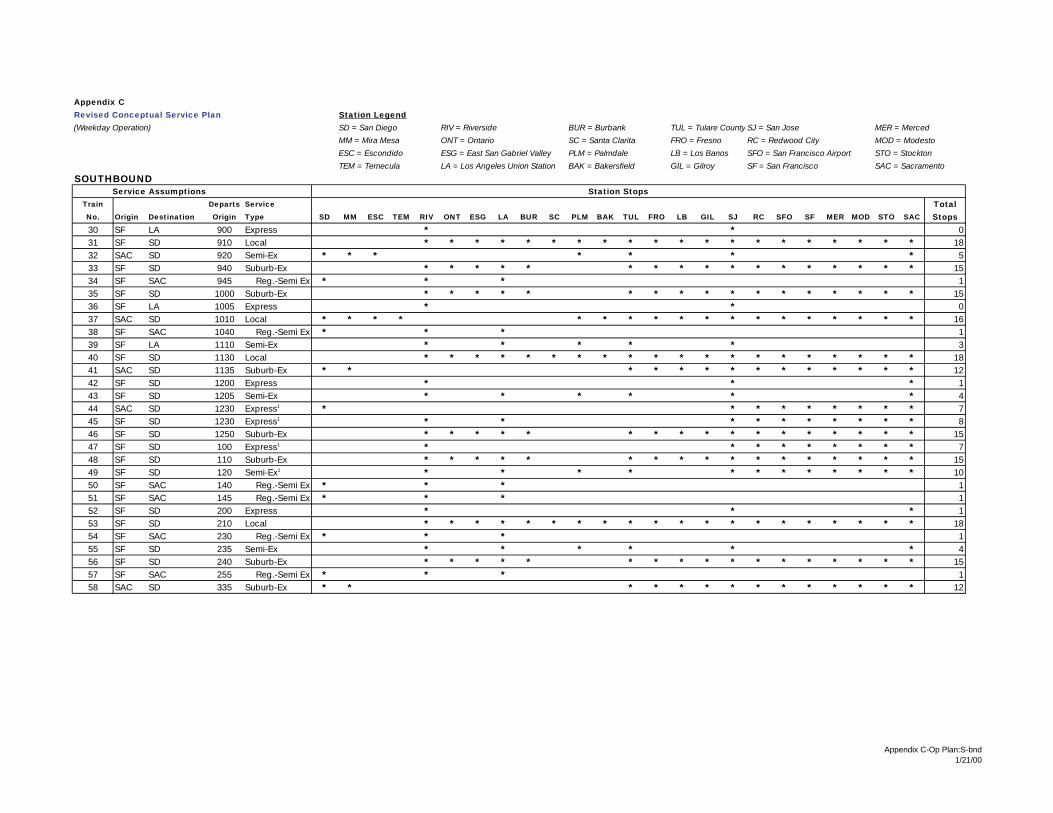
Appendix C
Revised Conceptual Service Plan Station Legend
(Weekday Operation) SD = San Diego RIV = Riverside BUR = Burbank TUL = Tulare County SJ = San Jose MER = Merced
MM = Mira Mesa ONT = Ontario SC = Santa Clarita FRO = Fresno RC = Redwood City MOD = Modesto
ESC = Escondido ESG = East San Gabriel Valley PLM = Palmdale LB = Los Banos SFO = San Francisco Airport STO = Stockton
TEM = Temecula LA = Los Angeles Union Station BAK = Bakersfield GIL = Gilroy SF = San Francisco SAC = Sacramento
SOUTHBOUNDService Assumptions Station Stops
Train Departs Service TotalNo. Origin Destination Origin Type SD MM ESC TEM RIV ONT ESG LA BUR SC PLM BAK TUL FRO LB GIL SJ RC SFO SF MER MOD STO SAC Stops
1 SF SAC 330 Reg.-Semi Ex * * * 12 SF SAC 440 Reg.-Semi Ex * * * 13 BAK SD 500 Regional * * * * * * * * * * * * 104 SF SAC 500 Reg.-Local * * * * * * * * * * 85 SF SD 510 Local * * * * * * * * * * * * * * * * * * * * 186 SAC SD 520 Suburb-Ex * * * * * * * * * * * * * 117 SF SAC 530 Reg.-Local * * * * * * * * * * 88 SF SD 540 Suburb-Ex * * * * * * * * * * * * * * * * 149 SF SD 550 Express * * * 110 BAK SD 600 Regional * * * * * * * * * * * * 1011 SF SAC 600 Reg.-Local * * * * * * * * * * 812 SF SAC 605 Reg.-Local * * * * * * * * * * 813 SF LA 640 Semi-Ex * * * * * 314 SF SAC 650 Reg.-Local * * * * * * * * * * 815 SF SD 655 Suburb-Ex * * * * * * * * * * * * * * * * * 1516 SF LA 700 Express * * 017 SAC SD 710 Local * * * * * * * * * * * * * * * * * * 1618 SF SD 710 Suburb-Ex * * * * * * * * * * * * * * * * 1419 SAC LA 720 Semi-Ex * * * * * * 420 SAC SD 730 Express * * * 121 SF SD 730 Local * * * * * * * * * * * * * * * * * * * * 1822 SF SAC 740 Reg.-Local * * * * * * * * * * 823 SF SD 745 Suburb-Ex * * * * * * * * * * * * * * * * 1424 SAC SD 755 Suburb-Ex * * * * * * * * * * * * * * 1225 SF SD 800 Express * * * 126 SF SD 810 Semi-Ex * * * * * * 427 SAC LA 830 Express * * 028 SF LA 850 Express * * * 129 SF SD 855 Suburb-Ex * * * * * * * * * * * * * * * * * 15
Appendix C-Op Plan:S-bnd1/21/00
Appendix C
Revised Conceptual Service Plan Station Legend
(Weekday Operation) SD = San Diego RIV = Riverside BUR = Burbank TUL = Tulare County SJ = San Jose MER = Merced
MM = Mira Mesa ONT = Ontario SC = Santa Clarita FRO = Fresno RC = Redwood City MOD = Modesto
ESC = Escondido ESG = East San Gabriel Valley PLM = Palmdale LB = Los Banos SFO = San Francisco Airport STO = Stockton
TEM = Temecula LA = Los Angeles Union Station BAK = Bakersfield GIL = Gilroy SF = San Francisco SAC = Sacramento
SOUTHBOUNDService Assumptions Station Stops
Train Departs Service TotalNo. Origin Destination Origin Type SD MM ESC TEM RIV ONT ESG LA BUR SC PLM BAK TUL FRO LB GIL SJ RC SFO SF MER MOD STO SAC Stops
30 SF LA 900 Express * * 031 SF SD 910 Local * * * * * * * * * * * * * * * * * * * * 1832 SAC SD 920 Semi-Ex * * * * * * * 533 SF SD 940 Suburb-Ex * * * * * * * * * * * * * * * * * 1534 SF SAC 945 Reg.-Semi Ex * * * 135 SF SD 1000 Suburb-Ex * * * * * * * * * * * * * * * * * 1536 SF LA 1005 Express * * 037 SAC SD 1010 Local * * * * * * * * * * * * * * * * * * 1638 SF SAC 1040 Reg.-Semi Ex * * * 139 SF LA 1110 Semi-Ex * * * * * 340 SF SD 1130 Local * * * * * * * * * * * * * * * * * * * * 1841 SAC SD 1135 Suburb-Ex * * * * * * * * * * * * * * 1242 SF SD 1200 Express * * * 143 SF SD 1205 Semi-Ex * * * * * * 444 SAC SD 1230 Express1 * * * * * * * * * 745 SF SD 1230 Express1 * * * * * * * * * * 846 SF SD 1250 Suburb-Ex * * * * * * * * * * * * * * * * * 1547 SF SD 100 Express1 * * * * * * * * * 748 SF SD 110 Suburb-Ex * * * * * * * * * * * * * * * * * 1549 SF SD 120 Semi-Ex1 * * * * * * * * * * * * 1050 SF SAC 140 Reg.-Semi Ex * * * 151 SF SAC 145 Reg.-Semi Ex * * * 152 SF SD 200 Express * * * 153 SF SD 210 Local * * * * * * * * * * * * * * * * * * * * 1854 SF SAC 230 Reg.-Semi Ex * * * 155 SF SD 235 Semi-Ex * * * * * * 456 SF SD 240 Suburb-Ex * * * * * * * * * * * * * * * * * 1557 SF SAC 255 Reg.-Semi Ex * * * 158 SAC SD 335 Suburb-Ex * * * * * * * * * * * * * * 12
Appendix C-Op Plan:S-bnd1/21/00

Appendix C
Revised Conceptual Service Plan Station Legend
(Weekday Operation) SD = San Diego RIV = Riverside BUR = Burbank TUL = Tulare County SJ = San Jose MER = Merced
MM = Mira Mesa ONT = Ontario SC = Santa Clarita FRO = Fresno RC = Redwood City MOD = Modesto
ESC = Escondido ESG = East San Gabriel Valley PLM = Palmdale LB = Los Banos SFO = San Francisco Airport STO = Stockton
TEM = Temecula LA = Los Angeles Union Station BAK = Bakersfield GIL = Gilroy SF = San Francisco SAC = Sacramento
SOUTHBOUNDService Assumptions Station Stops
Train Departs Service TotalNo. Origin Destination Origin Type SD MM ESC TEM RIV ONT ESG LA BUR SC PLM BAK TUL FRO LB GIL SJ RC SFO SF MER MOD STO SAC Stops
59 SF SAC 340 Reg.-Semi Ex * * * 160 SF SD 350 Express1 * * * * * * * * * 761 SF SAC 400 Reg.-Local * * * * * * * * * * 862 SAC SD 410 Local * * * * * * * * * * * * * * * * * * 1663 SF/SJ FRO 415 Regional * * * * * * * 564 SAC SD 420 Suburb-Ex * * * * * * * * * * * * * 1165 SF SAC 420 Reg.-Local * * * * * * * * * * 866 SF SD 430 Suburb-Ex * * * * * * * * * * * * * * * * 1467 SF SD 435 Local * * * * * * * * * * * * * * * * * * * * 1868 SF SAC 440 Reg.-Local * * * * * * * * * * 869 SF SD 445 Semi-Ex * * * * * * 470 SAC SD 445 Semi-Ex * * * * * * * 571 SF SD 450 Suburb-Ex * * * * * * * * * * * * * * * * * 1572 SF LA 500 Express * * 073 SF SD 510 Suburb-Ex * * * * * * * * * * * * * * * * 1474 SF SD 515 Suburb-Ex * * * * * * * * * * * * * * * * * 1575 SF/SJ FRO 520 Regional * * * * * * * 576 SAC LA 530 Express * * 077 SF SD 540 Suburb-Ex * * * * * * * * * * * * * * * * 1478 SF SD 600 Express * * * 179 SF SD 610 Local * * * * * * * * * * * * * * * * * * * * 1880 SAC LA 630 Express * * 081 SAC SD 650 Semi-Ex * * * * * * * 582 SF LA 700 Express * * 083 SAC SD 710 Local * * * * * * * * * * * * * * * * * * 1684 SF LA 720 Semi-Ex * * * * * 385 SF SD 730 Local * * * * * * * * * * * * * * * * * * * * 1886 SF SD 800 Express * * * 1TOTAL TRAINS 36 22 17 13 66 34 34 53 34 19 26 12 38 34 34 34 66 39 39 39 39 39 39 53
1) Local service between San Diego and Los Angeles
Appendix C-Op Plan:S-bnd1/21/00

Example Weekday Train Schedule - Year 2016California High Speed Rail
Northbound Service
Train Number 1 2 3 4 5 6 7 8 9 10 11 12 13 14 15 16 17 18 19 20 21 22 23 24 25 26 27 28 29 30 31 32 33 34Service Type R R L SUB SUB E SUB SL SL EL SUB L EL SUB SUB L EL EL EL SL SUB L E S SUB E L SUB S SUB E L E SSan Diego 505 450 500 515 525 535 545 600 615 625 635 645 700 710 720 730 740 835 815 905 840 915 1010 1000 1100 1050 1140Mira Mesa 6 457 507 522 532 542 552 607 622 632 642 652 707 717 727 737 747 6 822 6 847 922 6 1007 6 1057 6Escondido 6 507 517 532 542 552 602 617 632 642 652 702 717 727 737 747 757 6 832 6 857 932 6 1017 6 1107 6Temecula 6 522 532 547 557 607 617 632 647 657 707 717 732 742 752 802 812 6 847 6 912 947 6 1032 6 1122 6Riverside 6 539 549 604 614 624 634 649 704 714 724 734 749 759 809 819 829 6 904 6 929 1004 6 1049 6 1139 6Ontario 6 551 601 616 626 636 646 701 716 726 736 746 801 811 821 831 841 6 916 6 941 1016 6 1101 6 1151 6E. San Gabriel 6 603 613 628 638 648 658 713 728 738 748 758 813 823 833 843 853 6 928 6 953 1028 6 1113 6 1203 6Los Angeles 510 545 600 605 620 630 645 655 705 715 730 745 755 805 815 830 840 850 900 910 930 935 945 1005 1010 1045 1110 1130 1200 1220 1230 1240Burbank 521 556 611 6 631 6 6 6 716 726 6 756 806 6 826 6 851 6 6 921 6 6 956 6 1021 1056 6 1141 6 1231 6 6Santa Clarita 536 611 626 6 646 6 6 6 731 741 6 811 821 6 841 6 906 6 6 936 6 6 1011 6 1036 1111 6 1156 6 1246 6 6Bakersfield 608 6 658 6 6 719 734 6 6 813 6 6 853 6 913 6 6 942 6 1008 6 1024 1043 6 1108 1159 1228 6 118 6 129Tulare 634 6 6 6 6 6 6 6 6 839 6 6 6 6 939 6 6 6 6 1034 6 6 6 6 1134 6 6 6 6 144 6 6Fresno 550 635 651 6 733 6 6 756 811 6 6 856 6 6 928 6 958 6 6 1019 6 1051 6 1101 6 6 1151 6 1236 103 6 201 6 206Los Banos 616 701 717 6 6 6 6 6 6 6 6 1024 6 6 6 1117 6 6 6 6 6 6 227 6Gilroy 632 717 733 747 808 6 6 6 907 947 6 1040 1042 6 6 1133 6 1153 6 1247 6 6 243 6San Jose 647 732 748 802 823 6 844 6 922 1002 6 1055 1057 1107 6 1148 1132 1208 6 102 124 6 258 254Redwood City 703 748 804 818 839 6 6 6 938 1018 6 1111 1113 6 6 1204 6 1224 6 118 6 6 314 6SFO 714 759 815 829 850 6 6 6 949 1029 6 1122 1124 6 6 1215 6 1235 6 129 6 6 325 6San Francisco 728 813 829 843 904 837 917 927 1003 1043 1037 1136 1158 1140 1132 1229 1205 1249 1237 143 157 232 339 327Merced 6 6 917 6 6 6 6 1212 6 6Modesto 6 843 934 6 6 6 1133 1229 6 6Stockton 822 855 946 6 1004 6 1145 1241 139 6Sacramento 844 917 1008 941 1026 1041 1207 103 201 239
Train Number 35 36 37 38 39 40 41 42 43 44 45 46 47 48 49 50 51 52 53 54 55 56 57 58 59 60 61 62 63 64 65 66 67 68Service Type SUB E S SUB SUB E L SUB E S L E SUB S SUB S SUB E R E SUB S L SUB L E R E SUB E S L L ESan Diego 1120 1220 1200 1210 100 1240 110 210 145 245 325 300 345 320 355 410 445 420 430 440 515 500 520 710 740 835Mira Mesa 1127 6 1207 1217 6 1247 117 6 152 252 6 307 6 327 402 417 6 427 437 447 6 507 527 717 747 6Escondido 1137 6 1217 1227 6 1257 127 6 202 302 6 317 6 337 412 427 6 437 447 457 6 517 537 727 757 6Temecula 1152 6 1232 1242 6 112 142 6 217 317 6 332 6 352 427 442 6 452 502 512 6 532 552 742 812 6Riverside 1209 6 1249 1259 6 129 159 6 234 334 6 349 6 409 444 459 6 509 519 529 6 549 609 759 829 6Ontario 1221 6 101 111 6 141 211 6 246 346 6 401 6 421 456 511 6 521 531 541 6 601 621 811 841 6E. San Gabriel 1233 6 113 123 6 153 223 6 258 358 6 413 6 433 508 523 6 533 543 553 6 613 633 823 853 6Los Angeles 1250 105 120 130 140 200 210 240 255 310 315 400 415 425 430 445 450 510 525 530 540 545 550 600 610 615 630 640 650 705 715 840 910 935Burbank 101 6 6 141 151 6 221 251 6 6 326 6 426 6 441 6 501 6 536 6 551 6 601 611 621 6 641 6 701 6 6 851 921 6Santa Clarita 116 6 6 156 206 6 236 306 6 6 341 6 441 6 456 6 516 6 551 6 606 6 616 626 636 6 656 6 716 6 6 906 936 6Bakersfield 148 6 209 228 238 6 308 6 6 359 413 6 6 514 6 534 6 6 623 6 6 634 648 6 708 6 728 6 6 6 802 938 1008 6Tulare 6 6 6 6 6 6 334 6 6 6 439 6 6 6 6 6 6 6 6 6 6 714 6 734 6 6 6 6 6 1004 1034 6Fresno 6 6 246 303 6 6 351 6 6 436 456 6 6 551 6 611 6 6 6 6 711 731 6 751 6 6 6 6 839 1021 1051 6Los Banos 6 6 6 6 6 417 6 6 6 6 6 6 6 6 6 757 6 817 6 6 6 6 1047 6Gilroy 258 6 6 348 6 433 442 6 6 6 6 632 652 6 742 813 802 833 6 852 6 6 1103 6San Jose 313 6 334 403 402 448 457 6 524 6 639 647 707 6 757 828 817 848 6 907 6 927 1118 6Redwood City 329 6 6 419 6 504 513 6 6 6 6 703 723 6 813 844 833 904 6 923 6 6 1134 6SFO 340 6 6 430 6 515 524 6 6 6 6 714 734 6 824 855 844 915 6 934 6 6 1145 6San Francisco 354 335 407 444 505 529 538 525 557 630 712 728 748 740 838 909 858 929 847 948 935 1000 1159 1207Merced 6 517 6 6 6 6 6 1112Modesto 6 534 6 643 6 743 6 1129Stockton 339 546 617 655 6 755 6 1141Sacramento 401 608 639 717 739 817 849 1203
North Regional Service (SAC-SF)
Train Number 1 2 3 4 5 6 7 8 9 10 11 12 13 14 15 16 17 18Service Type L L S L S S L L S S L L L S S L S SSacramento 525 610 700 800 915 1000 1005 1045 1100 1220 200 300 400 525 615 735 820 930Stockton 547 632 6 822 6 6 1027 1107 6 6 222 6 422 6 6 757 6 952 L - Local E - Express R - Regional S - Semi Express SUB - Suburban ExpressModesto 559 644 6 834 6 6 1039 1119 6 6 234 6 434 6 6 809 6 1004 Note: Superscript denotes local service between San Diego and Los AngelesMerced 616 701 6 851 6 6 1056 1136 6 6 251 6 451 6 6 826 6 1021Los Banos 633 718 6 908 6 6 1113 1153 6 6 308 6 508 6 6 842 6 1038 Represents an example of statewide weekday train scheduling of future proposed HSR serviceGilroy 649 734 6 924 6 6 1129 1209 6 6 324 6 524 6 6 859 6 1054 Does not represent optimal train timing for all cities servedSan Jose 704 749 812 939 1027 1112 1144 1224 1212 132 339 412 539 637 727 914 932 1109 Based on conceptual operating plan of daily frequency and stopping patternsRedwood City 720 805 6 955 6 6 1200 1240 6 6 355 6 555 6 6 930 6 1125 No operations modeling or schedule optimization/refinement analysis has been completed for this exampleSFO 731 816 6 1006 6 6 1211 1251 6 6 406 6 606 6 6 941 6 1136 In some cases, train departure times adjusted at intermediate stops to avoid scheduling conflictsSan Francisco 745 830 845 1020 1100 1145 1225 105 1245 205 420 445 620 710 800 955 1005 1150

Example Weekday Train Schedule - Year 2016California High Speed Rail
Southbound Service
Train Number 1 2 3 4 5 6 7 8 9 10 11 12 13 14 15 16 17 18 19 20 21 22 23 24 25 26 27 28 29 30 31 32 33 34Service Type R R L SUB SUB E S SUB SUB E L SUB E L SUB S E S E E SUB E L S SUB E L SUB S L SUB E S EL
Sacramento 520 645 710 730 755 830 930 1010 1145 1230Stockton 542 707 732 6 817 6 952 1032 1207 6Modesto 6 6 744 6 829 6 1004 1044 6 6Merced 6 6 801 6 6 6 6 1101 6 6San Francisco 510 540 550 640 650 700 725 735 745 805 820 840 850 900 910 940 955 1010 1100 1130 1155 1210SFO 524 554 6 6 704 6 739 749 759 6 6 6 904 6 924 954 6 1024 6 1144 6 6Redwood City 535 605 6 6 715 6 750 800 810 6 6 6 915 6 935 1005 6 1035 6 1155 6 6San Jose 551 621 6 711 731 6 806 816 826 6 851 911 931 6 951 1021 6 1051 1131 1211 6 1241Gilroy 606 636 6 6 746 6 821 831 841 6 6 6 946 6 1006 1036 6 1106 6 1226 6 6Los Banos 622 6 6 6 6 6 6 847 6 6 6 6 6 6 1022 6 6 6 6 1242 6 6Fresno 648 6 6 6 759 6 6 6 822 6 6 913 6 901 6 939 6 6 6 6 1048 1036 6 6 1122 6 1219 108 1243 6 129 6Tulare 705 6 6 6 6 6 6 6 839 6 6 930 6 6 6 6 6 6 6 6 1105 6 6 6 1139 6 6 125 6 6 6 6Bakersfield 500 600 731 6 6 6 836 817 856 6 905 6 6 956 6 938 6 1016 6 6 1056 6 1131 1113 1146 6 1205 1216 1256 151 118 6 206 6Santa Clarita 532 632 803 718 812 6 6 849 928 6 937 957 6 1028 1017 6 6 6 6 6 1128 6 1203 6 1218 6 1237 1248 6 223 150 6 6 6Burbank 547 647 818 733 827 6 6 904 943 6 952 1012 6 1043 1032 6 6 6 6 6 1143 6 1218 6 1233 6 1252 103 6 238 205 6 6 6Los Angeles 558 658 829 744 838 820 925 915 954 930 1003 1023 939 1054 1043 1027 1035 1105 1039 1115 1154 1130 1229 1202 1244 1225 103 114 145 249 216 225 255 239E. San Gabriel 615 715 846 801 855 6 932 1011 1020 1040 6 1111 1100 6 6 1211 1246 6 101 120 131 306 233 6 6 256Ontario 627 727 858 813 907 6 944 1023 1032 1052 6 1123 1112 6 6 1223 1258 6 113 132 143 318 245 6 6 308Riverside 639 739 910 825 919 6 956 1035 1044 1104 6 1135 1124 6 6 1235 110 6 125 144 155 330 257 6 6 320Temecula 656 756 927 842 936 6 1013 1052 1101 1121 6 1152 1141 6 6 1252 127 6 142 201 212 347 314 6 6 337Escondido 711 811 942 857 951 6 1028 1107 1116 1136 6 1207 1156 6 6 107 142 6 157 216 227 402 329 6 6 352Mira Mesa 721 821 952 907 1001 6 1038 1117 1126 1146 6 1217 1206 6 6 117 152 6 207 226 237 412 339 6 6 402San Diego 728 828 959 914 1008 922 1045 1124 1133 1153 1041 1224 1213 1137 1207 124 159 104 214 233 244 419 346 327 357 409
Train Number 35 36 37 38 39 40 41 42 43 44 45 46 47 48 49 50 51 52 53 54 55 56 57 58 59 60 61 62 63 64 65 66 67 68Service Type EL SUB EL SUB L SUB E SL SUB SUB S EL R L E SUB S L E R E S SUB SUB SUB E S SUB L EL S L L ESacramento 155 300 410 450 505 525 605 900Stockton 217 322 432 512 6 547 6 922Modesto 6 6 444 524 6 559 6 934Merced 6 6 501 6 6 6 6 951San Francisco 1230 1250 100 110 125 205 215 240 325 350 400 425 435 500 510 520 530 540 600 605 620 630 640 730 845 930SFO 6 104 6 124 139 6 6 254 6 6 414 6 449 514 524 6 544 554 614 6 634 644 6 6 859 6Redwood City 6 115 6 135 150 6 6 305 6 6 425 6 500 525 535 6 555 605 625 6 645 655 6 6 910 6San Jose 101 131 6 151 206 6 246 321 356 6 441 6 516 541 551 6 611 621 641 636 701 711 6 801 926 6Gilroy 6 146 6 206 221 6 6 336 6 6 456 6 531 556 606 6 626 636 656 6 716 726 6 6 941 6Los Banos 6 6 6 6 237 6 6 6 6 6 512 6 6 612 622 6 6 6 6 6 6 742 6 6 957 6Fresno 6 221 6 6 303 253 6 334 6 6 444 6 538 522 6 6 556 638 6 648 6 631 6 6 6 6 724 6 808 6 849 1023 1012 6Tulare 6 6 6 6 320 6 6 6 6 6 6 6 539 6 6 6 655 6 6 6 6 6 6 6 6 6 825 6 6 1040 1029 6Bakersfield 6 256 6 316 346 328 6 411 6 6 521 6 605 6 6 633 721 6 6 708 6 746 6 6 801 6 851 6 926 1106 1055 6Santa Clarita 6 328 6 348 418 400 6 6 512 456 6 6 637 6 707 6 753 6 6 6 802 818 832 6 6 852 923 6 6 1138 1127 6Burbank 6 343 6 403 433 415 6 6 527 511 6 6 652 6 722 6 808 6 6 6 817 833 847 6 6 907 938 6 6 1153 1142 6Los Angeles 305 354 330 414 444 426 435 500 538 522 610 620 703 655 733 722 819 714 750 757 828 844 858 814 850 918 949 910 1015 1204 1153 1200E. San Gabriel 322 411 347 431 501 443 6 517 555 539 6 637 720 6 750 6 836 6 845 901 915 6 935 1006 927 6Ontario 334 423 359 443 513 455 6 529 607 551 6 649 732 6 802 6 848 6 857 913 927 6 947 1018 939 6Riverside 346 435 411 455 525 507 6 541 619 603 6 701 744 6 814 6 900 6 909 925 939 6 959 1030 951 6Temecula 403 452 428 512 542 524 6 558 636 620 6 718 801 6 831 6 917 6 926 942 956 6 1016 1047 1008 6Escondido 418 507 443 527 557 538 6 613 651 635 6 733 816 6 846 6 932 6 941 957 1011 6 1031 1102 1023 6Mira Mesa 428 517 453 537 607 548 6 623 701 645 6 743 826 6 856 6 942 6 951 1007 1021 6 1041 1112 1033 6San Diego 435 524 500 544 614 556 539 630 708 652 712 750 833 757 903 824 949 859 958 1014 1028 954 1048 1119 1040 1117
North Regional Service (SF-SAC)
Train Number 1 2 3 4 5 6 7 8 9 10 11 12 13 14 15 16 17 18Service Type L S L S L S S L S L S S L S L S L LSan Francisco 530 600 625 650 735 945 1040 1140 1245 140 300 340 400 455 515 620 800 940 L - Local E - Express R - Regional S - Semi Express SUB - Suburban ExpressSFO 544 6 639 6 749 6 6 1154 6 154 6 6 414 6 529 6 814 1002 Note: Superscript denotes local service between San Diego and Los AngelesRedwood City 555 6 650 6 800 6 6 1205 6 205 6 6 425 6 540 6 825 1014San Jose 611 631 706 721 816 1016 1111 1221 116 221 331 411 441 526 556 651 841 1031 Represents an example of statewide weekday train scheduling of future proposed HSR serviceGilroy 626 6 721 6 831 6 6 1236 6 236 6 6 456 6 611 6 856 1048 Does not represent optimal train timing for all cities servedLos Banos 642 6 737 6 847 6 6 1252 6 252 6 6 512 6 627 6 912 1104 Based on conceptual operating plan of daily frequency and stopping patternsMerced 659 6 754 6 904 6 6 109 6 309 6 6 529 6 644 6 929 1119 No operations modeling or schedule optimization/refinement analysis has been completed for this exampleModesto 716 6 811 6 921 6 6 126 6 326 6 6 546 6 701 6 946 1135 In some cases, train departure times adjusted at intermediate stops to avoid scheduling conflictsStockton 728 6 823 6 933 6 6 138 6 338 6 6 558 6 713 6 958 1146Sacramento 750 745 845 835 955 1130 1225 200 230 400 445 525 620 640 735 805 1020 1200

Appendix DData Sources

Appendix D
DATA SOURCES
• Threatened and Endangered Species/Habitat - California NaturalDiversity Data Base - Rare Find, April 1998
• Hazardous Materials/Waste Sites - VISTA Information Solutions,Inc. - December 1998
• Terrain - USGS Digital Elevation Models• Floodplain - Federal Emergency Management Agency Q3 Flood
Data, 1996• Census - 1990 U.S. Census Bureau STF1, STF3• Farmland - Office of Land Conservation, Department of
Conservation, State of California• Soils - Natural Resources Conservation Service, United States
Department of Agriculture, October 1994• Real Estate Data - DataQuick Information Services (on-line data
information service)• Satellite Imagery - EROS Data Center, United States Geological
Survey, Sioux Falls, SD.– Thematic Mapper Scene (Path 43, Row 35). March 11, 1984.– Thematic Mapper Scene (Path 42, Row 36). October 27, 1984.– Thematic Mapper Scene (Path 43, Row 34). March 11, 1984.– Thematic Mapper Scene (Path 41, Row 36). February 25,
1985.– Thematic Mapper Scene (Path 44, Row 33). October 25, 1984.– Thematic Mapper Scene (Path 40, Row 37). March 23, 1984.– Thematic Mapper Scene (Path 44, Row 34). October 25, 1984.– Thematic Mapper Scene (Path 43, Row 36). March 11, 1984.– Thematic Mapper Scene (Path 41, Row 37). March 29, 1985.– Thematic Mapper Scene (Path 40, Row 36). March 22, 1985.– Thematic Mapper Scene (Path 42, Row 35). March 20, 1985.
• Wetlands - National Wetlands Inventory, United StatesDepartment of Interior, U.S. Fish and Wildlife Service.
• Transportation, Hydrography - United States Geological Survey– Bakersfield (1:250,000 Scale). 1975.– Bakersfield DEM Data (ID # 34116-A1). N.d.– Cambria DLG Hydrography and Transportation Data (ID #
35121-E1). N.d.– Coalinga (1:100,000 Scale). 1987.
– Coalinga DLG Hydrography and Transportation Data (ID #36120-A1). N.d.
– Cuyama DLG Hydrography and Transportation Data (ID #34119-E1). N.d.
– Delano (1:100,000 Scale). 1993.– Delano DLG Hydrography and Transportation Data (ID #
35119-E1). N.d.– Fresno (1:100,000 Scale). 1982.– Fresno (1:250,000 Scale). 1971.– Fresno DEM Data (ID # 36118-A1). N.d.– Fresno DLG Hydrography and Transportation Data (ID #
36119-E1). N.d.– Isabella Lake DLG Hydrography and Transportation Data (ID #
35118-E1). N.d.– Lancaster (1:100,000 Scale). 1981.– Los Angeles (1:100,000 Scale). 1979.– Lancaster DLG Hydrography and Transportation Data (ID #
34118-E1). N.d.– Lodi DLG Hydrography and Transportation Data (ID # 38121-
A1). N.d.– Long Beach (1:250,000 Scale). 1978.– Long Beach DEM Data (ID # 33118-A1). N.d.– Long Beach DLG Hydrography and Transportation Data (ID #
33118-E1). N.d.– Los Angeles (1:250,000 Scale). 1975.– Los Angeles DEM Data (ID # 34118-A1). N.d.– Los Angeles DLG Hydrography and Transportation Data (ID #
34118-A1). N.d.– Mariposa DEM Data (ID # 37118-A1). N.d.– Mendota (1:100,000 Scale). 1982.– Mendota DLG Hydrography and Transportation Data (36120-
E1). N.d.– Merced (1:100,000 Scale). 1983.– Merced DLG Hydrography and Transportation Data (ID #
37120-A1). N.d.– Monterey (1:250,000 Scale). 1974.– Monterey DEM Data (ID # 36120-A1). N.d.

Appendix D
– Monterey DLG Hydrography and Transportation Data (ID #36121-E1). N.d.
– Napa DLG Hydrography and Transportation Data (ID # 38122-A1). N.d.
– Oceanside DLG Hydrography and Transportation Data (ID #33117-A1). N.d.
– Palm Springs DLG Hydrography and Transportation Data (ID #33116-E1). N.d.
– Palo Alto (1:100,000 Scale). 1982.– Palo Alto DLG Hydrography and Transportation Data (ID #
37122-A1). N.d.– Paso Robles DLG Hydrography and Transportation Data (ID #
35120-E1). N.d.– Point Conception DLG Hydrography and Transportation Data
(ID # 34120-A1). N.d.– Point Sur DLG Hydrography and Transportation Data (ID #
36121-A1). N.d.– Sacramento (1:250,000 Scale). 1970.– Sacramento DEM Data (ID # 38120-A1). N.d.– Sacramento DLG Hydrography and Transportation Data (ID #
38121-A1). N.d.– San Bernardino (1:250,000 Scale). 1969.– San Bernardino DEM Data (ID # 34116-A1). N.d.– San Bernardino DLG Hydrography and Transportation Data (ID
# 34117-A1). N.d.– San Diego (1:250,000 Scale). 1978.– San Diego DEM Data (ID # 32116-A1). N.d.– San Diego DLG Hydrography and Transportation Data (ID #
32117-E1). N.d.– San Francisco (1:100,000 Scale). 1978.– San Francisco (1:250,000 Scale). 1980.– San Francisco DEM Data (ID # 37122-A1). N.d.– San Francisco DLG Hydrography and Transportation Data (ID
# 37120-A1). N.d.– San Jose (1:100,000 Scale). 1978.– San Jose (1:250,000 Scale). 1969.– San Jose DEM Data (ID # 37120-A1). N.d.– San Jose DLG Hydrography and Transportation Data (ID #
37121-A1). N.d.– San Luis Obispo (1:250,000 Scale). 1979.
– San Luis Obispo DEM Data (ID # 35120-A1). N.d.– San Luis Obispo DLG Hydrography and Transportation Data
(ID # 35120-A1). N.d.– Santa Ana (1:250,000 Scale). 1979.– Santa Ana DEM Data (ID # 33116-A1). N.d.– Santa Ana DLG Hydrography and Transportation Data (ID #
33117-E1). N.d.– Santa Barbara DLG Hydrography and Transportation Data (ID
# 34119-A1). N.d.– Santa Maria (1:250,000 Scale). 1989.– Santa Maria DEM Data (ID # 34120-A1). N.d.– Santa Maria DLG Hydrography and Transportation Data (ID #
34120-E1). N.d.– Shaver Lake DLG Hydrography and Transportation Data (ID #
37119-A1). N.d.– Stockton (1:100,000 Scale). 1989.– Stockton DLG Hydrography and Transportation Data (ID #
37121-E1). N.d.– Taft (1:100,000 Scale). 1981.– Taft DLG Hydrography and Transportation Data (ID # 35119-
A1). N.d.– Tehachapi (1:100,000 Scale). 1978.– Tehachapi DLG Hydrography and Transportation Data (ID #
35118-A1). N.d.– Visalia (1:100,000 Scale). 1993.– Visalia DLG Hydrography and Transportation Data (ID #
36119-A1). N.d.

Appendix ECapital Cost Summary Sheets

HSR Corridor EvaluationAlternative Comparison: Staff Recommended CorridorLOSSAN-C, Grapevine, West 99, Pacheco 1
VHS Cost Estimate
CAPITAL COSTS Track & Guideway System
Segment Station Station Earthwork Structures, Grade Right Environmental Rail & Signals & Electrification SegmentNo. Name Cost Ballasted Direct Special and Related Tunnels & Separation of Impact Utility Communications Items Subtotals
Fixation Trackwork Items Crash and Way Mitigation Relocation (km) (miles) Sound Walls
San Diego to Los AngelesI/5-13 c 6.17 3.83 $905,960 $0 $135,894 $638,819 $0 $115,200,000 $4,920,000 $4,028,572 $112,000 $5,999,436 $6,373,632 $138,314,313I/5-14 c 17.70 11.00 $6,240,190 $0 $936,029 $15,091,486 $47,880,000 $14,100,000 $4,920,000 $3,600,757 $4,893,000 $7,680,247 $18,284,288 $123,625,997I/5-12 c 106.75 66.33 $51,491,330 $0 $7,723,700 $87,453,318 $402,897,000 $103,130,000 $14,760,000 $25,639,706 $40,936,000 $35,965,369 $110,300,160 $880,296,583I/5-11 c Union Station $95,000,000 73.52 45.69 $16,791,500 $0 $2,518,725 $7,187,868 $84,190,000 $381,130,000 $17,220,000 $18,407,236 $0 $28,570,220 $75,966,208 $726,981,757
Subtotals = $95,000,000 204.1 126.9 $75,428,980 $0 $11,314,347 $110,371,491 $534,967,000 $613,560,000 $41,820,000 $51,676,271 $45,941,000 $78,215,272 $210,924,288 $1,869,218,649Riverside to Los Angeles
LA-3 Riverside $110,000,000 28.84 17.92 $20,637,925 $8,514,905 $4,372,925 $6,164,926 $80,142,556 $143,400,000 $73,871,543 $12,583,808 $10,191,933 $40,810,482 $31,353,060 $542,044,062LA-4 Ontario, E. San Gabriel $82,500,000 66.47 41.30 $41,771,785 $15,382,955 $8,573,211 $11,979,686 $172,831,308 $576,300,000 $166,966,528 $35,235,412 $37,457,233 $81,012,420 $62,238,600 $1,292,249,139
Subtotals = $192,500,000 95.3 59.2 $62,409,710 $23,897,860 $12,946,136 $18,144,612 $252,973,864 $719,700,000 $240,838,072 $47,819,219 $47,649,167 $121,822,902 $93,591,660 $1,834,293,201Los Angeles to Bakersfield
C-1 (At Grade) Union Station, Burbank $165,000,000 40.09 24.91 $14,632,535 $31,540,390 $6,925,939 $1,703,814 $288,625,944 * $122,588,445 $17,226,112 $18,312,900 $50,826,102 $39,047,660 $756,429,840I/5-1 (3.5%) Santa Clarita $27,500,000 92.03 57.19 $41,674,245 $54,323,900 $14,399,722 $367,993,668 $1,039,431,128 * $98,139,024 $54,764,448 $7,444,050 $114,279,492 $87,796,360 $1,907,746,035SR/99-6 a 44.78 27.83 $26,878,095 $16,224,883 $6,465,447 $61,169,767 $14,725,460 * $47,374,582 $8,346,604 $3,604,181 $57,558,120 $44,219,600 $286,566,739
Subtotals = $192,500,000 176.9 109.9 $83,184,874 $102,089,173 $27,791,107 $430,867,249 $1,342,782,532 $0 $268,102,051 $80,337,164 $29,361,130 $222,663,714 $171,063,620 $2,950,742,614Bakersfield to Stockton
SR/99-10 Bakersfield $27,500,000 129.58 80.52 $101,037,970 $310,170 $15,202,221 $28,179,919 $15,376,140 $67,580,000 $143,928,912 $20,172,756 $10,317,419 $164,281,524 $126,210,920 $720,097,950SR/99-35 Tulare County $13,200,000 24.69 15.34 $19,282,890 $0 $2,892,434 $5,485,872 $247,542 $89,060,000 $25,864,874 $5,999,400 $1,796,356 $31,301,982 $24,048,060 $219,179,409SR/99-37 18.76 11.66 $14,651,560 $0 $2,197,734 $4,195,705 $112,583 $30,720,000 $17,138,142 $3,356,773 $820,529 $23,783,928 $18,272,240 $115,249,193SR/99-39 Fresno $27,500,000 15.43 9.59 $12,050,830 $0 $1,807,625 $3,400,518 $113,596 $40,100,000 $14,367,567 $3,217,928 $833,161 $19,562,154 $15,028,820 $137,982,199SR/99-20 61.90 38.46 $48,125,220 $413,560 $7,280,817 $13,508,732 $21,171,693 $19,220,000 $72,603,872 $9,851,571 $7,294,395 $78,476,820 $60,290,600 $338,237,280SR/99-22 Merced $13,200,000 27.23 16.92 $21,184,625 $155,085 $3,200,957 $5,974,602 $7,904,758 $10,630,000 $30,588,467 $4,292,863 $2,412,720 $34,522,194 $26,522,020 $160,588,289SR/99-27a Modesto $13,200,000 63.05 39.18 $49,187,380 $103,390 $7,393,616 $13,292,248 $10,937,200 $197,300,000 $101,724,492 $16,667,294 $34,292,643 $79,934,790 $61,410,700 $585,443,752
Subtotals = $94,600,000 340.6 211.7 $265,520,475 $982,205 $39,975,402 $74,037,595 $55,863,510 $454,610,000 $406,216,324 $63,558,585 $57,767,222 $431,863,392 $331,783,360 $2,276,778,071Central Valley to San Jose - Pacheco 1
SR/99-46 26.40 16.40 $20,509,060 $206,780 $3,107,376 $5,776,065 $1,925,417 $16,550,000 $29,327,285 $4,166,699 $2,304,469 $33,469,920 $25,713,600 $143,056,671SR/99-42 39.29 24.41 $30,494,145 $361,865 $4,628,402 $8,575,766 $3,284,304 $848,816 $43,646,554 $5,500,495 $3,429,644 $49,811,862 $38,268,460 $188,850,312
SR/99-23b Los Banos $13,200,000 28.70 17.83 $21,922,670 $930,510 $3,427,977 $4,677,831 $6,153,368 $7,080,000 $31,882,313 $4,287,587 $2,505,237 $36,385,860 $27,953,800 $160,407,154SR/99-34 Gilroy $13,200,000 55.94 34.76 $27,639,590 $28,801,500 $8,466,164 $536,954,454 $521,195,342 $160,780,000 $73,961,036 $44,773,010 $11,583,188 $69,589,542 $53,462,860 $1,550,406,686US/101-1 San Jose $55,000,000 57.25 35.58 $20,602,780 $44,014,600 $9,692,607 $11,455,825 $352,968,400 $169,180,000 $107,519,981 $25,702,183 $15,719,614 $71,022,156 $54,563,480 $937,441,627
Subtotals = $81,400,000 207.6 129.0 $121,168,245 $74,315,255 $29,322,525 $567,439,941 $885,526,831 $354,438,816 $286,337,169 $84,429,974 $35,542,153 $260,279,340 $199,962,200 $2,980,162,449San Jose to San Francisco
US/101-3 Palo Alto $27,500,000 28.70 17.83 $13,042,700 $17,724,000 $4,615,005 $6,351,885 $151,378,083 $152,270,000 $76,610,718 $15,415,602 $27,812,790 $36,221,046 $27,827,180 $556,769,009C-5 a SFO $55,000,000 18.80 11.68 $12,781,065 $5,073,495 $2,678,184 $51,208,215 $59,890,680 $79,610,000 $50,499,900 $9,875,621 $23,058,180 $25,102,440 $19,285,200 $394,062,979C-5 b 4th and Townsend $110,000,000 22.05 13.70 $14,058,000 $4,874,100 $2,839,815 $39,736,513 $235,094,640 $140,540,000 $65,327,100 $17,368,671 $28,735,200 $27,004,140 $20,746,200 $706,324,379
Subtotals = $192,500,000 69.6 43.2 $39,881,765 $27,671,595 $10,133,004 $97,296,612 $446,363,403 $372,420,000 $192,437,718 $42,659,894 $79,606,170 $88,327,626 $67,858,580 $1,657,156,367Stockton to Sacramento
SR/99-41 a Stockton, Sacramento $123,200,000 92.87 57.71 $64,081,050 $15,981,140 $12,009,329 $23,293,369 $176,890,228 $261,000,000 $247,903,742 $32,798,308 $83,922,102 $117,740,586 $90,455,380 $1,249,275,234Subtotals = $123,200,000 92.9 57.7 $64,081,050 $15,981,140 $12,009,329 $23,293,369 $176,890,228 $261,000,000 $247,903,742 $32,798,308 $83,922,102 $117,740,586 $90,455,380 $1,249,275,234
Subtotals = $971,700,000 1187 737.6 $711,675,099 $244,937,228 $143,491,849 $1,321,450,870 $3,695,367,368 $2,775,728,816 $1,683,655,076 $403,279,415 $379,788,943 $1,320,912,832 $1,165,639,088 $14,817,626,585
Program Implementation (25.5%) = $3,778,494,779
Contingency (25%) = $3,704,406,646
Vehicle Costs = $1,178,000,000
Support Facility Costs = $304,000,000
Alternative Total = $23,782,528,010
Length

HSR Corridor EvaluationAlternative Comparison: Authority Option AQualcomm, Inland Empire, Palmdale/Mojave, West 99, Pacheco 1
VHS Cost Estimate
CAPITAL COSTS Track & Guideway System
Segment Station Station Earthwork Structures, Grade Right Environmental Rail & Signals & Electrification SegmentNo. Name Cost Ballasted Direct Special and Related Tunnels & Separation of Impact Utility Communications Items Subtotals
Fixation Trackwork Items Crash and Way Mitigation Relocation (km) (miles) Sound Walls
San Diego to Los AngelesSD-5 E. Mission Valley $110,000,000 10.60 6.59 $0 $15,656,200 $2,348,430 $1,104,047 $115,031,412 $0 $23,202,446 $5,527,872 $3,156,775 $13,438,680 $10,324,400 $299,790,262SD-6 Mira Mesa $27,500,000 5.48 3.41 $1,054,350 $6,100,010 $1,073,154 $1,034,750 $49,610,365 $13,500,000 $13,576,749 $3,004,799 $1,925,511 $6,947,544 $5,337,520 $130,664,751SD-7 23.70 14.73 $0 $35,004,900 $5,250,735 $4,631,772 $273,761,456 $0 $60,235,209 $13,217,390 $8,564,943 $30,046,860 $23,083,800 $453,797,065SD-8 Escondido $27,500,000 47.10 29.27 $20,692,595 $31,467,485 $7,824,012 $298,198,561 $350,940,737 $92,020,000 $65,681,502 $29,454,969 $7,849,381 $60,600,840 $46,557,200 $1,038,787,282LA-1 Temecula $27,500,000 49.30 30.64 $35,843,995 $155,085 $5,399,862 $15,625,535 $24,461,288 $293,640,000 $64,013,140 $16,714,393 $14,884,734 $58,318,800 $44,804,000 $601,360,832LA-2 11.15 6.93 $6,915,755 $2,281,965 $1,379,658 $8,229,454 $48,245,592 $75,600,000 $15,992,371 $5,579,053 $4,008,918 $13,185,120 $10,129,600 $191,547,487LA-3 Riverside $55,000,000 28.84 17.92 $20,637,925 $8,514,905 $4,372,925 $6,164,926 $80,142,556 $143,400,000 $73,871,543 $12,583,808 $10,191,933 $40,810,482 $31,353,060 $487,044,062LA-4 Ontario, E. San Gabriel $82,500,000 66.47 41.30 $41,771,785 $15,382,955 $8,573,211 $11,979,686 $172,831,308 $576,300,000 $166,966,528 $35,235,412 $37,457,233 $81,012,420 $62,238,600 $1,292,249,139
Subtotals = $330,000,000 242.6 150.8 $126,916,405 $114,563,505 $36,221,987 $346,968,730 $1,115,024,715 $1,194,460,000 $483,539,488 $121,317,696 $88,039,430 $304,360,746 $233,828,180 $4,495,240,881Los Angeles to BakersfieldC-1 (At Grade) Union Station, Burbank $165,000,000 40.09 24.91 $14,632,535 $31,540,390 $6,925,939 $1,703,814 $288,625,944 * $122,588,445 $17,226,112 $18,312,900 $50,826,102 $39,047,660 $756,429,840
SR/99-1 Santa Clarita $27,500,000 48.51 30.14 $23,554,636 $25,951,504 $7,425,921 $134,587,750 $449,124,233 * $46,342,203 $24,094,125 $9,150,125 $60,512,094 $46,489,020 $854,731,609SR/99-3 Palmdale $27,500,000 12.35 7.67 $8,263,712 $2,317,505 $1,587,183 $37,565,608 $28,399,100 * $18,654,940 $3,825,286 $2,713,158 $15,498,958 $12,509,386 $158,834,836SR/99-4 124.73 77.51 $84,521,120 $21,428,811 $15,892,490 $347,312,603 $359,371,931 * $134,406,778 $37,894,712 $25,087,217 $155,597,094 $119,539,020 $1,301,051,775SR/99-7 Downtown Bakersfield $55,000,000 4.78 2.97 $0 $13,326,850 $1,041,285 $199,245 $102,847,404 * $19,514,640 $5,265,569 $8,656,344 $16,563,300 $13,369,910 $235,784,547SR/99-9 14.50 9.01 $11,144,870 $0 $1,671,731 $2,026,010 $904,199 $37,770,000 $34,117,529 $3,728,251 $4,650,202 $18,091,506 $13,898,980 $128,003,277
Subtotals = $275,000,000 245.0 152.2 $142,116,873 $94,565,059 $34,544,547 $523,395,030 $1,229,272,810 $37,770,000 $375,624,534 $92,034,055 $68,569,946 $317,089,054 $244,853,976 $3,434,835,884Bakersfield to Stockton
SR99-10 129.58 80.52 $101,037,970 $310,170 $15,202,221 $28,179,919 $15,376,140 $67,580,000 $143,928,912 $20,172,756 $10,317,419 $164,281,524 $126,210,920 $692,597,950SR99-35 Tulare County $13,200,000 24.69 15.34 $19,282,890 $0 $2,892,434 $5,485,872 $247,542 $89,060,000 $25,864,874 $5,999,400 $1,796,356 $31,301,982 $24,048,060 $219,179,409SR99-37 18.76 11.66 $14,651,560 $0 $2,197,734 $4,195,705 $112,583 $30,720,000 $17,138,142 $3,356,773 $820,529 $23,783,928 $18,272,240 $115,249,193SR99-39 Fresno $27,500,000 15.43 9.59 $12,050,830 $0 $1,807,625 $3,400,518 $113,596 $40,100,000 $14,367,567 $3,217,928 $833,161 $19,562,154 $15,028,820 $137,982,199SR99-20 61.90 38.46 $48,125,220 $413,560 $7,280,817 $13,508,732 $21,171,693 $19,220,000 $72,603,872 $9,851,571 $7,294,395 $78,476,820 $60,290,600 $338,237,280SR99-22 Merced $13,200,000 27.23 16.92 $21,184,625 $155,085 $3,200,957 $5,974,602 $7,904,758 $10,630,000 $30,588,467 $4,292,863 $2,412,720 $34,522,194 $26,522,020 $160,588,289
SR99-27a Modesto $13,200,000 63.05 39.18 $49,187,380 $103,390 $7,393,616 $13,292,248 $10,937,200 $197,300,000 $101,724,492 $16,667,294 $34,292,643 $79,934,790 $61,410,700 $585,443,752Subtotals = $67,100,000 340.6 211.7 $265,520,475 $982,205 $39,975,402 $74,037,595 $55,863,510 $454,610,000 $406,216,324 $63,558,585 $57,767,222 $431,863,392 $331,783,360 $2,249,278,071
Central Valley to San Jose - Pacheco 1SR/99-46 26.40 16.40 $20,509,060 $206,780 $3,107,376 $5,776,065 $1,925,417 $16,550,000 $29,327,285 $4,166,699 $2,304,469 $33,469,920 $25,713,600 $143,056,671SR/99-42 39.29 24.41 $30,494,145 $361,865 $4,628,402 $8,575,766 $3,284,304 $848,816 $43,646,554 $5,500,495 $3,429,644 $49,811,862 $38,268,460 $188,850,312SR/99-23b Los Banos $13,200,000 28.70 17.83 $21,922,670 $930,510 $3,427,977 $4,677,831 $6,153,368 $7,080,000 $31,882,313 $4,287,587 $2,505,237 $36,385,860 $27,953,800 $160,407,154SR/99-34 Gilroy $13,200,000 55.94 34.76 $27,639,590 $28,801,500 $8,466,164 $536,954,454 $521,195,342 $160,780,000 $73,961,036 $44,773,010 $11,583,188 $69,589,542 $53,462,860 $1,550,406,686US/101-1 San Jose $55,000,000 57.25 35.58 $20,602,780 $44,014,600 $9,692,607 $11,455,825 $352,968,400 $169,180,000 $107,519,981 $25,702,183 $15,719,614 $71,022,156 $54,563,480 $937,441,627
Subtotals = $81,400,000 207.6 129.0 $121,168,245 $74,315,255 $29,322,525 $567,439,941 $885,526,831 $354,438,816 $286,337,169 $84,429,974 $35,542,153 $260,279,340 $199,962,200 $2,980,162,449San Jose to San Francisco
US/101-3 Palo Alto $27,500,000 28.70 17.83 $13,042,700 $17,724,000 $4,615,005 $6,351,885 $151,378,083 $152,270,000 $76,610,718 $15,415,602 $27,812,790 $36,221,046 $27,827,180 $556,769,009C-5 a SFO $55,000,000 18.80 11.68 $12,781,065 $5,073,495 $2,678,184 $51,208,215 $59,890,680 $79,610,000 $50,499,900 $9,875,621 $23,058,180 $25,102,440 $19,285,200 $394,062,979C-5 b 4th and Townsend $110,000,000 22.05 13.70 $14,058,000 $4,874,100 $2,839,815 $39,736,513 $235,094,640 $140,540,000 $65,327,100 $17,368,671 $28,735,200 $27,004,140 $20,746,200 $706,324,379
Subtotals = $192,500,000 69.6 43.2 $39,881,765 $27,671,595 $10,133,004 $97,296,612 $446,363,403 $372,420,000 $192,437,718 $42,659,894 $79,606,170 $88,327,626 $67,858,580 $1,657,156,367Stockton to Sacramento
SR/99-41 a Stockton, Sacramento $123,200,000 92.87 57.71 $64,081,050 $15,981,140 $12,009,329 $23,293,369 $176,890,228 $261,000,000 $247,903,742 $32,798,308 $83,922,102 $117,740,586 $90,455,380 $1,249,275,234Subtotals = $123,200,000 92.9 57.7 $64,081,050 $15,981,140 $12,009,329 $23,293,369 $176,890,228 $261,000,000 $247,903,742 $32,798,308 $83,922,102 $117,740,586 $90,455,380 $1,249,275,234
Subtotals = $1,069,200,000 1198 745 $759,684,813 $328,078,759 $162,206,793 $1,632,431,278 $3,908,941,496 $2,674,698,816 $1,992,058,976 $436,798,511 $413,447,022 $1,519,660,744 $1,168,741,676 $16,065,948,885
Program Implementation (25.5%) = $4,096,816,966
Contingency (25%) = $4,016,487,221
Vehicle Costs = $1,178,000,000
Support Facility Costs = $304,000,000
Alternative Total = $25,661,253,072
Length

HSR Corridor EvaluationAlternative Comparison: Authority Option AQualcomm, Inland Empire, Palmdale/Mojave, West 99, Pacheco 1
Maglev Cost Estimate
CAPITAL COSTS Track & Guideway System
Segment Station Station Earthwork Structures, Grade Right Environmental Rail & Signals & Electrification SegmentNo. Name Cost Ballasted Direct Special and Related Tunnels & Separation of Impact Utility Communications Items Subtotals
Fixation Trackwork Items Crash and Way Mitigation Relocation (km) (miles) Sound Walls
San Diego to Los AngelesSD-5 E. Mission Valley $110,000,000 10.60 6.59 $0 $22,967,550 $3,445,133 $1,104,047 $115,031,412 $0 $23,202,446 $5,527,872 $3,156,775 $14,551,680 $32,648,000 $331,634,915SD-6 Mira Mesa $27,500,000 5.48 3.41 $4,449,060 $8,948,678 $2,009,661 $1,034,750 $49,610,365 $13,500,000 $13,576,749 $3,004,799 $1,925,511 $7,522,944 $16,878,400 $149,960,915SD-7 23.70 14.73 $0 $51,351,975 $7,702,796 $4,631,772 $273,761,456 $0 $60,235,209 $13,217,390 $8,564,943 $32,535,360 $72,996,000 $524,996,902SD-8 Escondido $27,500,000 47.10 29.27 $87,316,922 $46,162,609 $20,021,930 $298,198,561 $350,940,737 $92,020,000 $65,681,502 $29,454,969 $7,849,381 $65,619,840 $147,224,000 $1,237,990,450LA-1 Temecula $27,500,000 49.30 30.64 $151,251,562 $227,509 $22,721,861 $15,625,535 $24,461,288 $293,640,000 $64,013,140 $16,714,393 $14,884,734 $63,148,800 $141,680,000 $835,868,821LA-2 11.15 6.93 $29,182,538 $3,347,629 $4,879,525 $8,229,454 $48,245,592 $75,600,000 $15,992,371 $5,579,053 $4,008,918 $14,277,120 $32,032,000 $241,374,201LA-3 Riverside $55,000,000 28.84 17.92 $87,086,230 $12,491,314 $14,936,632 $6,164,926 $80,142,556 $143,400,000 $73,871,543 $12,583,808 $10,191,933 $44,190,432 $99,145,200 $639,204,573LA-4 Ontario, E. San Gabriel $82,500,000 66.47 41.30 $176,265,166 $22,566,701 $29,824,780 $11,979,686 $172,831,308 $576,300,000 $166,966,528 $35,235,412 $37,457,233 $87,721,920 $196,812,000 $1,596,460,735
Subtotals = $330,000,000 242.6 150.8 $535,551,478 $168,063,964 $105,542,316 $346,968,730 $1,115,024,715 $1,194,460,000 $483,539,488 $121,317,696 $88,039,430 $329,568,096 $739,415,600 $5,557,491,512Los Angeles to BakersfieldC-1 (At Grade) Union Station, Burbank $165,000,000 40.09 24.91 $59,132,102 $47,987,570 $16,067,951 $1,703,814 $306,471,864 * $122,588,445 $17,226,112 $18,312,900 $55,035,552 $127,512,000 $937,038,309
SR/99-1 Santa Clarita $27,500,000 48.51 30.14 $103,168,130 $35,589,282 $20,813,612 $134,587,750 $448,523,981 * $46,342,203 $24,094,125 $9,150,125 $65,523,744 $146,866,592 $1,062,159,542SR/99-3 Palmdale $27,500,000 12.35 7.67 $35,207,511 $3,178,217 $5,757,859 $37,561,518 $28,319,527 * $18,654,940 $3,825,286 $2,713,158 $17,260,977 $39,595,508 $219,574,502SR/99-4 124.73 77.51 $359,771,139 $29,387,384 $58,373,779 $347,312,603 $358,636,166 * $134,406,778 $37,894,712 $25,087,217 $168,483,744 $366,119,900 $1,885,473,421SR/99-7 Downtown Bakersfield $55,000,000 4.78 2.97 $0 $10,183,725 $1,527,559 $194,937 $102,847,404 * $19,514,640 $5,265,569 $8,656,344 $18,449,000 $42,319,000 $263,958,178SR/99-9 14.50 9.01 $47,028,212 $0 $7,054,232 $2,026,010 $904,199 $37,770,000 $34,117,529 $3,728,251 $4,650,202 $19,589,856 $43,951,600 $200,820,091
Subtotals = $275,000,000 245.0 152.2 $604,307,095 $126,326,178 $109,594,991 $523,386,632 $1,245,703,141 $37,770,000 $375,624,534 $92,034,055 $68,569,946 $344,342,873 $766,364,600 $4,569,024,044Bakersfield to Stockton
SR99-10 129.58 80.52 $426,351,772 $455,018 $64,021,018 $28,179,919 $15,376,140 $67,580,000 $143,928,912 $20,172,756 $10,317,419 $177,887,424 $399,106,400 $1,353,376,777SR99-35 Tulare County $13,200,000 24.69 15.34 $81,368,364 $0 $12,205,255 $5,485,872 $247,542 $89,060,000 $25,864,874 $5,999,400 $1,796,356 $33,894,432 $76,045,200 $345,167,294SR99-37 18.76 11.66 $61,825,456 $0 $9,273,818 $4,195,705 $112,583 $30,720,000 $17,138,142 $3,356,773 $820,529 $25,753,728 $57,780,800 $210,977,533SR99-39 Fresno $27,500,000 15.43 9.59 $50,851,108 $0 $7,627,666 $3,400,518 $113,596 $40,100,000 $14,367,567 $3,217,928 $833,161 $21,182,304 $47,524,400 $216,718,249SR99-20 61.90 38.46 $203,074,872 $606,690 $30,552,234 $13,508,732 $21,171,693 $64,680,000 $72,603,872 $9,851,571 $7,294,395 $84,976,320 $190,652,000 $698,972,379SR99-22 Merced $13,200,000 27.23 16.92 $89,393,150 $227,509 $13,443,099 $5,974,602 $7,904,758 $10,630,000 $30,588,467 $4,292,863 $2,412,720 $37,381,344 $83,868,400 $299,316,910SR99-27a Modesto $13,200,000 63.05 39.18 $207,556,888 $151,673 $31,156,284 $13,292,248 $10,937,200 $197,300,000 $101,724,492 $16,667,294 $34,292,643 $86,555,040 $194,194,000 $907,027,761
Subtotals = $67,100,000 340.6 211.7 $1,120,421,610 $1,440,889 $168,279,375 $74,037,595 $55,863,510 $500,070,000 $406,216,324 $63,558,585 $57,767,222 $467,630,592 $1,049,171,200 $4,031,556,902Central Valley to San Jose - Pacheco 1
SR/99-46 26.40 16.40 $86,542,456 $303,345 $13,026,870 $5,776,065 $1,925,417 $16,550,000 $29,327,285 $4,166,699 $2,304,469 $36,241,920 $81,312,000 $277,476,526SR/99-42 39.29 24.41 $128,676,702 $530,854 $19,381,133 $8,575,766 $3,284,304 $848,816 $43,646,554 $5,500,495 $3,429,644 $53,937,312 $121,013,200 $388,824,780
SR/99-23 b Los Banos $13,200,000 28.70 17.83 $92,507,492 $1,365,053 $14,080,882 $4,677,831 $6,153,368 $7,080,000 $31,882,313 $4,287,587 $2,505,237 $39,399,360 $88,396,000 $305,535,123SR/99-34 Gilroy $13,200,000 55.94 34.76 $116,631,284 $42,251,625 $23,832,436 $536,954,454 $521,195,342 $160,780,000 $73,961,036 $44,773,010 $11,583,188 $75,352,992 $169,061,200 $1,789,576,568US/101-1 San Jose $55,000,000 57.25 35.58 $86,937,928 $64,569,150 $22,726,062 $11,455,825 $352,968,400 $169,180,000 $107,519,981 $25,702,183 $15,719,614 $76,904,256 $172,541,600 $1,161,224,999
Subtotals = $81,400,000 207.6 129.0 $511,295,862 $109,020,026 $93,047,383 $567,439,941 $885,526,831 $354,438,816 $286,337,169 $84,429,974 $35,542,153 $281,835,840 $632,324,000 $3,922,637,996San Jose to San Francisco
US/101-3 Palo Alto $27,500,000 28.70 17.83 $55,036,520 $26,001,000 $12,155,628 $6,351,885 $151,378,083 $152,270,000 $76,610,718 $15,415,602 $27,812,790 $39,220,896 $87,995,600 $677,748,722C-5 a SFO $55,000,000 18.80 11.68 $53,932,494 $7,442,786 $9,206,292 $51,208,215 $59,890,680 $79,610,000 $50,499,900 $9,875,621 $23,058,180 $27,181,440 $60,984,000 $487,889,608C-5 b 4th and Townsend $110,000,000 22.05 13.70 $59,320,800 $7,150,275 $9,970,661 $39,736,513 $235,094,640 $140,540,000 $65,327,100 $17,368,671 $28,735,200 $29,240,640 $65,604,000 $808,088,500
Subtotals = $192,500,000 69.6 43.2 $168,289,814 $40,594,061 $31,332,581 $97,296,612 $446,363,403 $372,420,000 $192,437,718 $42,659,894 $79,606,170 $95,642,976 $214,583,600 $1,973,726,830Stockton to Sacramento
SR/99-41 a Stockton, Sacramento $123,200,000 92.87 57.71 $270,403,980 $23,444,235 $44,077,232 $23,293,369 $176,890,228 $261,000,000 $247,903,742 $32,798,308 $83,922,102 $127,491,936 $286,039,600 $1,700,464,732Subtotals = $123,200,000 92.9 57.7 $270,403,980 $23,444,235 $44,077,232 $23,293,369 $176,890,228 $261,000,000 $247,903,742 $32,798,308 $83,922,102 $127,491,936 $286,039,600 $1,700,464,732
Subtotals = $1,069,200,000 1198 745 $3,210,269,839 $468,889,353 $551,873,879 $1,632,422,880 $3,925,371,827 $2,720,158,816 $1,992,058,976 $436,798,511 $413,447,022 $1,646,512,313 $3,687,898,600 $21,754,902,016
Program Implementation (25.5%) = $5,547,500,014
Contingency (25%) = $5,438,725,504
Vehicle Costs = $1,116,000,000
Support Facility Costs = $304,000,000
Alternative Total = $34,161,127,534
Length

HSR Corridor EvaluationAlternative Comparison: Authority Option BQualcomm, Inland Empire, Grapevine, West 99, Pacheco 1
VHS Cost Estimate
CAPITAL COSTS Track & Guideway System
Segment Station Station Earthwork Structures, Grade Right Environmental Rail & Signals & Electrification SegmentNo. Name Cost Ballasted Direct Special and Related Tunnels & Separation of Impact Utility Communications Items Subtotals
Fixation Trackwork Items Crash and Way Mitigation Relocation (km) (miles) Sound Walls
San Diego to Los AngelesSD-5 E. Mission Valley $110,000,000 10.60 6.59 $0 $15,656,200 $2,348,430 $1,104,047 $115,031,412 $0 $23,202,446 $5,527,872 $3,156,775 $13,438,680 $10,324,400 $299,790,262SD-6 Mira Mesa $27,500,000 5.48 3.41 $1,054,350 $6,100,010 $1,073,154 $1,034,750 $49,610,365 $13,500,000 $13,576,749 $3,004,799 $1,925,511 $6,947,544 $5,337,520 $130,664,751SD-7 23.70 14.73 $0 $35,004,900 $5,250,735 $4,631,772 $273,761,456 $0 $60,235,209 $13,217,390 $8,564,943 $30,046,860 $23,083,800 $453,797,065SD-8 Escondido $27,500,000 47.10 29.27 $20,692,595 $31,467,485 $7,824,012 $298,198,561 $350,940,737 $92,020,000 $65,681,502 $29,454,969 $7,849,381 $60,600,840 $46,557,200 $1,038,787,282LA-1 Temecula $27,500,000 49.30 30.64 $35,843,995 $155,085 $5,399,862 $15,625,535 $24,461,288 $293,640,000 $64,013,140 $16,714,393 $14,884,734 $58,318,800 $44,804,000 $601,360,832LA-2 11.15 6.93 $6,915,755 $2,281,965 $1,379,658 $8,229,454 $48,245,592 $75,600,000 $15,992,371 $5,579,053 $4,008,918 $13,185,120 $10,129,600 $191,547,487LA-3 Riverside $55,000,000 28.84 17.92 $20,637,925 $8,514,905 $4,372,925 $6,164,926 $80,142,556 $143,400,000 $73,871,543 $12,583,808 $10,191,933 $40,810,482 $31,353,060 $487,044,062LA-4 Ontario, E. San Gabriel $82,500,000 66.47 41.30 $41,771,785 $15,382,955 $8,573,211 $11,979,686 $172,831,308 $576,300,000 $166,966,528 $35,235,412 $37,457,233 $81,012,420 $62,238,600 $1,292,249,139
Subtotals = $330,000,000 242.6 150.8 $126,916,405 $114,563,505 $36,221,987 $346,968,730 $1,115,024,715 $1,194,460,000 $483,539,488 $121,317,696 $88,039,430 $304,360,746 $233,828,180 $4,495,240,881Los Angeles to BakersfieldC-1 (At Grade) Union Station, Burbank $165,000,000 40.09 24.91 $14,632,535 $31,540,390 $6,925,939 $1,703,814 $288,625,944 * $122,588,445 $17,226,112 $18,312,900 $50,826,102 $39,047,660 $756,429,840
I/5-1 (3.5%) Santa Clarita $27,500,000 92.03 57.19 $41,674,245 $54,323,900 $14,399,722 $367,993,668 $1,039,431,128 * $98,139,024 $54,764,448 $7,444,050 $114,279,492 $87,796,360 $1,907,746,035SR 99-6 a 44.78 27.83 $26,878,095 $16,224,883 $6,465,447 $61,169,767 $14,725,460 * $47,374,582 $8,346,604 $3,604,181 $57,558,120 $44,219,600 $286,566,739
Subtotals = $192,500,000 176.9 109.9 $83,184,874 $102,089,173 $27,791,107 $430,867,249 $1,342,782,532 $0 $268,102,051 $80,337,164 $29,361,130 $222,663,714 $171,063,620 $2,950,742,614Bakersfield to Stockton
SR99-10 Bakersfield $27,500,000 129.58 80.52 $101,037,970 $310,170 $15,202,221 $28,179,919 $15,376,140 $67,580,000 $143,928,912 $20,172,756 $10,317,419 $164,281,524 $126,210,920 $720,097,950SR99-35 Tulare County $13,200,000 24.69 15.34 $19,282,890 $0 $2,892,434 $5,485,872 $247,542 $89,060,000 $25,864,874 $5,999,400 $1,796,356 $31,301,982 $24,048,060 $219,179,409SR99-37 18.76 11.66 $14,651,560 $0 $2,197,734 $4,195,705 $112,583 $30,720,000 $17,138,142 $3,356,773 $820,529 $23,783,928 $18,272,240 $115,249,193SR99-39 Fresno $27,500,000 15.43 9.59 $12,050,830 $0 $1,807,625 $3,400,518 $113,596 $40,100,000 $14,367,567 $3,217,928 $833,161 $19,562,154 $15,028,820 $137,982,199SR99-20 61.90 38.46 $48,125,220 $413,560 $7,280,817 $13,508,732 $21,171,693 $19,220,000 $72,603,872 $9,851,571 $7,294,395 $78,476,820 $60,290,600 $338,237,280SR99-22 Merced $13,200,000 27.23 16.92 $21,184,625 $155,085 $3,200,957 $5,974,602 $7,904,758 $10,630,000 $30,588,467 $4,292,863 $2,412,720 $34,522,194 $26,522,020 $160,588,289SR99-27a Modesto $13,200,000 63.05 39.18 $49,187,380 $103,390 $7,393,616 $13,292,248 $10,937,200 $197,300,000 $101,724,492 $16,667,294 $34,292,643 $79,934,790 $61,410,700 $585,443,752
Subtotals = $94,600,000 340.6 211.7 $265,520,475 $982,205 $39,975,402 $74,037,595 $55,863,510 $454,610,000 $406,216,324 $63,558,585 $57,767,222 $431,863,392 $331,783,360 $2,276,778,071Central Valley to San Jose - Pacheco 1
SR/99-46 26.40 16.40 $20,509,060 $206,780 $3,107,376 $5,776,065 $1,925,417 $16,550,000 $29,327,285 $4,166,699 $2,304,469 $33,469,920 $25,713,600 $143,056,671SR/99-42 39.29 24.41 $30,494,145 $361,865 $4,628,402 $8,575,766 $3,284,304 $848,816 $43,646,554 $5,500,495 $3,429,644 $49,811,862 $38,268,460 $188,850,312
SR/99-23b Los Banos $13,200,000 28.70 17.83 $21,922,670 $930,510 $3,427,977 $4,677,831 $6,153,368 $7,080,000 $31,882,313 $4,287,587 $2,505,237 $36,385,860 $27,953,800 $160,407,154SR/99-34 Gilroy $13,200,000 55.94 34.76 $27,639,590 $28,801,500 $8,466,164 $536,954,454 $521,195,342 $160,780,000 $73,961,036 $44,773,010 $11,583,188 $69,589,542 $53,462,860 $1,550,406,686US/101-1 San Jose $55,000,000 57.25 35.58 $20,602,780 $44,014,600 $9,692,607 $11,455,825 $352,968,400 $169,180,000 $107,519,981 $25,702,183 $15,719,614 $71,022,156 $54,563,480 $937,441,627
Subtotals = $81,400,000 207.6 129.0 $121,168,245 $74,315,255 $29,322,525 $567,439,941 $885,526,831 $354,438,816 $286,337,169 $84,429,974 $35,542,153 $260,279,340 $199,962,200 $2,980,162,449San Jose to San Francisco
US/101-3 Palo Alto $27,500,000 28.70 17.83 $13,042,700 $17,724,000 $4,615,005 $6,351,885 $151,378,083 $152,270,000 $76,610,718 $15,415,602 $27,812,790 $36,221,046 $27,827,180 $556,769,009C-5 a SFO $55,000,000 18.80 11.68 $12,781,065 $5,073,495 $2,678,184 $51,208,215 $59,890,680 $79,610,000 $50,499,900 $9,875,621 $23,058,180 $25,102,440 $19,285,200 $394,062,979C-5 b 4th and Townsend $110,000,000 22.05 13.70 $14,058,000 $4,874,100 $2,839,815 $39,736,513 $235,094,640 $140,540,000 $65,327,100 $17,368,671 $28,735,200 $27,004,140 $20,746,200 $706,324,379
Subtotals = $192,500,000 69.6 43.2 $39,881,765 $27,671,595 $10,133,004 $97,296,612 $446,363,403 $372,420,000 $192,437,718 $42,659,894 $79,606,170 $88,327,626 $67,858,580 $1,657,156,367Stockton to Sacramento
SR/99-41 a Stockton, Sacramento $123,200,000 92.87 57.71 $64,081,050 $15,981,140 $12,009,329 $23,293,369 $176,890,228 $261,000,000 $247,903,742 $32,798,308 $83,922,102 $117,740,586 $90,455,380 $1,249,275,234Subtotals = $123,200,000 92.9 57.7 $64,081,050 $15,981,140 $12,009,329 $23,293,369 $176,890,228 $261,000,000 $247,903,742 $32,798,308 $83,922,102 $117,740,586 $90,455,380 $1,249,275,234
Subtotals = $1,014,200,000 1130.2 702.3 $700,752,814 $335,602,873 $155,453,353 $1,539,903,497 $4,022,451,219 $2,636,928,816 $1,884,536,492 $425,101,620 $374,238,206 $1,425,235,404 $1,094,951,320 $15,609,355,615
Program Implementation (25.5%) = $3,980,385,682
Contingency (25%) = $3,902,338,904
Vehicle Costs = $1,178,000,000
Support Facility Costs = $304,000,000
Alternative Total = $24,974,080,201
Length

Appendix FTravel Time/Speed Summary Sheets

HSR Corridor EvaluationAlternative Comparison: Staff Recommended CorridorEnglish Units
VHS Time Estimate
San Diego to Los AngelesSegments Local Travel Time Express Travel Time
Station Length Max V Ta Tv Td Tss Tt* (Avg) Max V Ta Tv Td Tt* Avg VRange
Begin End (miles) (mph) (Min) (Min) (Min) (Min) (Min) (mph) (mph) (Min) (Min) (Min) (Min) (mph)San Diego U. Town Center 12.78 124 2.14 4.22 1.75 0.0 8.60 89 124 2.14 5.10 0.0 7.67 100
U. Town Center Oceanside 24.54 124 2.14 9.90 1.75 2.0 16.74 88 124 0.0 11.85 0.0 12.56 117Oceanside Irvine 45.30 202 3.47 10.30 2.85 2.0 19.74 138 202 0.0 13.46 0.0 14.27 191
Irvine Anaheim 14.48 124 2.14 5.04 1.75 2.0 11.59 75 124 0.0 6.99 0.0 7.41 117Anaheim Norwalk 14.48 93 1.60 7.86 1.32 2.0 13.55 64 93 0.0 9.32 0.0 9.88 88Norwalk Union Station 15.28 93 1.60 8.38 1.32 2.0 14.09 65 93 0.0 9.18 1.32 11.12 82
Total Length = 126.9 Total Travel Time = 84.3 Total Travel Time = 62.9Riverside to Los Angeles
Riverside Ontario 17.92 155 2.67 4.49 2.19 0.0 9.91 108 155 2.67 5.59 0.0 8.75 123Ontario E. San Gabriel 16.09 155 2.67 3.78 2.19 2.0 11.28 86 155 0.0 6.21 0.0 6.59 147
E. San Gabriel Union Station 25.22 124 2.14 10.23 1.75 2.0 17.09 89 124 0.0 11.30 1.75 13.83 109Total Length = 59.2 Total Travel Time = 38.3 Total Travel Time = 29.2
Los Angeles to BakersfieldUnion Station Burbank 11.13 93 1.60 5.70 1.32 2.0 11.26 59 93 1.60 6.36 0.0 8.44 79
Burbank Santa Clarita 21.07 124 2.14 8.22 1.75 2.0 14.96 84 124 0.0 10.17 0.0 10.78 117Santa Clarita Bakersfield 77.73 186 3.21 22.10 2.63 2.0 31.73 147 186 0.0 25.02 0.0 26.52 176
Total Length = 109.9 Total Travel Time = 58.0 Total Travel Time = 45.7Bakersfield to Fresno
Bakersfield Tulare County 69.56 217 3.74 15.78 3.07 2.0 26.07 160 217 0.0 19.19 0.0 20.34 205Tulare County Suburban Fresno 38.04 217 3.74 7.09 3.07 2.0 16.85 135 217 0.0 10.49 0.0 11.12 205
Total Length = 107.6 Total Travel Time = 42.9 Total Travel Time = 31.5Fresno to San Jose
Suburban Fresno Pacheco Junction1 27.24 217 3.74 5.65 0.00 0.0 9.95 164 217 0.0 7.52 0.0 7.97 205Pacheco Junction1 Los Banos 41.88 217 0.00 10.02 3.07 2.0 15.99 157 217 0.0 11.55 0.0 12.25 205
Los Banos Gilroy 36.97 217 3.74 6.80 3.07 2.0 16.54 134 217 0.0 10.20 0.0 10.81 205Gilroy San Jose 29.91 171 2.94 7.83 2.41 0.0 13.97 128 171 0.0 9.30 2.41 12.41 145
Total Length = 136.0 Total Travel Time = 56.5 Total Travel Time = 43.4San Jose to San Francisco
San Jose Redwood City 21.44 124 2.14 8.40 1.75 2.0 15.15 85 124 2.14 9.28 0.0 12.10 106Redwood City SFO 11.68 124 2.14 3.69 1.75 2.0 10.16 69 124 0.0 5.64 0.0 5.98 117
SFO Downtown 13.70 93 1.60 7.36 1.32 2.0 13.02 63 93 0.0 8.16 1.32 10.05 82Total Length = 46.8 Total Travel Time = 38.3 Total Travel Time = 28.1
San Jose to OaklandSan Jose Newark 17.27 124 2.14 6.39 1.75 2.0 13.02 80 124 2.14 7.27 0.0 9.97 104Newark Oakland Airport 18.46 124 2.14 6.96 1.75 2.0 13.63 81 124 0.0 8.91 0.0 9.44 117
Oakland Airport Oakland 7.33 93 1.60 3.26 1.32 2.0 8.67 51 93 0.0 4.06 1.32 5.70 77Total Length = 43.1 Total Travel Time = 35.3 Total Travel Time = 25.1
Fresno to SacramentoSuburban Fresno Suburban Merced 52.91 217 3.74 11.19 3.07 2.0 21.20 150 217 0.0 14.60 0.0 15.47 205Suburban Merced Suburban Modesto 37.52 217 3.74 6.95 3.07 2.0 16.70 135 217 0.0 10.35 0.0 10.97 205Suburban Modesto Stockton 21.54 217 3.74 2.54 3.07 2.0 12.03 107 217 0.0 5.94 0.0 6.30 205
Stockton Sacramento 50.71 186 3.21 13.40 2.63 2.0 22.51 135 186 0.0 15.00 2.63 18.69 163Total Length = 162.7 Total Travel Time = 72.4 Total Travel Time = 51.4
Sacramento to San JoseSacramento Stockton 50.71 186 3.21 13.40 2.63 2.0 22.51 135 186 3.21 14.72 0.0 19.00 160
Stockton Modesto 21.54 217 3.74 2.54 3.07 2.0 12.03 107 217 0.0 5.94 0.0 6.30 205Modesto Merced 37.52 217 3.74 6.95 3.07 2.0 16.70 135 217 0.0 10.35 0.0 10.97 205Merced Los Banos 38.71 217 3.74 7.28 3.07 2.0 17.05 136 217 0.0 10.68 0.0 11.32 205
Los Banos Gilroy 36.97 217 3.74 6.80 3.07 2.0 16.54 134 217 0.0 10.20 0.0 10.81 205Gilroy San Jose 29.91 171 2.94 7.83 2.41 0.0 13.97 128 171 0.0 9.30 2.41 12.41 145
Total Length = 215.4 2.94 98.8 Total Travel Time = 70.8Total Travel Time =
Appendix F-Travel Times;Staff Rec. (VHS);1/21/00

HSR Corridor EvaluationAlternative Comparison: Authority Option AQualcomm, Inland Empire, Palmdale/Mojave, West 99, Pacheco 1English UnitsVHS Time Estimate
San Diego to Los AngelesSegments Local Travel Time Express Travel Time
Station Length Max V Ta Tv Td Tss Tt* (Avg) Max V Ta Tv Td Tt* Avg VRange
Begin End (miles) (mph) (Min) (Min) (Min) (Min) (Min) (mph) (mph) (Min) (Min) (Min) (Min) (mph)East Mission Valley Mira Mesa 9.99 155 2.67 1.43 2.19 0.0 6.67 90 155 2.67 2.52 0.0 5.51 109
Mira Mesa Escondido 14.73 155 2.67 3.26 2.19 2.0 10.73 82 155 0.0 5.69 0.0 6.03 147Escondido Temecula 29.27 202 3.47 5.53 2.85 2.0 14.69 120 202 0.0 8.70 0.0 9.22 191Temecula Riverside 37.56 202 3.47 8.00 2.85 2.0 17.30 130 202 0.0 11.16 0.0 11.83 191Riverside Ontario 17.92 155 2.67 4.49 2.19 2.0 12.03 89 155 0.0 6.92 0.0 7.34 147Ontario E. San Gabriel 16.09 155 2.67 3.78 2.19 2.0 11.28 86 155 0.0 6.21 0.0 6.59 147
E. San Gabriel Union Station 25.22 124 2.14 10.23 1.75 2.0 17.09 89 124 0.0 11.30 1.75 13.83 109Total Length = 150.8 Total Travel Time = 89.8 0 Total Travel Time = 60.3
Los Angeles to BakersfieldUnion Station Burbank 11.13 93 1.60 5.70 1.32 2.0 11.26 59 93 1.60 6.36 0.0 8.44 79
Burbank Santa Clarita 15.99 124 2.14 5.78 1.75 2.0 12.37 78 124 0.00 7.72 0.0 8.19 117Santa Clarita Palmdale 36.75 186 3.21 8.91 2.63 2.0 17.75 124 186 0.0 11.83 0.0 12.54 176
Palmdale Bakersfield 88.31 202 3.47 23.07 2.85 2.0 33.28 159 202 0.0 26.24 0.0 27.81 191Total Length = 152.2 Total Travel Time = 74.7 0 Total Travel Time = 57.0
Bakersfield to FresnoBakersfield Tulare County 69.56 217 3.74 15.78 3.07 2.0 26.07 160 217 0.0 19.19 0.0 20.34 205
Tulare County Suburban Fresno 38.04 217 3.74 7.09 3.07 2.0 16.85 135 217 0.0 10.49 0.0 11.12 205Total Length = 107.6 Total Travel Time = 42.9 0 Total Travel Time = 31.5
Fresno to San JoseSuburban Fresno Pacheco Junction1 27.24 217 3.74 5.65 0.0 0.0 9.95 164 217 0.0 7.52 0.0 7.97 205
Pacheco Junction1 Los Banos 41.88 217 0.0 10.02 3.07 2.0 15.99 157 217 0.0 11.55 0.0 12.25 205Los Banos Gilroy 36.97 217 3.74 6.80 3.07 2.0 16.54 134 217 0.0 10.20 0.0 10.81 205
Gilroy San Jose 29.91 171 2.94 7.83 2.41 0.0 13.97 128 171 0.0 9.30 2.41 12.41 145Total Length = 136.0 Total Travel Time = 56.5 0 Total Travel Time = 43.4
San Jose to San FranciscoSan Jose Redwood City 21.44 124 2.14 8.40 1.75 2.0 15.15 85 124 2.14 9.28 0.0 12.10 106
Redwood City SFO 11.68 124 2.14 3.69 1.75 2.0 10.16 69 124 0.0 5.64 0.0 5.98 117SFO Downtown 13.70 93 1.60 7.36 1.32 2.0 13.02 63 93 0.0 8.16 1.32 10.05 82
Total Length = 46.8 Total Travel Time = 38.3 0 Total Travel Time = 28.1Fresno to Sacramento
Suburban Fresno Suburban Merced 52.91 217 3.74 11.19 3.07 2.0 21.20 150 217 0.0 14.60 0.0 15.47 205Suburban Merced Suburban Modesto 37.52 217 3.74 6.95 3.07 2.0 16.70 135 217 0.0 10.35 0.0 10.97 205Suburban Modesto Stockton 21.54 217 3.74 2.54 3.07 2.0 12.03 107 217 0.0 5.94 0.0 6.30 205
Stockton Sacramento 50.71 186 3.21 13.40 2.63 2.0 22.51 135 186 0.0 15.00 2.63 18.69 163Total Length = 162.7 Total Travel Time = 72.4 0 Total Travel Time = 51.4
Sacramento to San JoseSacramento Stockton 50.71 186 3.21 13.40 2.63 2.0 22.51 135 186 3.21 14.72 0.0 19.00 160
Stockton Modesto 21.54 217 3.74 2.54 3.07 2.0 12.03 107 217 0.0 5.94 0.0 6.30 205Modesto Merced 37.52 217 3.74 6.95 3.07 2.0 16.70 135 217 0.0 10.35 0.0 10.97 205Merced Los Banos 38.71 217 3.74 7.28 3.07 2.0 17.05 136 217 0.0 10.68 0.0 11.32 205
Los Banos Gilroy 36.97 217 3.74 6.80 3.07 2.0 16.54 134 217 0.0 10.20 0.0 10.81 205Gilroy San Jose 29.91 171 2.94 7.83 2.41 0.0 13.97 128 171 0.0 9.30 2.41 12.41 145
Total Length = 215.4 Total Travel Time = 98.8 0 Total Travel Time = 70.8
Appendix F-Travel Times;Auth Opt A (VHS);1/21/00
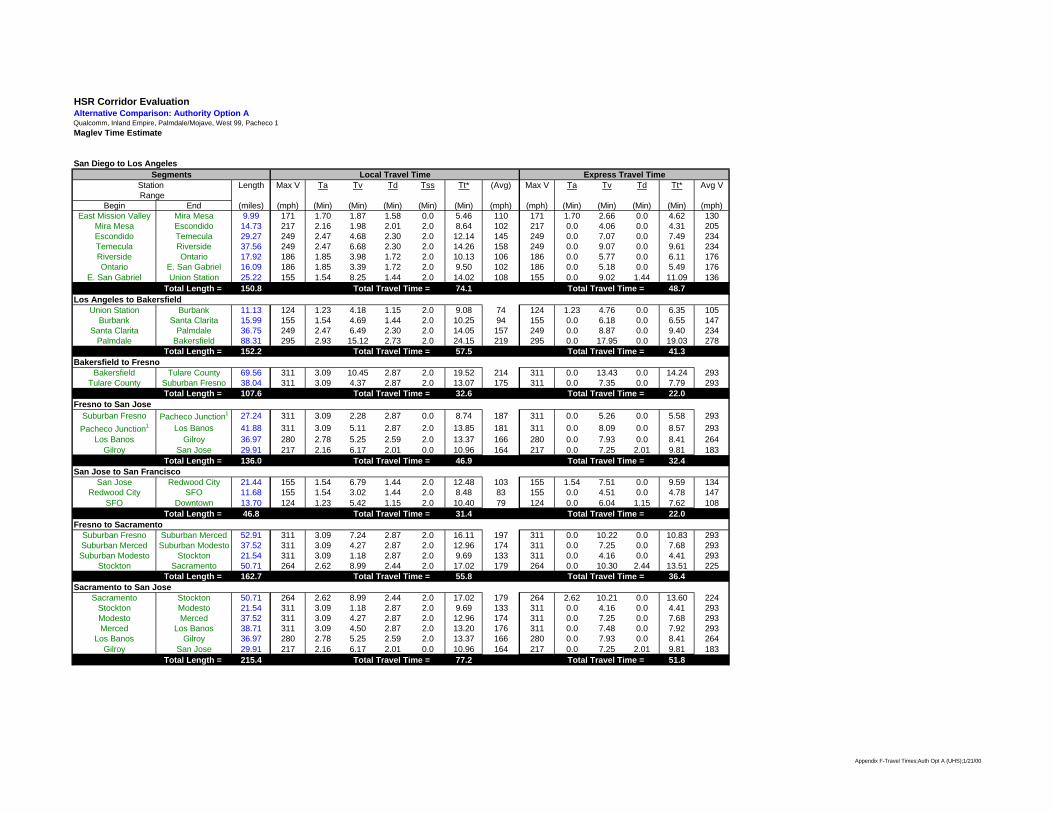
HSR Corridor EvaluationAlternative Comparison: Authority Option AQualcomm, Inland Empire, Palmdale/Mojave, West 99, Pacheco 1Maglev Time Estimate
San Diego to Los AngelesSegments Local Travel Time Express Travel Time
Station Length Max V Ta Tv Td Tss Tt* (Avg) Max V Ta Tv Td Tt* Avg VRange
Begin End (miles) (mph) (Min) (Min) (Min) (Min) (Min) (mph) (mph) (Min) (Min) (Min) (Min) (mph)East Mission Valley Mira Mesa 9.99 171 1.70 1.87 1.58 0.0 5.46 110 171 1.70 2.66 0.0 4.62 130
Mira Mesa Escondido 14.73 217 2.16 1.98 2.01 2.0 8.64 102 217 0.0 4.06 0.0 4.31 205Escondido Temecula 29.27 249 2.47 4.68 2.30 2.0 12.14 145 249 0.0 7.07 0.0 7.49 234Temecula Riverside 37.56 249 2.47 6.68 2.30 2.0 14.26 158 249 0.0 9.07 0.0 9.61 234Riverside Ontario 17.92 186 1.85 3.98 1.72 2.0 10.13 106 186 0.0 5.77 0.0 6.11 176Ontario E. San Gabriel 16.09 186 1.85 3.39 1.72 2.0 9.50 102 186 0.0 5.18 0.0 5.49 176
E. San Gabriel Union Station 25.22 155 1.54 8.25 1.44 2.0 14.02 108 155 0.0 9.02 1.44 11.09 136Total Length = 150.8 Total Travel Time = 74.1 0 Total Travel Time = 48.7
Los Angeles to BakersfieldUnion Station Burbank 11.13 124 1.23 4.18 1.15 2.0 9.08 74 124 1.23 4.76 0.0 6.35 105
Burbank Santa Clarita 15.99 155 1.54 4.69 1.44 2.0 10.25 94 155 0.0 6.18 0.0 6.55 147Santa Clarita Palmdale 36.75 249 2.47 6.49 2.30 2.0 14.05 157 249 0.0 8.87 0.0 9.40 234
Palmdale Bakersfield 88.31 295 2.93 15.12 2.73 2.0 24.15 219 295 0.0 17.95 0.0 19.03 278Total Length = 152.2 Total Travel Time = 57.5 0 Total Travel Time = 41.3
Bakersfield to FresnoBakersfield Tulare County 69.56 311 3.09 10.45 2.87 2.0 19.52 214 311 0.0 13.43 0.0 14.24 293
Tulare County Suburban Fresno 38.04 311 3.09 4.37 2.87 2.0 13.07 175 311 0.0 7.35 0.0 7.79 293Total Length = 107.6 Total Travel Time = 32.6 0 Total Travel Time = 22.0
Fresno to San JoseSuburban Fresno Pacheco Junction1 27.24 311 3.09 2.28 2.87 0.0 8.74 187 311 0.0 5.26 0.0 5.58 293
Pacheco Junction1 Los Banos 41.88 311 3.09 5.11 2.87 2.0 13.85 181 311 0.0 8.09 0.0 8.57 293Los Banos Gilroy 36.97 280 2.78 5.25 2.59 2.0 13.37 166 280 0.0 7.93 0.0 8.41 264
Gilroy San Jose 29.91 217 2.16 6.17 2.01 0.0 10.96 164 217 0.0 7.25 2.01 9.81 183Total Length = 136.0 Total Travel Time = 46.9 0 Total Travel Time = 32.4
San Jose to San FranciscoSan Jose Redwood City 21.44 155 1.54 6.79 1.44 2.0 12.48 103 155 1.54 7.51 0.0 9.59 134
Redwood City SFO 11.68 155 1.54 3.02 1.44 2.0 8.48 83 155 0.0 4.51 0.0 4.78 147SFO Downtown 13.70 124 1.23 5.42 1.15 2.0 10.40 79 124 0.0 6.04 1.15 7.62 108
Total Length = 46.8 Total Travel Time = 31.4 0 Total Travel Time = 22.0Fresno to Sacramento
Suburban Fresno Suburban Merced 52.91 311 3.09 7.24 2.87 2.0 16.11 197 311 0.0 10.22 0.0 10.83 293Suburban Merced Suburban Modesto 37.52 311 3.09 4.27 2.87 2.0 12.96 174 311 0.0 7.25 0.0 7.68 293Suburban Modesto Stockton 21.54 311 3.09 1.18 2.87 2.0 9.69 133 311 0.0 4.16 0.0 4.41 293
Stockton Sacramento 50.71 264 2.62 8.99 2.44 2.0 17.02 179 264 0.0 10.30 2.44 13.51 225Total Length = 162.7 Total Travel Time = 55.8 0 Total Travel Time = 36.4
Sacramento to San JoseSacramento Stockton 50.71 264 2.62 8.99 2.44 2.0 17.02 179 264 2.62 10.21 0.0 13.60 224
Stockton Modesto 21.54 311 3.09 1.18 2.87 2.0 9.69 133 311 0.0 4.16 0.0 4.41 293Modesto Merced 37.52 311 3.09 4.27 2.87 2.0 12.96 174 311 0.0 7.25 0.0 7.68 293Merced Los Banos 38.71 311 3.09 4.50 2.87 2.0 13.20 176 311 0.0 7.48 0.0 7.92 293
Los Banos Gilroy 36.97 280 2.78 5.25 2.59 2.0 13.37 166 280 0.0 7.93 0.0 8.41 264Gilroy San Jose 29.91 217 2.16 6.17 2.01 0.0 10.96 164 217 0.0 7.25 2.01 9.81 183
Total Length = 215.4 Total Travel Time = 77.2 0 Total Travel Time = 51.8
Appendix F-Travel Times;Auth Opt A (UHS);1/21/00
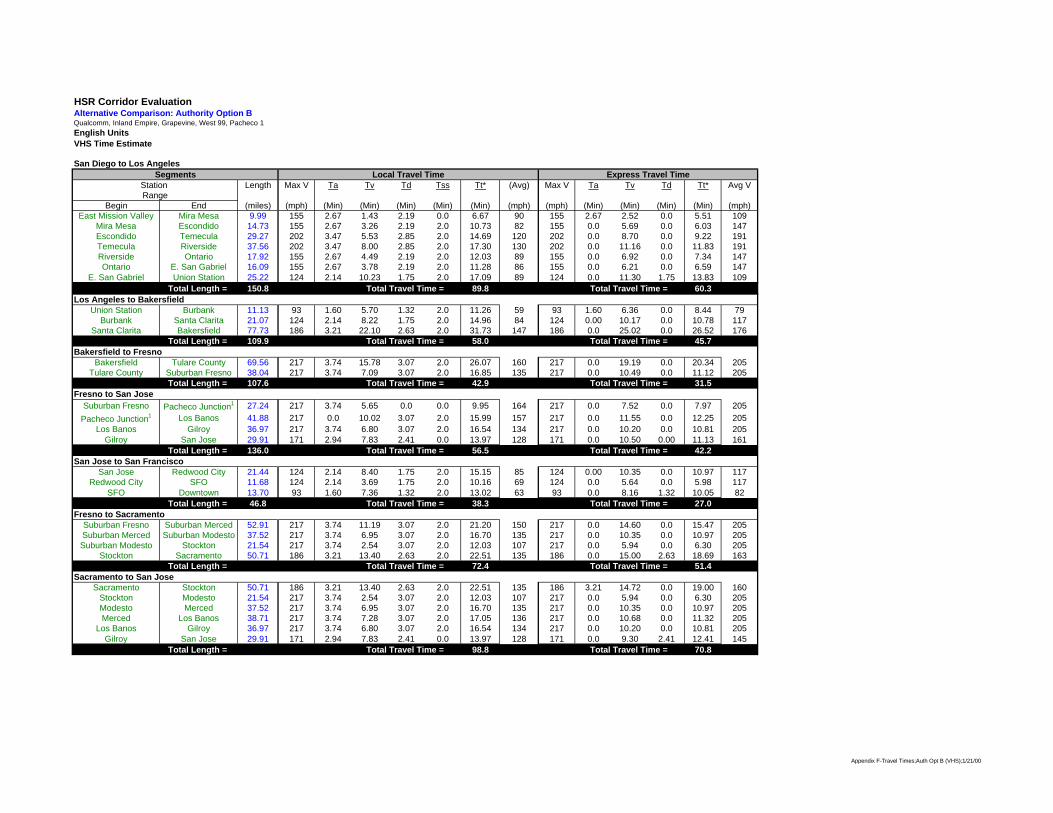
HSR Corridor EvaluationAlternative Comparison: Authority Option BQualcomm, Inland Empire, Grapevine, West 99, Pacheco 1English UnitsVHS Time Estimate
San Diego to Los AngelesSegments Local Travel Time Express Travel Time
Station Length Max V Ta Tv Td Tss Tt* (Avg) Max V Ta Tv Td Tt* Avg VRange
Begin End (miles) (mph) (Min) (Min) (Min) (Min) (Min) (mph) (mph) (Min) (Min) (Min) (Min) (mph)East Mission Valley Mira Mesa 9.99 155 2.67 1.43 2.19 0.0 6.67 90 155 2.67 2.52 0.0 5.51 109
Mira Mesa Escondido 14.73 155 2.67 3.26 2.19 2.0 10.73 82 155 0.0 5.69 0.0 6.03 147Escondido Temecula 29.27 202 3.47 5.53 2.85 2.0 14.69 120 202 0.0 8.70 0.0 9.22 191Temecula Riverside 37.56 202 3.47 8.00 2.85 2.0 17.30 130 202 0.0 11.16 0.0 11.83 191Riverside Ontario 17.92 155 2.67 4.49 2.19 2.0 12.03 89 155 0.0 6.92 0.0 7.34 147Ontario E. San Gabriel 16.09 155 2.67 3.78 2.19 2.0 11.28 86 155 0.0 6.21 0.0 6.59 147
E. San Gabriel Union Station 25.22 124 2.14 10.23 1.75 2.0 17.09 89 124 0.0 11.30 1.75 13.83 109Total Length = 150.8 Total Travel Time = 89.8 0 Total Travel Time = 60.3
Los Angeles to BakersfieldUnion Station Burbank 11.13 93 1.60 5.70 1.32 2.0 11.26 59 93 1.60 6.36 0.0 8.44 79
Burbank Santa Clarita 21.07 124 2.14 8.22 1.75 2.0 14.96 84 124 0.00 10.17 0.0 10.78 117Santa Clarita Bakersfield 77.73 186 3.21 22.10 2.63 2.0 31.73 147 186 0.0 25.02 0.0 26.52 176
Total Length = 109.9 Total Travel Time = 58.0 0 Total Travel Time = 45.7Bakersfield to Fresno
Bakersfield Tulare County 69.56 217 3.74 15.78 3.07 2.0 26.07 160 217 0.0 19.19 0.0 20.34 205Tulare County Suburban Fresno 38.04 217 3.74 7.09 3.07 2.0 16.85 135 217 0.0 10.49 0.0 11.12 205
Total Length = 107.6 Total Travel Time = 42.9 0 Total Travel Time = 31.5Fresno to San Jose
Suburban Fresno Pacheco Junction1 27.24 217 3.74 5.65 0.0 0.0 9.95 164 217 0.0 7.52 0.0 7.97 205
Pacheco Junction1 Los Banos 41.88 217 0.0 10.02 3.07 2.0 15.99 157 217 0.0 11.55 0.0 12.25 205Los Banos Gilroy 36.97 217 3.74 6.80 3.07 2.0 16.54 134 217 0.0 10.20 0.0 10.81 205
Gilroy San Jose 29.91 171 2.94 7.83 2.41 0.0 13.97 128 171 0.0 10.50 0.00 11.13 161Total Length = 136.0 Total Travel Time = 56.5 0 Total Travel Time = 42.2
San Jose to San FranciscoSan Jose Redwood City 21.44 124 2.14 8.40 1.75 2.0 15.15 85 124 0.00 10.35 0.0 10.97 117
Redwood City SFO 11.68 124 2.14 3.69 1.75 2.0 10.16 69 124 0.0 5.64 0.0 5.98 117SFO Downtown 13.70 93 1.60 7.36 1.32 2.0 13.02 63 93 0.0 8.16 1.32 10.05 82
Total Length = 46.8 Total Travel Time = 38.3 0 Total Travel Time = 27.0Fresno to Sacramento
Suburban Fresno Suburban Merced 52.91 217 3.74 11.19 3.07 2.0 21.20 150 217 0.0 14.60 0.0 15.47 205Suburban Merced Suburban Modesto 37.52 217 3.74 6.95 3.07 2.0 16.70 135 217 0.0 10.35 0.0 10.97 205Suburban Modesto Stockton 21.54 217 3.74 2.54 3.07 2.0 12.03 107 217 0.0 5.94 0.0 6.30 205
Stockton Sacramento 50.71 186 3.21 13.40 2.63 2.0 22.51 135 186 0.0 15.00 2.63 18.69 163Total Length = Total Travel Time = 72.4 0 Total Travel Time = 51.4
Sacramento to San JoseSacramento Stockton 50.71 186 3.21 13.40 2.63 2.0 22.51 135 186 3.21 14.72 0.0 19.00 160
Stockton Modesto 21.54 217 3.74 2.54 3.07 2.0 12.03 107 217 0.0 5.94 0.0 6.30 205Modesto Merced 37.52 217 3.74 6.95 3.07 2.0 16.70 135 217 0.0 10.35 0.0 10.97 205Merced Los Banos 38.71 217 3.74 7.28 3.07 2.0 17.05 136 217 0.0 10.68 0.0 11.32 205
Los Banos Gilroy 36.97 217 3.74 6.80 3.07 2.0 16.54 134 217 0.0 10.20 0.0 10.81 205Gilroy San Jose 29.91 171 2.94 7.83 2.41 0.0 13.97 128 171 0.0 9.30 2.41 12.41 145
Total Length = Total Travel Time = 98.8 Total Travel Time = 70.8
Appendix F-Travel Times;Auth Opt B (VHS);1/21/00

Appendix GTravel Time Matrices (Express and Local)

Staff Recommended Corridor - Local Travel Times
Sa
n D
ieg
o
U. T
ow
n C
en
ter
Oc
ea
nsi
de
Irvi
ne
An
ah
eim
No
rwa
lk
Lo
s A
ng
ele
s
Riv
ers
ide
On
tari
o
E. S
an
Ga
bri
el
Bu
rba
nk
Sa
nta
Cla
rita
Ba
ke
rsfi
eld
Tu
lare
Co
un
ty
Fre
sno
Lo
s B
an
os
Gil
roy
Sa
n J
ose
Re
dw
oo
d C
ity
SF
O
Sa
n F
ran
cis
co
Me
rce
d
Mo
de
sto
Sto
ck
ton
Sa
cra
me
nto
San Diego - 9 25 45 57 70 84 123 113 101 96 111 142 168 185 211 228 243 259 270 284 206 223 235 258
U. Town Center 9 - 17 36 48 62 76 114 104 93 87 102 134 160 177 203 219 234 250 261 275 198 214 227 249
Oceanside 25 17 - 20 31 45 59 97 87 76 70 85 117 143 160 186 202 217 233 245 259 181 198 210 232
Irvine 45 36 20 - 12 25 39 78 68 56 50 65 97 123 140 166 183 198 214 225 239 161 178 190 213
Anaheim 57 48 31 12 - 14 28 66 56 45 39 54 86 112 129 154 171 186 202 213 227 150 166 178 201
Norwalk 70 62 45 25 14 - 14 52 42 31 25 40 72 98 115 141 157 172 189 200 214 136 153 165 187
Los Angeles 84 76 59 39 28 14 - 38 28 17 11 26 58 84 101 127 143 158 174 186 200 122 139 151 173
Riverside 123 114 97 78 66 52 38 - 10 21 50 65 96 122 139 165 182 197 213 224 238 160 177 189 212
Ontario 113 104 87 68 56 42 28 10 - 11 40 55 86 112 129 155 172 187 203 214 228 150 167 179 202
E. San Gabriel 101 93 76 56 45 31 17 21 11 - 28 43 75 101 118 144 160 175 192 203 217 139 156 168 190
Burbank 96 87 70 50 39 25 11 50 40 28 - 15 47 73 90 116 132 147 163 174 188 111 128 140 162
Santa Clarita 111 102 85 65 54 40 26 65 55 43 15 - 32 58 75 101 117 132 148 159 173 96 113 125 147
Bakersfield 142 134 117 97 86 72 58 96 86 75 47 32 - 26 43 69 85 100 117 128 142 64 81 93 115
Tulare 168 160 143 123 112 98 84 122 112 101 73 58 26 - 17 43 59 74 90 102 116 38 55 67 89
Fresno 185 177 160 140 129 115 101 139 129 118 90 75 43 17 - 26 42 57 74 85 99 21 38 50 72
Los Banos 211 203 186 166 154 141 127 165 155 144 116 101 69 43 26 - 17 32 48 59 73 17 34 46 68
Gilroy 228 219 202 183 171 157 143 182 172 160 132 117 85 59 42 17 - 15 31 42 56 34 50 62 85
San Jose 243 234 217 198 186 172 158 197 187 175 147 132 100 74 57 32 15 - 16 27 41 49 65 77 100
Redwood City 259 250 233 214 202 189 174 213 203 192 163 148 117 90 74 48 31 16 - 11 25 65 81 93 116
SFO 270 261 245 225 213 200 186 224 214 203 174 159 128 102 85 59 42 27 11 - 14 76 93 105 127
San Francisco 284 275 259 239 227 214 200 238 228 217 188 173 142 116 99 73 56 41 25 14 - 90 107 119 141
Merced 206 198 181 161 150 136 122 160 150 139 111 96 64 38 21 17 34 49 65 76 90 - 17 29 51
Modesto 223 214 198 178 166 153 139 177 167 156 128 113 81 55 38 34 50 65 81 93 107 17 - 12 35
Stockton 235 227 210 190 178 165 151 189 179 168 140 125 93 67 50 46 62 77 93 105 119 29 12 - 23
Sacramento 258 249 232 213 201 187 173 212 202 190 162 147 115 89 72 68 85 100 116 127 141 51 35 23 -

Staff Recommended Corridor - Express Travel Times
Sa
n D
ieg
o
U. T
ow
n C
en
ter
Oc
ea
nsi
de
Irvi
ne
An
ah
eim
No
rwa
lk
Lo
s A
ng
ele
s
Riv
ers
ide
On
tari
o
E. S
an
Ga
bri
el
Bu
rba
nk
Sa
nta
Cla
rita
Ba
ke
rsfi
eld
Tu
lare
Co
un
ty
Fre
sno
Lo
s B
an
os
Gil
roy
Sa
n J
ose
Re
dw
oo
d C
ity
SF
O
Sa
n F
ran
cis
co
Me
rce
d
Mo
de
sto
Sto
ck
ton
Sa
cra
me
nto
San Diego - 9 21 36 43 52 63 90 83 76 71 82 108 129 140 160 171 183 195 202 212 156 167 173 190
U. Town Center 9 - 15 29 36 46 56 84 76 70 64 75 102 123 134 154 165 176 188 195 205 149 160 166 183
Oceanside 21 15 - 18 24 34 45 72 64 58 52 63 90 111 122 142 153 165 176 183 193 137 148 155 172
Irvine 36 29 18 - 10 19 30 57 50 43 37 48 75 96 107 127 138 150 161 168 178 122 133 140 157
Anaheim 43 36 24 10 - 12 22 49 42 35 29 40 67 88 99 119 130 142 154 161 171 115 126 132 149
Norwalk 52 46 34 19 12 - 12 39 32 25 20 31 58 78 89 109 120 132 144 151 161 105 116 122 139
Los Angeles 63 56 45 30 22 12 - 29 22 15 9 20 47 68 79 99 110 122 133 140 150 94 105 112 129
Riverside 90 84 72 57 49 39 29 - 10 17 37 48 75 95 106 126 137 149 161 168 178 122 133 139 156
Ontario 83 76 64 50 42 32 22 10 - 9 29 40 67 88 99 119 130 142 153 160 170 114 125 132 149
E. San Gabriel 76 70 58 43 35 25 15 17 9 - 22 33 60 81 92 112 123 135 146 153 164 107 118 125 142
Burbank 71 64 52 37 29 20 9 37 29 22 - 13 40 60 72 92 103 114 126 133 143 87 98 104 121
Santa Clarita 82 75 63 48 40 31 20 48 40 33 13 - 30 50 61 82 92 104 116 123 133 77 88 94 111
Bakersfield 108 102 90 75 67 58 47 75 67 60 40 30 - 24 35 55 66 78 90 96 107 51 62 68 85
Tulare 129 123 111 96 88 78 68 95 88 81 60 50 24 - 15 35 46 58 69 76 86 30 41 47 65
Fresno 140 134 122 107 99 89 79 106 99 92 72 61 35 15 - 24 35 46 58 65 75 19 30 36 53
Los Banos 160 154 142 127 119 109 99 126 119 112 92 82 55 35 24 - 15 26 38 45 55 15 26 32 49
Gilroy 171 165 153 138 130 120 110 137 130 123 103 92 66 46 35 15 - 15 27 34 44 26 37 43 60
San Jose 183 176 165 150 142 132 122 149 142 135 114 104 78 58 46 26 15 - 14 21 31 37 48 55 72
Redwood City 195 188 176 161 154 144 133 161 153 146 126 116 90 69 58 38 27 14 - 9 19 49 60 66 83
SFO 202 195 183 168 161 151 140 168 160 153 133 123 96 76 65 45 34 21 9 - 12 56 67 73 90
San Francisco 212 205 193 178 171 161 150 178 170 164 143 133 107 86 75 55 44 31 19 12 - 66 77 83 100
Merced 156 149 137 122 115 105 94 122 114 107 87 77 51 30 19 15 26 37 49 56 66 - 15 21 38
Modesto 167 160 148 133 126 116 105 133 125 118 98 88 62 41 30 26 37 48 60 67 77 15 - 10 27
Stockton 173 166 155 140 132 122 112 139 132 125 104 94 68 47 36 32 43 55 66 73 83 21 10 - 21
Sacramento 190 183 172 157 149 139 129 156 149 142 121 111 85 65 53 49 60 72 83 90 100 38 27 21 -

Authority Recommended Corridor Option A (VHS) - Local Travel Times
E. M
issi
on
Va
lle
y
Mir
a M
esa
Esc
on
did
o
Te
me
cu
la
Riv
ers
ide
On
tari
o
E. S
an
Ga
bri
el
Lo
s A
ng
ele
s
Bu
rba
nk
Sa
nta
Cla
rita
Pa
lmd
ale
Ba
ke
rsfi
eld
Tu
lare
Co
un
ty
Fre
sno
Lo
s B
an
os
Gil
roy
Sa
n J
ose
Re
dw
oo
d C
ity
SF
O
Sa
n F
ran
cis
co
Me
rce
d
Mo
de
sto
Sto
ck
ton
Sa
cra
me
nto
E. Mission Valley - 7 17 32 49 61 73 90 101 113 131 164 191 207 233 250 265 281 292 306 229 245 257 280
Mira Mesa 7 - 11 25 43 55 66 83 94 107 125 158 184 201 227 243 258 274 285 299 222 239 251 273
Escondido 17 11 - 15 32 44 55 72 84 96 114 147 173 190 216 232 247 264 275 289 211 228 240 262
Temecula 32 25 15 - 17 29 41 58 69 81 99 132 158 175 201 218 233 249 260 274 196 213 225 248
Riverside 49 43 32 17 - 12 23 40 52 64 82 115 141 158 184 200 215 232 243 257 179 196 208 230
Ontario 61 55 44 29 12 - 11 28 40 52 70 103 129 146 172 188 203 220 231 245 167 184 196 218
E. San Gabriel 73 66 55 41 23 11 - 17 28 41 58 92 118 135 161 177 192 208 219 233 156 173 185 207
Los Angeles 90 83 72 58 40 28 17 - 11 24 41 75 101 118 144 160 175 191 202 216 139 155 168 190
Burbank 101 94 84 69 52 40 28 11 - 12 30 63 89 106 132 149 164 180 191 205 128 144 156 179
Santa Clarita 113 107 96 81 64 52 41 24 12 - 18 51 77 94 120 136 151 168 179 193 115 132 144 166
Palmdale 131 125 114 99 82 70 58 41 30 18 - 33 59 76 102 119 134 150 161 175 97 114 126 149
Bakersfield 164 158 147 132 115 103 92 75 63 51 33 - 26 43 69 85 100 117 128 142 64 81 93 115
Tulare County 191 184 173 158 141 129 118 101 89 77 59 26 - 17 43 59 74 90 102 116 38 55 67 89
Fresno 207 201 190 175 158 146 135 118 106 94 76 43 17 - 26 42 57 74 85 99 21 38 50 72
Los Banos 233 227 216 201 184 172 161 144 132 120 102 69 43 26 - 17 32 48 59 73 17 34 46 68
Gilroy 250 243 232 218 200 188 177 160 149 136 119 85 59 42 17 - 15 31 42 56 34 50 62 85
San Jose 265 258 247 233 215 203 192 175 164 151 134 100 74 57 32 15 - 16 27 41 49 65 77 100
Redwood City 281 274 264 249 232 220 208 191 180 168 150 117 90 74 48 31 16 - 11 25 65 81 93 116
SFO 292 285 275 260 243 231 219 202 191 179 161 128 102 85 59 42 27 11 - 14 76 93 105 127
San Francisco 306 299 289 274 257 245 233 216 205 193 175 142 116 99 73 56 41 25 14 - 90 107 119 141
Merced 229 222 211 196 179 167 156 139 128 115 97 64 38 21 17 34 49 65 76 90 - 17 29 51
Modesto 245 239 228 213 196 184 173 155 144 132 114 81 55 38 34 50 65 81 93 107 17 - 12 35
Stockton 257 251 240 225 208 196 185 168 156 144 126 93 67 50 46 62 77 93 105 119 29 12 - 23
Sacramento 280 273 262 248 230 218 207 190 179 166 149 115 89 72 68 85 100 116 127 141 51 35 23 -

Authority Recommended Corridor Option A (VHS) - Express Travel Times
E. M
issi
on
Va
lle
y
Mir
a M
esa
Esc
on
did
o
Te
me
cu
la
Riv
ers
ide
On
tari
o
E. S
an
Ga
bri
el
Lo
s A
ng
ele
s
Bu
rba
nk
Sa
nta
Cla
rita
Pa
lmd
ale
Ba
ke
rsfi
eld
Tu
lare
Co
un
ty
Fre
sno
Lo
s B
an
os
Gil
roy
Sa
n J
ose
Re
dw
oo
d C
ity
SF
O
Sa
n F
ran
cis
co
Me
rce
d
Mo
de
sto
Sto
ck
ton
Sa
cra
me
nto
E. Mission Valley - 7 13 22 34 41 48 60 68 76 89 117 138 149 169 180 191 203 210 220 164 175 181 198
Mira Mesa 7 - 9 18 30 37 44 56 64 72 85 113 133 145 165 176 187 199 206 216 160 171 177 194
Escondido 13 9 - 13 24 31 38 51 58 66 79 107 128 139 159 170 182 193 157 210 154 165 172 189
Temecula 22 18 13 - 15 22 29 41 49 57 70 98 119 130 150 161 173 184 191 201 145 156 162 180
Riverside 34 30 24 15 - 10 17 29 37 45 58 86 106 117 138 148 160 172 179 189 133 144 150 167
Ontario 41 37 31 22 10 - 9 22 29 38 51 79 99 110 130 141 153 165 172 182 126 137 143 160
E. San Gabriel 48 44 38 29 17 9 - 15 22 31 44 72 92 103 123 134 146 158 165 175 119 130 136 153
Los Angeles 60 56 51 41 29 22 15 - 9 18 31 58 79 90 110 121 133 145 151 162 106 117 123 140
Burbank 68 64 58 49 37 29 22 9 - 10 23 51 72 83 103 114 126 137 144 154 98 109 116 133
Santa Clarita 76 72 66 57 45 38 31 18 10 - 16 44 64 75 95 106 118 130 137 147 91 102 108 125
Palmdale 89 85 79 70 58 51 44 31 23 16 - 31 52 63 83 94 106 117 124 134 78 89 95 113
Bakersfield 117 113 107 98 86 79 72 58 51 44 31 - 24 35 55 66 78 90 96 107 51 62 68 85
Tulare County 138 133 128 119 106 99 92 79 72 64 52 24 - 15 35 46 58 69 76 86 30 41 47 65
Fresno 149 145 139 130 117 110 103 90 83 75 63 35 15 - 24 35 46 58 65 75 19 30 36 53
Los Banos 169 165 159 150 138 130 123 110 103 95 83 55 35 24 - 15 26 38 45 55 15 26 32 49
Gilroy 180 176 170 161 148 141 134 121 114 106 94 66 46 35 15 - 15 27 34 44 26 37 43 60
San Jose 191 187 182 173 160 153 146 133 126 118 106 78 58 46 26 15 - 14 21 31 37 48 55 72
Redwood City 203 199 193 184 172 165 158 145 137 130 117 90 69 58 38 27 14 - 9 19 49 60 66 83
SFO 210 206 157 191 179 172 165 151 144 137 124 96 76 65 45 34 21 9 - 12 56 67 73 90
San Francisco 220 216 210 201 189 182 175 162 154 147 134 107 86 75 55 44 31 19 12 - 66 77 83 100
Merced 164 160 154 145 133 126 119 106 98 91 78 51 30 19 15 26 37 49 56 66 - 15 21 38
Modesto 175 171 165 156 144 137 130 117 109 102 89 62 41 30 26 37 48 60 67 77 15 - 10 27
Stockton 181 177 172 162 150 143 136 123 116 108 95 68 47 36 32 43 55 66 73 83 21 10 - 21
Sacramento 198 194 189 180 167 160 153 140 133 125 113 85 65 53 49 60 72 83 90 100 38 27 21 -

Authority Recommended Corridor Option A (Maglev) - Local Travel Times
E. M
issi
on
Va
lle
y
Mir
a M
esa
Esc
on
did
o
Te
me
cu
la
Riv
ers
ide
On
tari
o
E. S
an
Ga
bri
el
Lo
s A
ng
ele
s
Bu
rba
nk
Sa
nta
Cla
rita
Pa
lmd
ale
Ba
ke
rsfi
eld
Tu
lare
Co
un
ty
Fre
sno
Lo
s B
an
os
Gil
roy
Sa
n J
ose
Re
dw
oo
d C
ity
SF
O
Sa
n F
ran
cis
co
Me
rce
d
Mo
de
sto
Sto
ck
ton
Sa
cra
me
nto
E. Mission Valley - 5 14 26 40 51 60 74 83 93 108 132 151 164 187 200 212 226 235 247 180 193 203 220
Mira Mesa 5 - 9 21 35 45 55 69 78 88 102 126 146 159 181 195 207 220 230 241 175 188 198 215
Escondido 14 9 - 12 26 37 46 60 69 79 93 118 137 150 173 186 198 212 221 232 166 179 189 206
Temecula 26 21 12 - 14 24 34 48 57 67 81 105 125 138 161 174 186 199 209 220 154 167 177 194
Riverside 40 35 26 14 - 10 20 34 43 53 67 91 111 124 146 160 172 185 195 206 140 153 163 180
Ontario 51 45 37 24 10 - 10 24 33 43 57 81 101 114 136 150 162 175 185 196 130 143 152 169
E. San Gabriel 60 55 46 34 20 10 - 14 23 33 47 72 91 104 127 140 152 166 175 186 120 133 143 160
Los Angeles 74 69 60 48 34 24 14 - 9 19 33 58 77 90 113 126 138 152 161 172 106 119 129 146
Burbank 83 78 69 57 43 33 23 9 - 10 24 48 68 81 104 117 129 142 152 163 97 110 120 137
Santa Clarita 93 88 79 67 53 43 33 19 10 - 14 38 58 71 93 107 119 132 142 153 87 100 110 127
Palmdale 108 102 93 81 67 57 47 33 24 14 - 24 44 57 79 93 105 118 128 139 73 86 95 113
Bakersfield 132 126 118 105 91 81 72 58 48 38 24 - 20 33 55 69 81 94 103 115 49 62 71 88
Tulare County 151 146 137 125 111 101 91 77 68 58 44 20 - 13 36 49 61 74 84 95 29 42 52 69
Fresno 164 159 150 138 124 114 104 90 81 71 57 33 13 - 23 36 48 61 71 82 16 29 39 56
Los Banos 187 181 173 161 146 136 127 113 104 93 79 55 36 23 - 13 25 39 48 60 13 26 36 53
Gilroy 200 195 186 174 160 150 140 126 117 107 93 69 49 36 13 - 12 25 35 46 27 40 49 66
San Jose 212 207 198 186 172 162 152 138 129 119 105 81 61 48 25 12 - 13 23 34 39 51 61 78
Redwood City 226 220 212 199 185 175 166 152 142 132 118 94 74 61 39 25 13 - 9 21 52 65 75 92
SFO 235 230 221 209 195 185 175 161 152 142 128 103 84 71 48 35 23 9 - 11 61 74 84 101
San Francisco 247 241 232 220 206 196 186 172 163 153 139 115 95 82 60 46 34 21 11 - 73 86 96 113
Merced 180 175 166 154 140 130 120 106 97 87 73 49 29 16 13 27 39 52 61 73 - 13 23 40
Modesto 193 188 179 167 153 143 133 119 110 100 86 62 42 29 26 40 51 65 74 86 13 - 10 27
Stockton 203 198 189 177 163 152 143 129 120 110 95 71 52 39 36 49 61 75 84 96 23 10 - 17
Sacramento 220 215 206 194 180 169 160 146 137 127 113 88 69 56 53 66 78 92 101 113 40 27 17 -

Authority Recommended Corridor Option A (Maglev) - Express Travel Times
E. M
issi
on
Va
lle
y
Mir
a M
esa
Esc
on
did
o
Te
me
cu
la
Riv
ers
ide
On
tari
o
E. S
an
Ga
bri
el
Lo
s A
ng
ele
s
Bu
rba
nk
Sa
nta
Cla
rita
Pa
lmd
ale
Ba
ke
rsfi
eld
Tu
lare
Co
un
ty
Fre
sno
Lo
s B
an
os
Gil
roy
Sa
n J
ose
Re
dw
oo
d C
ity
SF
O
Sa
n F
ran
cis
co
Me
rce
d
Mo
de
sto
Sto
ck
ton
Sa
cra
me
nto
E. Mission Valley - 5 10 18 27 33 39 49 54 61 71 90 104 112 126 135 144 153 159 167 121 131 135 147
Mira Mesa 5 - 7 14 24 30 35 45 51 57 67 87 101 109 123 131 141 150 156 164 120 127 132 144
Escondido 10 7 - 10 20 25 31 41 47 53 63 82 97 105 119 127 136 146 152 160 115 123 127 139
Temecula 18 14 10 - 12 18 23 34 39 46 56 75 89 97 111 119 129 138 144 152 108 116 120 132
Riverside 27 24 20 12 - 8 13 24 29 36 46 65 79 87 101 110 119 128 134 142 98 106 110 122
Ontario 33 30 25 18 8 - 8 18 23 30 40 59 73 81 95 103 113 122 128 136 92 100 104 116
E. San Gabriel 39 35 31 23 13 8 - 12 17 24 34 53 68 75 90 98 107 117 122 130 86 94 98 110
Los Angeles 49 45 41 34 24 18 12 - 7 14 24 43 57 65 79 87 97 106 112 120 76 83 88 100
Burbank 54 51 47 39 29 23 17 7 - 8 18 37 52 59 73 82 91 101 106 114 70 78 82 94
Santa Clarita 61 57 53 46 36 30 24 14 8 - 12 31 46 53 67 76 85 95 100 108 64 72 76 88
Palmdale 71 67 63 56 46 40 34 24 18 12 - 22 36 44 58 67 76 85 91 99 55 63 67 79
Bakersfield 90 87 82 75 65 59 53 43 37 31 22 - 18 25 39 48 57 67 72 80 36 44 48 60
Tulare County 104 101 97 89 79 73 68 57 52 46 36 18 - 11 25 33 43 52 58 66 22 29 34 46
Fresno 112 109 105 97 87 81 75 65 59 53 44 25 11 - 21 26 35 44 50 58 14 22 26 38
Los Banos 126 123 119 111 101 95 90 79 73 67 58 39 25 21 - 11 21 30 36 44 11 19 23 35
Gilroy 135 131 127 119 110 103 98 87 82 76 67 48 33 26 11 - 12 21 27 35 19 27 31 43
San Jose 144 141 136 129 119 113 107 97 91 85 76 57 43 35 21 12 - 11 17 25 29 36 41 53
Redwood City 153 150 146 138 128 122 117 106 101 95 85 67 52 44 30 21 11 - 7 15 38 46 50 62
SFO 159 156 152 144 134 128 122 112 106 100 91 72 58 50 36 27 17 7 - 9 44 52 56 68
San Francisco 167 164 160 152 142 136 130 120 114 108 99 80 66 58 44 35 25 15 9 - 52 60 64 76
Merced 121 120 115 108 98 92 86 76 70 64 55 36 22 14 11 19 29 38 44 52 - 11 15 27
Modesto 131 127 123 116 106 100 94 83 78 72 63 44 29 22 19 27 36 46 52 60 11 - 8 20
Stockton 135 132 127 120 110 104 98 88 82 76 67 48 34 26 23 31 41 50 56 64 15 8 - 15
Sacramento 147 144 139 132 122 116 110 100 94 88 79 60 46 38 35 43 53 62 68 76 27 20 15 -

Authority Recommended Corridor Option B (VHS) - Local Travel Times
E.
Mis
sio
n V
all
ey
Mir
a M
esa
Esc
on
did
o
Te
me
cu
la
Riv
ers
ide
On
tari
o
E.
Sa
n G
ab
rie
l
Lo
s A
ng
ele
s
Bu
rba
nk
Sa
nta
Cla
rita
Ba
ke
rsfi
eld
Tu
lare
Co
un
ty
Fre
sno
Lo
s B
an
os
Gil
roy
Sa
n J
ose
Re
dw
oo
d C
ity
SF
O
Sa
n F
ran
cis
co
Me
rce
d
Mo
de
sto
Sto
ck
ton
Sa
cra
me
nto
E. Mission Valley - 7 17.4 32 49.4 61 72.7 90 101 116 148 174 191 217 233 248 264 275 289 212 229 241 263
Mira Mesa 7 - 11 25.4 43 54.8 66 83.1 94 109 141 167 184 210 226 241 258 269 283 205 222 234 256
Escondido 17 11 - 15 32 44 55 72 84 99 130 156 173 199 216 231 247 258 272 194 211 223 246
Temecula 32 25 15 - 17 29 41 58 69 84 116 142 159 185 201 216 232 243 257 180 196 209 231
Riverside 49 43 32 17 - 12 23 40 52 67 98 124 141 167 184 199 215 226 240 162 179 191 214
Ontario 61 55 44 29 12 - 11 28 40 55 86 112 129 155 172 187 203 214 228 150 167 179 202
E. San Gabriel 73 66 55 41 23 11 - 17 28 43 75 101 118 144 160 175 192 203 217 139 156 168 190
Los Angeles 90 83 72 58 40 28 17 - 11 26 58 84 101 127 143 158 174 186 200 122 139 151 173
Burbank 101 94 84 69 52 40 28 11 - 15 47 73 90 116 132 147 163 174 188 111 128 140 162
Santa Clarita 116 109 99 84 67 55 43 26 15 - 32 58 75 101 117 132 148 159 173 96 113 125 147
Bakersfield 148 141 130 116 98 86 75 58 47 32 - 26 43 69 85 100 117 128 142 64 81 93 115
Tulare County 174 167 156 142 124 112 101 84 73 58 26 - 17 43 59 74 90 102 116 38 55 67 89
Fresno 191 184 173 159 141 129 118 101 90 75 43 17 - 26 42 57 74 85 99 21 38 50 72
Los Banos 217 210 199 185 167 155 144 127 116 101 69 43 26 - 17 32 48 59 73 17 34 46 68
Gilroy 233 226 216 201 184 172 160 143 132 117 85 59 42 17 - 15 31 42 56 34 50 62 85
San Jose 248 241 231 216 199 187 175 158 147 132 100 74 57 32 15 - 16 27 41 49 65 77 100
Redwood City 264 258 247 232 215 203 192 174 163 148 117 90 74 48 31 16 - 11 25 65 81 93 116
SFO 275 269 258 243 226 214 203 186 174 159 128 102 85 59 42 27 11 - 14 76 93 105 127
San Francisco 289 283 272 257 240 228 217 200 188 173 142 116 99 73 56 41 25 14 - 90 107 119 141
Merced 212 205 194 180 162 150 139 122 111 96 64 38 21 17 34 49 65 76 90 - 17 29 51
Modesto 229 222 211 196 179 167 156 139 128 113 81 55 38 34 50 65 81 93 107 17 - 12 35
Stockton 241 234 223 209 191 179 168 151 140 125 93 67 50 46 62 77 93 105 119 29 12 - 23
Sacramento 263 256 246 231 214 202 190 173 162 147 115 89 72 68 85 100 116 127 141 51 35 23 -

Authority Recommended Corridor Option B (VHS) - Express Travel Times
E.
Mis
sio
n V
all
ey
Mir
a M
esa
Esc
on
did
o
Te
me
cu
la
Riv
ers
ide
On
tari
o
E.
Sa
n G
ab
rie
l
Lo
s A
ng
ele
s
Bu
rba
nk
Sa
nta
Cla
rita
Ba
ke
rsfi
eld
Tu
lare
Co
un
ty
Fre
sno
Lo
s B
an
os
Gil
roy
Sa
n J
ose
Re
dw
oo
d C
ity
SF
O
Sa
n F
ran
cis
co
Me
rce
d
Mo
de
sto
Sto
ck
ton
Sa
cra
me
nto
E. Mission Valley - 7 12.7 22 34.1 41 47.7 60 67.7 79 106 126 137 159 170 180 192 199 209 153 164 170 187
Mira Mesa 7 - 9 18.2 30 37 44 56.2 64 74.6 102 122 133 155 166 176 188 195 205 149 160 166 183
Escondido 13 9 - 13 24 31 38 51 58 69 96 117 128 150 160 171 182 189 199 143 154 160 178
Temecula 22 18 13 - 15 22 29 41 49 60 87 107 118 140 151 161 173 180 190 134 145 151 168
Riverside 34 30 24 15 - 10 17 29 37 48 75 95 106 128 139 149 161 168 178 122 133 139 156
Ontario 41 37 31 22 10 - 9 22 29 40 67 88 99 121 132 142 153 160 170 114 125 132 149
E. San Gabriel 48 44 38 29 17 9 - 15 22 33 60 81 92 114 125 135 146 153 164 107 118 125 142
Los Angeles 60 56 51 41 29 22 15 - 9 20 47 68 79 101 111 122 133 140 150 94 105 112 129
Burbank 68 64 58 49 37 29 22 9 - 13 40 60 72 93 104 114 126 133 143 87 98 104 121
Santa Clarita 79 75 69 60 48 40 33 20 13 - 30 50 61 83 94 104 116 123 133 77 88 94 111
Bakersfield 106 102 96 87 75 67 60 47 40 30 - 24 35 57 68 78 90 96 107 51 62 68 85
Tulare County 126 122 117 107 95 88 81 68 60 50 24 - 15 35 46 58 69 76 86 30 41 47 65
Fresno 137 133 128 118 106 99 92 79 72 61 35 15 - 24 35 46 58 65 75 19 30 36 53
Los Banos 159 155 150 140 128 121 114 101 93 83 57 35 24 - 15 26 38 45 55 15 26 32 49
Gilroy 170 166 160 151 139 132 125 111 104 94 68 46 35 15 - 15 27 34 44 26 37 43 60
San Jose 180 176 171 161 149 142 135 122 114 104 78 58 46 26 15 - 14 21 31 37 48 55 72
Redwood City 192 188 182 173 161 153 146 133 126 116 90 69 58 38 27 14 - 9 19 49 60 66 83
SFO 199 195 189 180 168 160 153 140 133 123 96 76 65 45 34 21 9 - 12 56 67 73 90
San Francisco 209 205 199 190 178 170 164 150 143 133 107 86 75 55 44 31 19 12 - 66 77 83 100
Merced 153 149 143 134 122 114 107 94 87 77 51 30 19 15 26 37 49 56 66 - 15 21 38
Modesto 164 160 154 145 133 125 118 105 98 88 62 41 30 26 37 48 60 67 77 15 - 10 27
Stockton 170 166 160 151 139 132 125 112 104 94 68 47 36 32 43 55 66 73 83 21 10 - 21
Sacramento 187 183 178 168 156 149 142 129 121 111 85 65 53 49 60 72 83 90 100 38 27 21 -

Appendix HEnvironmental Constraints Tables

APPENDIX H – ENVIRONMENTAL EVALUATION
TABLE H-1SAN DIEGO REGION
Environmental Miramar Road SR-52 I-15Issue Downtown Airport Downtown Airport QualcommLandCover
Rural/Suburban to DenseUrban Development – AirportArea, Downtown
Rural/Suburban to UrbanDevelopment
Rural/Suburban to DenseUrban Development – AirportArea, Downtown
Rural/Suburban to UrbanDevelopment
Rural/Suburban to UrbanDevelopment
EnvironmentalJustice
(Demographics)
Potential Minority PopulationImpacts - Downtown
No Minority or Low-IncomePopulations Identified
Potential Minority PopulationImpacts - Downtown
No Minority or Low-IncomePopulations Identified
No Minority or Low-IncomePopulations Identified
Threatened andEndangered
Species
Potential for Impacts toThreatened & EndangeredSpecies – Gnatcatcher, LeastTern, Salt Marsh Bird’s Beak
Potential for Impacts toThreatened & EndangeredSpecies – Gnatcatcher, LeastTern
Highest Potential for Impactsto Threatened & EndangeredSpecies – Gnatcatcher, LeastTern, Orcutt Grass, Salt MarshBird’s Beak
High Potential for Impacts toThreatened & EndangeredSpecies – Gnatcatcher, LeastTern, Orcutt Grass
Potential for Impacts toThreatened & EndangeredSpecies – Gnatcatcher, LeastBell’s Vireo, San Diego MesaMint
WaterResources
Water Crossings – San DiegoRiver, Rose Canyon
Water Crossings – San DiegoRiver, Rose Canyon
Major Water Crossings – SanDiego River, Rose Canyon,San Clemente Canyon
Major Water Crossings – SanDiego River, Rose Canyon,San Clemente Canyon
Water Crossings –RoseCanyon, San ClementeCanyon
Floodplain Major FloodplainEncroachment – Rose Canyon
Major FloodplainEncroachment – Rose Canyon
Minor FloodplainEncroachment
Minor FloodplainEncroachment
Minor FloodplainEncroachment
Parks andRecreation
Park Impacts – Marian BearMemorial Park, Old Town SanDiego State Historic Park
Park Impacts – Marian BearMemorial Park, Old Town SanDiego State Historic Park
Park Impacts – Marian BearMemorial Park, Standley Park,Old Town San Diego StateHistoric Park
Park Impacts – Marian BearMemorial Park, Standley Park,Old Town San Diego StateHistoric Park
Minor Park Impacts
VisualQuality
Visual Impact with ElevatedGuideway – Mission Bay,Downtown
Visual Impact with ElevatedGuideway – Mission Bay
Visual Impact with ElevatedGuideway – Mission Bay,Downtown
Visual Impact with ElevatedGuideway – Mission Bay
Visual Impact with ElevatedGuideway
CulturalResources
Historic Property Impacts –Old Town, Downtown
Historic Property Impacts –Old Town
Historic Property Impacts –Old Town, Downtown
Historic Property Impacts –Old Town
No Historic PropertiesIdentified
HazardousMaterials/Waste
Major Hazardous Materials/Waste – military, industrial,and aviation sites
Hazardous Materials/ Waste –military and industrial sites
Major Hazardous Materials/Waste – military, industrial,and aviation sites
Hazardous Materials/ Waste –military and industrial sites
Minor Hazardous Materials/Waste Constraints
IntermodalConnections
Amtrak, San Diego Trolley,Bus
San Diego Trolley, Bus Amtrak, San Diego Trolley,Bus
San Diego Trolley, Bus San Diego Trolley, Bus
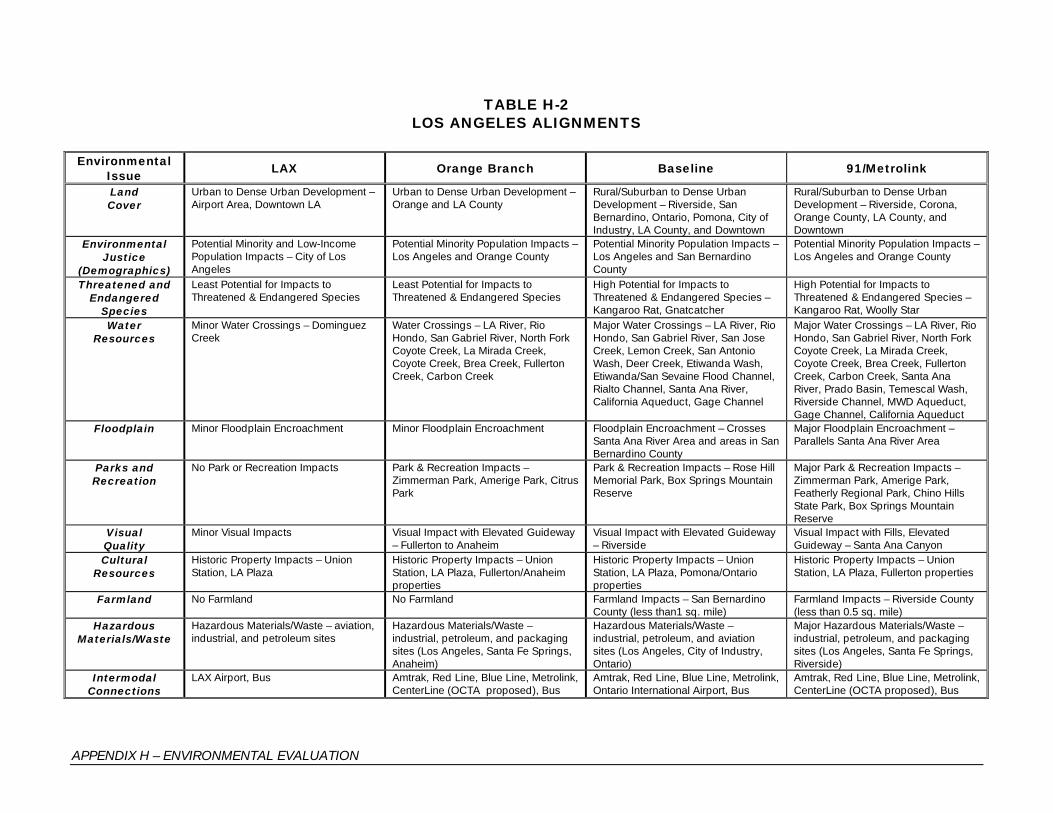
APPENDIX H – ENVIRONMENTAL EVALUATION
TABLE H-2LOS ANGELES ALIGNMENTS
EnvironmentalIssue
LAX Orange Branch Baseline 91/Metrolink
LandCover
Urban to Dense Urban Development –Airport Area, Downtown LA
Urban to Dense Urban Development –Orange and LA County
Rural/Suburban to Dense UrbanDevelopment – Riverside, SanBernardino, Ontario, Pomona, City ofIndustry, LA County, and Downtown
Rural/Suburban to Dense UrbanDevelopment – Riverside, Corona,Orange County, LA County, andDowntown
EnvironmentalJustice
(Demographics)
Potential Minority and Low-IncomePopulation Impacts – City of LosAngeles
Potential Minority Population Impacts –Los Angeles and Orange County
Potential Minority Population Impacts –Los Angeles and San BernardinoCounty
Potential Minority Population Impacts –Los Angeles and Orange County
Threatened andEndangered
Species
Least Potential for Impacts toThreatened & Endangered Species
Least Potential for Impacts toThreatened & Endangered Species
High Potential for Impacts toThreatened & Endangered Species –Kangaroo Rat, Gnatcatcher
High Potential for Impacts toThreatened & Endangered Species –Kangaroo Rat, Woolly Star
WaterResources
Minor Water Crossings – DominguezCreek
Water Crossings – LA River, RioHondo, San Gabriel River, North ForkCoyote Creek, La Mirada Creek,Coyote Creek, Brea Creek, FullertonCreek, Carbon Creek
Major Water Crossings – LA River, RioHondo, San Gabriel River, San JoseCreek, Lemon Creek, San AntonioWash, Deer Creek, Etiwanda Wash,Etiwanda/San Sevaine Flood Channel,Rialto Channel, Santa Ana River,California Aqueduct, Gage Channel
Major Water Crossings – LA River, RioHondo, San Gabriel River, North ForkCoyote Creek, La Mirada Creek,Coyote Creek, Brea Creek, FullertonCreek, Carbon Creek, Santa AnaRiver, Prado Basin, Temescal Wash,Riverside Channel, MWD Aqueduct,Gage Channel, California Aqueduct
Floodplain Minor Floodplain Encroachment Minor Floodplain Encroachment Floodplain Encroachment – CrossesSanta Ana River Area and areas in SanBernardino County
Major Floodplain Encroachment –Parallels Santa Ana River Area
Parks andRecreation
No Park or Recreation Impacts Park & Recreation Impacts –Zimmerman Park, Amerige Park, CitrusPark
Park & Recreation Impacts – Rose HillMemorial Park, Box Springs MountainReserve
Major Park & Recreation Impacts –Zimmerman Park, Amerige Park,Featherly Regional Park, Chino HillsState Park, Box Springs MountainReserve
VisualQuality
Minor Visual Impacts Visual Impact with Elevated Guideway– Fullerton to Anaheim
Visual Impact with Elevated Guideway– Riverside
Visual Impact with Fills, ElevatedGuideway – Santa Ana Canyon
CulturalResources
Historic Property Impacts – UnionStation, LA Plaza
Historic Property Impacts – UnionStation, LA Plaza, Fullerton/Anaheimproperties
Historic Property Impacts – UnionStation, LA Plaza, Pomona/Ontarioproperties
Historic Property Impacts – UnionStation, LA Plaza, Fullerton properties
Farmland No Farmland No Farmland Farmland Impacts – San BernardinoCounty (less than1 sq. mile)
Farmland Impacts – Riverside County(less than 0.5 sq. mile)
HazardousMaterials/Waste
Hazardous Materials/Waste – aviation,industrial, and petroleum sites
Hazardous Materials/Waste –industrial, petroleum, and packagingsites (Los Angeles, Santa Fe Springs,Anaheim)
Hazardous Materials/Waste –industrial, petroleum, and aviationsites (Los Angeles, City of Industry,Ontario)
Major Hazardous Materials/Waste –industrial, petroleum, and packagingsites (Los Angeles, Santa Fe Springs,Riverside)
IntermodalConnections
LAX Airport, Bus Amtrak, Red Line, Blue Line, Metrolink,CenterLine (OCTA proposed), Bus
Amtrak, Red Line, Blue Line, Metrolink,Ontario International Airport, Bus
Amtrak, Red Line, Blue Line, Metrolink,CenterLine (OCTA proposed), Bus

APPENDIX H – ENVIRONMENTAL EVALUATION
TABLE H-3TEHACHAPI ALIGNMENTS
Environmental I-5/Grapevine Palmdale/Aqueduct Palmdale/MojaveIssue 3.5% 5% 3.5% 5%LandCover
Rural and Suburban Development – Santa Clarita,suburban Bakersfield
Rural and Suburban/Urban Development – SantaClarita, Palmdale, Quartz Hill, suburban Bakersfield
Rural and Suburban/Urban Development – SantaClarita, Palmdale, Lancaster, Rosamond,Tehachapi, suburban Bakersfield
EnvironmentalJustice
(Demographics)
Potential Low Income Population Impacts – Castaicarea
No Minority or Low-Income Populations Identified Potential Low Income Population Impacts –Lancaster area
Threatened andEndangered
Species
Potential for Impacts to Threatened & EndangeredSpecies – Unarmored Threespine Stickleback, SanJoaquin Kit Fox
High Potential for Impacts to Threatened &Endangered Species – Unarmored ThreespineStickleback, San Joaquin Kit Fox, Blunt-NosedLeopard Lizard
High Potential for Impacts to Threatened &Endangered Species – Unarmored ThreespineStickleback, Bakersfield Cactus, San Joaquin KitFox, California Jewel-flower, San JoaquinWoollythreads
WaterResources
Major Water Crossings – Edison Channel, TecuyaCreek, California Aqueduct , Grapevine Creek,Cuddy Canyon, Gorman Creek, Apple Canyon,Pyramid Lake, Cherry Canyon, Canton Canyon, ViolinCanyon, Castaic Lake, Castaic Creek, Santa ClaraRiver, Pico Canyon, Gavin Canyon, Newhall Canyon
Major Water Crossings – Eastside Canal, EdisonChannel, Tecuya Creek, Grapevine Creek, PastoriaCreek, Los Alamos Creek, Little Sycamore Canyon,Big Sycamore Canyon, Myrick Canyon, Willow SpringsCanyon, Amargosa Creek, Lake Palmdale, PalmdaleDitch, California Aqueduct, Kentucky Springs Canyon,Soledad Canyon, Bee Box Canyon, BootleggerCanyon, Hughes Canyon, Bobcat Canyon, LongCanyon, Aqua Dulce Canyon, Bee Canyon, OakSpring Canyon, Santa Clara River, Soledad Canyon,Placerita Creek, Whitney Canyon
Major Water Crossings – Rodeo Canyon, TweedyCreek, Whiterock Creek, Cache Creek, LAAqueduct, Oak Creek, Amargosa Creek, LakePalmdale, Palmdale Ditch, California Aqueduct,Kentucky Springs Canyon, Soledad Canyon, BeeBox Canyon, Bootlegger Canyon, Hughes Canyon,Bobcat Canyon, Long Canyon, Aqua DulceCanyon, Bee Canyon, Oak Spring Canyon, SantaClara River, Soledad Canyon, Placerita Creek,Whitney Canyon
Floodplain Major Floodplain Encroachment – Area near Lamont,Grapevine Creek, Santa Clara River
Major Floodplain Encroachment – Area near Lamont,Grapevine Creek, North of Los Angeles Aqueduct,Soledad Canyon, Santa Clara River
Major Floodplain Encroachment – Area aroundCaliente and Tehachapi Creeks, Rosamond,Lancaster, and Palmdale; Soledad Canyon; SantaClara River
Parks andRecreation
Major Park & RecreationImpacts –AngelesNational Forest, HungryValley State VehicularRecreational Area,Pyramid LakeRecreation Area,Castaic Lake RecreationArea
Major Park & RecreationImpacts –Fort Tejon StateHistoric Park, CastacLake, Angeles NationalForest, Hungry ValleyState VehicularRecreational Area,Pyramid Lake RecreationArea, Castaic LakeRecreation Area
Park & Recreation Impacts – Antelope ValleyCalifornia Poppy Reserve, Pacific Crest NationalScenic Trail, Angeles National Forest
Park & Recreation Impacts – Pacific Crest NationalScenic Trail, Angeles National Forest

APPENDIX H – ENVIRONMENTAL EVALUATION
Environmental I-5/Grapevine Palmdale/Aqueduct Palmdale/MojaveIssue 3.5% 5% 3.5% 5%VisualQuality
Major Visual Impacts – I-5 travelers, PyramidLake, Castaic Lake
Major Visual Impacts – I-5 travelers, Fort Tejon,Castac Lake, PyramidLake, Castaic Lake
Visual Impacts –Pacific Crest National Scenic Trail Visual Impacts – Pacific Crest National ScenicTrail,
CulturalResources
No Historic PropertiesIdentified
Historic Property Impacts– Fort Tejon
No Historic Properties Identified No Historic Properties Identified
Farmland Farmland Impacts – Lamont/Weedpatch and Castaic Farmland Impacts – Lamont/Weedpatch and AntelopeValley
Farmland Impacts – Edison area
HazardousMaterials/Waste
Hazardous Materials/Waste – refining and metal worksites
Hazardous Materials/Waste – refining and metal worksites
Major Hazardous Materials/Waste – refining,trucking, and auto repair sites

APPENDIX H – ENVIRONMENTAL EVALUATION
TABLE H-4CENTRAL VALLEY ALIGNMENTS
EnvironmentalIssue
West 99 UP BNSF East 99
LandCover
Rural and Suburban Development –Minter Village, Delano, Tulare, Madera
Rural and Suburban/UrbanDevelopment – Minter Village, Delano,Tulare, Kingsburg, Selma, Fowler,Fresno, Madera, Chowchilla, Merced,Atwater, Livingston, Turlock, Modesto,Ripon, Bakersfield
Rural and Suburban/UrbanDevelopment – Shafter, Wasco,Corcoran, Hanford, Fresno, Madera,Planada, Merced, Hughson, Empire,Riverbank, Bakersfield
Rural and Suburban Development –Mintor Village, Dinaba, Reedly, Fresno,Planada, Hughson, Empire, Riverbank,Bakersfield
EnvironmentalJustice
(Demographics)
No Low-Income Populations Identified
Potential Minority Populations Impacts– Bakersfield
Potential Low-Income PopulationImpacts – Modesto, Turlock, Merced
Potential Minority Populations Impacts– Modesto , Turlock, Atwater, Merced,Bakersfield
Potential Low-Income PopulationImpacts – Merced
Potential Minority Populations Impacts– Merced, Fresno, Bakersfield
Potential Low-Income PopulationImpacts – northern and southern areaof Merced
Potential Minority Populations Impacts– Merced, Terra Bella, Bakersfield
Threatened &Endangered
Species
Potential for Impacts to Threatened &Endangered Species – ValleyElderberry Longhorn Beetle, GiantGarter Snake, Swainson’s Hawk,Fresno Kangaroo Rat, Blunt NoisedLeopard Lizard, San JoaquinWoollythreads, California Jewel Flower,San Joaquin Kit Fox, Tipton KangarooRat
Highest Potential for Impacts toThreatened & Endangered Species –Valley Elderberry Longhorn Beetle,Giant Garter Snake, Greene’s Tuctoria,San Joaquin Valley Orcutt Grass,Vernal Pool Fairy Shrimp, CaliforniaTiger Salamander, Vernal Pool TadpoleShrimp, Tipton Kangaroo Rat, BluntNoised Leopard Lizard, San JoaquinWoollythreads, California Jewel Flower,San Joaquin Kit Fox
Highest Potential for Impacts toThreatened & Endangered Species –Colusa Grass, Valley ElderberryLonghorn Beetle, Giant Garter Snake,Greene’s Tuctoria, Vernal Pool FairyShrimp, California Tiger Salamander,Vernal Pool Tadpole Shrimp, TiptonKangaroo Rat, Fresno Kangaroo Rat,Blunt Noised Leopard Lizard, SanJoaquin Woollythreads, CaliforniaJewel Flower, San Joaquin Kit Fox
Highest Potential for Impacts toThreatened & Endangered Species –Colusa Grass, Valley ElderberryLonghorn Beetle, Giant Garter Snake,Greene’s Tuctoria, San Joaquin ValleyOrcutt Grass, Vernal Pool Fairy Shrimp,California Tiger Salamander, VernalPool Tadpole Shrimp, Tipton KangarooRat, Blunt Noised Leopard Lizard, SanJoaquin Woollythreads, CaliforniaJewel Flower, San Joaquin Kit Fox
WaterResources
Major Water Crossings – StanislausRiver, Hetch Hetchy Aqueduct,Tuolumne River, Lower Lateral, CeresMain Canal, Highline Canal, MercedRiver, Livingston Drain, Atwater Canal,Black Rascal Creek, Bear Creek, SouthSlough,Hantley Slough, Duck Slough,Dutchman Creek, Chowchilla River,Ash Slough, Berendo Slough, BerendoCreek, Dry Creek, Fresno River,Cottonwood Creek, San Joaquin River,Flum Ditch, Houghton Canal, Dry CreekCanal, Fresno Colony Canal, WestPerrin Canal, Smith Ditch, ElkhornDitch, Weber Ditch, Cole Slough, KingsRiver, Peoples Ditch, Lakeland Canal,Cross Creek, Mosquito Creek, Mill
Major Water Crossings – StanislausRiver, Hetch Hetchy Aqueduct, TurlockRiver, Highline Canal, Merced River,Atwater Canal, Fahrens Creek, BearCreek, Miles Creek, Owens Creek,Duck Slough, Mariposa Creek,Deadman Creek, Dutchman Creek,Chowchilla River, Ash Slough, BerendoSlough, Berendo Creek, Dry Creek,Schmidt Creek, Fresno River,Cottonwood Creek, San Joaquin River,Herndon Ditch, Dry Creek, DrycreekCanal, Fresno Colony Canal,Washington Colony Canal, BriggsCanal, Kirby Canal, Elkhorn Ditch,Fower Switch Canal, Walnut Ditch,Kingsburg Canal, Kings River,McClanahan Ditch, Traver Canal,
Major Water Crossings – San JoaquinMain Canal, Stanislaus River, HetchHetchy Aqueduct,Lateral #6, Dry Creek, Tuolumne River,Turlock Main Canal, Highline Canal,Merced River, Canal Creek, BearCreek, Miles Creek, Owens Creek,,Mariposa Creek, Deadman Creek,Dutchman Creek, Chowcilla River, AshSlough, Berendo Creek, Dry Creek,Schmidth Creek, Fresno River,Cottonwood Creek, Forkner Canal,Enterprise Canal, Gould Canal, DryCreek Canal, Fresno Colony Canal,Washington Colony Canal, Smith Ditch,Davis Ditch, Elkhorn Ditch, LibertyDitch, Murphy Slough, Kings River,Chance Ditch, Peoples Ditch, Lakeside
Major Water Crossings – San JoaquinMain Canal, Stanislaus River, HetchHetchy Aqueduct, Lateral #6, DryCreek, Tuolumne River, Turlock MainCanal, Highline Canal, Merced River,Jones Drain, Canal Creek, FahrensCreek, Black Rascal Creek, BearCreek, Miles Creek, Owens Creek,Mariposa Creek, Deadman Creek,Dutchman Creek, Chowchilla River,Ash Slough, Berendo Slough, BerendoCreek, Dry Creek, Fresno River, severalsmall creeks between Little Dry Creekand Fresno River (12), Little Dry Creek,Root Creek, San Joaquin River,Enterprise Canal, Dry Creek, GouldCanal, Mill Ditch, Fancer Creek, BriggsCanal, Fowler Ditch, Garfield Ditch,

APPENDIX H – ENVIRONMENTAL EVALUATION
EnvironmentalIssue
West 99 UP BNSF East 99
WaterResources
Creek, Tulare Creek, Rockford Ditch,Kaweah Canal, Hooper Ditch, TulareCanal, Elk Bayou, Tule River, DeerCreek, White River, Posa Creek, LerdoCanal, Beardsley Canal, CallowayCanal, Kern Canal, Kern River
Banks Ditch, Cottonwood Creek, CrossCreek, Mill Creek, Packwood Creek,Railroad Ditch, Tulare Canal,Elk Bayou, Tule River, Deer Creek,White River, Fraint Kern Canal, PosaCreek, Lerdo Canal, Beardsley Canal,Calloway Canal, Kern Island Canal,Kern River
Ditch, Cross Creek, Sweet Canal, TuleRiver, Tayler Canal, Lakeland Canal,Deer Creek, Posa Creek
McCalli Ditch, Kingsburg Ditch, SantaFe Canal, Kings River, Traverse Creek,Horseman Ditch, Sand Creek,Cottonwood Creek, Wutchuma Ditch,St. Johns River, Kaweah River, OutsideCreek, Lewis Creek, Kern Canal,Pioneer Ditch, Porter Slough, TuleRiver, Deer Creek, Deer Ditch, WhiteRiver, Posa Creek, Lerdo Canal,Beardsley Canal, Caloway Canal, KernCanal, Kern River
Farmland Major Farmland Impacts – 188 acres ofprime, unique, or farmland of statewideimportance
Major Farmland Impacts – 254 acres ofprime, unique, or farmland of statewideimportance
Farmland Impacts – 103 acres ofprime, unique, or farmland of statewideimportance
Farmland Impacts – 156 acres ofprime, unique, or farmland of statewideimportance
Floodplain Major Floodplain Encroachment –Stanislaus River, Merced River, OwensCreek, Duck Slough, Dutchman Creek,Cottonwood Creek, San Joaquin River,Kings River, Cross Creek, large areanorth of Tulare, Tule River, large areabetween White River and Deer Creek,White River, east of Lake Woollamos,Poso Creek
Major Floodplain Encroachment –Stanislaus River, Merced River, OwensCreek, Duck Slough, Dutchman Creek,Cottonwood Creek, San Joaquin River,Kings River, Cross Creek, large areanorth of Tulare, Tule River, large areabetween White River and Deer Creek,White River, east of Lake Woollamos,Poso Creek
Floodplain Encroachment – StanislausRiver, Merced River, Bear Creek,Owens Creek, Duck Slough, South ofMerced, Cottonwood Creek, SanJoaquin River, Dry Creek, MurphySlough, Kings River, Cross Creek andPercolation Basin, Tule River, DeerCreek, Duck Pond, Poso Creek
Floodplain Encroachment – StanislausRiver, Merced River, Duck Slough,Owens Creek, South of Merced, KingsRiver, Cottonwood Creek, Tule River,large area at Deer Creek, White River,Poso Creek, East of Lake Woollomes
Parks &Recreation
Minor Parks & Recreation Impacts –Fruitvale Norris Park
Parks & Recreation Impacts – CeresCemetary, Stanislaus Fairgrounds,Broadway Park, Central Park,McConnell State Recreation Area,Cemetery (south part of Merced),Chaffee Zoological Park, FresnoAmphitheater, Roeding Park,Continental Park, Albany Park, CecilPark, Weill Perk, Riverview Park
Major Parks & Recreation Impacts –Jacob Meyer Park, Zerillo Park, EstherStaley Park, Castle Park, LatonKingston Park, Kingston Regional Park,Hidden Valley Park, Cob Park, PixleyNational Wildlife Refuge, AllensworthState Historical Park
Parks & Recreation Impacts – JacobMeyer Park, Zerillo Park, Esther StaleyPark, Castle Park, Airways Golf Course,Sierra Vista Shopping Area, ReedlyBeach Park, Rosa Ana Vuich Park,Dinuba Recreation Park, Roy Park
CulturalResources
Historic Property Impacts – TaoistTemple, Hanford Carnegie Library,Allensworth Historical District, WascoUnion High School Auditorium, ShafterResearch Station, Santa Fe Passengerand Freight Depot
Major Historic Property Impacts –Major George Beecher House, U.S.Post Office-Bell Station, U.S. PostOffice-El Viejo Station, Thomas H.Leggett House, Merced CountyCourthouse, Bloss Mansion, DanielWhitmore House, Turlock CarnegieLibrary, Hotel Covell, ForesterUnderground Gardens, Frank RomainHouse, Southern Pacific PassengerDepot
Major Historic Property Impacts –Major George Beecher House, MercedCounty High School, Kaehler, RectorHouse, Leggett House, Merced CountyCourthouse, Riverbank Branch Library,Old Administration Building, TwiningLaboratories, Kindler House, OldFresno Water Tower, Physicians Bldg,Rehorn House, Santa Fe PassengerDepot, Maulbridge Apartments,Warehouse Row, Holy Trinity ArmenianAposto, Alexander Pantages Theater,Meux House, Valencia House
Minor Historic Property Impacts –Riverbank Branch Library, Kern BranchBeale Memorial Library, Tevis Block

APPENDIX H – ENVIRONMENTAL EVALUATION
EnvironmentalIssue
West 99 UP BNSF East 99
VisualQuality
Minor Visual Impacts – around majorwater crossings, Fruitvale Norris Park
Major Visual Impacts – around majorwater crossings, minor parks,Stanislaus Fairgrounds, McConnellState Recreation Area, ChaffeeZoological Park, Fresno Amph.
Major Visual Impacts – around majorwater crossings, minor parks, KingstonRegional Park, Pixley National WildlifeRefuge, Allensworth State HistoricalPark
Visual Impacts – around major watercrossings, minor parks, Sierra VistaShopping Area, Dinuba RecreationPark
HazardousMaterials/Waste
Hazardous Materials/Waste – aviation,agriculture, industrial
Major Hazardous Materials/Waste –agricultural, chemical, petroleum,aviation, automotive, industrial
Major Hazardous Materials/Waste –dump sites, petroleum, agricultural,chemical
Hazardous Materials/Waste – aviation,chemical, gas/oil, agriculture
IntermodalConnections
Amtrak (San Joaquin – Bakersfield),Bus
Bus Amtrak (San Joaquin – Bakersfield,Hanford, Fresno, Riverbank), Bus
Amtrak (San Joaquin – Bakersfield,Riverbank), Fresno-YosemiteInternational Airport, Bus

APPENDIX H – ENVIRONMENTAL EVALUATION
TABLE H-5BAY AREA ACCESS ALIGNMENTS
EnvironmentalIssue
Altamont Pass Pacheco Pass
LandCover
Rural and Suburban/Urban Development – San Jose, Newark, Pleasanton,Livermore, Tracy, Manteca
Rural and Suburban/Urban Development – San Jose, Morgan Hill, Gilroy, SanJuan Bautista, Los Banos
EnvironmentalJustice
(Demographics)
Potential Low-Income Population Impacts – west Pleasanton, east Livermore
Potential Minority Population Impacts – San Jose, Union City, west Pleasanton,Tracy, Manteca
Potential Low-Income Population Impacts – south San Jose
Potential Minority Population Impacts – San Jose, Morgan Hill, Gilroy, San JuanBautista, west Hollister, Los Banos
Threatened &Endangered
Species
High Potential for Impacts to Threatened & Endangered Species – Salt-MarshHarvest Mouse, San Joaquin Kit Fox, California Red-Legged Frog, Contra CostaGoldfields, California Clapper Rail, California Least Tern
Potential for Impacts to Threatened & Endangered Species – San Joaquin Kit Fox,California Tiger Salamander, Giant Garter Snake
WaterResources
Water Crossings – Stanislaus River, Main District Canal, Niles Canyon, StonyBrook Canyon, Polomares Creek, Sinbad Creek, Mocho Creek, South BayAqueduct, Arroyo Creek, Patterson Run, California Aqueduct, Delta MendotaCanal, Lower and Upper Main Canal, Tom Paine Slough, Paradise Cut, SanJoaquin River
Major Water Crossings – Coyote Creek, Little Llagos Creek, Llagos Creek,Bodfish Creek, Uvas Creek, Miller Slough, San Ysidro Creek, Jones Creek,Elephant Head Creek, Cedar Creek, Pacheco Creek, South Fork, San LuisReservoir, California Aqueduct, Delta Mendota Canal, Los Banos Creek, MainCanal, 21 Crossings between San Joaquin River and the city of Los Banos, SanJoaquin River, Mariposa Slough, Deadman Creek, Duck Slough, Owens River,Moles Creek, Hartley Slough
Farmland Major Farmland Impacts – Large area of prime farmland from Tracy to the southend of Stockton.
Major Farmland Impacts – Long stretch of farmland of statewide importance formMorgan Hill to Hollister. Mixture of prime, unique, and farmland or statewideimportance from Los Banos to Chowchilla
Floodplain Floodplain Encroachment – north San Jose, Milpitas, Fremont, Tracy Floodplain Encroachment – south end of San Jose, San Juan Bautista, and east ofLos Banos
Parks &Recreation
Parks & Recreation Impacts – Oakwood Lake Resort, Shadow Cliffs RecreationArea
Major Parks & Recreation Impacts – San Luis State Recreation Area, San LuisNational Wildlife Area, O’Neill Forebay
VisualQuality
Visual Impacts – Residential Areas Major Visual Impacts – San Luis Reservoir State Recreation Area, NationalWildlife Area, O’Neill Forebay, Residential Areas
CulturalResources
Historic Property Impacts Impacts – Kottinger Adobe Barn, Murphy House, TracyCity Hall and Jail, West Side Bank, Bank of Italy, Bank of Tracy, Riverbank BranchLibrary
Major Historic Property Impacts – Santa Clara Depot, Holloway House, Live OakCreamery, Old City Hall, Building at 27 Fountain Alley, Leib Carriage House, VillaMira Monte, Christian Church of Gilroy, Hayes Mansion, Santa Clara Verein, GilroyFree Library, Southern Pacific Depot (10 on site)
HazardousMaterials/Waste
Hazardous Materials/Waste – aviation, agriculture, industrial (San Jose, Newark,Livermore)
Hazardous Materials/Waste – dump sites, petroleum, agricultural, chemical (SanJose, Gilroy)
IntermodalConnections
Altamont Commuter Express (ACE), Amtrak (Capitol Corridor, Coast Starlight),CalTrain, BART, Santa Clara LRT, Bus
Altamont Commuter Express (ACE), Amtrak (Capitol Corridor, Coast Starlight),CalTrain, Santa Clara LRT, Bus

APPENDIX H – ENVIRONMENTAL EVALUATION
TABLE H-6BAY AREA ALIGNMENTS
EnvironmentalIssue
Peninsula East Bay
LandCover
Suburban/Urban Development – San Francisco, Brisbane, South San Francisco,San Bruno, Millbrae, Burlingame, San Mateo, Belmont, San Carlos, Redwood City,Palo Alto, San Jose
Suburban/Urban Development – Oakland, Alameda, San Leandro, San Lorenzo,Hayward, Newark, Union City, Fremont, Milpitas, San Jose
EnvironmentalJustice
(Demographics)
Potential Low-Income Impacts – San Francisco, East San MateoPotential Minority Impacts – San Francisco, San Bruno, Millbrae, East Palo Alto,Mountain View, San Jose
Potential Low-Income Impacts – Oakland, San Lazerno, San CarlosPotential Minority Impacts – Oakland, San Leandro, Hayward, Milpitas, San Jose
Threatened &Endangered
Species
Potential for Impacts to Threatened & Endangered Species – California ClapperRail, California Red-Legged Frog, California Tiger Salamander
Potential for Impacts to Threatened & Endangered Species – Salt-Marsh HarvestMouse, Contra Costa Goldfields, Western Snowy Plover
WaterResources
Water Crossings – San Leanardo Creek, San Lorenzo Creek, Ward Creek,Alameda Creek, Morrison Canyon, Scott Creek, Coyote Creek
Major Water Crossings – Mills Creek, Sanchez Creek, San Mateo Creek, LaurelCreek, Reimons Creek, Cordillaras Creek, Hetch Hetchy Aqueduct, SanFransisquito Creek, Maradero Creek, Barron Creek, Adobe Creek, PermanteCreek, Stevens Creek, Calabazas Creek, Soratoga Creek
Floodplain No Floodplain Encroachment Identified Floodplain Encroachment – Union City, Fremont, Milpitas, north San JoseParks &
RecreationParks & Recreation Impacts – Posey Park, Lions Field Park, Washington Park,Holbrook Palmer Park, El Camino Park, Peers Park, Robles Park, Rengstroff Park
Major Parks & Recreation Impacts – San Leandro Bay Regional Shoreline Park,Ardenwood Regional Park, Sunny Hills Golf Coarse, Saint James Park
VisualQuality
Major Visual Impacts – Residential Areas, Cultural Resources, Downtown SanFrancisco, San Francisco Bay
Visual Impacts – Residential Areas, Parks, Water Resources, Downtown Oakland,San Francisco Bay
CulturalResources
Major Historic Property Impacts – Hotel St. Mathew, Diridon Station, Santa ClaraDepot, Irving Murray School, Burlingame Railroad Station, Menlo Park RailroadStation, Redwood City Historic Commercial Buildings, Morse House, HostessHouse, Rincon Annex, Lathrop House, San Mateo County Courthouse, RamonaStreet Architectural District, Barron-Latham-Hopkins Gate Lodge, Watkins House,Professorville Historic District, Santa Clara Verein, U.S. Postal Main Office-SanMateo, Federal Reserve Bank of San Francisco, Fraternal Hall Building, U.S.Customhouse, APOLLO (Storeship), New Sequoia Theater Building, SequoiaUnion High School, Matson Building and Annex, University African MethodistEpiscopal Zion Church, Palo Alto Southern Pacific Railroad Depot, MartinBuilding, National Bank of San Mateo
Historic Property Impacts – Santa Clara Depot, Diridon Station, Cohen House,Dunns Block, Patterson House, Oakland Iron Works, United Works, RemillardBrick Company, M.V. Santa Rosa, Santa Clara Verein, City of Oakland (USSHOGA) Lightship, USS POTOMAC, Oakland Free Library, Agnews Insane Asylum
HazardousMaterials/Waste
Hazardous Materials/Waste – aviation, commercial, chemical, industrial (SanFrancisco, San Bruno, Millbrae, San Mateo, Redwood City, Palo Alto, San Jose)
Hazardous Materials/Waste – dump Sites, petroleum, industrial, commercial,aviation, chemical (Oakland, San Leandro, Hayward, Union city, Fremont,Milpitas, San Jose)
IntermodalConnections
Amtrak, CalTrain, Santa Clara LRT, BART, MUNI, San Francisco InternationalAirport, Ferry, Bus
Amtrak (Capitol Corridor, Coast Starlight), BART, Santa Clara LRT, OaklandInternational Airport, Ferry, Bus

* - Rankings of High, Moderate, and Low are only used for relative comparative purposes and are not related to potential level of impact.
APPENDIX H – ENVIRONMENTAL EVALUATION
TABLE H-7OVERALL CORRIDOR COMPARISON*
EnvironmentalIssue
Staff Recommended Corridor Authority Option A Authority Option B
LandCover
High
• San Diego (LOSSAN): Rural/Suburban to DenseUrban Development – Los Angeles County,Orange County, Camp Pendleton, San DiegoCounty.
• Los Angeles (UP/Metrolink): Rural/Suburban toDense Urban Development – Riverside, SanBernardino, Ontario, Pomona, City of Industry, LACounty, and Downtown
• Tehachapi (I-5/Grapevine): Rural and SuburbanDevelopment – Santa Clarita, suburbanBakersfield
• Central Valley (West 99): Rural and SuburbanDevelopment – Minter Village, Delano, Tulare,Madera
• Bay Area Access (Pacheco Pass): Rural andSuburban/Urban Development – San Jose,Morgan Hill, Gilroy, San Juan Bautista, Los Banos
• Bay Area (Peninsula): Suburban/UrbanDevelopment – San Francisco, Brisbane, SouthSan Francisco, San Bruno, Millbrae, Burlingame,San Mateo, Belmont, San Carlos, Redwood City,Palo Alto, San Jose
Moderate
• San Diego (I-15/Qualcomm): Rural/Suburban toUrban Development
• Los Angeles (UP/Metrolink): Rural/Suburban toDense Urban Development – Riverside, SanBernardino, Ontario, Pomona, City of Industry, LACounty, and Downtown
• Tehachapi (Palmdale/Mojave): Rural andSuburban/Urban Development – Santa Clarita,Palmdale, Lancaster, Rosamond, Tehachapi,suburban Bakersfield
• Central Valley (West 99): Rural and SuburbanDevelopment – Minter Village, Delano, Tulare,Madera
• Bay Area Access (Pacheco Pass): Rural andSuburban/Urban Development – San Jose,Morgan Hill, Gilroy, San Juan Bautista, Los Banos
• Bay Area (Peninsula): Suburban/UrbanDevelopment – San Francisco, Brisbane, SouthSan Francisco, San Bruno, Millbrae, Burlingame,San Mateo, Belmont, San Carlos, Redwood City,Palo Alto, San Jose
Low
• San Diego (I-15/Qualcomm): Rural/Suburban toUrban Development
• Los Angeles (UP/Metrolink): Rural/Suburban toDense Urban Development – Riverside, SanBernardino, Ontario, Pomona, City of Industry, LACounty, and Downtown
• Tehachapi (I-5/Grapevine): Rural and SuburbanDevelopment – Santa Clarita, suburbanBakersfield
• Central Valley (West 99): Rural and SuburbanDevelopment – Minter Village, Delano, Tulare,Madera
• Bay Area Access (Pacheco Pass): Rural andSuburban/Urban Development – San Jose,Morgan Hill, Gilroy, San Juan Bautista, Los Banos
• Bay Area (Peninsula): Suburban/UrbanDevelopment – San Francisco, Brisbane, SouthSan Francisco, San Bruno, Millbrae, Burlingame,San Mateo, Belmont, San Carlos, Redwood City,Palo Alto, San Jose
EnvironmentalJustice
(Demographics)
High
• San Diego (LOSSAN): Potential MinorityPopulation Impacts – Pico Rivera, Santa FeSprings, and La Mirada.
• Los Angeles (UP/Metrolink): Potential MinorityPopulation Impacts – Los Angeles and SanBernardino County
• Tehachapi (I-5/Grapevine): Potential Low IncomePopulation Impacts – Castaic area
• Central Valley (West 99): No Low-IncomePopulations Identified. Potential MinorityPopulations Impacts – Bakersfield
• Bay Area Access (Pacheco Pass): Potential Low-Income Population Impacts – south San Jose.
Moderate
• San Diego (I-15/Qualcomm): No Minority or Low-Income Populations Identified
• Los Angeles (UP/Metrolink): Potential MinorityPopulation Impacts – Los Angeles and SanBernardino County
• Tehachapi (Palmdale/Mojave): Potential LowIncome Population Impacts – Lancaster area
• Central Valley (West 99): No Low-IncomePopulations Identified. Potential MinorityPopulations Impacts – Bakersfield
• Bay Area Access (Pacheco Pass): Potential Low-Income Population Impacts – south San Jose.Potential Minority Population Impacts – San Jose,
Moderate
• San Diego (I-15/Qualcomm): No Minority or Low-Income Populations Identified
• Los Angeles (UP/Metrolink): Potential MinorityPopulation Impacts – Los Angeles and SanBernardino County
• Tehachapi (I-5/Grapevine): Potential Low IncomePopulation Impacts – Castaic area
• Central Valley (West 99): No Low-IncomePopulations Identified. Potential MinorityPopulations Impacts – Bakersfield
• Bay Area Access (Pacheco Pass): Potential Low-Income Population Impacts – south San Jose.Potential Minority Population Impacts – San Jose,

* - Rankings of High, Moderate, and Low are only used for relative comparative purposes and are not related to potential level of impact.
APPENDIX H – ENVIRONMENTAL EVALUATION
EnvironmentalIssue
Staff Recommended Corridor Authority Option A Authority Option B
EnvironmentalJustice
(Demographics)
Potential Minority Population Impacts – San Jose,Morgan Hill, Gilroy, San Juan Bautista, westHollister, Los Banos
• Bay Area (Peninsula): Potential Low-IncomeImpacts – San Francisco, East San Mateo.Potential Minority Impacts – San Francisco, SanBruno, Millbrae, East Palo Alto, Mountain View,San Jose
Morgan Hill, Gilroy, San Juan Bautista, westHollister, Los Banos
• Bay Area (Peninsula): Potential Low-IncomeImpacts – San Francisco, East San Mateo.Potential Minority Impacts – San Francisco, SanBruno, Millbrae, East Palo Alto, Mountain View,San Jose
Morgan Hill, Gilroy, San Juan Bautista, westHollister, Los Banos
• Bay Area (Peninsula): Potential Low-IncomeImpacts – San Francisco, East San Mateo.Potential Minority Impacts – San Francisco, SanBruno, Millbrae, East Palo Alto, Mountain View,San Jose
Threatened andEndangered
Species
High
• San Diego (LOSSAN): High Potential for Impactsto Threatened & Endangered Species – birdscommonly found in the adjacent lagoons, such asLight-footer Clapper Rail, California Least Tern,Belding Savannah Sparrow, Salt Marsh Bird'sBeak, Snowy Plover, Brown Pelican, Least Bell'sVireo, and American Peregrine Falcon
• Los Angeles (UP/Metrolink): High Potential forImpacts to Threatened & Endangered Species –Kangaroo Rat, Gnatcatcher, Woolly Star
• Tehachapi (I-5/Grapevine): Potential for Impacts toThreatened & Endangered Species – UnarmoredThreespine Stickleback, San Joaquin Kit Fox
• Central Valley (West 99): Potential for Impacts toThreatened & Endangered Species – ValleyElderberry Longhorn Beetle, Giant Garter Snake,Swainson’s Hawk, Fresno Kangaroo Rat, BluntNoised Leopard Lizard, San JoaquinWoollythreads, California Jewel Flower, SanJoaquin Kit Fox, Tipton Kangaroo Rat
• Bay Area Access (Pacheco Pass): Potential forImpacts to Threatened & Endangered Species –San Joaquin Kit Fox, California Tiger Salamander,Giant Garter Snake
• Bay Area (Peninsula): Potential for Impacts toThreatened & Endangered Species – CaliforniaClapper Rail, California Red-Legged Frog,California Tiger Salamander
Moderate
• San Diego (I-15/Qualcomm): Potential forImpacts to Threatened & Endangered Species –Gnatcatcher, Least Bell’s Vireo, San Diego MesaMint
• Los Angeles (UP/Metrolink): High Potential forImpacts to Threatened & Endangered Species –Kangaroo Rat, Gnatcatcher, Woolly Star
• Tehachapi (Palmdale/Mojave): High Potential forImpacts to Threatened & Endangered Species –Unarmored Threespine Stickleback, BakersfieldCactus, San Joaquin Kit Fox, California Jewel-flower, San Joaquin Woollythreads
• Central Valley (West 99): Potential for Impacts toThreatened & Endangered Species – ValleyElderberry Longhorn Beetle, Giant Garter Snake,Swainson’s Hawk, Fresno Kangaroo Rat, BluntNoised Leopard Lizard, San JoaquinWoollythreads, California Jewel Flower, SanJoaquin Kit Fox, Tipton Kangaroo Rat
• Bay Area Access (Pacheco Pass): Potential forImpacts to Threatened & Endangered Species –San Joaquin Kit Fox, California Tiger Salamander,Giant Garter Snake
• Bay Area (Peninsula): Potential for Impacts toThreatened & Endangered Species – CaliforniaClapper Rail, California Red-Legged Frog,California Tiger Salamander
Low
• San Diego (I-15/Qualcomm): Potential for Impactsto Threatened & Endangered Species –Gnatcatcher, Least Bell’s Vireo, San Diego MesaMint
• Los Angeles (UP/Metrolink): High Potential forImpacts to Threatened & Endangered Species –Kangaroo Rat, Gnatcatcher, Woolly Star
• Tehachapi (I-5/Grapevine): Potential for Impactsto Threatened & Endangered Species –Unarmored Threespine Stickleback, San JoaquinKit Fox
• Central Valley (West 99): Potential for Impacts toThreatened & Endangered Species – ValleyElderberry Longhorn Beetle, Giant Garter Snake,Swainson’s Hawk, Fresno Kangaroo Rat, BluntNoised Leopard Lizard, San JoaquinWoollythreads, California Jewel Flower, SanJoaquin Kit Fox, Tipton Kangaroo Rat
• Bay Area Access (Pacheco Pass): Potential forImpacts to Threatened & Endangered Species –San Joaquin Kit Fox, California Tiger Salamander,Giant Garter Snake
• Bay Area (Peninsula): Potential for Impacts toThreatened & Endangered Species – CaliforniaClapper Rail, California Red-Legged Frog,California Tiger Salamander
WaterResources
High
• San Diego (LOSSAN): Major Water Crossings –Los Penasquitos Lagoon, San Diequito Lagoon,San Elino Lagoon, Batiquitos Lagoon, AguaHedionda Lagoon, Buena Vista Lagoon, Loma Alta
Moderate
• San Diego (I-15/Qualcomm): Water Crossings –Rose Canyon, San Clemente Canyon
• Los Angeles (UP/Metrolink): Major WaterCrossings – LA River, Rio Hondo, San Gabriel
Moderate
• San Diego (I-15/Qualcomm): Water Crossings –Rose Canyon, San Clemente Canyon
• Los Angeles (UP/Metrolink): Major WaterCrossings – LA River, Rio Hondo, San Gabriel

* - Rankings of High, Moderate, and Low are only used for relative comparative purposes and are not related to potential level of impact.
APPENDIX H – ENVIRONMENTAL EVALUATION
EnvironmentalIssue
Staff Recommended Corridor Authority Option A Authority Option B
WaterResources
Creek, San Luis Rey River, Santa Margarita River,Santa Ana River
• Los Angeles (UP/Metrolink): Major WaterCrossings – LA River, Rio Hondo, San GabrielRiver, San Jose Creek, Lemon Creek, San AntonioWash, Deer Creek, Etiwanda Wash, Etiwanda/SanSevaine Flood Channel, Rialto Channel, Santa AnaRiver, California Aqueduct, Gage Channel
• Tehachapi (I-5/Grapevine): Major Water Crossings– Edison Channel, Tecuya Creek, CaliforniaAqueduct , Grapevine Creek, Cuddy Canyon,Gorman Creek, Apple Canyon, Pyramid Lake,Cherry Canyon, Canton Canyon, Violin Canyon,Castaic Lake, Castaic Creek, Santa Clara River,Pico Canyon, Gavin Canyon, Newhall Canyon
• Central Valley (West 99): Major Water Crossings –Stanislaus River, Hetch Hetchy Aqueduct,Tuolumne River, Lower Lateral, Ceres Main Canal,Highline Canal, Merced River, Livingston Drain,Atwater Canal, Black Rascal Creek, Bear Creek,South Slough, Hantley Slough, Duck Slough,Dutchman Creek, Chowchilla River, Ash Slough,Berendo Slough, Berendo Creek, Dry Creek,Fresno River, Cottonwood Creek, San JoaquinRiver, Flum Ditch, Houghton Canal, Dry CreekCanal, Fresno Colony Canal, West Perrin Canal,Smith Ditch, Elkhorn Ditch, Weber Ditch, ColeSlough, Kings River, Peoples Ditch, LakelandCanal, Cross Creek, Mosquito Creek, Mill Creek,Tulare Creek, Rockford Ditch, Kaweah Canal,Hooper Ditch, Tulare Canal, Elk Bayou, Tule River,Deer Creek, White River, Posa Creek, Lerdo Canal,Beardsley Canal, Calloway Canal, Kern Canal,Kern River
• Bay Area Access (Pacheco Pass): Major WaterCrossings – Coyote Creek, Little Llagos Creek,Llagos Creek, Bodfish Creek, Uvas Creek, MillerSlough, San Ysidro Creek, Jones Creek, ElephantHead Creek, Cedar Creek, Pacheco Creek, SouthFork, San Luis Reservoir, California Aqueduct,Delta Mendota Canal, Los Banos Creek, MainCanal, 21 Crossings between San Joaquin Riverand the city of Los Banos, San Joaquin River,Mariposa Slough, Deadman Creek, Duck Slough,
River, San Jose Creek, Lemon Creek, San AntonioWash, Deer Creek, Etiwanda Wash, Etiwanda/SanSevaine Flood Channel, Rialto Channel, Santa AnaRiver, California Aqueduct, Gage Channel
• Tehachapi (Palmdale/Mojave): Major WaterCrossings – Rodeo Canyon, Tweedy Creek,Whiterock Creek, Cache Creek, LA Aqueduct,Oak Creek, Amargosa Creek, Lake Palmdale,Palmdale Ditch, California Aqueduct, KentuckySprings Canyon, Soledad Canyon, Bee BoxCanyon, Bootlegger Canyon, Hughes Canyon,Bobcat Canyon, Long Canyon, Aqua DulceCanyon, Bee Canyon, Oak Spring Canyon, SantaClara River, Soledad Canyon, Placerita Creek,Whitney Canyon
• Central Valley (West 99): Major Water Crossings –Stanislaus River, Hetch Hetchy Aqueduct,Tuolumne River, Lower Lateral, Ceres Main Canal,Highline Canal, Merced River, Livingston Drain,Atwater Canal, Black Rascal Creek, Bear Creek,South Slough, Hantley Slough, Duck Slough,Dutchman Creek, Chowchilla River, Ash Slough,Berendo Slough, Berendo Creek, Dry Creek,Fresno River, Cottonwood Creek, San JoaquinRiver, Flum Ditch, Houghton Canal, Dry CreekCanal, Fresno Colony Canal, West Perrin Canal,Smith Ditch, Elkhorn Ditch, Weber Ditch, ColeSlough, Kings River, Peoples Ditch, LakelandCanal, Cross Creek, Mosquito Creek, Mill Creek,Tulare Creek, Rockford Ditch, Kaweah Canal,Hooper Ditch, Tulare Canal, Elk Bayou, Tule River,Deer Creek, White River, Posa Creek, Lerdo Canal,Beardsley Canal, Calloway Canal, Kern Canal,Kern River
• Bay Area Access (Pacheco Pass): Major WaterCrossings – Coyote Creek, Little Llagos Creek,Llagos Creek, Bodfish Creek, Uvas Creek, MillerSlough, San Ysidro Creek, Jones Creek, ElephantHead Creek, Cedar Creek, Pacheco Creek, SouthFork, San Luis Reservoir, California Aqueduct,Delta Mendota Canal, Los Banos Creek, MainCanal, 21 Crossings between San Joaquin Riverand the city of Los Banos, San Joaquin River,Mariposa Slough, Deadman Creek, Duck Slough,
River, San Jose Creek, Lemon Creek, San AntonioWash, Deer Creek, Etiwanda Wash, Etiwanda/SanSevaine Flood Channel, Rialto Channel, Santa AnaRiver, California Aqueduct, Gage Channel
• Tehachapi (I-5/Grapevine): Major Water Crossings– Edison Channel, Tecuya Creek, CaliforniaAqueduct , Grapevine Creek, Cuddy Canyon,Gorman Creek, Apple Canyon, Pyramid Lake,Cherry Canyon, Canton Canyon, Violin Canyon,Castaic Lake, Castaic Creek, Santa Clara River,Pico Canyon, Gavin Canyon, Newhall Canyon
• Central Valley (West 99): Major Water Crossings –Stanislaus River, Hetch Hetchy Aqueduct,Tuolumne River, Lower Lateral, Ceres Main Canal,Highline Canal, Merced River, Livingston Drain,Atwater Canal, Black Rascal Creek, Bear Creek,South Slough, Hantley Slough, Duck Slough,Dutchman Creek, Chowchilla River, Ash Slough,Berendo Slough, Berendo Creek, Dry Creek,Fresno River, Cottonwood Creek, San JoaquinRiver, Flum Ditch, Houghton Canal, Dry CreekCanal, Fresno Colony Canal, West Perrin Canal,Smith Ditch, Elkhorn Ditch, Weber Ditch, ColeSlough, Kings River, Peoples Ditch, LakelandCanal, Cross Creek, Mosquito Creek, Mill Creek,Tulare Creek, Rockford Ditch, Kaweah Canal,Hooper Ditch, Tulare Canal, Elk Bayou, Tule River,Deer Creek, White River, Posa Creek, Lerdo Canal,Beardsley Canal, Calloway Canal, Kern Canal,Kern River
• Bay Area Access (Pacheco Pass): Major WaterCrossings – Coyote Creek, Little Llagos Creek,Llagos Creek, Bodfish Creek, Uvas Creek, MillerSlough, San Ysidro Creek, Jones Creek, ElephantHead Creek, Cedar Creek, Pacheco Creek, SouthFork, San Luis Reservoir, California Aqueduct,Delta Mendota Canal, Los Banos Creek, MainCanal, 21 Crossings between San Joaquin Riverand the city of Los Banos, San Joaquin River,Mariposa Slough, Deadman Creek, Duck Slough,Owens River, Moles Creek, Hartley Slough

* - Rankings of High, Moderate, and Low are only used for relative comparative purposes and are not related to potential level of impact.
APPENDIX H – ENVIRONMENTAL EVALUATION
EnvironmentalIssue
Staff Recommended Corridor Authority Option A Authority Option B
WaterResources
Owens River, Moles Creek, Hartley Slough
• Bay Area (Peninsula): Water Crossings – SanLeanardo Creek, San Lorenzo Creek, Ward Creek,Alameda Creek, Morrison Canyon, Scott Creek,Coyote Creek
Owens River, Moles Creek, Hartley Slough
• Bay Area (Peninsula): Water Crossings – SanLeanardo Creek, San Lorenzo Creek, Ward Creek,Alameda Creek, Morrison Canyon, Scott Creek,Coyote Creek
• Bay Area (Peninsula): Water Crossings – SanLeanardo Creek, San Lorenzo Creek, Ward Creek,Alameda Creek, Morrison Canyon, Scott Creek,Coyote Creek
Floodplain High
• San Diego (LOSSAN): Floodplain Encroachment –near lagoons, creeks, and along the coastline.
• Los Angeles (UP/Metrolink): FloodplainEncroachment – Crosses Santa Ana River Areaand areas in San Bernardino County
• Tehachapi (I-5/Grapevine): Major FloodplainEncroachment – Area near Lamont, GrapevineCreek, Santa Clara River
• Central Valley (West 99): Major FloodplainEncroachment – Stanislaus River, Merced River,Owens Creek, Duck Slough, Dutchman Creek,Cottonwood Creek, San Joaquin River, KingsRiver, Cross Creek, large area north of Tulare, TuleRiver, large area between White River and DeerCreek, White River, east of Lake Woollamos, PosoCreek
• Bay Area Access (Pacheco Pass): FloodplainEncroachment – south end of San Jose, San JuanBautista, and east of Los Banos
• Bay Area (Peninsula): No FloodplainEncroachment Identified
Moderate
• San Diego (I-15/Qualcomm): Minor FloodplainEncroachment
• Los Angeles (UP/Metrolink): FloodplainEncroachment – Crosses Santa Ana River Areaand areas in San Bernardino County
• Tehachapi (Palmdale/Mojave): Major FloodplainEncroachment – Area around Caliente andTehachapi Creeks, Rosamond, Lancaster, andPalmdale; Soledad Canyon; Santa Clara River
• Central Valley (West 99): Major FloodplainEncroachment – Stanislaus River, Merced River,Owens Creek, Duck Slough, Dutchman Creek,Cottonwood Creek, San Joaquin River, KingsRiver, Cross Creek, large area north of Tulare,Tule River, large area between White River andDeer Creek, White River, east of Lake Woollamos,Poso Creek
• Bay Area Access (Pacheco Pass): FloodplainEncroachment – south end of San Jose, San JuanBautista, and east of Los Banos
• Bay Area (Peninsula): No FloodplainEncroachment Identified
Moderate
• San Diego (I-15/Qualcomm): Minor FloodplainEncroachment
• Los Angeles (UP/Metrolink): FloodplainEncroachment – Crosses Santa Ana River Areaand areas in San Bernardino County
• Tehachapi (I-5/Grapevine): Major FloodplainEncroachment – Area near Lamont, GrapevineCreek, Santa Clara River
• Central Valley (West 99): Major FloodplainEncroachment – Stanislaus River, Merced River,Owens Creek, Duck Slough, Dutchman Creek,Cottonwood Creek, San Joaquin River, KingsRiver, Cross Creek, large area north of Tulare, TuleRiver, large area between White River and DeerCreek, White River, east of Lake Woollamos, PosoCreek
• Bay Area Access (Pacheco Pass): FloodplainEncroachment – south end of San Jose, San JuanBautista, and east of Los Banos
• Bay Area (Peninsula): No FloodplainEncroachment Identified
Parks andRecreation
High• San Diego (LOSSAN): Major Park & Recreation
Impacts – estimated 32 city and county parks, 9state beaches
• Los Angeles (UP/Metrolink): Park & RecreationImpacts – Rose Hill Memorial Park, Box SpringsMountain Reserve
• Tehachapi (I-5/Grapevine): Major Park &Recreation Impacts –Angeles National Forest,Hungry Valley State Vehicular Recreational Area,Pyramid Lake Recreation Area, Castaic LakeRecreation Area
• Central Valley (West 99): Minor Parks &Recreation Impacts – Fruitvale Norris Park
Low• San Diego (I-15/Qualcomm): Minor Park &
Recreation Impacts
• Los Angeles (UP/Metrolink): Park & RecreationImpacts – Rose Hill Memorial Park, Box SpringsMountain Reserve
• Tehachapi (Palmdale/Mojave): Park & RecreationImpacts – Pacific Crest National Scenic Trail,Angeles National Forest
• Central Valley (West 99): Minor Parks &Recreation Impacts – Fruitvale Norris Park
Moderate
• San Diego (I-15/Qualcomm): Minor Park &Recreation Impacts
• Los Angeles (UP/Metrolink): Park & RecreationImpacts – Rose Hill Memorial Park, Box SpringsMountain Reserve
• Tehachapi (I-5/Grapevine): Major Park &Recreation Impacts –Angeles National Forest,Hungry Valley State Vehicular Recreational Area,Pyramid Lake Recreation Area, Castaic LakeRecreation Area
• Central Valley (West 99): Minor Parks &Recreation Impacts – Fruitvale Norris Park

* - Rankings of High, Moderate, and Low are only used for relative comparative purposes and are not related to potential level of impact.
APPENDIX H – ENVIRONMENTAL EVALUATION
EnvironmentalIssue
Staff Recommended Corridor Authority Option A Authority Option B
Parks andRecreation
• Bay Area Access (Pacheco Pass): Major Parks &Recreation Impacts – San Luis State RecreationArea, San Luis National Wildlife Area, O’NeillForebay
• Bay Area (Peninsula): Parks & Recreation Impacts– Posey Park, Lions Field Park, Washington Park,Holbrook Palmer Park, El Camino Park, Peers Park,Robles Park, Rengstroff Park
• Bay Area Access (Pacheco Pass): Major Parks &Recreation Impacts – San Luis State RecreationArea, San Luis National Wildlife Area, O’NeillForebay
• Bay Area (Peninsula): Parks & RecreationImpacts – Posey Park, Lions Field Park,Washington Park, Holbrook Palmer Park, ElCamino Park, Peers Park, Robles Park, RengstroffPark
• Bay Area Access (Pacheco Pass): Major Parks &Recreation Impacts – San Luis State RecreationArea, San Luis National Wildlife Area, O’NeillForebay
• Bay Area (Peninsula): Parks & Recreation Impacts– Posey Park, Lions Field Park, Washington Park,Holbrook Palmer Park, El Camino Park, Peers Park,Robles Park, Rengstroff Park
VisualQuality
High
• San Diego (LOSSAN): Major Visual Impacts –elevated guideway for 35% of corridor, parks andbeaches, I-5 travelers, residential areas
• Los Angeles (UP/Metrolink): Visual Impact withElevated Guideway – Riverside
• Tehachapi (I-5/Grapevine): Major Visual Impacts –I-5 travelers, Pyramid Lake, Castaic Lake
• Central Valley (West 99): Minor Visual Impacts –around major water crossings, Fruitvale NorrisPark
• Bay Area Access (Pacheco Pass): Major VisualImpacts – San Luis Reservoir State RecreationArea, National Wildlife Area, O’Neill Forebay,Residential Areas
• Bay Area (Peninsula): Major Visual Impacts –Residential Areas, Cultural Resources, DowntownSan Francisco, San Francisco Bay
Moderate
• San Diego (I-15/Qualcomm): Visual Impact withElevated Guideway
• Los Angeles (UP/Metrolink): Visual Impact withElevated Guideway – Riverside
• Tehachapi (Palmdale/Mojave): Major VisualImpacts – elevated guideway through Bakersfield,Pacific Crest National Scenic Trail, and AngelesNational Forest
• Central Valley (West 99): Minor Visual Impacts –around major water crossings, Fruitvale NorrisPark
• Bay Area Access (Pacheco Pass): Major VisualImpacts – San Luis Reservoir State RecreationArea, National Wildlife Area, O’Neill Forebay,Residential Areas
• Bay Area (Peninsula): Major Visual Impacts –Residential Areas, Cultural Resources, DowntownSan Francisco, San Francisco Bay
Moderate
• San Diego (I-15/Qualcomm): Visual Impact withElevated Guideway
• Los Angeles (UP/Metrolink): Visual Impact withElevated Guideway – Riverside
• Tehachapi (I-5/Grapevine): Major Visual Impacts –I-5 travelers, Pyramid Lake, Castaic Lake
• Central Valley (West 99): Minor Visual Impacts –around major water crossings, Fruitvale NorrisPark
• Bay Area Access (Pacheco Pass): Major VisualImpacts – San Luis Reservoir State RecreationArea, National Wildlife Area, O’Neill Forebay,Residential Areas
• Bay Area (Peninsula): Major Visual Impacts –Residential Areas, Cultural Resources, DowntownSan Francisco, San Francisco Bay
CulturalResources
High
• San Diego (LOSSAN): Major Historic PropertyImpacts – Mission San Juan Capistrano, Old Townin San Diego, and rail stations in Los Angeles andSan Diego
• Los Angeles (UP/Metrolink): Historic PropertyImpacts – Union Station, LA Plaza,Pomona/Ontario
• Tehachapi (I-5/Grapevine): No Historic PropertiesIdentified
• Central Valley (West 99): Historic PropertyImpacts – Taoist Temple, Hanford CarnegieLibrary, Allensworth Historical District, Wasco
Moderate
• San Diego (I-15/Qualcomm): No HistoricProperties Identified
• Los Angeles (UP/Metrolink): Historic PropertyImpacts – Union Station, LA Plaza,Pomona/Ontario
• Tehachapi (Palmdale/Mojave): No HistoricProperties Identified
• Central Valley (West 99): Historic PropertyImpacts – Taoist Temple, Hanford CarnegieLibrary, Allensworth Historical District, WascoUnion High School Auditorium, Shafter ResearchStation, Santa Fe Passenger and Freight Depot
Moderate
• San Diego (I-15/Qualcomm): No HistoricProperties Identified
• Los Angeles (UP/Metrolink): Historic PropertyImpacts – Union Station, LA Plaza,Pomona/Ontario
• Tehachapi (I-5/Grapevine): No Historic PropertiesIdentified
• Central Valley (West 99): Historic PropertyImpacts – Taoist Temple, Hanford CarnegieLibrary, Allensworth Historical District, WascoUnion High School Auditorium, Shafter ResearchStation, Santa Fe Passenger and Freight Depot

* - Rankings of High, Moderate, and Low are only used for relative comparative purposes and are not related to potential level of impact.
APPENDIX H – ENVIRONMENTAL EVALUATION
EnvironmentalIssue
Staff Recommended Corridor Authority Option A Authority Option B
CulturalResources
Union High School Auditorium, Shafter ResearchStation, Santa Fe Passenger and Freight Depot
• Bay Area Access (Pacheco Pass): Major HistoricProperty Impacts – Santa Clara Depot, HollowayHouse, Live Oak Creamery, Old City Hall, Buildingat 27 Fountain Alley, Leib Carriage House, VillaMira Monte, Christian Church of Gilroy, HayesMansion, Santa Clara Verein, Gilroy Free Library,Southern Pacific Depot (10 on site)
• Bay Area (Peninsula): Major Historic PropertyImpacts – Hotel St. Mathew, Diridon Station, SantaClara Depot, Irving Murray School, BurlingameRailroad Station, Menlo Park Railroad Station,Redwood City Historic Commercial Buildings,Morse House, Hostess House, Rincon Annex,Lathrop House, San Mateo County Courthouse,Ramona Street Architectural District, Barron-Latham-Hopkins Gate Lodge, Watkins House,Professorville Historic District, Santa Clara Verein,U.S. Postal Main Office-San Mateo, FederalReserve Bank of San Francisco, Fraternal HallBuilding, U.S. Customhouse, APOLLO (Storeship),New Sequoia Theater Building, Sequoia UnionHigh School, Matson Building and Annex,University African Methodist Episcopal ZionChurch, Palo Alto Southern Pacific Railroad Depot,Martin Building, National Bank of San Mateo
Farmland Moderate
• Los Angeles (UP/Metrolink): Farmland Impacts –San Bernardino County (less than 1 sq. mile)Riverside County (less than 0.5 sq. mile)
• Tehachapi (I-5/Grapevine): Farmland Impacts –Lamont/Weedpatch and Castaic
• Central Valley (West 99): Major Farmland Impacts– 188 acres of prime, unique, or farmland ofstatewide importance
• Bay Area Access (Pacheco Pass): MajorFarmland Impacts – Long stretch of farmland ofstatewide importance form Morgan Hill to Hollister.Mixture of prime, unique, and farmland orstatewide importance from Los Banos toChowchilla
Moderate
• Los Angeles (UP/Metrolink): Farmland Impacts –San Bernardino County (less than 1 sq. mile)Riverside County (less than 0.5 sq. mile)
• Tehachapi (Palmdale/Mojave): Farmland Impacts– Edison area
• Central Valley (West 99): Major Farmland Impacts– 188 acres of prime, unique, or farmland ofstatewide importance
• Bay Area Access (Pacheco Pass): MajorFarmland Impacts – Long stretch of farmland ofstatewide importance form Morgan Hill to Hollister.Mixture of prime, unique, and farmland orstatewide importance from Los Banos toChowchilla
Moderate
• Los Angeles (UP/Metrolink): Farmland Impacts –San Bernardino County (less than 1 sq. mile)Riverside County (less than 0.5 sq. mile)
• Tehachapi (I-5/Grapevine): Farmland Impacts –Lamont/Weedpatch and Castaic
• Central Valley (West 99): Major Farmland Impacts– 188 acres of prime, unique, or farmland ofstatewide importance
• Bay Area Access (Pacheco Pass): MajorFarmland Impacts – Long stretch of farmland ofstatewide importance form Morgan Hill to Hollister.Mixture of prime, unique, and farmland orstatewide importance from Los Banos toChowchilla

* - Rankings of High, Moderate, and Low are only used for relative comparative purposes and are not related to potential level of impact.
APPENDIX H – ENVIRONMENTAL EVALUATION
EnvironmentalIssue
Staff Recommended Corridor Authority Option A Authority Option B
HazardousMaterials/Waste
Moderate
• San Diego (LOSSAN): Major HazardousMaterials/Waste – industrial, military, and aviationsites (San Diego, Orange and Los Angelescounties)
• Los Angeles (UP/Metrolink): HazardousMaterials/Waste – industrial, petroleum, andaviation sites (Los Angeles, City of Industry,Ontario, Riverside)
• Tehachapi (I-5/Grapevine): HazardousMaterials/Waste – refining and metal work sites
• Central Valley (West 99): HazardousMaterials/Waste – aviation, agriculture, industrial
• Bay Area Access (Pacheco Pass): HazardousMaterials/Waste – dump sites, petroleum,agricultural, chemical (San Jose, Gilroy)
• Bay Area (Peninsula): Hazardous Materials/Waste– aviation, commercial, chemical, industrial (SanFrancisco, San Bruno, Millbrae, San Mateo, RedwoodCity, Palo Alto, San Jose)
Moderate
• San Diego (I-15/Qualcomm): Minor HazardousMaterials/Waste
• Los Angeles (UP/Metrolink): HazardousMaterials/Waste – industrial, petroleum, andaviation sites (Los Angeles, City of Industry,Ontario, Riverside)
• Tehachapi (Palmdale/Mojave): Major HazardousMaterials/Waste – refining, trucking, and autorepair sites
• Central Valley (West 99): HazardousMaterials/Waste – aviation, agriculture, industrial
• Bay Area Access (Pacheco Pass): HazardousMaterials/Waste – dump sites, petroleum,agricultural, chemical (San Jose, Gilroy)
• Bay Area (Peninsula): Hazardous Materials/Waste– aviation, commercial, chemical, industrial (SanFrancisco, San Bruno, Millbrae, San Mateo,Redwood City, Palo Alto, San Jose)
Low
• San Diego (I-15/Qualcomm): Minor HazardousMaterials/ Waste Constraints
• Los Angeles (UP/Metrolink): HazardousMaterials/Waste – industrial, petroleum, andaviation sites (Los Angeles, City of Industry,Ontario, Riverside)
• Tehachapi (I-5/Grapevine): HazardousMaterials/Waste – refining and metal work sites
• Central Valley (West 99): HazardousMaterials/Waste – aviation, agriculture, industrial
• Bay Area Access (Pacheco Pass): HazardousMaterials/Waste – dump sites, petroleum,agricultural, chemical (San Jose, Gilroy)
• Bay Area (Peninsula): Hazardous Materials/Waste– aviation, commercial, chemical, industrial (SanFrancisco, San Bruno, Millbrae, San Mateo,Redwood City, Palo Alto, San Jose)

Appendix IO&M Calculation Worksheets

RECOMMENDED CORRIDOR - OPERATIONS AND MAINTENANCE COST SUMMARY (2015)Staff Recommended CorridorLOSSAN-C, Grapevine, West 99, Pacheco 1
DISTANCE NO. OF TRAINS DAILY O&M UNIT COSTS PER TRAIN MILE TOTAL TOTALLIMITS IN PER DAY (Both TOTAL TRAIN L.T.A.C ENERGY COSTS WEEKDAY COSTS ANNUAL COSTS
Begin End MILES Directions) MILES VHS UHS VHS UHS VHS UHS VHS UHSSan Diego to San Diego U. Town Center 12.78 96 1227 19.70 18.73 2.99 3.43 $27,838 $27,188 $9,225,482 $9,009,991Los Angeles U. Town Center Oceanside 24.54 96 2356 19.70 18.73 2.99 3.43 $53,454 $52,205 $17,714,659 $17,300,874
Oceanside Irvine 45.30 96 4349 19.70 18.73 2.99 3.43 $98,674 $96,369 $32,700,654 $31,936,822Irvine Anaheim 14.48 96 1390 19.70 18.73 2.99 3.43 $31,541 $30,804 $10,452,659 $10,208,503
Anaheim Norwalk 14.48 96 1390 19.70 18.73 2.99 3.43 $31,541 $30,804 $10,452,659 $10,208,503Norwalk Union Station 15.28 96 1467 19.70 18.73 2.99 3.43 $33,284 $32,506 $11,030,154 $10,772,509
Riverside to Riverside Ontario 17.92 36 645 19.70 18.73 2.99 3.43 $14,638 $14,296 $4,850,958 $4,737,648Los Angeles Ontario E. San Gabriel 16.09 36 579 19.70 18.73 2.99 3.43 $13,143 $12,836 $4,355,575 $4,253,837
E. San Gabriel Union Station 25.22 36 908 19.70 18.73 2.99 3.43 $20,601 $20,120 $6,827,074 $6,667,605Los Angeles to Union Station Burbank 11.13 132 1469 19.70 18.73 2.99 3.43 $33,335 $32,557 $11,047,299 $10,789,252
Bakersfield Burbank Santa Clarita 21.07 132 2781 19.70 18.73 2.99 3.43 $63,106 $61,632 $20,913,440 $20,424,937Santa Clarita Bakersfield 77.73 132 10260 19.70 18.73 2.99 3.43 $232,808 $227,370 $77,152,428 $75,350,278
Bakersfield to Bakersfield Tulare County 69.56 128 8904 19.70 18.73 2.99 3.43 $202,024 $197,306 $66,950,919 $65,387,059Fresno Tulare County Suburban Fresno 38.04 128 4869 19.70 18.73 2.99 3.43 $110,480 $107,900 $36,613,182 $35,757,960
Fresno to Suburban Fresno Pacheco Junction 27.24 96 2615 19.70 18.73 2.99 3.43 $59,335 $57,949 $19,663,704 $19,204,394San Jose* Pacheco Junction Los Banos 41.88 132 5528 19.70 18.73 2.99 3.43 $125,434 $122,504 $41,568,811 $40,597,834
Los Banos Gilroy 36.97 132 4880 19.70 18.73 2.99 3.43 $110,728 $108,142 $36,695,295 $35,838,155Gilroy San Jose 29.91 132 3948 19.70 18.73 2.99 3.43 $89,583 $87,490 $29,687,754 $28,994,298
San Jose to San Jose Redwood City 21.44 132 2830 19.70 18.73 2.99 3.43 $64,215 $62,715 $21,280,690 $20,783,609San Francisco Redwood City SFO 11.68 132 1542 19.70 18.73 2.99 3.43 $34,983 $34,165 $11,593,212 $11,322,414
SFO Downtown 13.70 132 1808 19.70 18.73 2.99 3.43 $41,033 $40,074 $13,598,202 $13,280,571Fresno to Suburban Fresno Suburban Merced 52.91 36 1905 19.70 18.73 2.99 3.43 $43,219 $42,209 $14,322,778 $13,988,222
Sacramento* Suburban Merced Suburban Modesto 37.52 36 1351 19.70 18.73 2.99 3.43 $30,648 $29,932 $10,156,693 $9,919,450Suburban Modesto Stockton 21.54 36 775 19.70 18.73 2.99 3.43 $17,595 $17,184 $5,830,895 $5,694,695
Stockton Sacramento 50.71 36 1826 19.70 18.73 2.99 3.43 $41,422 $40,454 $13,727,236 $13,406,591
Note : TOTAL $538,412,414 $525,836,011L.T.A.C = Long Term Avoidable Cost (Non-Power Cost)Number of trains during a Weekend is equal to 70% of the Weekday number of trains Assumed 253 weekdays and 112 weekend days (including 8 holidays) in a year* Includes trains between Sacramento and San Jose, 18 trains per direction per day.
SEGMENTS

RECOMMENDED CORRIDOR - OPERATIONS AND MAINTENANCE COST SUMMARY (2015)Authority Recommended Corridor - Option AQualcomm, Inland Empire, Palmdale/Mojave, West 99, Pacheco 1
DISTANCE NO. OF TRAINS DAILY O&M UNIT COSTS PER TRAIN MILE TOTAL TOTALLIMITS IN PER DAY (Both TOTAL TRAIN L.T.A.C ENERGY COSTS WEEKDAY COSTS ANNUAL COSTS
Begin End MILES Directions) MILES VHS UHS VHS UHS VHS UHS VHS UHSSan Diego to East Mission Vly Mira Mesa 9.99 106 1059 19.70 18.73 2.99 3.43 $24,027 $23,466 $7,962,663 $7,776,669Los Angeles Mira Mesa Escondido 14.73 106 1561 19.70 18.73 2.99 3.43 $35,428 $34,600 $11,740,744 $11,466,500
Escondido Temecula 29.27 106 3103 19.70 18.73 2.99 3.43 $70,398 $68,754 $23,330,046 $22,785,095Temecula Riverside 37.56 106 3981 19.70 18.73 2.99 3.43 $90,337 $88,227 $29,937,701 $29,238,407Riverside Ontario 17.92 106 1900 19.70 18.73 2.99 3.43 $43,100 $42,093 $14,283,376 $13,949,741Ontario E. San Gabriel 16.09 106 1706 19.70 18.73 2.99 3.43 $38,699 $37,795 $12,824,750 $12,525,186
E. San Gabriel Union Station 25.22 106 2673 19.70 18.73 2.99 3.43 $60,658 $59,241 $20,101,939 $19,632,392Los Angeles to Union Station Burbank 11.13 132 1469 19.70 18.73 2.99 3.43 $33,335 $32,557 $11,047,299 $10,789,252
Bakersfield Burbank Santa Clarita 15.99 132 2111 19.70 18.73 2.99 3.43 $47,891 $46,773 $15,871,186 $15,500,462Santa Clarita Palmdale 36.75 132 4851 19.70 18.73 2.99 3.43 $110,069 $107,498 $36,476,930 $35,624,890
Palmdale Bakersfield 88.31 132 11657 19.70 18.73 2.99 3.43 $264,496 $258,317 $87,653,814 $85,606,369Bakersfield to Bakersfield Tulare County 69.56 128 8904 19.70 18.73 2.99 3.43 $202,024 $197,306 $66,950,919 $65,387,059
Fresno Tulare County Suburban Fresno 38.04 128 4869 19.70 18.73 2.99 3.43 $110,480 $107,900 $36,613,182 $35,757,960Fresno to Suburban Fresno Pacheco Junction 27.24 96 2615 19.70 18.73 2.99 3.43 $59,335 $57,949 $19,663,704 $19,204,394San Jose* Pacheco Junction Los Banos 41.88 132 5528 19.70 18.73 2.99 3.43 $125,434 $122,504 $41,568,811 $40,597,834
Los Banos Gilroy 36.97 132 4880 19.70 18.73 2.99 3.43 $110,728 $108,142 $36,695,295 $35,838,155Gilroy San Jose 29.91 132 3948 19.70 18.73 2.99 3.43 $89,583 $87,490 $29,687,754 $28,994,298
San Jose to San Jose Redwood City 21.44 132 2830 19.70 18.73 2.99 3.43 $64,215 $62,715 $21,280,690 $20,783,609San Francisco Redwood City SFO 11.68 132 1542 19.70 18.73 2.99 3.43 $34,983 $34,165 $11,593,212 $11,322,414
SFO Downtown 13.70 132 1808 19.70 18.73 2.99 3.43 $41,033 $40,074 $13,598,202 $13,280,571Fresno to Suburban Fresno Suburban Merced 52.91 36 1905 19.70 18.73 2.99 3.43 $43,219 $42,209 $14,322,778 $13,988,222
Sacramento* Suburban Merced Suburban Modesto 37.52 36 1351 19.70 18.73 2.99 3.43 $30,648 $29,932 $10,156,693 $9,919,450Suburban Modesto Stockton 21.54 36 775 19.70 18.73 2.99 3.43 $17,595 $17,184 $5,830,895 $5,694,695
Stockton Sacramento 50.71 36 1826 19.70 18.73 2.99 3.43 $41,422 $40,454 $13,727,236 $13,406,591
Note : TOTAL $592,919,820 $579,070,216L.T.A.C = Long Term Avoidable Cost (Non-Power Cost)Number of trains during a Weekend is equal to 70% of the Weekday number of trains Assumed 253 weekdays and 112 weekend days (including 8 holidays) in a year* Includes trains between Sacramento and San Jose, 18 trains per direction per day.
SEGMENTS
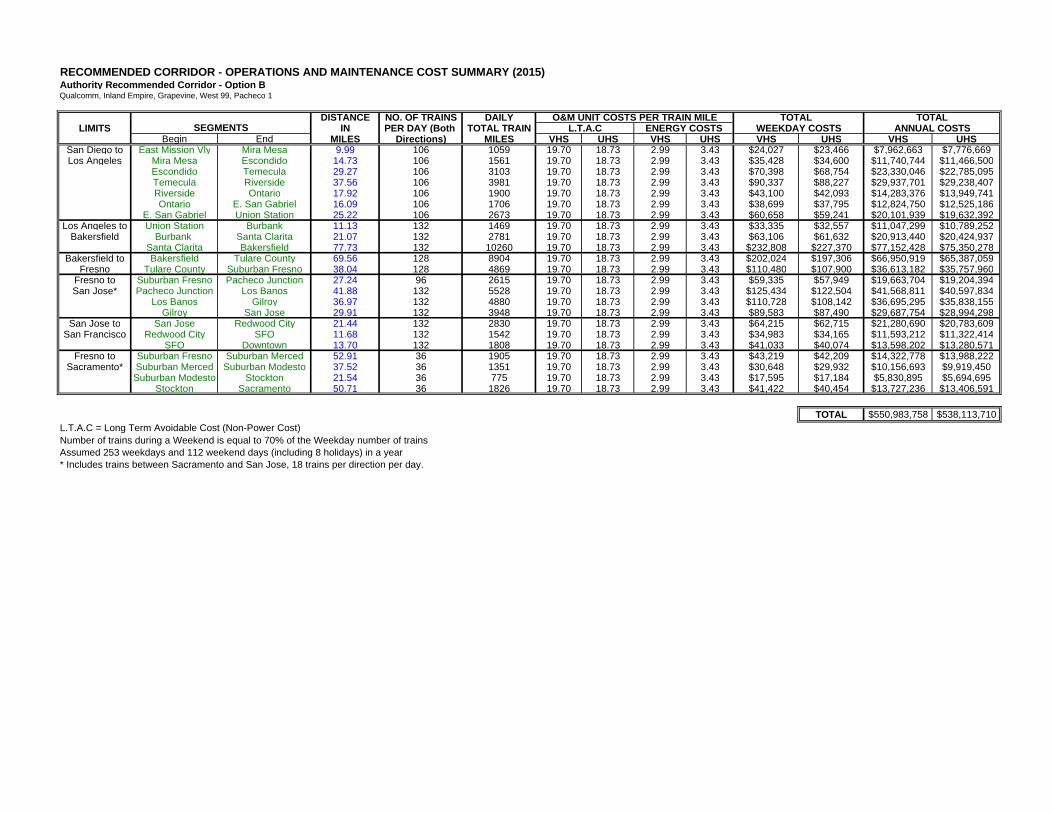
RECOMMENDED CORRIDOR - OPERATIONS AND MAINTENANCE COST SUMMARY (2015)Authority Recommended Corridor - Option BQualcomm, Inland Empire, Grapevine, West 99, Pacheco 1
DISTANCE NO. OF TRAINS DAILY O&M UNIT COSTS PER TRAIN MILE TOTAL TOTALLIMITS IN PER DAY (Both TOTAL TRAIN L.T.A.C ENERGY COSTS WEEKDAY COSTS ANNUAL COSTS
Begin End MILES Directions) MILES VHS UHS VHS UHS VHS UHS VHS UHSSan Diego to East Mission Vly Mira Mesa 9.99 106 1059 19.70 18.73 2.99 3.43 $24,027 $23,466 $7,962,663 $7,776,669Los Angeles Mira Mesa Escondido 14.73 106 1561 19.70 18.73 2.99 3.43 $35,428 $34,600 $11,740,744 $11,466,500
Escondido Temecula 29.27 106 3103 19.70 18.73 2.99 3.43 $70,398 $68,754 $23,330,046 $22,785,095Temecula Riverside 37.56 106 3981 19.70 18.73 2.99 3.43 $90,337 $88,227 $29,937,701 $29,238,407Riverside Ontario 17.92 106 1900 19.70 18.73 2.99 3.43 $43,100 $42,093 $14,283,376 $13,949,741Ontario E. San Gabriel 16.09 106 1706 19.70 18.73 2.99 3.43 $38,699 $37,795 $12,824,750 $12,525,186
E. San Gabriel Union Station 25.22 106 2673 19.70 18.73 2.99 3.43 $60,658 $59,241 $20,101,939 $19,632,392Los Angeles to Union Station Burbank 11.13 132 1469 19.70 18.73 2.99 3.43 $33,335 $32,557 $11,047,299 $10,789,252
Bakersfield Burbank Santa Clarita 21.07 132 2781 19.70 18.73 2.99 3.43 $63,106 $61,632 $20,913,440 $20,424,937Santa Clarita Bakersfield 77.73 132 10260 19.70 18.73 2.99 3.43 $232,808 $227,370 $77,152,428 $75,350,278
Bakersfield to Bakersfield Tulare County 69.56 128 8904 19.70 18.73 2.99 3.43 $202,024 $197,306 $66,950,919 $65,387,059Fresno Tulare County Suburban Fresno 38.04 128 4869 19.70 18.73 2.99 3.43 $110,480 $107,900 $36,613,182 $35,757,960
Fresno to Suburban Fresno Pacheco Junction 27.24 96 2615 19.70 18.73 2.99 3.43 $59,335 $57,949 $19,663,704 $19,204,394San Jose* Pacheco Junction Los Banos 41.88 132 5528 19.70 18.73 2.99 3.43 $125,434 $122,504 $41,568,811 $40,597,834
Los Banos Gilroy 36.97 132 4880 19.70 18.73 2.99 3.43 $110,728 $108,142 $36,695,295 $35,838,155Gilroy San Jose 29.91 132 3948 19.70 18.73 2.99 3.43 $89,583 $87,490 $29,687,754 $28,994,298
San Jose to San Jose Redwood City 21.44 132 2830 19.70 18.73 2.99 3.43 $64,215 $62,715 $21,280,690 $20,783,609San Francisco Redwood City SFO 11.68 132 1542 19.70 18.73 2.99 3.43 $34,983 $34,165 $11,593,212 $11,322,414
SFO Downtown 13.70 132 1808 19.70 18.73 2.99 3.43 $41,033 $40,074 $13,598,202 $13,280,571Fresno to Suburban Fresno Suburban Merced 52.91 36 1905 19.70 18.73 2.99 3.43 $43,219 $42,209 $14,322,778 $13,988,222
Sacramento* Suburban Merced Suburban Modesto 37.52 36 1351 19.70 18.73 2.99 3.43 $30,648 $29,932 $10,156,693 $9,919,450Suburban Modesto Stockton 21.54 36 775 19.70 18.73 2.99 3.43 $17,595 $17,184 $5,830,895 $5,694,695
Stockton Sacramento 50.71 36 1826 19.70 18.73 2.99 3.43 $41,422 $40,454 $13,727,236 $13,406,591
TOTAL $550,983,758 $538,113,710L.T.A.C = Long Term Avoidable Cost (Non-Power Cost)Number of trains during a Weekend is equal to 70% of the Weekday number of trains Assumed 253 weekdays and 112 weekend days (including 8 holidays) in a year* Includes trains between Sacramento and San Jose, 18 trains per direction per day.
SEGMENTS

Appendix JExpress Commute Analysis

Table 1
Express Commute Service - Intercity Capacity Analysis
Intercity ServicePeak Period Intercity Train Runs Total Daily Total Daily
Commuter Alignment Station (Local, Sub Express, Reg Local) Available Demand AmountLoad Factor1 AM PM Total Capacity2 (Both Directions) Served by Intercity
LA County - Option A Palmdale 76% 5 11 16 4096 6400Santa Clarita 69% 5 11 16 4824 15120Burbank 60% 5 11 16 5760 17100 28%LA Union Station 70% 5 11 16 4720
LA County - Option A Santa Clarita 84% 5 11 16 3264 8560Burbank 72% 5 11 16 4512 10540 31%LA Union Station 77% 5 11 16 3992
Riverside - Option A Temecula 46% 15 11 26 11726 7400Riverside 50% 15 11 26 11050 7700Ontario Airport 52% 15 11 26 10712 10900E. San Gabriel 67% 15 11 26 8177 11600 70%LA Union Station 58% 15 11 26 9698
Riverside - Option B Temecula 47% 15 11 26 11557 7400Riverside 53% 15 11 26 10543 7700Ontario Airport 55% 15 11 26 10205 10900E. San Gabriel 75% 15 11 26 6825 11600 59%LA Union Station 67% 15 11 26 8177
San Diego - Option A Temecula 42% 2 9 11 5247 80Escondido 27% 2 9 11 6319.5 680Mira Mesa 22% 2 9 11 6677 710 100%E. Mission Valley 0% 2 9 11 8250
San Diego - Option B Temecula 43% 2 9 11 5175.5 80Escondido 27% 2 9 11 6319.5 680Mira Mesa 22% 2 9 11 6677 710 100%E. Mission Valley 0% 2 9 11 8250
Bay Area - Option A Los Banos 72% 8 12 20 5640 200Gilroy 63% 8 12 20 6810 500San Jose 48% 8 12 20 8760 5300Redwood City 32% 8 12 20 10840 10300SFO 25% 8 12 20 11750 10400 100%Downtown SF 0% 8 12 20 15000
Bay Area - Option B Los Banos 82% 8 12 20 4340 200Gilroy 72% 8 12 20 5640 500San Jose 55% 8 12 20 7850 5300Redwood City 37% 8 12 20 10190 10300SFO 29% 8 12 20 11230 10400 100%Downtown SF 0% 8 12 20 15000
1) Source Charles River Associates2) Assumes capacity of 650 Intercity passengers plus 100 commute passengers.

Table 2
Express Commute Service - Operations and Maintenance CostsComparison of Intercity and Commuter Unit Costs
Item Intercity Commuter Intercity CommuterCost / Train-mile Cost / Train-mile Cost / Train-mile Cost / Train-mile
Train Operations 6.08$ 6.08$ 6.08$ 6.08$ Equipment Maintenance 7.13$ 21.39$ 6.42$ 19.26$ Station Services 0.50$ 1.00$ 0.50$ 1.00$ Marketing and Reservations 1.28$ 1.28$ 1.28$ 1.28$ Insurance 1.22$ 1.22$ 1.22$ 1.22$ General Support 0.88$ 1.06$ 0.88$ 1.06$ Maintenance of Way 2.61$ 2.61$ 2.35$ 2.61$ Subtotal Non-Power Cost Components 19.70$ 34.64$ 18.73$ 32.51$
Power 2.99$ 3.74$ 3.43$ 4.29$
Total 22.69$ 38.37$ 22.16$ 36.79$
VHS Technology Maglev Technology

Table 3
Express Commute Service - Operations and Maintenance
Authority Recommended Corridor - Option AQualcomm, Inland Empire, Palmdale/Mojave, West 99, Pacheco 1
DISTANCEIN L.T.A.C ENERGY COSTS
MILES
San Diego Temecula Qualcomm 55.31 24 03 1991 0 34.64 3.74 $19,334,442 $0
Los Angeles Temecula LA Union Station 93.69 24 8 2811 1124 34.64 3.74 $27,292,290 $10,916,916Palmdale LA Union Station 63.87 284 22 2555 2044 34.64 3.74 $24,807,466 $19,845,973
San Francisco Los Banos San Francisco 117.16 485 03 5624 0 34.64 3.74 $54,606,720 $0
TOTAL $126,040,919 $41,779,754
Authority Recommended Corridor - Option BQualcomm, Inland Empire, Grapevine, West 99, Pacheco 1
DISTANCEIN L.T.A.C ENERGY COSTS
MILES
San Diego Temecula Qualcomm 55.31 24 03 1991 0 34.64 3.74 $19,334,442 $0
Los Angeles Temecula LA Union Station 93.69 24 10 2811 1312 34.64 3.74 $27,292,290 $12,736,402Santa Clarita LA Union Station 32.19 24 18 1223 901 34.64 3.74 $11,877,637 $8,751,943
San Francisco Los Banos San Francisco 117.16 485 03 5624 0 34.64 3.74 $54,606,720 $0
TOTAL $113,111,090 $31,853,693Note :1) L.T.A.C = Long Term Avoidable Cost (Non-Power Cost)2) Assumed 253 weekdays3) Capacity available on intercity local service; however, does not meet commute frequency assumptions. Thus revenue estimate may be inflated.4) Additional trains required to meet forecasted demand.5) Commute service assumed in both directions for this corridor.6) Number of trains reduced by the amount of commute demand served by intercity trainsets.7) Includes return trips.8) Includes additional Intercity O&M associated with additional coach cars.
(VHS) (VHS) (SEPARATE) (INTEGRATED)8
TOTAL ANNUAL COMMUTE O&M COSTSO&M UNIT COSTS PER TRAIN MILE
REGIONLIMITS
BEGIN END (SEPARATE) (INTEGRATED)6 (SEPARATE) (INTEGRATED)
ADDITIONAL COMMUTE TRAIN RUNS REQUIRED
DAILY TOTAL TRAINMILES7
LIMITSADDITIONAL COMMUTE DAILY TOTAL TRAIN O&M UNIT COSTS PER TRAIN MILETRAIN RUNS REQUIRED MILES7 TOTAL ANNUAL COMMUTE O&M COSTS
REGIONBEGIN END (SEPARATE) (INTEGRATED)6 (SEPARATE) (INTEGRATED)8(INTEGRATED) (VHS) (VHS) (SEPARATE)

Table 4
Express Commute Service - Capital Costs
Authority Recommended Corridor- Option A
TOTAL $880,000,000 $282,500,000 $70,928,000 $22,769,500
1) Assumes a 20% maintenance/spare ratio2) Based on new commuter trainset (different from Long Distance Intercity trainsets) with 650 seat capacity and a cost of $20 million per trainset3) Assumes franchise period of 30 years annualized at 7%4) 25 coach cars added to the Intercity trains which would carry commuters, at $2.5 million each.
Authority Recommended Corridor- Option B
TOTAL $800,000,000 $242,500,000 $64,480,000 $19,545,500
1) Assumes a 20% maintenance/spare ratio2) Based on new commuter trainset (different from Long Distance Intercity trainsets) with 650 seat capacity and a cost of $20 million per trainset3) Assumes franchise period of 30 years annualized at 7%4) 25 coach cars added to the Intercity trains which would carry commuters, at $2.5 million each.
$5,037,500
Intercity 0 254 $0 $62,500,000 $0 $5,037,500
254 $0 $62,500,000 $0Intercity 0
LIMITS
BEGIN END
REGION
NUMBER OF TRAINSETS REQUIRED
FOR PURCHASE 1
SEPARATE INTEGRATED
EQUIPMENT CAPITAL COST
TOTAL 2 ANNUAL 3
SEPARATE INTEGRATED SEPARATE INTEGRATED
8
Temecula LA Union Station
Temecula Qualcomm
11
Palmdale LA Union Station
Los Banos San Francisco
3
10 8 $16,120,000 $12,896,000
$0
$220,000,000 $60,000,000 $17,732,000 $4,836,000
$160,000,000 $0 $12,896,000
$300,000,000 $0
$200,000,000 $160,000,000
LIMITSNUMBER OF TRAINSETS REQUIRED
FOR PURCHASE 1
San Diego
Los Angeles
San Francisco
REGION
0
15 0
INTEGRATED SEPARATE INTEGRATEDBEGIN END SEPARATE INTEGRATED
San Diego Temecula Qualcomm 8 0 $160,000,000 $0 $12,896,000 $0
Los AngelesTemecula LA Union Station 11 4 $220,000,000 $80,000,000 $17,732,000 $6,448,000
$120,000,000 $100,000,000Santa Clarita LA Union Station 6 5
0 $300,000,000 $0San Francisco Los Banos San Francisco 15 $0
$24,180,000 $0
$24,180,000
$9,672,000 $8,060,000
EQUIPMENT CAPITAL COST
TOTAL 2 ANNUAL 3
SEPARATE

Appendix KImplementation / Capital Phasing

PROJECT CAPITAL PHASING (TOTAL)HSR Corridor Evaluation (VHS)Based on Preliminary Cost Estimate for the Authority Recommended System Option A ($Millions of 1999 Dollars)Phasing Plan 1
Item 1 2 3 4 5 6 7 8 9 10 11 12 13 14 15 16 Total % of Total
PE/Environmental
Program Environmental 10$ 10$ 20$ 0%
Prelim Engr/EIS/EIR 75$ 100$ 100$ 75$ 350$ 1%
Right of Way 278$ 556$ 390$ 390$ 877$ 2,490$ 10%
Design-Build - Civil
Stations 83$ 165$ 165$ 231$ 231$ 231$ 231$ 1,337$ 5%
Line Construction 531$ 797$ 797$ 1,399$ 1,735$ 1,735$ 1,735$ 1,735$ 868$ 11,333$ 44%
DBOM - Vehicles 98$ 98$ 98$ 98$ 196$ 196$ 196$ 196$ 1,178$ 5%
DBOM - Systems
Trackwork 22$ 66$ 66$ 66$ 134$ 268$ 268$ 268$ 268$ 134$ 1,562$ 6%
Electrification 20$ 61$ 61$ 61$ 126$ 252$ 252$ 252$ 252$ 126$ 1,461$ 6%
Signaling and Comm 26$ 79$ 79$ 79$ 164$ 327$ 327$ 327$ 327$ 164$ 1,900$ 7%
Support Facilities 30$ 53$ 53$ 15$ 43$ 43$ 43$ 24$ 304$ 1%
Program Implementation 186$ 198$ 361$ 410$ 522$ 484$ 522$ 522$ 373$ 149$ 3,727$ 15%(Admin, PM & CM)
Total $10 $10 $75 $100 $100 $75 $1,193 $1,990 $2,070 $2,683 $3,558 $3,110 $3,575 $3,575 $2,540 $1,000 $25,661 100%
% of Total Cost 0.04% 0.04% 0.29% 0.39% 0.39% 0.29% 5% 8% 8% 10% 14% 12% 14% 14% 10% 4% 100%
Year
Appendix K-Implementation:Option A (VHS) 16 YR Total_11/21/00

PROJECT CAPITAL PHASING (TOTAL)HSR Corridor Evaluation (Maglev)Based on Preliminary Cost Estimate for the Authority Recommended System Option A ($Millions of 1999 Dollars)Phasing Plan 1
Item 1 2 3 4 5 6 7 8 9 10 11 12 13 14 15 16 Total % of Total
PE/Environmental
Program Environmental 10$ 10$ 20$ 0%
Prelim Engr/EIS/EIR 75$ 100$ 100$ 75$ 350$ 1%
Right of Way 278$ 556$ 390$ 390$ 877$ 2,490$ 7%
Design-Build - Civil
Stations 83$ 165$ 165$ 231$ 231$ 231$ 231$ 1,337$ 4%
Line Construction 531$ 797$ 797$ 1,407$ 1,751$ 1,751$ 1,751$ 1,751$ 875$ 11,410$ 33%
DBOM - Vehicles 93$ 93$ 93$ 93$ 186$ 186$ 186$ 186$ 1,116$ 3%
DBOM - Systems
Trackwork 73$ 219$ 219$ 219$ 456$ 912$ 912$ 912$ 912$ 456$ 5,289$ 15%
Electrification 64$ 191$ 191$ 191$ 397$ 794$ 794$ 794$ 794$ 397$ 4,610$ 13%
Signaling and Comm 28$ 85$ 85$ 85$ 177$ 355$ 355$ 355$ 355$ 177$ 2,058$ 6%
Support Facilities 30$ 53$ 53$ 15$ 43$ 43$ 43$ 24$ 304$ 1%
Program Implementation 207$ 362$ 362$ 466$ 673$ 673$ 777$ 777$ 621$ 259$ 5,178$ 15%(Admin, PM & CM)
Total $10 $10 $75 $100 $100 $75 $1,305 $2,439 $2,356 $3,031 $4,331 $4,528 $5,048 $5,048 $3,999 $1,706 $34,161 100%
% of Total Cost 0.03% 0.03% 0.22% 0.29% 0.29% 0.22% 4% 7% 7% 9% 13% 13% 15% 15% 12% 5% 100%
Year
Appendix K-Implementation:Option A (UHS) 16 YR Total_11/21/00

PROJECT CAPITAL PHASING (TOTAL)HSR Corridor Evaluation (VHS)Based on Preliminary Cost Estimate for the Authority Recommended System Option B($Millions of 1999 Dollars)Phasing Plan 1
Item 1 2 3 4 5 6 7 8 9 10 11 12 13 14 15 16 Total % of Total
PE/Environmental
Program Environmental 10$ 10$ 20$ 0%
Prelim Engr/EIS/EIR 75$ 100$ 100$ 75$ 350$ 1%
Right of Way 271$ 542$ 363$ 363$ 816$ 2,356$ 9%
Design-Build - Civil
Stations 83$ 165$ 165$ 214$ 214$ 214$ 214$ 1,268$ 5%
Line Construction 531$ 797$ 797$ 1,390$ 1,718$ 1,718$ 1,718$ 1,718$ 859$ 11,248$ 45%
DBOM - Vehicles 98$ 98$ 98$ 98$ 196$ 196$ 196$ 196$ 1,178$ 5%
DBOM - Systems
Trackwork 22$ 66$ 66$ 66$ 127$ 254$ 254$ 254$ 254$ 127$ 1,490$ 6%
Electrification 20$ 61$ 61$ 61$ 117$ 233$ 233$ 233$ 233$ 117$ 1,369$ 5%
Signaling and Comm 26$ 79$ 79$ 79$ 152$ 304$ 304$ 304$ 304$ 152$ 1,782$ 7%
Support Facilities 30$ 53$ 53$ 15$ -$ 43$ 43$ 43$ 24$ -$ 304$ 1%
Program Implementation 181$ 289$ 325$ 361$ 505$ 433$ 505$ 505$ 361$ 144$ 3,610$ 14%(Admin, PM & CM)
Total $10 $10 $75 $100 $100 $75 $1,180 $2,068 $2,007 $2,598 $3,436 $2,985 $3,468 $3,468 $2,446 $950 $24,974 100%
% of Total Cost 0.04% 0.04% 0.30% 0.40% 0.40% 0.30% 5% 8% 8% 10% 14% 12% 14% 14% 10% 4% 100%
Year
Appendix K-Implementation:Option B (VHS) 16 YR Total_11/21/00

PROJECT CAPITAL PHASING (TOTAL)HSR Corridor Evaluation (VHS)Based on Preliminary Cost Estimate for the Authority Recommended System Option A ($Millions of 1999 Dollars)Phasing Plan 2
Item 1 2 3 4 5 6 7 8 9 10 11 12 13 14 15 16 Total % of Total
PE/Environmental
Program Environmental 10$ 10$ 20$ 0%
Prelim Engr/EIS/EIR 75$ 100$ 100$ 75$ 350$ 1%
Right of Way 423$ 423$ 564$ 360$ 360$ 360$ 2,490$ 10%
Design-Build - Civil
Stations 184$ 184$ 184$ 184$ 120$ 240$ 240$ 1,337$ 5%
Line Construction 1,108$ 1,108$ 1,108$ 1,108$ 1,108$ 1,108$ 1,171$ 1,171$ 1,171$ 1,171$ 11,333$ 44%
DBOM - Vehicles 196$ 196$ 196$ 295$ 98$ 98$ 98$ 1,178$ 5%
DBOM - Systems
Trackwork 100$ 200$ 200$ 200$ 200$ 156$ 169$ 169$ 169$ 1,562$ 6%
Electrification 95$ 189$ 189$ 189$ 189$ 146$ 155$ 155$ 155$ 1,461$ 6%
Signaling and Comm 123$ 246$ 246$ 246$ 246$ 190$ 201$ 201$ 201$ 1,900$ 7%
Support Facilities 43$ 43$ 43$ 24$ 30$ 53$ 53$ 15$ 304$ 1%
Program Implementation 298$ 381$ 381$ 381$ 381$ 381$ 381$ 381$ 381$ 381$ 3,727$ 15%(Admin, PM & CM)
Total $10 $10 $75 $100 $100 $75 $1,829 $2,230 $2,730 $2,547 $2,547 $2,889 $2,913 $2,708 $2,468 $2,430 $25,661 100%
% of Total Cost 0.04% 0.04% 0.29% 0.39% 0.39% 0.29% 7% 9% 11% 10% 10% 11% 11% 11% 10% 9% 100%
Note: Assumes Los Angeles to San Francisco opens for revenue service at the beginning of Year 14.
Year
Appendix K-Implementation:Opt A (VHS) 16 YR Total_21/21/00

PROJECT CAPITAL PHASING (TOTAL)HSR Corridor Evaluation (Maglev)Based on Preliminary Cost Estimate for the Authority Recommended System Option A ($Millions of 1999 Dollars)Phasing Plan 2
Item 1 2 3 4 5 6 7 8 9 10 11 12 13 14 15 16 Total % of Total
PE/Environmental
Program Environmental 10$ 10$ 20$ 0%
Prelim Engr/EIS/EIR 75$ 100$ 100$ 75$ 350$ 1%
Right of Way 423$ 423$ 564$ 360$ 360$ 360$ 2,490$ 7%
Design-Build - Civil
Stations 184$ 184$ 184$ 184$ 120$ 240$ 240$ 1,337$ 4%
Line Construction 1,121$ 1,121$ 1,121$ 1,121$ 1,121$ 1,121$ 1,171$ 1,171$ 1,171$ 1,171$ 11,410$ 33%
DBOM - Vehicles 186$ 186$ 186$ 279$ 93$ 93$ 93$ 1,116$ 3%
DBOM - Systems
Trackwork 343$ 686$ 686$ 686$ 686$ 529$ 558$ 558$ 558$ 5,289$ 15%
Electrification 298$ 596$ 596$ 596$ 596$ 461$ 489$ 489$ 489$ 4,610$ 13%
Signaling and Comm 133$ 266$ 266$ 266$ 266$ 206$ 218$ 218$ 218$ 2,058$ 6%
Support Facilities 43$ 43$ 43$ 24$ 30$ 53$ 53$ 15$ 304$ 1%
Program Implementation 414$ 529$ 529$ 529$ 529$ 529$ 529$ 529$ 529$ 529$ 5,178$ 15%(Admin, PM & CM)
Total $10 $10 $75 $100 $100 $75 $1,958 $2,847 $3,805 $3,611 $3,611 $3,953 $3,750 $3,591 $3,351 $3,313 $34,161 100%
% of Total Cost 0.03% 0.03% 0.22% 0.29% 0.29% 0.22% 6% 8% 11% 11% 11% 12% 11% 11% 10% 10% 100%
Note: Assumes Los Angeles to San Francisco opens for revenue service at the beginning of Year 14.
Year
Appendix K-Implementation:Opt A (UHS) 16 YR Total_21/21/00

PROJECT CAPITAL PHASING (TOTAL)HSR Corridor Evaluation (VHS)Based on Preliminary Cost Estimate for the Authority Recommended System Option B ($Millions of 1999 Dollars)Phasing Plan 2
Item 1 2 3 4 5 6 7 8 9 10 11 12 13 14 15 16 Total % of Total
PE/Environmental
Program Environmental 10$ 10$ 20$ 0%
Prelim Engr/EIS/EIR 75$ 100$ 100$ 75$ 350$ 1%
Right of Way 383$ 383$ 510$ 360$ 360$ 360$ 2,356$ 9%
Design-Build - Civil
Stations 167$ 167$ 167$ 167$ 120$ 240$ 240$ 1,268$ 5%
Line Construction 1,094$ 1,094$ 1,094$ 1,094$ 1,094$ 1,094$ 1,171$ 1,171$ 1,171$ 1,171$ 11,248$ 45%
DBOM - Vehicles 196$ 196$ 196$ 295$ 98$ 98$ 98$ 1,178$ 5%
DBOM - Systems
Trackwork 93$ 185$ 185$ 185$ 185$ 149$ 169$ 169$ 169$ 1,490$ 6%
Electrification 85$ 171$ 171$ 171$ 171$ 137$ 155$ 155$ 155$ 1,369$ 5%
Signaling and Comm 111$ 222$ 222$ 222$ 222$ 178$ 201$ 201$ 201$ 1,782$ 7%
Support Facilities 43$ 43$ 43$ 24$ 30$ 53$ 53$ 15$ 304$ 1%
Program Implementation 289$ 369$ 369$ 369$ 369$ 369$ 369$ 369$ 369$ 369$ 3,610$ 14%(Admin, PM & CM)
Total $10 $10 $75 $100 $100 $75 $1,766 $2,135 $2,594 $2,447 $2,447 $2,789 $2,856 $2,696 $2,456 $2,418 $24,974 100%
% of Total Cost 0.04% 0.04% 0.30% 0.40% 0.40% 0.30% 7% 9% 10% 10% 10% 11% 11% 11% 10% 10% 100%
Note: Assumes Los Angeles to San Francisco opens for revenue service at the beginning of Year 14.
Year
Appendix K-Implementation:Opt B (VHS) 16 YR Total_21/21/00