final report (arial 22) - defense technical information center · final report microgrid enabled...
TRANSCRIPT

FINAL REPORT Microgrid Enabled Distributed Energy Solutions (MEDES)
Fort Bliss Military Reservation
ESTCP Project EW-201140
FEBRUARY 2014
Teri Hall Curtis H. Fischer Lockheed Martin
Distribution Statement A

REPORT DOCUMENTATION PAGE Form Approved
OMB No. 0704-0188 Public reporting burden for this collection of information is estimated to average 1 hour per response, including the time for reviewing instructions, searching existing data sources, gathering and maintaining the data needed, and completing and reviewing this collection of information. Send comments regarding this burden estimate or any other aspect of this collection of information, including suggestions for reducing this burden to Department of Defense, Washington Headquarters Services, Directorate for Information Operations and Reports (0704-0188), 1215 Jefferson Davis Highway, Suite 1204, Arlington, VA 22202-4302. Respondents should be aware that notwithstanding any other provision of law, no person shall be subject to any penalty for failing to comply with a collection of information if it does not display a currently valid OMB control number. PLEASE DO NOT RETURN YOUR FORM TO THE ABOVE ADDRESS.
1. REPORT DATE (DD-MM-YYYY)
23-04-2014
2. REPORT TYPE
Final Report
3. DATES COVERED (From - To)
06/2011-12/2013
4. TITLE AND SUBTITLE
Microgrid Enabled Distributed Energy Solutions (MEDES)
5a. CONTRACT NUMBER
W912HQ-11-C-0082
Fort Bliss, Texas 5b. GRANT NUMBER
5c. PROGRAM ELEMENT NUMBER
6. AUTHOR(S)
Teri Hall, William Wright, Roger Kar, and Brad Fiebig
5d. PROJECT NUMBER
EW-201140
Edited by Curtis H. Fischer
5e. TASK NUMBER
5f. WORK UNIT NUMBER
7. PERFORMING ORGANIZATION NAME(S) AND ADDRESS(ES)
AND ADDRESS(ES)
8. PERFORMING ORGANIZATION REPORT NUMBER
Lockheed Martin MFC
P.O. Box 650003
Dallas, Texas 75265-0003
EW-201140
9. SPONSORING / MONITORING AGENCY NAME(S) AND ADDRESS(ES) 10. SPONSOR/MONITOR’S ACRONYM(S)
SERDP/ESTCP SERDP/ESTCP
4800 Mark Center Drive,
Suite 17D08, Alexandria, 11. SPONSOR/MONITOR’S REPORT
VA 22350-3605 NUMBER(S)
EW-201140
12. DISTRIBUTION / AVAILABILITY STATEMENT
Approved for public release; distribution is unlimited.
13. SUPPLEMENTARY NOTES
14. ABSTRACT
By leveraging the existing backup generators and photovoltaic array, integrating intelligent
controls on the renewable resources and introducing an energy storage system, Lockheed
Martin’s Intelligent Microgrid Solution can provide more energy security while also lowering
electric utility costs and greenhouse gas emissions.
15. SUBJECT TERMS
Microgrid, Intelligent Microgrid Solutions, Energy Security, Reduce Energy Costs, Reduce
Green House Gases, Energy Storage System, Microgrid Control System, Power, Energy, Solar
16. SECURITY CLASSIFICATION OF:
17. LIMITATION OF ABSTRACT
18. NUMBER OF PAGES
19a. NAME OF RESPONSIBLE PERSON
Curtis H Fischer
a. REPORT
UNCLASSIFIED
b. ABSTRACT
UNCLASSIFIED
c. THIS PAGE
UNCLASSIFIED
83 +
Cover
19b. TELEPHONE NUMBER (include area
code) 972-603-3715
Standard Form 298 (Rev. 8-98)
Prescribed by ANSI Std. Z39.18

ESTCP Final Report:
EW 201140 i April 2014
Table of Contents List of Acronyms ........................................................................................................................... iv
List of Figures ............................................................................................................................... vii
List of Tables ................................................................................................................................. ix
Acknowledgements ........................................................................................................................ ix
Executive Summary ....................................................................................................................... xi
1.0 Introduction ............................................................................................................................. 1
1.1 Background ...................................................................................................................... 1
1.1.1 Current State of Technology in DoD ........................................................................ 2
1.1.2 Technology Opportunity ........................................................................................... 3
1.2 Objective of the Demonstration ....................................................................................... 3
1.3 Regulatory Drivers ........................................................................................................... 5
2.0 Technology Description .......................................................................................................... 7
2.1 Technology Overview ...................................................................................................... 7
2.2 Technology Development .............................................................................................. 13
2.2.1 Grid Tied Microgrid Functions ............................................................................... 14
2.2.2 Grid Independent Functions .................................................................................... 15
2.2.3 Always Active Functions ........................................................................................ 17
2.3 Advantages And Limitations Of The Technology ......................................................... 17
3.0 Performance Objectives ......................................................................................................... 20
3.1 Summary Of Performance Objectives and Results ........................................................ 21
3.2 Performance Objectives Descriptions ............................................................................ 22
3.2.1 Reduce Facility Energy Usage ................................................................................ 22
3.2.2 Reduce Fuel Usage and GHG Emissions of Backup Generators ........................... 23
3.2.3 Increase Power Availability During Grid Independent Operation ......................... 23
3.2.4 Energy Surety.......................................................................................................... 24
3.2.5 Reduction in Back Up Generator Usage ................................................................. 24
3.2.6 System Economics .................................................................................................. 25
3.2.7 Power Quality Assessment ..................................................................................... 25
3.2.8 Reduction of Transient Power Flow Caused by Renewable Energy ...................... 25
3.2.9 Power Factor Improvement..................................................................................... 26
3.2.10 Electricity Arbitrage................................................................................................ 26

ESTCP Final Report:
EW 201140 ii April 2014
4.0 Facility/Site Description ........................................................................................................ 27
4.1 Facility/Site Location And Operations ........................................................................... 27
4.1.1 Demonstration Site Description .............................................................................. 27
4.1.2 Key Operations ....................................................................................................... 28
4.1.3 Personnel ................................................................................................................. 29
4.2 Facility/Site Conditions .................................................................................................. 30
5.0 Test Design ............................................................................................................................ 31
5.1 Conceptual Test Design ................................................................................................. 31
5.1.1 Peak Shaving Test ................................................................................................... 31
5.1.2 Grid Failure Test ..................................................................................................... 32
5.1.3 Grid Independent Test............................................................................................. 33
5.2 Baseline Characterization ............................................................................................... 35
5.2.1 Reference Conditions .............................................................................................. 35
5.2.2 Baseline Collection Period ...................................................................................... 35
5.2.3 Existing Baseline Data ............................................................................................ 35
5.2.4 Baseline Estimation ................................................................................................ 35
5.2.5 Data Collection Equipment ..................................................................................... 36
5.3 Design And Layout Of Technology Components .......................................................... 37
5.3.1 Major Subsystems and Components ....................................................................... 37
5.3.2 Communications Design ......................................................................................... 50
5.3.3 Failure Modes and Effects Analysis (FMEA) ........................................................ 51
5.4 Operational Testing ........................................................................................................ 51
5.4.1 Operational Testing of Cost and Performance ........................................................ 51
5.4.2 Technology Transfer or Decommissioning ............................................................ 52
5.5 Sampling Protocol .......................................................................................................... 52
5.5.1 Sampling Protocol for Baseline Measurements ...................................................... 52
5.5.2 Sampling Protocol for Data in the Microgrid Control System (MCS) ................... 53
5.6 Sampling Results ............................................................................................................ 54
6.0 Performance Assessment ....................................................................................................... 64
6.1 Reduce Facility Energy Usage ....................................................................................... 64
6.2 Reduce Fuel Usage And Ghg Emissions Of Backup Generators During Grid
Independent Operations ............................................................................................................ 64
6.3 Increase power availability during grid independent operations ................................... 65

ESTCP Final Report:
EW 201140 iii April 2014
6.4 Energy Surety ................................................................................................................. 65
6.5 System Economics ......................................................................................................... 65
6.6 Power Quality Assessment ............................................................................................. 65
6.7 Reduction of Transient Power Flow Caused by Renewable Energy ............................. 66
6.8 Power Factor Improvement ............................................................................................ 66
6.9 Electricity Arbitrage ....................................................................................................... 67
6.10 Impact of PV and Resulting Power Factor ................................................................. 67
7.0 Cost Assessment .................................................................................................................... 68
7.1 Cost Model ..................................................................................................................... 68
7.2 Cost Drivers.................................................................................................................... 68
7.2.1 Electric Utility Costs ............................................................................................... 69
7.2.2 Generator Costs ....................................................................................................... 70
7.2.3 Solar PV Costs ........................................................................................................ 70
7.2.4 Energy Storage Costs .............................................................................................. 70
7.2.5 Switchgear Costs ..................................................................................................... 70
7.2.6 Monitoring and Control Costs ................................................................................ 71
7.3 Cost Analysis And Comparison ..................................................................................... 71
8.0 Implementation Issues ........................................................................................................... 75
9.0 References ............................................................................................................................. 76
Appendix A Points of Contact ................................................................................................... 78
Appendix B Action Items and Lockheed Martin Responses .................................................. 81

ESTCP Final Report:
EW 201140 iv April 2014
List of Acronyms
Acronym Definition
AESIS Army Energy Security Implementation Strategy
AFCESA Air Force Civil Engineering Support Agency
AFRL Air Force Research Laboratory
AMI Advanced Metering Infrastructure
A Ampere
Ah Ampere-hour
ATS Automatic Transfer Switch
BCT Brigade Combat Team
BEAR Basic Expeditionary Airfield Resources
BLCC Building Life Cycle Cost
C4ISR Command, Control, Communications, Computers, Intelligence, Surveillance,
and Reconnaissance
CBI Common Bus Interface
CERDEC Communications Electronics Research Development and Engineering Center
CERL Construction Engineering Research Laboratory
CHP Combined Heat and Power
CMMI Capability Maturity Model Integrated
CMTP Contractor Master Test Plan
CNIC Commander of the Navy Installations Command
CO2 Carbon Dioxide
CONUS Continental United States
COR Contracting Officer Representative
CSV Comma Separated Value
DCS Distributed Control System
D/R Demand/Response
DER Distributed Energy Resources
DoD Department of Defense
DoE Department of Energy
DPW Directorate of Public Works
ECIP Energy Conservation Investment Program
EISA Energy Independence and Security Act
EPDF Enlisted Personnel Dining Facility
ESM Energy Surety Microgrid

ESTCP Final Report:
EW 201140 v April 2014
Acronym Definition
ESPC Energy Savings Performance Contract
ESTCP Environmental Security Technology Certification Program
EV Electric Vehicle
FEMP Federal Energy Management Program
FMEA Failure Modes and Effects Analysis
FPGA Field Programmable Gate Array
Genset generation set or generator set
GFE Government Furnished Equipment
GHG Greenhouse Gas
HI Power Hybrid Intelligent Power
HMI Human Machine Interface
HWIL Hardware in the Loop
HVAC Heating Ventilation and Air Conditioning
IDIQ Indefinite Delivery, Indefinite Quantity
IEEE Institute of Electrical and Electronic Engineers
IID Island Interconnection Device
IMCOM US Army Installation Management Command
IP Internet Protocol
IRAD Independent Research and Development
ISO International Organization for Standardization
ISBPS Integrated Smart BEAR Power System
JCTD Joint Capability Technology Demonstration
kW Kilowatt
LAN Local Area Network
MFC Missiles and Fire Control
MDC Microgrid Development Center
MDMS Meter Data Management System
MILCON Military Construction
MIT Massachusetts Institute of Technology
MOSFET Metal Oxide Semiconductor Field Effect Transistor
MOU Memorandum of Understanding
MW Megawatt
NAVFAC Naval Facilities Engineering Command
NEMA National Electrical Manufacturers Association
O&M Operations and Maintenance

ESTCP Final Report:
EW 201140 vi April 2014
Acronym Definition
ODBC Open Database Connectivity
OPC Open Platform Communications
PCC Point of Common Coupling
PDRR Pre-Deployment Readiness Review
PLC Programmable Logic Controller
PF Power Factor
PO Performance Objectives
PPA Power Purchase Agreements
PV Photovoltaic
R&D Research and Development
RDSI Renewable and Distributed Systems Integration
SCADA Supervisory Control and Data Acquisition
SERDP Strategic Environmental Research and Development Program
SFMC Soldier and Family Medical Clinic
SIR Savings-to-Investment Ratio
SOP Standard Operating Procedures
SPIDERS Smart Power Infrastructure Demonstration for Energy Reliability and Security
SRM Sustainment, Restoration, and Modernization
SQL Structured Query Language
TCP Transport Control Protocol
TOC Tactical Operations Centers
TRL Technology Readiness Level
TRR Test Readiness Review
UESC Utility Energy Service Contract
UFC Unified Facilities Criteria
UMCS Utility Monitoring and Control System
UPS Uninterruptible Power Supply
USACE United States Army Corps of Engineers
V Volt(s)
VA Volt-Ampere
VAR Volt-Ampere Reactive
VARh Volt-Ampere Reactive - hours
W Watts
Wh Watt-hours

ESTCP Final Report:
EW 201140 vii April 2014
List of Figures Figure 2-1 Lockheed Martin’s Flexible Microgrid Architecture .................................................... 8
Figure 2-2 Microgrid Planning Tool Screenshot .......................................................................... 10
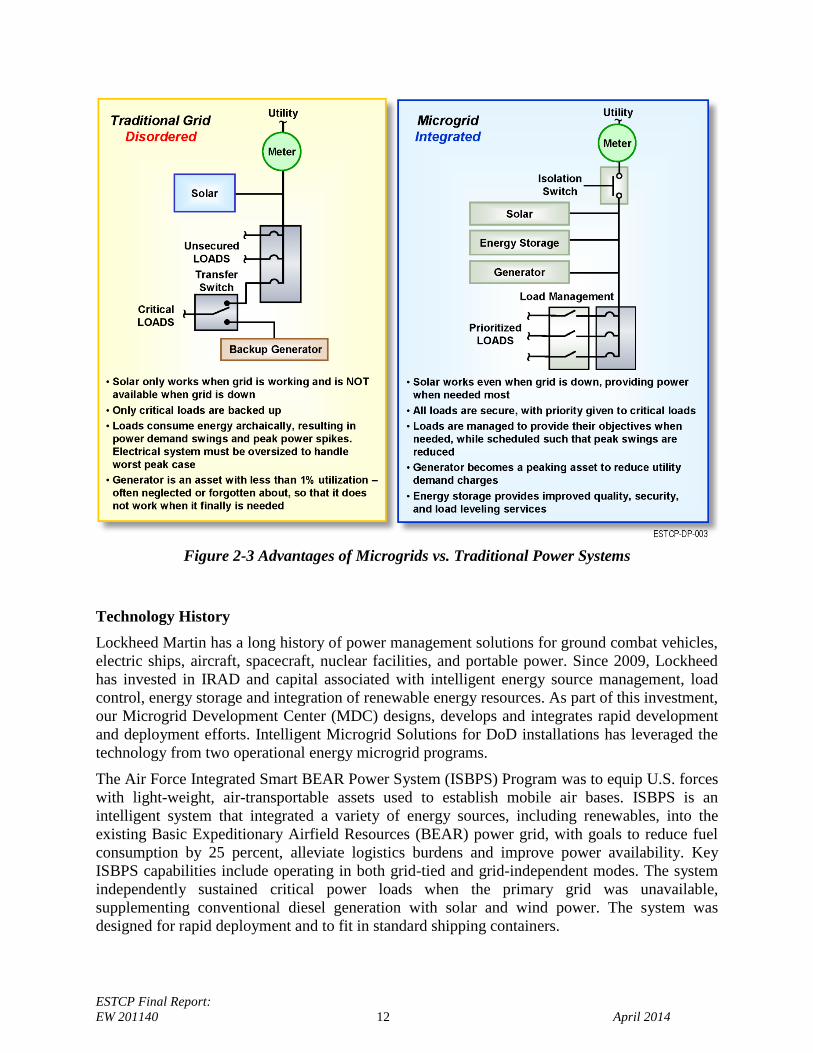
Figure 2-3 Advantages of Microgrids vs. Traditional Power Systems ......................................... 12
Figure 2-4 Typical Backup Generator Alternator Efficiency Curves ........................................... 16
Figure 2-5 Resource Optimization significantly reduces the amount of fuel required ................. 18
Figure 4-1 Location of Brigade Combat Team (BCT-1) on Fort Bliss Map ................................ 27
Figure 4-2 Location of EPDF on BCT-1 Installation Map ........................................................... 28
Figure 4-3 Fort Bliss DPW Chain of Command in the U.S. Army .............................................. 29
Figure 5-1 Facility Distribution Transformer Disconnection Switch ........................................... 33
Figure 5-2 Data Loggers and Power Meters used for Baseline Measurements ............................ 36
Figure 5-3 T-MAG-SCT-200 and T-MAG-SCT-600 AC Current Sensors.................................. 36
Figure 5-4 System Block Diagram ............................................................................................... 37
Figure 5-5 EPDF Floor Plan with Microgrid Components Labeled ............................................. 38
Figure 5-6 MCS Rack ................................................................................................................... 38
Figure 5-7 MCS Human Machine Interface Screenshot ............................................................... 39
Figure 5-8 Three Energy Storage Containers at the EPDF ........................................................... 40
Figure 5-9 Absolyte GP Battery Cycle Life vs. Depth of Discharge ............................................ 40
Figure 5-10 Existing Backup Generator and Automatic Transfer Switch .................................... 41
Figure 5-11 New Woodward easYgen Controller ........................................................................ 42
Figure 5-12 Generator Test Load Bank ........................................................................................ 42
Figure 5-13 Existing Transformer and New Switchgear .............................................................. 43
Figure 5-14 SEL-700G0+ Protective Relay .................................................................................. 44
Figure 5-15 National Instruments cRIO-9024 .............................................................................. 44
Figure 5-16 Load Breakers in Main Switchboard prior to Motor Operators Installation ............. 45
Figure 5-17 Motor Operator.......................................................................................................... 46
Figure 5-18 PVPowered PVP100kW-480 Inverter....................................................................... 47
Figure 5-19 Kyocera KD210GX-LPU Solar Panel Modules ....................................................... 47
Figure 5-20 FieldServer LonWorks Gateway FS-B2011 ............................................................. 48
Figure 5-21 1st UMCS page for EPDF Microgrid........................................................................ 49
Figure 5-22 2nd UMCS page for EPDF Microgrid ...................................................................... 49
Figure 5-23 EPDF Microgrid Control Network............................................................................ 50

ESTCP Final Report:
EW 201140 viii April 2014
Figure 5-24 National Instruments MAX Screenshot .................................................................... 54
Figure 5-25 Peak Shaving Example .............................................................................................. 55
Figure 5-26 Peak Shaving During Summer Months ..................................................................... 56
Figure 5-27 Grid State Transition Examples ................................................................................ 57
Figure 5-28 System Bus Voltage and Frequency ......................................................................... 57
Figure 5-29 Facility Import Power ............................................................................................... 58
Figure 5-30 Power Factor ............................................................................................................. 58
Figure 5-31 Baseline Measurements of Power Factor at EPDF ................................................... 58
Figure 5-32 High Speed Waveform Capture During Utility Interruption Event .......................... 59
Figure 5-33 Renewable Smoothing During Daylight Hours ........................................................ 60
Figure 5-34 Power Factor Improvement for a Sample Period ...................................................... 61
Figure 5-35 Electricity Arbitrage for a Sample Week .................................................................. 62
Figure 5-36 Electricity Arbitrage for a Sample Day ..................................................................... 63
Figure 7-1 Load profile of a Ft Bliss BCT complex over a year (Zhivov, 2010) ......................... 71
Figure 7-2 Duration at a given Ft Bliss BCT load annually ......................................................... 72
Figure 7-3 Daily Duration at or above a given Ft Bliss BCT load ............................................... 73
Figure 7-4 Power Factor impact on the Demand Charge for Ft. Bliss monthly electric bill ........ 74

ESTCP Final Report:
EW 201140 ix April 2014
List of Tables Table 2-1 Typical EPDF Microgrid Energy Source and Load Composition.................................. 9
Table 2-2 Measured EPDF Load Data ............................................................................................ 9
Table 4-1 Key Site Leaders at Fort Bliss ...................................................................................... 30
Table 5-1 Fort Bliss EPDF Backup Circuit Sample Data ............................................................ 53
Table 5-2 Daily Energy Arbitraged (6/2/13 to 6/8/13) ................................................................. 62
Table 7-1 Cost Model for the Intelligent Microgrid Solution....................................................... 69

ESTCP Final Report:
EW 201140 x April 2014
Acknowledgments Lockheed Martin would like to acknowledge the US Army Corps of Engineers (USACE)
Construction Engineering Research Laboratory (CERL) for their Department of Defense (DoD)
liaison support. Their research on Net Zero Clusters, specifically focusing on a Fort Bliss
Brigade Combat Team (BCT) complex as a case study, was invaluable in the cost assessment
phase of the project. The BCT complex analysis, together with actual Fort Bliss energy usage
data and the Environmental Security Technology Certification Program (ESTCP) demo’s results,
we were able to show the economic benefits of deploying microgrids at BCT complexes. Their
expertise and broad knowledge regarding DoD microgrid implementation was also important to
the success of the project. Specific thanks go to Harold Sanborn and Melanie Johnson.

ESTCP Final Report:
EW 201140 xi April 2014
Executive Summary
Microgrid Enabled Distributed Energy Solutions (MEDES) is the first DoD grid-tied microgrid
to integrate renewable resources, onsite generation, and energy storage with facility loads and the
utility distribution network. As prime contractor, Lockheed Martin designed and built the
microgrid system, intelligently integrating distributed diesel generation, solar photovoltaic (PV)
array, and grid-scale energy storage with the medium voltage utility distribution grid and facility
loads at one of the Brigade Combat Team (BCT) Complexes at Fort Bliss.
Currently the US power grid is largely centralized with a handful of large utilities handling the
majority of power production in the country. In 1996, a sagging power line in Oregon brushed
up against a tree, and then within minutes, 12 million electricity customers in eight states lost
power. Such is the vulnerability of the aging US power grid. In order to remedy this systemic
risk from large scale blackouts a new more decentralized system can be used in which a cluster
of onsite power generation devices/assets can service local loads in the event of power loss from
the Utility. A microgrid is a localized set of generation, energy storage, and loads that normally
operate connected to a traditional utility grid. There is a single point of common coupling with
the utility grid that can be disconnected if the microgrid needs to be able to operate without
utility power in the event of utility failure.
The primary benefit of a microgrid is energy surety/resiliency/mission sustainment.
However there can be advantages in found in energy cost savings depending on one’s electric
rate structure. The Energy Manager needs to fully understand their electric provider’s rate
structure and the load profile of their facilities in order to effectively design a microgrid to help
in energy costs. For instance, if some utilities have time of use rates it may be beneficial to use
energy during non-peak hours for storage and use that stored energy during peak hours. If your
facility is arbitraging daily it’s also important to know about your battery storage’s depth of
discharge vs. cycle life.
OBJECTIVES OF THE DEMONSTRATION
The technical objective of the Lockheed Martin’s MEDES project was to demonstrate 1) reduced
greenhouse gas emissions, 2) lower capital expenditure, 3) lower operating costs, and 4)
enhanced energy security via a microgrid consisting of distributed energy resources and load
management capabilities. The technology demonstration took place at Fort Bliss, Texas.
The cost elements of the microgrid captured during the demonstration were put into a Building
Life Cycle Cost analysis tool using the methods in NIST Handbook 135 (1,2)
. The system
economics performance objective was to demonstrate the economic advantages of having a
Microgrid versus a conventional system configuration. The Savings-to-Investment Ratio (SIR),
using the Building Life Cycle Cost (BLCC) methodology was used as the performance metric
since this is the key metric by which energy projects are considered for DoD infrastructure
project funding. The success criteria of reaching a SIR greater than 1.5 when extrapolated to a
full BCT were achieved.
TECHNOLOGY DESCRIPTION
The technology utilized for the Lockheed Martin’s MEDES project included an intelligent
microgrid controls and data acquisition system with distributed diesel generation, a solar

ESTCP Final Report:
EW 201140 xii April 2014
photovoltaic (PV) array, and grid-scale energy storage integrated with the medium voltage utility
distribution grid and facility loads of the Enlisted Personnel Dining Facility (EPDF).
The Lockheed Martin microgrid controls architecture provided a flexible platform to integrate
multiple types of distributed energy resources (DER), energy storage, and load management. The
architecture is comprised of distributed controllers which locally manage each DER connected to
the common power bus. The distributed controller also manages load centers to provide
monitoring and load scheduling capability. The distributed controllers communicate with the
microgrid centralized controller which provides the overarching control and optimization of the
microgrid, including Demand/Response (D/R) algorithms, an Advanced Metering Infrastructure
(AMI), and Meter Data Management System (MDMS). The centralized controller also provides
aggregate real-time monitoring data for all DERs, load centers, fault events, and financial
performance.
The microgrid optimization functions were designed to avoid/lower energy costs and increase
energy surety with the following features: peak shaving, electricity arbitrage, power factor
improvement, renewable smoothing, integration with the existing building management system,
and the ability to near seamlessly transition between Grid Tied and Grid Independent modes
(Islanding).
DEMONSTRATION RESULTS
The project can be categorized into three phases of execution: baseline design and performance
documentation, technology implementation, and technology performance validation. The
baseline design was performed by conducting site surveys and preliminary power flow
measurements to document the baseline design. The baseline performance documentation
consisted of two tasks: 1) obtaining energy consumption data at the demonstration site by
installing power measurement instrumentation and data acquisition systems and 2) obtaining
energy consumption data of the larger installation utilizing the existing metering system and
performing load surveys. After the baseline design and performance data were captured, the
detailed design of the microgrid was developed and major components were procured. The
project design, preparation, permitting and procurement phase started after contract signing in
June 2011 and continued until April 2012. Construction was performed from December 2012 to
March 2013 with configuration and acceptance testing occurring in April 2013 and final
commissioning in May 2013. Performance measurements and verification were continued until
the project was concluded in December 2013.
In addition to showing the economic benefits of deploying microgrids at BCT complexes, the
EPDF Microgrid resulted in:
Successfully reducing peak utility demand to 261 kW which is a 14.4% reduction when
compared to the 305kW peak load observed by DPW in prior years
Successfully reducing fuel usage and Greenhouse Gas (GHG) emissions of backup
generators during grid independent operations
Successfully increased islanded load from 30-50kW to 50-80kW (a 37.5% to 40%
increase in load supported during grid independent operations)
Energy Surety - Successfully measured the ESS picking up system load within 2 cycles
of AC power interruption

ESTCP Final Report:
EW 201140 xiii April 2014
Successfully calculated a SIR of 1.51 and a payback of 8.89 years
Successful power quality assessment and Power Factor Improvement (> 0.9PF during
peak hours)
Electricity Arbitrage - Successfully demonstrated an average energy output of 21.35 kWh
per day at peak hours
IMPLEMENTATION ISSUES
Retrofitting the generators to operate within the microgrid proved to be a significant challenge.
Generators at the time of installation are either installed as a standalone backup generator or a
paralleling generator. While standalone generator controls reference system voltage and system
frequency, parallel generators utilize/manage real and reactive power as well as system voltage
and frequency. Generator grounding schemes are also different between paralleling generators
and backup generators and a hybrid grounding system suitable for both types of generator
installations was developed. Also, standalone backup generators do not have a restricted run
time but when using them to parallel with the utility, an air permit must be obtained for the unit
from the relevant authority, in this case from the Texas Commission on Environmental Quality.
The process for obtaining this permit must be started as early in the process as possible due to the
length of time required.
Retrofitting the existing electrical infrastructure was a challenge, especially with the existing
switchboard layout restricting the addition of motor operators (to allow for load shedding). The
LM team installed as many motor operators as physically possible in the existing switchboard
such that load shed capability was maximized to avoid purchasing of a completely brand new
switchboard.
There are inherent challenges in integrating multiple Distributed Energy Resources since the
electrical bus requires a master DER. While grid tied, the utility is always the bus master, but
when the microgrid islands, the bus master functionality passes first to the energy storage system
until the generator comes online. The handoff of that functionality between the energy storage
system and the generator is a high speed, time critical event. The interfaces between DERs have
to be carefully coordinated, timed, and tested thoroughly to ensure no conflicts of authority.
Although not a major issue, separate data loggers were used to collect baseline data for the BCT
feeders since the DPW Building Operations Command Center (BOCC) data collection did not
have the resolution of individual feeders in their energy measurements. As the Ft. Bliss power
distribution is upgraded, more resolution could be available in these measurements to support
future energy projects.
Regulatory hurdles associated with ‘islanding’ microgrid power architectures are being
addressed with release of the Institute of Electrical and Electronic Engineers (IEEE) 1547.4 and
1547.8 guidance (3,4,5)
. The approach will allow DoD end users to implement a proven, consistent
solution that addresses renewable energy and environmental mandate compliance, energy cost
reduction, and energy security goals.

ESTCP Final Report:
EW 201140 1 April 2014
1.0 INTRODUCTION
Lockheed Martin Intelligent Microgrid Solutions manage on-site power generation and
consumption within a campus either interconnected with a utility grid or in a mode independent
of the utility grid in the event the utility grid is not reliable. Such technology is needed where
efficient, reliable and secure power is required, including Department of Defense (DoD)
installations.
DoD recognizes that 99% of the power provided to its Continental United States (CONUS)
operations is provided by off-site generation; which leaves critical mission functions at risk when
that power is lost. Integrating microgrids into DoD facilities can mitigate this risk; however,
acceptance will not occur until the technology is proven given that the integration of intermittent
and dispatchable generation has historically been challenging. Lockheed Martin is performing
this technical and economic demonstration of an Intelligent Microgrid Solution with the
Environmental Security Technology Certification Program (ESTCP) to enable a larger microgrid
implementation at Fort Bliss and as a model for more microgrid projects across DoD.
The project can be categorized into three phases of execution: baseline design and performance
documentation, technology implementation, and technology performance validation. The
baseline design was performed by conducting site surveys and preliminary power flow
measurements to document the baseline design. The baseline performance documentation
consisted of two tasks: 1) obtaining energy consumption data at the demonstration site by
installing power measurement instrumentation and data acquisition systems and 2) obtaining
energy consumption data of the larger installation utilizing the existing metering system and
performing load surveys. After the baseline design and performance data were captured, the
detailed design of the microgrid was developed and major components were procured. The
project design, preparation, permitting and procurement phase started after contract signing in
June 2011 and continued until April 2012. Construction was performed from December 2012 to
March 2013 with configuration and acceptance testing occurring in April 2013 and final
commissioning in May 2013. Performance measurements and verification were continued until
the project was concluded in December 2013.
This project demonstrated how an Intelligent Microgrid Solution allowed an installation to
integrate large fractions of on-site renewable energy generation, optimize operation of on-site
dispatchable generation and intelligently manage facility loads and coordinate these capabilities
to provide economic grid connected and grid independent operational capability. This was shown
using the hardware installation at Fort Bliss, El Paso, TX.
1.1 BACKGROUND
The project fits under the Strategic Environmental Research and Development Program
(SERDP) / Environmental Security Technology Certification Program (ESTCP) Microgrid
Installation Energy Initiative as described:
The current state-of-the-art power grid includes minimal renewable or clean
energy, no intelligent distribution, minimal or no energy storage, ad hoc dispatch,
uncontrolled load demands, and excessive distribution losses. Microgrids can
improve operating efficiency, enhance the use of renewables, and increase the

ESTCP Final Report:
EW 201140 2 April 2014
reliability of electric power delivery systems, making any mission-critical load
more resilient and secure.
Methods are being developed to enable DoD to better plan, analyze, and evaluate
the operational benefits and risks of deploying microgrids on its installations.
Advanced controls can optimize functions such as dispatch of distributed
generation power resources, load shedding, islanded operation, and energy
efficiency by controlling the major electrical loads. This capability would
facilitate the introduction of dynamically stable, modular, and cost-effective
energy microgrids that could seamlessly operate in grid-parallel and off-grid
modes, leading to significant reductions in DoD energy costs and carbon dioxide
output. (6)
1.1.1 Current State of Technology in DoD
There are currently no guidelines for installing microgrids on DoD facilities. DoD depends on
the local utility grid for normal operating power and has limited back up emergency generators
for critical loads that provide power for short durations. The DoD Energy Manager’s Handbook
states that “Installations should develop local risk assessments and plans” but that additional
energy security guidelines are under development.(7)
DoD installations are required to have an
energy security plan which has resulted in back-up Uninterruptible Power Supply (UPS) and
diesel generators for emergency loads under the guidelines presented in UFC 3-520-01 section 3-
8 and for C4ISR facilities under guidance such as the USACE Technical Manual series 689 to
698 (8)
.
Several DoE/DoD microgrid programs are underway for installations to be completed over the
next few years including DoE’s Renewable and Distributed Systems Integration (RDSI)
program, the Smart Power Infrastructure Demonstration for Energy Reliability and Security
(SPIDERS) Joint Capability Technology Demonstration program, and ESTCP’s Microgrid
Installation Energy Initiative. There are also relevant projects funded by Energy Savings
Performance Contracts (ESPC), Utility Energy Service Contracts (UESC), Energy Conservation
Investment Program (ECIP), and district ear marks. Massachusetts Institute of Technology
(MIT) Lincoln Laboratories has assembled a comprehensive survey of microgrid efforts within
the US military.
The Department of Defense (DoD), in an Energy Security Memorandum of Understanding
(MOU) with the Department of Energy (DoE), recognized the significant impact that microgrid
technology could have on military installations and has initiated several programs for
demonstrating such technology. At the 2011 DoE Microgrid Workshop, validated microgrid
planning tools were identified as one of the most important areas needing research and
development (9)
.
Some aspects of microgrid functionality exist in the commercial market; they exist in critical
facilities with back-up power systems, such as data centers and hospitals. However, these
facilities justify paying 2 to 3 times more for energy reliability and they do not have
sustainability objectives. Microgrid functionality also exists at petrochemical complexes
containing large on-site power generation that can interact with the grid or island from the grid to
maintain essential operations at the complex in the event of a grid failure. However, these

ESTCP Final Report:
EW 201140 3 April 2014
facilities are a niche segment where the microgrid is justified in a unique situation, and
renewable energy is typically not part of the power generation mix.
1.1.2 Technology Opportunity
Energy savings, renewable energy, and energy security objectives are often addressed
individually with energy managers having to develop projects that also comply with the vast
array of federal and local regulations, policies, and constraints. Energy efficiency upgrades and
load management programs are developed to address energy savings mandates. Separately,
renewable energy mandates are often addressed through the purchase of renewable energy
credits or installation of grid-tied renewable energy systems, often without improving energy
security. Intelligent Microgrid Solutions allow an installation’s energy team to comply with
onsite renewable energy generation mandates, optimize operation of legacy power generation,
and intelligently manage facility loads to provide energy savings as well as provide grid
independent operational capability for an installation’s mission critical facilities.
Lockheed Martin’s systems approach to microgrid design should be applicable and provide value
to the majority of DoD’s greater than 480 fixed installations. The environmental benefits
provided by intelligent microgrid solutions will be prevalent in the major military bases of the
southwest and coastal regions, with reductions of over 1 ton of CO2/yr. for every kWh of onsite
renewable energy generation. The energy savings, energy security, reliability, and power quality
improvements provided by intelligent microgrid solutions will be prevalent at critical military
bases and those that are located on the congested power grid in the northeast of the continental
US.
With the Enlisted Personnel Dining Facility (EPDF) Microgrid as an example implementation of
an intelligent microgrid, return on investment and payback time can be estimated. In comparison
with current approaches to reduce carbon emissions and energy costs by implementing
renewable energy solutions, the intelligent microgrid solution provides improved integration of
the renewable energy sources with the local power grid, maximizing the fuel-reducing benefit
while minimizing the power quality problems inherent with many intermittent renewable
resources. The inherent intermittency and resulting power quality issues of renewable power
sources at high penetration levels can often affect energy costs. As an example, the wind turbines
recently installed at US Naval Base Guantanamo Bay, an installation that maintains its own
power grid fed with large diesel generators, now requires significant percentages of spinning
reserve, >20%, to counteract the intermittency and power quality impact of the wind turbines,
reducing or eliminating the positive impact the renewable energy source could have had on
greenhouse gas emissions or energy costs. With an intelligent microgrid solution using Lockheed
Martin’s microgrid planning tools, a microgrid can be designed and installed that provides the
appropriate controls and hardware necessary to eliminate the need for increased spinning reserve,
reducing fuel use to realize the benefit of the renewable energy.
1.2 OBJECTIVE OF THE DEMONSTRATION
The technical objective of the effort was to demonstrate 1) reduced greenhouse gas emissions, 2)
lower capital expenditure, 3) lower operating costs, and 4) enhanced energy security via a

ESTCP Final Report:
EW 201140 4 April 2014
microgrid consisting of distributed energy resources and load management capabilities. The
technology demonstration took place at Fort Bliss, Texas.
The microgrid demonstration and technology performance validation occurs on a subset of a
larger installation demonstrating the key operational performance, costs and benefits of the
microgrid using the same control software and hardware that would be implemented in a multi-
megawatt scale microgrid. The components of a microgrid, including renewable energy,
dispatchable generation, energy storage, load shedding, and an island interconnection device
have been integrated into the Enlisted Personnel Dining Facility (EPDF) of the BCT-1 complex.
The data obtained from the Dining Facility microgrid and base wide energy measurements
during this demonstration program have been used to design a comprehensive microgrid solution
sized for a BCT complex circuit.
While implementing microgrid solutions, the size of a BCT is effective for implementation
across DoD. The ESTCP demonstration of the microgrid solution on a smaller BCT portion cost
effectively provides the quantitative evidence of the benefits of our intelligent microgrid
solution. To the facility and higher level installation management organizations, the
demonstration provides quantitative evidence of the microgrid’s ability to reduce energy costs
and optimize the use of Distributed Energy Resources (DERs). To the end user, the
demonstration instills confidence in the technology’s readiness and ability to enhance mission
effectiveness.
US Army Corps of Engineers (USACE) Construction Engineering Research Laboratory (CERL)
is shaping the microgrid guidelines and requirements for DoD installations. CERL’s microgrid
group worked with Lockheed Martin throughout the project to ensure that the results from this
demonstration will influence DoD policy, practices, guidelines, and standards.
In addition, Lockheed Martin works closely with USACE/IMCOM, NAVFAC/CNIC, and
AFRL/AFCESA to better understand their installation energy challenges and to help them
understand the technology and benefits of microgrid architecture. Since energy security and
renewable energy are unfunded initiatives, continuing efforts are underway to understand and
develop contract mechanisms combining Government Furnished Equipment (GFE), public
capital investment, and private financing at a scale that is large enough to reach economic
viability.
Intelligent microgrid solutions will transition to DoD end users through traditional means
including appropriated funds, as part of MILCON, ECIP, or SRM projects, and leveraging third
party financing arrangements when appropriate, such as power purchase agreements (PPAs) or
energy savings performance contracts (ESPCs). Lockheed Martin is one of 16 companies
awarded in late 2008 a 10-year, $5B limit Indefinite Delivery Indefinite Quantity (IDIQ) under
Department of Energy’s (DOE’s) Federal Energy Management Program (FEMP) super ESPC
program. This technology transfers to all military service fixed installations as well as tactical
facilities such as forward operating bases and mobile airbases. The EPDF Microgrid is a good
example of how the technology could be transitioned to a well-defined fixed installation
customer in a standardized fashion. The modern BCT takes advantage of MILCON
transformation and the establishment of Centers of Standardization within the US Army Corps of
Engineers to reduce the non-recurring design effort required during new construction by offering
standardized, nearly complete designs of key facilities that can be adapted quickly and
confidently for a specific sites needs while taking advantage of the latest technology

ESTCP Final Report:
EW 201140 5 April 2014
improvements. Through this ESTCP activity and continuing activities with organizations such as
the US Army Corps of Engineers Construction Engineering Research Laboratory (CERL),
Lockheed Martin can support the establishment of design/build or adapt/build standards and a
microgrid planning methodology within the major facility commands, such as Naval Facilities
Engineering Command (NAVFAC) and US Army Installation Management Command
(IMCOM) and organizations such as the US Army Corps of Engineers (USACE), that allows for
nearly complete power infrastructure designs to be created rapidly and consistently. This results
in less site-specific final design efforts, significantly reducing the non-recurring engineering
typically required to incorporate distributed energy assets and intelligent power management into
existing or new facilities, while enhancing safety through standardization. Regulatory hurdles
associated with ‘islanding’ microgrid power architectures are being addressed with release of the
Institute of Electrical and Electronic Engineers (IEEE) 1547.4 (3,4)
and 1547.8 (5)
guidance. The
approach will allow DoD end users to implement a proven, consistent solution that addresses
renewable energy and environmental mandate compliance, energy cost reduction, and energy
security goals.
In addition to benefitting DoD installations, Intelligent Microgrid Solutions installed over the
next decade will create jobs and support further economic growth. Hundreds of US companies
have invested in developing the technology to improve the way we generate and distribute
electrical power. Because of the regulated nature of the electric grid, implementation of these
technologies requires support from the Federal government. The last century of US history
shows that national investment in the electric grid resulted in economic development.
Intelligent Microgrid Solutions will also facilitate wide spread adoption of electric vehicles
(EVs) charged with electricity from renewable sources. Being that oil imports represented 50%
of the trade deficit in 2010 (6,10)
and that number will increase with increasing oil prices, EVs
using renewable energy are one of the most significant opportunities to reduce our nation’s trade
deficit. The challenges associated with large numbers of electric vehicles on the utility grid and
solutions that Intelligent Microgrid Solutions could offer are not included in the scope of this
ESTCP project, yet should be considered for future evaluation.
1.3 REGULATORY DRIVERS
DoD energy mandates relevant to microgrids include both renewable energy and energy security
mandates. Renewable energy mandates include Section 203 of the Energy Policy Act of 2005
(EPAct05), Executive Order 13423, National Defense Authorization Acts of 2007 & 2010,
Executive Order 13514, and the Energy Independence & Security Act of 2007 (EISA)
(11,12,13,14,15,16). The combination of these mandates drives renewable energy penetration at DoD
installations to levels greater than 20%, which can require a microgrid to provide the reliable,
secure integration of those intermit-tent renewable sources. Energy security mandates and
objectives come from both congressional and DoD service branch sources. A DoD service
branch example is the combination of documents that make up the Army energy security
execution strategy. These include the Installation Management Campaign Plan, and the Army
Energy Security Implementation Strategy (AESIS) 2009 (17,18)
. The Installation Management
Campaign Plan captures each of these strategies in the following statement:
“We will address installation dependency on the national grid for electric
power at a time when these systems capacities are being taxed and

ESTCP Final Report:
EW 201140 6 April 2014
vulnerabilities are better understood. To meet these and other challenges,
we will effectively execute programs that recognize energy as a key
mission enabler and address the priorities outlined in the Army Energy
Security Implementation Strategy, the Army Sustainability Campaign Plan
and other Army guidance and Federal mandates. The Installation
Management Energy Portfolio provides authority, resource tools, example
projects, and actions available to installations in order to improve our
energy security posture.” (17)

ESTCP Final Report:
EW 201140 7 April 2014
2.0 TECHNOLOGY DESCRIPTION
This project will demonstrate that operating existing energy assets as a microgrid is more cost
effective, cleaner, and more secure than traditional operations.
2.1 TECHNOLOGY OVERVIEW
The technology utilized for the Lockheed Martin’s MEDES project included an intelligent
microgrid controls and data acquisition system with distributed diesel generation, a solar
photovoltaic (PV) array, and grid-scale energy storage integrated with the medium voltage utility
distribution grid and facility loads of the Enlisted Personnel Dining Facility (EPDF).
The microgrid optimization functions were designed to avoid/lower energy costs and increase
energy surety with the following features: peak shaving, electricity arbitrage, power factor
improvement, renewable smoothing, integration with the existing building management system,
and the ability to near seamlessly transition between Grid Tied and Grid Independent modes
(Islanding).
The novel solution that was demonstrated includes three components:
1) Microgrid Planning Tools. These tools allow power engineers to design a microgrid,
determining the optimal arrangement and control of the distributed energy assets, loads,
switchgear, and fault protection based on cost, emissions, and security.
2) Microgrid Controls and Data Acquisition. The control system architecture has a bi-level
arrangement. Fast-acting distributed controllers at each piece of equipment react automatically to
ensure power delivery, quality, and safety. The higher-level Microgrid Control System (MCS)
maintains a historical database, houses the optimization algorithms, and provides a user interface
for data analysis and operator control. Figure 5-4 shows all the major components that were
installed to implement this bi-level control arrangement.
3) Microgrid Optimization Algorithms. The optimization algorithms calculate the optimum set
points to operate each connected device to achieve lower energy costs and improve stability of
the system. The algorithms run autonomously and in parallel; their status is reported back to the
facility's energy operator. If required the algorithms can be disabled (e.g. for equipment
maintenance). Further details regarding the specific goals of these algorithms are explained in
Section 2.2.
Successful integration of intermittent and renewable Distributed Energy Resources (DERs) at
penetration levels mandated by government will require transitioning emerging power
conversion and control technologies to commercial applications. Our microgrid architecture
addresses these challenges and our Microgrid Development Center (MDC) provides the
resources to validate and test these technologies.
Microgrid Architecture
Figure 2-1 shows how the Lockheed Martin microgrid architecture provides a flexible platform
to integrate multiple types of DERs, energy storage, and load management. The architecture is
comprised of distributed controllers which locally manage each DER connected to the common

ESTCP Final Report:
EW 201140 8 April 2014
power bus. The distributed controller also manages load centers to provide monitoring and load
scheduling capability. The distributed controllers communicate with the microgrid centralized
controller which provides the overarching control and optimization of the microgrid, including
Demand/Response (D/R) algorithms, an Advanced Metering Infrastructure (AMI), and Meter
Data Management System (MDMS).
Figure 2-1 Lockheed Martin’s Flexible Microgrid Architecture
The centralized controller also provides aggregate real-time monitoring data for all DERs, load
centers, fault events, and financial performance. The data shown in Table 2-1 is based off 2010
energy usage data given to Lockheed Martin by Fort Bliss Directorate of Public Works (DPW).
Some estimates were extrapolated from that data based on site visits and discussions with Fort
Bliss, including breakout power of Sources and Loads. Lockheed Martin received data solely for
the EPDF (Table 2-2) from the Fort Bliss DPW. The information includes energy consumption
data for the EPDF BCT-1 from 2/7/2011 to 9/21/2011. The peak kW value was measured
directly and is expected to be the actual yearly peak, as the missing months average much lower
peaks than the summer months when this peak was captured. The average kW value was
averaged over the given time period from the 15-minute kW demand data. It is expected that the
actual yearly average demand is slightly less than this value due to the missing information from
the (typically less energy-intensive) winter months. The yearly energy consumption was
calculated based on the average instantaneous value and so the actual yearly energy consumption
value is most likely slightly less for the same reason as the average kW value. As part of the
MEDES effort, power data for the EPDF was collected from October 2011 to December 2013.

ESTCP Final Report:
EW 201140 9 April 2014
Table 2-1 Typical EPDF Microgrid Energy Source and Load Composition
Table 2-2 Measured EPDF Load Data
Microgrid Planning Tools
The Microgrid Planning Tool Suite (Figure 2-2) provides comprehensive capabilities to analyze
and recommend microgrid solutions for a specific facility. By taking into account site-specific
mission, facility, electrical, and renewable characterization data, the tools objectively quantify
anticipated microgrid benefits. Inputs include existing generation and fuel storage, power
consumption patterns, and existing electrical distribution feeder and connections between the
critical facilities. The tools use this information to evaluate whether additional generation and
distribution hardware is needed, identify specific opportunities for incorporating fuel-saving
renewable technologies, and perform optimization and power flow analyses. The planning tools
generate a solution set of feasible microgrid architectures that meet energy surety, financial, and
performance constraints as defined by the customer’s needs.

ESTCP Final Report:
EW 201140 10 April 2014
Figure 2-2 Microgrid Planning Tool Screenshot
Microgrid Components
Microgrid Centralized Controller and Optimization Algorithms. This offering includes
optimization algorithms to efficiently and effectively operate and schedule the Microgrid’s
sources and loads to deliver a reliable system that can minimize operational cost. Housed in the
microgrid centralized controller, algorithms perform power flow analysis, short term
optimization, and long-term forecasted planning. The power flow analysis ensures electrical
stability of the microgrid under various source configurations. The short-term optimization offers
a means to optimize for surety or cost efficiency given the current load conditions and available
sources. The long-term optimization algorithms can accommodate daily and monthly
information to take into account weather conditions, upcoming events which significantly change
the characteristic load profile, and also maintenance schedules to determine the best means to
plan the microgrid sources and loads. The microgrid centralized controller also coordinates load
scheduling, use of renewables or energy storage during peak grid hours, and advance startup of
generators for predicted load increases. The controller solution suite can be tailored to meet a
variety of customer needs and microgrid requirements to provide cost effective operation while
enhancing system performance.
Distributed Controllers. The distributed controller provides high-speed control functions for
equipment protection against faults, high-speed relay coordination for synchronization and fault
coordination, and high frequency data acquisition to capture off-nominal events. The distributed
controller’s hardware platform is designed for modularity and flexibility, with systems deployed
in thousands of locations worldwide. Customization of this platform with innovative embedded
logic has enabled comprehensive integration for DER and load management in microgrid
applications, as evidenced by their use in our MDC. Although the distributed controllers perform

ESTCP Final Report:
EW 201140 11 April 2014
optimally in a microgrid guided by a centralized controller, they are designed to operate
autonomously in the event that communication with the centralized controller is lost.
Dispatchable Generators provide either base load power or back-up power. Base power if
feasible in situations where combined heat and power (CHP) can be utilized, or where there are
incentives for distributed equipment, or where there is a local fuel source. Back-up generation is
required where there are emergency and critical loads. Dispatchable generators provide swing
power to follow instantaneous load demand when the microgrid is islanded. They can also
perform peak-shaving or demand response functions while paralleled to the utility to create a
potential revenue (savings) stream. In the Intelligent Microgrid Solution, several generators
within the microgrid can synchronize for parallel operation. This improves reliability and
redundancy.
Renewable Energy (wind and solar) provides environmentally clean energy with low
operational cost (no fossil fuel cost) and no need for logistics support. However, renewable
energy is intermittent and requires fast acting spinning reserves or energy storage to provide
transient buffering, otherwise, its contribution must remain well below the minimum power
demand.
Energy Storage can provide several functions in a microgrid. It provides a means to smooth
rapid transients caused by either loads or renewable energy. It can provide grid stability
functions to improve power quality, filter harmonics, and support grid voltage. It can perform
peak shaving and demand response functions. It can also perform supply shifting, to match
renewable energy availability with load demand. It can also perform supply shifting to take
advantage of time of use, or on-peak scheduling where it charges at low utility prices and
discharges at high prices.
A microgrid with a Point of Common Coupling (PCC) to the utility grid provides the ability to
supply peak shaving power through the PCC. The microgrid also enables the ability to isolate
from the utility grid (island) providing secure power to mission critical loads, and utilize
renewable energy within the microgrid while islanded to reduce fuel consumption of the
combustion-driven power generation sources.
Comparison with Existing Technology
Intelligent Microgrid Solutions differ from traditional back-up power by including Smart Grid
communications, renewable energy, multiple disparate generators, utility market interaction and
optimization algorithms such that their services become economically attractive to an expanded
electric consumer market (Figure 2-3). Microgrids provide an architecture and process for
integrating energy systems including: Advanced Metering, Building Environmental Controls,
Facility Distribution Circuit Controls, and Utility Demand Response programs. The energy
savings realized through optimization of the entire energy system often justifies the cost of
adding Microgrid integration and control.
ESTCP Final Report:
EW 201140 12 April 2014
Figure 2-3 Advantages of Microgrids vs. Traditional Power Systems
Technology History
Lockheed Martin has a long history of power management solutions for ground combat vehicles,
electric ships, aircraft, spacecraft, nuclear facilities, and portable power. Since 2009, Lockheed
has invested in IRAD and capital associated with intelligent energy source management, load
control, energy storage and integration of renewable energy resources. As part of this investment,
our Microgrid Development Center (MDC) designs, develops and integrates rapid development
and deployment efforts. Intelligent Microgrid Solutions for DoD installations has leveraged the
technology from two operational energy microgrid programs.
The Air Force Integrated Smart BEAR Power System (ISBPS) Program was to equip U.S. forces
with light-weight, air-transportable assets used to establish mobile air bases. ISBPS is an
intelligent system that integrated a variety of energy sources, including renewables, into the
existing Basic Expeditionary Airfield Resources (BEAR) power grid, with goals to reduce fuel
consumption by 25 percent, alleviate logistics burdens and improve power availability. Key
ISBPS capabilities include operating in both grid-tied and grid-independent modes. The system
independently sustained critical power loads when the primary grid was unavailable,
supplementing conventional diesel generation with solar and wind power. The system was
designed for rapid deployment and to fit in standard shipping containers.

ESTCP Final Report:
EW 201140 13 April 2014
For the U.S. Army Communications, Electronics, Research, Development and Engineering
Center (CERDEC) HI Power program, Lockheed Martin provided design, development, and
integration of a Brigade Combat Team microgrid comprised of a Common Bus Interface (CBI),
centralized controller, energy storage, and generator mod kits. This demonstration project
leveraged algorithms and controls developed for the HI Power programs that enabled optimal use
of multiple energy resources including energy storage.
Potential for DoD
Lockheed Martin’s Intelligent Microgrid Solution provides a foundation on which DoD’s
continued investments in renewable energy will result in reduced energy costs and reduced
carbon emissions while simultaneously providing a secure, reliable, mission-extending
capability. Without the intelligent power management inherent in our microgrid solution, the
increased use of renewable energy resources often results in lower reliability, higher cost energy
threatening mission readiness and effectiveness and suboptimal carbon reductions. In the site
specific example of the EPDF Microgrid, the microgrid control of the BCT’s electrical loads
may reduce peak power levels through load scheduling lowering utility demand charges. A solar
array with even small amounts of energy storage interconnected to the EPDF Microgrid can
provide power during the peak demand of heating ventilation and air conditioning (HVAC) loads
which further reduces peak demand charges as well as carbon emissions, and also reduces fuel
use by back-up generators, when the power grid is unavailable, extending mission operational
capability. With microgrid control, the BCT’s emergency power assets can reduce energy costs,
rather than sitting dormant, by operating during periods when electricity rates are higher than the
cost of gas that fuels those emergency assets offsetting the capital expenditure. And when
combined heating, cooling, and power is utilized, and/or biomass fuels where available, carbon
emissions reductions are further increased. With the addition of energy storage in areas where
there is significant differences in time-of-use or peak electricity charges, further reductions in
energy costs can be realized when using the microgrid’s central control algorithms.
The impact microgrids could make on achieving DoD goals is significant. If only 30% of the
electrical distribution feeders on the 250 DoD installations with larger than 5 MW average loads
are outfitted with microgrids there would be 172 feeder sized (<10 MW) microgrid systems.
2.2 TECHNOLOGY DEVELOPMENT
This project focused on leveraging existing Lockheed Martin software, COTS software and
commercially available hardware to build an affordable microgrid which implements a number
of microgrid optimization functions designed to avoid/lower energy costs and increase energy
surety. The primary item that was modified and developed was the control software in the MCS
and the Programmable Logic Controller (PLC) used to implement the following features: peak
shaving, electricity arbitrage, power factor improvement, renewable smoothing, integration with
the existing building management system, and the ability to near seamlessly transition between
Grid Tied and Grid Independent modes. There are two primary modes of steady state operation
Grid Tied Mode and Grid Independent Mode (Island).

ESTCP Final Report:
EW 201140 14 April 2014
2.2.1 Grid Tied Microgrid Functions
Grid tied mode is the normal mode of operation for the system; that is, operating with utility
power. In this mode, the PCC/ protective relay is closed, thus connecting the microgrid to the
utility grid. In addition, all of the load breakers in the system are closed. In the preliminary
design assessment, automatic load shedding/management was not seen as desirable or beneficial
and has not been included in this mode. If load shedding is desired, an operator can manually
shut off one or more feeder breakers from the MCS HMI. It should be noted that in this mode the
solar PV system is also completely uncurtailed allowing for maximum production of solar power
to be used by the EPDF or the distribution grid.
2.2.1.1 Peak Shaving
With modifications to the controls, the generator can now be paralleled to the utility to provide
power to the microgrid’s electrical bus. The MCS commands the generator to start and output
power as needed to implement a peak shaving algorithm. The algorithm is a feedback loop that
monitors the amount of power being imported from the utility and commands the generator to
provide real power onto the bus in order to lower utility demand. This algorithm increases the
generator output if utility demand is too high and decreases output when utility demand is too
low. In Figure 5-25, the generator is being turned on in response to an increased load demand
and the MCS adjusts the generator’s power output until it eventually turns the generator off due
to a low load demand. From the figure, note that there is a 30 second delay before the generator
turns on in response to the rapid additional load of 33 second duration. The algorithm is
configurable and was set to keep utility demand below 250 kW in this project. That threshold can
be lowered further, but that software limits generator usage to 300 hours per year to comply with
Environmental Protection Agency (EPA) regulations.
2.2.1.2 Power Factor Improvement
Apparent power (volt-amperes) is the vector sum of real power (watts) and reactive power (volt-
ampere reactive). Power Factor is the ratio of real power to the apparent power of the circuit.
Power factors below 1.0 require the utility to generate more volt-amperes to supply the rated real
power, which increases generation and transmission costs. Many utilities, such as the one that
supplies power to Fort Bliss, apply a penalty/fee into their electricity rate structures for
customers that have a poor power factor. As can be seen in Figure 5-31, power factor at the
EPDF is quite poor around roughly noontime each day. This is most likely due to the fact that the
PV Inverter only supplies real power to the EPDF’s loads requiring the utility to provide the
reactive power component for the loads thus lowering the Power Factor rating at the PCC.
The Energy Storage System (ESS) can be used for power factor/quality improvements for the
microgrid. A feedback loop is used to monitor the PCC’s power factor and command the ESS to
output reactive power as needed to ensure that the power factor stays above 0.9, thus avoiding
the utility’s fees. In Figure 5-34, one can see how the ESS’s reactive output changes in response
to the changing power factor.

ESTCP Final Report:
EW 201140 15 April 2014
2.2.1.3 Electricity Arbitrage
In general, electrical power is considerably cheaper in the middle of the night than during peak
demand during the day. This is also the case at Fort Bliss, where their service rate schedule states
that the on-peak period shall be between 12:00 P.M through 6:00 PM for the months of June
through September at a cost of $0.14335 per kWh. The off-peak period, all other hours not
covered in the on-peak period, costs $0.00527 per kWh. This is according to the “El Paso
Electric Company Schedule No. 31 Military Reservation Service Rate” (19)
. That is a substantial
$0.13808 per kWh difference. By performing electricity arbitrage, the microgrid will take
advantage of this rate structure. As can be seen in Figure 5-35, this algorithm is a daily schedule
that charges the ESS (a.k.a., buys energy) at night when prices are cheap and discharges (a.k.a.,
sells/uses stored energy) when it is expensive at peak hours.
2.2.1.4 Renewable Energy Smoothing
Solar PV and wind power systems are inherently intermittent; solar PV systems can drop by 60%
within seconds due to a cloud passing over the array. One of the ways to manage the
intermittency of solar power production is to use short-term energy storage systems to offset the
sudden loss of power. The renewable energy smoothing algorithm is a high speed algorithm
implemented in a real-time Programmable Logic Controller (see Figure 5-15), that monitors the
PV inverter’s AC power output and reacts to sudden drops in production with increased output
from the ESS. This can be observed in Figure 5-32.
2.2.2 Grid Independent Functions
In Grid Independent mode there is no utility power and the main circuit breaker for the building
is opened to island the microgrid. During this mode the generator, solar PV system, and the ESS
are providing all the power for the loads. Originally it was planned that the MCS would manage
the loads of the EPDF in grid independent mode, unfortunately that was no longer possible when
some of the automation equipment (see Figure 5-17) were unable to be fitted in the existing main
switchboard. Thus the critical load and the uncontrollable loads are powered on the bus when the
system is islanded, since the controllable loads were shed right by the PLC during the transition
from Grid Tied mode to Grid Independent mode. Although load management was not performed
to the extent originally planned, the MCS does manage the PV Inverter and correct for poor
power factor using the ESS.
2.2.2.1 PV Management
Unlike Grid Tied mode operations, when in Grid Independent mode (a.k.a., Islanded mode) the
generator is the bus master and regulates the frequency and voltage of the microgrid bus. When
the PV inverter is enabled in an islanded microgrid, it can possibly back feed power into the
generator if it’s a particularly sunny day or if the load on the microgrid is very small (or both).
When power is back fed into the generator, then the generator’s protection equipment trips off.
Turning off protects the generator from damage and prevents the bus from destabilizing since the
bus frequency and voltage are not being regulated.

ESTCP Final Report:
EW 201140 16 April 2014
To remedy this situation the MCS actively curtails the PV output to ensure it does not back feed
the generator and risk a microgrid blackout. Instead of turning the PV off or curtailing it to a
very small static amount the MCS uses a feedback loop that monitors the amount of load on the
generator and adjusts the PV curtailment set-point to ensure that the generator is carrying some
of the load but not too much. As seen in Figure 5-27, this in effect is aimed to maximize PV
usage in islanded scenarios.
2.2.2.2 Power Factor Improvement
Similar to Power Factor Improvement during Grid Tied mode, in Grid Independent mode the
MCS will adjust the reactive power output of the ESS. Unlike in Grid Tied mode the MCS aims
to improve the power factor at the generator’s circuit breaker instead of the PCC. The main
reason why one would want to optimize the Power Factor at the generator’s connection to the
bus is to improve engine efficiency which ultimately reduces diesel fuel use.
Figure 2-4 Typical Backup Generator Alternator Efficiency Curves
As can be seen in Figure 2-4 the efficiency of a generator is a function of both the amount of
load on the generator (the Per Unit kVA represents the ratio of load demand to the generator’s
nameplate rating) and the load’s power factor. Some additional information about diesel
generators and the importance of power factor can be found in Cummins Power Generation’s
White Paper on “Rated power factor tests and installation acceptance of emergency and standby
power systems”.(20)

ESTCP Final Report:
EW 201140 17 April 2014
2.2.3 Always Active Functions
Some software monitoring and control functionality is always available regardless of the state of
the microgrid.
2.2.3.1 Grid State Transitioning
Because utility interruptions/outages can happened at any moment, the microgrid is always ready
to island. When a fault on the utility side of the PCC is detected by the Protective Relay it
immediately opens the breaker at the PCC to separate the microgrid from the utility grid.
Microseconds after that the PLC commands the ESS inverters to become the bus master (a.k.a.,
voltage mode) so they can regulate voltage and frequency in addition to carrying the entire load.
As can be seen in Figure 5-32, there is slight voltage sag in voltage, but that gets corrected by the
ESS within 2 electrical cycles. The PV Inverter sees the small voltage sag and turns off its power
production to be compliant with IEEE1547. The PLC also begins to open the load breakers
connected to all the low priority loads so only the critical ones are powered while islanded.
Meanwhile the MCS commands the generator to start and synchronize to the bus. Once the
generator has connected the ESS Inverters go back to current mode thus letting the generator
become the bus master. Finally, the MCS starts up its Grid Independent mode algorithms.
Eventually after seeing a stable bus for 5 minutes the PV Inverter will automatically begin power
production. This islanding event and the system’s overall transition to Grid Independent mode is
depicted in Figure 5-27.
While islanded, the MCS will continually monitor the utility side of the PCC. After it detects a
valid and nominal voltage on the utility bus for the duration of 5 minutes (again in accordance
with IEEE1547), it will command the protective relay to attempt a reconnection. When the
protective relay is told to reconnect, it adjusts the generators frequency and voltage to match the
utility’s, closes in the PCC breaker when the timing is right, and signals the generator to stop
acting as the bus master since the utility is now the bus master. Once this is complete the MCS
will resume its Grid Tied mode algorithms.
2.2.3.2 Situational Awareness of Distributed Energy Assets
A local HMI is accessible on either of the MCS Servers (see Figure 5-7). It provides information
regarding the live status of each microgrid component as well as a user interface to control them
manually. To view historical data stored by the historian, each server has a trend viewing tool
from National Instruments (see Figure 5-24). It can be used to analyze power data, plot graphs,
or export them as Comma Separated Value (CSV) files.
In additional to the local HMI at the EPDF there is a few new HMI screens (see Figure 5-21 and
Figure 5-22) created at DPW’s Building Operations Command Center (BOCC) where users can
view device telemetry as well as the status of the above mentioned software algorithms.
2.3 ADVANTAGES AND LIMITATIONS OF THE TECHNOLOGY
Energy Security has been carried out with battery UPS and back-up diesel generators on specific
critical loads. These systems are overdesigned by requirements for growth which add

ESTCP Final Report:
EW 201140 18 April 2014
unnecessary capital and maintenance cost. The back-up units are essentially a non-utilized asset
and must be tested weekly and monthly for maintenance and to verify performance. These are
wasteful exercises of fuel and personnel. These tests often go unperformed and the units prove
non-functional when needed. During operation of the back-up generators, they often run at
minimum power output in an inefficient operating region, which wastes fuel. In addition, only
loads on the critical circuits can be powered and there is no flexibility of operation.
The Intelligent Microgrid Solution utilizes back-up generation assets for utility cost saving
services and can participate in providing utility ancillary services for additional revenue. Each
MW of peak shaving potential can result in $50K to $100K cost savings per year. It also
integrates back-up generation during grid independent mode to optimize the use of back-up
generation, allows flexibility to serve dynamically selected loads, and optimizes generator
operation to save fuel. Figure 2-5 shows a typical scenario where intelligently operating
generators and incorporating renewable energy during a day of operating grid independent saved
38% of fuel and CO2 emissions.
Figure 2-5 Resource Optimization significantly reduces the amount of fuel required
Renewable Energy is being added to bases as small 10’s to 100’s of kW sizes. Recently, a few
MW size installations have been added and more recently larger systems (20+MW) are in the
works under Power Purchase Agreements (PPAs). Small and large systems do not support grid
independent operation of back-up power systems – when they are needed the most. And large
projects (20MW+) challenge utilities to maintain grid stability due to the intermittent nature of
renewable, which require large and costly spinning reserves.
Intelligent Microgrid Solutions integrate medium size renewable energy projects (1 to 5 MW)
within the facilities on roof tops or parking lots. The size is large enough to make significant
impacts and reach economies of scale, yet small enough for rapid implementation with little
environmental impact. Renewable energy systems supply power to both grid connected and grid
independent configurations with other dispatchable on-site power sources. The addition of
energy storage into the microgrid stabilizes renewable power and relieves the utility from
intermittent transients.
Implementing a microgrid today is expensive because of the lack of installation experience in the
industry and market, the lack of standards for circuit switch and protection equipment in
microgrids, and the lack of standards in control and networking devices for microgrids. In the
2011 DOE Microgrid Workshop Report (9)
, industry experts estimated the control and

ESTCP Final Report:
EW 201140 19 April 2014
networking costs for a microgrid to be $100,000 per distributed energy resource or building
automation system, with a target cost of $10,000. The working group’s goal was to achieve a 10
fold reduction in those costs through experience and standardization.
Acceptance of microgrids faces challenges from utilities and facility operations. Utilities view
customer operated microgrids as a challenge to their ability to control the grid and they view
distributed generation as a loss of their revenue stream. Facility energy operations are often split
between the mechanical/HVAC group and the electrical/distribution group. Because the skill sets
and safety hazards are different between the two groups, integrating the two trades into a single
control and network system are challenging. The solution must keep a clear dividing line
between the equipment on which each group works, with a single simple interface between the
two.

ESTCP Final Report:
EW 201140 20 April 2014
3.0 PERFORMANCE OBJECTIVES
The overall goal of the proposed project was to demonstrate the Lockheed Martin Intelligent
Microgrid Solution’s ability to provide greenhouse gas emissions reduction, reduce facility
energy usage, reduce backup generator usage, and provide enhanced energy security as an
integrated system of energy assets under central control.
ENERGY SECURITY
The operating time of the facility critical loads was to be extended during periods of grid
independent operation by reducing the fuel consumption of the backup generation with a
combination of intelligent load management and the integration of renewable resources. The data
requirements for this objective were the normal operating time of the backup generation and the
extended operating time with the integration of renewable sources.
Also to be demonstrated was the extension of backup power to select high priority but non-
critical loads in order to extend the mission capability of the facility during grid
disturbances/failures. The data required for this objective was the verification of the additional
load, beyond serving the critical loads, during grid independent operation.
Energy Surety was to be attained through the demonstration of facility isolation during periods of
grid failure and seamless reconnection when the grid returns and stabilizes. The data
requirements of this objective included power flow measurements across the Point of Common
Coupling (PCC) and the microgrid bus voltage during these events.
Reduction of transient power flow caused by renewable energy was also to be demonstrated. By
installing an energy storage system to operate in conjunction with the existing photovoltaic
system, the microgrid is capable of offsetting any occlusions that may occur during the day. The
Microgrid Control System monitors the output from the solar inverter during the day and if
output drops considerably, the energy storage system supplies the difference. This capability will
help prevent voltage fluctuations and the need for additional frequency regulation by the utility.
Data requirements for this were power flow measurements from the solar inverter and the energy
storage system.
COST AVOIDANCE
The monthly demand charges were to be reduced by utilizing distributed resources available for
peak shaving. The data requirements for this include power consumption (in kW) of the facility
in both baseline configuration and microgrid configuration. Based on actual data gathered by the
MEDES data acquisition system installed in October 2011, the Enlisted Personnel Dining
Facility (EPDF) had a baseline power factor of 0.8. This power factor value decreased
substantially during periods of peak demand. The current rate structure at Fort Bliss dictates a
power factor adjustment charge based on the lowest power factor measured during the highest
peak demand on a rolling 30 minute window on a monthly basis. This is according to the “El
Paso Electric Company Schedule No. 38 Noticed Interruptible Power Service.” (21)
When the
power factor measured is less than 0.9, a cost adjustment is made. By performing power factor
improvement, the overall power factor of the EPDF can be improved, avoiding the power factor
adjustment charge. The data requirements for this include power factor as measured at the
protective relay.

ESTCP Final Report:
EW 201140 21 April 2014
In grid independent operation, fuel costs are reduced. This was accomplished through the
integration of energy storage and existing solar power onto the bus. The data requirements for
this include the calculated fuel consumption of the backup generator in the baseline
configuration and the calculated fuel consumption in the microgrid configuration. The total
energy production from the energy storage and the existing photovoltaic system was also
collected and compared to the cost of running the generator in the baseline configuration.
3.1 SUMMARY OF PERFORMANCE OBJECTIVES AND RESULTS
Performance
Objective Metric Data Requirements Success Criteria Results
Quantitative Performance Objectives
Reduce Facility
Energy Usage
Energy Intensity (kWh),
Peak Demand (kW)
Microgrid Power
Flow measurements,
electricity rates
>10% reduction of
peak electricity usage
as seen by the Utility
Successfully
reduced peak
utility demand
to 261 kW
which is a
14.4% reduction
when compared
to the 305kW
peak load
observed by
DPW in years
prior.
Reduce fuel usage
and Greenhouse
Gas (GHG)
emissions of
backup generators
during grid
independent
operations
Use of Energy Storage
and PV on critical load
during grid independent
scenarios (kWh), direct
fossil fuel GHG
emissions (metric tons)
during grid independent
operations
Power flow measure-
ments of energy
storage and PV during
grid independent
scenarios, measured or
calculated release of
GHG based on source
of energy, present fuel
costs
>20% reduction of
backup generator fuel
costs during daylight
hours in grid
independent
operations, 20%
reduced GHG
emissions compared
to baseline
configuration
Successful
Increase power
availability during
grid independent
operations
Number of additional
loads served in grid
independent operations
(kW)
Breaker status,
Microgrid load served
>20% more load and
facility utilization
during grid
independent
operations
Successfully
increased
islanded load
from 30-50kW
to 50-80kW.
This represents
a 37.5% to 40%
increase in load
supported
during grid
independent
operations.
Energy Surety Time interval of
interruption (s)
Microgrid bus voltage
measurements as a
function of time
< 5 cycles of AC
power for all EPDF
loads
Successfully
measured the
ESS picking up
system load
within 2 cycles
of AC power
interruption.

ESTCP Final Report:
EW 201140 22 April 2014
Performance
Objective Metric Data Requirements Success Criteria Results
System Economics Return on Investment as
calculated by the BLCC
program
Usage as a function of
time and utility billing
rate schedules
Savings to
Investment Ratio
(SIR) greater than 1.5
when extrapolated to
a full BCT.
Successfully
calculated a SIR
of 1.51 and a
payback of 8.89
years.
Power Quality
Assessment
Ability to provide event
oscillography,
waveform capture,
remote monitoring of
building power quality
Power, voltage and
power factor of the
Microgrid
The following data
points were captured
at a 1Hz rate: system
voltage per phase,
system frequency,
and real power,
reactive power, and
power factor as
measured from the
main circuit breaker
to the Utility.
Successful
Reduction of
Transient Power
Flow Caused by
Renewable Energy
Smoothing of
intermittent transients
introduced to the utility
grid. Will use reduction
of Power over time
interval: W/s
Measurements of PV
and Energy Storage
power flows
< 500W/second
reduction in power
caused by Renewable
Energy
Results Mixed
Power Factor
Improvement
EPDF total Power
Factor
Power Factor
measured at the
Protective Relay/Point
of Common Coupling
between the EPDF
loads and the Utility
Connection
>.9 PF of the EPDF
during peak hours
5AM to 8PM ,
Monday - Friday
Successful
Electricity
Arbitrage
kWhr(s) stored during
off peak demand and
kWhr(s) used during on
peak demand
Energy Storage
System kWhrs used
>20kWhrs stored
during off peak
demand and used
during on peak
demand.
Successfully
demonstrated an
average energy
output of 21.35
kWh per day at
peak hours.
3.2 PERFORMANCE OBJECTIVES DESCRIPTIONS
3.2.1 Reduce Facility Energy Usage
This objective demonstrated the ability of the microgrid to reduce peak electrical demand from
the utility provider arising during peak usage hours.
Purpose. To demonstrate the cost savings achievable by the microgrid in terms of utility
peak demand charges in line with the policy of reducing energy costs at DoD installations
Metric. Facility peak electrical demand
Data. Utility rate structure, fuel rates, Microgrid Power Flow measurements

ESTCP Final Report:
EW 201140 23 April 2014
Analytical Methodology. Direct comparison of baseline peak electrical demand and
microgrid peak electrical demand
Success Criteria. Greater than 10% reduction of peak electrical demand
3.2.2 Reduce Fuel Usage and GHG Emissions of Backup Generators
This objective demonstrated the ability of the microgrid to integrate new/existing renewable
energy resources and energy storage during grid independent operations to supplement the
existing backup generators. By offsetting some of the power requirements, less fuel is consumed
and less GHGs are emitted by the generator.
Purpose. To demonstrate the fuel savings and the reduction of GHGs associated with the
microgrid in line with the policies of reducing energy costs and GHG emissions at DoD
installations
Metric. Use of energy storage and photovoltaic system on critical loads during grid
independent scenarios (kWh), calculated GHG emissions (metric tons) and fuel usage
during grid independent operations
Data. Power flow measurements of energy storage and PV during grid independent
scenarios, calculated release of GHG based on fuel consumption data, calculated fuel
consumption data based on generator output and present fuel costs
Analytical Methodology. For fuel consumption, calculated numbers were derived using
the manufacturer’s specification sheet and the generator output data, in both the baseline
configuration and the microgrid configuration. These numbers will then be directly
compared to determine success. For GHG emissions, suggested Environmental Protection
Agency (EPA) calculations were performed based on the calculated fuel consumption rates
to arrive at emission data for both baseline and microgrid configurations. These levels of
emissions will then be directly compared to determine success.
Success Criteria. Greater than 20% fuel use reduction and greater than 20% GHG
emission reduction
3.2.3 Increase Power Availability During Grid Independent Operation
This objective demonstrated the ability of the microgrid to supply power to any subset of loads
during grid independent operations.
Purpose. In order to achieve greater energy security and mission capabilities, the facility
operator may need to supply power to loads not defined as critical. In the present
configuration, this is not possible. With the microgrid, the operator can choose to supply
power to loads in addition to the critical loads during grid independent operations.
Metric. Amount of additional load (kW) served during grid independent operations
Data. Breaker status of additional loads, power flow to additional loads
Analytical Methodology. Direct comparison of baseline configuration critical loads served
versus microgrid loads served

ESTCP Final Report:
EW 201140 24 April 2014
Success Criteria. Servicing additional load beyond critical load during grid independent
operation
3.2.4 Energy Surety
This objective demonstrated the ability of the microgrid to provide minimal power interruption
to critical loads and to reconnect with the grid upon its return and stabilization.
Purpose. During a loss of the utility grid, the critical loads are isolated from the facility
main bus and are powered by traditional backup generators. With the microgrid, non-
critical loads are isolated from the facilities main bus leaving the critical loads and allowing
the microgrid to serve prioritized non-critical loads based on power source availability
within the microgrid. This objective demonstrated the microgrid is capable of providing
this level of energy surety.
Metric. Time of interruption during grid disturbances was used to verify success. Typical
time of outages on similarly sized systems are on the order of 10-20 seconds. The
microgrid can decrease this substantially.
Data. Measurement of microgrid bus voltage
Analytical Methodology. Direct comparison of microgrid downtime versus baseline
configuration downtime
Success Criteria. Less than existing system configuration delay from grid failure to bus
powered
3.2.5 Reduction in Back Up Generator Usage
This objective demonstrated the ability of the microgrid to utilize renewable resources while
operating in a grid independent configuration. This capability is lacking from most grid-
interactive renewable installations. It also demonstrated how the microgrid allows the facility to
stay under power longer during periods of grid disturbance/outage. When the energy storage
component and the available renewable distributed energy resources are sized correctly, the
facility critical loads can operate indefinitely.
Purpose. This objective demonstrated the capability of the microgrid to extend the facility
operating time and decrease the load demand on the backup generator while operating
independent from the bulk power grid.
Metric. Energy production during grid independent operations
Data. Measurement of solar PV and energy storage system power outputs
Analytical Methodology. Comparison of calculated operational duration of the baseline
configuration (backup generator only) versus the microgrid configuration
Success Criteria. >20% reduction in backup generator load during grid independent
operation in daylight hours

ESTCP Final Report:
EW 201140 25 April 2014
3.2.6 System Economics
This objective demonstrated the economic advantages of having a microgrid and all the
flexibility it provides.
Purpose. The objective demonstrated the return on investment benefits provided by a
microgrid versus that of investing in a traditional system configuration.
Metric. Savings to Investment Ratio (SIR) as calculated by the Building Life Cycle Cost
(BLCC) program
Data. Usage as a function of time and utility billing rate schedules
Analytical Methodology. Calculation of the BLCC of a microgrid installation using the
government’s BLCC calculation program
Success Criteria. Savings to Investment Ratio (SIR) greater than 1.5 when extrapolated to
a full BCT
3.2.7 Power Quality Assessment
This objective demonstrated the ability to monitor and assess power quality within the microgrid
during grid-provided and grid independent modes of operation.
Purpose. In line with the desires of DoD for expanded energy usage information, metering
was installed on the facility that offers additional capabilities such as remote data collection
and event waveform capture.
Metric. Ability to provide event oscillography, waveform capture, remote monitoring of
building power quality
Data. Power, voltage, and power factor data of the microgrid
Analytical Methodology. Demonstrate the ability to capture Power Quality data
Success Criteria. Capture data to assess power quality of the microgrid
3.2.8 Reduction of Transient Power Flow Caused by Renewable Energy
This objective demonstrated the microgrid’s capability to control renewable energy transient
behavior experienced by utilities when renewable sources approach a significant percentage of
system generation.
Purpose. This objective demonstrated how energy storage coupled with renewable energy
sources can be used to reduce the transient nature of those sources. With the current
100kW PV Inverter, a solar occlusion could see a reduction in renewable energy as seen by
the Utility in the order of ~ 100kW/s.
Metric. Smoothing of intermittent transients introduced to the utility grid. The metric of
choice was maximum transient Watts/second seen by the Utility.
Data. Measurements of PV and energy storage power flows

ESTCP Final Report:
EW 201140 26 April 2014
Analytical Methodology. The total combined power flow of the energy storage and PV
systems during an occlusion was compared with a stand-alone PV system occlusion and the
results extrapolated to a larger system comprising a high percentage of renewable sources
to demonstrate the effectiveness of this type of deployment
Success Criteria. Less than 500W/second transient reduction as seen by the Utility due to
Renewable Energy
3.2.9 Power Factor Improvement
This objective demonstrated the ability of the microgrid to improve power factor at the EDPG
thus eliminating the power factor adjustment charge.
Purpose. To demonstrate the cost savings achievable by the microgrid in terms of power
factor improvement in line with the policy of reducing energy costs at DoD installations
Metric. EPDF total Power Factor
Data. Power Factor measured at the Protective Relay/Point of Common Coupling between
the EPDF loads and the Utility Connection
Analytical Methodology. Direct comparison of baseline power factor and microgrid power
factor
Success Criteria. Greater than 0.9 PF of the EPDF during peak hours 5AM to 8PM ,
Monday - Friday
3.2.10 Electricity Arbitrage
This objective demonstrated the ability of the microgrid to reduce peak electrical demand from
the utility provider arising during peak usage hours by storing energy when the kWhr price is
low, and expending that energy when the kWhr price is high.
Purpose. To demonstrate the cost savings achievable by the microgrid in terms of
electricity arbitrage in line with the policy of reducing energy costs at DoD installations
Metric. Number of kWhr(s) stored during off peak demand and kWhr(s) used during on
peak demand
Data. Energy Storage System kWhrs used
Analytical Methodology. Direct comparison of baseline kWhrs used from the Utility’s
perspective versus kWhrs used in conjunction with the microgrid
Success Criteria. Greater than 20kWhrs stored during off peak demand and used during on
peak demand.

ESTCP Final Report:
EW 201140 27 April 2014
4.0 FACILITY/SITE DESCRIPTION
The Enlisted Personnel Dining Facility (EPDF) at Fort Bliss Army Base was chosen as the
demonstration site in the BCT-1 installation. The EPDF is building 20226 of the BCT-1 campus.
The BCT-1 campus is located in the northeast portion of Fort Bliss.
4.1 FACILITY/SITE LOCATION AND OPERATIONS
The BCT-1 complex at Fort Bliss is located at the northeast side of the base in El Paso, TX
(Figure 4.1-1). The Enlisted Personnel Dining Facility (EPDF) of the BCT-1 complex served as
the demonstration site.
Figure 4-1 Location of Brigade Combat Team (BCT-1) on Fort Bliss Map
4.1.1 Demonstration Site Description
The EPDF of the BCT-1 complex at Fort Bliss provides a scalable size for a microgrid
demonstration with a transition path to a base-wide microgrid, followed by future DoD-wide
microgrid implementations. The EPDF is located on the BCT-1 campus map in Figure 4-1 as the
building number 20226.

ESTCP Final Report:
EW 201140 28 April 2014
Figure 4-2 Location of EPDF on BCT-1 Installation Map
The BCT complex is served by a 13.8 kV feeder loop. The EPDF has a 1500 kVA building
transformer that converts the feeder loop medium voltage to 480 VAC. For this demonstration,
power transfer was conducted at 480 VAC. The EPDF also has an existing 100 kW solar PV
array, suitable for demonstrating use of renewable energy in combination with load management
to achieve energy cost savings during islanded scenarios.
As a dining facility, the loads that are considered critical load equipment with near-continuous
operation required are the refrigeration and freezer equipment. If utility power were ever lost,
these loads were supported by the backup generator on an automatic transfer switch. The critical
load demand profile along with the legacy energy sources were well suited for demonstrating
seamless power transfer for energy surety as well as peak shaving for energy cost reduction.
4.1.2 Key Operations
There are extensive military operations in the vicinity of the EPDF demonstration site. The
BCT-1 complex at the base serves as a platform to quickly project military force anywhere in the
world. The majority of the BCT-1 buildings serve Brigade activities, including the Brigade /
Battalion Headquarters, EPDF, and Company Operations facilities and Tactical Equipment
Maintenance Facilities for Field Artillery, Brigade Support, Special Troops, Combined Arms,
and Reconnaissance, Surveillance, and Target Acquisition. Unaccompanied Enlisted Personnel
Housing and the EPDF provide housing and food for all troops engaged in military training,
equipment test and maintenance, and practicing military maneuvers as part of BCT-1.
Construction, installation, and verification of the demonstration project required power to the
building to be disconnected for periods of time. These times were coordinated with the Fort Bliss
Program Manager for Energy Savings Performance Contracting (ESPC) and DPW to minimize
the impact on those served by the EPDF. Lockheed Martin ensured that the subcontractors
contacted the DPW to coordinate down times for electrical work and equipment installation or

ESTCP Final Report:
EW 201140 29 April 2014
check out. Lockheed Martin also coordinated down times for system check out, commissioning
and verification.
4.1.3 Personnel
Key leaders at Fort Bliss were responsive and timely in coordinating with Lockheed Martin and
providing information needed to design and plan the demonstration project. They collaborated
and took action to find space for demonstration equipment, provide historical power system data
for the system design, and worked with Lockheed Martin and BCT personnel to designate
building down times. Details of the leadership chain of command at Fort Bliss at the time of
installation, integration, and commissioning are shown in Figure 4-3.
Figure 4-3 Fort Bliss DPW Chain of Command in the U.S. Army
The primary point of contact for the Lockheed Martin demonstration is the Fort Bliss DPW
Energy Manager and the Fort Bliss DPW Resource Efficiency Manager. Representatives of the
legacy infrastructure and equipment at Fort Bliss have also been forthcoming and helpful in
coordinating information to develop the demonstration. Key Fort Bliss contacts are listed in
Table 4-1, with a detailed list of program points of contact provided in Appendix A.

ESTCP Final Report:
EW 201140 30 April 2014
Table 4-1 Key Site Leaders at Fort Bliss
Contact Organization / Position
BJ Tomlinson DPW / Renewable Energy Project Manager
Gene Curtiss DPW / Program Manager for Energy Savings Performance Contracting
Dennis Wike DPW / Fort Bliss Resource Efficiency Manager
Robert Lopez DPW / Energy Manager
Mike Gomez Pride Power / High-voltage Supervisor
Derek Williamson Johnson Controls Inc. / Site Supervisor
4.2 FACILITY/SITE CONDITIONS
The EPDF at Ft Bliss had a number of benefits that make it ideal for use in this demonstration
project. The backup generator was oversized and rarely used. The existing solar PV system
supplemented power while grid tied but it was limited to <20% of its full potential output when
islanded. There was an existing connection to the base wide Utility Monitoring and Control
System (UMCS) (22)
thus allowing DPW a means to receive additional telemetry data from the
microgrid. The distribution equipment is owned and operated by DPW thus avoiding extra work
to setup an intertie agreement with the utility/distribution company. Most importantly the
soldiers on post were actively using the facility thus giving the project a real world load profile
to test against.

ESTCP Final Report:
EW 201140 31 April 2014
5.0 TEST DESIGN
The traditional approach to electricity usage results in many inefficiencies for DoD installations
and for underutilization of existing renewable energy resources. It also fails to provide
appropriate measures of energy security and greenhouse gas emission reductions. The traditional
configuration uses backup combustion generators for support of critical loads only and integrates
renewable resources that cannot be fully utilized in grid independent operations. The existing
distributed energy resources cannot be utilized to perform tasks such as controlled peak shaving
and energy resource optimization.
The detailed description of the system components and interconnections are described in the
following sections.
5.1 CONCEPTUAL TEST DESIGN
The overarching test designed for measuring system operational success has been carried out via
a series of several smaller tests, each designed to verify a particular subset of performance
objectives. These smaller tests included a peak shaving test with the microgrid paralleled to the
utility, a grid failure test with the microgrid isolating from the utility, and a grid independent test
with the microgrid isolated from the utility. Two of these simulated scenarios were performed
shortly after system commissioning and following that period, the system was left to operate
autonomously for the remainder of the demonstration time in real-life conditions. The details of
these tests and the associated performance objectives were described in more detail in the
following paragraphs.
5.1.1 Peak Shaving Test
The purpose of this test was to determine the ability of the microgrid to reduce the facility energy
usage from the bulk power grid and thereby reduce the monthly utility demand charge. This test
yields the measure of success for the performance objective “Reduce Facility Energy Usage”.
Independent Variable. The amount of locally generated energy was manipulated in the form of
generator and energy storage power output. Also, the produced solar power was monitored and
recorded.
Dependent Variable. During this test, the facility load demand from the bulk power grid was
monitored. This demand directly impacts the cost of energy for the facility in the form of kWh
charges and peak demand charges.
Controlled Variable. In this case, the controlled variable was the total load demand of the
facility. The additional locally generated energy subtracted from the energy demanded from the
bulk power grid and resulted in cost savings and facility energy usage reductions from the
perspective of the bulk power grid. Also, the utility rate schedule and the demand charge were
controlled variables as they had been negotiated in advance with the electric utility provider.
Hypothesis. By integrating new and existing renewable energy sources and existing backup
generators, energy cost reductions can be achieved. For this demonstration, the peak usage of the
infrastructure within the microgrid can be shaved by 10% with the use of distributed energy
resources.

ESTCP Final Report:
EW 201140 32 April 2014
Test Design. In order to test the reduction of facility energy usage, facility peak load demand
times were identified by the microgrid Central Controller and during these periods of time,
sources were utilized to shave this peak and reduce peak demand charges. In the case of this
demonstration, the diesel generator was the primary source used to peak shave dynamically,
while the energy storage system contributed in a static fashion while performing an energy
arbitrage function. The results of the test are presented in section 6.
Test Phases. This test consisted of several phases of execution including baseline
characterization, equipment installation, commissioning, data collection, and final analysis.
The baseline characterization was accomplished by installing a data acquisition system
composed of power meters and associated data loggers and recording the logged data for the
duration of the project. Periodically, this data was extracted and used to characterize the facility
loading. From this characterization, peak demand and peak demand times were identified and
targeted for test runs.
The equipment installation phase consisted of the installation of all new equipment and the
modifications to the existing electrical infrastructure needed to support the equipment. This
included integration efforts and was followed by the commissioning of the system as a whole.
The data collection phase entailed capturing the new system data with the existing data collection
system and the data historian subsystem of the microgrid and extracting this data following the
testing.
5.1.2 Grid Failure Test
The purpose of this test was to determine the ability of the microgrid to provide minimal
interruption to facility loads during a grid failure as well as to reconnect back to the grid upon the
return of voltage. This test yielded the measure of success of the performance objective “Energy
Surety.” The grid failure was simulated with the manual opening of the transfer switch and
subsequent operation of the system resulted in no unexpected microgrid outages.
Independent Variable. The availability of the bulk power grid was manipulated in this test by
shutting the feed to the facility down for a predetermined amount of time. The facility load
demand was also manipulated in the form of a non-critical load shed when utility power was lost.
Dependent Variable. During this test, the down time of the facility bus voltage was monitored
and recorded. This downtime demonstrated the ability of the microgrid to minimize the
interruption of power to the facility loads deemed critical.
Controlled Variable. For this test, the controlled variable was the simulation of the loss of the
bulk power grid. Originally, this was to be controlled via a manual switch on the transformer that
feeds the facility (Figure 5-1). However, due to standard operating procedures and safety
considerations of the local distribution service contractor, the utility power was interrupted at the
medium voltage switchgear directly upstream from the facility distribution transformer. This
alteration in no way influenced the outcome of the test due to the fact that the microgrid islands
itself no matter where the point of service interruption occurs.

ESTCP Final Report:
EW 201140 33 April 2014
Figure 5-1 Facility Distribution Transformer Disconnection Switch
Hypothesis. The ability of traditional backup systems to respond to utility power outages is
currently time limited due to the nature of combustion generator sets and their associated turn on
and warm up times. This downtime can be reduced significantly with the introduction of an
intelligent energy storage element that can respond much more rapidly to such outages.
Test Design. In order to test the energy surety performance objective, a utility power outage was
simulated by turning off the electrical feed to the facility at the distribution loop switchgear. The
voltage of the facility distribution bus was monitored and the time lapse between voltage loss
and return was recorded and compared to the existing interrupt time of several minutes. Once the
data had been captured, the utility voltage was restored to the Point of Common Coupling and
the system reconnected itself to the utility.
Test Phases. Following the installation and integration of the system components, the test was
scheduled with the base personnel and the facility operators so as to minimize impact to the
existing mission of the facility. The test was performed and the data was acquired from the
installed data acquisition system. The baseline data set acquired was the interrupt time of the
present system configuration. For the data analysis, refer to Section 6.0.
5.1.3 Grid Independent Test
The purpose of this test was to ascertain the capabilities of the microgrid while isolated from the
bulk power grid. This test yielded the measures of success for all performance objectives in table
1 not tested in the previous two tests, with the exception of the system economics performance
objective.
Independent Variables. During this test, the photovoltaic and energy storage components were
utilized. Also, the total amount and numbers of loads served during a grid independent event
were recorded.
Dependent Variables. The fuel consumption and associated operating time of the backup
generator were measured and recorded to be compared with baseline measurements/calculations.
Also, the status of additional feeder breakers used to feed loads not available in the traditional
system configuration were monitored and recorded along with their demand levels. The power

ESTCP Final Report:
EW 201140 34 April 2014
quality of the microgrid bus was also closely monitored to ascertain if any issues were present on
the bus.
Controlled Variable. The absence of the bulk power grid was maintained for the duration of this
test.
Hypotheses. By introducing the availability of both renewable photovoltaic power and energy
storage in this microgrid configuration, the available mission operational time of the backup
generator can be increased greater than 20% over present system configurations. With
appropriate renewable source and energy storage system sizing, this operational time could be
increased without limit.
By reducing the operational load on the backup generator, fuel consumption is reduced
accordingly and so are greenhouse gas emissions. For the purposes of this demonstration, fuel
consumption and GHG emissions are to be reduced by greater than 20%.
The microgrid configuration also allows the flexibility to increase the mission of the facility to
include other loads not included in the traditional backup system configuration.
Test Design. The facility was separated from the bulk power grid for the duration of this test. In
order to test the performance objective “Reduce fuel usage and Greenhouse Gas (GHG)
emissions of backup generators during grid independent operations”, all available photovoltaic
power was used as well as all available energy storage capabilities to serve critical loads. During
this operation, the power output and calculated fuel consumption of the backup generator was
recorded. Also, GHG emissions are to be calculated for both configurations and compared to
determine reduction percentage levels. In order to test the performance objective “Reduction in
Back Up Generator Usage”, the output of the photovoltaic and energy storage systems was
recorded. These were compared with the traditional configuration generator load to determine
the increase in available energy during daytime grid independent operations. The power quality
of the microgrid was closely monitored for any indications of abnormality. Finally, to test the
performance objective “Increase power availability during grid independent operations,” non-
critical load was added during this period of grid-independent operation and the additional load
demand was recorded as well as the status of the associated feeder breaker(s). This data were
sufficient to ascertain success of this particular objective. For analysis, see section 6.0.
Test Phases. Following the installation and integration of the system components, the test was
scheduled with the base personnel and the dining facility operators as a part of pre-test
preparation so as to minimize impact to the existing mission of the facility. Once a suitable
testing schedule had been identified, the test was performed and the relevant data was acquired
from the data acquisition system.
The baseline data was collected prior to the system operational phase. It consists of the facility
and critical load demand data and the output from the photovoltaic system, which was previously
designed to output at greatly reduced renewable energy power levels when the facility was
operating in emergency backup mode to prevent back feeding of the generator.
For the data analysis performed, refer to Section 6.0.

ESTCP Final Report:
EW 201140 35 April 2014
5.2 BASELINE CHARACTERIZATION
5.2.1 Reference Conditions
The facility energy consumption data was collected from the energy monitoring and metering
system described in Section 5.2.5. The load data from the critical loads was used to calculate the
expected operational time and expected GHG emissions of the backup generator. This data was
used to provide a baseline for the performance objective “Reduce fuel usage and Greenhouse
Gas (GHG) emissions of backup generators during grid independent operations” and “Reduction
in Back Up Generator Usage.” The pre-microgrid generator control parameters were collected to
determine the interruption time that previously existed when the bulk power grid went down.
This data was used to provide a baseline for assessing the performance objective “Energy
Surety.” The baseline characterization of the performance objective “Increase power availability
during grid independent operations” was determined by recording the amount of load not served
by the existing backup generator within the planned microgrid. The performance objective
“Power Quality Issue Assessment” used the currently available metering of the facility as a
baseline to show improvement in the capabilities to determine power quality problems. Finally,
the System Economics performance objective provides the information from a Building Life
Cycle Cost (BLCC) study performed on the system.
5.2.2 Baseline Collection Period
The planned baseline data collection period extended from November 2011 to July 2012. This
yielded detailed baseline data over both hot and cold weather extreme conditions. It also allowed
for the identification of heavy facility electrical demand periods. These time periods were used to
evaluate candidate peak shaving operation times.
5.2.3 Existing Baseline Data
The DPW at Fort Bliss has logged monthly electrical demand for the facility for a period of time
via their Building Operations Command Center (BOCC). This data was analyzed to see if it
could be used to augment the baseline data pool, but the BOCC measurements were not at a
resolution required to see the energy use from individual feeders. Instead, power meters were
placed on the feeders to the BCT to collect baseline data (see Section 5.2.5).
5.2.4 Baseline Estimation
The operational time of the backup generator in the baseline configuration was estimated based
on the known critical load demand data obtained and the manufacturer’s fuel usage data. The
GHG emissions and the fuel consumption were obtained as byproducts of this estimation.
Maintenance of generators may reduce GHG emissions, but this data were not collected.

ESTCP Final Report:
EW 201140 36 April 2014
5.2.5 Data Collection Equipment
The metering of the facility electrical demand was performed with metering equipment on each
feeder circuit and the incoming facility main feed. These meters are T-VER-E50B2 power
meters manufactured for Onset Computer Corp. They are accompanied by HOBO UX120-017M
data loggers, one for each meter used for long term data storage.
The sensors used to detect current are the AC current transducers manufactured by Magnelab
show in Figure 5-3.
Figure 5-3 T-MAG-SCT-200 and T-MAG-SCT-600 AC Current Sensors
Figure 5-2 Data Loggers and Power Meters used for Baseline Measurements

ESTCP Final Report:
EW 201140 37 April 2014
5.3 DESIGN AND LAYOUT OF TECHNOLOGY COMPONENTS
The following section describes the design of the Intelligent Microgrid Solution as it specifically
applies to the work that was done in this ESTCP demonstration project.
5.3.1 Major Subsystems and Components
Several additions were made to the building’s existing power system.
Solar PV System
300kVA 60kWh
ENERGY STORAGE
SYSTEM
13.8 kVAC
MICROGRID CONTROL
SYSTEM (MCS)
CRITICAL
LOADS
AUTOMATIC TRANSFER
SWITCH
FEEDER BREAKERS
125kWp SOLAR
ARRAY
100kVA GRID-TIE PV
INVERTER
250kW TEST
LOAD BANK250kW
BACKUP
GENERATOR
PARALLELLING GENERATOR CONTROLLER
TO
SUBSTATION
MAIN PANEL
1600A 480VAC
480
VAC
Additions /
Modifications
Existing HW/SW
13.8 kVAC Power Line
480 VAC Power Line
Control/Status Comms Line
BASE-WIDE
UMCS
FIRMWARE UPDATE FOR OUTPUT CONTROL
PCC/Switchboard Controls System
PROTECTIVE
RELAY
POWER CIRCUIT
BREAKER/
SWITCHGEAR
PLC Generator Controls System
LONWORKS
GATEWAY
NEW HMI SCREENS
NEW DATA POINTSBUILDING
SERVICETRANSFORMER
Legend
MOTOR OPERATORS
NON-CRITICAL LOADS
Figure 5-4 System Block Diagram
Originally, the plan was to utilize the existing main switchboard and add new circuits on to it.
However, following the contract modification, it became necessary to redesign the electrical
additions. The resulting system incorporated a new switchboard upstream from the existing
switchboard. This new switchboard housed the connections for the energy storage systems and
the equipment comprising the PCC. Also, the generator paralleling equipment was also to be
housed in the original switchboard, but to maintain consistency with industry standards,
subcontractors placed the paralleling equipment in an adjacent mechanical room and run the
power feeds to the existing generator breaker connection. The load shedding features were also
modified prior to the final commissioning as the selected motor operators would not fit on all of
the desired circuit breakers.
A partial floor plan of the EPDF is provided in Figure 5-5 with labeled points of interest.

ESTCP Final Report:
EW 201140 38 April 2014
Microgrid Components
1) MCS Servers
2) Unmanaged Ethernet Switch
3) Programmable Logic Controller
4) LonWorks Gateway
5) Solar PV Inverter
6) Solar Array
7) Backup Generator
8) Generator Controls
9) Test Load Bank
10) Automatic Transfer Switch
11) Energy Storage Inverter
12) Batteries
13) Protective Relay
14) Main Switch Gear
15) Motor Operators/ Load Shed Breakers
16) Building Service Transformer
2
1
3
4
5
6
7
8
9
10
11 11 11
12 12 12
13
14
15
16
Figure 5-5 EPDF Floor Plan with Microgrid Components Labeled
5.3.1.1 Microgrid Control System (MCS)
The MCS is a server rack containing two Dell PowerEdge R515 servers, one UPS, one Keyboard
Video Mouse (KVM) switch, and a rack mounted Keyboard and Monitor Module (KMM).
Figure 5-6 MCS Rack

ESTCP Final Report:
EW 201140 39 April 2014
Each MCS server runs Windows Server 2008 R2 and hosts a number of software applications
such as the control algorithms, data acquisition system, database management system, and the
Microgrid’s Human Machine Interface (HMI). A MCS server can be configured to have one of
two possible roles: a primary MCS Server configuration and a secondary MCS Server
configuration. Each server was loaded with identical software, except the primary server was
configured to actively run the optimization algorithms and control DERs. The secondary server
was a “hot” backup and only would command the DERs if it detected that the primary MCS
Server had stopped working. This redundant control system helped to ensure availability of the
system, and minimizes downtime if maintenance work was required on one of the servers.
Figure 5-7 MCS Human Machine Interface Screenshot
The optimization and stabilization control algorithms are discussed further in section 2.2.
5.3.1.2 Energy Storage System (ESS)
The Energy Storage System (ESS) consists of three 20-foot International Organization for
Standardization (ISO) 6346 shipping containers each holding 20 kWh of battery storage and a
100 kVA inverter. Together as a system the ESS provides 60 kWh of energy with a 300 kVA
output rating and is connected on the 480V main bus. Three additional breakers were added to
the new switchboard for the ESS interface.

ESTCP Final Report:
EW 201140 40 April 2014
Figure 5-8 Three Energy Storage Containers at the EPDF
The microgrid utilized the ESS to perform source shifting, renewable energy stabilization and
power quality functions both while grid tied and when islanded. Princeton Power Systems was
selected as the subcontractor for the ESS containers, inverters, and other electrical equipment.
For this project lead acid Absolyte GP Batteries were used. Assuming that the average depletion
of the ESS at the end of the day is about 33% depth of discharge (67% full), the batteries should
last 3500 charge cycles.
Figure 5-9 Absolyte GP Battery Cycle Life vs. Depth of Discharge

ESTCP Final Report:
EW 201140 41 April 2014
Effort for proper integration of the ESS included running underground conduit for the power and
control wires and mounting the outdoor units on a new concrete pad.
5.3.1.3 Generator Controls System
The dining facility has a 250kW diesel generator, (Cummins model DQAA-5952220, 480/277V,
3-phase) connected by an automatic transfer switch (ATS) to a dedicated subpanel servicing
critical loads (freezer power for the EPDF).
Figure 5-10 Existing Backup Generator and Automatic Transfer Switch
The ATS, a Cummins model BTPC-400, 400A, was used to transfer the critical loads from the
utility to the generator in the case of a power outage. The transfer switch senses the power
outage, starts the generator and transfers the critical load. This device was left in place. A jumper
in the terminal block disables it during microgrid operation, but allows easy restoration back to
legacy conditions. The transfer switch operation has been modified to make the transfer switch
inactive while the microgrid is active. If the operators choose to disable the microgrid, the
transfer switch will immediately take over its previous functionality. There is an additional
circuit breaker that parallels the transfer switch. Its operation will replace the transfer switches
function via a motor operator on the circuit breaker.
The original generator controller has been replaced with a Woodward easYgen (see Figure 5-11)
for the required paralleling operation. The new controller allows legacy operation and has been
configured to allow the operators to return to legacy operating mode with no reprogramming.

ESTCP Final Report:
EW 201140 42 April 2014
Figure 5-11 New Woodward easYgen Controller
A paralleling circuit from the generator to the main switch board was added to get power to the
microgrid bus, yet leave the existing ATS in place.
There was an existing 250KW load bank used for generator testing. Previously, the power
generated during the scheduled maintenance was wasted. The microgrid system will now allow
this power to be used in the building instead of wasting it as heat in the load bank.
Figure 5-12 Generator Test Load Bank

ESTCP Final Report:
EW 201140 43 April 2014
5.3.1.4 PCC/Switchboard Controls System
The Point of Common Coupling (PCC)/Switchboard controls system was composed of new
switchgear, a protective relay at the point of common coupling, a Programmable Logic
Controller (PLC), new Motor Operators installed on top of the load breakers, and a main panel
for the EPDF.
The Power Circuit Breaker/Switchgear allows the Utility to be disconnected from the EPDF in
less than five cycles. This was also the distribution point for the 300kW ESS. It housed the
equipment that constitutes the PCC for the microgrid.
Figure 5-13 Existing Transformer and New Switchgear
The new switchgear equipment as seen in Figure 5-13 was located outside, next to the building
service transformer. This addition fully utilizes previously present power cables that connected
the transformer to the main circuit breaker. The ESS connects to the EPDF bus at this location,
which keeps the EPDF electrical room free from most of the modification effort.
A Schweitzer Engineering Laboratories SEL-700G0+ Protective Relay (see Figure 5-14)
monitored the utility and microgrid sides of the microgrid isolation switch to allow compliance
with IEEE 1547. It ensured that power is not fed back to the utility grid from the microgrid when
the grid is down and ensures synchronization between the utility grid and the islanded microgrid
before reconnecting them.

ESTCP Final Report:
EW 201140 44 April 2014
Figure 5-14 SEL-700G0+ Protective Relay
The Protective Relay provided power metering at the point of common coupling so that the MCS
could monitor the power flow in and out of the microgrid. It was used by the MCS to detect
when the utility grid came back online after an outage.
A programmable logic controller (PLC) controlled the motorized load shed breakers in the
switchgear and monitors the power measurements. It had inputs/outputs to/from the generator
controller and protective relay. With the MCS commands and the other inputs, it controlled the
appropriate load breakers via the Motor Operators to ensure power delivery, quality and safety.
As seen in Figure 5-15, the PLC used was a National Instruments cRIO-9024 with a real-time
800MHz PowerPC CPU and an integrated FPGA. Additional high speed digital input/output
channels and analog output channel modules were used to interface with devices and sensors.
Figure 5-15 National Instruments cRIO-9024
The PLC operated under the VxWorks Real-time Operating System to ensure that critical tasks,
such as coordinating with the generator, load breakers, and ESS inverters during grid mode

ESTCP Final Report:
EW 201140 45 April 2014
transition, were executed in deterministic high speed manner. The hard real-time nature of the
PLC was critical for the renewable smoothing function and the grid transition function.
The building’s main switchboard served as the microgrid bus under the “Facility Microgrid”
definition in IEEE 1547.4. The switchboard shown in Figure 5-16 is an Eaton Cutler Hammer:
POW-R-LINE C. 1600A, 480/277V, 3-phase unit.
Figure 5-16 Load Breakers in Main Switchboard prior to Motor Operators Installation
Motor operators were added to some of the major switchboard breakers to allow for the remote
control of these breakers. The motor operators as seen in Figure 5-17 were designed to be
attached to the existing breakers with no switchboard modifications. As discussed below, not all
of the originally planned operators were installed due to conflict with the present infrastructure in
the main switchboard.

ESTCP Final Report:
EW 201140 46 April 2014
Figure 5-17 Motor Operator
5.3.1.5 Solar PV System
The Solar PV System included a 125 kW DC array of Kyocera KD210GX-LPU modules (see
Figure 5-19) and a 100 kW PVPowered (now called Advanced Energy) inverter for 480/277V, 3-
phase operation. Prior to commissioning the microgrid, the PV inverter operated without
external controls and reported status to the UMCS over the LonWorks (23)
device network.
The PV Inverter operated per UL1741/IEEE1547 which includes the utility grid interconnection
requirements. When the utility output is outside the operating range (w.r.t. voltage or frequency)
the PV Inverter automatically disconnects from the grid for 5 minutes before trying to reconnect
to a stable grid (reference Figure 5-27). The maximum PV Inverter output during islanding is
automatically adjusted so that there is at least a 20kW load on the generator – preventing the
generator from being back fed by the PV Inverter which may destabilize the grid.
Note: A protective relay (SEL-700G0) could be configured to operate per UL1741/IEEE1547
when using a non-UL1741 inverter. This will limit the interaction of the inverters to only operate
in the islanded configuration.

ESTCP Final Report:
EW 201140 47 April 2014
Figure 5-18 PVPowered PVP100kW-480 Inverter
Figure 5-19 Kyocera KD210GX-LPU Solar Panel Modules
The PV inverter received a software upgrade from the manufacturer that allowed the inverter’s
output to be curtailed by the MCS to prevent the inverter from producing more power than the
loads required in an islanded grid mode (see section 2.2.2.1 for more details).

ESTCP Final Report:
EW 201140 48 April 2014
5.3.1.6 LonWorks Gateway
The FieldServer LonWorks Gateway in Figure 5-20 serves as a bridge between the microgrid
control network and the existing Ft Bliss Local Area Network (LAN), as well as a gateway to
access data from the PV Inverter.
Figure 5-20 FieldServer LonWorks Gateway FS-B2011
The LonWorks Gateway’s software configuration was updated to allow both the UMCS and
MCS system to collect data from the PV inverter, and to allow for a few select data points to be
sent from the MCS to UMCS.
5.3.1.7 UMCS
Most large DoD fixed facilities have an existing Building Management System (BMS), SCADA
or similar system that fulfills the role of a UMCS as defined in the UFGS-25 10 10 specification (22)
. The UFGS-25 10 10 specification recommends using a LonWorks, BACnet, Modbus, OPC,
and/or the Niagara Framework to implement a device network. At Fort Bliss, the UMCS
consists of a Johnson Controls Inc. provided/managed system called Metasys™.
Metasys™ pulls data from the base’s LonWorks devices including data that contains status
information about the microgrid. Johnson Controls was subcontracted to create the new HMI
screens (see Figure 5-21 and Figure 5-22) in Metasys™. This allows personnel at the DPW’s
Building Operations Command Center (BOCC) to monitor real-time device telemetry data from
the microgrid, set alarms based off the data, and store trending information.

ESTCP Final Report:
EW 201140 49 April 2014
Figure 5-21 1st UMCS page for EPDF Microgrid
Figure 5-22 2nd UMCS page for EPDF Microgrid

ESTCP Final Report:
EW 201140 50 April 2014
5.3.2 Communications Design
Communications is a key design element for any microgrid. Ideally the communications design
allows for easy integration with existing systems and provides an open design for growth. For
this demonstration project, power data is measured by DERs and distributed controllers which
are then polled for status information by the Microgrid Control Subsystem (MCS) at a periodic
interval using the Modbus/TCP protocol. Likewise, commands that originate at the MCS are
communicated to the DERs and distributed controllers using Modbus/TCP.
Unmanaged Ethernet Switch
LonWorks GatewayLonWorks LON to IP
Router
Photovoltaic Inverter
Modbus TCP
Modbus TCP Modbus TCP
Modbus TCP
Modbus RTU
LonTalk
Modbus RTU
Modbus TCPModbus TCP
Utility Monitoring and Control System
(UMCS)
LonTalk Over IP
PLC
MCS Server 1 MCS Server 2
Modbus Gateway
GeneratorController
ProtectiveRelay
ModbusGateway
ModbusGateway
ModbusGateway
Energy Storage
Inverter 1
Energy Storage
Inverter 2
Energy Storage
Inverter 3
Modbus TCP
Modbus RTU Modbus RTU Modbus RTU
Modbus TCP
Modbus TCP
Figure 5-23 EPDF Microgrid Control Network
Many industrial control devices do not natively use Ethernet as their physical link but instead
communicate using serial RS-485. Gateways are used to translate both the application layer
messages to Modbus/TCP and to convert the DERs’ native physical link to Ethernet. For
instance the Generator Controller natively communicates via a Modbus RTU on a serial RS-45
physical link, but with the Modbus Gateway messages can be converted to Modbus/TCP on an
Ethernet link to facilitate communications with the MCS.
The backbone of the control network includes an unmanaged Ethernet switch, which can be
easily scaled up to support additional devices in the future as is commonly done with stackable
Ethernet switches in office environments.
The UMCS periodically polls the LonWorks Gateway using the LonTalk protocol (standardized
as ANSI/CEA-709.1-C) (23)
. In response to the UMCS, the LonWorks Gateway provides the

ESTCP Final Report:
EW 201140 51 April 2014
latest data it received from the MCS. This isolated the microgrid control network, shown in red,
from the Ft Bliss LAN, shown in blue, and vice versa.
Since the EPDF Microgrid control network is completely contained on the building side of the
LonWorks to IP router, Certificate of Networthiness (CoN) and Defense Information Assurance
Certification Accreditation Program (DIACAP) processes need not be applied to the Lockheed
Martin demonstration. This approval has been coordinated with the Fort Bliss DPW and Network
Enterprise Center at the base. The Lockheed Martin scope of work does not include addressing
cyber security issues that may be associated with the UMCS.
5.3.3 Failure Modes and Effects Analysis (FMEA)
A Failure Modes and Effects Analysis (FMEA) document was created for the controls portion of
the microgrid. Described herein is the top-down approach to the failure modes and effects
analysis. This FMEA assumes a failure at the system level and then identifies how that failure
can occur. For each of the failure modes identified, the corresponding system mode of operation
has been identified. A mode is defined as a condition of a system in which it provides some
known set of functions.
In addition to the corresponding system mode, the cause of each failure and its local effect has
been identified. The local effect refers to the system component or subsystem that is directly
affected by the failure. Subsystems that are indirectly affected by the failure are identified as
“next level higher” effects, and system functionality that is disabled or partially disabled is
categorized as an “end effect.” Finally, for each failure mode that is identified for the system, the
method of failure detection is identified as well, so that actions to avoid catastrophic failures or
mitigate any performance degradation can be developed.
Lockheed Martin is willing to share the FMEA for this project; if interested parties would like to
receive a copy of the FMEA then please contact the project PI or Co-PI (see Appendix A for
contact information). The FMEA primarily addresses the following categories of failure modes:
breaker control failures, device control failures, and central controller-related failures, and grid
disconnection and reconnection failures. The mitigation strategies mainly rely on being able to
revert to operation that is equivalent to the legacy configuration the EPDF power distribution
system. The mitigations may be enacted autonomously by the system in some cases or require
manual actions by the operator that have been written into the operating procedures.
5.4 OPERATIONAL TESTING
5.4.1 Operational Testing of Cost and Performance
Data collection methodology was unchanged for the duration of the demonstration. Through
initial baseline characterization, system installation, integration, and adjustment, system
commissioning, system operation, and demonstration completion data collection has consisted of
extracting the data from the metering system described in Section 5.2.5. Following system
commissioning, generator, energy storage, and photovoltaic system data were collected and

ESTCP Final Report:
EW 201140 52 April 2014
archived internally via the SCADA software and its associated historian package in order to
supplement this data set. Data has been extracted from the data loggers approximately quarterly.
The complete pool of data was sufficient to assess the performance objectives.
5.4.2 Technology Transfer or Decommissioning
Appropriate personnel at the demonstration site have received training on the operation and use
of the system during the course of the commissioning. As a part of this training, Lockheed
Martin has included operating manuals on all new equipment and the system as a whole.
Lockheed Martin also included the option for the base personnel to return the system to its
original configuration if so desired.
It is hoped that this site will be continually used as a test bed for future microgrid projects
unfolding across different sections of the base. The appropriate personnel can become acquainted
with the technology and the financial benefits of a larger microgrid can be investigated using in
situ equipment backed up with verifiable results.
5.5 SAMPLING PROTOCOL
There are three main data acquisition systems: the sub-meters installed for baseline
measurements, the MCS, and lastly the base wide UMCS. Primarily data were used from the
MCS historian(s) to determine success of most objectives. The sub-meters were used mainly for
comparison purposes and initial algorithm settings. The UMCS data was not used in this report,
but it did provide DPW an independent way to record status of each DER and determine
efficiency as needed.
5.5.1 Sampling Protocol for Baseline Measurements
The sub-meter data acquisition system consisted of 11 pairs of Onset model T-VER-E50B2
power meters and HOBO model UX120-017x data loggers (see Figure 5-1) in addition to their
associated current sensors. These meters collected power data at various points on the electrical
bus such as: the main building feed and each of the branch feed breakers in the main switchgear
panel for the dining facility. This data was used to compare the baseline system power usage and
cost prior to modification to the system after the microgrid system with energy storage and peak
shaving was installed. The following is a sample of the data taken from one meter/logger
combination.

ESTCP Final Report:
EW 201140 53 April 2014
Table 5-1 Fort Bliss EPDF Backup Circuit Sample Data
# Date Time, GMT-06:00
Ah, Ah
Energy, Wh
VARh,VARh
VAR, VAR
VA,VA Volts,
V
Power Factor,
PF
Power, W
Amps, A
1 8/10/2011 4:20 3.38 896 278 16680 56288.2 277.6 0.955 53760 202.8
2 8/10/2011 4:21 3.4 903 280 16800 56724.9 278.1 0.955 54180 204
3 8/10/2011 4:22 3.3 870 283 16980 54892.3 277.2 0.951 52200 198
4 8/10/2011 4:23 3.41 909 270 16200 56895.1 278.1 0.959 54540 204.6
In this example, the time/date stamp shows that data were read every minute. In the actual
installation data are read every 15 minutes. The first three pieces of data here (Ah, Energy,
VARh) are the raw data from the meter, which are then translated into the other more readable
parameters (VAR, VA, Volts, etc.). These values have been used in the analysis. The data is
taken on the three phase, Line-to-Line 480VAC system. The logger combines the individual
phase values into one overall value. Therefore individual phase data is unavailable from this
system.
This data was collected automatically by the system described above. The data logger can store
more than 4,000,000 measurements. The data was manually download from the 11 loggers
approximately once per quarter for reporting purposes. The data was collected with a personal
computer with manufacturer supplied software called HOBOware™ which was then imported
into a Microsoft® Excel spreadsheet.
5.5.2 Sampling Protocol for Data in the Microgrid Control System (MCS)
The data aggregated in the MCS was collected from the distributed controllers. Some of the
distributed controllers are sampling power data at a sub-millisecond rates however the MCS
polls the distributed controllers at a slower rate on the order of once per second. The devices that
are polled by the MCS are the PLC, the ESS inverters, the generator controller, the solar PV
inverter, and the protective relay. The distributed controllers use combinations of current
transformers and electronics to calculate the current, voltage and other power related
measurements.
OPC Server software on the MCS is configured to read/write a list of tags (a.k.a., data points)
which map to specific Modbus registers on the distributed controllers. The live data on the OPC
Server is read by the optimization algorithms and the historian. The historian is built using
National Instruments LabVIEW Data logging and Supervisory Control (DSC) Module. It stores
device telemetry in a specialized time-series database called Citadel 5. The Citadel database can
be accessed via a standard ODBC connection similar to a SQL database; its data can also be
viewed directly on the MCS servers using the National Instruments Measurement and
Automation Explorer (MAX) application.

ESTCP Final Report:
EW 201140 54 April 2014
Figure 5-24 National Instruments MAX Screenshot
Using MAX an engineer can plot all the telemetry trend data recorded by the historian and export
it to Comma Separated Value (CSV) format as needed. As funding has allowed, periodic visits
were made by Lockheed Martin personnel to visit the EPDF Microgrid to copy the historian
database on each server and bring it back to Lockheed Martin’s MDC for data analysis and
report generation.
5.6 SAMPLING RESULTS
The data collected by the baseline data acquisition system, composed of the Onset energy meters
and associated data loggers, has been summarized in section 5.5.
Although 15 minute interval data was sufficient for baseline characterization, the bulk of the
analysis has been carried out with the MCS historian data recorded at one second intervals. Each
historian recorded roughly 2GB worth of data for the period of performance. The entire 4GB of
raw data is too large and cumbersome to place in an appendix of this report; however, portions of
the historian data were extracted from its native data format to CSV files for sampling purposes,
and finally processed with Microsoft® Excel to generate graphs and tables.
A few of the main data points considered in the analysis are shown at varying levels of fidelity,
as the viewing tool allows for a customized extraction interval for the data. For example, taking
a look at the import power for the facility, a view of 1 second data for the entire duration of the
demonstration would be unwieldy (Microsoft® Excel can only plot up to 1,048,576 rows),
whereas if the data is extracted on 10-minute intervals instead, the data becomes convenient
enough to work within a spreadsheet. Analysis and discussion of the graphs and tables are
provided in the performance assessment section.

ESTCP Final Report:
EW 201140 55 April 2014
Figure 5-25 Peak Shaving Example
An additional load switches on
for approximately 33 seconds,
then
the MCS Turns Generator ON, then OFF
after Load Removed

ESTCP Final Report:
EW 201140 56 April 2014
Figure 5-26 Peak Shaving During Summer Months

ESTCP Final Report:
EW 201140 57 April 2014
Figure 5-27 Grid State Transition Examples
Figure 5-28 System Bus Voltage and Frequency
Note: No notable voltage or frequency excursions.
PV Inverter output turned off for 5 minutes
per UL1741 after loss of Utility Power
The maximum PV Inverter output during islanding is
automatically adjusted so that there is at least a 20kW load on the generator – preventing the generator from being back fed by
the PV Inverter which may destabilize the grid.

ESTCP Final Report:
EW 201140 58 April 2014
Figure 5-29 Facility Import Power
Figure 5-30 Power Factor
Figure 5-31 Baseline Measurements of Power Factor at EPDF

ESTCP Final Report:
EW 201140 59 April 2014
Seconds
Vo
lts
(AC
)
Figure 5-32 High Speed Waveform Capture During Utility Interruption Event

ESTCP Final Report:
EW 201140 60 April 2014
Figure 5-33 Renewable Smoothing During Daylight Hours

ESTCP Final Report:
EW 201140 61 April 2014
0
20
40
60
80
100
120
0.88
0.89
0.9
0.91
0.92
0.93
0.94
0.95
0.96
0.97
0.98
0.99
1
7/29/13 7/30/13 7/31/13 8/1/13 8/2/13 8/3/13
ESS
Rea
ctiv
e O
utp
ut
(kV
AR
)
Po
wer
Fac
tor
TIME (6 Day Period)
Power Factor Improvement (7/29/13 to 8/3/13)
Power Factor
ESS Reactive Output (kVAR)
Figure 5-34 Power Factor Improvement for a Sample Period

ESTCP Final Report:
EW 201140 62 April 2014
Figure 5-35 Electricity Arbitrage for a Sample Week
Table 5-2 Daily Energy Arbitraged (6/2/13 to 6/8/13)
Day 2-Jun 3-Jun 4-Jun 5-Jun 6-Jun 7-Jun 8-Jun
Total ESS Energy Output From Noon to 2PM (kWh)
21.07714 22.71578 21.54918 22.03387 22.39774 20.55005 19.15556

ESTCP Final Report:
EW 201140 63 April 2014
Figure 5-36 Electricity Arbitrage for a Sample Day

ESTCP Final Report:
EW 201140 64 April 2014
6.0 PERFORMANCE ASSESSMENT
6.1 REDUCE FACILITY ENERGY USAGE
In order to measure the success of this objective, the imported real power from the utility was
extracted from the historian data and the data set was examined to make sure the real power
import did not rise above 274.5kW (10% less than the 305kW peak measurements provided by
DPW). The extracted data was taken at 15 minute intervals to give a dataset slightly less erratic
than 1 second data appeared. See Figure 5-26 for detailed import power data and the objective
import maximum in red during the summer months (2013). The maximum demand recorded in
the 15-min interval data was 261 kW (8/27/13 at 12:55PM) representing a 14.4% reduction in
peak demand for the summer.
It must be noted that the 1-second data did indicate very short-term excursions above 275 kW of
import, and this is to be expected. The use of a diesel generator, which requires some small
amount of time to warm up dependent on size, and the nature of the loads on the dining facility,
which spike up values as high as 70 kW and disappear just as suddenly a short time later,
contribute to a built-in latency that causes the instantaneous import power to exceed the desired
limit temporarily until the system can respond. For future studies, the same peak shaving would
be more responsive if done with the energy storage system. The intent of this demonstration was
not to use the energy storage system for peak shaving since it was already tasked with the
electricity arbitrage function, as well as the renewable energy smoothing function.
Additional system monitoring over a longer period of time would facilitate improving the peak
shaving function system parameters. With the data collected, the peak shaving function
successfully demonstrated the ability of the microgrid to determine import levels approaching a
limit and adjusting the system accordingly.
6.2 REDUCE FUEL USAGE AND GHG EMISSIONS OF BACKUP GENERATORS
DURING GRID INDEPENDENT OPERATIONS
The goal with this objective was to demonstrate the capability of the microgrid to incorporate a
greater fraction of renewable energy, in this case solar, in an islanded configuration. The
baseline configuration utilized the generator and 20% of the existing PV array to feed only the
critical load circuits. This amounted to a maximum of 20kW of solar (calculation based on
theoretical maximum output of solar inverter). As can be seen from Figure 5-27, during the most
comprehensive islanding event, the MCS pushed the output of the solar up to 35 kW of output.
By offsetting the generator’s load by an additional 15kW above the baseline configuration solar
output, the goal of 20% fuel use and greenhouse gas reduction was exceeded.
As discussed in the following section, modifications had to be made to the load shedding scheme
during installation, and these modifications led to a larger load on the island than in the baseline
configuration. However, even when the additional load is taken into account, the microgrid was
successful at reducing the generator fuel consumption and greenhouse gas emissions.

ESTCP Final Report:
EW 201140 65 April 2014
6.3 INCREASE POWER AVAILABILITY DURING GRID INDEPENDENT
OPERATIONS
A related objective was to show the ability to add more loads and extend the mission of the
facility during periods of time in which the grid is unavailable. There were some modifications
that had to be made to the original plan in the field due to equipment limitations. It was not
possible for motor operators to fit on all of the feeder breakers, so not all of the loads could be
shed in the islanded configuration. This resulted in additional loads placed on the islanded
configuration than the design for the baseline configuration. The critical load circuit, during
daylight hours, fluctuated between roughly 30-50 kW. In the islanded scenario presented above
in Figure 5-27, island load never falls below 50kW and even rises to ~80 kW. This additional
load placed on the bus substantially surpassed 20% of the baseline average of 30-50 kW.
6.4 ENERGY SURETY
This objective demonstrated the ability of the microgrid to provide a reliable source of power in
all conditions, specifically in the scenario where the grid becomes unavailable. The test for this
was carried out by disconnecting the facility distribution transformer from the distribution loop.
Also, high speed waveform capture was performed in Lockheed’s Microgrid Development
Center (MDC) prior to deployment to the field. These MDC results have been included as an
example, but as high speed data was not captured at the EPDF Microgrid due to lack of proper
instrumentation. Historian data from the MCS Servers were captured, as shown in Figure 5-27.
From the high speed data captured in the MDC shown in Figure 5-32, it can be seen that the
delay between loss of utility and stable bus voltage is about 2 electrical cycles
(33.3ms). According to the data shown, this objective was successfully demonstrated.
6.5 SYSTEM ECONOMICS
The system economics performance objective was to demonstrate the economic advantages of
having a microgrid versus a conventional system configuration. The Savings to Investment
Ratio, using the BLCC methodology was used as the performance metric since this is the key
metric by which energy projects are considered for DoD infrastructure project funding. The
success criteria of reaching a Savings-to-Investment Ratio (SIR) greater than 1.5 when
extrapolated to a full BCT was achieved. Section 7.0 provides more detail.
6.6 POWER QUALITY ASSESSMENT
This objective demonstrated the microgrid’s ability to maintain visualization of the system state
at all times. By closely monitoring all critical electrical parameters of the electrical system, the
microgrid can be prepared to take whatever action is necessary to stabilize the system following
any disturbances. In the four hour morning sample data collected, there were no drastic voltage
or frequency fluctuations from the grid (refer to Figure 5-28) with consistent real and reactive
power (Figure 5-29), and stable Power Factor (Figure 5-30). Data points were captured at a 1Hz
rate: system voltage per phase, system frequency, and real power/reactive power and power
factor as measured from the main circuit breaker to the utility.

ESTCP Final Report:
EW 201140 66 April 2014
6.7 REDUCTION OF TRANSIENT POWER FLOW CAUSED BY RENEWABLE
ENERGY
The goal of this objective was to demonstrate the EPDF Microgrid’s capability to smooth out
short-term transients caused by rapidly fluctuating renewable energy sources. A good example is
the sudden occlusion of a large PV array on a sunny day. The output of the array may drop as
much as 80% or higher of its capacity in a few seconds. The corresponding rise in demand from
the utility can be very problematic in situations where the renewable resource capacity is a large
fraction of the local load demand.
As illustrated in Figure 5-33, the microgrid responds instantly to the drop in PV output power to
compensate. This example also shows that although the algorithm was successful at rapidly
detecting the roll off of solar production and ramping up the energy storage system to
compensate, the power levels of the response do not coincide with the amount of the drop due to
a misapplied scale factor. The renewable smoothing function worked as designed at Lockheed
Martin’s MDC.
6.8 POWER FACTOR IMPROVEMENT
This objective demonstrated the ability to correct the power factor of the microgrid with the
ESS. Prior to installation of the microgrid the baseline measurements in Figure 5-31 show that
the EPDF’s power factor drops to 0.6 during noon on weekdays corresponding to peak real
power generation from the solar PV system. On weekends, the EPDF Microgrid’s power factor is
worse, it drops to 0.2.
The rate structure of the base includes a power factor penalty for poor power factors Monday
through Friday between 5AM and 8PM. The MCS targeted those times for power factor
correction. As long as the site does not fall below a power factor of 0.9, no penalty is
incurred. As can be seen from the representative week in Figure 5-34, this objective was
successfully demonstrated. An important note to consider is how the utility calculates the power
factor to apply to the penalty. In this case, the power factor was averaged over a rolling time
period and the worst average power factor calculate during the relevant period of time is used to
determine the magnitude of the penalty. This integrating function allows the end user to tolerate
brief excursions below the limit as long as the system corrects quickly and maintains acceptable
levels for the majority of the time.
The inverter reactive power outputs are graphed along with the power factor to show the
correlation between the energy storage reactive power production and the power factor
improvement. An important consideration for planning high penetration levels of renewable
resources is that by offsetting real power requirements and ignoring the corresponding reactive
power requirements, a site energy manager may save some money on the demand charges
(which measures only real power), but also lose money by having power factor penalties applied
to the billing. As the penetration levels of renewable resources continue to increase, it is to be
expected that the utility providers will negotiate higher power factor penalties to compensate.
This will make the power factor issue more important going forward.

ESTCP Final Report:
EW 201140 67 April 2014
6.9 ELECTRICITY ARBITRAGE
The arbitrage objective is a straight forward exercise in energy storage system scheduling, as
shown by Figure 5-35. Figure 5-36 provides a zoomed in view of a single day where one can see
the ESS charging from 11PM to 4AM and discharging from 12PM to 2PM. The existing base
rate schedule includes a demand charge component that applies to the typically high-demand
summer months between 12PM and 6PM. By providing a set amount of energy from the energy
storage system during this time, the microgrid allows the operator to offset some of the load
demand. This will save the operator money by essentially buying inexpensive energy during the
night time hours and using it during the peak charge hours. Power output from the ESS was
summed up during the hours of 12PM to 2PM to calculate the amount of energy arbitraged for
each day and the results are show in Table 5-2. The average value of energy per day supplied by
the EPDF Microgrid in this case is 21.35 kWh, exceeding the goal of the objective.
One important consideration for energy managers is the cost of maintenance and replacement of
the energy storage technology. They need to determine if the system can save more money than
it costs to operate. This can be complicated if the system performs more than one function, as in
the case of the EPDF Microgrid.
6.10 IMPACT OF PV AND RESULTING POWER FACTOR
Though not part of the EPDF Microgrid performance assessment, it is worthy to examine the
impact of relatively high penetration of PV behind the meter on the utility power factor
adjustment charges. As seen in the demonstration site PV system, PV systems installed behind
the meter typically use commercial PV inverters that export only real power when behind the
meter loads typically require both real and reactive power to operate. This drives the power
factor rating lower and requires the utility power provider to compensate by delivering more
reactive power. Utility power providers charge for this service in the form of a utility power
factor adjustment charges. We found the power factor measured at the EPDF would drop below
0.9 and worst case could drop to almost zero. See Figure 5-31 Baseline Measurements of Power
Factor at EPDF. The ability to actively manage power factor with energy storage was
demonstrated with this project. During demonstration, the energy storage compensated for the
PV inverters by injecting dynamic reactive power to maintain a power factor for the EPDF
Microgrid above 0.9.
Other non-energy storage solutions for overcoming power factor adjustment charges could
include passive capacitor banks and synchronous condensers. Upon implementation, capacitor
banks would need to constantly be switched in causing some life cycle concerns, while
synchronous condensers are generator based and typically used in environments not sensitive to
cost. The Energy Storage solution provides a dynamic reactive power injection in which the
operation cycle is only limited to inverter and energy storage cycle life.

ESTCP Final Report:
EW 201140 68 April 2014
7.0 COST ASSESSMENT
The cost elements of the microgrid captured during the demonstration were put into a Building
Life Cycle Cost analysis tool using the methods in NIST Handbook 135 (1,2)
. The economic
benefits from energy security or providing ancillary services to a utility were not included in the
results. The National Renewable Energy Laboratory (NREL) Customer Damage Function (CDF)
methodology was considered to attempt to capture the economic benefit gained from the energy
security attributes of the EPDF Microgrid; however, a CDF survey was not available during this
contract’s period of performance.
7.1 COST MODEL
A site survey was performed to collect the electricity rate schedules and obtain the 1-line
electrical schematic of the site. This data was used to form a Building Life-Cycle Cost (BLCC)
assessment to determine a Savings-to-Investment Ratio (SIR) and simple payback; key variables
used when rating potential DoD energy infrastructure projects. Available manufacturer data,
DOE’s PVWatts application, and Lockheed Martin modeling and simulation platforms were used
for penetration levels of solar PV energy, energy storage, and the onsite generation.
7.2 COST DRIVERS
The cost model assumptions needed to extrapolate the ESTCP demo to a full-scale cost
assessment, such as BCT loads, capital and operational costs of microgrid components were
evaluated during the demonstration. Table 7-1 presents some of the cost elements that were
tracked, estimated, and normalized in order to extrapolate to a full BCT complex.

ESTCP Final Report:
EW 201140 69 April 2014
Table 7-1 Cost Model for the Intelligent Microgrid Solution
Cost Element Data Tracked During the
Demonstration Cost Estimate
Hardware Capital Costs
Estimate of Major Equipment Cost including solar retrofits, Genset retrofits, new energy storage, new switchgear, and new controls.
PV Retrofit = $50/kW (limited inverter mods) Genset Retrofit = $60/kW (mod for grid-tie)
Energy Storage = $700/kWh (lead-acid system; Advanced solution estimate $400/kWh)
Switchgear = $100/kW of load served Controls = $20/kW of controlled loads/sources
Installation Costs
Estimate of Labor and material Design and installation accounts for 16% of costs
Consumables Estimates based on rate of consumable use during demo
$500 annually (ESTCP demo fuel and electricity costs)
Facility Operational Costs
Reduction in energy costs vs. baseline data
$9,500 in savings annually vs. baseline (ESTCP demo scale project)
Maintenance Frequency of maintenance; labor and material cost per maintenance action
1 trip per year estimated at $2500
Hardware Lifetime
Estimate based on components degradation during demonstration
20 years for industrial electrical equipment and electronics was estimated. Lead acid energy storage estimated less than 10 yrs as used in
ESTCP demo. Advanced grid-scale storage technologies estimated 20 year life.
Operator Training
Estimate of training costs. 2 days of training plus materials
$5,000
Salvage Value Estimate of end-of-life value less removal costs
Minimal
7.2.1 Electric Utility Costs
Fort Bliss purchases electricity from El Paso Electric. Detailed electricity rate schedules from El
Paso Electric with an effective date of July 2010 were used in the analysis. The complex rate
structure includes (as found in El Paso Electric’s Schedules 31, 38, 95 and 98) (21)
:
A Fixed Customer Charge of $500 /mo.
A Demand Charge of $16.78 per kW per month, where Maximum demand is defined as the
highest measured 30 minute average kW demand not less than 15,000 kW or less than 65%
of the highest measured demand in the last 12 month period.

ESTCP Final Report:
EW 201140 70 April 2014
A Power Factor Adjustment is added to the Demand Charge if the PF falls below 0.9 lagging
anytime during the 30 minute peak interval, where the Adjustment = ((KW x 0.95/PF) – KW)
x DC
An Energy Charge for On-Peak of $0.14335/kWh and Off-Peak of $0.00527/kWh, where on-
peak is defined as the time from 12 PM to 6 PM MDT, Monday through Friday for the
months of June through September. A military discount factor of 20% is additionally applied
these rates, in addition to a Fixed Fuel Factor of $0.029/kWh.
7.2.2 Generator Costs
The onsite back-up generation set (a.k.a., Genset) used during the demonstration was diesel-
fueled. The Genset was modified for grid-tied operation at a normalized cost of ~$60/kW. Gas
fueled Gensets, rather than diesel, are preferred for economic reasons. Although conversion of
diesel Gensets to dual-fuel or gas is possible, it was not within the scope of this project to
perform the modification. For extrapolated EPDF Microgrid cost analysis, a new gas-fed
Genset, intended for extended operation, was used. Extended use generation with both voltage
and current control was determined to be $1500/kW. This is above the $700-$1000/kW cost of
back-up only generation available commercially. Section 7.3 covers sizing rationale.
7.2.3 Solar PV Costs
This demonstration took advantage of an existing solar array. Future microgrid implementations
can expect installed solar PV costs less than $3/W. Existing PV installations that used inverters
with maximum power point tracking (MPPT) grid-tied inverters will require replacement or
modification to allow for substantial use in islanded microgrid configurations. Modification of
inverters to accept current control was determined to be $50/kW of inversion. It should be stated
that not all grid-tied inverters can be modified to allow for current control (see Section 5.3.1.5).
7.2.4 Energy Storage Costs
Energy Storage for facilities is rapidly evolving and pricing ($/kW and $/kWh) varies between
technologies and capabilities. Prices are coming down as companies focus on MW size energy
storage and production volumes increase. Extensive review of both currently available and near-
term advanced solutions indicate nominal costs falling from an average of $700/kWh to
$400/kWh while lifetime expands from less than 1000 deep discharge cycling to greater than
4500 cycles. Section 7.3 covers sizing rationale.
7.2.5 Switchgear Costs
Switches and protection at the microgrid interconnection with the grid as well as switches
necessary for load management consist of a broad collection of devices at different voltage and
current service ratings. Based on the survey of equipment necessary for this ESTCP
demonstration and use in larger BCT Microgrid applications, the cost was determined to be $100
per kW of load served on average.

ESTCP Final Report:
EW 201140 71 April 2014
7.2.6 Monitoring and Control Costs
The combination of equipment and software necessary for microgrid monitoring and control
including central servers, distributed discrete logic hardware, sensors, communications and
associated software is site specific and affected by the number of nodes, compatibility of existing
hardware, and accessibility of existing networks. The data gathered on these costs was
normalized to the total amount (kW) of loads and sources controlled by the microgrid. This was
determined to be $20/kW on average.
7.3 COST ANALYSIS AND COMPARISON
To explain the lifecycle cost benefits of a microgrid installed to serve a full-scale BCT complex,
the costs associated with designing, procuring, and installing the necessary generation, energy
storage, switchgear, monitoring and controls was estimated based on insights from the sub-scale
ESTCP demonstration as well as a survey of costs at larger scales needed for a BCT complex.
These cost drivers were described in Section 7.2. In order to extrapolate the electricity costs and
benefits captured at a full BCT complex, detailed energy usage of Ft Bliss was obtained and
scaled to the peak load (4.5MW) and annual energy usage (18.2GWh) of a BCT complex located
at Ft Bliss as defined in the US Army Engineer Research & Development Center’s (ERDC)
technical paper, “Towards a Net Zero Building Cluster Energy Systems Analysis for a Brigade
Combat Team Complex” (Zhivov et al, 2010). (24)
Figure 7-1 Load profile of a Ft Bliss BCT complex over a year (Zhivov, 2010)

ESTCP Final Report:
EW 201140 72 April 2014
Figure 7-1 shows a broad peak load growing above a base load threshold between 2500 and 3000
kW in the 3rd
month and falling below the same threshold prior to the last 2 months of a given
year. The on-peak energy pricing period of June through September (~3500 hrs to 7500 hrs)
clearly corresponds to the peak energy intensity of the BCT modeled by ERDC. To determine
the optimal peak shaving and energy arbitrage capacity design point to use for the BLCC
analysis of the EPDF Microgrid it was useful to analyze the duration a BCT spends above a
given load annually. Figure 7-2 shows the duration spent at a specific BCT load over a year. The
data shows a clear knee in the curve between 2500 and 3000 kW which corresponds closely with
hourly BCT electrical load modeled by ERDC as shown in Figure 7-1. This provides rationale
for the combined peak shaving capacity of 2000 kW provided by energy storage and gas
generation assets in a full BCT complex. The 2000 kW also covers the combined 1800 kW of
critical and essential loads estimated in Table 2-1. The capacity is evenly split between energy
storage and onsite generation to maintain a redundant capability to serve critical loads in an
islanded configuration.
Figure 7-2 Duration at a given Ft Bliss BCT load annually
Figure 7-3 integrates the data in Figure 7-2 and normalizes to 24 hours to show the daily duration
spent at and above a given BCT load averaged over an entire year and averaged over the peak
energy intensity period between June and September. This figure illustrates the rationale for the
energy storage runtime design point used in the BLCC analysis. To ensure the energy storage
asset can provide its contribution to the demand reduction through peak shaving over the entire
The data shows a clear knee in the
curve between 2500 and 3000 kW

ESTCP Final Report:
EW 201140 73 April 2014
year it can be seen that 6 hours is the daily duration spent above the knee in the demand curve at
Ft Bliss of ~2750 kW as originally shown in Figure 7-2. A runtime of 6 hours also allows the
energy storage asset to discharge its capacity within the 6 hour window defined by El Paso
Electric’s on peak energy pricing period of 12-6 pm in the months of June through September.
Figure 7-3 Daily Duration at or above a given Ft Bliss BCT load
The design points of 1000 kW of onsite gas generation, energy storage with 6 hours of runtime at
1000 kW, along with allocation of the normalized cost drivers defined in Table 7-1 results in an
SIR of 1.51 and a payback of 8.89 years when using the NIST BLCC cost analysis methodology.
This exceeds the success criteria defined at the beginning of the project for the system economics
performance objective.
It should be noted that the SIR is most sensitive to energy storage costs. An SIR of 1.51 occurs
with an energy storage cost assumption of $400/kWh. If energy storage costs of $800/kWh are
assumed, typical of today’s energy storage options, the SIR falls below 1.0. While energy
storage is critical to the energy security functions of a microgrid, the impact of energy storage
costs on a microgrid’s economic benefits should not be underestimated. Availability of energy
storage solutions that provide 20 years of durability at prices less than $400/kWh is critical to the
success of microgrids.
The data is averaged over both an
entire year and peak months of June
through September. For example, a
BCT’s load exceeds 3500 kW for 2
hours a day when averaged over an
entire year, and ~5 hours a day when
averaged over the peak months of
June through September

ESTCP Final Report:
EW 201140 74 April 2014
Figure 7-4 Power Factor impact on the Demand Charge for Ft. Bliss monthly electric bill
Additionally, energy storage provides power factor correction of the real power produced by
onsite renewable energy. The economic benefit is created by reducing the power factor penalties
imposed by the utility for power factors below 0.9. With essentially no onsite renewable energy
in 2010, Ft Bliss had a minimum power factor of 0.902 resulting in no penalty. However, as can
be seen in Figure 5-31, power factor seen by the utility with renewable penetration of ~30% in
the case of the EPDF Microgrid site, can be as low as 0.6. This can be even lower during periods
of low daytime loads, such as the weekends in the case of the EPDF Microgrid at BCT-1 Ft
Bliss. This will occur as Ft Bliss progresses towards achieving NetZero Energy goals. Capacitor
banks can be installed to improve power factor, but at an installed cost of ~$50 per kVAR of
reactive power. Because low power factor occurs during peak renewable source output, which
also corresponds to peak demand, the energy storage power electronics, sized to provide critical
and essential apparent power needs, can be used concurrently to provide the necessary reactive
power during the peak renewable output events. This is because the energy storage asset will not
be needed to provide peak shaving during times when renewable energy output is at its highest.
The savings not only includes the cost avoidance of a capacitor bank, but also the avoidance of
~10-12% increase in the electric bill due to power factor penalties associated with high
penetration of renewables (see Figure 7-4).

ESTCP Final Report:
EW 201140 75 April 2014
8.0 IMPLEMENTATION ISSUES
Retrofitting of existing generators proved to be very challenging. Generators at the time of
installation are either installed as a standalone backup generator or a paralleling generator. The
electrical designs are unique to each type of generator installation. For example the controls for
a standalone generator are much simpler than the controls for a parallel generator; most
standalone generator controls are only concerned with system voltage and system frequency.
Paralleling generators on the other hand have to consider real and reactive power as well as
system voltage and frequency. Synchronization of the generator circuit breaker is a time critical
operation where the generator controls must close the breaker only when both sides of the bus
are synchronized. Generator protection is correspondingly much more complicated for
paralleling generators. Generator grounding schemes are also different between paralleling
generators and backup generators. The LM team developed a hybrid grounding system suitable
for both types of generators installations. It is worthy to note that emergency backup generators
do not have a restricted run time when utilized in such a mode. However, when using them to
parallel with the utility, an air permit must be obtained for the unit from the relevant authority, in
this case from the Texas Commission on Environmental Quality. The process for obtaining this
permit must be started as early in the process as possible due to the length of time required.
Budget must also be considered.
Retrofitting of existing electrical infrastructure is a challenge; the existing switchboard was laid
out in such a manner that installation of all motor operators (to allow for load shedding) was
impossible without substantial rework of the switchboard or purchasing of a completely brand
new switchboard. The LM team installed as many motor operators as physically possible in the
existing switchboard such that load shed capability was maximized.
There are also inherent challenges integrating the multiple Distributed Energy Resources. One
major issue is the fact that the electrical bus always needs a master DER. While grid tied, the
utility is always the bus master, but when the microgrid islands, another source must be ready to
take over that function immediately. Furthermore, when the transition occurs and the generator
finally comes online, the master function passes to the generator in the EPDF Microgrid. The
handoff of that functionality between the energy storage system and the generator is a very high
speed, time critical event and requires a great deal of attention. The interfaces between DERs
have to be carefully coordinated, timed, and tested thoroughly to ensure no conflicts of authority.
Although not a major issue, separate data loggers were used to collect baseline data for the BCT
feeders since the DPW BOCC data collection did not have the resolution of individual feeders in
their energy measurements. As the Ft. Bliss power distribution is upgraded, more resolution
could be available in these measurements to support future energy projects.

ESTCP Final Report:
EW 201140 76 April 2014
9.0 REFERENCES
1. NIST Life-Cycle Costing Manual for the Federal Energy Management Program
(FEMP), Handbook 135.
2. NIST Building Lifecycle Cost Program, 5.3-10.
3. IEEE Guide for Design, Operation, and Integration of Distributed Resource Island
Systems with Electric Power Systems, IEEE 1547.4-2011, 20 July 2011.
4. IEEE Guide for Design, Operation, and Integration of Distributed Resource Island
Systems with Electric Power Systems, IEEE 1547-2003, 20 July 2011.
5. IEEE Draft Recommended Practice for Establishing Methods and Procedures that
Provide Supplemental Support for Implementation Strategies for Expanded Use of
IEEE Std 1547, IEEE 1547.8, Not yet released.
6. SERDP, ESTCP. Installation Energy Initiatives. s.l.: http://www.serdp.org/Featured-
Initiatives/Installation-Energy, 2011.
7. Department of Defense Energy Manager’s Handbook. s.l.: Office of Deputy Under
Secretary of Defense (ODUSD) Installations and Environment (I&E), 2005.
8. USACE Technical Manual Series TM 5-689 to TM 5-698, circa 2006, reference:
http://armypubs.army.mil/eng/
9. Department of Energy Microgrid Workshop Report, Office of Electricity Delivery and
Energy Reliability Smart Grid R&D Program, August 31, 2011. San Diego, CA.
http://energy.gov/sites/prod/files/Microgrid%20Workshop%20Report%20August%20
2011.pdf
10. US Census Bureau, http://blogs.census.gov/globalreach/2011/02/trade-deficit-increases-
to-498-billion-in-2010.html
11. Energy Policy Act of 2005 (EPAct05), H.R. 6, Pub. L. 109–58, is a bill passed by the
United States Congress on July 29, 2005, and signed into law by President George W.
Bush on August 8, 2005, at Sandia National Laboratories in Albuquerque, NM.
12. Executive Order 13423, Strengthening Federal Environmental, Energy, and
Transportation Management, was signed on January 24, 2007.
13. John Warner National Defense Authorization Act (NDAA) of 2007, H.R. 5122, Pub. L.
109-364, was a bill passed in the United States Congress on September 29, 2006 and
signed by President George W. Bush on October 17, 2006.
14. National Defense Authorization Act (NDAA) for Fiscal Year 2010 (H.R. 2647, Pub. L.
111–84, 123 Stat. 2190.) is a law in the United States signed by President Barack
Obama on October 28, 2009.
15. Executive Order 13514, Federal Leadership in Environmental, Energy, and Economic
Performance that U.S. President Barack Obama issued on October 5, 2009. This
executive order mandates that at least 15 percent of existing federal buildings and
leases meet Energy Efficiency Guiding Principles by 2015, and that annual progress

ESTCP Final Report:
EW 201140 77 April 2014
be made toward 100 percent conformance of all federal buildings, with a goal of
100% of all new federal buildings achieving zero-net-energy by 2030.
16. Energy Independence and Security Act of 2007 (EISA 2007) established energy
management goals and requirements while also amending portions of the National
Energy Conservation Policy Act (NECPA), signed into law on December 19, 2007.
17. Installation Management Campaign Plan (IMCP), Version 4.0, November 2011,
represents the combined strategy for the Installation Management Command
(IMCOM), the Office of the Assistant Chief of Staff for Installation Management
(OACSIM) and the Assistant Secretary of the Army (Installations, Energy and
Environment) (ASA (IE&E)).
18. Army Energy Security Implementation Strategy (AESIS) 2009, 13 Jan 2009, establishes
five strategic energy security goals and outlines a broad approach for accomplishing
them.
19. El Paso Electric Company Schedule No. 31 Military Reservation Service Rate, Docket
37690, July 30, 2010.
20. Rated power factor tests and installation acceptance of emergency and standby power
systems, Power topic, Iverson, Jim, 2006.
http://www.cumminspower.com/www/literature/technicalpapers/PT-6004-
PowerFactorTests-en.pdf
21. El Paso Electric’s Schedules 31, 38, 95 and 98 http://www.nmprc.state.nm.us/consumer-
relations/company-directory/electric/el-paso-electric/index.html
22. Unified Facilities Guide Specifications, Section 25 10 10 Utility Monitoring and Control
System (UMCS) Front End and Integration, May 2010.
http://www.wbdg.org/ccb/DOD/UFGS/UFGS%2025%2010%2010.pdf
23. Department of Defense Unified Facilities Criteria, LonWorks Utility Monitoring and
Control System, UFC3-401-01, 1 June 2011.
24. Towards a Net Zero Building Cluster Energy Systems Analysis for a Brigade Combat
Team Complex”, Alexander Zhivov, Richard J. Liesen, Franklin H. Holcomb, U.S.
Army Engineer Research & Development Center, Champaign, IL, Paper No. ES2010-
90487, pp. 1017-1030; 14 pages, May 17, 2010.

ESTCP Final Report:
EW 201140 78 April 2014
APPENDICES
Appendix A Points of Contact
POINT OF
CONTACT
Name
ORGANIZATION
Name
Address
Phone
Fax
Role in Project
Teri L. Hall
Lockheed Martin
MFC
P.O. Box 650003,
M/S: SP-85, Dallas,
Texas 75265-0003
1701 Marshall Drive
Grand Prairie, Texas
75051
972-603-2643
Principal
Investigator
Microgrid Enabled
Distributed Energy
Solution
Curtis H. Fischer
Lockheed Martin
MFC
P.O. Box 650003,
M/S: MM-99, Dallas,
Texas 75265-0003
1701 Marshall Drive
Grand Prairie, Texas
75051
972-603-3715
Co- Principal
Investigator
Microgrid Enabled
Distributed Energy
Solution
William L Wright
Lockheed Martin
MFC
P.O. Box 650003,
M/S: MM-99, Dallas,
Texas 75265-0003
1701 Marshall Drive
Grand Prairie, Texas
75051
972-603-9694
Lead Power
Engineer
Microgrid Enabled
Distributed Energy
Solution
Rajorshi “Roger”
Kar
Lockheed Martin
MFC
P.O. Box 650003,
M/S: MM-99, Dallas,
Texas 75265-0003
1701 Marshall Drive
Grand Prairie, Texas
75051
972-603-3844
Lead Software
Engineer
Microgrid Enabled
Distributed Energy
Solution
Brad Fiebig
Lockheed Martin
MFC
P.O. Box 650003,
M/S: MM-99, Dallas,
Texas 75265-0003
1701 Marshall Drive
Grand Prairie, Texas
75051
972-603-9019
Business
Development
Manager
Microgrid Enabled
Distributed Energy
Solution

ESTCP Final Report:
EW 201140 79 April 2014
POINT OF
CONTACT
Name
ORGANIZATION
Name
Address
Phone
Fax
Role in Project
Katie S. Speakes
Lockheed Martin
MFC
P.O. Box 650003,
M/S: MM-99, Dallas,
Texas 75265-0003
1701 Marshall Drive
Grand Prairie, Texas
75051
972-603-3181
Contracts Manager,
Microgrid Enabled
Distributed Energy
Solution
Benny J “BJ”
Tomlinson
Department of Public
Works
BLDG. 777 - Rm.
126
Fort Bliss, Texas
915-214-6906
Fort Bliss DPW
Renewable Energy
Project Manager
Donald E Vincent Jr
Department of Public
Works
BLDG. 777 - Rm.
126
Fort Bliss, Texas
915-568-5172
[email protected] Fort Bliss DPW
Dennis Wike
Department of Public
Works
Room 304, Bldg 777,
Pleasonton Road Fort
Bliss, TX 79916-
6816
Office 915-568-3278
Cell 816-807-4104
Fort Bliss DPW
OMD Resource
Efficiency Manager
PE, CEM, Leed-AP,
REM
Gene Curtiss
Department of Public
Works
BLDG. 777 - Rm.
126
Fort Bliss, Texas
915-568-6627
Energy Savings
Performance
Contracting BOCC
Program Manager
Robert Lopez
Department of Public
Works
BLDG. 777 - Rm.
126
Fort Bliss, Texas
915-568-7105
Fort Bliss DPW
Energy Manager
Harold Sanborn
US Army Corps of
Engineers,
Construction
Engineering Research
Laboratory
586-909-0600
Program Manager,
Energy Branch
Melanie Johnson
US Army Corps of
Engineers,
Construction
Engineering Research
Laboratory
217-373-5872
[email protected] Electrical Engineer

ESTCP Final Report:
EW 201140 80 April 2014
POINT OF
CONTACT
Name
ORGANIZATION
Name
Address
Phone
Fax
Role in Project
Mike Gomez
Pride Power
PO Box 31310,
El Paso, TX 79931
915-726-6618
High-voltage
Supervisor
Derek Williamson
Johnson Controls Inc.
4940 Corporate Drive
NW, Suite C,
Huntsville, AL
35805-6222
[email protected] Site Supervisor

ESTCP Final Report:
EW 201140 81 April 2014
Appendix B Action Items and Lockheed Martin Responses
1) In your Final and Cost & Performance Reports, include the following:
a. Provide narrative for a layman's guide to microgrids for military installations to
enable energy managers to understand critical issues and make prudent decisions.
Currently the US power grid is largely centralized with a handful of large utilities handling the
majority of power production in the country. In 1996, a sagging power line in Oregon brushed
up against a tree, and then within minutes, 12 million electricity customers in eight states lost
power. Such is the vulnerability of the aging US power grid. In order to remedy this systemic
risk from large scale blackouts a new more decentralized system can be used in which a cluster
of onsite power generation devices/assets can service local loads in the event of power loss from
the Utility. A microgrid is a localized set of generation, energy storage, and loads that normally
operate connected to a traditional utility grid. There is a single point of common coupling with
the utility grid that can be disconnected if the microgrid needs to be able to operate without
utility power in the event of utility failure.
The primary benefit of a microgrid is energy surety/resiliency/mission sustainment.
However there can be advantages in found in energy cost savings depending on one’s electric
rate structure. Energy Manager needs to fully understand their electric provider’s rate structure
and the load profile of their facilities in order to effectively design a microgrid to help in energy
costs. For instance if some utilities have time of use rates it may be beneficial to use energy
during non-peak hours and use that energy when peak hours. If your facility is arbitraging daily
it’s also important to know about your battery storage’s depth of discharge vs. cycle life.
b. Address the impact of relatively high penetration PV behind the meter and its
impact on the Utility’s Power Factor adjustment charge. Indicate whether a
capacitor bank or some other type of PF correction technology could be installed
behind the meter to mitigate low PF issues.
This project highlighted the impact of relatively high penetration of PV behind the meter on the
utility power factor adjustment charges. As seen in the demonstration site PV system, PV
systems installed behind the meter typically use commercial PV inverters that export only real
power when behind the meter loads typically require both real and reactive power to operate.
This drives the power factor rating lower and requires the utility power provider to compensate
by delivering more reactive power. Utility power providers charge for this service in the form of
a utility power factor adjustment charges. We found the power factor measured at the EPDF
would drop below 0.9 and worst case could drop to almost zero. See Figure 5-31 Baseline
Measurements of Power Factor at EPDF. The ability to actively manage power factor with
energy storage was demonstrated with this project. During demonstration, the energy storage
compensated for the PV inverters by injecting dynamic reactive power to maintain a power
factor for the EPDF Microgrid above 0.9.
Other non-energy storage solutions for overcoming power factor adjustment charges could
include passive capacitor banks and synchronous condensers. Upon implementation, capacitor
banks would need to constantly be switched in causing some life cycle concerns, while
synchronous condensers are generator based and typically used in environments not sensitive to

ESTCP Final Report:
EW 201140 82 April 2014
cost. The Energy storage solution provides a dynamic reactive power injection in which the
operation cycle is only limited to inverter and energy storage cycle life.
2) In your Final Report discuss:
a. How the microgrid also lengthens the availability of backup generators, if
applicable.
By being able to utilize all renewable resources to a much greater extent during an islanding
event, the microgrid can reduce base line load on the backup generator. When the loading on the
generator is reduced, the fuel consumption is correspondingly reduced. This, in turn, lengthens
the time of availability of the generator. With an appropriately sized energy storage system and
renewable resources, the microgrid could run the island indefinitely without using a generator.
When the generator is forced to run at a poor power factor, more fuel is consumed for the same
amount of power output. During Grid Independent mode, microgrid functions such as power
factor improvement help to improve the fuel efficiency of the backup generator thus lengthening
its availability (see this whitepaper by Cummins Power Generation:
http://www.cumminspower.com/www/literature/technicalpapers/PT-6004-PowerFactorTests-en.pdf
b. The technical nuances of electrical systems learned during the project, such as
inverter requirements, interfaces among components, etc.
Details provided in section 8.0 Implementation Issues.
c. The advantages and disadvantages of using diesel generators to shave peak load.
When considering what specific device to use for the purposes of peak shaving one must
consider the load profile. If there are known periodic peak loads then a slow reacting generator
would be ideal until more cost effective energy storage technologies come to market. For non-
periodic unpredictable peak loads a faster acting energy storage system can be justified.
d. How the IEEE 1547 interconnection standards impact the ability to operate the
microgrid/ PV in an islanded mode. Discuss arrangements made with the utility
serving the part of Fort Bliss hosting the microgrid.
The IEEE 1547 defines a framework under which to create an island. The standard puts
limitations on the connectivity between the utility and the island in terms of when to disconnect
for safety reasons. The limitations must be translated into parameters for the system under
consideration in terms of protection equipment. The microgrid houses the point of common
coupling (PCC) in the new switchboard. The PCC is monitored at all times by a protective relay
which is responsible for separating the island from the utility in case of an issue defined by the
standard.
As long as the PCC is designed in accordance with the standard and meets all of the required
safety limitations, the system designer is free to architect the microgrid in any way they see fit.
One thing to consider in architecting the island is that most of the renewable energy inverters are
designed to meet the IEEE 1547 standard. This imposes unnecessary limitations on the
microgrid, as can be seen in the example of grid independent operations above. Notice the PV
inverter waits for some period of time before re-engaging and outputting power on the island.

ESTCP Final Report:
EW 201140 83 April 2014
This is one of the requirements of the IEEE 1547 standard, but in a standalone island, this is
unnecessary.
The project did not require additional coordination with the utility because the distribution
equipment is owned and operated by DPW at Ft Bliss. If that was not the case, then prior to the
start of construction one would need to ascertain the requirements for installing the onsite
generation to be parallel with the providing utility company and any distribution
operators/owners.
e. The factors impacting the battery storage requirement, such as the ability to
disable the HVAC during a grid outage until the generator is operational.
Energy storage system sizing must consider key energy security/reliability functions including
islanding of critical loads, renewable energy smoothing, and power factor improvement; as well
as economic functions such as energy arbitrage and peak shaving. As described in more detail in
Section 7.3, the energy storage sizing optimized for the EPDF Microgrid is impacted by the
electricity rate schedule defining demand charges and on-peak pricing, the load profile of the
BCT complex, and the portion of a BCT’s loads that are critical. In the case of a BCT complex,
the critical loads are estimated to be 1 MW which defines the necessary energy storage power
rating. To ensure the energy storage asset can provide its contribution to the demand reduction
through peak shaving over the entire year, a runtime of 6 hours is required based on the daily
duration the BCT’s loads spent above the demand reduction target, as shown in Figure 7-3. A
runtime of 6 hours also allows the energy storage asset to discharge its capacity within the 6 hour
window defined by El Paso Electric’s on-peak energy pricing period of 12-6 pm in the months of
June through September. The energy storage attributes defined above affect the selection criteria
for the chemistry. In this case, chemistry optimized for long duration discharge, long cycle life at
deep depth of discharge, and a low energy cost ($/kWh) is optimal.