final report - defense technical information center · final report combined heat & power using...
TRANSCRIPT

FINAL REPORT Combined Heat & Power Using the Infinia Concentrated Solar
CHP PowerDish System
ESTCP Project EW-201145
AUGUST 2013
David Townley Paul Gee Infinia Corporation

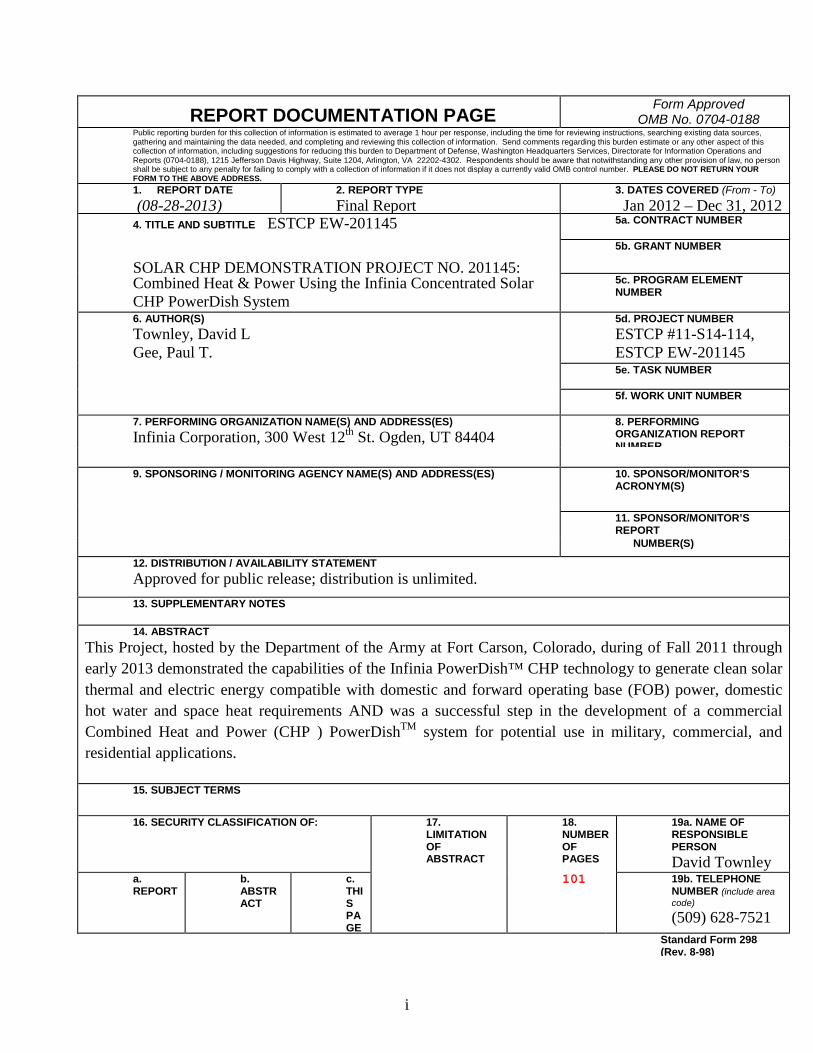
Report Documentation Page Form ApprovedOMB No. 0704-0188
Public reporting burden for the collection of information is estimated to average 1 hour per response, including the time for reviewing instructions, searching existing data sources, gathering andmaintaining the data needed, and completing and reviewing the collection of information. Send comments regarding this burden estimate or any other aspect of this collection of information,including suggestions for reducing this burden, to Washington Headquarters Services, Directorate for Information Operations and Reports, 1215 Jefferson Davis Highway, Suite 1204, ArlingtonVA 22202-4302. Respondents should be aware that notwithstanding any other provision of law, no person shall be subject to a penalty for failing to comply with a collection of information if itdoes not display a currently valid OMB control number.
1. REPORT DATE 28 AUG 2013 2. REPORT TYPE
3. DATES COVERED 00-01-2012 to 31-12-2012
4. TITLE AND SUBTITLE Combined Heat & Power Using the Infinia Concentrated Solar CHPPowerDish System
5a. CONTRACT NUMBER
5b. GRANT NUMBER
5c. PROGRAM ELEMENT NUMBER
6. AUTHOR(S) 5d. PROJECT NUMBER
5e. TASK NUMBER
5f. WORK UNIT NUMBER
7. PERFORMING ORGANIZATION NAME(S) AND ADDRESS(ES) Infinia Corporation,300 West 12th St.,Ogden,UT,84404
8. PERFORMING ORGANIZATIONREPORT NUMBER
9. SPONSORING/MONITORING AGENCY NAME(S) AND ADDRESS(ES) 10. SPONSOR/MONITOR’S ACRONYM(S)
11. SPONSOR/MONITOR’S REPORT NUMBER(S)
12. DISTRIBUTION/AVAILABILITY STATEMENT Approved for public release; distribution unlimited
13. SUPPLEMENTARY NOTES
14. ABSTRACT This Project, hosted by the Department of the Army at Fort Carson, Colorado, during of Fall 2011 throughearly 2013 demonstrated the capabilities of the Infinia PowerDish? CHP technology to generate clean solarthermal and electric energy compatible with domestic and forward operating base (FOB) power, domestichot water and space heat requirements AND was a successful step in the development of a commercialCombined Heat and Power (CHP ) PowerDishTM system for potential use in military, commercial, andresidential applications.
15. SUBJECT TERMS
16. SECURITY CLASSIFICATION OF: 17. LIMITATION OF ABSTRACT Same as
Report (SAR)
18. NUMBEROF PAGES
109
19a. NAME OFRESPONSIBLE PERSON
a. REPORT unclassified
b. ABSTRACT unclassified
c. THIS PAGE unclassified
Standard Form 298 (Rev. 8-98) Prescribed by ANSI Std Z39-18
i
REPORT DOCUMENTATION PAGE Form Approved
OMB No. 0704-0188 Public reporting burden for this collection of information is estimated to average 1 hour per response, including the time for reviewing instructions, searching existing data sources, gathering and maintaining the data needed, and completing and reviewing this collection of information. Send comments regarding this burden estimate or any other aspect of this collection of information, including suggestions for reducing this burden to Department of Defense, Washington Headquarters Services, Directorate for Information Operations and Reports (0704-0188), 1215 Jefferson Davis Highway, Suite 1204, Arlington, VA 22202-4302. Respondents should be aware that notwithstanding any other provision of law, no person shall be subject to any penalty for failing to comply with a collection of information if it does not display a currently valid OMB control number. PLEASE DO NOT RETURN YOUR FORM TO THE ABOVE ADDRESS. 1. REPORT DATE (08-28-2013)
2. REPORT TYPE Final Report
3. DATES COVERED (From - To) Jan 2012 – Dec 31, 2012
4. TITLE AND SUBTITLE ESTCP EW-201145
5a. CONTRACT NUMBER
SOLAR CHP DEMONSTRATION PROJECT NO. 201145:
5b. GRANT NUMBER
Combined Heat & Power Using the Infinia Concentrated Solar CHP PowerDish System
5c. PROGRAM ELEMENT NUMBER
6. AUTHOR(S) Townley, David L Gee, Paul T.
5d. PROJECT NUMBER ESTCP #11-S14-114, ESTCP EW-201145
5e. TASK NUMBER
5f. WORK UNIT NUMBER 7. PERFORMING ORGANIZATION NAME(S) AND ADDRESS(ES)
Infinia Corporation, 300 West 12th St. Ogden, UT 84404
8. PERFORMING ORGANIZATION REPORT NUMBER
9. SPONSORING / MONITORING AGENCY NAME(S) AND ADDRESS(ES) 10. SPONSOR/MONITOR’S ACRONYM(S)
11. SPONSOR/MONITOR’S
REPORT NUMBER(S) 12. DISTRIBUTION / AVAILABILITY STATEMENT Approved for public release; distribution is unlimited. 13. SUPPLEMENTARY NOTES 14. ABSTRACT
This Project, hosted by the Department of the Army at Fort Carson, Colorado, during of Fall 2011 through early 2013 demonstrated the capabilities of the Infinia PowerDish™ CHP technology to generate clean solar thermal and electric energy compatible with domestic and forward operating base (FOB) power, domestic hot water and space heat requirements AND was a successful step in the development of a commercial Combined Heat and Power (CHP ) PowerDishTM system for potential use in military, commercial, and residential applications.
15. SUBJECT TERMS
16. SECURITY CLASSIFICATION OF:
17. LIMITATION OF ABSTRACT
18. NUMBER OF PAGES
19a. NAME OF RESPONSIBLE PERSON David Townley a.
REPORT
b. ABSTRACT
c. THIS PAGE
101
19b. TELEPHONE NUMBER (include area code) (509) 628-7521 Standard Form 298
(Rev. 8-98)

ii
TABLE OF CONTENTS
EXECUTIVE SUMMARY 1
1.0 INTRODUCTION 6
1.1 BACKGROUND 6 1.2 OBJECTIVES OF THE DEMONSTRATION 7 1.3 REGULATORY DRIVERS 7
2.0 TECHNOLOGY DESCRIPTION 9 2.1 TECHNOLOGY OVERVIEW 9 2.2 ADVANTAGES AND LIMITATIONS OF THE TECHNOLOGY 15
3.0 SITE/FACILITY DESCRIPTION 18 3.1 SITE/FACILITY LOCATION, OPERATIONS, AND CONDITIONS 18 3.2 SITE/FACILITY IMPLEMENTATION CRITERIA 21 3.3 SITE-RELATED PERMITS AND REGULATIONS 22
4.0 TEST DESIGN AND ISSUE RESOLUTION 23 4.1 INITIAL CONCEPTUAL TEST DESIGN 23
4.2 BASELINECHARACTERIZATION 25 4.3 DESIGN AND LAYOUT OF TECHNOLOGY COMPONENTS 25 4.4 OPERATIONAL TESTING 33 4.5 SAMPLING PROTOCOL 33 4.6 EQUIPMENT CALIBRATION AND DATA QUALITY ISSUES 36
5.0 PERFORMANCE RESULTS 38 5.1 SUMMARY OF PERFORMANCE OBJECTIVES AND OUTCOMES 38 5.2 PERFORMANCE RESULTS DISCUSSION 41
6.0 COST ASSESSMENT 63 6.1 COST DRIVERS 64 6.2 COST ANALYSIS AND COMPARISON 68
7.0 IMPLEMENTATION ISSUES 71 7.1 PRE-DEMONSTRATION ISSUES 74 7.2 DEMONSTRATION PERIOD ISSUES 74
8.0 TECHNOLOGY TRANSFER 86 8.1 COMMERCIALIZATION AND IMPLEMENTATION 86 8.2 TRAINING REQUIREMENTS AND RESOURCES 87 8.3 DESIGN COMMUNITY IMPACTS 87

iii
APPENDICES APPENDIX A: PERFORMANCE ASSESSMENT METHODOLOGIES APPENDIX B: BUILDING LIFE CYCLE COST MODEL RESULTS APPENDIX C: MANAGEMENT AND STAFFING APPENDIX D: REFERENCES APPENDIX E: SECTION 6 NOTES, TOOLS, & SOURCE REFERENCES APPENDIX F: TEARDOWN REPORTS APPENDIX G: GRAPHICS OF BUILDING PERFORMANCE

iv
Acronyms & Abbreviations
BTEL – Building Thermal Energy Loop CHP - Combined Heat and Power CSP – Concentrated Solar Power DNI - Direct Normal Insolation DoD - Department of Defense DPW - Directorate of Public Works EO - Executive Orders FOB - Forward Operating Base FPSE - Free Piston Stirling Engine GHG - Greenhouse Gas ICC - International Code Council IMA - Installation Management Agency IEEE - Institute of Electrical and Electronics Engineers kW – Kilowatt kWhe – Kilowatt hour electric kWhth- Kilowatt hour thermal LCCA - Life Cycle Cost Analysis MBTF - Mean Time Before Failure NRL - National Renewable Energy Laboratory OI – Over Insolation PI - Principal Investigator PM - Project Manager POU – Point of Use ROI - Return on Investment RTD - Resistance Temperature Detector SAM - Solar Advisor Model SIR - Savings to Investment Ratio SPA - Solar Position Algorithm TES - Thermal Energy Storage TMY - Typical Meteorological Year
v
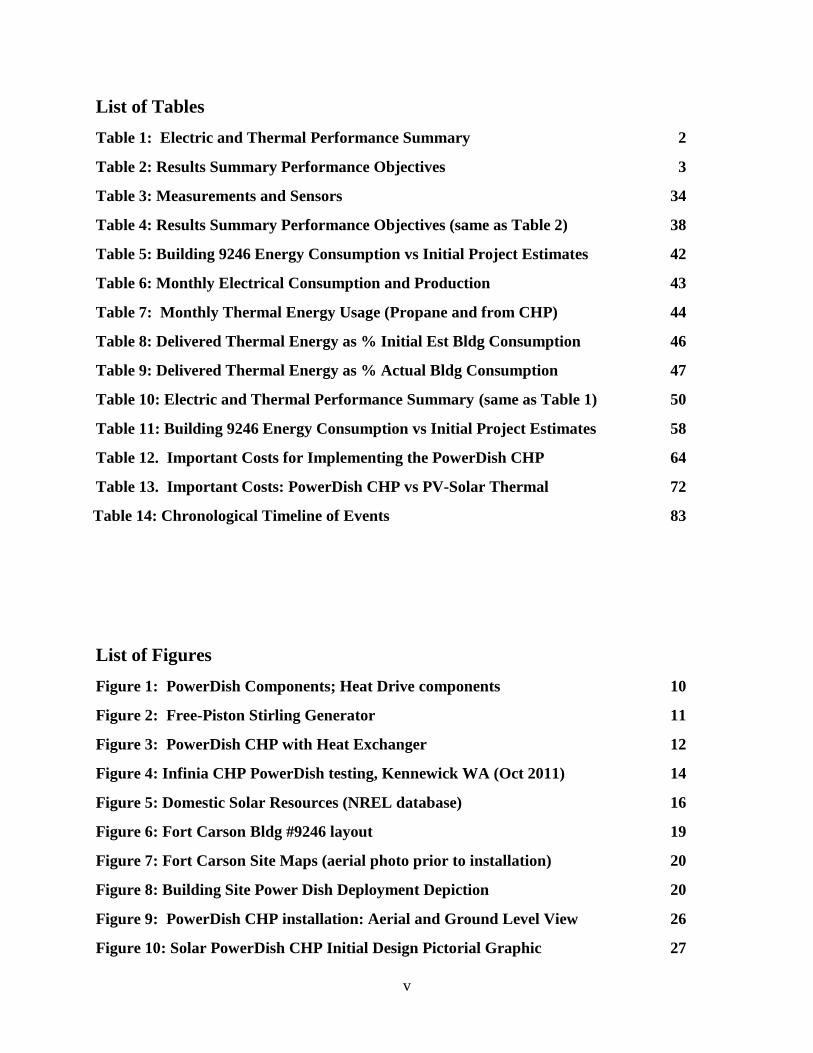
List of Tables Table 1: Electric and Thermal Performance Summary 2
Table 2: Results Summary Performance Objectives 3
Table 3: Measurements and Sensors 34
Table 4: Results Summary Performance Objectives (same as Table 2) 38
Table 5: Building 9246 Energy Consumption vs Initial Project Estimates 42
Table 6: Monthly Electrical Consumption and Production 43
Table 7: Monthly Thermal Energy Usage (Propane and from CHP) 44
Table 8: Delivered Thermal Energy as % Initial Est Bldg Consumption 46
Table 9: Delivered Thermal Energy as % Actual Bldg Consumption 47
Table 10: Electric and Thermal Performance Summary (same as Table 1) 50
Table 11: Building 9246 Energy Consumption vs Initial Project Estimates 58
Table 12. Important Costs for Implementing the PowerDish CHP 64
Table 13. Important Costs: PowerDish CHP vs PV-Solar Thermal 72
Table 14: Chronological Timeline of Events 83
List of Figures Figure 1: PowerDish Components; Heat Drive components 10
Figure 2: Free-Piston Stirling Generator 11
Figure 3: PowerDish CHP with Heat Exchanger 12
Figure 4: Infinia CHP PowerDish testing, Kennewick WA (Oct 2011) 14
Figure 5: Domestic Solar Resources (NREL database) 16
Figure 6: Fort Carson Bldg #9246 layout 19
Figure 7: Fort Carson Site Maps (aerial photo prior to installation) 20
Figure 8: Building Site Power Dish Deployment Depiction 20
Figure 9: PowerDish CHP installation: Aerial and Ground Level View 26
Figure 10: Solar PowerDish CHP Initial Design Pictorial Graphic 27

vi
Figure 11: PowerDish and Building Measurement Instrumentation P&ID 28
Figure 12: Building 9246 Radiant Heating and Hot Water Equipment 29
Figure 13: Coolant Flow and Temperature Sensors as installed 30
Figure 14: Energy Consumption Metering as installed 31
Figure 15: Solar PowerDish CHP Revised Design Pictorial Graphic 32 Figure 16: Monthly Electrical Consumption and Production 43
Figure 17: Monthly Building Thermal Energy Consumption & CHP Delivery 45
Figure 18: Effect of Tree Shade on Production 47
Figure 19: % Thermal Energy Delivered 52
Figure 20: OI (Over Insolation) 76
Figure 21: Heat Exchanger functionality and performance testing 77
Figure 22: Glycol temperature coming into the building 79
Figure 23: Storage tank temperature heating 80
Figure 24: System thermal dynamics with 20 C tank temp increase 80
Figure 25: Revised design system performance 81
Figure 26: Glyol Piping & Insulation between PowerDish and Building 82

vii
Acknowledgements Thanks to DOD-ESTCP for providing funding for this Project Significant Contributors: Infinia Corporation 300 West 12th Street 6811 W. Okanogan Place Ogden, Utah 84404 Kennewick, WA 99336 (801) 833-4561 (509) 737-2150 David Townley (PI) Paul Gee Albert Estrada Lauren Swanson Robert Kuykendahl Jason Modrell Aaron Erickson Vista Engineering Technologies 1355 Columbia Park Trail Richland, WA 99352 (509) 737-1377 KC Kuykendahl Milo Himes ABC Heating and Plumbing 707 East Fillmore Colorado Springs, CO 80907 (719)633-0208 Mark Bush Fort Carson and Fort Carson DPW Colorado Springs, CO (719) 526-2927 Vince Guthrie

1
EXECUTIVE SUMMARY OBJECTIVE AND TIME PERIOD OF THE DEMONSTRATION The Infinia PowerDish™ CHP (Combined Heat and Power) technology installation hosted by the Department of the Army at Fort Carson, Colorado was intended to demonstrate the capabilities of the Infinia PowerDish CHP technology to generate clean solar thermal and electric energy compatible with domestic and forward operating base (FOB) power, domestic hot water and space heat requirements. ESTCP Project 201145 demonstration/data collection period began January 17, 2012 and formally ended December 31, 2012. TECHNOLOGY DESCRIPTION The PowerDish CHP system is a modified Infinia PowerDish solar system. To make the PowerDish CHP system, a heat exchanger was added to the PowerDish (electric only) cooling loop system, and changes were made to the system controls to allow higher temperature cooling loop fluid to the heat exchanger. The liquid-to-liquid heat exchanger, mounted on the PowerDish heat drive, was also connected to a closed loop system that carried the heat transferred across the cooling loop heat exchanger (thermal energy in a liquid) to a near-by building where the thermal energy was used for space heating, water heating, and with any excess thermal energy was stored in a tank. This CHP technology and the building point-of-use (POU) hardware are discussed in more detail in the report. DEMONSTRATION RESULTS Over the test period of January 17, 2012 – December 31, 2012, the PowerDish CHP produced 4,315 kWh of electricity (kWhe) and produced 11,109.7 kWh of thermal energy (kWhth) measured at the engine heat exchanger. The demonstration confirmed that the PowerDish CHP can deliver both electric and thermal energy to a facility from a single solar system. Due to PowerDish CHP forced outages and an Infinia control system change that induced an output reduction, this measured output was about 22% lower than the predicted output of 5,500 kWhe for electricity and about 30% lower than the predicted output of 16,000 kWhth for thermal energy at the Fort Carson site. Following a PowerDish generator failure very shortly after startup, Infinia identified a potential problem with the high cooling loop temperatures needed for the CHP applications. Infinia ordered the lowering of the cooling loop temperature from the planned 70oC to 60oC maximum and made control system changes that effectively lowered the output of the system of about 10%. This resulted in lower heat transfer to the building heat loop than planned. During the first months of the demonstration and in the winter months, the heat energy transferred to the building and used for space heating was well below expectations. Infinia redesigned and implemented changes to the building heat loop system before the winter season

2
2012-2013 resulting in about 350% improvement in heat delivered for space heating. The following table summarizes the electric and thermal performance. The effectiveness of the redesign of the building heat loop system can be seen in the November and December data of the last column: “% Thermal Energy Building Loop that is Used by Radiator”.
Table 1: Electric and Thermal Performance Summary IMPLEMENTATION ISSUES AND LESSONS LEARNED The Demonstration Project experienced several Implementation Issues which are explained in detail later in the report but include: • Initial grid interconnection software incompatibility with utility interconnection process • Low thermal energy delivery to in-building applications (space heating and water heating) • Unexpected PowerDish failures due to design implications from the CHP application. Some lessons learned for improving the application of PowerDish CHP to future projects include: 1) Need low-temperature heat exchanger (more surface area) for more heat to building and
applications 2) Keep Solar CHP system close to the building and Point-of-Use applications to minimize
losses

3
3) Take thermal heat directly to the Point-of-Use applications first and then to storage to maximize the utilization of available thermal energy
4) Use an improved design PowerDish that enables 70C generator cooling loop temperature to improve efficiency of heat transfer to building and Point-of-Use applications.
PERFORMANCE OBJECTIVE SUMMARY Following is the Performance Objectives Table 2 showing the results of the Ft. Carson demonstration as well as some projections for Forward Operating Base (FOB) performance. Table 2: Results Summary Performance Objectives—Solar CHP Demonstration Project for Fort
Carson, CO (table from Demonstration Plan)
Performance Objective
Domestic Power Success Criteria
Ft. Carson Demonstration Results
Demonstration FOB Predictions
Monitor Estimated
Facility Energy Usage
“Facility Energy Consumption”
Comparable to Estimated Facility Baseline: 16,800 kWh/yr electric
7,887 kWh (46.9% of estimated baseline)
(less 167 kWh from heat loop
pump energy consumption –CHP implementation
FOB energy consumption is predicted to be greater than Demonstration site due to
environmental, size, and other conditional requirements Comparable to
Estimated Facility Baseline: 1,200 gal/yr
liquid propane (110.55 million BTU)
1,182.6 gal (31,931 kWh) of propane consumed + 76.5 gallons
equivalent of thermal energy from CHP = 1,259 gallons propane
equivalent consumption (116.0 million BTU)
(104.9% of propane consumption baseline)
Maximize Renewable
Energy Usage “PowerDish
Energy Supplied”
30% Compared to Baseline: 5,040 kWh/yr electric
4,315 kWhe produced
4,238 kWhe delivered (54 % of actual consumption) (25 % of estimated baseline)
(less 167 kWh from heat loop
pump energy consumption –CHP implementation FOB energy production will be a
function of specific geographic location ~50% Compared to
Baseline: 16,000 kWh/yr (55 million
BTU) thermal potential
11,110 kWhth produced (37.9 million BTU)
2,082 kWhth delivered
(7.11 million BTU) (6.1% of total building thermal
consumption) (6.4% of estimated baseline)

4
Performance Objective
Domestic Power Success Criteria
Ft. Carson Demonstration Results
Demonstration FOB Predictions
Maximize Savings for
System Economics
“Fuel and Electricity Reduction Savings”
20+yrs with maintenance
Generator failure during the demonstration resulted in revisions to the demonstration PowerDish CHP controls and design improvements for subsequent PowerDish generators when operating in CHP mode (higher cooling loop temperature)
Improved durability expected from production systems vs. those used in
the demonstration
~ 50% Fuel Savings: $1100/yr potential propane savings
$145 savings (rate $1.90/gal)
$3,180 savings (assuming $50/gal Diesel FOB costs for 63.8 gallons of
diesel)
~ 30% Electricity Savings: $252/yr
savings in electricity
$212 savings ($0.05 rate) – $8 for the building heat loop pump energy
= $204 saving net
$12,715 savings (assuming net $3/kWh FOB costs)
Minimize
Direct Greenhouse
Gas Emissions “Fuel
Consumption Offset”
~50% Compared to Baseline: 600
gallons/yr propane reduction potential
96.4 gal reduction in propane consumption (including propane burner inefficiencies) from the delivered thermal energy to the
building: 2,082 kWh.
Also, 4,238 kWh electricity off-set CO2 emissions from CSU
generation.
With improved design CHP system including 50% efficient thermal delivery system and a FOB with
higher thermal energy uses annually, FOB GHG prevention could be 3X the demonstration
results.
~50% Compared to Baseline: 7,000lb/yr
CO2 potential reduction
1,233 pounds of CO2 emissions were reduced from the propane
reduction from the thermal energy delivered to the building.
Additionally, 7,459 pounds of CO2
were reduced from the electric offset.
8,692 pounds CO2 were reduced
from the CHP demonstration.
1,435 lbs CO2 prevention from diesel reduction from thermal
energy delivered
5,409 lbs CO2 prevention from diesel gen set electricity production
reduction
6,844 lbs CO2 total reduction
Could see 30% increase with improved thermal delivery system
and a FOB with higher thermal energy demand
Monitor Facility
Metering
Meter building for electricity, thermal,
and fuel consumption:
Comparable to "Estimated Facility
Energy Usage" values
Facility electricity, and thermal metering (flow and temperature
sensors) was installed and monitored remotely via satellite internet and 24 hr data logging.
Propane meter log was only read onsite.
Comparable to the Demonstration project outcome for each CHP
PowerDish installation with onsite monitoring and potentially some
remote monitoring

5
Performance Objective
Domestic Power Success Criteria
Ft. Carson Demonstration Results
Demonstration FOB Predictions
Monitor System
Maintenance
Mirror cleaning - once every 2 weeks.
No other maintenance
expected in the first year. Replacement
expected for the pump, fan, coolant
after 7 years
Mirror cleaning- at 6-8 week intervals (lower DNI from soiling was acceptable in reduced power
mode); Slew Cone checks/replacement followed same
frequency (PowerDish design changes have eliminated slew cone
maintenance); PowerDish generator replacements occurred due to generator failure; design
changes were made to in-building space heating applications
A production CHP system will require similar preventative
maintenance and suffer no routine hardware replacement issues as
experienced in the Demonstration
Monitor System
Integration
No problems expected with other
systems
Heat delivery system: 1) Need better match of
generator/building loop heat exchanger with the low CHP temperatures;
2) Need careful selection considering the low CHP temperature for "off the shelf" solar heating components in the building thermal delivery systems
3) Discovered that the revised design which had heat loop liquid going to end-uses FIRST and then to thermal storage tank LAST makes better use of CHP system to offset fuels for end-use application (space & water heating)
None expected
6
1.0 INTRODUCTION The Infinia Combined Heat and Power (CHP) project, ESCTP Project #EW-201145, hosted by the Department of the Army at Fort Carson, Colorado demonstrated Combined Heat and Power generation via clean, solar thermal resources using a hybrid version of Infinia’s Concentrated Solar Power, PowerDish System. The technology as installed demonstrated thermal and electric energy production compatible with both domestic and forward operating base (FOB) power, domestic hot water and space heat requirements. The intent of the Army program is to help save lives, help save money, help meet clean energy objectives, and help the war-fighting mission. The technology’s benefits will help DoD achieve its objectives of reductions in the energy production burden, fuel transport costs and logistics and greenhouse gas emissions. This demonstration was conducted at Fort Carson between January 17, 2012 and December 31, 2012 following the testing, installation and start up commissioning events that took place during October through December 2011. The system also benefited from successful changes to the thermal energy delivery systems within the demonstration building during the early fall of 2012 in an effort to improve the thermal energy delivery to the point of use systems (space heating and hot water).
1.1 BACKGROUND Infinia Corporation has been developing the Free Piston Stirling Engine (FPSE) for military, commercial, and space applications for almost 30 years. These developments have included multiple fuel types including radioisotopes, fossil fuel (gaseous and liquid), bio-fuels (gaseous and liquid), as well as more recently, solar. Some of these applications have included capturing and using the heat from the electrical generation process for other thermal applications. As Infinia developed a commercial product for its Free Piston Stirling Engine operating on solar energy for electricity production, called the PowerDishTM, a reasonable extension for the commercial product was to capture the heat that otherwise was rejected to air through a closed-loop radiator system for use in local space heating and hot water applications. ESTCP Project 201145 enabled Infinia and its site host, Ft. Carson, to demonstrate the effectiveness of such a system and to access improvements that could enable such a system, when commercial, to find application not only at commercial sites but in military base and forward operating base (FOB) applications. The DoD technology option today to provide solar electricity as well as solar thermal energy is to install 2 systems. A photovoltaic (PV) system would be installed to provide the electricity. A separate solar thermal system would be installed to provide hot water to a facility for water and space heating. The PowerDish CHP demonstration evaluates the potential to get both electricity and thermal energy from a single system. The PowerDish CHP system has the potential to provide the energy desired at lower total cost. If successfully deployed commercially, the PowerDish CHP can provide economic benefits and improved energy security as well as the potential for reduced loss of life if deployed successfully in FOB.
7
1.2 OBJECTIVE OF THE DEMONSTRATION ESCTP Project #EW-201145 demonstrated that the modified PowerDish, the PowerDish CHP, can generate clean solar thermal and electric energy compatible with domestic and forward operating base (FOB) power, domestic hot water and space heat requirements. While the level of performance fell 22% (electric) and 30% (thermal energy) below predictions, the causes of the under-performance (lessons learned) were identified. These lessons learned can be used to improve future installations so they are more effective and lower total cost. This PowerDish CHP demonstration confirms for the DoD that the PowerDish CHP system can provide both electric and thermal energy to a facility rather than the need for using 2 separate solar systems. This demonstration also provided insights to Infinia to make design changes so that future, commercial versions of the PowerDish CHP will provide better thermal heat quality and transfer to external facility heat loops.
1.3 REGULATORY DRIVERS Under Executive Orders 13423 and 13514, it is DoD’s policy to improve energy conservation and efficiency, reduce energy as well as water demand, and increase the use of renewable energy to improve energy flexibility, save financial resources, and reduce emissions that contribute to air pollution and global climate change. The DoD has also established a goal of 25% renewable energy by 2025, including requirements under the Energy Independence and Security Act of 2007 for the production of 30% of hot water in new and renovated federal buildings from solar sources. Additionally, the state of Colorado became the first U.S. state to create a renewable portfolio standard (RPS) by ballot initiative when voters approved Amendment 37 in November 2004. Updates and expansions to the Law were adopted in March 2007 (HB1281) and in 2010(HB 1001). Eligible renewable-energy resources include solar-electric energy. The Public Utility Commission (PUC) has issued and amended rules, as required, to implement the RPS. While the PUC's rules generally apply to investor-owned utilities (IOUs), the PUC has provided separate requirements for electric cooperatives and municipal utilities, like Fort Carson’s utility provider, Colorado Springs Utilities (CSU). CSU is required to provide the following percentage as renewable energy: • 3% of its retail electricity sales in Colorado for the years 2011-2014; • 6% of its retail electricity sales in Colorado for the years 2015-2019; and • 10% of its retail electricity sales in Colorado for the year 2020 and each following year. Also, to assist in meeting the renewable requirements and to enable deployment of solar-electric systems in Colorado, House Bill 1160, enacted in March 2008, requires CSU (and all other

8
municipal utilities with more than 5,000 customers and all cooperative utilities) to offer net-metering. The law allows residential systems up to 10 kW in capacity and commercial and industrial systems up to 25 kW to be credited monthly at the retail rate for any net excess generation their systems produce. Ft. Carson was able to use a “net metering” tariff from Colorado Springs Utilities which enabled the Project to generate electricity and put it directly into the Ft. Carson distribution network to be consumed on-site without any metering by the utility. This PowerDish generated electricity directly reduced the electricity that would have been supplied by the utility. In compliance with the regulations implementing the net metering Law, the PowerDish system was required to meet the grid interconnection requirements of the utility in order to interconnect to the electrical grid at Ft. Carson; and it did.

9
2.0 TECHNOLOGY DESCRIPTION At the time of this ESTCP project selection, Infinia Corporation had developed a concentrated solar thermal technology utilizing a highly reliable Free Piston Stirling Engine (FPSE) with a parabolic dish that produced 3 kWe of power and 7 kWth of usable heat, called PowerDish III. The solar concentrator dish, integrated into the system, focuses the sun’s energy into high-temperature thermal energy to drive Infinia’s very efficient FPSE, producing grid-compatible AC electric output plus heat which can be used for space heating and hot water. The solar-thermal-electric approach allows both heat and power to be generated at conversion efficiencies initially projected in the 70% range far surpassing what can be done with standard distributed solar power generation.
2.1 TECHNOLOGY OVERVIEW The Infinia PowerDish CHP system provides solar electricity and hot water for site use from a single integrated product. The PowerDish CHP system is a modified Infinia PowerDish solar system, which is an electric only system. To make the PowerDish CHP system, a heat exchanger was added to the PowerDish cooling loop system, and changes were made to the system controls to allow higher temperature cooling loop fluid to the heat exchanger. The liquid-to-liquid heat exchanger, mounted on the PowerDish heat drive, was connected to a closed loop system that carried the heat transferred across the heat exchanger to a near-by building where the thermal energy was used for space heating, water heating, and any excess thermal energy was stored in a tank. This CHP technology and the building point-of-use (POU) hardware are discussed in more detail below. The Infinia PowerDish The Infinia PowerDish system, which is an electric only system, is made of a: • Concentrator that collects and focuses the sun to a point; • Free Piston Stirling Engine (FPSE) that:
o Receives the focused solar energy in the hot-end of the engine, and o Provides single phase electricity from the linear alternator within the hermetically
sealed engine system; • Biaxial drive that enables 2-axis sun tracking; and • Monitoring and control system to operate the PowerDish in remote, autonomous mode.
Figure 1 shows the PowerDish system with the concentrator, also called a reflector, as well as a close-up of the FPSE inside the Heat Drive which is mounted at the focal point of the concentrator mirror system.

10
FIGURE 1: PowerDish Components; Heat Drive components shown with shell removed The concentrator, made of mirrored surface, collects and focuses the solar energy on the receiver within the Heat Drive package. That high temperature solar energy crosses the metal container at the FPSE heater head and heats a working fluid, helium, inside the FPSE generator. This is the hot side. The FPSE generator technology operates on the Stirling cycle principle whose power and efficiency are determined by a piston moving energy from a very hot source to a cold source. Work is performed as a piston shuttles back and forth moving the helium from the hot source to the cold source. A closed loop cooling system circulates a coolant fluid from the FPSE generator through a radiator, where it exchanges the collected heat to the ambient air. This establishes the cold side for the Stirling cycle. The displacer piston moving the helium from the hot side to the cold side at around 60 cycles per second causes a pressure wave to form in the helium working fluid. This pressure wave causes a second piston, called the power piston and which is connected to a linear alternator, to also move in sympathetic vibration. This second

11
piston is associated with a magnet that is moved back-and-forth inside a stator, which in turn causes an electric current to be generated. Figure 2 shows a cross-section of the FPSE illustrating some major internal components.
FIGURE 2: Free-Piston Stirling Generator For the PowerDish there are two modes of operation: “on sun” which is tracking the sun during the day; and “stowed” which is not tracking the sun and in a non-moving, safe position and condition. The PowerDish controls have been developed so that during a normal day, typical operation, Infinia’s proprietary software automatically sends the system “on sun” each morning and stows at sunset. If any problems are sensed in the system, i.e. a grid event, the software will stow the hardware so it does not operate. During rare circumstances, the system may be taken off sun remotely by clicking the ‘off’ button in the software or in-person on site. As an added precaution, if the software does not take the system off sun automatically, the system can be taken off sun using an “emergency-stop” button at the site to manually disconnect the unit from the grid. The autonomous operation and automatic control was an intended cost control measure to allow remote operation oversight from either Ogden, UT or Kennewick, WA personnel via satellite internet connectivity. In the event of any operational circumstance outside of expected ranges of the measurement instrumentation on site, a fault code gets triggered and immediately relayed to field engineering personnel to ascertain any need for human intervention. The PowerDish CHP The conventional PowerDish system generates heat as a byproduct of the solar thermal energy-to-electricity generation process and would normally reject most of the heat into the atmosphere

12
through a conventional coolant-based fan and radiator sub-system. The CHP PowerDish as installed and evaluated at Fort Carson during the period of January through December 2012 consisted of a pre-production level PowerDish generator integrated with an off-the-shelf liquid-to-liquid tube and shell heat exchanger, in order to recover the thermal energy normally wasted through the on-board radiator. Figure 3 is a picture of the heat exchanger mounted on top of the Heat Drive. The PowerDish system controls were modified to allow the cooling loop temperature, the hot-side of the heat exchanger, to go up to 70C. This modified PowerDish with the off-the-shelf heat exchanger and modified controls form the PowerDish CHP that was used in this demonstration.
FIGURE 3: PowerDish CHP - Heat Exchanger mounted on Infinia PowerDish The Building Thermal Energy Loop To use the thermal energy available from the PowerDish CHP system, a site-specific Building Thermal Energy Loop (BTEL) and Point of Use (POU) hardware will need to be selected and designed into the overall CHP system. The liquid-liquid heat exchange process is utilized to capture most of the thermal energy from the engine’s coolant loop and transfer energy to the BTEL; energy which otherwise in an electric-only PowerDish would normally be rejected to atmosphere from the on board radiator system. The heated BTEL fluid is piped within an insulated piping and hose arrangement, down the post of the PowerDish to the facility and the integrated systems being supplied with the thermal energy. Most commonly, the systems in a CHP application include systems for extracting energy from the BTEL to heat water, heat air, or be stored for later use. After supplying the building systems, the BTEL fluid flows back to the PowerDish, up the post, and back into the liquid-liquid heat exchanger mounted above the Stirling generator.

13
The building systems utilized to store and transfer the BTEL heat energy for living space occupant consumption can be off-the-shelf or specially designed equipment. The careful selection or design of equipment to utilize the relatively low temperature energy in the BTEL is critical to have a successful installation. Typical solar components for the POU equipment in the facility include:
• Solar Storage Tanks, pumps and controls, • Solar Hot Water heater and controls, • Wall mounted radiators or other room exchangers for space heating, • Programmable, multi-heat source thermostat • Hydronic heating/cooling fluids for the BETL • Piping, valving, and insulations to meet local building codes
TECHNOLOGY DEVELOPMENT The main technology utilized for this installation has been developed by Infinia over the past 8 years as a mass producible Concentrated Solar Power (CSP), electrical energy conversion and delivery system. This system, in electric production only mode, has been utilized at various installations across the globe which in many cases are still serving as both customer sites as well as Infinia corporate validation and verification facilities. Some of these facilities include Frito Lay and GH Dairy Processing in Arizona, Sandia National Labs and Belen City Hall in New Mexico, Infinia Offices in Washington state, Infinia facility and developmental site in Utah and outside New Delhi, India, as well as decommissioned sites at Villorobledos, Spain, Los Virgenes Water District, SDG&E and MagicAll (supplier) in California. To develop a PowerDish CHP system, a heat exchanger in the engine cooling loop was added to an early production Infinia PowerDish. Also, the controls were modified to allow higher temperature cooling fluid to operate in the PowerDish. Infinia’s 3 kWe FPSE, PowerDish system typically rejects about 7 kWth of thermal energy (at rated conditions) as a normal part of the solar-on-the-dish to AC-electric-to---the-grid conversion process. Through internal testing and development prior to award of this project as well as some specific heat exchanger integration development afterwards, the ability to integrate a heat exchanger into the engine cooling loop to capture and store otherwise rejected energy was proven as a viable alternative to the electric only, standard PowerDish system. Figure 4 shows heat exchanger integration and development testing (2010: left) and a demonstration for Congressman Adam Smith, Oct 2011, at Infinia’s Kennewick facility (right).

14
FIGURE 4: Heat Exchanger Integration and Testing The delivery of this BTEL thermal energy to the POU and its thermal usefulness is a system integration effort. For the development at Ft. Carson, Infinia elected to work with existing commercially available solar heated energy technologies which would be appropriate for heating, hot water production, and energy storage at the chosen facility. For the PowerDish CHP to function correctly, the standard PowerDish controls had to be modified. Infinia had developed proprietary software for controlling the solar Stirling dish system (the PowerDish). The position control of the parabolic reflector and engine uses a solar position algorithm (SPA) to determine the location of the sun at any moment in time and then uses closed loop tracking with heat sensors on the heat drive to better center the beam on the heater head of the generator. Engine/generator power output is regulated by maintaining a constant temperature engine by varying the stroke length of the power piston. The modification to Infinia’s PowerDish control system for CHP mode was with the control of the fan. The fan was set to turn on only when the coolant temperature has gone above a specific temperature (higher than the normal electric only temperature and was expected to be able to be set as high as 70°C) instead of running all the time while the engine is producing power as in the electric-only mode. The fan control scheme was to ensure the fan is not dissipating heat until the tank in the building has achieved the maximum temperature it can operate at or the temperature to protect the engine components (approximately 80°C). After the initial PowerDish generator failure, Infinia reduced the generator cooling-loop temperature set-point in order to protect the generator

15
which in turn had the effect of lowering the total electrical output during the demonstration. The effect of these set-point changes will be described later. In addition to Infinia’s PowerDish control system, there was a control system for running a pump to distribute the hot liquid (heat) from the heat exchanger with the PowerDish into the building. When Infinia’s coolant is sufficiently hot, a pump pushes building-loop coolant through the liquid-liquid heat exchanger which transfers the heat to the radiators, water heater exchanger, and storage tank inside the building. For this development, Infinia chose work with an off-the-shelf solar storage water tank with the BTEL pump control software built into the solar water tank. The CHP PowerDish technology in combination with the appropriate thermal delivery and POU systems can cover a broad range of possible DoD end users ranging from single site domestic installations up to larger scale combined unit installations for DoD domestic and foreign facilities. Additionally, mobile and tactical versions of similar CHP systems are under development as well as improved thermal and electrical capacity generators with the intended potential for improvement on some of the deficiencies defined from this installation and demonstration. Future technology development: While this demonstration modified an existing PowerDish design to take advantage of thermal energy recovery, there are other design changes that are being considered for the PowerDish evolution that could have an impact on this application. Infinia is developing a “Hybrid” PowerDish product that integrates the solar PowerDish with the Stirling multi-fueled generator. This Hybrid PowerDish can provide 27/7 coverage which can be especially useful in remote applications in smaller scale projects (with heat recovery) or also useful for utility scale, dispatchable electric power. A separate development that has received some funding from the US DOE, is to integrate thermal energy storage (TES) into the PowerDish. Depending on the final design selected, this would enable solar energy to be used to produce electricity during “daylight or solar” hours as well as to store “excess” solar energy in the TES system for use during non-solar hours. The TES could provide from minutes to many hours of non-solar operation depending on the final commercial design. 2.2 ADVANTAGES AND LIMITATIONS OF THE TECHNOLOGY The FPSE as a solar energy conversion source for both electrical and thermal energy allows both heat and power to be generated at conversion efficiencies projected as high as the 70% range; far surpassing what can be done with standard distributed power generation. This CHP technology integrates solar electric production and hot water production into a single system versus the need for two solar systems to provide the same: photovoltaic system for electricity and a solar thermal system for thermal energy for hot water and space heating. The PowerDish CHP technology will help reduce the DoD’s energy burden and carbon footprint through on site production of

16
electricity and hot water with a single system utilizing a free, non-GHG producing fuel source, the sun, at either domestic or deployed installations. Potential deployment to FOB can provide even greater gain as standard fuel transport and logistics expenses are offset through the use of the PowerDish CHP system as a supplemental energy source. The disadvantage for the PowerDish CHP system at FOB is the large profile, heavy system, and need for substantial foundation support to offset wind loading. As solar resources are seasonally, climate and weather dependent, the ability of this technology to be a primary electrical and thermal energy source is not always reliable. But as a supplemental and at times primary source, it is entirely feasible especially in the global environments of greatest Direct Normal Irradiance (DNI) potential (especially 5.5 kWh/m2/day and higher as shown in continental US map in Figure 5). The PowerDish as being deployed in its 2014 model, PowerDish V, will be competitive with photovoltaic (PV) produced electricity ($/MWH) in places around the world where DNI is 5.5 kWh/m2/d or higher. The installed PowerDish system usually costs more ($/W) than PV but produces 15% - 50% more MWH per year (depending on the type of installation). As a result, on a $/MWH basis the PowerDish is competitive with PV. Consequently, in those locations, the PowerDish CHP system is expected to be more cost effective than a PV system for electricity and a solar thermal system for hot water.
FIGURE 5: Domestic Solar Resources (NREL database) While the PV and solar thermal systems have been in the commercial markets for several decades, the PowerDish system has only recently been seen in commercial applications. There is

17
still a “let’s see it in operation over time” attitude with many in the market that does slow the penetration of the PowerDish. The same attitude will slow the penetration of the PowerDish CHP system when introduced commercially.

18
3.0 SITE/FACILITY DESCRIPTION For successful deployment of the PowerDish CHP system, the site should be in an area with Direct Normal Irradiance of 5.5 kWh/m2/day average or more and have good view to the sun throughout the day, i.e. no or very limited obstructions such as trees or local mountains to the east or west of the installation. The facility should have need of electricity at levels higher than the PowerDish CHP production. Further, the facility should have use of the thermal energy for hot water production and space heating. Hot water could be used to drive cooling technologies, but for this demonstration, simple space heating is sought. To prepare for the installation of the PowerDish, some information about the soil conditions are needed so a proper foundation can be designed for the PowerDish. It is possible that an above ground foundation can be used. Communications with the local electric utility will be needed to prepare for the interconnection with the grid. 3.1 SITE/FACILITY LOCATION, OPERATIONS, AND CONDITIONS Fort Carson Directorate of Public Works (DPW), in consultation with Infinia personnel, selected the Administration Building (#9246) based on the desired criteria for the solar CHP application. Building #9246 (Figure 6) at Ft. Carson is a 1320 sq ft., single story mobile office unit, set on a concrete foundation, crawlspace underneath and plywood skirting. The building occupants vary year round between 4-6 DPW staff, who administers the hazardous waste processing facility (Bldg #9248). There are five cubicles which may be occupied part/full time depending upon the “field work” required at Building #9248 and elsewhere on Post. Actual staff during the entire demonstration period was 2 DPW personnel.

19
FIGURE 6: Fort Carson Bldg#9246 layout Site maps are depicted below in Figure 7 and Figure 8. Building 9246 is located in the southern portion of the Fort Carson army base along Butts Road. The facility is managed by the DPW Environmental Division for the purpose of handling and storing hazardous waste from Fort Carson units and activities. The site is managed year-round, but is not heavily trafficked; thereby posed no hindering effects to the demonstration project’s installation and/or performance data monitoring.

20
FIGURE 7: Fort Carson Site Maps (aerial photo prior to installation) The Infinia PowerDish was sited approximately 200-feet to the front of Building 9248, which is adjacent to the Administration Building 9246. The balance of plant components are all situated within the Administration Building (#9246), and the site plan and building site depiction, Figure 8, shows the installation locations.
The placement of the dish in the grassy region in front of Building 9248 was determined by several restricting infrastructures and site features including: existing underground piping, a 50-
Figure 8: Building Site Power Dish Deployment Depiction
50ft Poplar Tree
General Solar Trajectory
9248
9246 PowerDish
40’Tower&Weather Station
Demonstration Buried lines --thermal --electrical

21
foot Poplar tree just inside the facility’s fence line, and the integration of supporting performance monitoring structures. Approximately 250-feet of underground piping extends towards Butts Road from Building 9248. The piping served as a boundary that could not be trespassed. The shading created by the 50-foot tall, 25-foot wide Poplar tree was a restriction to the location of the dish. The tree is located approximately 115-feet from Building 9248, just inside the facilities’ fenced perimeter. The dish was placed approximately 100-feet away from the tree to provide adequate distance from the shadow of the tree at all times. Building #9246 is served by CSU with 3-phase electricity. The PowerDish CHP system was configured to also provide 3-phase power with an integrated communications and control system. Building 9246’s existing use and design accommodated the domestic hot water and space heat components, as well the required data logger and CPU. A pre-shipment test run of the Infinia Solar CHP PowerDish system was completed in Washington at the Infinia headquarters site in October 2011. The Infinia Solar CHP PowerDish project began installation at Fort Carson, Colorado, Administration Building (#9246), in September, 2011 and completed installation and began operation December 14, 2011 with a subsequent Demonstration restart on January 17, 2012 following the shutdown of the initial PowerDish CHP generator. By using companies that the base had experience with made the site design and construction easier. Local construction, electrical, and plumbing companies did the construction. The plumbing company also worked with Infinia to perform certain maintenance services at the site. 3.2 SITE/FACILITY IMPLEMENTATION CRITERIA The Hazardous Waste Storage Facility Administration Building #9246 and grounds were selected as an applicable demonstration site primarily due to the facility size, estimated energy use, and occupancy level from the available sites at Fort Carson. These criteria were deemed appropriate to select an operating facility that represents a single dwelling, small office electric and thermal energy usage. The facility was expected to consume much more than 5,000 kWh per year and much more than 55,000 million BTU per year for thermal energy use for water and space heating. The facility was also deemed to be of reasonable traffic levels and likely representative of a typical usage in other locations, although traffic levels are not important criteria for site selection. The Fort Carson Facility has an appropriate geographical location for higher DNI profile (projected in the 6-7 kWh/m2/day range) which is beneficial to solar energy systems although its location near the base of Cheyenne Mountain has shown to create a negative cloud transient effect.

22
The Hazardous Waste Site also has flat terrain with a good southern exposure (except for poplar tree in late winter afternoons) and enough surrounding square footage for the necessary weather instrumentation. The site was also determined able to accept buried communications, fluid and electrical conduits between the instrumentation and to the appropriate building locations without creating interruption to the other buried services already present. During the facility selection process and at the start of the demonstration the building occupancy was thought to be between 4-6 daily occupants which was appropriate for an energy consumption profile for a building of this size. But due to base needs some of those personnel were relocated during late 2011/early 2012 to other facilities resulting in a lower than expected occupancy level (2-3 personnel). This lower occupancy likely had effects on the actual energy consumption vs the expectations. 3.3 SITE-RELATED PERMITS AND REGULATIONS Listing of permits and regulation checks obtained for installation at Hazardous Materials Disposal site on Butts Rd, Fort Carson.
-Execution packet Scott Clark ESTCP-Energy Program Coordinator -Dig permit DPW Fort Carson -Grid interconnect Inspection DPW Fort Carson -Public Utility Agreement CSU Colorado Springs Utilities Ft. Carson was able to use a “net metering” tariff from Colorado Springs Utilities, the electric utility serving Ft. Carson, which enabled the Project to generate electricity and put it directly into the Ft. Carson distribution network to be consumed on-site without any metering by the utility. This PowerDish generated electricity directly reduced the electricity that would have been supplied by the utility. The electricity output was metered for the purposes of this project, but not as a requirement of the utility tariff. The PowerDish system was required to meet the grid interconnection requirements of the utility in order to interconnect to the electrical grid at Ft. Carson; and it did.

23
4.0 TEST DESIGN AND ISSUE RESOLUTION
The ESTCP Solar CHP Demonstration Project objective was to demonstrate that the Infinia PowerDish (electric only) could provide both electric and thermal energy when developed as a CHP device. A heat exchanger added to the PowerDish along with system control changes enabled the PowerDish to provide a source of thermal energy (through the heat exchanger) to a thermal energy building loop that supplied thermal energy to space and water heating applications inside Building 9246. A detailed description of the integrated technology’s conceptual design, baseline estimates, design components, operational testing criteria, performance data sampling protocol, and calibration of measuring methodology is described in the following sections.
4.1 INITIAL CONCEPTUAL TEST DESIGN Infinia’s PowerDish system produces grid quality electricity and rejects the heat to the atmosphere through a radiator. The premise of this demonstration is that the PowerDish could be modified to provide both electricity AND heat to a DoD facility at reasonably economic levels. The modified PowerDish system that provided both electricity AND thermal energy for use in a facility was called the PowerDish CHP. The dependent variable in this demonstration is the amount of energy, both electric and thermal, that were consumed by Building 9246. The independent variable was the amount of renewable energy, electricity and thermal, that could be delivered to Building 9246. Building 9246 was selected among a few facilities available at Ft. Carson as representative of an “office” type environment that could make sufficient use of the electricity and thermal energy that a PowerDish CHP could provide. Test Design: The demonstration established estimated output from the PowerDish CHP that would be available for use in end-use applications, e.g. hot water and space heating, within Building 9246. The estimates were based on:
• The PowerDish model that was modified; • The heat exchanger that was selected for the interface between the PowerDish cooling
loop and the building thermal energy loop; and • The location of the installation so that direct normal irradiance (DNI) and other weather
data could be accessed and its implication on the electric and thermal output of the engine.
The demonstration also established estimates of the amount of electric and thermal energy use (from propane) for Building 9246 confirming that it was sufficiently large that the energy produced by the PowerDish CHP would be consumed. It was recognized from the start that

24
while the annual thermal energy use was sufficiently large, the use was NOT uniform throughout the year. During the late spring, summer, and early fall there would be very little need for thermal energy, e.g. no space heating requirement and very little water heating for the Building. As a result, during a significant period of the year almost no thermal energy (although available) would be transferred to the building. A building thermal energy loop was designed using off-the-shelf end-use equipment so that the thermal energy generated by the PowerDish and transferred across the heat exchanger to the building thermal energy loop could be delivered to building end uses such as space heating, water heating, and thermal energy storage. Finally, a suite of sensors, meters, and monitoring/communications system were installed at appropriate points throughout the installation to monitor, measure, record, and report the energy and energy related parameters that enabled the Building use and the PowerDish CHP production of electricity and thermal energy flows to be captured. The project moved through several phases during the demonstration. The Pre-demonstration phase included activities aimed at site selection (building selection), PowerDish CHP estimated performance at the site, CHP loop design for the building, end-use equipment selection, hardware procurement, making estimations of building energy use (electric and thermal), and electric utility interconnection application. The construction phase covered the installation of all the hardware and equipment to the design requirements. The Commissioning phase included calibrating the installed monitoring and measurement equipment, starting up the integrated system, and confirming that the system performed as designed. Then, the data collection and analysis phase included assuring that the data monitoring systems continued to operate to collect and communicate the data to the appropriate people so that analysis and quarterly reporting could continue. Finally, the report writing phase focused on preparing the data and experiences into a report that could be used by others to understand the performance of this demonstration as well as derive information on how to successfully apply the PowerDish CHP to other applications. After the year-long demonstration period, the data collected on the Building energy consumption and the PowerDish CHP production could be evaluated and compared to the estimations so that judgments could be made about how effective the PowerDish CHP system was for Building 9246. Further, the analysis of the effectiveness of this demonstration for Building 9246 could provide insights for how:
• To make improvements to the PowerDish CHP system, the heat exchanger system, and to the selection of appropriate end-use systems to delivery more useable energy to a DOD facility; and
• To better understand the appropriate choice for the DOD facilities that should be selected for this type of solar CHP application.

25
4.2 BASELINE CHARACTERIZATION Infinia’s solar Stirling dish system produces both electricity and heat. The electrical production is dependent on weather conditions and the efficiency of Infinia’s system with respect to those weather conditions. The baseline weather conditions were estimated by TMY data from NREL’s Solar Prospector, which takes the most typical measured weather conditions for Fort Carson for a period of over 8 years. The baseline electrical energy consumption for the building at Fort Carson was estimated based on the square footage of a double-wide trailer, Building 9246, and the expected number of building occupants. The electrical baseline estimate for the building at Fort Carson was 1,400 kW-hrs/month or 16,800 kw-hrs/yr. The propane baseline for Building 9246 was estimated to be around 1,200 gallons/yr. It should be noted that FOB sites are assumed to have various additional energy demands and may potentially be able to consume more hot water during the summer months, because of their more frequent utilization of showers and other appliances. Building 9246 at Fort Carson, however, is mainly utilized as an office building (and only 2 – 3 person occupancy) with almost no hot water use in the summer. 4.3 DESIGN AND LAYOUT OF TECHNOLOGY COMPONENTS The Infinia PowerDish™ CHP demonstration system is integrated with building #9246 at the Hazardous Waste Disposal facility on Butt’s Rd of the Fort Carson Army Facility. The physical layout of the PowerDish CHP system relative to building 9246 and the electrical interconnection is shown in Figure 9. A direct electrical production interface with the Fort Carson power grid was established via a buried, 150 ft run of grounded, 3 conductor (for 3-phase electricity), 10AWG cable, running from the point of power metering at the outdoor, weather proof containment disconnect switch box located near the dish.

26
FIGURE 9 : PowerDish CHP installation: Aerial and Ground Level Views To use the thermal energy from the PowerDish CHP system, site-specific Building Thermal Energy Loop (BTEL) and Point of Use (POU) hardware are selected and designed into the overall CHP system. A liquid-liquid heat exchange process is utilized to capture most of the thermal energy from the engine’s coolant loop through the heat exchanger with the BTEL. In the electric-only PowerDish, this thermal energy would normally be rejected to atmosphere from the on board radiator system; this radiator system was left in place and fully functional as a safety back-up system during this demonstration. The heated fluid is piped within an insulated piping and hose arrangement, down the post of the PowerDish and into the ground where it is pumped to the building and then into the integrated POU systems: storage, radiant heating and domestic hot water. After the building systems, the fluid flows via the same below ground route back to the base of the PowerDish™ from where it travels up the post and back into the liquid-liquid heat exchanger mounted above the Stirling generator. A conceptual pictorial graphic is shown below in Figure 10 depicting major components and sensors in the system as installed in the initial design layout.

27
FIGURE 10: Solar PowerDish CHP INITIAL Design Pictorial Graphic A detailed schematic showing the piping and instrumentation diagram for the initial CHP system design is shown in Figure 11. The initial CHP design and schematic was developed with project team member, Vista Engineering Technologies.

28
FIGURE 11: PowerDish and Building Measurement Instrumentation (P&ID) (Initial Design)

29
The POU building systems equipment utilized to store and transfer the heat energy for living space occupant consumption were selected from typical, commercially available solar heating components: • Schüco Solar Storage Tanks, pumps and recommended controls, • Schüco Domestic Solar Hot Water heater and controls, • wall mounted radiators, • wall mounted programmable, multi-heat source thermostat • off the shelf glycol based hydronic heating/cooling fluids • standard, available piping, valving, and insulations to meet required codes
Figure 12 shows some of the POU (point-of-use) equipment installed in building 9246 (from upper left and going clockwise): • 105 gal solar storage tank behind controls; • Building system controls; • Solar hot water heater next to propane furnace; • Example of piping and valving with electric power meter shown; • 2 of 7 wall mounted radiators in living space; • Another view of the wall mounted radiator in living space.
FIGURE 12: Building 9246 Radiant Heating and Hot Water Equipment In addition to the PowerDish CHP system and the building point-of-use hardware described above, a number of other pieces of hardware are required for measuring and controlling the energy flows in the system (many are shown in Figures 13 and 14). These include: • Insulated plumbing

30
• Plumbing rotary unions • Temperature sensors (RTD’s) • RTD signal conditioner • Flow meters • Data Acquisition (DAQ) box • Laptop computer with internet connectivity • Power meter • Weather station • Solar water tank and pump control system Thermal energy production by the PowerDish CHP was measured using two onboard coolant temperature sensors and flowmeter. The output from these instruments is then utilized to calculate the energy content using basic calorimetry theory (Energy= flowrate * fluid heat capacity coeff. * ∆T). Similar energy transfer calculations were employed to determine the thermal energy delivery and transfer to the installed building systems through the use of seven similar temperature sensors and two highly accurate magnetic flow meters installed at key locations within the building hydronic system piping loops. The installation schematic for the initial design is depicted above in Figure 11 showing the instrumentation layout. Figure 13 shows physically where the flow and temperature sensors were installed.
Figure 13: PowerDish and Building Flow and Temperature sensors: PowerDish (left) and Building #9246 Utility Closet (right) The electric and propane meters (energy use measurement equipment) installed at the site are shown in Figure 14 below. Electrical production to grid was measured via an Accuvim - II Powermeter. Electrical consumption within building #9246 was also measured via a second Accuvim - II Powermeter. Propane consumption was measured via a new propane meter and HoboWare acquisition equipment.
Coolant temperature sensor Flowmeter
Flowmeter Coolant temperature sensor

31
FIGURE 14: Energy consumption metering as installed The initial building heat loop design took the heat from the engine cooling loop (closed loop system) of the PowerDish III, through a heat exchanger and into the building heat loop (a closed loop design). The initial building loop design caused the heated fluid to pass through a solar storage tank and then a return loop back to the heat exchanger at the engine. Hot water loops from the solar storage tank took heat to the radiators for space heating and to the Hot Water tank for hot water heating. This initial building heat loop design required that the storage tank temperature be increased to the point where minimum heat for the radiator (space heating) loop and the hot water tank loop to operate. During the winter months and as a result of low insulation properties in the building, the storage tank water temperatures would fall to very low temperatures. As the heat from the PowerDish CHP system came through the heat exchanger into the building heat loop and then into the solar storage tank, most of the day’s heat energy went into warming the water in the

32
solar storage tank before any heat went to the space or water heating needs of the building (and occupants). And overnight, much of the energy stored would be lost through the tank insulation. Following the poor solar heat utilization in Building #9246 during the initial period of January – April 2012, the building heat loop design was revised (redesigned) to have the heat from the heat exchanger at the engine to flow directly to the building radiators first, and then flow to the storage tank. This significantly improved the amount of heat that was delivered to the space heating within building and directly reduced the amount of propane used through the work day to keep the temperature inside the building at the desired set-point. The pictorial graphic in Figure 15 shows the revised design for the building heat loop. Figure 15: Solar PowerDish CHP REVISED Design Pictorial Graphic

33
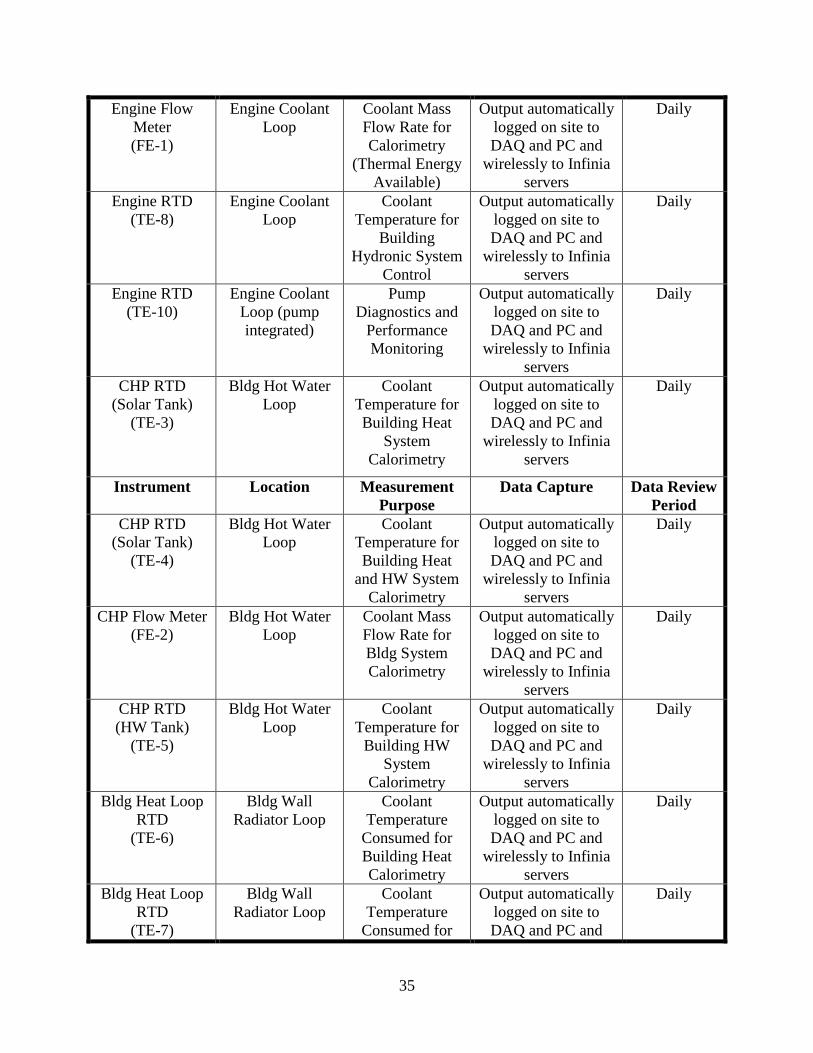
4.4 OPERATIONAL TESTING The PowerDish CHP has only two modes of operation. The first is being “on sun” which is tracking the sun during the day. The second mode is “stowed” which is not tracking the sun. Throughout the Demonstration period, daily operation of the PowerDish CHP while under autonomous control was typical, as described in Section 2. The control software automatically sent the PowerDish on sun in the morning, operated under “self” control throughout the day, reported any system faults immediately to field engineering personnel, and stowed the PowerDish at sunset. The demonstration period began January 17, 2012, following pre-shipment testing, commissioning, and an early engine failure, and ended December 31, 2012. During the operational period, the PowerDish concentrator panels and the weather station unit required some preventative cleaning maintenance. The panels and weather station were cleaned 9 times during the demonstration period (typically on a 6 week period). In addition, the performance data was monitored remotely via a network satellite system on a daily basis to ensure proper system function, correct data acquisition transfer, and to spot problems quickly so they could be resolved. Daily performance data was monitored closely and compared against system models to confirm the performance objectives were in line with predictions or to take corrective actions. The sensor outputs associated with performance monitoring were also observed to ensure they were functioning properly and providing accurate performance measurement data during operation. The data capture and operational testing took place over the full demonstration period with daily data logged and analyzed for engine performance and production output, energy delivered to the grid, building system function and performance as well as building energy consumption levels. At the end of the demonstration period all of these systems are still in place and functional awaiting disposition for either decommissioning or technology transfer to Fort Carson personnel. 4.5 SAMPLING PROTOCOL The installation and integration of Infinia’s CHP PowerDish with building #9246 required multiple power, temperature and flow sensing devices in order to monitor performance and capture the necessary data for assessing functionality. The measurement equipment employed with the building integration is detailed in Table 3 below. All of the data except for propane consumption was captured on a 24/7 basis at approximately a 6 sec sample rate. The raw data stream from each of these meters and probes (except propane) was sent to Labview data acquisition system where it was post processed (based on each individual instrument’s calibration information). The processed data then was recorded at the given sample rate and saved into daily data log files. These daily files were stored on the installation site computer and

34
downloaded daily to a resident computer at the Infinia Kennewick location for analysis. Propane consumption data was also logged on a 24/7 basis through a Hobo-Meter system which required that manual recovery from on site by either Infinia of contracted personnel be conducted at regular intervals. The PowerDish electrical production data was gathered through the onboard measurement equipment and control software in conjunction with an installation weather station and anemometer tower through standard Infinia procedures and methodologies. With the weather station and anemometer tower inputs, the proprietary software assesses the units electrical production relative to the changing daily environmental conditions. This data then gets charted on a daily basis versus a standard 2.7 kW energy predicted production level as an assessment of performance and function. Using the data, the electrical power production over time (standard Power Dish observations) as well as the thermal energy both produced (at engine) and the amount made available for building heat and hot water (bldg heat and HW loops) is calculated. Electrical energy consumption was measured and logged through the same labview system as previously described which allowed consumption over time assessments to made easily through the use of excel macro based programming.. Propane consumption required manual data analysis that resulted in daily consumption levels which were then compiled into cumulative summaries. The following Table identifies the meter or sensor, its location in the CHP system, its purpose, how the data was logged and whether the data was provided to Infinia remotely, and what was the review period of the data.
Instrument Location Measurement
Purpose Data Capture Data Review
Period Power Meter Bldg#9246-ctrl
closet Solar Electrical
Energy produced Output automatically
logged on site to DAQ and PC and
wirelessly to Infinia servers
Daily
Engine RTD (TE-1)
Engine Coolant Loop
Coolant Temperature for
Calorimetry (Thermal Energy
Available)
Output automatically logged on site to DAQ and PC and
wirelessly to Infinia servers
Daily
Engine RTD (TE-2)
Engine Coolant Loop
Coolant Temperature for
Calorimetry (Thermal Energy
Available)
Output automatically logged on site to DAQ and PC and
wirelessly to Infinia servers
Daily
35
Engine Flow Meter (FE-1)
Engine Coolant Loop
Coolant Mass Flow Rate for Calorimetry
(Thermal Energy Available)
Output automatically logged on site to DAQ and PC and
wirelessly to Infinia servers
Daily
Engine RTD (TE-8)
Engine Coolant Loop
Coolant Temperature for
Building Hydronic System
Control
Output automatically logged on site to DAQ and PC and
wirelessly to Infinia servers
Daily
Engine RTD (TE-10)
Engine Coolant Loop (pump integrated)
Pump Diagnostics and
Performance Monitoring
Output automatically logged on site to DAQ and PC and
wirelessly to Infinia servers
Daily
CHP RTD (Solar Tank)
(TE-3)
Bldg Hot Water Loop
Coolant Temperature for Building Heat
System Calorimetry
Output automatically logged on site to DAQ and PC and
wirelessly to Infinia servers
Daily
Instrument Location Measurement Purpose
Data Capture Data Review Period
CHP RTD (Solar Tank)
(TE-4)
Bldg Hot Water Loop
Coolant Temperature for Building Heat
and HW System Calorimetry
Output automatically logged on site to DAQ and PC and
wirelessly to Infinia servers
Daily
CHP Flow Meter (FE-2)
Bldg Hot Water Loop
Coolant Mass Flow Rate for Bldg System Calorimetry
Output automatically logged on site to DAQ and PC and
wirelessly to Infinia servers
Daily
CHP RTD (HW Tank)
(TE-5)
Bldg Hot Water Loop
Coolant Temperature for
Building HW System
Calorimetry
Output automatically logged on site to DAQ and PC and
wirelessly to Infinia servers
Daily
Bldg Heat Loop RTD
(TE-6)
Bldg Wall Radiator Loop
Coolant Temperature
Consumed for Building Heat Calorimetry
Output automatically logged on site to DAQ and PC and
wirelessly to Infinia servers
Daily
Bldg Heat Loop RTD
(TE-7)
Bldg Wall Radiator Loop
Coolant Temperature
Consumed for
Output automatically logged on site to DAQ and PC and
Daily

36
Building Heat Calorimetry
wirelessly to Infinia servers
Bldg Heat Loop Flow Meter
(FE-3)
Bldg Wall Radiator Loop
Coolant Mass Flow Rate for
Consumed Bldg System
Calorimetry
Output automatically logged on site to DAQ and PC and
wirelessly to Infinia servers
Daily
Bldg Heat and HW RTD
(TE-9)
Solar Thermal Tank
Solar Tank Control System
Output automatically logged on site to DAQ and PC and
wirelessly to Infinia servers
Daily
Bldg Electric Power Meter
(added at start of demonstration)
Bldg. Power Panel
Electrical Consumption
Output automatically logged on site to DAQ and PC and
wirelessly to Infinia servers
Daily
Bldg Propane Meter
(added at start of demonstration)
Bldg Propane Tank
Propane Consumption
Output automatically logged on site
Daily
Instrument Location Measurement Purpose
Data Capture Data Review Period
Hot Water Heater RTD
(TE-13) (added at start of demonstration)
Bldg Domestic Hot Water
Hot Water Temperature For Propane Consumption
Output automatically logged on site
Daily
Solar Storage Tank RTD
(TE-15) (added at start of demonstration)
Middle -- 105 gal Shuco Storage
Tank
Storage Tank Temperature
Output automatically logged on site
Daily
Table 3: Measurements and Sensor 4.6 EQUIPMENT CALIBRATION AND DATA QUALITY ISSUES Calibration of the individual measurement instruments typically was supplied with each. Where it was not, linearity curves were generated over the desired range for each as required (but this typically was not needed). As examples of the techniques used:
1) the Magnetic flowmeters employed a calibration constant which was provided with the instrument (this constant was then programmed into the electronic display of the device)

37
and its output was directly transmitted to the labview input board where a linearity curve of the flowmeter digital display reading was employed to generate the flow measurement within the labview system
2) the Accuvim Powermeters required the use of transformers to convert the AC power to a usable DC signal. This was accomplished through standard turns ratios and then linearity curve confirmations of the AC output vs the DC signal
System operating parameters were reviewed on a daily basis confirming normal operation. On a regular basis, all of the instrumentation measurements were reviewed to look for any output changes which could be considered non-normal variability. No instances of unexpected variability were noted or found. In the case of engine performance degradation over time which was found to be present in the data accumulated over the operational lifetime on engine M067 (Jan thru Aug) this energy production potential was taken into account through the use of adjusted production values (as described later in section 5),

38
5.0 PERFORMANCE RESULTS 5.1 SUMMARY OF PERFORMANCE OBJECTIVES (PO) AND OUTCOMES The following Table 4 is the Results Summary Performance Objectives (same as Table 2) showing the results of the Ft. Carson demonstration as well as some projections for Forward Operating Base (FOB) performance. A discussion of each Performance Objective follows. Table 2: Results Summary Performance Objectives—Solar CHP Demonstration Project for Fort
Carson, CO (table from Demonstration Plan)
Performance Objective
Domestic Power Success Criteria
Ft. Carson Demonstration Results
Demonstration FOB Predictions
Monitor Estimated
Facility Energy Usage
“Facility Energy Consumption”
Comparable to Estimated Facility Baseline: 16,800 kWh/yr electric
7,887 kWh (46.9% of estimated baseline)
(less 167 kWh from heat loop
pump energy consumption –CHP implementation
FOB energy consumption is predicted to be greater than Demonstration site due to
environmental, size, and other conditional requirements Comparable to
Estimated Facility Baseline: 1,200 gal/yr
liquid propane (110.55 million BTU)
1,182.6 gal (31,931 kWh) of propane consumed + 76.5 gallons
equivalent of thermal energy from CHP = 1,259 gallons propane
equivalent consumption (116.0 million BTU)
(104.9% of propane consumption baseline)
Maximize Renewable
Energy Usage “PowerDish
Energy Supplied”
30% Compared to Baseline: 5,040 kWh/yr electric
4,315 kWhe produced
4,238 kWhe delivered (54 % of actual consumption) (25 % of estimated baseline)
(less 167 kWh from heat loop
pump energy consumption –CHP implementation FOB energy production will be a
function of specific geographic location ~50% Compared to
Baseline: 16,000 kWh/yr (55 million
BTU) thermal potential
11,110 kWhth produced (37.9 million BTU)
2,082 kWhth delivered
(7.11 million BTU) (6.1% of total building thermal
consumption) (6.4% of estimated baseline)
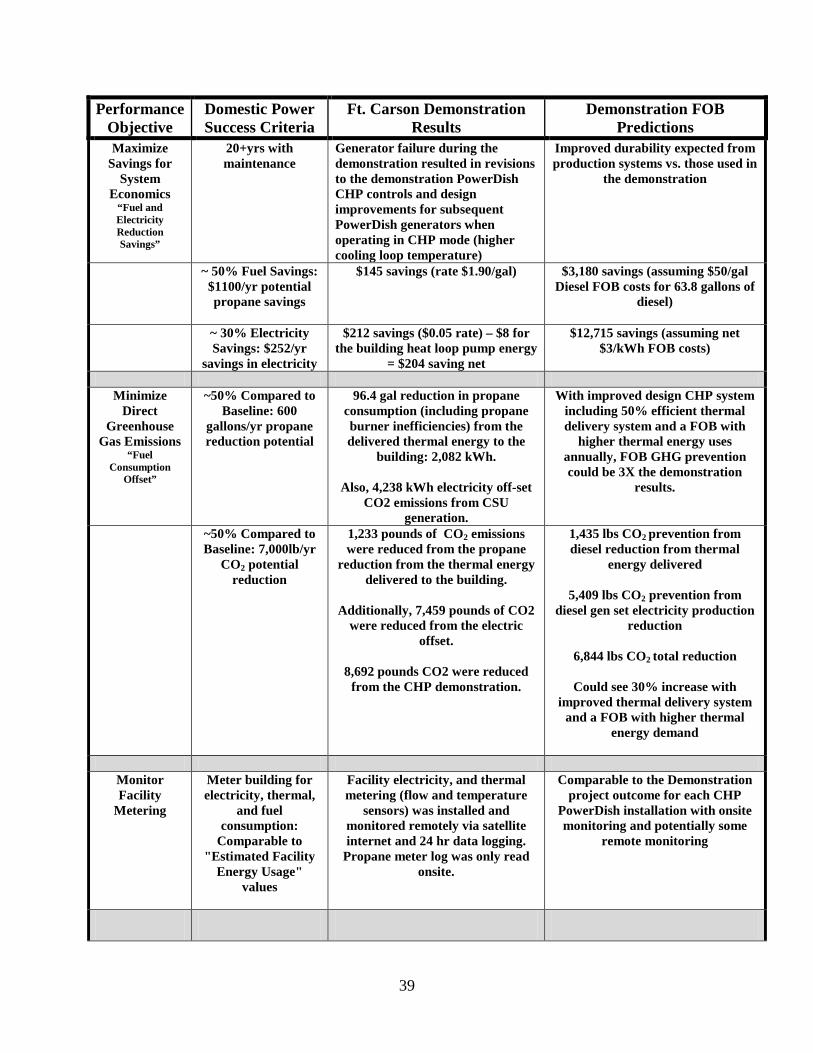
39
Performance Objective
Domestic Power Success Criteria
Ft. Carson Demonstration Results
Demonstration FOB Predictions
Maximize Savings for
System Economics
“Fuel and Electricity Reduction Savings”
20+yrs with maintenance
Generator failure during the demonstration resulted in revisions to the demonstration PowerDish CHP controls and design improvements for subsequent PowerDish generators when operating in CHP mode (higher cooling loop temperature)
Improved durability expected from production systems vs. those used in
the demonstration
~ 50% Fuel Savings: $1100/yr potential propane savings
$145 savings (rate $1.90/gal)
$3,180 savings (assuming $50/gal Diesel FOB costs for 63.8 gallons of
diesel)
~ 30% Electricity Savings: $252/yr
savings in electricity
$212 savings ($0.05 rate) – $8 for the building heat loop pump energy
= $204 saving net
$12,715 savings (assuming net $3/kWh FOB costs)
Minimize
Direct Greenhouse
Gas Emissions “Fuel
Consumption Offset”
~50% Compared to Baseline: 600
gallons/yr propane reduction potential
96.4 gal reduction in propane consumption (including propane burner inefficiencies) from the delivered thermal energy to the
building: 2,082 kWh.
Also, 4,238 kWh electricity off-set CO2 emissions from CSU
generation.
With improved design CHP system including 50% efficient thermal delivery system and a FOB with
higher thermal energy uses annually, FOB GHG prevention could be 3X the demonstration
results.
~50% Compared to Baseline: 7,000lb/yr
CO2 potential reduction
1,233 pounds of CO2 emissions were reduced from the propane
reduction from the thermal energy delivered to the building.
Additionally, 7,459 pounds of CO2
were reduced from the electric offset.
8,692 pounds CO2 were reduced
from the CHP demonstration.
1,435 lbs CO2 prevention from diesel reduction from thermal
energy delivered
5,409 lbs CO2 prevention from diesel gen set electricity production
reduction
6,844 lbs CO2 total reduction
Could see 30% increase with improved thermal delivery system
and a FOB with higher thermal energy demand
Monitor Facility
Metering
Meter building for electricity, thermal,
and fuel consumption:
Comparable to "Estimated Facility
Energy Usage" values
Facility electricity, and thermal metering (flow and temperature
sensors) was installed and monitored remotely via satellite internet and 24 hr data logging.
Propane meter log was only read onsite.
Comparable to the Demonstration project outcome for each CHP
PowerDish installation with onsite monitoring and potentially some
remote monitoring

40
Performance Objective
Domestic Power Success Criteria
Ft. Carson Demonstration Results
Demonstration FOB Predictions
Monitor System
Maintenance
Mirror cleaning - once every 2 weeks.
No other maintenance
expected in the first year. Replacement
expected for the pump, fan, coolant
after 7 years
Mirror cleaning- at 6-8 week intervals (lower DNI from soiling was acceptable in reduced power
mode); Slew Cone checks/replacement followed same
frequency (PowerDish design changes have eliminated slew cone
maintenance); PowerDish generator replacements occurred due to generator failure; design
changes were made to in-building space heating applications
A production CHP system will require similar preventative
maintenance and suffer no routine hardware replacement issues as
experienced in the Demonstration
Monitor System
Integration
No problems expected with other
systems
Heat delivery system: 1) Need better match of
generator/building loop heat exchanger with the low CHP temperatures;
2) Need careful selection considering the low CHP temperature for "off the shelf" solar heating components in the building thermal delivery systems
3) Discovered that the revised design which had heat loop liquid going to end-uses FIRST and then to thermal storage tank LAST makes better use of CHP system to offset fuels for end-use application (space & water heating)
None expected
Table 4: Results Summary Performance Objectives (same as Table 2)

41
5.2 PERFORMANCE RESULTS DISCUSSION
5.2.1 Monitor Facility Energy Usage Purpose: This performance objective (PO) specified that the energy usage for Building 9246 was to be monitored during the demonstration. The fundamental measurement enables the effects of the PowerDish CHP demonstration on building energy consumption to be assessed. Metric: All of the energy measurements were to be measured and reported in kilowatt-hour (kWh). Electricity is nearly always expressed in kWhe (kilowatt-hour electric). Thermal energy is most often reported in British thermal Units (BTU), but to enable a single metric that could be directly compared for both electricity and thermal energy, the thermal energy was also reported in kWh. One kWh is equal to 3,411.142 BTU. Success Criteria: The demonstration measured the electric and thermal energy usage of building 9246 and compared this to the estimated usage identified in the project proposal. As has been described, the building did not have meters to measure the amount of electricity and thermal energy that was actually being used by the building. So, initial estimates were made based on the intensity of usage of all the buildings in the aggregate bill with adjustment for building size and number of people occupying the building. Results: During the demonstration, energy consumption within building #9246 was monitored on a 24hr/7day/week basis through the use of 3 pieces of measurement (metering) instrumentation (described in Section 2) as well as customized data acquisition using LabView software and programming. The consumption meters, both electric and gas, were added at the time of the project installation because the building did not have its own electrical or propane metering systems. Therefore, historical electrical consumption data and propane use data for Building 9246 was unavailable. Baseline estimates were made based on occupancy and estimates from “bulk” propane deliveries and electric bills which were for a larger “community” of buildings. The result is that the comparisons for energy savings purposes can only be extrapolated from the data gathered during earlier periods of the project year or from the estimated values utilized in the proposal and demonstration plans. Those estimated values for the initial proposal, before the project start, consisted of:
1) Predicted facility electricity consumption of 16,800kWh/yr and 2) The best estimated guess of 1,200 gallons of yearly propane consumption or 32,400
kWh/yr equivalent (using 27 kWh/gal as a conversion factor).
Because the electricity provided to the grid went into the general electric grid and DID NOT directly offset the electric consumption, then the electric consumption of the building is the

42
direct measurement of the meter installed at the building. However, the thermal energy delivered to the building loop and used within the building offset the use of propane for space and water heating. Therefore, the total thermal energy used by the building was the thermal energy provided by the CHP system PLUS the measured Propane use. Table 5 compares these predictions to the actual measured consumption values during the demonstration period.
Measured Consumption (kWh)
Actual Building Consumption (kWh)
Initial Estimated Consumption (kWh)
Electric (kWh) 7,887 7,887 16,800 Total Propane
Equivalent 34,013 (1,260 gal)
Propane (kWh) 31,931 (1182.6 gal) 32,400 (1200 gal) TE from CHP (kWh) 2,082 (77.1 gal equiv)
Total Energy 41,900 49,200
Table 5: Building 9246 Energy Measured Consumption vs Project Estimates
The installed demonstration system had the capability to measure the energy consumption and production for the majority of the demonstration period (Jan 17, 2012 – Dec 31, 2012) except during periods of monitoring system outages. Those periods of” no data acquisition” were the result of various reasons: utility power outages, meter failure and/or backup battery system failure which took place during periods within July, August, September, and October. During these periods of no available data, “best” estimates of the conditions for consumption and production were employed as a substitute. Table 6 presents the monthly electric consumption (measured at the breaker panel inside the building) and PowerDish delivered electricity (measured just before the grid interconnection). During the periods of data acquisition outages noted in the Table, the building consumption and PowerDish production were estimated based on surrounding monthly data and the PowerDish inverter production data. There is a small energy usage that is included in the building consumption numbers that are a result of implementing the CHP application. That small energy use is from 2 motors in the building heat loop and 1 motor in the radiator loop that move the fluid throughout the heat loop. These motors were not metered. They did run in a full-on or full-off mode at about35 Watt per motor when running. The best estimate of their contribution to the building electric consumption is 167 kWh over entire demonstration period: about 2% of the building consumption. The consumption numbers have NOT been reduced for this motor usage.

43
Table 6: Monthly Electrical Consumption and Production
Figure 16 : Monthly Electrical Consumption and Production
Building Electric Energy Consumption
(kWhe)
CHP Delivered Electric Energy
(kWhe)% Delivered / Consumption
January (17-31) 338.9 128.2 37.8%February 729.6 281.4 38.6%March 761.1 450.8 59.2%April 655.9 470.5 71.7%May 646.7 507.5 78.5%June 640.2 444.1 69.4%July (3 days est) 615.3 314.6 51.1%August (6 days est) 539.6 231.6 42.9%September (26 days est) 470.3 303.4 64.5%October (9 days est) 685.0 418.4 61.1%November 723.8 391.1 54.0%December 1080.0 296.9 27.5%
Electricity during Demo Period Jan 17-Dec 31 2013 7886.6 4238.4 53.7%

44
The building actual electrical consumption figures are considerably lower as compared to the initial estimates and this can only be partially explained. When the project started and the predicted usages made, the building living space was occupied by 5+ people but at the time of the installation and over the full year demonstration period that occupant level dropped to 2 people. Also as part of the project scope, during the Nov 2011 installation a programmable thermostat was installed and was set for typical daytime needs as well as energy conserving, night time set-backs. The system was configured to not allow the building occupants to change the furnace operational controls, thereby ensuring a consistent demonstration period operation. The effects of this thermostat control scheme are visible for both electric (fans) and propane consumption when comparing the month to month consumptions vs the Dec-2012 data when Fort Carson personnel had the project thermostat removed and replaced with a manual control device on approximately December 10, 2012 for fear of pipe freeze during the winter period (the December consumption data for both electricity and propane shows a dramatic increase, as compared to the other months of the test period—this likely indicates that the forced air furnace was running more frequently).
Table 7: Monthly Thermal Energy Usage (Propane and from CHP)
Measured Propane Usage
(kWhth)
Measured Propane Usage
(gal)
Thermal Energy Delivered to
Building Heat Loop (kWhth)
Total Building Thermal Energy COnsumption
(kWhth)
Total Building Thermal Energy COnsumption
(kWhth)
January (17-31) 2820.2 104.45 120.9 2941.1 108.93February 7089.0 262.55 234.7 7323.7 271.25March 2513.1 93.08 296.7 2809.8 104.07April 1372.3 50.82 259.0 1631.3 60.42May 587.5 21.76 225.0 812.5 30.09June 274.5 10.16 151.1 425.5 15.76July 248.5 9.20 115.3 363.8 13.47August (15 days est) 323.4 11.98 23.8 347.1 12.86September (30 days est) 1479.0 54.78 0.0 1479.0 54.78October (4 days est) 2926.6 108.39 94.8 3021.3 111.90November 4208.0 155.85 325.2 4533.2 167.90December 8088.9 299.59 235.8 8324.7 308.32
Electricity during Demo Period Jan 17-Dec 31 2013 31930.7 1182.6 2082.3 34013.1 1259.7

45
FIGURE 17: Monthly Building Thermal Energy Consumption & CHP Delivery
The propane figures align very well and will not change significantly if the propane data capture system had been operational during the full August through October period as this is still a relatively low heating need period and only the hot water system would have been calling for propane energy. One of the objectives for this project was to perform a comparison to energy consumption at Forward Operating Facilities. For comparison purposes, FOB consumptions are going to be assumed to be greater than that of building #9246, as those facilities are thought to have greater occupancy as well as daily and weekend around the clock staffing (this facility was typically occupied by 2 personnel between 6:30AM and 3:30PM on weekdays only). So utilizing the building #9246 as a lower threshold for consumption purposes it is apparent that multiple PowerDish installations would be appropriate for FOB.

46
5.2.2 Maximize Renewable Energy Usage Purpose: The purpose of this PO was to show how much of the energy production of the PowerDish CHP system could be applied to building energy uses: electric and thermal. Metric: All of the energy measurements were to be measured and reported in kilowatt-hour (kWh) as described above. The actual measured energy production from the PowerDish CHP system can be compared to the actual building consumption and shown as a percentage (%) of the building consumption for electricity and for propane energy. Success Criteria: Success Criteria specified the PowerDish CHP output: • Provide 30% of the building electricity (direct reduction from the grid electricity provided);
and • Provide 50% of the thermal energy required from propane to provide space heating and water
heating for the building. Specifically it was stated that the PowerDish CHP target for the demonstration was to produce 30% of the electricity compared to the baseline ESTIMATE for the building consumption and to provide thermal energy to offset 50% of the ESTIMATE for the building consumption of thermal energy from propane. Results: ALL of the electricity provided from the PowerDish was from a renewable resource, the sun, and all of the electricity produced (measured post-inverter) was consumed by the Building #9246 (or Fort Carson). As described in Section 3, the electrical output from the PowerDish CHP inverter was directly connected to the Fort Carson power grid. As described in Section 2, meters for electricity and flow rate and temperature sensors for calculating thermal energy in the liquids circulating in the PowerDish cooling loop and the building heat loop were installed. Data from these meters and sensors were collected on 6 second intervals and used to record and report the total energy, electric and thermal, that were produced and delivered by the PowerDish CHP system and that were consumed by the building. Table 8 compares the PowerDish CHP energy delivered to the initial estimated consumption.
CHP Delivered Energy (kWh)
Initial Estimated Consumption (kWh)
% of Delivered Energy to Estimated
Consumption Electric (kWh) 4,238 16,800 25.2% Thermal (kWh) 2,082 32,400 (1200 gal) 6.4% Total Energy 6,320 49,200 12.8%
Table 8: Delivered Thermal Energy as % of Initial Estimated Building Consumption

47
As a point of reference, Table 9 shows the PowerDish CHP energy delivered compared to the actual building consumption.
CHP Delivered Energy (kWh)
Actual Building Consumption (kWh)
% of Delivered Energy to Estimated Consumption
Electric (kWh) 4,238 7,887 53.7% Propane (kWh/gal) 34,013 (1,260 gal)
CHP Thermal (kWh/gal)
2,082 2,082 (77.1 gal equiv)
Propane Equivalent Thermal (kWh/gal)
4.6%
Total Energy 6,320 43,982 14.4% Table 9: Delivered Thermal Energy as % of Actual Building Consumption It was observed and noted that, while it was considered during the design and layout of the site, a large poplar tree on site did have a slight impact on the output of electricity and thermal energy during a part of the year. The winter solar trajectory did cause afternoon shading from the poplar tree branches which was evident in the daily data (a slight loss of productive energy can be assumed but was not regarded as detrimental to the scope of the demonstration).
Figure 18: Example of tree shading on solar energy production
Production drop due to tree shade

48
Result – Electric Production: The PowerDish CHP delivered electricity (4,238 kWhe) is 25.2% of the baseline estimate of 5,040 kWhe and is 5% below the PO of 30% of baseline estimated electricity consumption. Electric output was lower than expected for 2 key factors:
1) PowerDish forced outages: 19 days in total with limited or no PowerDish operation due to PowerDish outage or control system forced outage; and
2) The controlled reduction of energy output that was implemented in order to maintain autonomous operation without generating system faults and potential PowerDish generator damage (>10% reduction over entire period).
Immediately following the initial startup of the PowerDish CHP system in December 2011, the PowerDish generator failed due to an over-stroke event. A new PowerDish generator was installed and the installation re-commissioned January 17th, 2012: the “revised” beginning of the demonstration period. From that early failure experience came some speculation from Infinia that the over-stroke failure may have been caused by the CHP application changes. Specifically, the higher coolant temperature’s effects on the magnets in the generator may cause a loss of control of the generator under certain conditions. (Post-generator teardown analysis showed that the failure was a loss of system control caused by a shorted wire that led to an over-stroke event.) As a result to this potential, Infinia changed some control setting that had the effect of reducing the peak amount of energy into the generator and consequently a reduction in electricity output. The amount of these control changes resulted in at least a 10% loss in electricity over the demonstration period. Additionally, the PowerDish generator itself failed in the summer 2012, due to a heater head failure. The whole heat drive was replaced with one that generated electricity only (no heat exchanger). This allowed the electricity generation to continue during a period when the thermal energy demand from building 9246 was very low. This period was also used to revise the system design in the building heat loop so that when the heat drive with the heat exchanger was re-installed and the CHP system re-commissioned in October, the new design significantly improved the thermal energy delivery to the end-uses inside the building; especially the space heating application. As a result of these PowerDish outages along with 4 days of outage due to storm damage to control and data collection systems, the PowerDish CHP system was not operating for 19 days (forced outage) and the thermal energy delivery to the building heat loop was not operating for an additional 44 days (electric-only operation) during the demonstration period. All energy uses within the PowerDish system (including the inverter conversion losses) were covered in the inverter output measurements. The small difference (76.6 kWh or 1.8%) between the meter reading at the inverter and the meter reading at the grid is explained by the small

49
amount of wiring losses at 208 volts between the inverter meter and the grid meter as well as the difference in the accuracy between the 2 different meters. As noted in Section 5.2.1, there is a small energy usage from motors in the building heat loop and the radiator loop that is included in the building consumption numbers. The best estimate of their consumption is about 167 kWh over entire demonstration period: about 3.9% of the delivered energy to the grid. The delivered electricity to the grid a shown in the Tables and Figures has NOT been reduced to account for this energy use that is the result of the CHP implementation. Result – Thermal Energy Production: The thermal energy PO was for ~50% production of the Baseline Estimate of 33,789 kWh (~1200 gallon of propane use per year); a PO of 16,000 kWh. The Baseline Estimate was for the estimated amount of propane that was being consumed annually to provide the space heating and water heating requirements of building 9246. So, the amount of thermal energy expressed in the PO is for a % of energy USED in the building for space and water heating. Thus, the PO target should be for the amount of thermal energy delivered to the building heat loop system for building application use. Table 9 above provides the actual thermal energy USED by the building heat loop from the PowerDish CHP. This value, 2,082 kWh, is only 6.4% of the Baseline estimated consumption of 1200 gallons or 32,400 kWh. This is well below the PO target of 50% of Baseline or about 16,000 kWh. The Baseline of 16,000 kWh is more closely related to the amount of thermal energy actually produced in the PowerDish CHP system measured in the PowerDish cooling loop (at the engine heat exchanger): a value of 11,110 kWhth. The reasons for the difference in values are explained below with some Lessons Learned for future applications in the Implementation Issues, Section 7. But, it is clear (in hindsight) that the PO target was incorrect for delivered thermal energy. However, the actual delivery of thermal energy to the building was too low and can be improved in the future. Incorrect PO Target: Thermal energy from the PowerDish CHP is the starting point for this discussion. The amount of energy PRODUCED by the generator (as measured in the PowerDish cooling loop) is directly linked and correlated to the electrical production. Solar energy that goes across the heater head in the Free-Piston Stirling Engine either produces electricity or is lost as thermal energy…most of which is in the cooling loop. The amount of thermal energy PRODUCED is correlated with the amount of electricity PRODUCED. From the data collected across the demonstration period, the electricity measured at the inverter was 4,315 kWhe and the thermal energy in the PowerDish cooling loop was measured as 11,110 kWhth. Consequently, within the PowerDish, for each kWhe produced about 2.575 kWhth is produced. The PO electricity target was 5,040 kWhe delivered to the grid. Then, the implied thermal energy produced in the cooling loop is about 12,980 kWhth (a total energy of ~18,000 kWh produced within the PowerDish CHP system during the demonstration period). This is the amount of thermal energy in the PowerDish cooling loop. This thermal energy amount has to be reduced

50
across the heat exchanger to the building heat loop. Then the energy must be delivered to building heat demands, e.g. space heating, water heating, and storage tank. For the months of May – September the thermal energy demand from the building is very small. If the heat exchanger were 70% efficient, then only 9,086 kWhth is put into building heat loop, if that much energy were being taken out by the end-use thermal demands (this would only be during the highest demand months of November – February). During those high thermal energy demand months, ~ 85% could get used in the space heating (and other applications). If all the months were ~85% extraction, the PO target should have been about 7,700 kWhth. The fact that 6 of 12 months have very low thermal demand (<10% of high use months), the PO target could easily have been 4,000 kWhth or less. So the PO target, as expressed, was not a reasonable target, in hindsight.
Table 10 (same as Table 1): Electric and Thermal Performance Summary Low Energy Delivery to Building Systems: Early in the project, the “Thermal Energy Delivered to the Building Heat Loop” in Table 7 was much lower than expected and desired. The nominal cooling loop temperature for the PowerDish in electric only operation typically stays below 45 C. For this CHP project, the cooling loop temperature was expected to be raised to about 70 C. “Thermal Energy Delivered to the Building Heat Loop” relies on:
51
1) the quality/temperature of the heat produced and presented at the heat exchanger on the engine; 2) the ambient air temperature; 3) the effectiveness and efficiency of the heat exchanger, 4) whether there is any “heat demand” in the building.
When the original PowerDish generator failed very shortly after commissioning in Dec 2011, Infinia engineering analysis of the failure and operating conditions made a preliminary finding that included the potential for the elevated cooling loop temperature to affect the magnet strength in the linear alternator which in turn could affect the control of the PowerDish III generator (and could lead to its failure due to “over-stroke). As a result, the cooling loop temperature was capped at a 60 C upper threshold for the duration of the demonstration. [This design constraint has been eliminated for new model designs of the PowerDish.] This had a direct result of decreased quality/temperature of the heat provided to the heat exchanger, and lower efficiency of the heat exchanger expecting to see a higher input temperature cooling fluid. This resulted in very low heat transfer to the building even during the winter period when the building heat demand was high. The building heating loop was also analyzed and determined to have a design that could be significantly improved for providing heat for space heating, which was a PRIMARY need for the building during the Fall/Winter months. During the summer, the building heat loop was redesigned and put back in service for the Fall/Winter period. Even while operating at the reduced cooling loop temperature of 60 C, the results for the October – December demonstrate that the building design changes had a dramatic effect on the amount of thermal energy delivered to the space heating needs of the building. As visible in the highlighted data in Table 10 above and Figure 22 below, the energy delivery to the radiant heat systems was improved during the last quarter of the project term. From this it is readily apparent that the heat delivered to the building can be efficiently distributed to the needed points of use (the data shows >80% of the thermal energy delivered to the building was being delivered to the radiant heat system during November and December). For the entire measurement period, 2,082 kWhth of thermal energy was delivered to the building point-of-use applications. This was, on average across the demonstration period, 18.7% of the total thermal energy available from the engine. The monthly amount delivered varied over the course of the year between 0% and 33% as shown below, with the colder months receiving greater percentage levels when the heating systems where in operation as shown in Figure 19.

52
Figure 19: % Thermal Energy Delivered The detailed discussion of the contributors to the low energy delivery to the building heat loop as well as the lessons learned for future projects can be found in Section 7: Implementation Issues.

53
5.2.3 Maximize Savings for System Economics Purpose: This performance objective (PO) was to measure the system economics when implementing the PowerDish CHP in the demonstrations as well as for future use in a FOB application. Metric: All of the energy measurements were in kilowatt-hour (kWh). The electricity savings can be determined using the electric energy rate, which is expressed in $/kWh. Based on the energy bills from the utility for the demonstration building, the avoided electricity commodity and demand rate was $0.05 / kWhe. The propane savings PO, however, is expressed in gallons / year of propane reduction and require the thermal energy to be converted to gallons. The conversion used for this report is 27 kWh/gal: a gallon of propane contains about 91,690 BTU per US gallon (Wikipedia) and 1 kWh =3411.142 BTU, so a US gallon = 26.88 kWh (or 27 kWh). The overall economics were to be considered for a 20 year period including the maintenance of the PowerDish CHP system. Success Criteria: Success Criteria was specified considering the PO for the energy provided from the PowerDish CHP system at the energy rates for the building (for the demonstration) and at the FOB costs for the future application at FOB. If the building saved $252 / year in electricity savings the electricity success criteria is met. If the building saves 600 gallons per year reduction potential, then the propane savings criteria is met. If the system COULD go 20 years with maintenance, then the lifetime success criteria is met. Results: Propane: The PowerDish CHP system delivered 2,082 kWhth to the building heat loop, which in turn delivered that energy to the heat loads within the loop. This energy delivered to the building heat loop was used by point-of-use applications that were otherwise serviced by propane energy: space and water heating. Converted to gallons of propane, the amount of thermal energy delivered by the CHP system off-set 77.1 gallons of propane at the end-use application. Because the propane burner is not 100% efficient in delivering the heat from combusted propane into space or water heating, a greater amount of propane was not burned. If the space heating and water heating application efficiency averaged 80% for the converting the energy in propane into heated air and heated water, then 96.4 gallons of propane were not burned as a result of the CHP demonstration. The PO success criterion was for 600 gallons of propane to be “saved”. The actual results were 16% of the PO target. As described in the previous section (Section 5.2.2), in hindsight, the PO target was incorrectly set. A PO target of <4,000 kWhth delivered to the building heat system and avoiding propane consumption would have been more appropriate. 4,000 kWhth would have off-set 148 gallons of propane at the point-of-use and with the burner efficiencies mentioned above, 230 gallons of

54
propane not burned would be a more appropriate PO. Still, for reasons described above regarding forced outages and commanded output reduction, as well as the low thermal energy demand within building 9246, the 96.4 gallons saved is only 42% of a revised PO of 230 gallons saved. Electricity: The PowerDish CHP system delivered 4,238 kWhe to the grid to off-set Building 9246’s consumption of 7,887 kWhe. At the PO implied $0.05/kWh, the CHP system off-set $212 of electricity charges. There is a small reduction in the savings as calculated due to the small energy usage of the building heat loop pumps that were included in the building electric consumption. This energy discussed in Section 5.2.2. above is estimated as 167 kWh and at $0.05/kWh reduces the savings by $8.35. No credit or value is taken for the reduction in electricity DEMAND charges; the $/kW charge versus the $/kWh energy charge. Usually, an intermittent resource like solar and wind are not steady enough year around to offset the charges applied by the utility for the cost of wires, transformers, delivery system…the demand or $.kW charges. However, the potential for statistically offsetting SOME demand changes on an annual basis is dependent on the structure of the tariff for applying demand charges. In this case we have applied NO benefit for reduced demand ($/kW) charges. 20 Years Operation with maintenance: The demonstration PowerDish CHP was a modified pre-production PowerDish system. The CHP demonstration exposed a constraint for the model available for the demonstration, PowerDish III. The increased PowerDish cooling loop temperature was a potential risk of generator damage for the PowerDish III (and earlier) models. Due to design changes, subsequent models do not have that same risk of generator damage when in CHP mode of operation. The electric-only version of the later PowerDish model, PowerDish 4 and PowerDish 5, are expected to operate in excess of 25 years with scheduled maintenance. The CHP version of the PowerDish 5 will be expected to also have a greater than 25 year life with scheduled maintenance. The PowerDish III model systems are no longer produced and are not available. According to Infinia’s document, SMP-014 PowerDish IV Scheduled Maintenance V11_0, the scheduled maintenance cycle to maintain the expected 25 year life includes:
Annual Inspections 10 Year Service Items: Replace Coolant Pump Replace Radiator Fan Replace Post-Box LED Indicator 13 Year Service Items: Replace Steering Thermocouples Replace Coolant Replace Drive Motors

55
Replace HCP Capacitors Replace Buck Converter Replace E-Max Stepper Motor Replace E-Max Screen
Because of the long periods between scheduled maintenance, an annual O&M reserve is sometimes used to put some financial reserves back to pay for the schedule maintenance that occurs much later in time. A suggested reserve for the scheduled maintenance is about $30/kW-yr. or about $90 per year. (The periodic cost of cleaning the mirrors is in addition to this reserve for scheduled maintenance. The frequency of mirror cleaning is solely dependent on the local site characteristics: the environmental conditions (dust, etc); the cost of labor and water; the value of the kWh produced and fuel costs avoided.). Improved durability is expected in the current and future PowerDish models versus the model used in the CHP demonstration. When considered for future FOB applications, the >20 year life with maintenance is anticipated. And, the $ savings associated with electric generation and hot water uses for point-of-use space and water heating are substantial. Unlike the highly competitive prices for electricity and diesel at Fort Carson, the prices for delivered electricity and diesel at a FOB can be very large. Anecdotal information in discussion with people associated with this project have suggested that at a FOB site, diesel fuel could be $50/gallon when delivered and used at the FOB. This translates to $3/kWh for the cost of electricity at a FOB experiencing this diesel fuel cost. If the FOB is experiencing this level of diesel fuel cost, then the 4,238.4 kWhe of electricity that were generated by the demonstration CHP system would save $12,715 and 241 gallons of diesel fuel. The 2,082 kWhth delivered to the building heat loop off-set about 2,603 kWhth with the fuel to point-of-use 80% efficiency established above. 2,603 kWhth is 8.88 million BTU and this is about 63,8 gallons of diesel fuel at the FOB. In total, at a FOB with the diesel fuel costs of $50/gallon delivered, 305 gallons of diesel fuel (241 + 63.8) would be avoided, for a savings of over $15,000 per year.

56
5.2.4 Minimize Direct GHG Emissions Purpose: This performance objective (PO) was to illustrate the amount of Green House Gas (GHG) could be reduced by implementing the PowerDish CHP system. The GHG focused on is CO2. Metric: The metric for this PO is pounds of CO2 reduced. The Colorado Springs Utility generation is mostly coal and natural gas in large steam power plants. They do not report on their website their CO2 emission rate, but from Energy Information Agency (EIA) information, www.eia.gov , for the Colorado state profile, Colorado electric utilities produce CO2 at a rate of 1,760 pounds CO2/MWH (1.76 pounds / kWh). The EIA also provide the CO2 emission factors by fuel type: • Propane produces about 5.8 kilograms/gallon (12.79 pounds/gal) of CO2 per gallon burned. • Diesel fuel produces about 10.2 kilograms/gallon (22.49 pounds/gal) of CO2 per gallon
burned. Success Criteria: The Success Criteria is based on the number of pounds of CO2 reduction per year that was achieved in the demonstration and that can be achieved with future applications. Specifically, if the amount of propane reduction could be achieved, then about 7,000 pounds of CO2 reduction could be expected. Results: The demonstration achieved 4,238 kWhe to the grid and avoided about 7,459 pounds of CO2 from avoided electricity (1.76 pounds/kWh *4238 kWh). Further, the 2,082 kWhth delivered to the building heat loop off-set 96.4 gallons of propane (when considering the conversion efficiency of the end-use systems). These saved gallons of propane reduced the CO2 emissions by 1,233 pounds (96.4*12.79). While the amount of propane reduction was less than the PO targets because of an incorrect PO and low heat delivery to the building for the reasons detailed above in the report, the demonstration did reduce the CO2 emissions by 8,692 pounds; exceeding the stated PO of 7,000 pounds CO2 reduction. For the demonstration level of performance at a FOB, the electricity and thermal CHP system production will offset diesel fuel. The 2,082 delivered thermal energy adjusted for the diesel heating end-uses (80% efficient) will offset 2,603 kWhth or 63,81 gallons of diesel. This will reduce 1,435 pounds of CO2 from the thermal energy offsets (63.81 gal*22.49 pounds/gal). The 4,238 kWh of electricity avoided 33.48 million BTU from FOB diesel generator which in turn avoided 241 gallons of diesel and 5,409 pounds of CO2 (4238 kWh*7900 BTU/kWh / 139200 BTU/gal*22.49 pounds/gal). Total CO2 reduction with demonstration results at FOB: 6,844 pounds of CO2 reduced.

57
With improvement in the heat exchanger system and in the overall CHP design (so higher temperature can be achieved), and at a FOB with higher annual thermal energy requirements than at Fort Carson, the amount of CO2 reduced versus supplying the energy requirement from diesel generator and diesel thermal energy space and water heating requirements could be 30% improvement over the demonstration result: 8,870 pounds of CO2 reduced.

58
5.2.5 Monitor Facility Metering Purpose: The purpose of this PO is to confirm the metering was installed that would be needed to measure the performance of the PowerDish CHP demonstration. Metric: No metric; only confirmation. Success Criteria: Confirm that the meters were installed to measure electricity, thermal and fuel consumption during the demonstration. Results: As presented earlier in the report, meters were installed at the Fort Carson Hazardous Waste Disposal Site, building #9426, and the site was monitored for energy consumption (electricity and propane) and the PowerDish CHP was monitored for produced and delivered energy (electric and thermal) on a daily basis for the demonstration period, January 17 2012 to December 31, 2012. The building electricity meter and the flow and temperature sensor readings at the engine and at several locations throughout the building heat loop used to calculate the thermal energy delivered to the building were monitored remotely. However, the propane meter was never able to be monitored remotely. The propane hourly consumption measurements were retrieved periodically during site visits by Infinia personnel. The data logging system worked well throughout the demonstration period. However, there were several days where data logging was interrupted to one or all of the meters/sensors due to loss of power to the site, loss of the on-site computer link to one or more meters/sensors, and storm/water damage. In all cases, using other data sources and data for similar weather conditions immediately before or after the interruption, the missing data was estimated. Following are the results of the meters and sensors installed to monitor the electricity, thermal, and propane energy consumed by the building.
Measured Consumption (kWh)
Actual Building Consumption (kWh)
Initial Estimated Consumption (kWh)
Electric (kWh) 7,887 7,887 16,800 Total Propane
Equivalent 34,013 (1,260 gal)
Propane (kWh) 31,931 (1182.6 gal) 32,400 (1200 gal) TE from CHP (kWh) 2,082 (77.1 gal equiv)
Total Energy 41,900 49,200
Table 11: Building 9246 Energy Measured Consumption vs Project Estimates (Table 5)

59
5.2.6 Monitor System Maintenance: Purpose: This performance objective (PO) was to monitor and describe the maintenance performance of the PowerDish CHP. Metric: Description of maintenance. Success Criteria: Mirror cleaning with no other maintenance in demonstration period. Results: System maintenance for the demonstration period was planned to require only routine Preventive Maintenance (DNI sensor and dish mirror cleanings) and was minimized as much as was possible. However, an unexpected engine failure during the demonstration period caused unscheduled maintenance: replacement of the failed generator with an electric-only PowerDish and then later (after design revision to the building heat loop and end-use controls) replacement of the electric-only system with a re-commissioned PowerDish CHP system. Replacement/re-commissioning events as well as some data acquisition failures required on-site personnel at various stages during the demonstration period. These actions and site visits are all listed in chronological detail within Section 7 of this report. Because of the PowerDish control changes that effectively caused the system to reject input heat beyond a certain solar irradiation level, the mirror did NOT need to be cleaned as often. Essentially, the mirror fouling acted as a passive heat reduction and reduced the amount of active heat rejection (by Over-Insolation control actions) required. Over the course of the 12 months, the dish was cleaned 6 times. While on-site for any reason, the slew cone/receiver was replaced. The PowerDish model used in the demonstration had an area around the heater head aperture (where the concentrated light goes into a cavity and onto the heater heat (hot end) of the generator) that reflected light away from the PowerDish that was not otherwise focused into the aperture. This area was the slew cone/receiver and was white color. Infinia found that on this and earlier models, the slew cone would become stained from dirt and moisture draining from the aperture. This dark stained (dirty) area would then absorb more reflected solar energy and could become heat stained or even damaged due to the over-heating in the dirty area. So, whenever Infinia personnel were on-site for other events, the slew cone would be replaced (to prevent over heating or even melting of the slew cone material). See the picture of the slew cone and aperture in the Over-Insulation discussion in Section 7.2. The slew cone is eliminated in the current PowerDish 4 and future PowerDish 5 designs and is no longer a maintenance item. As described in Section 5.2.3. above, the scheduled maintenance cycle for the PowerDish 4 and PowerDish 5 described in Infinia’s document, SMP-014 PowerDish IV Scheduled Maintenance V11_0, is:

60
Annual Inspections 10 Year Service Items: Replace Coolant Pump Replace Radiator Fan Replace Post-Box LED Indicator 13 Year Service Items: Replace Steering Thermocouples Replace Coolant Replace Drive Motors Replace HCP Capacitors Replace Buck Converter Replace E-Max Stepper Motor Replace E-Max Screen
Because of the long periods between scheduled maintenance, an annual O&M reserve is sometimes used to put some financial reserves back to pay for the schedule maintenance that occurs much later in time. A suggested reserve for the scheduled maintenance is about $30/kW-yr. or about $90 per year. (The periodic cost of cleaning the mirrors is in addition to this reserve for scheduled maintenance.) The PowerDish 5 envisioned for future CHP integration will follow a similar scheduled maintenance cycle as the current PowerDish 4. Its suggested reserve is likely to be about $20/kW or less per year…although $30/kW is used in Section 6 of this report. The frequency of mirror cleaning is solely dependent on the local site characteristics: the environmental conditions (dust, etc); the cost of labor and water; the value of the kWh produced and fuel costs avoided. There is no general “optimal” number of wash cycles. Rather, the “optimal” number of washes and the timing of the washes will vary. Some areas will have rain that can function to remove dust from the mirror and the timing of the cleaning cycles adjusted accordingly. The electric tariff in some areas changes as a function of time of year or even time of day. The changing value of the electricity will affect the “optimal” timing and frequency of the wash cycle. For example, during a low electric rate time when there is frequent rain, no wash cycles may be performed during those months (“spring” is often this set of conditions in some regions). But, during a period with very high rates during the peak of the day when conditions are very dusty (and labor is inexpensive), the wash cycle might be done monthly or even bi-weekly. The rate of output decline is very variable as a function of time as the examples suggest. Rather, the reduced output is a function of depth and extend of mirror coverage by dust. In the US Southwest where the conditions are hot and often dusty, during the peak summer period, the PowerDish might see a 10% decline in output after a month in these conditions. Infinia’s experience in these conditions suggest that the output tends to me somewhat asymptotic at around 20% reduction in output even after very long periods (e.g. 6 months) of no mirror cleaning. In the US, a reasonable plan for the rate of mirror cleaning might be about 6 – 12 times

61
per year. However, depending on the region and rates, the frequency might be 2 times per month for 2 or 3 months in the high electric value period and only one washing every 2 or 3 months during the low electric value periods. The actual site economic and environmental conditions will shape the mirror washing frequency.

62
5.2.7 Monitor System Integration: Purpose: This performance objective (PO) was to monitor and describe the system integration and any issues that emerge. Metric: Description of system integration. Success Criteria: No problems expected with other systems. Results: System integration into the Fort Carson Hazardous Waste Disposal Site on Butts Rd of the base went as planned for the PowerDish physical installation, building 9246 heat and hot water systems integration, instrumentation and controls install and integration as well as the eventual system upgrades during the September timeframe. Details of any and all noteworthy issues are included in the chronological detail within Section 7. The lower cooling loop temperature instituted by Infinia as a result of an early failure did cause some “mis-match” between the off-the shelf hardware and its actual performance at the lower temperatures presented. Also, 2 areas of performance improvement from better system integration can be noted here (and in Lessons Learned in Section 7): 1) better match between engine/building heat loop heat exchanger is needed; and 2) better design integration of the storage tank and end-use applications. Heat Exchanger: the temperatures in the generator cooling loop are rather low (60C – 70C), so a heat exchanger with sufficient surface area is needed to take advantage of the low temperature heat. Storage tank / end-use application design: A significant difference was observed in the ability to get thermal energy immediately to space heating applications (revised design) versus the initial design which had the building heat loop fluid exchange with the storage tank first before being presented for space or water heating application. Designing for the storage tank to be LAST in line for the thermal energy will make a significant difference in the amount of thermal energy that actually gets to the end-use application. All lessons learned are applicable to the FOB installation.

63
6.0 COST ASSESSMENT This section provides the calculated life cycle operational costs for the PowerDish CHP technology. It is not very useful to describe the costs for the non-commercial, modified PowerDish system that was used in the demonstration and which is no longer available. Rather, the cost assessment will focus on a PowerDish 5 based CHP system and the competing choices that a customer considering the choice of what to use for a combined electricity and thermal energy application. The PowerDish III-based CHP system used in the demonstration was a 3.0 kW rated system that was downgraded by the control system operation first to 2.7 kW and then lower. The PowerDish 5 system considered in this Cost Assessment Section is a 7.5 kW rated system. So the electric and thermal output of a PowerDish 5 will be more than 2.5X the demonstration model PowerDish CHP. Sufficient cost information will be provided in section 6.1 to enable reasonable cost estimates for implementing this technology at other sites. Section 6.2 provides a discussion of the Cost / Benefit Analysis and some comparisons to existing technology. Table 12 summarizes the key cost elements for an installation of the PowerDish CHP, identifies some of the data elements tracked during the demonstration, and provides estimates for a next generation PowerDish CHP implementation.

64
Cost Element Data Tracked During the Demonstration Estimated Costs for Future Implementation
Hardware capital costs Component costs for the PowerDish CHP, space & water heating, and all other hardware components in the demonstration
$15000 (PowerDish 5 w/ heat exchanger) + $10,000 (in-bldg application hardware) = $25,000 CHP system hardware
Installation costs Labor and material required to install $10,000 (installation of PowerDish) + $10,000 (installation of in-bldg systems) = $20,000 Installation Costs
Consumables Estimates based on rate of consumable use during the demonstration Water: 60 gal per year
Facility operational costs: Electric cost Energy cost for thermal loads
• Electricity cost and quantity that can be avoided
• Cost and quantity of fuel for space and water heating that can be avoided
Electric: 20,044 kWh per year @$0.11/kWh (ave) = $2,205 per year Thermal: 68.4 million BTU per year use @85% gas to thermal use conversion @ $6.50/mmBTU = $523 per year
Maintenance • Frequency of required maintenance • Labor and material per maintenance
action
Incremental above existing systems: $225/yr ($30 per KW installed) PLUS the periodic cost of mirror cleaning
Estimated Salvage Value Estimate of the value of equipment at the end of its life cycle 10% of initial cost
Hardware lifetime Estimate based on components degradation during demonstration 20 year
Operator training Estimate of training costs Incremental: minimal Table 12: Important Costs for Implementing the PowerDish CHP 6.1 COST DRIVERS Following are cost drivers to consider when selecting the PowerDish CHP for future implementation. Observations regarding site-specific characteristics or regional issues that may impact the costs or benefits when implementing the PowerDish CHP will be made. Hardware Capital Costs: The PowerDish CHP system (PowerDish 5 based system) will be the largest single component cost for the installation. The PowerDish (5) CHP system will benefit from volume production of the system and lower cost per unit of output is anticipated. However, the selection of space heating, water heating, and heat storage component choices will significantly affect the cost and benefits of an implementation. The thermal heat provided from the PowerDish CHP system is relatively low: 130 F – 160 F. Attention to the selection of components for space heating need to consider that large amounts of surface area are needed to transfer the low temperature heat to the room. Same with water heating: large surface areas are needed to transfer the low temperature heat to another liquid system. And the size of the thermal storage system and its integration into

65
the thermal system are important considerations for the overall performance and economics of the installation. Installation costs: The foundation for the PowerDish CHP and the electric interconnection costs are important cost considerations, but the space heating, water heating, and storage tank components and their interconnectedness are the dominant costs for the CHP installation. Important site specific considerations include: 1) un-obstructed (not shaded by terrain or vegetation) installation for the PowerDish CHP system; 2) close proximity of the PowerDish CHP system to the building that will be using the thermal energy; and 3) adequate thermal insulation for the pipes from the PowerDish CHP system outside to the interior systems that will use the thermal energy. Consumables: The only consumable for the PowerDish CHP system is small amount of water (7-10 gallons of water per washing) that is used to clean the mirrors of the concentrator dish periodically. While there is NO requirement for cleaning the concentrator dish for the system to operate, more output (electric and thermal heat) will be available with clean mirrors. The timing of the mirror cleaning is a function of the labor and water costs for cleaning and the avoided electric and fuel rates at the site. Depending on the amount of energy (electric and thermal) that can be recovered by cleaning versus the cost of cleaning will determine the timing and frequency of any mirror cleaning. Facility operational costs: Electric cost and quantity avoided: The PowerDish CHP is a concentrator solar system. As such, its performance is greatly affected by the quantity of Direct Normal Irradiation (DNI) available at a site. DNI is measured instantaneously as power (W/m2) or is expressed over time as energy (kWh/m2/time period). For example, the electricity (and thermal energy provided) for a site in the US Southwest (7-8 kWh/m2/day average) can be 2-4 times the output from a site in parts of the Northeast (2-3 kWh/m2/day). But the value of the thermal heat can be more valuable for a colder climate like the Northeast site. Sites that are away from the coasts and at somewhat higher altitude will perform better (often very much better) than a site at the ocean. But areas that have a very high electric rate AND/OR very high thermal fuel cost can provide opportunities for the PowerDish CHP in areas that may be lower DNI. Energy cost for thermal loads and quantity avoided: The previous discussion for high output DNI areas versus low DNI areas applies for the amount of thermal energy made available at a site. Certainly, high cost fuels for space or water heating can expand the geographic coverage where the DNI is sufficient to provide good economics for the CHP application.

66
Maintenance: The PowerDish is a low maintenance system featuring a generator that does not need maintenance for the life of the system and with long maintenance cycles for other components in the PowerDish. As described in Section 5.2.3. above, the scheduled maintenance cycle for the PowerDish 4 and PowerDish 5 described in Infinia’s document, SMP-014 PowerDish IV Scheduled Maintenance V11_0, is:
Annual Inspections 10 Year Service Items: Replace Coolant Pump Replace Radiator Fan Replace Post-Box LED Indicator 13 Year Service Items: Replace Steering Thermocouples Replace Coolant Replace Drive Motors Replace HCP Capacitors Replace Buck Converter Replace E-Max Stepper Motor Replace E-Max Screen
Because of the long periods between scheduled maintenance, an annual O&M reserve is sometimes used to put some financial reserves back to pay for the schedule maintenance that occurs much later in time. A suggested reserve for the scheduled maintenance of PowerDish 5 is about $30/kW-yr. or about $225 per year (although a lower O&M reserve is anticipated). The periodic cost of cleaning the mirrors is in addition to this reserve for scheduled maintenance. The frequency of mirror cleaning is solely dependent on the local site characteristics: the environmental conditions (dust, etc); the cost of labor and water; the value of the kWh produced and fuel costs avoided.
The PowerDish CHP system integrated with a building thermal energy system will require some annual maintenance to confirm that the systems are not leaking, and are functioning properly. These CHP systems will need maintenance similar to the heating and cooling systems they are supporting or replacing. In these economic analyses, it is assumed that the facility HAS some maintenance personnel covering the facility. Only the INCREMENTAL costs for the PowerDish CHP routine maintenance (mirror washing) are considered in this study. For the scheduled maintenance, described above, the cost of $30/kW-yr accumulated as a reserve (e.g. $225/yr) is also considered in this study.

67
Estimated Salvage Value: This varies substantially with the duty cycle of the CHP application. Generally, the PowerDish (electric only) system is estimated to have a 10% salvage value after its 25 year life cycle. The life cycle of the CHP system may have a life cycle similar to the thermal systems it is supplementing or replacing. The opportunity to continue to produce electricity even if the thermal systems are decommissioned provides for a more substantial salvage value at the end of the thermal system life cycle which may be shorter than the 25 year life for the electric production system. Hardware lifetime: The PowerDish electric only system has a lifetime of 25 year or greater. The system life estimates have been made from engineering analysis and from field experience of PowerDish units (electric-only) that have been installed. When incorporated into a CHP system, the PowerDish CHP may have a 20 year life (or more) for the thermal systems, but will still have extended life providing electricity even if the thermal systems are decommissioned or replaced. Operator training: Operator training should be similar to that given to operators or maintenance personnel for the thermal systems that the CHP is supplementing or replacing. For the electric production systems, they are simpler than IC or Diesel generator systems since they require no lubrication maintenance. The mirror cleaning is a simple, low skill task.

68
6.2 COST ANALYSIS AND COMPARISON This demonstration (and the subsequent commercial product) is a combined heat & power (CHP) application using solar energy to produce electricity and hot water through the Infinia PowerDish CHP. All future PowerDish CHP systems will NOT be the same PowerDish model as for the demonstration (which is no longer manufactured). For the purpose of this cost analysis, the 2014 PowerDish 5 model is used as the base system for the PowerDish CHP system. The electricity and hot water are used by a “host” facility and offset electricity from the utility electric grid or from an on-site generator-based mini-grid as well as offsetting electric or fossil fuels for space and water heating needs of the building/facility. A wide variety of electric costs and fossil fuel costs can be observed in markets as well as a very wide range of electric and fossil fuel consumption patterns (load / capacity factors). The “ideal” facility / building for this commercial technology application is a building that: 1) Is located in a high direct normal solar irradiation (DNI) area such as the US SW; 2) Has a high use factor for electricity and space heating / cooling during the daylight hours;
and 3) Has high electric and high heating fuel costs. The demonstration technology was based on a PowerDish rated at about 3.0 kWac (and later reduced to below 2.7 kWac). At the specific location near Colorado Springs, CO, the unit was expected to produce about 5,500 kWh/yr (electric). Operated in CHP mode, the unit should produce over 2X the electric energy in thermal energy in the form of hot water in the generator cooling loop. About half of that energy could be transferred to a building for use in space or water heating at a given site. While PowerDish III (the demonstration model) was rated for 3.0 kWac in electric-only mode of operation, the Infinia PowerDish 5 is rated at 7.5 kWac (electric-only mode); 2.5X the rated power of the demonstration model PowerDish. At the same Ft. Carson location, the PowerDish 5 is expected to provide 13,750 kWh/yr of electricity (versus 5,500 kWh for the PowerDish III) with about 14,000 kWh/yr of thermal energy expected to be used by a facility that has a good thermal energy demand (for end-use applications like space heating or cooling, process heat, and water heating). Example Site: Office Use facility For the economic analysis, a good DNI site in the US Southwest (example: Southern California, inland site: example Calipatria or Armargosa) is postulated with a Direct Normal Irradiation of 7.25 kWh/m2/d. This proposed site represents an “office” or “commercial” type environment where a worker population comes to work at 8:00am and ends the work day at 5:00 pm, Monday through Friday with a small number of workers (e.g. security, cleaning, IT, etc) working over the weekend. The “office” or “commercial” site has a full time maintenance person(s) that covers

69
this facility in his/her work duties. The electric rate is a 2-tier time-of-use, net metering rate that averages $0.13/kWh during the summer peak rate (April – October, Monday - Friday) during the day (7am-7pm), and averages $0.09/kWh for the winter peak rate (6am-6am). The rate for all other periods for the summer and winter is $0.08/kWh. These patterns of use result in a weighted energy cost of about $0.11/kWh which also represents the value (avoided cost) for the electricity produced by the PowerDish during the various rate time periods. Electric usage in the summer is at least double that of the winter due to air conditioning loads. The facility electric use in the winter consumes all of the output from the PowerDish while the summer facility electric use is more than the available output from the PowerDish. The PowerDish was able to be installed near the facility with a relatively short run to the tie into the building space heating system. The water heating and the space heating systems are natural gas systems with the gas cost of $6.50/mmBTU. We will assume that the building systems convert natural gas energy at 85% efficiency into thermal energy actually used as water and space heating (high efficiency conversion). The Infinia CHP system and the building water heating and space heating system to which it is attached has a 20 year life. For each kWh electric that the Infinia PowerDish CHP system produces, it produces more than twice as much kWh (thermal). For the purpose of this study, it is assumed that less than 50% of thermal energy available in the PowerDish CHP cooling system is actually captured and used in the office/commercial building. So, we will make the amount of thermal energy actually used by the building equal to its kWh electric production. For the O&M costs, only the INCREMENTAL cost of routine maintenance for cleaning the dish and the alternate PV systems is included in the economic study. The scheduled maintenance costs are also included for the PowerDish CHP and alternate PV/Thermal systems in the economic study. Assumptions: Infinia PowerDish 5 electric production:
20,044 kWh per year; 13,340 kWh during the Summer period (April – Oct)
9,529 kWh during week 3,811 kWh during weekends
6,704 kWh during the Winter period (Nov – Mar) 4,789 kWh during week 1,915 kWh during weekends
Building energy consumption: ELECTRIC
>20,044 kWh per year >13,340 kWh during Summer [13,340 kWh available from PowerDish CHP] 6,704 kWh during Winter [ 6,704 kWh available from PowerDish CHP]
THERMAL Energy Consumed by facility

70
>20,044 kWh per year (68.4 million BTU per year) 9,925 kWh during (May- Sept) [ 9,925 kWh available from PowerDish CHP]
>10,119 kWh during (Oct – April) [10,119 available from PowerDish CHP] Natural Gas consumed (85% efficiency) to produce the Thermal Energy Consumed: 23,581 kWh per year or 80.46 million BTU.
Electric Rates: 2-tier time-of-use, net metering rate $0.13/kWh during the summer peak rate (April – October, Monday – Friday, 7am – 7pm); $0.09/kWh for the winter peak rate (Nov – Mar, Monday – Friday, 6am – 6pm); $0.08/kWh for all other periods summer and winter. ($0.11/kWh annualized rate for solar operating periods) Natural Gas Rate: $6.50/mmBTU (mmBTU/293.0711 kWh) = System Lifetime: 20 year CHP System Capital cost: $24,000 for installed PowerDish CHP system (provides thermal energy to an external building heat loop across a heat exchange) $20,000 for building heat loop with hot water, space conditioning, hot water storage tank system, thermostat, valves, pumps, and insulated piping. CHP System Maintenance Costs: INCREMENTAL cost for cleaning the dish is $100 per year (assumes that there are salaried maintenance personnel that will do the dish cleaning/washing). Scheduled maintenance costs are also included for the PowerDish CHP in the economic study. The PowerDish 5 reserve rate is $30/kW-yr ($225/yr and is “rounded up” to $250/yr for the study. RESULTS: Using the MILCON Energy Project Model with the parameters above and a 20 year real discount rate of 0.8% from the OMB circular A-94, the PowerDish CHP Solution provides a: Saving-to-investment ratio = 1.24; Real internal rate of return of 1.89%, and Simple payback in year 18.

71
Installed cost lower, rates higher, and/or higher PowerDish output (more energy savings) and the Project is even more cost effective. Alternative FEMP discount rate: Using the FEMP real discount rate of 3%, the installed capital cost must be at $42,500 for the “breakeven” results: a $1,500 reduction in installed capital. Model runs output summaries with the MILCON and FEMP discount rates are included in Appendix B. ___________________________________________ COMPETING TECHNOLOGY: The competitive technology for the Office Use facility described above is a Photovoltaic (PV) installation for electricity and a solar thermal installation for the thermal energy production. At the specific site described with a DNI of 7.25 kWh/m2/d, about 9.6 kWdc of solar PV (thin film) will need to be installed to provide the SAME electric output (20,044 kWh/yr) to the facility as the PowerDish CHP system (ref: Infinia Performance Model and NREL S.A.M.; see Appendix D for discussion). The installed cost for a small PV system at the commercial site is about $2.50/Wdc or about $24,000 for the installation needed to produce 20,044 kWh per year (about the same installed cost as the PowerDish CHP system). The solar thermal system selected and installed will be a low or medium-temperature collector system that will need to provide 40,000-45,000 kWh (~136-150 million BTU/year) hot water at ~60C to the heat exchanger to the building system in order to have about 20,044 kWh (68.4 million BTU per year) USED by the building. This system will require solar collectors, a heat exchanger, pump, and associated piping and controls. At 7.25 kWh/m2/d DNI (2,646 kWh/m2/yr), we need to have at least 16 m2 (about 8x 2m2 collectors) to collect enough solar radiation. At 70% efficient for getting solar energy into the liquid heat loop, we need about 23 m2 of solar collectors installed (with piping, heat exchanger, pump and controllers). 8 collectors (2 m2 each) with the associated piping, heat exchanger, pump and controls for a closed loop heating system is estimated to cost about $20,000 installed (ref: www.jc-solarhomes.com). This closed loop heating system is linked to the building water heating and space heating systems loop that carries the heat from the closed-loop solar thermal system to the building thermal system and its water and space heating applications. Because we have matched the PowerDish thermal production with the installed solar thermal system, the cost for the building thermal system and applications is the same as for the PowerDish CHP application: $20,000. Summary Inputs: PV System: 9.65 kWdc PV system installed: $24,000

72
Solar Thermal System: 16 m2 installed with exchanger, pump and controls: $20,000. Building thermal loop with water and space heating applications: $20,000 Total investment: $64,000 (without consideration of rebates or incentives) We make a simplifying assumption that the PV System PLUS the Solar Thermal System O&M costs are the same as the PowerDish CHP. As with the basecase conditions, it is assumed that a salaried maintenance personnel cover the facility and take on the mirror/PV panel cleaning duties. The INCREMENTAL cost for cleaning the dish or the panels is $100 per year. The PV system will need to have the PV panels washed/cleaned periodically and on a similar schedule as the PowerDish. Also, the PV system will need to have the inverter maintenance performance on a similar schedule as with the PowerDish. The Solar Thermal system will need to have pumps, fans, sensors, fluid change-out, and other such hardware maintained over the life of the system. So, for simplicity we have made the PowerDish equal to the PV and Thermal system maintenance costs at the rate of $250/yr (this is a conservative simplification as the PowerDish maintenance is expected to be less over the lifetime). Then, the main difference between the current solar PV + solar thermal solution versus the PowerDish CHP solution is the initial installed cost. Evaluated in the same MILCON Energy Project model as the PowerDish CHP solution and with the same OMB discount rate of 0.8%, the PV-Solar Thermal Solution with the assumptions but has a SIR of 0.85; an AIRR of 0.02%; and a simple payback never reached in the study period. To get to a “breakeven” with SIR of 1.0, the total initial investment of this solution needs to be reduced to $54,660 (a $9,340 reduction). Following is a Table that summarizes the Important Costs for the PV and PowerDish CHP solutions for the “Office/Commercial Use facility”.
Cost Element Estimated Costs for future PowerDish CHP Implementation
Estimated Costs for Current PV-Solar Thermal Implementation
Hardware capital costs
$15000 (PowerDish 5 (7.5kW) w/ heat exchanger) + $10,000 (in-bldg application hardware) = $25,000
$ 9,600 (9.6kW Thin film PV w/ inverter) + $10,400 (Solar Thermal system: 68 mmBTU) + $10,000 (in-bldg application hardware) =$30,000
Installation costs $10,000 (installation of PowerDish) + $10,000 (installation of in-bldg systems) = $20,000
$ 9,6,000 (installation cost of PV system) + $10,000 (installation of solar thermal system) + $10,000 (installation of in-bldg systems) = $34,000
Consumables Water: 60 gal per year Water: 60 gal per year
Facility operational costs: Electric cost Energy cost for thermal loads
Electric: 20,044 kWh per year @$0.11/kWh (ave) = $2,205 per year Thermal: 68.4 million BTU per year use @85% gas to thermal use conversion @ $6.50/mmBTU = $523 per year
Electric: 20,044 kWh per year @$0.11/kWh (ave) = $2,205 per year Thermal: 68.4 million BTU per year use @85% gas to thermal use conversion @ $6.50/mmBTU = $523 per year
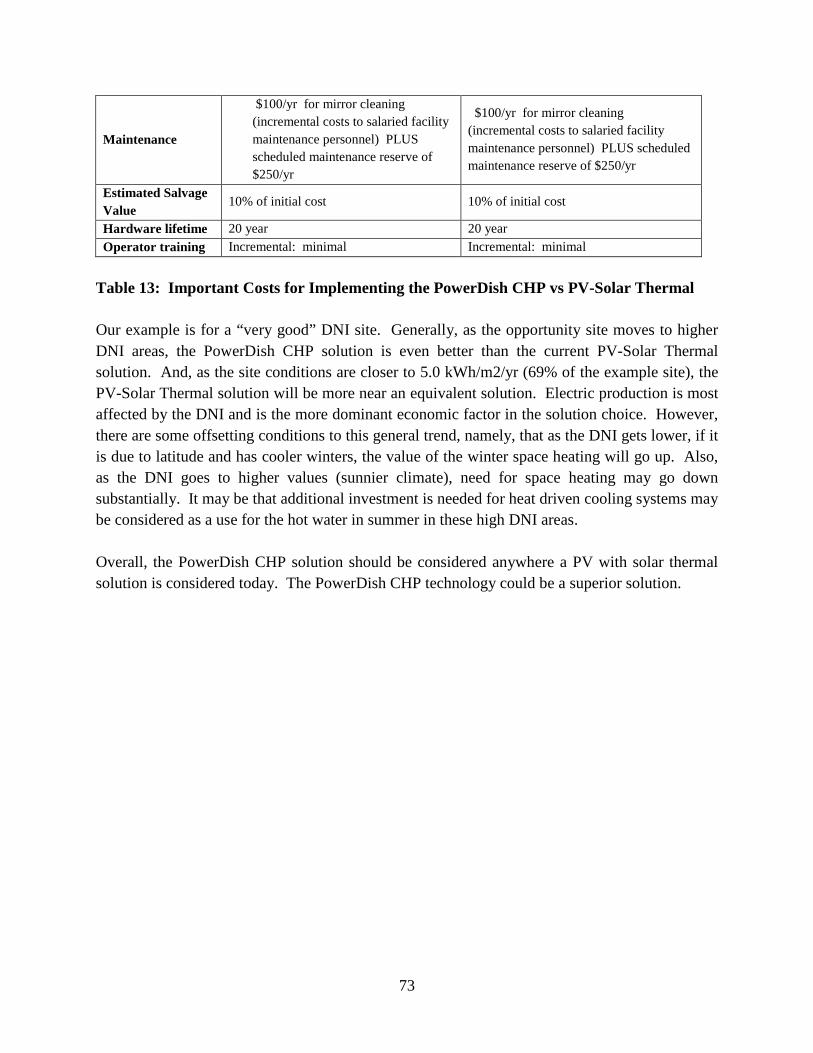
73
Maintenance
$100/yr for mirror cleaning (incremental costs to salaried facility maintenance personnel) PLUS scheduled maintenance reserve of $250/yr
$100/yr for mirror cleaning (incremental costs to salaried facility maintenance personnel) PLUS scheduled maintenance reserve of $250/yr
Estimated Salvage Value
10% of initial cost 10% of initial cost
Hardware lifetime 20 year 20 year Operator training Incremental: minimal Incremental: minimal
Table 13: Important Costs for Implementing the PowerDish CHP vs PV-Solar Thermal Our example is for a “very good” DNI site. Generally, as the opportunity site moves to higher DNI areas, the PowerDish CHP solution is even better than the current PV-Solar Thermal solution. And, as the site conditions are closer to 5.0 kWh/m2/yr (69% of the example site), the PV-Solar Thermal solution will be more near an equivalent solution. Electric production is most affected by the DNI and is the more dominant economic factor in the solution choice. However, there are some offsetting conditions to this general trend, namely, that as the DNI gets lower, if it is due to latitude and has cooler winters, the value of the winter space heating will go up. Also, as the DNI goes to higher values (sunnier climate), need for space heating may go down substantially. It may be that additional investment is needed for heat driven cooling systems may be considered as a use for the hot water in summer in these high DNI areas. Overall, the PowerDish CHP solution should be considered anywhere a PV with solar thermal solution is considered today. The PowerDish CHP technology could be a superior solution.
74
7.0 IMPLEMENTATION ISSUES Among the issues encountered during the year-long demonstration period, the PowerDish system experienced periods of unplanned outage as well as an Infinia imposed power output reduction strategy that was adopted in order to improve PowerDish CHP survival during high heat flux changes under unattended, autonomous operation. 7.1 Pre-Demonstration Issues There were two events following the installation of the PowerDish CHP system at Fort Carson that affected the official demonstration start-date of January 17, 2012. The events were: 1) grid interconnection; and 2) an early unit failure. 1) Grid Interconnection Issue: This occurred at the initial installation and start up when the
PowerDish inverter system was unable to connect with the Fort Carson grid due to a parameter mismatch within the invertor control algorithm. Infinia implemented a software code update which allowed the grid interconnect to fully complete before system timeout was reached. This software update was completed within 3 weeks of the equipment install date and performed without further issues from that time on. This control algorithm improvement enables improved interconnection robustness to the many differing electrical grid requirements.
2) Early generator failure: On December 31, 2011, the PowerDish system autonomously shut down after experiencing a loss of control of the generator stroke (over-stroke) event resulting in its inability to restart. This event is covered in Appendix E with the teardown root cause analysis for engine M056 which defined a broken sensor wire as the ultimate cause. This period of inoperability allowed for the remedy of some known hydronic fluid leaks hidden within the PowerDish support post as well the installation of improved insulating materials to the fluid piping at the PowerDish. This outage caused the demonstration to “re-start” following the replacement of the PowerDish generator in January 2012.
7.2 Demonstration Period Issues During the Demonstration Period, January 17, 2012 through December 31, 2012, the following significant issues were addressed:
1) PowerDish CHP cooling loop temperature reductions 2) Low Thermal Energy delivery to building 9246 3) PowerDish generator failure
1) PowerDish CHP cooling loop temperature reductions: Following the December 2011
generator failure, Infinia imposed a reduction in the generator cooling loop temperature (from 70C to 60 C); AND heat input reduction (resulting in reduced energy production). Due to the generator failure, there was some suspicion with Infinia engineers that the cause may

75
have been due to a temperature induced reduction in magnetic field strength (inside the generator) that in turn can cause a generator over-stroke which can result in generator damage or even failure. The generator teardown analysis confirmed the failure was due to over-stroke, but the root cause was determined to be a broken sensor wire. However, the temperature reduction was continued. The heat input reduction was related to the potential for generator over-stroke during periods of rapid energy input change, e.g. moving from cloud over back to full sun conditions. The reduced energy input strategy during high power conditions (high solar conditions) ensured enough safe operating margin with the existing control system so that the over-stroke potential was substantially reduced; especially since the unit was operating in autonomous mode with no onsite operator to hear, see, and correct over-stroke conditions. Lower generator loop temperature and reduced solar heat input (during high irradiation conditions) were the Infinia imposed conditions so that demonstration operations could continue.
As described several times in the Report, Infinia imposed a “solar heat reduction” strategy to add some operating margin for the PowerDish in order to avoid “over stroke” events during periods of high solar irradiance and rapid changes in the irradiance such as when the system moves from cloud to full sun conditions. One of the main tactics for reducing the amount of solar energy that goes into the Stirling generator is to move the PowerDish such that the solar energy is not centered on the receiving area….energy is “spilled”. This method of control is called “Over Insolation”. Over Insolation, commonly termed OI, is a controlled PowerDish operational method where sunlight is intentionally spilled beyond the aperture as a way to shed excess input energy. Infinia implemented OI during most of test period in order to operate in unattended, autonomous mode without risking PowerDish CHP system damage.

76
As the PowerDish tracks the sun across the sky, control algorithms introduce an offset to the exact angle required for perfect alignment and then sweep that offset over 360 degs. to create a halo effect surrounding the aperature hole in the slew cone—reducing the suns input energy onto the hot end of the engine
Figure 20: OI (Over Insolation) (photo taken through welding lens)
2) Low Thermal Energy delivery to building 9246: The predominant issue with the CHP demonstration overall was the low level of heat delivery to the building. During the early months of the Demonstration, the daily operation showed, on average, 18% of the thermal energy available at the engine was getting to the building systems. This low heat transfer was first observed during the December 2011 testing and was initially thought to be largely due to thermal losses occurring between the PowerDish engine and the building thermal systems. Subsequent testing on site provided insight on a number of contributors that caused lower than expected thermal energy delivery. These contributors are listed and a discussion of each follows. A Lessons Learned summarizes the implication for future applications. Itemized contributors:
1) Liquid-to-liquid heat exchanger efficiency and dynamic operation 2) Expected thermal energy input of installed building systems 3) Prototype engine and controls restrictions on thermal energy output of PowerDish 4) Thermal energy delivery to building 5) Design of building systems 6) Optimized thermal energy drop within “point of use” 7) Optimized system losses
Contributor 1: The liquid to liquid heat exchanger efficiency and dynamic operation contribution is most obvious within the daily data output and analysis. The data shows that the CHP liquid - liquid heat exchanger is outputting a range of 40-55C coolant for use at the
Aperture
Controlled spillage onto slew cone

77
installed building systems. This temperature increases throughout the day with the largest amounts of heat transfer taking place during the early hours of system operation. The heat transfer rate visibly decreases as the building systems come up in temperature over the course of the day as warmer coolant is returned to the CHP PowerDish from the building and building demand lowers. This heat exchanger was selected from readily available off-the-shelf components and is rated for cooling 82° C process water with 29° C water and a 69 kPa pressure differential. This heat exchanger would perform better at increased engine coolant temperatures, but only slightly. It is apparent that the CHP system would benefit greater from a heat exchanger designed specifically for the actual dynamics of the engine coolant temperature and building system response ranges. While investigating, additional instrumentation was added during the demonstration in order to understand the system dynamics present within the liquid – liquid heat exchanger. This testing provided a series of snapshots showing the limited amount of thermal energy being extracted from the engine coolant by the building coolant. The other recognized facts present in this data and discussed later in this section are 1) heat up time--the building coolant volume being much greater than the engine volume (length of buried piping) and 2) the driving 60C engine coolant temperature threshold.
Figure 21: Heat Exchanger functionality and performance testing
Engine coolant temperatures into and out of HeX (TE-8 and t/c4)
Building coolant temperatures into and out of HeX (t/c1 and t/c2)

78
Contributors 2 and 3: These are best explained by the cooling loop temperature level at the Stirling engine utilized during this demonstration and the requirements of the standard off the shelf solar hydronic heating products installed . These heating products typically have an expected fluid temperature input of 70-80C. The original Stirling engine (s/n M056) which was installed in the PowerDish during early Nov 2011 time was at that time a higher performing pre-production level system and was planned to be capable of higher running coolant temperatures with increased thermal output. But, it suffered an engine failure while in operation during the first month of operation; on the last day of December 2011. As a result of this event a 60C threshold was placed on the engine coolant temperature as preventative measure allowing unattended autonomous operation of this prototype system. Contributor 4: The thermal energy delivery to the building was measured to be a small fraction of the available thermal energy produced by engine. The data shows that the temperature of the fluid at the inlet to building increases throughout day but never exceeded 54 C during the demonstration period. This is predominantly because of the 60C source temperature driving the system energy transfer but also because a portion of the thermal energy flowing to the building was reheating return coolant to the engine (data was recording showing building coolant temperature increase between the building exit and the inlet back to the dish at the base of the post). Figure 21 shows the maximum glycol temperature coming into the building. The upper inset shows the solar data with continuous PowerDish operability over full day. The two dips in temperature in the main system temperature plot indicate calls for solar heat flow to building to shut off. Lower inset shows the flow pump shutting off (aqua blue) at the times coinciding with the dipping temperature lines.

79
Figure 22 : Glycol temperature coming into the building Contributor 5: The specification of building systems were originally designed with the storage tank as the primary energy use and the radiant heat and hot water heating as secondary/tertiary energy use (primarily because of an expected 70C+ coolant temperature into the building). The gathered data shows that the 105 gal storage tank when cold from overnight, especially during cold weather periods, could dip in tank temperature to lower than the 20 C range (partially due to poor building insulation) and could take over ½ of an operational day to come up to a temperature range to allow heat transfer/flow for the radiator system to engage. On a typical day, the building occupants would leave the premises for the day soon after the thermal energy would reach a level of possible usage and then the programmable thermostat would soon after set the building conditions back into a conservation mode. The stored tank energy would then dissipate overnight. The next day, the energy would go into heating the storage tank back up, but no heat would go to the radiators until late into the day (all the heat going to heat the storage tank). Figure 22 shows days where the storage tank was able to retain much of the stored energy from the previous day. Figure 23 shows a day where the storage temperature was lower at the start of the day and over a 7 hour operational period gained 10 C temperature increase and Figure 24 shows a 20 C temperature increase.
Glycol Temperatures: Green-into building TE-3 Purple-out of bldg TE-5 Blue-in bldg TE-4
Glycol Temperatures: L Blue-into radiators TE-7 Orange-out of radiat. TE-6
Glycol Temperatures: Blue-Out of engine TE-1 Red-Into engine. TE-2
Miscellaneous Temperatures: Pink-Hot Water Heater TE-13 L Green-Storage Tank TE-15

80
Figure 23: Storage tank temperature heating
Figure 24: System thermal dynamics with 20 C tank temp increase
7 hrs operation, bldg staff goes home approx 3:30
Storage tank temp heating
∆T (TE3 to TE5) Bldg inlet to outlet decreasing over time
Storage Tank Temp
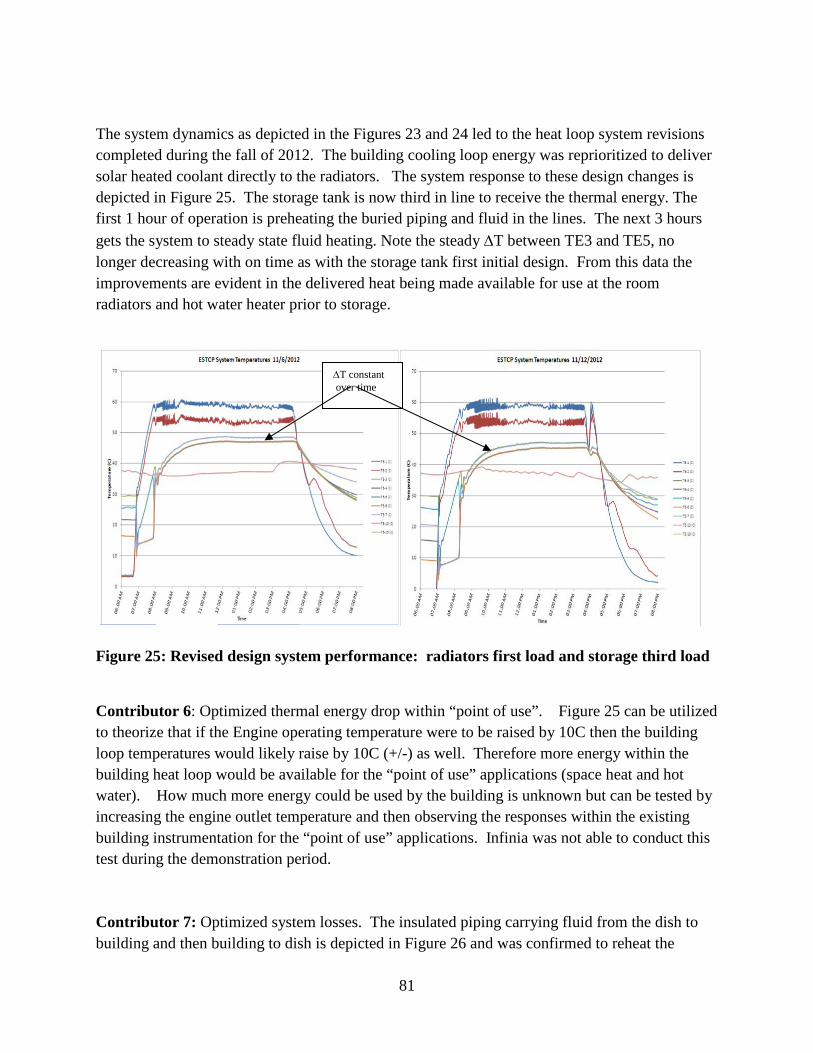
81
The system dynamics as depicted in the Figures 23 and 24 led to the heat loop system revisions completed during the fall of 2012. The building cooling loop energy was reprioritized to deliver solar heated coolant directly to the radiators. The system response to these design changes is depicted in Figure 25. The storage tank is now third in line to receive the thermal energy. The first 1 hour of operation is preheating the buried piping and fluid in the lines. The next 3 hours gets the system to steady state fluid heating. Note the steady ∆T between TE3 and TE5, no longer decreasing with on time as with the storage tank first initial design. From this data the improvements are evident in the delivered heat being made available for use at the room radiators and hot water heater prior to storage.
Figure 25: Revised design system performance: radiators first load and storage third load Contributor 6: Optimized thermal energy drop within “point of use”. Figure 25 can be utilized to theorize that if the Engine operating temperature were to be raised by 10C then the building loop temperatures would likely raise by 10C (+/-) as well. Therefore more energy within the building heat loop would be available for the “point of use” applications (space heat and hot water). How much more energy could be used by the building is unknown but can be tested by increasing the engine outlet temperature and then observing the responses within the existing building instrumentation for the “point of use” applications. Infinia was not able to conduct this test during the demonstration period. Contributor 7: Optimized system losses. The insulated piping carrying fluid from the dish to building and then building to dish is depicted in Figure 26 and was confirmed to reheat the
∆T constant over time

82
returning fluid to the dish by approximately 1 to 2 C (1.8 to 3.6 F). This piping arrangement was chosen for best installation purposes, but did not account for the reheat effect on the return glycol fluid (4 in conduit with cellular insulation encasing 1 in PEX piping).
Figure 26: Piping & insulation to transport heated glycol between PowerDish and building Low Energy Delivery to Building Systems: LESSONS LEARNED In conclusion, the lessons learned for improving the CHP application in future Projects can be summarized as:
a) Need low-temperature heat exchanger for more heat to building and applications b) Keep Solar CHP system close to the building and Point-of-Use applications to minimize
losses c) Take thermal heat directly to the Point-of-Use applications first and then to storage to
maximize the utilization of available thermal energy d) Use an improved design PowerDish that enables 70C generator cooling loop temperature
to improve efficiency of heat transfer to building and Point-of-Use applications 3) PowerDish generator failure: In August 2012, the engine would not restart after coming off
sun. This engine was quickly replaced with an electric-only version (no integrated heat exchanger) which ran until early October. The building heat loads in August and September are very low (almost non-existent) so the continuation during the period with electric only did not substantially change the building thermal energy use conditions. During this “electric only” period, multiple building heat loop improvements were made to enhance thermal energy use in the building point-of-use applications. In early October, the electric-only generator was replaced with a CHP generator (with integrated heat exchanger) and the system re-commissioned with the building heat loop and continued to operate through the remainder of the demonstration period. A generator teardown root cause analysis (see Appendix F for the teardown analysis for engine M067) discovered a heater head failure and helium leak as the root cause.

83
Monthly Chronological Tracking Once the site was prepared and PowerDish installation completed, a chronological tracking of the major events throughout the demonstration period was logged. The most significant of these were based around protecting the PowerDish from “overstroking” while maintaining the autonomous operability of the site through energy reduction strategies and engine coolant temperature threshold caps.
Monthly Chronological Tracking: October 2011 Pre-Demonstration Period
-Intended completion of installation and start of Demonstration -Infinia imposed 1 month “shake down” test period for CHP PowerDish at Kennewick site
November 2011 Pre-Demonstration Period
-Fort Carson site building integration work completed -CHP PowerDish Shipped and installed at Fort Carson -Fort Carson grid interconnect issue preventing start of demonstration
December 2011 Pre-Demonstration Period
-December 14 – Original Demonstration starts after software revision of the PowerDish inverter start sequence -Additional pump added in series to increase the flowrate to the heat exchanger on the building side of the system -Leaking (small areas of dripping) hydronic fluid (building loop) visible beneath post of PowerDish -December 31 – PowerDish engine failure due to a root cause of a damaged sensor wire causing intermittent position control feedback and a piston overstroke event
January 17, 2012 Demonstration Period (re-start)
-Replacement engine shipped to Colorado Springs for integration of CHP components (at local supplier shop) -Failed engine removed and PowerDish support structure disassembled allowing leak repairs (replacement of existing coolant lines for improved durability) January 17 -- Demonstration restarted with replacement engine and repaired fluid couplings and lines -Data acquisition and communication over satellite internet improved for better remote operability and on site camera functionality -Engine coolant threshold of 60 C maximum established after magnet degradation (over temp)

84
theorized during the post mortem analyses of the failed engine -Some OI (over insolation) introduced during daily operation to benefit magnet longevity and permit unattended operation of the installation
February 2012 -Site monitored for performance and function -Data indicating lower than expected heat transfer to building #9246 systems -Programmable thermostat for building heat replaced by Fort Carson personnel (pipe freeze in exterior building wall root cause)—was reinstalled approx 3 weeks later
March 2012 -March 5-6, Additional instrumentation installed into coolant lines and testing performed to understand root causes of heat transfer performance related shortcomings -Monthly cadence for preventive “dish cleaning” maintenance instituted -First receiver and slew cone replacement required and monthly checks established in accordance with “dish cleaning” -OI usage increased
April 2012 -Performance degradations imposed w/in system controls to maintain autonomous operability -OI usage increased to nearly 100% of daily operation periods
May 2012 -Performance degradations revised w/in system controls in order to maintain autonomous and maximize system performance -Receiver and slew cone replacement
June 2012 -Receiver and slew cone replacement -Performance degradations revised w/in system controls in order to maintain autonomous and maximize system performance
July 2012 -Performance degradations revised w/in system controls in order to maintain autonomous and maximize system performance -Receiver and slew cone replacement -July 27-30, data acquisition failures, computer off line (root cause unknown)—manual reboot required
August 2012 -Receiver and slew cone replacement -August 6—system experienced start fault and was down until replaced with an electric only PowerDish on August 17

85
-CHP PowerDish shipped to Ogden Utah for replacement and reintegration of CHP system (planned to reinstall on site October after heating system improvements made) -August 26-30 camera, computer and data acquisition went down after power outage and depletion of the installed battery backup capability -August 31 PowerDish operation restored with limited data acquisition (forcing use of inverter generated power production numbers)
September 2012 -Electric only system ran entire month with limited data acquisition -Building heating systems improved to make better use of the thermal energy delivered -September 28 -- another power outage event knocked system out for remainder of month
October 2012 -PowerDish production restored with limited data acquisition -Building system revisions integration completed October 5 -Slew cone and receiver replaced -CHP integrated replacement engine installed and operational by October 10 with all data acquisition restored except for Flowmeter that was damaged by electrical surge -Flowmeter disassembled and repaired with new hardware for October 26 (building radiator heating loop) -1:00PM, October 26 system reinstated fully
November 2012 -Full operation, no issues December 2012 -Full operation
-December 10 -- programmable thermostat installed by project replaced again by Fort Carson personnel (Infinia was informed by Vince Gutherie that this had occurred out of fear of potential pipe freeze w/in exterior walls) -December 31 -- last day of demonstration
TABLE 14: Chronological timeline of events

86
8.0 TECHNOLOGY TRANSFER Following is a discussion of some on-going and future efforts by Infinia to inform and demonstrate to the DoD energy and water community the appropriate application, timing, and performance of the Infinia PowerDish CHP product.
8.1 COMMERCIALIZATION AND IMPLEMENTATION Commercialization: The PowerDish CHP technology would be an adaptation of the commercial Infinia PowerBlock product. The Infinia PowerBlock is a product that integrates the PowerDish technology with a central inverter, station service UPS, and control and monitoring software/firmware. The commercial success of this product confirms the commercial success for the PowerDish. The Infinia PowerDish CHP product would take the commercial PowerDish and integrates a heat exchanger into the closed loop cooling systems. That heat exchanger then makes the cooling system thermal energy available for extraction and use in the water and space heating needs of a nearby facility. A single unit inverter system will also need to be matched to the PowerDish to complete a PowerDish CHP commercial product. So, continued commercial success of the PowerBlock and PowerDish technology paves the way for the commercial launch of the PowerDish CHP. The PowerDish 5 product considered for future application to a PowerDish CHP system will be first deployed late in 2013. Assuming confirmation of market opportunity and timely launch of a development program, the Infinia PowerDish CHP system could be offered commercially within a year of the PowerDish 5 launch. The commercial launch of PowerDish CHP product would need to follow one-or-more field deployments of the system to confirm the successful integration of the heat exchanger and single unit inverter. Implementation Mechanisms: While the Infinia PowerBlock (with PowerDish components included) is currently marketed directly to electricity project developers in several countries AND to renewable energy project developers for deployment at DoD facilities in the US, the Infinia PowerDish CHP for DoD applications will likely need to use a different distribution and marketing plan with alternative distribution channels. Because of the way DoD facilities are operated, Infinia might approach facility operators with a technology package that will enable them to integrate the PowerDish CHP solution directly into their existing facility operating contracts. These packages would most likely take the form of Energy Saving Contracts that the facility operator would administer and/or own. This is a more likely (and quicker) pathway to deploy a PowerDish CHP solution than direct sales to the DoD or to DoD facility managers.

87
8.2 TRAINING REQUIREMENTS AND RESOURCES Technical/Educational Sessions: The Project, experience and results are expected to be shared at the SERDP/ESTCP Symposium in June. Once a commercial product is offered, Infinia will engage the opportunities that exist to educate and inform DoD community about the PowerDish CHP product and how best to select the application sites for the product to create good outcomes. End User Training: Infinia has developed procedures and training documents for the PowerDish system (without CHP). All of that material is applicable for the PowerDish CHP product. Multiple installations have been made and field operations at specific sites is now well in excess of 2 years. Multiple individuals have been trained to install, operate, and repair the PowerDish systems. Training has taken place both in the factory and on the job site. Once the PowerDish CHP product is offered commercially, the training programs will be revised to include the CHP extension of the PowerDish product.
8.3 DESIGN COMMUNITY IMPACTS
The PowerDish CHP is not yet offered as a commercial product. As part of preparing the PowerDish CHP for commercial readiness, Infinia will review the relevant design guidance documents, policy/management documents, and design tools that could impact both acceptance and appropriate integration of this technology into buildings in the future. Some examples for documents / standards that may need to be reviewed and possibly updated include:
• Online Federal document libraries: such as the Whole Building Design Guide’s Construction Criteria Base (found at http://www.wbdg.org/ccb/ccb.php);
• Specifications: ASHRAE, LEED, Unified Facilities Criteria Guide Specifications; • High Performance Sustainable Buildings Guiding Principles; • Design Standards: Pressure Vessel Codes, Structural Design Standards, Electrical Design
Standards, Utility Interconnection Standards; • Policy/Management Documents: Infinia PowerDish Warranty documents, PowerDish
Maintenance documents; other Infinia product, process, and manufacturing documents; and
• Modeling Tools: NREL-Solar Analysis Model, SAGE (for Infinia Stirling generator performance estimates), Infinia PowerDish Performance Estimating Model.

88
APPENDIX A
PERFORMANCE ASSESSMENT METHODOLOGIES
Performance Objective: Employed Methodologies Monitor Estimated Facility Energy Usage
“Facility Energy Consumption” Methodology Employed: Graphical assessments of real time energy consumption data capture and comparison to estimated consumptions. Facility energy usage was estimated at the outset of the project utilizing available tools (such as System Advisor Model (SAM) developed through the National Renewal Energy Lab (NREL) and NREL’s Solar Prospector program for weather climate and weather predictions) based on the building size and age, room and water heating sources, geographical environment and estimated occupancy. Those original estimates of usage/consumption where: 16,800kWhe/yr and 1200 gals propane/yr. There were no electrical or reliable propane usage systems available on site from which to gather usable information so alternative equipment was selected and installed. Metering of electrical consumption within the demonstration building was established with an Acuvim II multi-phase electric meter installed within the wall of the kitchen’s utility closet near the buildings main electrical panel. This meter was monitored real time (24hrs/day) and data was captured and logged at an approximate 6 sec cycle via data acquisition software and the main system computer. Propane metering required the installation of a standard residential gas utility meter at the building which required an additional Hobo-meter and software implementation to allow routine downloads of the daily logged CF propane consumption to the on site computer. These “real time” measured values then allowed easy comparison against the Estimated Facility Usage numbers above.
Maximize Renewable Energy Usage
“PowerDish Energy Supplied” Methodology Employed: Empirical assessments of real time energy production data at the direct connect of the PowerDish electrical system to the Fort Carson grid and at the direct connect plumbing of the PowerDish Thermal Coolant to the installed “off the shelf” solar heat and hot water systems within the demonstration building. Electrical production was measured with an Accuvim II multiphase meter installed between the PowerDish and grid connection. This meter was monitored real time (24hrs/day) and data was captured and logged at an approximate 6 sec cycle via data acquisition software and the main system computer. Thermal energy was measured both as a production and consumption value through onboard temperature and flow rate data acquisition. The data was also real time (24hrs/day) and data was

89
captured and logged at an approximate 6 sec cycle via data acquisition software and the main system computer. These measured values then were utilized in thermal energy calculations for PowerDish production and building system usage. The solar thermal heat and hot water systems were typical off the shelf solar products as installed in building 9246 and were intended by design to optimize the solar energy usage.
Maximize Savings for System Economics
“Fuel and Electricity Reduction Savings” Methodology Employed: Analytical assessments using gathered energy consumption and production data along with calculated predictions regarding time periods of reduced production and system inoperability. System Economics were maximized through the use of assessments comparing the predicted amount of energy not required from the original supply systems (Colorado Springs Utility for electricity and Propane). The comparative assessments took into account the real/actual electrical and thermal energy produced and supplied to the building. In the case of system downtime or with the self-imposed performance degradations put in place for autonomous operability predictive assessments were utilized to show what a fully operational PowerDish CHP would have normally supplied to the “point of use”. These resultant energy production numbers both actual and predicted were then utilized as a real savings and a potential savings to the normal consumption levels of the site. The metered electrical production was treated as a direct offset to the metered electrical consumption with an actual 51% reduction in consumed electricity from the Colorado Springs Grid and if fully functional a 64% predicted consumption reduction. Similarly, the measured thermal production at the engine was treated as an available source of thermal energy which if properly implemented would have created a potential economic savings and as implemented was a minimal offset to the consumed thermal energy resource(propane). These thermal savings were treated the same way as the electrical energy and showed an actual 5% reduction to the propane energy sources required with a 22% propane usage reduction from a fully functional and properly implemented thermal energy system. The thermal energy supply system was reconstructed during the fall of 2012 to prove that when the thermal energy was properly supplied to the “point of use” applications it was an effective heat and hot water resource to supplement the existing systems (92% of the thermal energy supplied was utilized for heat and hot water). The combination of these savings was shown to be significant especially given the fact that they come from a single solar resource conversion resource (14.4% actual and 48 predicted).
Minimize Direct Greenhouse Gas Emissions
“Fuel Consumption Offset” Methodology Employed: Direct GHG reductions Green House Gas reductions are considered a direct reduction for all energy production from the PowerDish as it has ZERO GHG emission when converting solar thermal energy to the other usable energy forms. These direct offsets were compared against the typical domestic energy production methods and the potential FOB energy production methods. The offsets were estimated to be 900 lbs CO2 actual with 3480 lbs predicted from this installation. The FOB scenario was a hypothetical situation utilizing diesel generators which potentially could result in a 23,000 lbs CO2 reduction from a similar usage profile building as this demonstration site.

90
Monitor Facility Metering
Methodology Employed: Continuous “Real Time” Data Acquisition (24/7 with routine periodic download and review) The system monitoring was a 24 hr/day, 7 day/week continuous data acquisition operation that was saved on a daily basis to a local computer which in turn was retrieved (via satellite based internet connection) on a regular basis (varied over the course of the project from daily to 2-3x/week as time progressed). All operational data was processed and reviewed immediately upon retrieval enabling necessary human interactions as required based on data trends and analysis results. The total energy consumption and productions as metered were as follows: -41,465kWh consumed -15,045kWh produced (not accounting for lost days) and 20,998kWh estimated production (accounting for lost days and unexpected system outages).
Monitor System Maintenance
Methodology Employed: Chronological tracking When necessary maintenance was required a tabular tracking format was followed making records of the event and the actions taken. Any changes or revisions to the operational systems were then taken into account over the course of the ongoing facility metering and monitoring. Over the course of the demonstration period there were 2 engine/generator related failures which required replacement equipment (Dec 2011 and Aug 2012), approximately 9 routine preventative maintenance events and mirror cleanings. In addition there were 2 specific events where the building thermostat controls were replaced by base personnel which drove a number of additional contractor support interventions to either replace the changed controls back to the project controls or to revise the project controls systems to compensate for the changes made. In the end (last occurrence of this Dec 2012) it was deemed best to leave the base imposed revisions in place and just note the energy consumption penalties incurred (differences are readily apparent in the energy consumption data within the report)
Monitor System Integration
Methodology Employed: Project management controls Integration of the CHP PowerDish system went as planned except for an initial delay due to a self-imposed performance testing prior to shipment and installation at Fort Carson. This caused approximately a 1-2 month delay in the PowerDish installation with all of the integrated systems on site waiting for arrival. Original project timelines had the demonstration starting prior to winter 2011-12 while actual timing was Jan, 2012. Once installation and shakedown issues were corrected the integrated and operational the systems were monitored through the daily data analysis and processing ensuring consistent function and performance.

91
APPENDIX B
BUILDING LIFE CYCLE COST MODEL RESULTS The MILCON Energy Project Model within the Building Life Cycle Model was used to evaluate the economic conditions of the Project. See Section 6.2 for details of the Assumptions and Results of the Analysis. The following Comparative Analysis Reports are attached to this Final Report. Attached as a PDF file to this Final Report: BLCC 5-Comparative Report-PowerDish CHP Project 0.8DR BLCC 5-Comparative Report-PowerDish CHP Project 3.0DR BLCC 5-Comparative Report-PowerDish CHP Project 3.0DR-BE

92
APPENDIX C
MANAGEMENT AND STAFFING Following is an organization wire diagram showing the participants and relationships among the participants for the Project. Also included is the contact information for the representatives of the project team, subcontractors, technology vendor, and the host site.
POINT OF CONTACT
Name
ORGANIZATION Name
Address
Phone Fax
E-mail Role in Project
David Townley Infinia Corporation 509-628-7521 [email protected]
Principal Investigator (replacement)
Paul Gee Infinia Corporation 509-438-5303 [email protected]
Project Manager/Engineer
KC Kuykendall Vista Engineering 509-396-1460 [email protected]
Vista Project Manager
Milo Himes Vista Engineering 509-737-1377 [email protected]
Vista Project Engineer
Mark Bush ABC Plumbing 800-632-0208 [email protected]
Building Integration
Tim Leonard Precision Solar 505-281-0399 [email protected]
Weather Station
Albert Estrada Infinia Corporation 801-833-4554 [email protected]
Field Services Technician
Vince Gutherie Fort Carson 719-491-2982 [email protected]
Program Manager
Scott Clark Fort Carson 719-526-1739 [email protected]
Energy Project Coordinator

93
APPENDIX D
REFERENCES INTENTIONALLY BLANK

94
APPENDIX E
SECTION 6 NOTES, TOOLS, & SOURCE REFERENCES
In Section 6.2, we describe a competing set of technologies that will provide the SAME solar electric output and the SAME thermal energy for hot water and space heating solutions. The 2 technologies that together will provide the SAME electric and thermal energy as the PowerDish CHP are 1) a PV system for electricity, and 2) a solar thermal system for thermal energy for water heating and space heating.
ELECTRIC OUTPUT:
To get the installed capacity of thin film PV that is required to provide the EQUAL amount of electricity, we turned to a model used by Infinia for predicting the expected output of a PowerDish system under a specified Direct Normal Irradiance (DNI). This Infinia model is a “first order” performance estimator and uses a “correlation” approach to estimate the expected output under a specific DNI. DNI is the primary driver of PowerDish output and ambient temperature and wind speed provide second order adjustments to the PowerDish output. The Infinia Performance Estimator uses a large selection of US sites where Infinia has done detailed 8,760 hour performance modeling. From there, a correlation of performance to DNI is established statistically. This enables a “quick” first order estimate given an estimate of DNI for a site. The annual average DNI for a site can be determined from an online tool developed by DOE-National Renewable Energy Laboratory (NREL) and made available at:
http://maps.nrel.gov/SWERA
Additionally, in the Infinia initial Performance Estimator Model, the weather profiles that are available from DOE-NREL for a large number of US sites and that were used to do the detailed performance studies used by Infinia Performance Estimator Model, are also used in another DOE-NREL model called the Solar Analysis Model, SAM. NREL describes SAM as:
System Advisor Model (SAM)
Developed in 2006, the System Advisor Model (SAM) is a performance and financial model designed to facilitate decision making for people involved in the renewable energy industry. SAM makes performance predictions and cost of energy estimates for grid-connected power projects based on installation and

95
operating costs and system design parameters that you specify as inputs to the model. Projects can be either on the customer side of the utility meter, buying and selling electricity at retail rates, or on the utility side of the meter, selling electricity at a price negotiated through a power purchase agreement (PPA).
In SAM, PV and inverter technologies are selected and the electric output of an installed capacity under the specified weather file is calculated and provided in a user friendly interface. As a result, the electric AC output of the PowerDish and of a PV/inverter set can be calculated under the same 8,760 hour weather file. A large number of these sites were calculated using SAM for PV and a detailed performance model for the PowerDish under the same detailed weather profile. Then, the Infinia initial PowerDish / DNI Performance Estimator could include a correlation to a set of PV/inverter technology for a specific site. The resulting output from the Performance Estimator could include the estimated performance of a specified capacity of PowerDish AND the amount of PV capacity that would be required to provide the SAME electric output under a specified DNI.
The Summary page of the Infinia Performance Estimator Model Version 8 for the DNI condition for the study in Section 6 is included in this Appendix. For PowerDish V systems, one PowerBlock is .225 MW and contains 30 PowerDish V units. As seen in the attachment, 0.225 MW of PowerDish V requires 0.288 MWdc. Thus, 1 PowerDish V @ 7.5 kWac average requires 9.6 kWdc of thin film PV (0.288/0.255*7.5) to produce the same kWh(ac) at the meter. This Performance Estimator Model can be made available by request to Infinia.
The thin film PV pricing is quoted from personal current experience in the market place at this time for a small 9.6 kWdc system.
SOLAR THERMAL ENERGY:
Some personal experience of a solar thermal hot water production system along with solar thermal wiki site information and www.jc-solarhomes.com provided insight for the current performance and pricing estimates for a solar thermal system that would provide the SAME thermal energy and temperature to a heat exchanger that would take the energy to the building systems (same set up as the PowerDish CHP system).

96
APPENDIX F
TEAR DOWN REPORTS The failure of a generator early in the initial demonstration start and then another failure in mid-period have been described in the Report. Following are some screen shots of the ‘teardown” reports that were done on each generator. The first (M056) failed due to “over-stroke” cause by a failed sensor wire (a sensor that should have prevented the over-stroke). The second (M067) was a heater head failure (cracks) which caused the working fluid (helium) to escape…which caused the generator to fail. More discussion of the teardown is included in Section 7.0. Engine Failure Infinia Tracking System Records: Engine M056: Overstroke Failure 12/31/11 after failed hall sensor communication due to broken sensor wire (root cause of damage during either disassembly, transport or installation handling) to shut down. Engine Teardown Results:

97
Engine M067: DePressurization Event and Fail to Restart 8/6/2012: Cracked heater head and leak of pressurized Helium to atmosphere (probable cause thermal cyclical overstress)

98
APPENDIX G
REPRESENTATIVE GRAPHICS OF BUILDING PERFORMANCE
To collect and report the information needed for this demonstration, data was collected across a number of meters and sensors (see Section 2 discussion). Following are a number of graphics from November 17, 2012 (revised system). These graphics show how the CHP system responds during a good, full sun day. The daily data was captured by the data acquisition system and post-processed into excel format from which a series of macro driven performance plots were generated. Representative daily data sets Figures G1 through G4 provide both electrical and thermal PowerDish CHP system performance as well as electrical consumption within building #9246. FIGURE G1 – G4: Representative Plots of Daily Data for Nov 17, 2012
FIGURE G1: Solar DNI with PowerDish electrical output response
Predicted Electrical Production with standard control scheme
Actual Electrical Production

99
FIGURE G2: Electric and thermal production and building consumption during this day
Thermal energy production at engine
Electrical energy production at PowerDish
Thermal energy delivered, L2 (to bldg) and L3 (to heat and hot water systems)
Consumed Electricity
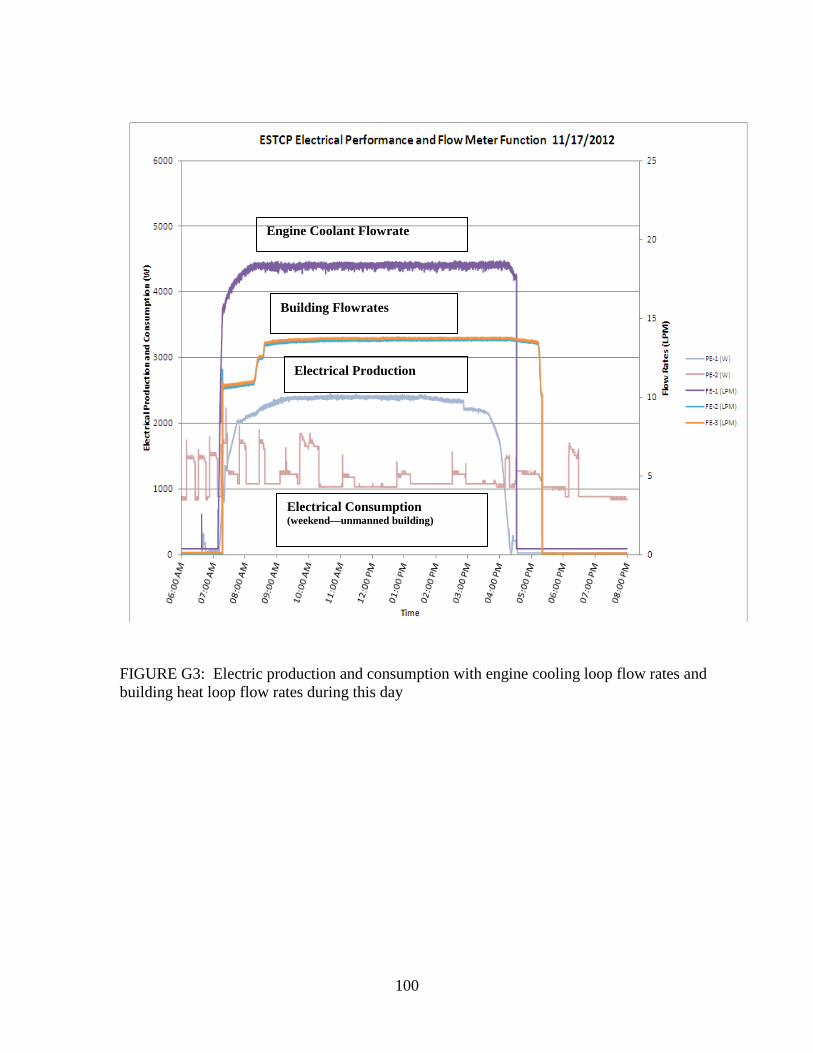
100
FIGURE G3: Electric production and consumption with engine cooling loop flow rates and building heat loop flow rates during this day
Engine Coolant Flowrate
Building Flowrates
Electrical Production
Electrical Consumption (weekend—unmanned building)

101
FIGURE G4: CHP system temperature readings during this day
Engine Coolant from Engine to HeX
Engine Coolant from HeX To Engine
Bldg Coolant (2sensors) (inlet to bldg) & inlet to radiators
Bldg Coolant (2 sensors) (outlet from bldg) & from radiators
Hot Water Heater