final report: economic value of the crocodile farming ... report economic value of the crocodile...
TRANSCRIPT

Photo: Parks and Wildlife Commission of the NT
Final Report
Economic Value of theCrocodile Farming Industry to theNorthern Territory

Northern Territory Crocodile Industry Economic Contribution Analysis EY ÷ i
NoticeErnst & Young (EY) was engaged on the instructions of Department of Trade, Business andInnovation (DTBI) to determine the economic contribution Crocodile Farming Industry, inaccordance with the consultancy agreement 2 June 2016.
The results of EY’s work, including the assumptions and qualifications made in preparing the report,are set out in EY's report dated 3 March 2017 ("Report"). The Report should be read in its entiretyincluding the applicable scope of the work and any limitations. A reference to the Report includesany part of the Report. The report has been constructed based on information current as of 7October 2016 (being the date of the economic modelling progress at the Report), and which hasbeen provided by the Client and other stakeholders. Since this date, material events may haveoccurred since completion, which are not reflected in the Report.
EY has prepared the Report for the benefit of DTBI and has considered only the interests of DTBI asset out in the consultancy agreement. EY has not been engaged to act, and has not acted, asadvisor to any other party. Accordingly, EY makes no representations as to the appropriateness,accuracy or completeness of the Report for any other party's purposes.
No reliance may be placed upon the Report or any of its contents by any recipient of the Report forany purpose and any party receiving a copy of the Report must make and rely on their ownenquiries in relation to the issues to which the Report relates, the contents of the Report and allmatters arising from or relating to or in any way connected with the Report or its contents.
EY disclaims all responsibility to any other party for any loss or liability that the other party maysuffer or incur arising from or relating to or in any way connected with the contents of the Report,the provision of the Report to the other party or the reliance upon the Report by the other party.
No claim or demand or any actions or proceedings may be brought against EY arising from orconnected with the contents of the Report or the provision of the Report to any party. EY will bereleased and forever discharged from any such claims, demands, actions or proceedings.
EY has prepared this independent economic analysis and has relied on information provided by theClient and other stakeholders. We do not imply, and it should not be construed that we haveperformed audit or due diligence procedures on any of the information provided to us. We have notindependently verified, or accept any responsibility or liability for independently verifying, any suchinformation nor do we make any representation as to the accuracy or completeness of theinformation. We accept no liability for any loss or damage, which may result from your reliance onany research, analyses or information so supplied.
It should also be noted that this work does not constitute a Cost Benefit Analysis. Further, it isimportant to note that the identification of economic impact and contribution is not a precisescience.
EY have consented to the Report being published electronically on the DTBI website forinformational purposes only. EY have not consented to distribution or disclosure beyond this. Thematerial contained in the Report, including the EY logo, is copyright and copyright in the Reportitself vests in DTBI. The Report, including the EY logo, cannot be altered without prior writtenpermission from EY.
EY’s liability is limited by a scheme approved under Professional Standards Legislation.

Northern Territory Crocodile Industry Economic Contribution Analysis EY ÷ ii
Table of contents
1. Executive Summary ....................................................................................................... 11.1 Background ............................................................................................................. 21.2 The Economic Contribution of the Crocodile Industry .................................................. 21.3 Employment within the Crocodile Industry ................................................................. 41.4 Regional and Remote Impacts of the Industry ............................................................. 51.5 Broader Economic, Social and Cultural Values ............................................................ 51.6 Summary ................................................................................................................ 6
2. Introduction .................................................................................................................. 72.1 The Study ............................................................................................................... 72.2 Scope of the Report ................................................................................................. 72.3 Our Approach .......................................................................................................... 82.4 Structure of the Report ............................................................................................ 8
3. Industry Background ...................................................................................................... 93.1 Background ............................................................................................................. 93.2 The Crocodile Industry to the NT ............................................................................. 10
3.2.1 Stages of the production process ........................................................................ 103.2.2 Products ........................................................................................................... 113.2.3 Industry Profile .................................................................................................. 123.2.4 Tourism ............................................................................................................ 143.2.5 Knowledge ........................................................................................................ 143.2.6 Remote ............................................................................................................. 15
3.3 Key Stakeholders ................................................................................................... 16
4. Methodology ............................................................................................................... 184.2 Define Key Measures .............................................................................................. 184.3 Establish Contribution Analysis Geography............................................................... 194.4 Collect Data and Define Assumptions ....................................................................... 204.5 Estimate the Economic Contribution ........................................................................ 204.6 Discuss Intangible Economic Benefits ...................................................................... 21
5. Economic Contribution Analysis .................................................................................... 225.1 Summary of Categories .......................................................................................... 235.2 Farm Operations .................................................................................................... 24
5.2.1 Operational Expenditure ..................................................................................... 245.2.2 Capital Expenditure (1 year)................................................................................ 255.2.3 Capital Expenditure (3 year)................................................................................ 26
5.3 Knowledge ............................................................................................................ 275.3.1 Veterinarian/Scientific Services .......................................................................... 275.3.2 Regulation ......................................................................................................... 285.3.3 Research and Development ................................................................................. 29
5.4 Farm Related Tourism ............................................................................................ 305.4.1 Visitor Expenditure ............................................................................................ 305.4.2 Farm Related Tourism – operational expenditure .................................................. 315.4.3 Farm Related Tourism – Capital Expenditure ......................................................... 315.4.4 Total Farm Related Tourism ................................................................................ 32

Northern Territory Crocodile Industry Economic Contribution Analysis EY ÷ iii
5.5 Estimation of Regional/Remote Impacts (Regional IO Assessment) ............................. 33
6. Broader Economic, Social and Cultural Values ................................................................ 356.1 Outcomes for Aboriginal People .............................................................................. 356.2 Environmental Conservation and Species Management ............................................. 376.3 Value of Knowledge – Research and Development ..................................................... 376.4 Regulation ............................................................................................................ 386.5 Additional Tourism Value ........................................................................................ 38
6.5.1 Iconic Status – Brand Recognition for the NT ........................................................ 386.5.2 International Film and Television Industry ............................................................ 38
Bibliography ......................................................................................................................... 39
Appendix A - Overview of IO Modelling .................................................................................... 40
Appendix B – Tourism Calculation Assumptions ........................................................................ 43
Northern Territory Crocodile Industry Economic Contribution Analysis EY ÷ iv
Glossary
Consumption effect – The flow of expenditure to all industries that results from the spending ofsalaries and wages by local employees.
Direct contribution - Direct economic activity in Northern Territory associated with the crocodilefarming industry. This represents the sum of Gross Output (including value added).
Employment – Number of workers directly employed, expressed in terms of full time equivalent(FTE) employees.
2014/15 FY – 2014/15 Financial Year was selected as the most recent complete data set at thetime of report development.
Gross output – Market value of goods and services produced.
Hatchling – Crocodiles born during the preceding nesting season and are typically less than 0.6metres in length.
Indirect contribution - Associated indirect or flow-on impacts for the rest of the economy resultingfrom the direct contribution. That is, the impacts both forward and backwards along the supplychain as a result of an increased investment in an industry. For this study, the indirect contributionis the sum of both the Industrial and Consumption flow effects.
Industrial effect – The additional output created by industries that support the industry where theexpenditure occurred.
Ranching – The rearing in a controlled environment of animals taken from the wild.
Regional contribution – Economic contribution retained in particular region. Regional contributionis a subset of the total economic contribution to Northern Territory.
Value add – Market value of goods and services produced, after deducting the cost of goods andservices used. This represents the sum of all wages, income and profits generated.

Northern Territory Crocodile Industry Economic Contribution Analysis EY ÷ 1
1. Executive Summary
The Crocodile Industry is a unique industry in many respects. For example, it involves farming oneof the world’s oldest, least understood and most dangerous predators. It requires collecting (or‘ranching’) eggs from wild crocodile nests using helicopters to drop in people, or needing to walkthrough unforgiving and swampy lands. It also then requires careful handling and management toensure the crocodile eggs and then juvenile crocodiles are hatched then nurtured to minimise stressand protect their skins. Finally, the premium end product, crocodile skins, then often ends up assome of the World’s most expensive and sought after fashion accessories (handbags, shoes, pursesand wallets) being worn in the finest establishments throughout the world with key markets in theUnited States and Europe.
The Northern Territory of Australia (NT) makes an equally unique contribution to the industry, andthe story, in that it:
► Is the largest producer in Australia, which is the dominant supplier of crocodile skinsworldwide, and which benefits from having a native species, Crocodylus Porosus, that is highlysought after because of the quality of its skins
► Has a reputation for providing some of the highest value product for luxury leather market andseen significant inbound investment from the world’s most famous fashion labels (e.g. LouisVuitton, Hermes and Yves Saint Laurant), to have greater control over their supply chain andthus be able to manage raw material product quality and the environmental and animal welfareconditions under which the raw material is produced
► Combines farming with sustainable management of crocodile populations, other farmingactivities and public safety
► Combines farming with a major tourist industry, which provides one of the key reasons mosttourists visit the NT
► Plays a key role in advancing species research, sustainable management practices, enhancingproduct quality and animal welfare
► Provides a source of private sector employment for traditional land owners and regionalcommunities.
The future growth of the NT industry will, given its higher cost structure compared to crocodilefarming in less developed countries, depend on its capacity to provide higher value products viaprocesses that reflect the demands of its customers.
The end result of this process in the NT is such that a crocodile that is harvested at a direct unitcost of circa $1051 ends up in fresh skins that are exported at a value exceeding $300 per raw skin,through the application of advanced farming techniques that reflect the challenges of farming aprehistoric animal.
1 This unit cost does not account for crocodile rearing costs

Northern Territory Crocodile Industry Economic Contribution Analysis EY ÷ 2
1.1 Background
In August 2015, the Northern Territory Government (NTG) released The Northern TerritoryCrocodile Farming Industry: Strategic Plan 2015-2021. The release of the plan followsfundamental changes in the way saltwater crocodiles are managed in the NT as reflected in a newCrocodile Management Plan and Wildlife Trade Management Plan2. The strategic plan recognises areturn of a healthy and sustainable level of crocodiles in the wild concurrent with the growth of theNT crocodile farming industry. This study reports on the economic value that the crocodilefarming industry contributes to the Northern Territory (NT) in 2014/15.
1.2 The Economic Contribution of the Crocodile IndustryEconomic contribution (or gross contribution) is a measure comprising all market-relatedexpenditure generated by a specified industry. It focuses on capturing the direct effects of anindustry (i.e. revenues or output) and applying economic multipliers to these direct effects, toestimate the flow-on (or ‘indirect’) effects of Industry operations. The indirect effects consist ofIndustrial and Consumption flow-on effects.
Industrial effects measure the additional output created by industries that support the industrywhere the expenditure occurred. Consumption effects measure the expenditure to all industriesthat results from the spending of salaries and wages by employees.
The total economic contribution includes the sum of both these direct and indirect effects. For thepurposes of this study, the total Industry economic contribution is being estimated in terms of its‘value add’ to the economy. Value-added accounts for the direct cost of production, that is themarket value of goods and services produced minus the cost of goods and services used in theirproduction. Essentially, this represents the sum of all wages, income and profits generated by theindustry.
It is important to note that economic contribution studies do not consider substitution impacts, orwhat would happen if the relevant industry ceased to exist (For further information regarding thetheory of economic contribution analysis, please refer to Appendix A).
During the 2014/15 FY, the total economic contribution of the Industry in value added terms was$54.3 million (m). In total, the contribution of the Industry represented approximately 0.23 percent of the Northern Territory GSP.3 The breakdown is represented in Figure 1.
Farming operations (capital and operational expenditure) provided the largest proportion of theeconomic contribution estimated at $29.3m (in terms of total value added) across the Territory.Farm related tourism expenditure, that captures both tourism specific visitor expenditure andassociated farm related costs, was estimated at approximately $16.9m. Expenditure related toindustry regulation contributed $4.6m while vet services contributed $1.3m of value added. Theeconomic contribution within remote communities as a result of royalty payments to indigenouscommunities was $2.1m.
It was estimated that 96.5 per cent of value added was generated within Darwin and thesurrounding area with the remainder attributable to regional areas.
Approximately 82.5 per cent (or $44.8m) of the economic contribution was attributable tooperational expenditure and 17.5 per cent (or $9.5m) to capital works or investment.
2 The Northern Territory Government Management Program for the Saltwater Crocodile 2016-2021 and Wildlife TradeManagement Plan for the Saltwater Crocodile (Crocodylus Porosus) in the Northern Territory of Australia, 2016-2020 –respectively.3 In 2014/15 the Gross State Product (GSP) of the Northern Territory was $23,139m (Source: REMPLAN)

Northern Territory Crocodile Industry Economic Contribution Analysis EY ÷ 3
Figure 1: Value added ($m) of Crocodile farming industry components (operational and construction), NT, 2014/15
*Calculated using the Northern Territory IO tableSource: REMPLAN, EY, 2016
Figure 2: Value added ($m), Crocodile Industry, Darwinonly, 2014/15
Figure 3: Value added ($m), Crocodile Industry, Darwinand Regional NT, 2014/15
Source: REMPLAN, EY, 2016 Source: REMPLAN, EY, 2016

Northern Territory Crocodile Industry Economic Contribution Analysis EY ÷ 4
1.3 Employment within the Crocodile IndustryDuring the 2014/15FY, the total (direct and indirect) operational employment generated by theIndustry was estimated at 231 Full Time Equivalent (“FTE”) workers whereas employmentattributable to construction accounted for 33 FTE, totalling 264 FTE. Total public sector jobsinvolved with the Industry (29 FTE) accounted for 0.08% of all NT public sector jobs whereasprivate sector jobs in the industry (235 FTE) accounted for 0.24% of all jobs in the NT privatesector.
Farm related tourism expenditure associated with tourism specific visitor expenditure andassociated farm costs was the largest employing industry component, estimated to employ 115 FTEworkers related to operations and 1 FTE workers in construction. Farming operations followed at59 operational FTE workers in Darwin and surrounds and 9 FTE in regional NT, to a total of 68workers in operations. Farming operations-construction related employment was estimated at 32FTE across the Territory. Regulation was estimated to contribute 23 operational FTE workers andvet services 7 operational FTE. The estimated employment generated in remote communities as aresult of royalty payments to indigenous communities was 19 operational FTE workers.
A share of 91.4 per cent of employment generated by the Industry is attributed to the Darwin andthe surrounding area with the remainder attributable to regional areas.
Overall, approximately 88 per cent (or 231 FTE) workers were attributable to operationalexpenditure and 12 per cent (or 33 FTE) workers to capital works or investment.
Figure 4: Total employment within the Crocodile farming industry components (FTEs), Northern Territory, 2014/15
*Calculated using the Northern Territory IO tableSource: REMPLAN, EY, 2016
Of interest, Figure 4 indicates that farm related tourism has a greater contribution than farmoperations in terms of employment within the NT economy. However, in terms of value added(Figure 3), farming operations contributes relatively more than farm related tourism. The outcomedemonstrates the higher relative worker productivity of farm operations relative to the tourism.

Northern Territory Crocodile Industry Economic Contribution Analysis EY ÷ 5
1.4 Regional and Remote Impacts of the IndustryThe Industry has the potential to significantly impact regional and remote communities by providingemployment and income opportunities. The primary impact is through the egg collection orranching process with Traditional Owners (“TO’s”) receiving royalty payments for eggs collected ontheir lands and locals being employed for the egg collection itself.
The results indicate that during the 2014/15 financial year, crocodile farms spent $2.3m on eggcollection and royalty costs. This direct output is the equivalent of employing 14 employees overthe course of the year. The direct value added of this activity was $1.2m and the total value addedwas estimated at $1.9m. The results are included in Table 1 below.
Table 1: Economic contribution from crocodile egg collection in remote communities, 2014/15 Financial Year
Direct effect Indirect effect Total
Output $2.31 $1.39 $3.70
Value-added $1.19 $0.74 $1.92
Employment (Jobs) 14 4 17Source: Stakeholder consultation, REMPLAN, 2016 (some numbers may not add due to rounding).
1.5 Broader Economic, Social and Cultural ValuesFurther to the values estimated for the Industry above, it is also important to understand thebroader economic, social and cultural value that is generated which includes:
► Outcomes for Aboriginal People – annual income for TO’s and those tasked with egg collection(such as the NT Ranger Groups) provides significant economic and social benefits for regionaland remote areas. The Northern Land Council (“NLC”) Caring for Country Rangers play animportant part in the process. This results in less reliance on Commonwealth/state support,greater empowerment to TO groups, opportunities for Connection to Country and greateropportunities to maintain and grow social cohesion
► Environmental conservation and species management – The development and continuedpresence of the Industry (that maintains the market and demand for eggs) are a key agent inthe continued sustainable management of the saltwater crocodile in the NT. Further, theenvironmental standards and conservation program (to which the Industry contributes) isrecognised internationally as best practice that contributes to the NT being rated as a premiumlocation to source crocodile skins worldwide
► Value of knowledge (research and development) - The crocodile industry (internationally) is inits infancy with research and development part of normal daily operations. The NT has worldrenowned researchers and farm industry experts who not only work locally (in the NT andacross Western Australia and Queensland) but travel internationally to assist Industrydevelopment worldwide
► Regulation – Industry regulation is a common part of the ongoing sustainable management ofNT crocodiles but helps to maintain appropriate environmental standards including the humanetreatment of animals. The overview of the process from egg collection to the farm and thensale (of the crocodile products) is essential to maintain the NT’s premium crocodile ‘brand’.More importantly, the maintenance of these standards allows continued access to internationalmarkets (such as the United States) without which significant value would be lost (both interms of price and volume)
► Additional tourism value:
► Iconic Status – Brand Recognition for the NT - The crocodile is synonymous with the NTboth at a national and international level and features strongly in many tourismpromotions. The Industry contributes, to some extent, through its tourism activities andfrom its exposure in TV and film documentaries and features. Brand recognition addsvalue at the level to which it may induce further tourism and business opportunities thatwould not have otherwise occurred without it

Northern Territory Crocodile Industry Economic Contribution Analysis EY ÷ 6
► International film and television industry – The NT’s crocodile farms, associated tourismvenues and industry experts brings film and television makers from across the world. Thisgenerates economic value not only in terms of the direct expenditure of the film crewswhen they visit the NT, but also in the further development of the NT brand.
1.6 SummaryTable 2 below provides an overview of the total economic output, value added and employmentgenerated by the NT crocodile industry during the 2014/15 financial year.
Table 2: Summary of economic output, value added and employment generated by the NT crocodile industry,2014/15 Financial Year
Direct Indirect Total
Economic contribution – Gross output
Remote and Regional NT ($m)* $2.31 $1.86 $4.17
Total Northern Territory ($m) $64.44 $42.34 $106.77
Value added (subset of Gross output)
Remote and Regional NT ($m)* $1.19 $0.96 $2.14
Total Northern Territory ($m) $33.67 $20.65 $54.33
Employment (jobs)
Remote and Regional NT* 14 5 19
Total Northern Territory 168 96 264
*Calculated using the Northern Territory IO table (some numbers may not add due to rounding)Source: Stakeholder consultation, REMPLAN, 2016

Northern Territory Crocodile Industry Economic Contribution Analysis EY ÷ 7
2. Introduction
2.1 The StudyThis study reports on the economic value that the crocodile farming industry contributed to theNorthern Territory (NT) economy in 2014/15.
2.2 Scope of the ReportThis study explores the economic contributions and the qualitative factors also contributing to theIndustry’s value. The Report includes an assessment of the following economic contributions:
Table 3: Report scope
Product Detail
Skins ► Value of export for all skin types and sizes
Live products ► Eggs► Hatchlings (small – large)► Large crocodiles
Meat and products ► Meat (raw and processed)► Teeth, skulls and claws
Knowledge ► Value to NT of scientific knowledge, skills and experience► Veterinary knowledge, skills and experience► Regulatory knowledge and experience
Tourism ► Tourism associated with farming, including: gate takings, retail takings and‘adventure type’ activity takings
While assessing these impacts we also consider:
Table 4: Other considerations
Employment ► Employment profile of the Industry► Wages► Employment benefits to the NT through activities including:► Farming and husbandry► Abattoir and butcher► Tourism► Ranching and crocodile catching► Welfare, veterinary and zoological
Remote value ► Value of remote crocodile activities► Value to Traditional Landowners (TO)► Aboriginal employment and associated benefits
Value to the Industry of NTGovernment support
► Government support including monetary grants
The Report does not address:
► Value of conservation (accessibility for future generations)
► General wildlife tourism that includes crocodile activity (such as Adelaide River Cruises)
► The direct contribution of crocodile retail trade from non-farming or farm related operations(such as clothing/crocodile product shops or souvenir shops in the NT).

Northern Territory Crocodile Industry Economic Contribution Analysis EY ÷ 8
2.3 Our ApproachThe value generated by the crocodile farming industry is being estimated by way of an economiccontribution study. Economic contribution (or gross contribution) is a measure comprising allmarket-related expenditure generated by a specified industry. It focuses on capturing the directeffects of an industry (i.e. revenues or output) and applying economic multipliers to these directeffects, to estimate the flow-on (or ‘indirect’) effects of Industry operations. The indirect effectsconsist of Industrial and Consumption flow-on effects.
Industrial effects measure the additional output created by industries that support the industrywhere the expenditure occurred. Consumption effects measure the expenditure to all industriesthat results from the spending of salaries and wages by employees.
The total economic contribution includes the sum of both these direct and indirect effects. For thepurposes of this study, the total Industry economic contribution is being estimated in terms of its‘value add’ to the economy. Value-added accounts for the direct cost of production, that is themarket value of goods and services produced minus the cost of goods and services used in theirproduction. Essentially, this represents the sum of all wages, income and profits generated by theindustry.
It is important to note that economic contribution studies do not consider substitution impacts, orwhat would happen if the relevant industry ceased to exist.
Further details on our approach and methodology are included in Section 4.
2.4 Structure of the Report
The report proceeds as follows:
► Section 3 – Industry Background
► Section 4 – Approach and Methodology
► Section 5 – Economic Contribution Analysis
► Section 6 – Broader Economic, Social and Cultural Value.

Northern Territory Crocodile Industry Economic Contribution Analysis EY ÷ 9
3. Industry Background
3.1 BackgroundDuring the first half of the 20th Century, the saltwater crocodile was hunted to near extinction forboth its skins and to eradicate what was seen as a pest species to livestock graziers. In 1971,formal protection of the species in Australia was put in practice. Since this time wild numbers of thespecies have recovered strongly. Today the species is considered abundant, with some groupscalling for culling of wild crocodiles, due to the threats to human safety and agriculturalproduction.4
From 1985, ecological responsible farming emerged allowing for use of crocodile products whilemanaging the environmental impacts. Collaboration between farmers and regulators, NTGovernment and Parks and Wildlife Commission of the Northern Territory (PWCNT), balance theeconomic value with environmental sustainability.5
The crocodile farming industry in the NT is an emerging industry that captures everything frominitial egg collection/breeding through to their slaughter and subsequent sale of skins (and otherbody parts) and also farm related tourism. Although there is some value adding carried out forskins/body parts in the NT this mainly occurs off-shore or interstate.
To date, considerable work has been carried out in developing and substantiating the Industry inthe NT. Examples of this work include:
► The Northern Territory Government Management Program for the Saltwater Crocodile 2016-2021
► Wildlife Trade Management Plan for the Saltwater Crocodile (Crocodylus Porosus) in theNorthern Territory of Australia, 2016-2020
► The Northern Territory Crocodile Farming Industry: Strategic Plan 2015-2021.
This report estimates the economic value that the Industry contributes to the NT with considerationalso given to knowledge developed, tourism, and social impacts.
4 Wildlife Trade Management Plan for the Saltwater Crocodile (Crocodylus Porosus) in the Northern Territory of Australia,2016-20205 The Northern Territory Crocodile Farming Industry: Strategic Plan 2015-2021

Northern Territory Crocodile Industry Economic Contribution Analysis EY ÷ 10
3.2 The Crocodile Industry to the NT3.2.1 Stages of the production processActivities of the Industry over the life cycle of a farmed crocodile include:
► Ranching (egg collection), although some eggs are also sourced ‘on farm’ through breedingprograms. The egg collection usually occurs February through March every year
► Hatching – Eggs are transferred to on-farm incubators until hatched where temperature andhumidity is carefully controlled to ensure every success
► Juvenile crocodiles are typically grown for 1.5 years or until approximately 1.2m long. Thesize of the grown-out crocodile will depend on the intended use. For example, skins producedfor a handbag are grown to a belly width of approximately 40cm (1.2m long crocodile). Thesize required varies with the fashion of the day (e.g. larger or smaller handbags). Very largecrocodiles can be used for pants or a suit
► Crocodiles are also grown and maintained for on farm breeding and crocodile based tourism. Inthe NT farm associated tourism includes Crocodylus Park and Crocosaurus Cove where you canboat around and see them in natural surrounds or swim with them in a protective cage
► Once ready for slaughter the crocodiles are sent to abattoirs where skins are removed and allbody parts are thereafter separated for sale or value-adding. The skins hold the highestcommercial value followed by meat and other products (see Section 3.2.2 for further details)
► The majority of value adding for the skins is carried out by the worlds fashion houses such asLouis Vuitton, Hermes and Yves Saint Laurant. The skins are very carefully graded and thencured with even the smallest scrape or pinhole puncture separating a first grade skin from asecond skin. Premium skins are exported primarily to France, Italy and the United States. InAustralia, boutique crocodile fashions are produced by Di Croco with a range of other customproduct makers working with lesser skins and byproducts
Other activities of the Industry over the life cycle of a farmed crocodile include:
► Research and development – is consistently undertaken as crocodile farming is still anemerging industry carried out primarily by farmers enhanced by Government services such asthe Berrimah Vetlab
► Regulation and conservation - the Government is active throughout the entire process frominitial licensing and monitoring of egg collection, monitoring of animal health and well-beingthrough captivity and issuing of permits for export. Annual crocodile surveys are carried out inthe wild to ensure the crocodile’s sustainable management
► Consulting and provision of expertise – the NT contains some of the world’s pre-eminentcrocodile researchers who provide consultant services to other countries seeking to improvetheir production techniques
The cost of ranching, including the royalty payment, in the NT suggest that the costs of collectingan egg is in excess of $1056 per egg. Skins can sell for $300 or more with high quality skinstypically selling for more than $1,000. Meat and other byproducts of skin harvesting can generateup to an additional $200 in revenue.
6 This unit cost does not account for crocodile rearing costs.

Northern Territory Crocodile Industry Economic Contribution Analysis EY ÷ 11
3.2.2 ProductsSkins are the primary and most lucrative product, however the Industry also produces a range ofother goods that utilise by-products. A summary of the industry products are in Table 5 below.
Table 5: Key Industry products
Product Information
Skins Skins derived from the saltwater crocodiles are internationally regarded by fashion productmanufacturers as the most desirable crocodilian skins, rivaled only by the Nile Crocodile skins.7
Skins are used in manufacturing of fashion accessory products, such as high-end handbags.► Large sized crocodile skin► High in quality of skin► Ethical and environmentally responsible framing practices
► As a result, reputable fashion brands have invested in NT crocodile farms, allowing them tocontrol more of their product supply chain.
Eggs Eggs are harvested from the wild in line with Territory Regulation and close overview within theCrocodile Farm industry itself. To collect eggs, an agreement with Traditional Owners (TO’s)must be in place and a valid license must be possessed. If not collected by the famersthemselves, eggs are purchased from licensed collectors.8
Hatchlings Hatchlings are on occasion sourced from the wild, but most are hatched and reared in captivityto be used for skins. Hatchlings can be traded across Australia to other farms in Queensland orWestern Australia.
Meat Crocodile meat is harvested for both human and pet consumption. It is sold domestically andexported
Other body parts This includes:► Teeth and bones for jewellery► Chinese medicine► Ornaments such as claws, skulls and skeletons.Limited quantities of crocodile products that are manufactured overseas are sold via retailoutlets in Australia, predominantly to tourists
7 The Northern Territory Crocodile Farming Industry: Strategic Plan 2015-2021
8 CFANT (2016), Pers. Comm., July

Northern Territory Crocodile Industry Economic Contribution Analysis EY ÷ 12
3.2.3 Industry ProfileThe Industry in the NT is recognised both nationally and internationally for its consistent, highquality products. Today, the NT hosts seven farms in the Top End9, while Queensland hosts five andWestern Australia hosts two.10
In 2011, the Industry in the NT was valued at approximately $25million, $19 million of which wasattributable to the sale of skin products. Australian crocodile skin exports accounted forapproximately 60 per cent of global trade in the product in 2012.11
Whilst the core role in the Industry is that played by farmers, there are a number of spin-off andsupport industries that are present. These include:
► Egg collectors
► Associated tourism operations
► Northern Territory Government services:
► Primary industries and Fisheries
► Department of Land Resource Management
► Parks and Wildlife Commission
► Northern Land Council.
Overall the international demand for crocodile products has been increasing with skins and meatbeing the largest product type being exported. Historic export data sourced from the Conventionon International Trade in Endangered Species of Wild Fauna and Flora (CITES) indicates that thelegal exportation of crocodile skins is increasing, which is associated with increasing demand drivenby the international luxury goods market. This trend is evident in data from 2000 to 2013, asshown below.
Figure 5: Export quantities of select crocodile products, Australia, 2000 - 2013
Source: CITES Trade Database http://trade.cites.org/, 2016
9 Refers to the Northern Territory10 Northern Territory Government Factsheets11 The Northern Territory Crocodile Farming Industry: Strategic Plan 2015-2021
Northern Territory Crocodile Industry Economic Contribution Analysis EY ÷ 13
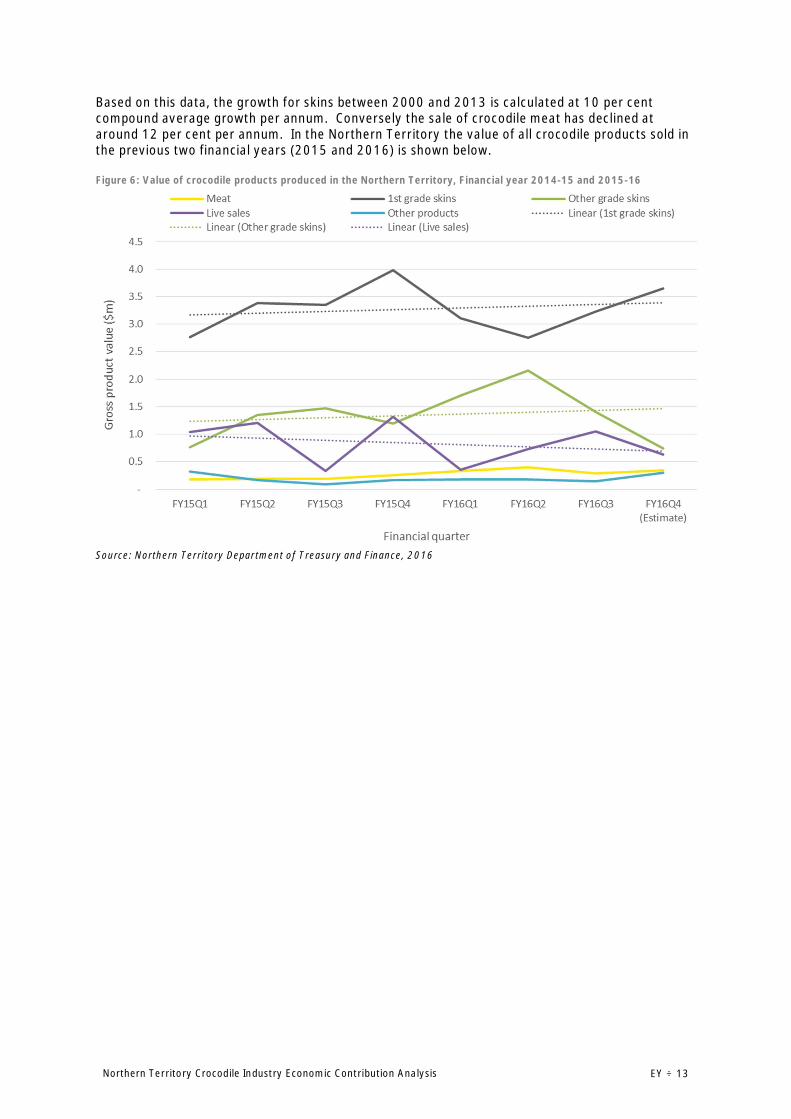
Based on this data, the growth for skins between 2000 and 2013 is calculated at 10 per centcompound average growth per annum. Conversely the sale of crocodile meat has declined ataround 12 per cent per annum. In the Northern Territory the value of all crocodile products sold inthe previous two financial years (2015 and 2016) is shown below.
Figure 6: Value of crocodile products produced in the Northern Territory, Financial year 2014-15 and 2015-16
Source: Northern Territory Department of Treasury and Finance, 2016
Northern Territory Crocodile Industry Economic Contribution Analysis EY ÷ 14
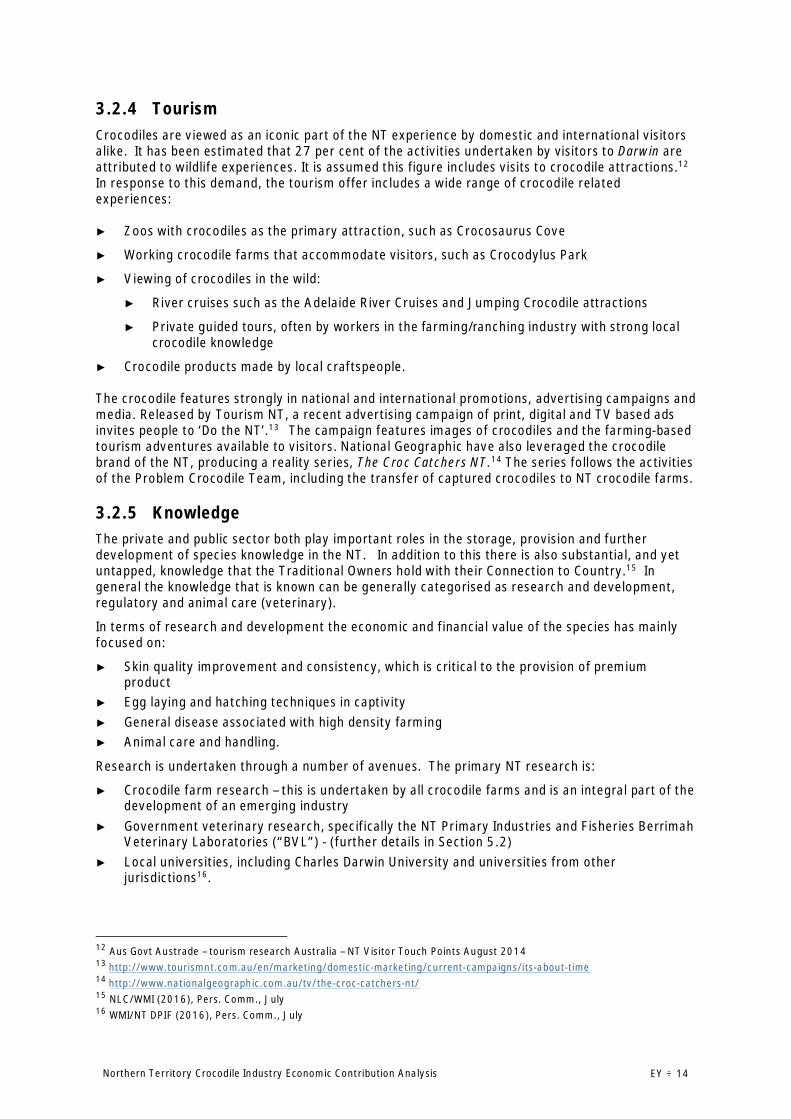
3.2.4 TourismCrocodiles are viewed as an iconic part of the NT experience by domestic and international visitorsalike. It has been estimated that 27 per cent of the activities undertaken by visitors to Darwin areattributed to wildlife experiences. It is assumed this figure includes visits to crocodile attractions.12
In response to this demand, the tourism offer includes a wide range of crocodile relatedexperiences:
► Zoos with crocodiles as the primary attraction, such as Crocosaurus Cove
► Working crocodile farms that accommodate visitors, such as Crocodylus Park
► Viewing of crocodiles in the wild:
► River cruises such as the Adelaide River Cruises and Jumping Crocodile attractions
► Private guided tours, often by workers in the farming/ranching industry with strong localcrocodile knowledge
► Crocodile products made by local craftspeople.
The crocodile features strongly in national and international promotions, advertising campaigns andmedia. Released by Tourism NT, a recent advertising campaign of print, digital and TV based adsinvites people to ‘Do the NT’.13 The campaign features images of crocodiles and the farming-basedtourism adventures available to visitors. National Geographic have also leveraged the crocodilebrand of the NT, producing a reality series, The Croc Catchers NT.14 The series follows the activitiesof the Problem Crocodile Team, including the transfer of captured crocodiles to NT crocodile farms.
3.2.5 KnowledgeThe private and public sector both play important roles in the storage, provision and furtherdevelopment of species knowledge in the NT. In addition to this there is also substantial, and yetuntapped, knowledge that the Traditional Owners hold with their Connection to Country.15 Ingeneral the knowledge that is known can be generally categorised as research and development,regulatory and animal care (veterinary).
In terms of research and development the economic and financial value of the species has mainlyfocused on:
► Skin quality improvement and consistency, which is critical to the provision of premiumproduct
► Egg laying and hatching techniques in captivity► General disease associated with high density farming► Animal care and handling.
Research is undertaken through a number of avenues. The primary NT research is:
► Crocodile farm research – this is undertaken by all crocodile farms and is an integral part of thedevelopment of an emerging industry
► Government veterinary research, specifically the NT Primary Industries and Fisheries BerrimahVeterinary Laboratories (“BVL”) - (further details in Section 5.2)
► Local universities, including Charles Darwin University and universities from otherjurisdictions16.
12 Aus Govt Austrade – tourism research Australia – NT Visitor Touch Points August 201413 http://www.tourismnt.com.au/en/marketing/domestic-marketing/current-campaigns/its-about-time14 http://www.nationalgeographic.com.au/tv/the-croc-catchers-nt/15 NLC/WMI (2016), Pers. Comm., July16 WMI/NT DPIF (2016), Pers. Comm., July
Northern Territory Crocodile Industry Economic Contribution Analysis EY ÷ 15
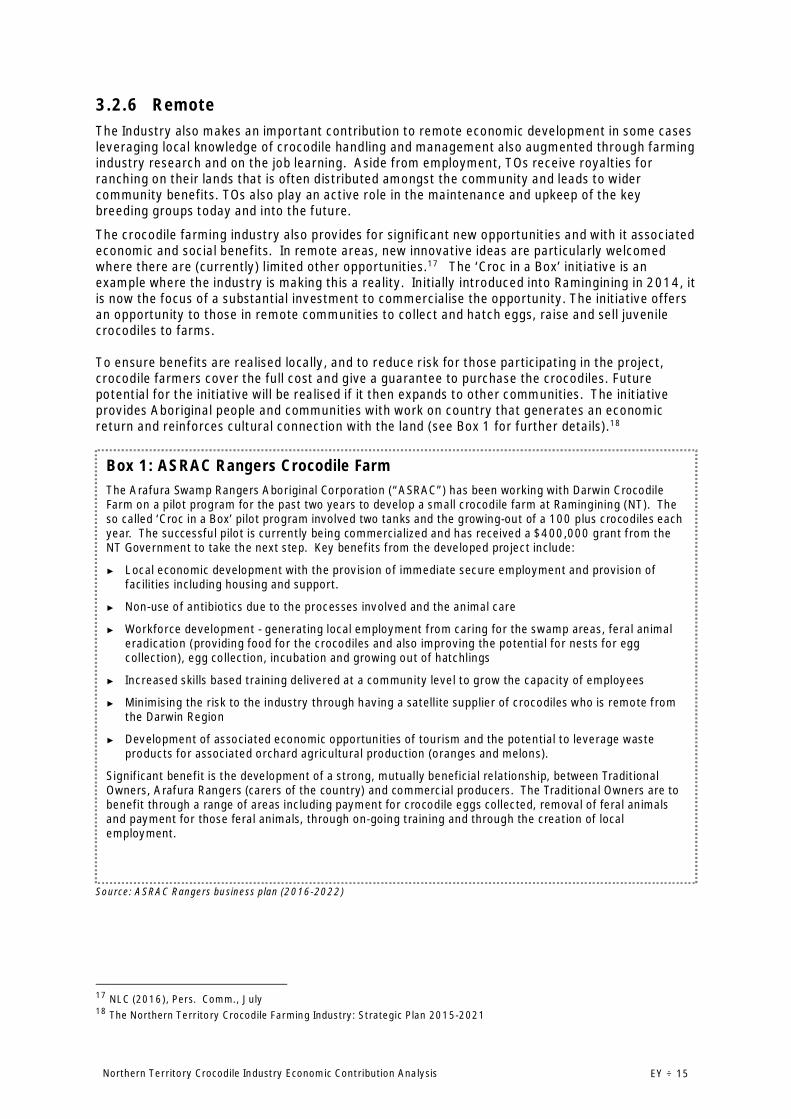
3.2.6 RemoteThe Industry also makes an important contribution to remote economic development in some casesleveraging local knowledge of crocodile handling and management also augmented through farmingindustry research and on the job learning. Aside from employment, TOs receive royalties forranching on their lands that is often distributed amongst the community and leads to widercommunity benefits. TOs also play an active role in the maintenance and upkeep of the keybreeding groups today and into the future.
The crocodile farming industry also provides for significant new opportunities and with it associatedeconomic and social benefits. In remote areas, new innovative ideas are particularly welcomedwhere there are (currently) limited other opportunities.17 The ‘Croc in a Box’ initiative is anexample where the industry is making this a reality. Initially introduced into Ramingining in 2014, itis now the focus of a substantial investment to commercialise the opportunity. The initiative offersan opportunity to those in remote communities to collect and hatch eggs, raise and sell juvenilecrocodiles to farms.
To ensure benefits are realised locally, and to reduce risk for those participating in the project,crocodile farmers cover the full cost and give a guarantee to purchase the crocodiles. Futurepotential for the initiative will be realised if it then expands to other communities. The initiativeprovides Aboriginal people and communities with work on country that generates an economicreturn and reinforces cultural connection with the land (see Box 1 for further details).18
Source: ASRAC Rangers business plan (2016-2022)
17 NLC (2016), Pers. Comm., July18 The Northern Territory Crocodile Farming Industry: Strategic Plan 2015-2021
Box 1: ASRAC Rangers Crocodile FarmThe Arafura Swamp Rangers Aboriginal Corporation (“ASRAC”) has been working with Darwin CrocodileFarm on a pilot program for the past two years to develop a small crocodile farm at Ramingining (NT). Theso called ‘Croc in a Box’ pilot program involved two tanks and the growing-out of a 100 plus crocodiles eachyear. The successful pilot is currently being commercialized and has received a $400,000 grant from theNT Government to take the next step. Key benefits from the developed project include:
► Local economic development with the provision of immediate secure employment and provision offacilities including housing and support.
► Non-use of antibiotics due to the processes involved and the animal care
► ·Workforce development - generating local employment from caring for the swamp areas, feral animaleradication (providing food for the crocodiles and also improving the potential for nests for eggcollection), egg collection, incubation and growing out of hatchlings
► Increased skills based training delivered at a community level to grow the capacity of employees
► Minimising the risk to the industry through having a satellite supplier of crocodiles who is remote fromthe Darwin Region
► Development of associated economic opportunities of tourism and the potential to leverage wasteproducts for associated orchard agricultural production (oranges and melons).
Significant benefit is the development of a strong, mutually beneficial relationship, between TraditionalOwners, Arafura Rangers (carers of the country) and commercial producers. The Traditional Owners are tobenefit through a range of areas including payment for crocodile eggs collected, removal of feral animalsand payment for those feral animals, through on-going training and through the creation of localemployment.

Northern Territory Crocodile Industry Economic Contribution Analysis EY ÷ 16
3.3 Key StakeholdersA number of stakeholders have played a played a key role in the development of the industry. These are outlined below in Table 6.
Table 6: Key Industry stakeholders
Stakeholder Description
Northern Territory Government The NT Government has invested in the industry to support growth through its infancy. Today, NT Government continues to support, govern andregulate the Industry to maximise investment, commercial activity and employment in urban and remote areas. The departments actively involved inthe Industry are:► Department of Business (DTBI)► Department of Primary Industry and Fisheries (DPIF)► Department of Land Resource Management (DLRM)► Tourism NT.
The NT Government releases the Management Program for the Saltwater Crocodile on an annual basis. The Program directs activities toward thevision for the NT to proliferate as a national and international leader in the consistent and efficient production of high quality skins.
Crocodile Farmers Association of theNorthern Territory (CFANT)
CFANT is a membership forum for those directly involved in the Industry. CFANT works closely with the NT Government, based on a common interestin developing and maintaining a sustainable industry. CFANT promotes responsible practices in which the commercial use of wild populations issustainable and where landowners directly benefit from the Industry.19
The organisation developed the NT Crocodile Farming Industry – Strategic Plan 2015-21, which profiles the Industry and highlights issues andopportunities. CFANT endeavors to secure the future of the Industry through sustainable growth.
Traditional Owners and the NorthernLand Council (NLC)
The NLC acts in the interest of the TO’s groups to negotiate appropriate and equitable arrangements for the use of their lands and its resources. Akey part of this role is to work as an intermediary between the TO’s and business operators who wish to utilise land or employ the expertise of TO‘s. Inthe past the NLC has facilitated ranching agreements ranging from two to ten years.20
Ranger groups operate under the authority of the NLC. These rangers undertake various activities relating to land and sea management andprotection. In some cases, rangers are involved in the management of farming productions, such as those in Ramingining.21
19 NT Crocodile Farming Industry – Strategic Plan 2015-2120 NLC (2016), Pers. Comm., July21 NT Crocodile Farming Industry – Strategic Plan 2015-21

Northern Territory Crocodile Industry Economic Contribution Analysis EY ÷ 17
Table 6: Key Industry stakeholders
Stakeholder Description
Crocodile farmers ► Crocodile farms in the NT breed, wild harvest and/or grow crocodiles for commercial purposes. Activities include ranching, rearing of hatchlingsand/or juveniles and breeding.
► The NT crocodile farms that have been included in the study include:► Crocodile Farms NT (Porosus Pty Ltd)► Crocodylus Park► Coolibah Crocodile Farm► Elizabeth Valley Crocodile Farm► Janamba Crocodile Farm► Lagoon Crocodile Farm► BA Crocodile Farms
Crocodile farmers are integral to the Industry and its growth. Farmers have invested significant resources into infrastructure, research anddevelopment, and social projects 22.
NT Primary Industries and Fisheries-Berrimah Veterinary Laboratories(BVL)
BVL, under the DPIF, provide quality assured services to support industry and deliver upon Government policies to ensure product integrity. BVLundertakes:► Diagnostic work as animal health problems emerge. This service is provided free of charge to farmers and is funded by the NT Government► Targeted research projects which are afforded through State and Federal funding grants.
BVL has undertaken targeted studies principally concerned with crocodile skin conditions that affect the quality of skin products for export. Staff atBVL often work alongside academic and private researchers, such as those from Charles Darwin University and Crocodylus Park.
Parks and Wildlife Commission of theNorthern Territory (PWCNT)
The Problem Crocodile Team (PCT), within PWCNT, is tasked with protecting the public from saltwater crocodile interaction. This is done throughtrapping, patrols and by responding to reports from businesses and residents. Crocodile farms are crucial to the operations of the PCT. When acrocodile is captured by the team, scientific data is collected and the crocodile is transported to a participating farm. The PWCNT have ongoingcontractual arrangements with any farmer that wishes to be involved to receive problem crocs from the team and be paid a nominal, predeterminedfee to accept the crocodiles. The team repeats this process for between 250 to 300 saltwater crocodiles per annum. As at July 2016, the PCTconsisted of five full time staff. The PWCNT is dependent on the farms to take the problem crocodiles as there are no other viable or ecologicallysound options available for relocation.23
22 Department of Land Resource Management (2016). Pers. Comm., July23 NT Problem Croc Team (2016). Pers. Comm., July

Northern Territory Crocodile Industry Economic Contribution Analysis EY ÷ 18
4. Methodology
The methodology for this economic contribution study is presented below.
Figure 7: Economic contribution method
Source: EY, 2016
4.2 Define Key MeasuresEconomic contribution is a measure comprising all market-related expenditure generated by aspecified industry or an activity.
Three common indicators of an industry or economic size or value are:
► Gross output – Market value of goods and services produced, often measured byturnover/revenue. Gross output is also referred to as ‘gross economic contribution’
► Value added – Market value of goods and services produced, after deducting the cost of goodsand services used
► Jobs – Number of jobs generated by an industry or attraction.
All three measures are valuable in their own right. Industry output is a measure of production,value add is a measure of wealth generation, and employment is a measure of the human capitalused in the production process (i.e. its labour intensity)
In comparing the size of an industry against others, it is generally accepted to discuss this in termsof its industry value add. Industry value add measures net of the costs of production (that is, inputssourced from other sectors) from the industry’s outputs. This avoids the inclusion of revenues toother industries and any associated double counting. In practice, industry value add largelycomprises wages, salaries and the operating surplus of an industry (i.e. the industry’s income). Thisstudy considers all three measures, with attention placed on industry value add measures whenmaking comparisons to other industries. The value add measure is commonly put forward as themost appropriate measure of an industry’s contribution to the national economy.
It is important to note that economic contribution studies do not consider the substitution impactsto other industries (i.e. what might happen to expenditures if the specific industry or activity werelost). As such economic contribution is a gross measure rather than a net measure.

Northern Territory Crocodile Industry Economic Contribution Analysis EY ÷ 19
4.3 Establish Contribution Analysis GeographyTwo geographical regions were selected for this study:
► Primary region - Northern Territory (NT)
► Secondary region - Regional and remote Northern Territory (RRNT) – areas used for the supplyof crocodile eggs excluding the Darwin metropolitan and fringe areas.
The primary area for analysis was the NT as a whole. However given the size and dominance of theDarwin economy in the NT, a secondary region was created to more effectively assess theeconomic contribution of regional and remote expenditure. Particular focus was given toexpenditure applicable to the Katherine surrounds and remote Aboriginal communities. Theboundaries of the regions and the relative position are shown below.
Figure 8: Contribution analysis geography – Northern Territory and Remote Areas
Source: EY, 2016/REMPLAN

Northern Territory Crocodile Industry Economic Contribution Analysis EY ÷ 20
4.4 Collect Data and Define AssumptionsInitial project stages involved collecting expenditure (both capital and operation) and employmentfigures from the various crocodile farms, with the addition of Crocosausrus Cove given theinteractions with farming operations in the Industry. To ensure consistency, data was collected forthe 2014/15 financial year. Stakeholders consulted in the data collection process include:
► Crocodile farms
► Crocodile attraction operators with a direct link to the farming sector, specificallyCrocosauraus Cove located in Darwin
► Northern Territory Government departments, including:
► Department of Land Resource Management
► Department of Business
► Parks and Wildlife Commission
► Department of Primary Industries (including BVL)
► Universities and researchers
► Northern Land Council.
A more comprehensive list of these assumptions is provided in Appendix A.
4.5 Estimate the Economic ContributionThis report estimates the direct and indirect economic contribution of the Industry the NT andRRNT economy by estimating the direct contribution associated with the Industry as outlinedbelow.
Table 7: Areas of direct contribution
Contribution Explanation
Direct crocodile farmingoperations
Economic contribution and employment generated by crocodile farm operations, includingconstruction of farming infrastructure.
Tourism (and associatedretail component)
Contribution from visitors specifically coming to, or extending their stay, in the NT to visita crocodile attraction (associated with farm operations).Included retail is only that which is directly associated with a tourism attraction and doesnot include standalone businesses trading crocodile products (see Appendix B for detail).
Scientific research/productresearch and development
Contribution of research activities focusing on crocodile disease mitigation or skinimprovement research.
Analysis Note: Two farms declined to provide data for the analysis. As a result, the economiccontribution of these farms has been estimated by taking the expenditure data of comparablefarms and adjusting this expenditure based on relative output. This approach effectivelyassumes that the two farms indicated produce the same value add in proportional terms as therest of the Industry.

Northern Territory Crocodile Industry Economic Contribution Analysis EY ÷ 21
Once data was collected from stakeholders, it was analysed and expenditure items were allocatedto the approximate 114 Input Output (IO) industry classification. In the case of this study, crocodilefarm spend and employment was allocated in the following manner:
Table 8: Crocodile industry activity to 114 Input Output industry classification
Activity 114 IO Industry Classification
Crocodile farming Aquaculture
Crocodile meat works Meat and Meat Product Manufacturing
Zoological park operation Heritage, Creative and Performing Arts
Sale of crocodile products to tourists Retail Trade
Scientific research/product research and development Professional, Scientific and Technical Services
Source: EY, 2016
Next, an estimate of the indirect or flow-on effect24 for the rest of the economy resulting from thedirect expenditure is completed. This study adopts an input/output approach to the calculation ofindirect (wider) economic impacts. EY engaged REMPLAN to develop a tailored input/output tablethat contains multipliers that reflect the specific characteristics of the NT and RRNT economy25.
The REMPLAN model accounts for ‘leakage’ of direct expenditure from the economy in itsmultipliers. Input output models are often criticized when used in economic impact assessments asthey do not consider capacity constraints in the economy (e.g. full employment). Such constraintslimit the extent to which economic impacts can increase in a linear fashion with changes in demand.The alternative CGE approach26 addresses some of these issues, although the nature and scale ofthis Project did not warrant the use a detailed CGE analysis.
Further details on the IO approach are provided in Appendix A.
4.6 Discuss Intangible Economic BenefitsThere are a number of ways the Industry contributes to the NT economy that are intangible.Examples of these contributions are:
► Outcomes for Aboriginal People - including social inclusion, higher income in communitieswith reduced reliance on Government support leading to increased empowerment of TO groups
► Environmental conservation and species management - including the preservation of thespecies for future generations, biodiversity and reversing the extinction of the species in theNT
► Value of knowledge through research and development - including patents, cures forcrocodile farming related disease and education
► Regulation - including industry sustainability, environmental standards to maintain high qualityoperations and outputs, avoidance of live export issues and ensuring optimal levels ofregulation
► Additional tourism value - including brand recognition for the NT and spend by televisionproduction companies utilising the wealth of knowledge among crocodile farmers and otherindustry professionals.
These elements are discussed in greater detail in Section 6.
24 For instance, injections in tourism expenditures will have downstream impacts (output and employment) through anincrease in expenditure in connected industries (e.g. hospitality and accommodation)25 REMPLAN modelling provides the ability to calculate the value of gross regional product and to assess likely economicimpacts of proposed changes. REMPLAN can foster an understanding of the interdependent nature of the local economy.26 These complex models are based on theoretical concepts and account for profit maximisation, household consumptionfunctions, terms of trade effects, labour market adjustments etc. These models take into account changes in prices andwages with increases in demand. As such, their economic impact results are generally more conservative relative to input-output analysis as capacity constraints are taken into account by increases in prices and wages.
Northern Territory Crocodile Industry Economic Contribution Analysis EY ÷ 22
5. Economic Contribution Analysis
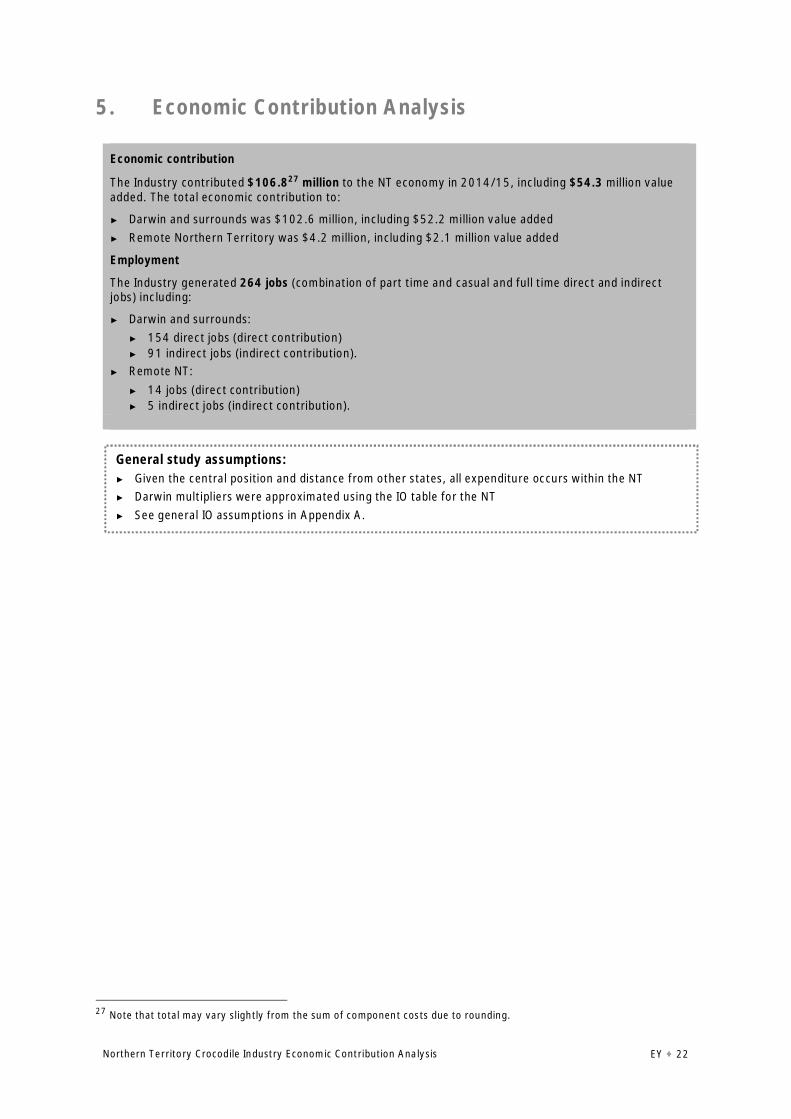
Economic contribution
The Industry contributed $106.827 million to the NT economy in 2014/15, including $54.3 million valueadded. The total economic contribution to:
► Darwin and surrounds was $102.6 million, including $52.2 million value added► Remote Northern Territory was $4.2 million, including $2.1 million value added
Employment
The Industry generated 264 jobs (combination of part time and casual and full time direct and indirectjobs) including:
► Darwin and surrounds:► 154 direct jobs (direct contribution)► 91 indirect jobs (indirect contribution).
► Remote NT:► 14 jobs (direct contribution)► 5 indirect jobs (indirect contribution).
27 Note that total may vary slightly from the sum of component costs due to rounding.
General study assumptions:► Given the central position and distance from other states, all expenditure occurs within the NT► Darwin multipliers were approximated using the IO table for the NT► See general IO assumptions in Appendix A.

Northern Territory Crocodile Industry Economic Contribution Analysis EY ÷ 23
5.1 Summary of CategoriesTable 9 below summarises the gross output, value added and employment for the Industry.
Table 9: Economic contribution analysis key output summary, 2014/15 Financial Year
Direct Indirect Total
Economic contribution – Gross output
Farm Operations $24.49 $14.03 $38.52
Farm Construction $11.60 $6.65 $18.25
Farm Related Tourism28 $20.33 $14.41 $34.74
Regulation $4.30 $4.13 $8.43
Veterinarian/Scientific Services $1.41 $1.25 $2.66
Remote Impacts* $2.31 $1.86 $4.17
Total Northern Territory $64.44 $42.34 $106.77
Value added (subset of Gross output)
Farm Operations $13.42 $6.47 $19.89
Farm Construction $6.36 $3.06 $9.42
Farm Related Tourism $9.61 $7.33 $16.95
Regulation $2.40 $2.17 $4.57
Veterinarian/Scientific Services $0.69 $0.65 $1.35
Remote Impacts* $1.19 $0.96 $2.14
Total Northern Territory $33.67 $20.65 $54.33
Employment (jobs)
Farm Operations 39 30 68
Farm Construction 18 14 32
Farm related tourism 80 35 115
Regulation 13 10 23
Veterinarian/Scientific Services 4 3 7
Remote Impacts* 14 5 19
Total Northern Territory 168 96 264
*Calculated using the Northern Territory IO table (some numbers may not add due to rounding)_
Source: Stakeholder consultation, REMPLAN, 2016
28 Includes operational and capital expenditure.

Northern Territory Crocodile Industry Economic Contribution Analysis EY ÷ 24
5.2 Farm Operations5.2.1 Operational ExpenditureDuring the 2014/15 financial year, the total direct operation expenditure of the crocodile farmingcomponent (aquaculture) accounted for $24.5m direct spend into the NT economy. Theoperational expenditure data collected from the crocodile farming businesses was comprehensiveand included the following costs:
► Salaries, Wages and On-Costs
► Animal Care
► Maintenance Consumables
► Cost of Sales
► Conservation & Research Projects
► Utilities
► Marketing and Promotion
► Safari and Other Tour Costs
► Depreciation
► Loss on Disposal of Asset
► Printing
► Other Expenses.
Applying the multipliers from the NT regional IO table, this annual gross direct expenditure of$24.5m is estimated to generate $19.9m of total value added, specifically:
► $13.4m direct effect
► $6.5m indirect effect
► This direct operational expenditure is estimated to support a total of 68 jobs, including:
► 39 as a result of the direct expenditure
► 30 indirect jobs.
These details and others are contained in Table 10 below.
Table 10: Operational Expenditure, Crocodile farming, Northern Territory, 2014/15FY
Direct effect Indirect effect Total
Gross Output ($M) $24.49 $14.03 $38.52
Value-added ($M) $13.42 $6.47 $19.89
Employment (Jobs) 38 30 68
Source: Stakeholder consultation, REMPLAN, 2016 (some numbers may not add due to rounding).
Specific key assumptions:► Multipliers from the aquaculture industry were used to estimate the contribution of operational
expenditure► The contribution was estimated using the expenditure approach

Northern Territory Crocodile Industry Economic Contribution Analysis EY ÷ 25
5.2.2 Capital Expenditure (1 year)Crocodile farms and related tourism operators were initially asked to provide a single year of capitalexpenditure to inform this analysis. During the 2014/15 financial year, NT crocodile farmsdeclared directly spending $11.6m on capital works to improve farm facilities. These worksincluded, but were not limited to:
► Investment in plant and equipment
► Computer programme and equipment
► Pen and pond construction and renovations
► Fencing
► Construction of incubators
► Bitumen service roads
► Construction of bores, dams and installation of associated pumping equipment.
This $11.6m of direct capital expenditure (output) was used to estimate the resulting flow oneconomic activity. The approach estimated that this expenditure supported $9.4m total valueadded, which comprised:
► $6.4m of value added from the direct expenditure
► $1.5m of value added from the indirect effect.
In terms of employment, this expenditure generated a total employment amount of 32 FTE:
► 18 direct jobs (directly involved in capital works)
► 14 indirect effect jobs.
These details and others are outlined in Table 11.
Table 11: Capital Expenditure, Crocodile farming, Northern Territory, 2014/15FY
Direct effect Indirect effect Total
Gross Output ($M) $11.60 $6.65 $18.25
Value-added ($M) $6.36 $3.06 $9.42
Employment (Jobs) 18 14 32
Source: Stakeholder consultation, REMPLAN, 2016
Specific key assumptions:► Multipliers from the aquaculture industry were used to estimate the contribution of capital expenditure► The contribution was estimated using the expenditure approach

Northern Territory Crocodile Industry Economic Contribution Analysis EY ÷ 26
5.2.3 Capital Expenditure (3 year)The capital expenditure analysis undertaken in this section seeks to better represent theinvestment occurring in the Industry that may not be adequately represented by the expenditure ofa single year. Description of capital expenditure and expenditure amounts were collected fromfarmers for the 2014, 2015 and 2016 financial years respectively. These were then broadlycategorised as being general investment or investment in research and development facilities.
Capital expenditure in pen construction and renovation was the largest spend category across allthree financial years, accounting for between $3m and $7.5m. Plant equipment and buildings werethe next two significant categories. Overall 2014/15 saw the greatest capital expenditure of$9.81m followed by $7.91m in 2015/16 and 3.7m in 2013/14. A comparison of expenditure asper these categories is provided in Figure 9.
Figure 9: Capital expenditure, All crocodile farms, 2013/14, 2014/15 and 2015/16
Source: Stakeholder consultation, 2016
$-
$1
$2
$3
$4
$5
$6
$7
$8
Expe
nditu
re($
m)
Category
2013/14 2014/15 2015/16

Northern Territory Crocodile Industry Economic Contribution Analysis EY ÷ 27
5.3 KnowledgeThis report values knowledge in terms of the net contribution from Government and privateorganisations pre-dominantly made up of time and expense involved in participating and supportingthe Industry. However, it is acknowledged that these services are most likely a significant under-representation of the value due to the Industry’s farming status and the value this has at aninternational level29. This does not capture the significant knowledge of the Aboriginal peoplewithin the community. Much of today’s recognised monetary value is in terms of the sustainablemanagement of crocodiles across the NT.
5.3.1 Veterinarian/Scientific ServicesThe extent of BVL’s direct involvement in the Industry was determined through direct consultationwith the DPIF. These discussions determined the size and ranks of the team. Adjustments werenecessary to reflect that the crocodile farming industry was not the full time focus of DPIF staff andwas estimated to be, on average, 15 per cent of relevant staff’s time. Appropriate multipliers werethen applied to this amount to determine economic contribution. For the purposes of this analysis,the staff involved in crocodile monitoring and scientific monitoring within the NT Department ofLand Resource Management were also included within this category.
Under the ANSIC06 industry classification system, veterinarian services are included underProfessional, Scientist and Technical services (excluding Computer System Design and RelatedServices) and so the appropriate multipliers for salary and wages from this industry were applied todetermine economic contribution.
Based on this approach, Vet services contributed 4 FTE that was estimated to be $1.4m of grossdirect output. In terms of value added, this equates to a total amount of $1.4m, including:
► $0.7m direct effect
► $0.7m indirect effect.
Indirect employment was estimated at 3 FTE, which when added to direct employment equates to 7FTE. Details are contained in Table 12 below.
Table 12: Operational Expenditure, Veterinarian services, Northern Territory, 2014/15FY
Direct effect Indirect effect Total
Gross Output ($M) $1.41 $1.25 $2.66
Value-added ($M) $0.69 $0.65 $1.35
Employment (Jobs) 4 3 7
Source: Stakeholder consultation, REMPLAN, 2016 (some numbers may not add due to rounding).
29 DLRM (2016), Pers. Comm. August
Specific key assumptions:► Multipliers from the Professional, Scientific and Technical Services industry were used to estimate the
contribution of veterinarian and scientific services► The contribution was estimated using the employment approach► The contribution estimate was based on the demand for vet services that would not occur if the
Industry did not exist in the NT.► BVL and NTDLRM were assumed to all reside in the NT (no Fly-In-Fly-Out (FIFO))

Northern Territory Crocodile Industry Economic Contribution Analysis EY ÷ 28
5.3.2 RegulationThe NT Government employs staff to regulate the industry, addressing issues such speciesprotection, export management and other regulatory activities that in turn promote the brand andimage of the Industry. The extent of this industry activity is estimated by valuing what would notexist in its absence also considering the wild crocodile populations would still be served by thisregulation. This was determined based on conversations with key Government stakeholders. Forthe purposes of this study, Northern Land Council (NLC) staff are also included within regulationdue to the role they play in administering egg ranching and subsequent royalty payments.
During 2014/15, there were 13 full-time employees within the NT Government or the NLC directlyresponsible for the regulation of crocodile farming. In addition to this direct employment,government regulation also created 10 indirect jobs. In terms of total value added, regulationcontribution $4.6m, specifically:
► $2.4m direct effect
► $2.2m indirect effect.
These details and others are contained in Table 13 below.
Table 13:Operational Expenditure, Crocodile Industry Regulation, Northern Territory, 2014/15FY
Direct effect Indirect effect Total
Gross Output ($M) $4.30 $4.13 $8.43
Value-added ($M) $2.40 $2.17 $4.57
Employment (Jobs) 13 10 23
Source: Stakeholder consultation, REMPLAN, 2016
Specific key assumptions:► Multipliers from the Public Administration and Regulatory Services industry were used to estimate the
contribution of regulating the crocodile industry► The contribution was estimated using the employment approach► Employees work entirely in crocodile regulation

Northern Territory Crocodile Industry Economic Contribution Analysis EY ÷ 29
5.3.3 Research and DevelopmentExpenditure attributable to research and development generated by the crocodile farming industrycan be counted in number of ways:
► Expenditure to private institutions such as universities to undertake studies
► Consulting services offered by government departments on behalf of farm operators
► Internal farm research and development by dedicated or semi dedicated staff and students(carrying out their doctoral studies).
Internal farm research and development is difficult to quantify as the nature and size of theindustry means that operators are regularly conducting passive research and development in howthey operate and plan new infrastructure. In most instances farms did not differentiate distinctresearch and development expenditure from normal operations (that could then be used to easilyestimate this contribution).
However, due to the progressive nature of the Industry, farm owners do sell their expertise to othercrocodile farmers nationally and internationally.30 Crocodile farmers and NT GovernmentVeterinarians alike make a substantial scientific contribution to international specialist groups, suchas to the Veterinary Group of the International Union for the Conservation of Nature (IUCN)-SpeciesSurvival Commission (SSC) Crocodile Specialist Group. This is also difficult to quantify as thebenefit that participating and building this reputation generates is not a direct benefit in atraditional contribution sense.
30 Northern Territory Crocodile Farming Industry Strategic Plan 2015-21

Northern Territory Crocodile Industry Economic Contribution Analysis EY ÷ 30
5.4 Farm Related Tourism5.4.1 Visitor ExpenditureCrocosaurus Cove and Crocodylus Park are the two tourism businesses related directly to crocodilefarming and provide zoological services available to tourists. The combined attendance visitor dataand place of origin for the 2014/15 financial year is included in Table 14. Details for all the tourismvalue estimates are included in Appendix B.
Table 14: Tourist attendance to NT crocodile parks, 2014/15
Origin Visitor Numbers
NT 55,000
Interstate 46,000
International 13,000
Total 114,000
Source: Industry data, 2016 (Crocosaurus Cove and Crocodylus Park)
The Visitor Average Expenditure Profile produced by Tourism Research Australia is also a keydataset used in the calculation of the tourism contribution component and is shown below inTable 15.
Table 15: Visitor Average Expenditure Profile
Visitor Profile Domestic Day Domestic Overnight International
Average Stay (nights) N/A 6.9 16.7
Average Spend per trip ($) $152 $1,313 $1,598
Average Spend per night ($) N/A $189 $95
Source: Tourism Research Australia (TRA), National and International Visitor Surveys June 2015; Northern Territory
As indicated in Section 3.2.4, the ability to see crocodiles is a strong attractor for NT tourism. Assuch, it is reasonable to assume that for a proportion of NT tourists, the primary driver is to seecrocodiles (in the wild or through farm related tourism). Similarly, if it was not possible to seecrocodiles, then those tourists would not visit (or stay as long) in the NT. For the purpose of thisstudy, and without specific surveys carried out, we have assumed that 5% of interstate andinternational tourists visit the NT specifically for farm related tourism. Where this is the case ourcalculations capture the full trip spend of these visitors. Otherwise, the study assumes a casual visitand attributes only a half-of- one day’s expenditure to this. Further details are included in AppendixB.
Specific key assumptions:► The NT visitor spend is representative of visitors who attend crocodile parks► Split of tourists from the NT by day and overnight: 90 per cent of tourists from the NT were considered
to be day visitors, the remainder overnight► All interstate tourists were overnight visitors► No visitors were assumed to visit both parks in a single day

Northern Territory Crocodile Industry Economic Contribution Analysis EY ÷ 31
The total visitor expenditure attributable to the crocodile industry is outlined in Table 16.
Table 16: Economic contribution from crocodile visitation expenditure, 2014/15 Financial Year ($m)
Domestic Day DomesticOvernight International Total
Specific visitors $7.5 $3.4 $1.0 $11.9
Casual visitors $- $4.6 $0.6 $5.2
Total expenditure $7.5 $8.0 $1.6 $17.1
Source: EY, 2016
Quantifying the economic tourism contribution using economic multipliers for the NT is difficult asthe tourism industry does not have its own category but rather contributes to a range of otherindustries, such as retail and accommodation and food services, to varying extents. A proxy, basedon REMPLAN’s tourism module, was used to attribute tourism spend across these industriesspecific to the NT economy.
5.4.2 Farm Related Tourism – Operational ExpenditureDuring the 2014/15 financial year, the tourism component of farms and croc-related attractionsexpended $4.94m on their operations (direct expenditure). This accounted for money spent tooperate the tourist facing facilities at both Crocosaurus Cove and Crocodylus Park. This directexpenditure generated a total value added value of $4.6m, including:
► $2.5m direct effect
► $2.1m indirect effect.
We note that an adjustment was made to the tourism expenditure component (below) to avoiddouble counting of operational expenditure and tourism based expenditure31.
5.4.3 Farm Related Tourism – Capital ExpenditureDuring the 2014/15 financial year the tourism component of farms spent $84,000 on building andrenovating tourist serving infrastructure (direct expenditure). This accounted for capital works thatoccurred solely within the zoo and tourist areas of either Crocosaurus Cove or Crocodylus Park.This direct expenditure generated a total value added value of $78,000, including:
► $43,100 direct effect
► $34,900 indirect effect.
31 This was done by reducing the assumed daily expenditure of each visitor by the entrance fee attributed to each at thetourism facilities.
Specific key assumptions:► Multipliers from the Heritage, Creative and Performing Arts to calculate these effects.► The contribution was estimated using the expenditure approach.
Specific key assumptions:► Multipliers from the Heritage, Creative and Performing Arts to calculate these effects.► The contribution was estimated using the expenditure approach.

Northern Territory Crocodile Industry Economic Contribution Analysis EY ÷ 32
5.4.4 Total Farm Related Tourism
The total farm related tourism economic contribution was estimated as the sum of visitorexpenditure along with related operational and capital expenditure. The result was an estimatedtotal value added amount of $17.0m32, which could be broken down into:
► $9.6m direct effect
► $7.3m indirect effect
Table 17 summarises the key economic contribution indicators for visitor expenditure during the2014/15 financial year.
Table 17: Economic contribution from NT crocodile farming related tourism, 2014/15 Financial Year
Direct effect Indirect effect Total
Gross Output ($M) $20.33 $14.41 $34.74
Value-added ($M) $9.61 $7.33 $16.95
Employment (Jobs) 80 35 115
Source: Stakeholder consultation, REMPLAN, 2016
32 We note this figure may not exactly total the component totals below due to rounding.
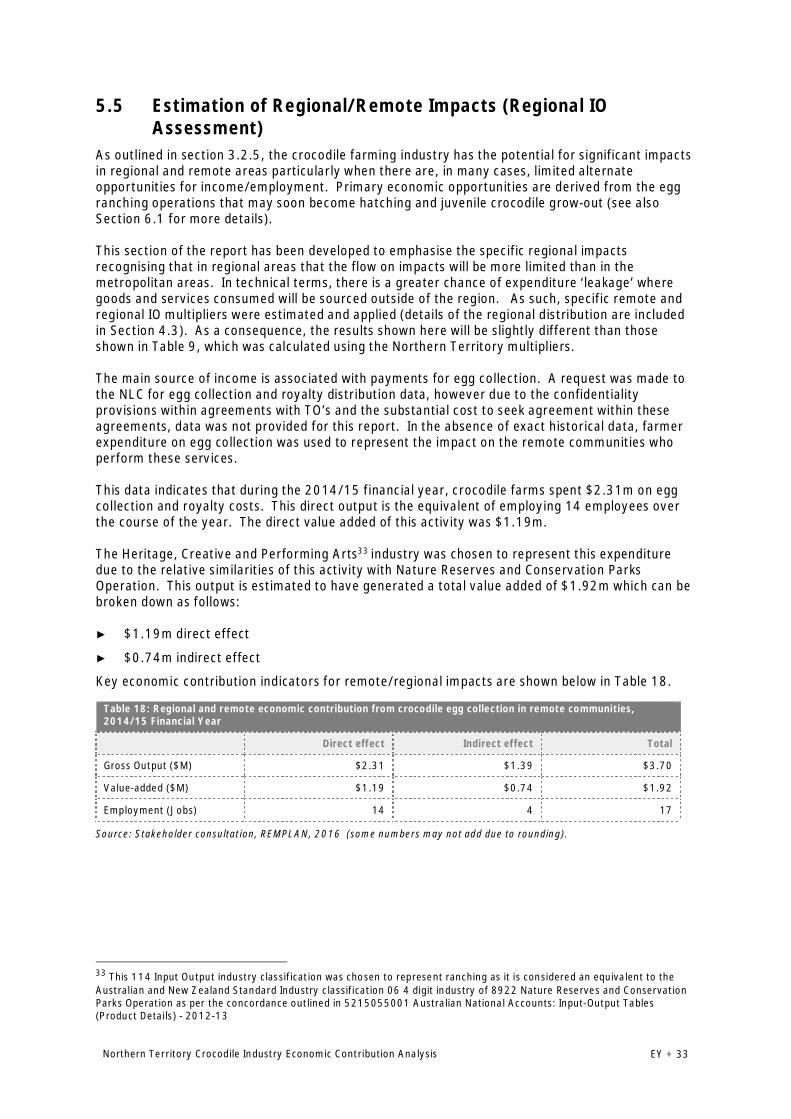
Northern Territory Crocodile Industry Economic Contribution Analysis EY ÷ 33
5.5 Estimation of Regional/Remote Impacts (Regional IOAssessment)
As outlined in section 3.2.5, the crocodile farming industry has the potential for significant impactsin regional and remote areas particularly when there are, in many cases, limited alternateopportunities for income/employment. Primary economic opportunities are derived from the eggranching operations that may soon become hatching and juvenile crocodile grow-out (see alsoSection 6.1 for more details).
This section of the report has been developed to emphasise the specific regional impactsrecognising that in regional areas that the flow on impacts will be more limited than in themetropolitan areas. In technical terms, there is a greater chance of expenditure ‘leakage’ wheregoods and services consumed will be sourced outside of the region. As such, specific remote andregional IO multipliers were estimated and applied (details of the regional distribution are includedin Section 4.3). As a consequence, the results shown here will be slightly different than thoseshown in Table 9, which was calculated using the Northern Territory multipliers.
The main source of income is associated with payments for egg collection. A request was made tothe NLC for egg collection and royalty distribution data, however due to the confidentialityprovisions within agreements with TO’s and the substantial cost to seek agreement within theseagreements, data was not provided for this report. In the absence of exact historical data, farmerexpenditure on egg collection was used to represent the impact on the remote communities whoperform these services.
This data indicates that during the 2014/15 financial year, crocodile farms spent $2.31m on eggcollection and royalty costs. This direct output is the equivalent of employing 14 employees overthe course of the year. The direct value added of this activity was $1.19m.
The Heritage, Creative and Performing Arts33 industry was chosen to represent this expendituredue to the relative similarities of this activity with Nature Reserves and Conservation ParksOperation. This output is estimated to have generated a total value added of $1.92m which can bebroken down as follows:
► $1.19m direct effect
► $0.74m indirect effect
Key economic contribution indicators for remote/regional impacts are shown below in Table 18.
Table 18: Regional and remote economic contribution from crocodile egg collection in remote communities,2014/15 Financial Year
Direct effect Indirect effect Total
Gross Output ($M) $2.31 $1.39 $3.70
Value-added ($M) $1.19 $0.74 $1.92
Employment (Jobs) 14 4 17
Source: Stakeholder consultation, REMPLAN, 2016 (some numbers may not add due to rounding).
33 This 114 Input Output industry classification was chosen to represent ranching as it is considered an equivalent to theAustralian and New Zealand Standard Industry classification 06 4 digit industry of 8922 Nature Reserves and ConservationParks Operation as per the concordance outlined in 5215055001 Australian National Accounts: Input-Output Tables(Product Details) - 2012-13

Northern Territory Crocodile Industry Economic Contribution Analysis EY ÷ 34
Heritage, Creative and Performing Arts is a broad industry and it is not immediately apparent as towhether ranching would generate the same demand for intermediate inputs (industrial effect) asper the representative industry. Similarly, it is difficult to say whether consumption patterns fromtypical industry workers spending salaries and wages is consistent with remote communities. Theseissues should be considered when interpreting this estimation.
Specific key assumptions:► Industrial inputs into the industry are the same the representative industry Heritage, Creative and
Performing Arts► Industrial production and consumption characteristics in remote communities are assumed to be
consistent with the same characteristics for the NT excluding Darwin and surrounds.

Northern Territory Crocodile Industry Economic Contribution Analysis EY ÷ 35
6. Broader Economic, Social and Cultural Values
This section addresses the intangible contribution elements that cannot be measured usingtraditional means. The key elements include:
► Outcomes for Aboriginal people
► Environmental conservation and species management
► Value of knowledge – research and development
► Regulation
► Additional tourism value
► Each of these is outlined below.
6.1 Outcomes for Aboriginal PeopleThe Industry represents opportunities for Aboriginal people in communities in RRNT providingsupport to six different regions across the NT from annual ranching operations. As such, theIndustry has the potential to provide significant economic and social benefits
As outlined in Section 5.5, in 2014/15 over $2.3million was paid directly to TOs and those taskedwith egg collection (such as the NT Ranger Groups). This regular annual contribution adds incomeand employment opportunities for the regional areas that then result in less reliance onCommonwealth/state support, greater empowerment to TO groups, opportunities for connection tocountry and greater opportunities to maintain and grow social cohesion.
The ranching, or gathering of the eggs from the nests, occurs either on farming leases or TO lands.Part of the success of the operation comes from the support of the NLC Ranger Program.
Around 20,000eggs a season are harvested with the assistance of Ranger groups who also havethe wider responsibilities for ‘care of country’. 34 The crocodile farming practices provide anavenue for Rangers to put into practice the training, skills and knowledge that they have. In someinstances the opportunity to collect eggs also provides the associated benefit of carrying out otherroles including feral animal control (such as buffalo culls) and reconnaissance for burningoperations.35
As such, the crocodile farming industry is a key mainstay of the Ranger program in a number ofareas. Further, the value of a dollar earned in these regional and remote area is far greater thanthe individual dollar itself.
For example, a recent report prepared for the Commonwealth Department of Prime Minister andCabinet recently estimated the social return on investment of the Ranger program itself, working inconjunction with the Indigenous Protected Area program, was in the order of 3.4:1. The study alsoexemplified the importance of providing the ability to reconnect to country, culture and language36
(see Box 2 for further details).
34 DPLW (2016), Pers. Comm., Sept35 NLC (2016), Pers. Comm., July36 See the Department of Prime Minister and Cabinet report – prepared by Social Ventures Australia – Consolidate report onIndigenous Protected Areas following Social Return on Investment analyses – Feb 2016.
‘Caring for Country’ rangers operate across almost 200,000 square kilometres of landowned by Aboriginal peoples in the Land Council's area. Ranger groups provide aformalised structure for the transfer of traditional knowledge from old to young, as well asbeing a vehicle for the training and employment of young Aboriginal people living in remotearea’s (NLC 2016)1
Northern Territory Crocodile Industry Economic Contribution Analysis EY ÷ 36
Source: SVA (2016)
In the remote and regional areas of the NT there are limited opportunities for employment, muchless those that are connected to country (that are highly sought after). To date the main focus hasbeen on ranching with any collected eggs carefully transported back to crocodile farms closer toDarwin. Work is currently underway within the Industry to provide further economic opportunitiesout closer to where the egg collection occurs. The ‘Croc in a Box’ concept was developed withinthe Industry to enable communities not only to collect the eggs but to incubate and then grow outfrom hatchlings for later transfer back to the farms as small crocodiles (up to one metre long) . Theability to do this increases the value of the egg (collected) by up to 10 times. Once fully developedthis concept has the potential to be pushed out to many communities consolidating and significantlyenhancing the outcomes. Further details on the ‘Croc in a Box’ concept are included in Section 6.3.
Box 2: Value of the involvement of the Ranger Program and theIndigenous Protected Area Program.
In January 2016, the Department of the Prime Minister and Cabinet released a study (prepared by SocialVentures Australia (SVA)) that reported on consolidated findings of social return on investment analysisfor four separate areas. The SVA (2016) study emphasised that the Ranger program was seen to provideopportunities for remote and regional areas to enhance cultural ties to the land and facilitate the passingon of skills and knowledge through the generations. The more time spent on country, the greater the valuecreated for the local community and government (that the crocodile industry contributes to). TheGovernment, and society as a whole, are also key beneficiaries from:► An increase in local indigenous community members undertaking training for other jobs who were also
working as Rangers► A reduction in income support payments and an increase in income tax where more indigenous people
were working► Reduced violence and safer communities► A greater respect for traditional elder knowledge in the broader community► A change in Government engagement with indigenous communities leading to better and more
innovative partnering modelsThe greatest reported benefit of the program was the associated reduced cost of land management.
Interestingly, the study estimated the social return on investment across four different indigenousprotected areas across Australia.4 The Wardekkan IPA , north east of Darwin (that happens in includecrocodile ranching), and the associated indigenous Ranger program was found to create the greatest valuewith a Social Return on Investment of 3.4:1.

Northern Territory Crocodile Industry Economic Contribution Analysis EY ÷ 37
6.2 Environmental Conservation and Species ManagementAs outlined in Section 3, the saltwater crocodiles of the NT were almost hunted until theirextinction in the 1960s. The crocodiles were brought back during a conservation phase37 (1971 to1984) with management by PWCNT under the Territory Parks and Wildlife Conservation Act (TPWCAct). During the 1990s the crocodile management regime changed as wild stocks replenished andthe responsibility for their continued management was divided between P&W for wild stocks and theDepartment of Primary Industry and Fisheries (DPIF) for farm production. The Industry played animportant part in the change process and benefitted from the introduction of economic incentivesfor land owners to maintain crocodile populations with payments for the sustainable collection ofcrocodile eggs on their land. As of 2014 the crocodile populations in the wild were no longer aproblem and are now considered to have recovered.38
The development and continued presence of the Industry (that maintains the market and demandfor eggs) is a key agent in the continued sustainable management of the saltwater crocodile in theNT. Further, the environmental standards and conservation program (of which the Industrycontributes) is recognised internationally as best practice contributing to NT skins being rated asone premium locations worldwide to source crocodile skins.39
6.3 Value of Knowledge – Research and DevelopmentResearch and development is essential in the development of an emerging industry. Until recently,much of the research focused on other species. Ongoing research into the saltwater crocodilespecies is being undertaken to build species specific knowledge and, as such, the Industry is in aconstant state of change. Each day more knowledge is generated of the crocodiles and improvedmethods of growing and handling crocodiles is developed.
The NT has internationally recognised researchers, such as Graham Webb and Charlie Manolis, butalso farm industry experts (such as Mick Burns) who are leading the way in approaches andmethods to improve crocodile farming. This combination attracts much interest including visitingresearchers and academics similarly carrying out work in this area (itself creating an increase inlocal economic activity).
The NT is not unique to being the home of saltwater crocodiles around the world with others suchas Vietnam, Indonesia and Papua New Guinea also home to Crocodylus Porosus. These countriescompete with Australia to produce crocodile products with many having lower relative productioncosts based on lower wage rates and improved growing climatic conditions40. However, Australiamaintains a higher quality differential based on a premium grade and greater consistency of skinquality and environmental controls. Maintaining this position pushes research and developmentconstantly. The ‘Croc in a Box’ project is an example of one such activity (see Section 3.2.5 – Box 1for more details). The initial and ongoing benefits of this development are expected to addsignificant value to the local and surrounding areas.
37 CFANT (2014) - Northern Territory Crocodile Industry Management Program: Perspectives from the Crocodile FarmingIndustry38 CFANT (2014) - Northern Territory Crocodile Industry Management Program: Perspectives from the Crocodile FarmingIndustry39 CFANT (2016), Pers. Comm., Sept40 Webb (2013)

Northern Territory Crocodile Industry Economic Contribution Analysis EY ÷ 38
6.4 RegulationRegulation of the Industry is essential as part of the ongoing sustainable management of theindustry but also for maintaining appropriate environmental standards, including the humanetreatment of animals. As mentioned in Section 6.2, the NT crocodiles are currently managed jointlyby the P&W and DPIF and NT farmers are world leaders in the production of quality crocodileproducts. The regulation/standards ensure NT producers are known as ethical providers and haveencouraged high end fashion producers such as Hermes and Louis Vuitton to purchase local NTfarms to secure their supply chain.
Maintaining the standard is essential as world markets of animal farmed products are highlysusceptible to external interest groups particularly through social media. Suboptimal regulationcan result in significant current and future impacts. Where mistreatment or mishandling arises inthe production process industries can be quickly shut down or severely limited. Issues arising fromthe live export of Australian beef is a good example where offshore processing of Australiansourced stock resulted in an Australian Government live export ban that had significant financial(and economic) costs that included drops in sale yard prices, a reduction in property prices andpotential increase in interest margins.41
For the Industry, access to the US market for Australian produced skins is essential. Crocodileskins, that then become high-end value-added products such as handbags, wallets, shoes, and soforth. The quality of NT environmental standards and handling of animals advocated for thecrocodile farming industry is the reason why this market remains open. Without the ability toaccess the US market the value of the Industry would be significantly reduced through majorreductions in price and volumes.
6.5 Additional Tourism Value6.5.1 Iconic Status – Brand Recognition for the NTThe crocodile is synonymous with the NT on both a national and international level and featuresstrongly in many tourism promotions. The Industry contributes, to some extent, through itstourism activities and from its exposure in TV and film documentaries and features (see Section6.5.2 below). Further exposure is gained through the export of the Industry’s expertise to othercrocodile farming areas (national and international) and the premium quality products known tocome from the NT. The test for the Industry in this respect, and brand recognition that comes withit, is the level to which it may induce further tourism and business opportunities that would nothave otherwise occurred without it.
While it is difficult to directly value additional tourism visits or business opportunities specifically tothe crocodile farming industry itself (along with the many other quality natural offerings of the NT),it is an integral contributor to the bigger picture NT brand.
6.5.2 International Film and Television IndustryThe ability to easily access and film crocodiles in the NT regularly brings international film andtelevision crews to Australia.42 Some filming occurs in the natural environment, although the abilityto capture the desired footage can on occasion be difficult. Accessing crocodiles on farms,particularly in natural settings reduces the risk, time and cost for the film crews. This film industryinterest brings with it economic value not only in terms of the direct expenditure of the film crewswhen they visit the NT, but also in the further development of the NT brand.
41 Hydros Consulting (2011)42 WMI (2016), Pers. Comm., July

Northern Territory Crocodile Industry Economic Contribution Analysis EY ÷ 39
Bibliography
CFANT (2014)a. Northern Territory Crocodile Industry Management Program: Perspectives fromthe Crocodile Farming Industry, report prepared by the Crocodile Farmers Association of theNorthern Territory
CFANT (2014)b The Northern Territory Crocodile Farming Industry: Strategic Plan 2015-2021, ajointly prepared report by the NT Government and Crocodile Farmers Association of the NorthernTerritory
Hydros Consulting (2011). The financial impacts of cattle export restrictions on producers andother stakeholders in North Australia, report prepared for the Department of Agriculture Fisheriesand Forestry.
NT Government (2016). The Northern Territory Government Management Program for theSaltwater Crocodile 2016-2021.
NT Government (2016). Wildlife Trade Management Plan for the Saltwater Crocodile (CrocodylusPorosus) in the Northern Territory of Australia, 2016-2020.
SVA (2016). Consolidated report on Indigenous Protected Areas following Social Return onInvestment analyses – prepared by Social Ventures Australia for the Department of Prime Ministerand Cabinet – February 2016
Webb, G (2013). Wildlife conservation: In the belly of the beast. Published by Charles DarwinUniversity Press (Northern Territory, Australia)

Northern Territory Crocodile Industry Economic Contribution Analysis EY ÷ 40
Appendix A - Overview of IO Modelling
Economic contribution is a measure comprising all market-related expenditure generated by aspecified industry or an activity. Input Output modelling calculates how the impacts created byactivity in one industry effects the broader economy through established inter-industryrelationships.
There are many advantages of using IO modelling as the basis for economic contributionstudies. These include:
► The approach produces relatively simple outputs that are easy to understand andcommunicate
► It can be used to estimate the sectorial impact of industry-specific changes in final demand
► The process is transparent; not a ‘black box’ where the method of calculation is unknown.
However, there are also limitations of the IO approach that result from the use of criticalassumptions and these should be well understood when interpreting the results of theanalysis. Typically these limitations are more pronounced when attempting to use I-O to analysecomplicated policy impacts which affect many industries, taxes, resource allocation etc. on a large,national scale. Given that this work involves a relatively simpler contribution analysis on a relativelysmall scale, the use of IO modelling is appropriate. However it is still important to be mindful of themost significant limitations, which in this context include:
► The approach assumes fixed production coefficients and subsequently constant returns toscale. This means that no matter how much production occurs the per-unit costs of requiredinputs remains the same
► The approach assumes that unlimited supplies of production inputs such as labour (lack ofsupply side constraints) are available
► It does not account for price changes that may result from increased competition for scarceresources
► The analysis is built on a static picture of the economy that does not consider dynamicadjustments that occur from a shock (fixed coefficients)
► Regional performance matches national and state average performance
► The effect of technology on the improvement of production efficiency is not considered
► Products are only sold in a single industry (Homogeneity of product)
► It considers the average effects rather than the marginal effects, meaning that IO models donot take into account economies of scale, unused capacity or technological change
Economic contribution studies do not consider the substitution impacts to other industries (i.e.what might happen to expenditures if the specific industry or activity were lost). As such economiccontribution is a gross measure rather than a net measure.
As mentioned above, IO modelling takes into account established inter-industry relationships.These relationships are represented in matrix form, which position industries as being both suppliesand consumers of their output. For example, a retail business sources products to sell from awholesaler who in turn sources their stock from the manufacturer. Of course there are many otherinputs into the operation of the retailer, such as electricity (sourced from distributors andgenerators) and construction of the premises (by the construction industry). The degree to whicheach industry requires input from other industries is expressed in the form of coefficients. Thesame coefficients serve to distribute expenditure of an industry throughout the economy and theeffect is then measured. These effects are measured in a number of ways, including:
► Total Output – the (final) value of transactions for goods and services generated in theeconomy
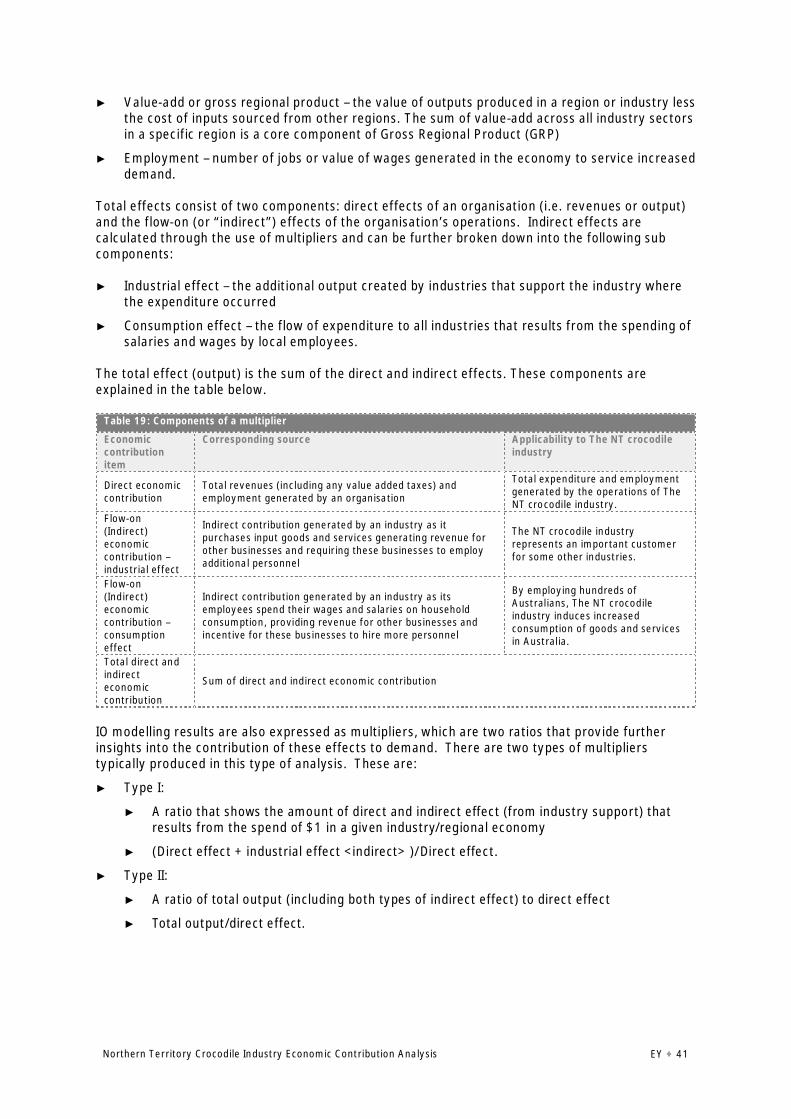
Northern Territory Crocodile Industry Economic Contribution Analysis EY ÷ 41
► Value-add or gross regional product – the value of outputs produced in a region or industry lessthe cost of inputs sourced from other regions. The sum of value-add across all industry sectorsin a specific region is a core component of Gross Regional Product (GRP)
► Employment – number of jobs or value of wages generated in the economy to service increaseddemand.
Total effects consist of two components: direct effects of an organisation (i.e. revenues or output)and the flow-on (or “indirect”) effects of the organisation’s operations. Indirect effects arecalculated through the use of multipliers and can be further broken down into the following subcomponents:
► Industrial effect – the additional output created by industries that support the industry wherethe expenditure occurred
► Consumption effect – the flow of expenditure to all industries that results from the spending ofsalaries and wages by local employees.
The total effect (output) is the sum of the direct and indirect effects. These components areexplained in the table below.
Table 19: Components of a multiplier
Economiccontributionitem
Corresponding source Applicability to The NT crocodileindustry
Direct economiccontribution
Total revenues (including any value added taxes) andemployment generated by an organisation
Total expenditure and employmentgenerated by the operations of TheNT crocodile industry.
Flow-on(Indirect)economiccontribution –industrial effect
Indirect contribution generated by an industry as itpurchases input goods and services generating revenue forother businesses and requiring these businesses to employadditional personnel
The NT crocodile industryrepresents an important customerfor some other industries.
Flow-on(Indirect)economiccontribution –consumptioneffect
Indirect contribution generated by an industry as itsemployees spend their wages and salaries on householdconsumption, providing revenue for other businesses andincentive for these businesses to hire more personnel
By employing hundreds ofAustralians, The NT crocodileindustry induces increasedconsumption of goods and servicesin Australia.
Total direct andindirecteconomiccontribution
Sum of direct and indirect economic contribution
IO modelling results are also expressed as multipliers, which are two ratios that provide furtherinsights into the contribution of these effects to demand. There are two types of multiplierstypically produced in this type of analysis. These are:
► Type I:
► A ratio that shows the amount of direct and indirect effect (from industry support) thatresults from the spend of $1 in a given industry/regional economy
► (Direct effect + industrial effect <indirect> )/Direct effect.
► Type II:
► A ratio of total output (including both types of indirect effect) to direct effect
► Total output/direct effect.

Northern Territory Crocodile Industry Economic Contribution Analysis EY ÷ 42
A variety of sources of information can be used to access the economic multipliers (e.g. theAustralian Bureau of Statistics or macro-economic models of the Australian economy).Value-added can be calculated by one of either two methods:
► Subtracting local expenditure and expenditure on regional imports from the output generatedby an industry sector, or
► Adding wages and salaries paid to local employees with the gross operating surplus and taxeson products and production.

Northern Territory Crocodile Industry Economic Contribution Analysis EY ÷ 43
Appendix B – Tourism Calculation Assumptions
In order to determine the economic contribution the following process was followed:
1. Identify which farms or closely associated businesses offer tourism experiences
2. Profile the average expenditure of Northern Territory tourists
3. Based on visitation data from the farms, determine the type of tourists that visit in terms ofdomestic day, domestic overnight and international
4. Calculate total expenditure by visitor type
5. Attribute spend to crocodile attraction visitation and use assumptions to determine whetherthe purpose of their trip is to specifically see crocodiles in a farm or zoo environment orwhether this is incidental
6. Subtract the entry fee component of tourist spend estimate to avoid double countingexpenditure with zoo operations revenue
7. Generate an estimate of total tourism expenditure
8. Apply to economic multipliers
9. Present key contribution results.
Crocosaurus Cove and Crocodylus Park are the two businesses related to crocodile farming areassumed to provide zoological services to tourists, based on discussions with farm operators andindustry stakeholders. The combined attendance visitor data and place of origin for the 2014/15financial year is included in Table 20.
Table 20: Tourist attendance to NT crocodile parks, 2014/15
Origin Visitor Numbers
NT 55,000
Interstate 46,000
International 13,000
Total 114,000
Source: Industry data, 2016 (Crocosaurus Cove and Crocodylus Park)
Specific key assumptions:► The NT visitor spend is representative of visitors who attend crocodile parks► Split of tourists from the NT by day and overnight: 90 per cent of tourists from the NT were considered
to be day visitors, the remainder overnight► All interstate tourists were overnight visitors► Casual visitor seeing more than one (or the same) park: 5 per cent of each visitor type

Northern Territory Crocodile Industry Economic Contribution Analysis EY ÷ 44
The Visitor Average Expenditure Profile produced by Tourism Research Australia is also a keydataset used in the calculation of the tourism contribution component and is shown below inTable 21.
Table 21: Visitor Average Expenditure Profile
Visitor Profile Domestic Day Domestic Overnight International
Average Stay (nights) N/A 6.9 16.7
Average Spend per trip ($) $152 $1,313 $1,598
Average Spend per night ($) N/A $189 $95
Source: Tourism Research Australia (TRA), National and International Visitor Surveys June 2015; Northern Territory
Given that the crocodile parks do not collect data regarding the type (length of stay) of theirvisitors, an assumption was needed to reconcile tourist origins with visitor types. In the absence ofactual data and the concentration of the NT population in Darwin within close proximity of the twotourist parks, it was assumed that 90 per cent of NT tourists were domestic day visitors and 10 percent were domestic overnight visitors.43 With park visitors counted in this way, averageexpenditure ratios per visitor could be applied and an overall expenditure amount determined.
As indicated in Section 3.2.4, the ability to see crocodiles is a strong attractor for NT tourism. Assuch, it is reasonable to assume that for a proportion of NT tourists, the primary driver is to seecrocodiles (in the wild or through farm related tourism). Similarly, if it was not possible to seecrocodiles, then those tourists would not visit (or stay as long) in the NT. For the purpose of thisstudy, and without specific surveys carried out, we have assumed that 5% of interstate andinternational tourists visit the NT specifically for farm related tourism. Where this is the case ourcalculations capture the full trip spend of these visitors. Otherwise, the study assumes a casual visitand attributes only a half-of- one day’s expenditure to this.
The value of these assumptions is outlined in Table 22.
Table 22: Purpose of visit assumptions
Domestic Day Domestic Overnight International
Specific crocodile visitors 100 per cent 5 per cent 5 per cent
Casual crocodile visitors 0 per cent 95 per cent 95 per cent
Source: EY, 2016
The total visitor expenditure attributable to the crocodile industry calculated from theaforementioned assumptions is outlined in Table 23.
Table 23: Economic contribution from crocodile visitation expenditure, 2014/15 Financial Year ($m)
Domestic Day DomesticOvernight International Total
Specific visitors $7.5 $3.4 $1.0 $11.9
Casual visitors $- $4.5 $0.6 $5.2
Total expenditure $7.5 $8.0 $1.6 $17.1
Source: EY, 2016 (some numbers may not add due to rounding).
43 This 10 per cent of NT tourists was added to all interstate visitors to comprise the domestic overnight count withinternational tourists remaining in that same category.
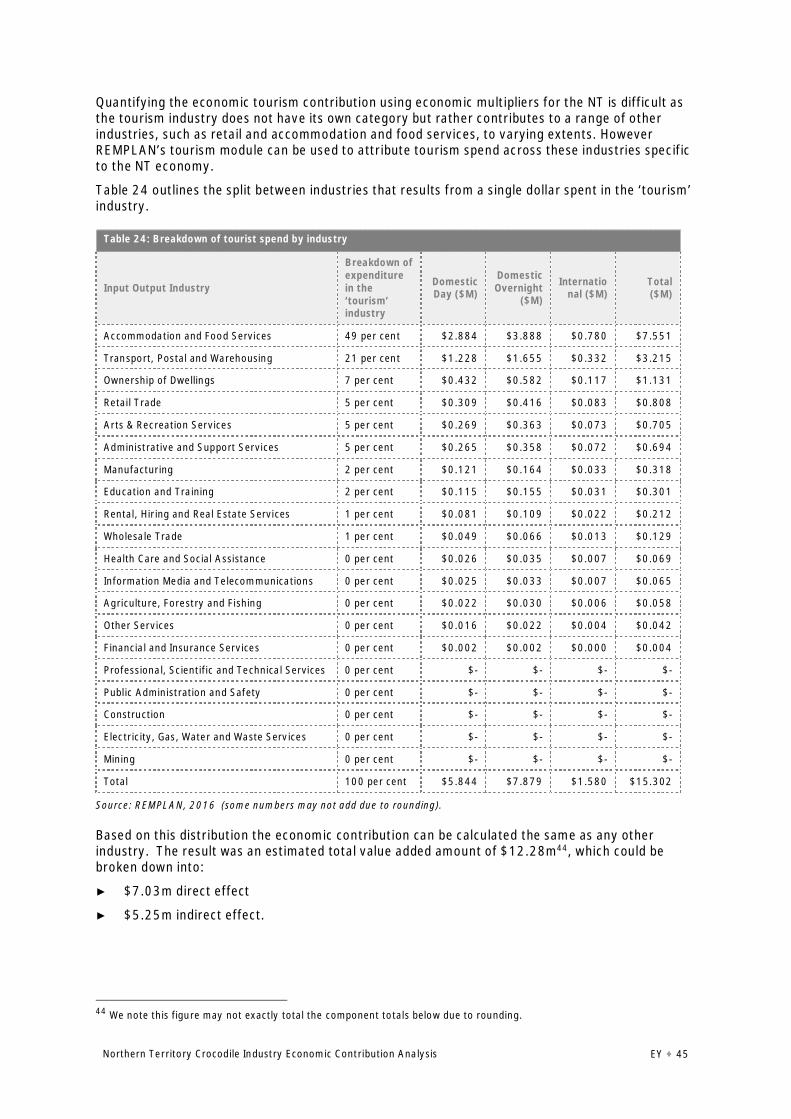
Northern Territory Crocodile Industry Economic Contribution Analysis EY ÷ 45
Quantifying the economic tourism contribution using economic multipliers for the NT is difficult asthe tourism industry does not have its own category but rather contributes to a range of otherindustries, such as retail and accommodation and food services, to varying extents. HoweverREMPLAN’s tourism module can be used to attribute tourism spend across these industries specificto the NT economy.
Table 24 outlines the split between industries that results from a single dollar spent in the ‘tourism’industry.
Table 24: Breakdown of tourist spend by industry
Input Output Industry
Breakdown ofexpenditurein the‘tourism’industry
DomesticDay ($M)
DomesticOvernight
($M)
International ($M)
Total($M)
Accommodation and Food Services 49 per cent $2.884 $3.888 $0.780 $7.551
Transport, Postal and Warehousing 21 per cent $1.228 $1.655 $0.332 $3.215
Ownership of Dwellings 7 per cent $0.432 $0.582 $0.117 $1.131
Retail Trade 5 per cent $0.309 $0.416 $0.083 $0.808
Arts & Recreation Services 5 per cent $0.269 $0.363 $0.073 $0.705
Administrative and Support Services 5 per cent $0.265 $0.358 $0.072 $0.694
Manufacturing 2 per cent $0.121 $0.164 $0.033 $0.318
Education and Training 2 per cent $0.115 $0.155 $0.031 $0.301
Rental, Hiring and Real Estate Services 1 per cent $0.081 $0.109 $0.022 $0.212
Wholesale Trade 1 per cent $0.049 $0.066 $0.013 $0.129
Health Care and Social Assistance 0 per cent $0.026 $0.035 $0.007 $0.069
Information Media and Telecommunications 0 per cent $0.025 $0.033 $0.007 $0.065
Agriculture, Forestry and Fishing 0 per cent $0.022 $0.030 $0.006 $0.058
Other Services 0 per cent $0.016 $0.022 $0.004 $0.042
Financial and Insurance Services 0 per cent $0.002 $0.002 $0.000 $0.004
Professional, Scientific and Technical Services 0 per cent $- $- $- $-
Public Administration and Safety 0 per cent $- $- $- $-
Construction 0 per cent $- $- $- $-
Electricity, Gas, Water and Waste Services 0 per cent $- $- $- $-
Mining 0 per cent $- $- $- $-
Total 100 per cent $5.844 $7.879 $1.580 $15.302
Source: REMPLAN, 2016 (some numbers may not add due to rounding).
Based on this distribution the economic contribution can be calculated the same as any otherindustry. The result was an estimated total value added amount of $12.28m44, which could bebroken down into:
► $7.03m direct effect
► $5.25m indirect effect.
44 We note this figure may not exactly total the component totals below due to rounding.

Northern Territory Crocodile Industry Economic Contribution Analysis EY ÷ 46
Table 25 summarises the key economic contribution indicators for visitor expenditure during the2014/15 financial year.
Table 25: Economic contribution from NT crocodile farming related tourism, 2014/15 Financial Year
Direct effect Industrial flow oneffect
Consumption flow oneffect Total
Output ($M) $15.30 $10.35 $25.65 $51.30
Value-added ($M) $7.03 $5.25 $12.28 $24.56
Employment (Jobs) 51 24 75 150
Source: Stakeholder consultation, REMPLAN, 2016

EY | Assurance | Tax | Transactions | Advisory
About EYEY is a global leader in assurance, tax, transaction and advisoryservices. The insights and quality services we deliver help build trustand confidence in the capital markets and in economies the worldover. We develop outstanding leaders who team to deliver on ourpromises to all of our stakeholders. In so doing, we play a critical rolein building a better working world for our people, for our clients andfor our communities.
EY refers to the global organization and may refer to one or more ofthe member firms of Ernst & Young Global Limited, each of which is aseparate legal entity. Ernst & Young Global Limited, a UK companylimited by guarantee, does not provide services to clients. For moreinformation about our organization, please visit ey.com.
© 2017 Ernst & Young, Australia.All Rights Reserved.
This communication provides general information which is current at the time of production.The information contained in this communication does not constitute advice and should notbe relied on as such. Professional advice should be sought prior to any action being taken inreliance on any of the information. Ernst & Young disclaims all responsibility and liability(including, without limitation, for any direct or indirect or consequential costs, loss ordamage or loss of profits) arising from anything done or omitted to be done by any party inreliance, whether wholly or partially, on any of the information. Any party that relies on theinformation does so at its own risk. Liability limited by a scheme approved underProfessional Standards Legislation.
ey.com